Embed Size (px)
Citation preview
2017 REPORTS AND OPINIONS
OF THE PROPERTY TAX ADMINISTATOR
KIMBALL COUNTY

April 7, 2017 Commissioner Salmon: The Property Tax Administrator has compiled the 2017 Reports and Opinions of the Property Tax Administrator for Kimball County pursuant to Neb. Rev. Stat. § 77-5027. This Report and Opinion will inform the Tax Equalization and Review Commission of the level of value and quality of assessment for real property in Kimball County. The information contained within the County Reports of the Appendices was provided by the county assessor pursuant to Neb. Rev. Stat. § 77-1514.
For the Tax Commissioner Sincerely,
Ruth A. Sorensen Property Tax Administrator 402-471-5962 cc: Sherry Winstrom, Kimball County Assessor
53 Kimball Page 2
Table of Contents 2017 Reports and Opinions of the Property Tax Administrator:
Certification to the Commission Introduction County Overview
Residential Correlation Commercial Correlation Agricultural Land Correlation PTA’s Opinion
Appendices: Commission Summary
Statistical Reports and Displays:
Residential Statistics Commercial Statistics
Chart of Net Sales Compared to Commercial Assessed Value Agricultural Land Statistics
Table-Average Value of Land Capability Groups Special Valuation Statistics (if applicable)
Market Area Map Valuation History Charts
County Reports:
County Abstract of Assessment for Real Property, Form 45 County Abstract of Assessment for Real Property Compared to the Prior Year Certificate of Taxes Levied (CTL). Assessor Survey Three-Year Plan of Assessment Special Value Methodology (if applicable)
Ad Hoc Reports Submitted by County (if applicable)
53 Kimball Page 3
Introduction
Neb. Rev. Stat. § 77-5027 provides that the Property Tax Administrator (PTA) shall prepare and deliver an annual Reports and Opinions (R&O) document to each county and to the Tax Equalization and Review Commission (Commission). This will contain statistical and narrative reports informing the Commission of the certified opinion of the PTA regarding the level of value and the quality of assessment of the classes and subclasses of real property within each county. In addition to an opinion of the level of value and quality of assessment in the county, the PTA may make nonbinding recommendations for subclass adjustments for consideration by the Commission.
The statistical and narrative reports contained in the R&O of the PTA provide an analysis of the assessment process implemented by each county to reach the levels of value and quality of assessment required by Nebraska law. The PTA’s opinion of the level of value and quality of assessment in each county is a conclusion based upon all the data provided by the county assessor and gathered by the Nebraska Department of Revenue, Property Assessment Division (Division) regarding the assessment activities in the county during the preceding year.
The statistical reports are developed using the state-wide sales file that contains all arm’s-length transactions as required by Neb. Rev. Stat. § 77-1327. From this sale file, the Division prepares a statistical analysis comparing assessments to sale prices. After determining if the sales represent the class or subclass of properties being measured, inferences are drawn regarding the assessment level and quality of assessment of the class or subclass being evaluated. The statistical reports contained in the R&O are developed based on standards developed by the International Association of Assessing Officers (IAAO).
The analysis of assessment practices in each county is necessary to give proper context to the statistical inferences from the assessment sales ratio studies and the overall quality of assessment in the county. The assessment practices are evaluated in the county to ensure professionally accepted mass appraisal methods are used and that those methods will generally produce uniform and proportionate valuations.
The PTA considers the statistical reports and the analysis of assessment practices when forming conclusions on both the level of value and quality of assessment. The consideration of both the statistical indicators and assessment processes used to develop valuations is necessary to accurately determine the level of value and quality of assessment. Assessment practices that produce a biased sales file will generally produce a biased statistical indicator, which, on its face, would otherwise appear to be valid. Likewise, statistics produced on small, unrepresentative, or otherwise unreliable samples, may indicate issues with assessment uniformity and assessment level—however, a detailed review of the practices and valuation models may suggest otherwise. For these reasons, the detail of the Division’s analysis is presented and contained within the correlation sections for Residential, Commercial, and Agricultural land.
53 Kimball Page 4
Statistical Analysis:
In determining a point estimate of the level of value, the PTA considers three measures as indicators of the central tendency of assessment: the median ratio, weighted mean ratio, and mean ratio. The use and reliability of each measure is based on inherent strengths and weaknesses which are the quantity and quality of the information from which it was calculated and the defined scope of the analysis.
The median ratio is considered the most appropriate statistical measure to determine a level of value for direct equalization which is the process of adjusting the values of classes or subclasses of property in response to an unacceptable level. Since the median ratio is considered neutral in relationship to either assessed value or selling price, adjusting the class or subclass of properties based on the median measure will not change the relationships between assessed value and level of value already present in the class of property. Additionally, the median ratio is less influenced by the presence of extreme ratios, commonly called outliers, which can skew the outcome in the other measures.
The weighted mean ratio best reflects a comparison of the fully assessable valuation of a jurisdiction, by measuring the total assessed value against the total of selling prices. The weighted mean ratio can be heavily influenced by sales of large-dollar property with extreme ratios.
The mean ratio is used as a basis for other statistical calculations, such as the price related differential and coefficient of variation. As a simple average of the ratios the mean ratio has limited application in the analysis of the level of value because it assumes a normal distribution of the data set around the mean ratio with each ratio having the same impact on the calculation regardless of the assessed value or the selling price.
The quality of assessment relies in part on statistical indicators as well. If the weighted mean ratio, because of its dollar-weighting feature, is significantly different from the mean ratio, it may be an indication of disproportionate assessments. The coefficient produced by this calculation is referred to as the Price Related Differential (PRD) and measures the assessment level of lower-priced properties relative to the assessment level of higher-priced properties.
The Coefficient of Dispersion (COD) is a measure also used in the evaluation of assessment quality. The COD measures the average deviation from the median and is expressed as a percentage of the median. A COD of 15 percent indicates that half of the assessment ratios are expected to fall within 15 percent of the median. The closer the ratios are grouped around the median the more equitable the property assessments tend to be.
Pursuant to Neb. Rev. Stat. § 77-5023, the acceptable range is 69% to 75% of actual value for agricultural land and 92% to 100% for all other classes of real property.
53 Kimball Page 5

Nebraska Statutes do not provide for a range of acceptability for the COD or PRD; however, the IAAO establishes the following range of acceptability:
Analysis of Assessment Practices:
The Division reviews assessment practices that ultimately affect the valuation of real property in each county. This review is done to ensure the reliability of the statistical analysis and to ensure professionally accepted methods are used in the county assessor’s effort to establish uniform and proportionate valuations.
To ensure county assessors are submitting all Real Estate Transfer Statements, required for the development of the state sales file pursuant to Neb. Rev. Stat. § 77-1327, the Division audits a random sample from the county registers of deeds’ records to confirm that the required sales have been submitted and reflect accurate information. The timeliness of the submission is also reviewed to ensure the sales file allows analysis of up-to-date information. The county’s sales verification and qualification procedures are reviewed to ensure that sales are properly considered arm’s-length transactions unless determined to be otherwise through the verification process. Proper sales verification practices ensure the statistical analysis is based on an unbiased sample of sales.
Valuation groupings and market areas are also examined to identify whether the areas being measured truly represent economic areas within the county. The measurement of economic areas is the method by which the Division ensures intra-county equalization exists. The progress of the county’s six-year inspection cycle is documented to ensure compliance with Neb. Rev. Stat. § 77-1311.03 and also to confirm that all property is being uniformly listed and described for valuation purposes.
Valuation methodologies developed by the county assessor are reviewed for both appraisal logic and to ensure compliance with professionally accepted mass appraisal methods. Methods and sales used to develop lot values are also reviewed to ensure the land component of the valuation process is based on the local market, and agricultural outbuildings and sites are reviewed as well.
The comprehensive review of assessment practices is conducted throughout the year. Issues are presented to the county assessor for clarification. The county assessor can then work to implement corrective measures prior to establishing assessed values. The PTA’s conclusion that assessment quality is either compliant or not compliant with professionally accepted mass appraisal methods is based on the totality of the assessment practices in the county.
*Further information may be found in Exhibit 94
Property Class Residential
COD .05 -.15
PRD .98-1.03
Newer Residential .05 -.10 .98-1.03 Commercial .05 -.20 .98-1.03 Agricultural Land .05 -.25 .98-1.03
53 Kimball Page 6
County Overview
With a total area of 952 miles, Kimball had 3,689
residents, per the Census Bureau Quick Facts for
2015, a 4% population decline from the 2010 US
Census. In a review of the past fifty-five years,
Kimball has seen a steady drop in population of
54% (Nebraska Department of Economic
Development). Reports indicated that 65% of
county residents were homeowners and 82% of residents occupied the same residence as in the
prior year (Census Quick Facts).
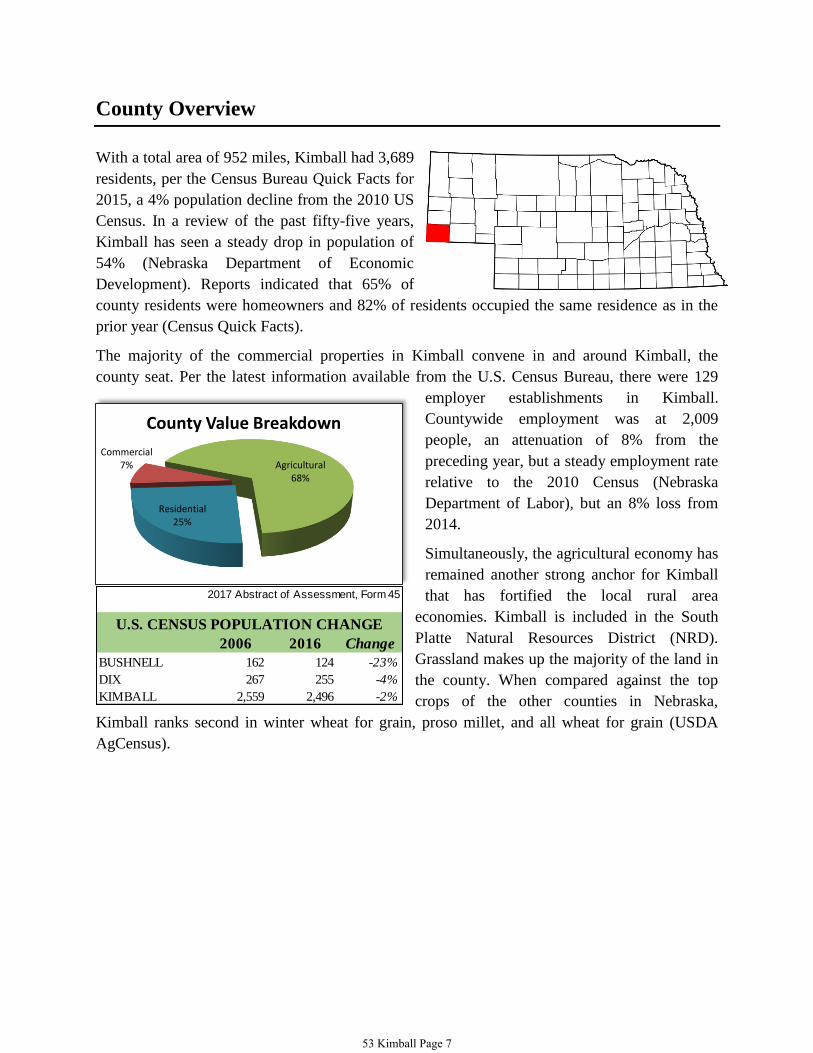
The majority of the commercial properties in Kimball convene in and around Kimball, the
county seat. Per the latest information available from the U.S. Census Bureau, there were 129
employer establishments in Kimball.
Countywide employment was at 2,009
people, an attenuation of 8% from the
preceding year, but a steady employment rate
relative to the 2010 Census (Nebraska
Department of Labor), but an 8% loss from
2014.
Simultaneously, the agricultural economy has
remained another strong anchor for Kimball
that has fortified the local rural area
economies. Kimball is included in the South
Platte Natural Resources District (NRD).
Grassland makes up the majority of the land in
the county. When compared against the top
crops of the other counties in Nebraska,
Kimball ranks second in winter wheat for grain, proso millet, and all wheat for grain (USDA
AgCensus).
2006 2016 Change
BUSHNELL 162 124 -23%
DIX 267 255 -4%
KIMBALL 2,559 2,496 -2%
U.S. CENSUS POPULATION CHANGE
2017 Abstract of Assessment, Form 45
Residential25%
Commercial7% Agricultural
68%
County Value Breakdown
53 Kimball Page 7

2017 Residential Correlation for Kimball County
Assessment Actions
Actions taken to address the residential property class for assessment year 2017 included the
complete review of all residential property within the county, coupled with an updated lot value
study. The county assessor implemented a 2016 cost index and a corresponding market
depreciation.
Description of Analysis
The residential property class consists of four valuation groupings based on the city and villages
assessor locations and the rural subclass described in the following table:
Valuation
Grouping
Description
10
Kimball: all residential properties within the city of Kimball.
20 Bushnell: residential parcels within the village of Bushnell.
30 Dix: residential parcels within the village of Dix.
80 Rural: the remaining residential parcels not found within the above
valuation groupings, including those that would be considered suburban.
The statistical profile for the residential class indicates ninety sales deemed qualified by the county
assessor and all four valuation groupings are represented. Two of the three overall measures of
central tendency are within range and only the median and weighted mean are within one point of
each other. All valuation groupings with significant sales also have medians within acceptable
range (and VG 80, Rural shows all three measures of central tendency within range). Although
VG 10 may be somewhat over-represented in the sample, this is due to the fact that only Kimball
has a somewhat viable residential market compared to the other groupings. The overall sample is
considered stable, since the absence or presence of outliers produces no appreciable effect on the
median.
A comparison of the difference between the measures of central tendency for the two years of the
study period would not indicate an increase in the residential market within the county, and this is
not surprising considering the current residential revaluation and the implementation of both a
newer cost index and market depreciation. Actually, until this year the county had been below the
Panhandle counties’ average for residential property valuations during the eleven year period of
2006-2016.
53 Kimball Page 8
2017 Residential Correlation for Kimball County
Assessment Practice Review
The Division conducts an annual comprehensive review of assessment practices for each county.
The purpose of the review is to examine the specific assessment practices to determine compliance
for all activities that ultimately affect the uniform and proportionate valuation of all three classes
of property.
One specific area addressed included sales qualification and verification. The Kimball County
assessor has developed a consistent procedure for both sales qualification and verification. The
Division’s review inspects the non-qualified sales to ensure that the county assessor has supported
and documented the grounds for disqualification. Only one of the ninety-six non-qualified sales
lacked sufficient documentation (and this was a family sale). The review includes a dialogue with
the county assessor and a consideration of verification documentation. The review of Kimball
County revealed that no apparent bias existed in the qualification determination and that all arm’s-
length sales were available for the measurement of real property. Verification of sales consists of
a mailed questionnaire sent to both the buyer and seller of all sales transactions for the three
property classes, with the exception of those transactions that current IAAO standards recommend
for possible exclusion. The response rate is slightly over 50% and for non-respondents the county
assessor’s office contacts these by phone. The county assessor was informed of other supplemental
verification methods used by the surrounding Panhandle counties and she has agreed to utilize
these.
The Division discussed the county’s inspection and review cycle for all real property with the
county assessor. Previously, Kimball County had fallen behind with both the assessment review
cycle and the implementation of an updated cost index, market depreciation and lot value studies.
The current revaluation conducted by both the county assessor’s office and the contracted appraiser
have remedied the situation that previously existed.
Valuation groups were also examined to ensure that as defined they are equally subject to a set of
economic forces that affect the value of properties within the designated group. The Division’s
review and analysis indicates that the county has adequately identified economic areas for the
residential property class. Based on all relevant information, the quality of assessment for the
residential class adheres to professionally accepted mass appraisal standards and has been
determined to be in general compliance.
Equalization and Quality of Assessment
Valuation grouping substrata (regardless of sample size) indicates that all groupings are
statistically within acceptable range (median), and is not surprising when a complete revaluation
of the property class is completed.
53 Kimball Page 9

2017 Residential Correlation for Kimball County
Level of Value
Based on analysis of all available information, the level of value for the residential class of real
property in Kimball County is 99%.
53 Kimball Page 10
2017 Commercial Correlation for Kimball County
Assessment Actions
For the current assessment year, Kimball County completely reviewed the commercial class of
property, implemented a 2016 cost index and depreciation schedule, as well as conducting a
commercial lot study.
Description of Analysis
Like the residential property class, the county assessor has established four valuation groupings
based primarily on assessor location, and are described in the table below:
Valuation
Grouping
Description
10 Kimball—all commercial property within the city of Kimball.
20 Bushnell—the commercial parcels found within the village of Bushnell.
30 Dix—commercial parcels within the village of Dix.
80 Rural—all commercial properties not found within the above valuation
groupings, including those commercial properties that would be considered
suburban.
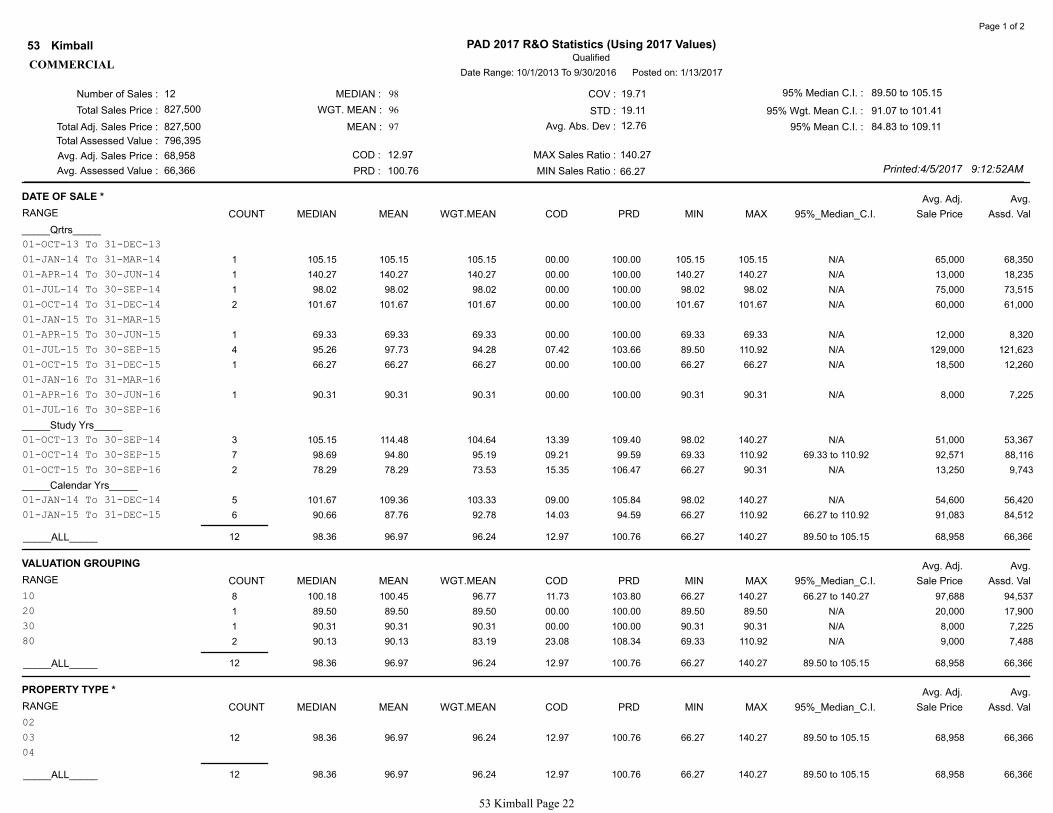
For the commercial property class, a review of statistical profile reveals twelve qualified sales
distributed among the four valuation groupings. Although all three measures of central tendency
are within acceptable range, and both qualitative statistics are within their prescribed parameters,
the sample is too small and the valuation groupings are not numerically representative of the
commercial base as a whole.
Assessment Practice Review
The Division conducts an annual comprehensive review of assessment practices for each county.
The purpose of the review is to examine the specific assessment practices to determine compliance
for all activities that ultimately affect the uniform and proportionate valuation of all three classes
of property.
One aspect addressed included sales qualification and verification. The Kimball County assessor
has developed a consistent procedure for both sales qualification and verification. The Division’s
review inspects the non-qualified sales to ensure that the assessor has supported and documented
the grounds for disqualification. All of the twenty-four non-qualified sales contained sufficient
documentation. The review includes a dialogue with the county assessor and a consideration of
verification documentation. The review of Kimball County revealed that no apparent bias existed
in the qualification determination and that all arm’s-length sales were available for the
53 Kimball Page 11

2017 Commercial Correlation for Kimball County
measurement of real property. Verification of sales consists of a mailed questionnaire sent to both
the buyer and seller of all sales transactions for the three property classes (with the exception of
those transactions that current IAAO standards recommend for possible exclusion). The response
rate is slightly over 50% and for non-respondents the county assessor’s office contacts these by
phone.
Another important part of the review was the examination of the six-year inspection cycle. The
county for assessment year 2017 conducted a physical review of all commercial properties within
the county, utilizing Stanard Appraisal, a contracted appraisal firm, to review and re-value all
commercial properties.
The Division also examined commercial valuation groups to ensure that as defined they are equally
subject to a set of economic forces that affect the value of properties within the designated group.
The Division’s review and analysis indicates that the county has adequately identified commercial
economic areas. The quality of assessment, based on all relevant information and not just the too
small sample, for the commercial class of property adheres to professionally accepted mass
appraisal standards and has been determined to be in compliance.
Equalization and Quality of Assessment
By utilizing all information available, it is confirmed that the Kimball County assessor’s
assessment practices are reliable and applied consistently and therefore it is believed that
commercial properties are valued in a uniform and proportional manner.
Due to the small sample size, however, it is believed to be an unreliable representation of the
commercial class as a whole.
Level of Value
Based on analysis of all available information, Kimball County has achieved the statutory level of
value of 100% for the commercial property class.
53 Kimball Page 12
2017 Agricultural Correlation for Kimball County
Assessment Actions
The county assessor reviewed sales and preliminary values to determine what assessment actions
to take to address agricultural land for the current assessment year. Actions taken to address
agricultural/horticultural land for assessment year 2017 included the following overall
adjustments: dry land was reduced by about 5% in market Area 1 that indicated this class was
above acceptable range, and grassland was increased by slightly more than 5%.
Description of Analysis
The Kimball County assessor has partitioned agricultural land geographically into two distinct
market areas. Area 1 consists of land in the southern portion of the county and Area 2 consists of
the northern one-third (approximately) portion of the county and typically has better irrigated land.
Kimball County has only two neighbors that would have comparable sales just across the county
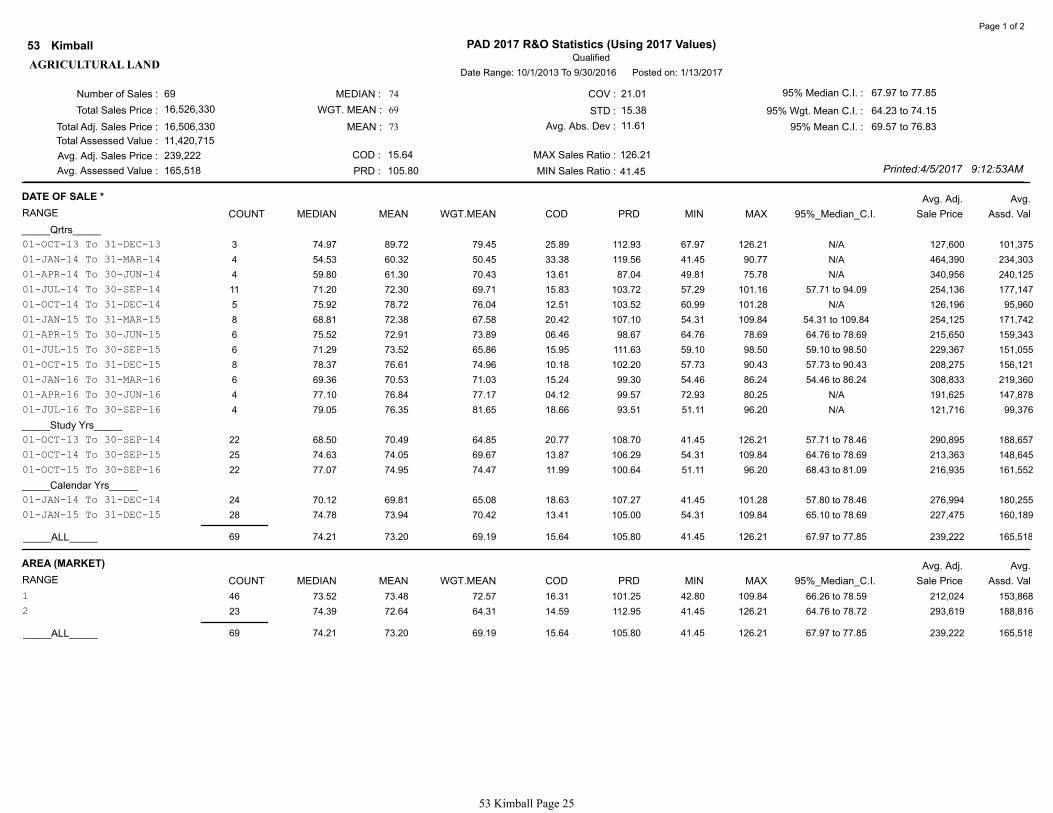
lines—Banner to the north and Cheyenne to the east. Analysis of the sample reveals sixty-nine
qualified sales with all three of the overall measures of central tendency falling within acceptable
range. The overall agricultural statistics are stable, in that, they are not influenced by the absence
or presence of outliers, nor would the inclusion of a comparable sale produce an adverse effect.
The overall sample is representative by land use of the agricultural base. Both defined market areas
also have medians within acceptable range, supported by their respective COD’s. Kimball’s
Conservation Reserve Program land (CRP) values in Kimball County are not typical of most other
counties in that these are higher than or almost equal to the dry land values. The county assessor
believes that this is because a CRP contract is a reliable source of return on investment, whereas
dry land is fully dependent on annual precipitation and the type crops that can be grown. It is true
that more land is enrolled in CRP in Kimball County than the other Panhandle counties, and there
is no conclusive evidence that the county assessor is incorrect in this observation within her county.
Assessment Practice Review
Annually, the Division conducts a comprehensive review of assessment practices for each county.
The purpose of the review is to examine the specific assessment practices of the county to ensure
that these produce uniform and proportionate valuation of all property.
One of the assessment practices addressed is the county’s sales qualification and verification
process. The county assessor has developed a consistent procedure for both sales qualification and
verification. The Division’s review inspects the non-qualified sales to ensure that the assessor has
supported and documented the grounds for disqualification. All of the twenty-five non-qualified
sales were sufficiently documented. The review includes a dialogue with the county assessor and
a consideration of verification documentation. The review of Kimball County revealed that no
apparent bias existed in the qualification determination and that all arm’s-length sales were
available for the measurement of real property. Further, all sales were reviewed to ensure that those
53 Kimball Page 13

2017 Agricultural Correlation for Kimball County
sales deemed qualified were not affected by non-agricultural influences or special factors that
would cause a premium to be paid for the land. Verification of sales consists of a mailed
questionnaire sent to both the buyer and seller of all sales transactions for the three property classes
(with the exception of those transactions that current IAAO standards recommend for possible
exclusion). The response rate is slightly over 50% and for non-respondents the county assessor’s
office contacts these by phone.
The Division also examined the county’s inspection and review cycle for agricultural land and
improvements. Kimball County utilizes GIS Workshop information and tries to supplement this
with Farm Service Agency maps obtained from taxpayers to determine current land use for parcels
in question. This is notably out-of-date (2011) and the county assessor is working to rectify this
issue by assigning one staff member to update land use. Agricultural improvements are reviewed
at the same time as the rural residential/suburban parcels. This was last completed during
assessment year 2016.
The Division’s review of agricultural market areas within the county was conducted with the
county assessor to ensure that the areas defined are equally subject to economic forces that affect
the value of land within the delineated areas. In summary, the market area analysis indicates that
the county assessor has adequately identified market areas for the agricultural land class.
The final part of the assessment practices review addresses the identification of rural residential
and recreational land apart from agricultural land within the county. The county assessor
determines rural residential land from agricultural land by primary use. Currently, recreational use
of land has not been seen within the county at this time.
Equalization
Dwellings and outbuildings on agricultural land are valued using the same cost index as those for
the rural residential acreages. Farm home sites carry the same value as rural residential home sites.
Since all rural improvements have been reviewed for the current assessment year, and the rural
residential subclass has all three measure of central tendency within acceptable range, agricultural
improvements are believed to be equalized at the statutorily required assessment level.
Again, the two defined market areas also have medians within acceptable range, supported by their
respective COD’s. The overall sample is considered stable, since no removal of extreme outliers
affect the overall median. Review of the 80% MLU by Market Area indicates overall statistics
within range, and the grass includes land enrolled in CRP that is similar to Kimball’s immediate
neighbors within a six-mile radius. It is believed that the quality of assessment of agricultural land
within the county is in general compliance with generally accepted mass appraisal standards.
53 Kimball Page 14

2017 Agricultural Correlation for Kimball County
Level of Value
Based on analysis of all available information, the level of value of agricultural land in Kimball
County is 74%.
53 Kimball Page 15
2017 Opinions of the Property Tax Administrator
for Kimball County
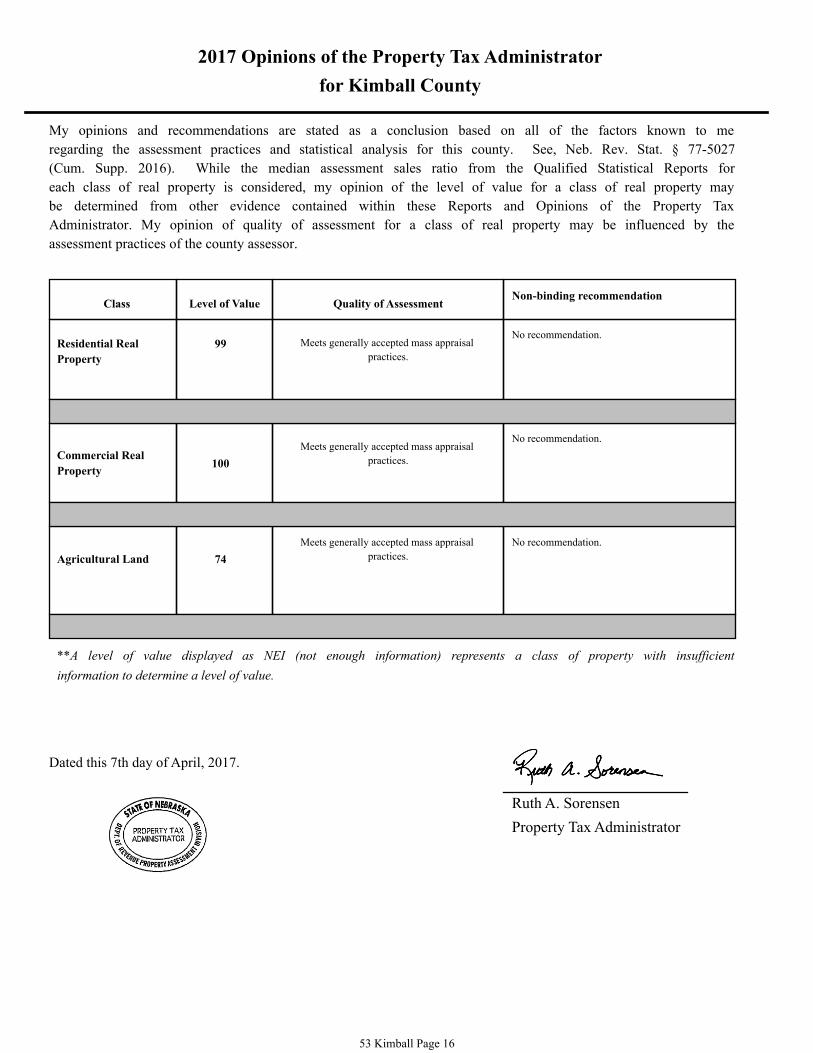
My opinions and recommendations are stated as a conclusion based on all of the factors known to me
regarding the assessment practices and statistical analysis for this county. See, Neb. Rev. Stat. § 77-5027
(Cum. Supp. 2016). While the median assessment sales ratio from the Qualified Statistical Reports for
each class of real property is considered, my opinion of the level of value for a class of real property may
be determined from other evidence contained within these Reports and Opinions of the Property Tax
Administrator. My opinion of quality of assessment for a class of real property may be influenced by the
assessment practices of the county assessor.
Residential Real
Property
Commercial Real
Property
Agricultural Land
Class Level of Value Quality of Assessment
100
74
99
Meets generally accepted mass appraisal
practices.
Meets generally accepted mass appraisal
practices.
Meets generally accepted mass appraisal
practices.
No recommendation.
No recommendation.
No recommendation.
Non-binding recommendation
**A level of value displayed as NEI (not enough information) represents a class of property with insufficient
information to determine a level of value.
Dated this 7th day of April, 2017.
Ruth A. Sorensen
Property Tax Administrator
53 Kimball Page 16

Appendices
APPENDICES
53 Kimball Page 17
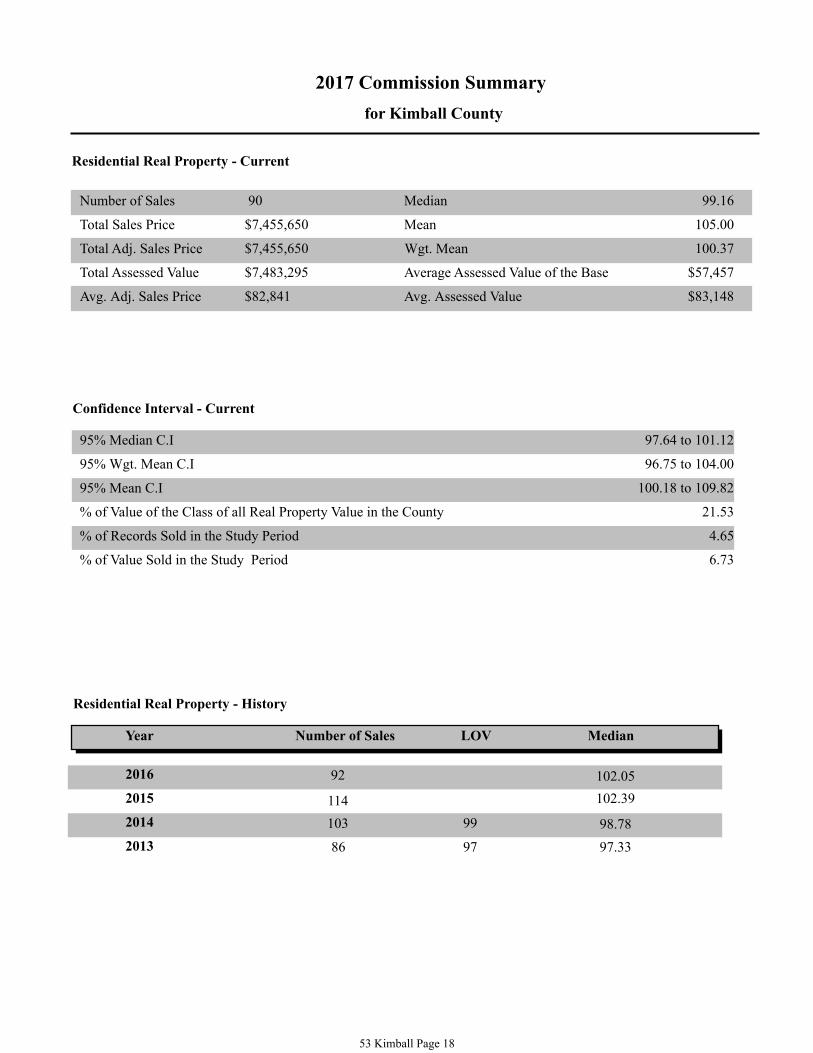
2017 Commission Summary
for Kimball County
Residential Real Property - Current
Number of Sales
Total Sales Price
Total Adj. Sales Price
Total Assessed Value
Avg. Adj. Sales Price Avg. Assessed Value
Median
Wgt. Mean
Mean
95% Median C.I
95% Wgt. Mean C.I
95% Mean C.I
97.64 to 101.12
96.75 to 104.00
100.18 to 109.82
% of Value of the Class of all Real Property Value in the County
% of Records Sold in the Study Period
% of Value Sold in the Study Period
Average Assessed Value of the Base
21.53
4.65
6.73
$57,457
Residential Real Property - History
Year
2015
2014
2016
Number of Sales LOV
Confidence Interval - Current
Median
2013
90
105.00
99.16
100.37
$7,455,650
$7,455,650
$7,483,295
$82,841 $83,148
97 97.33 86
98.78 103 99
114 102.39
102.05 92
53 Kimball Page 18
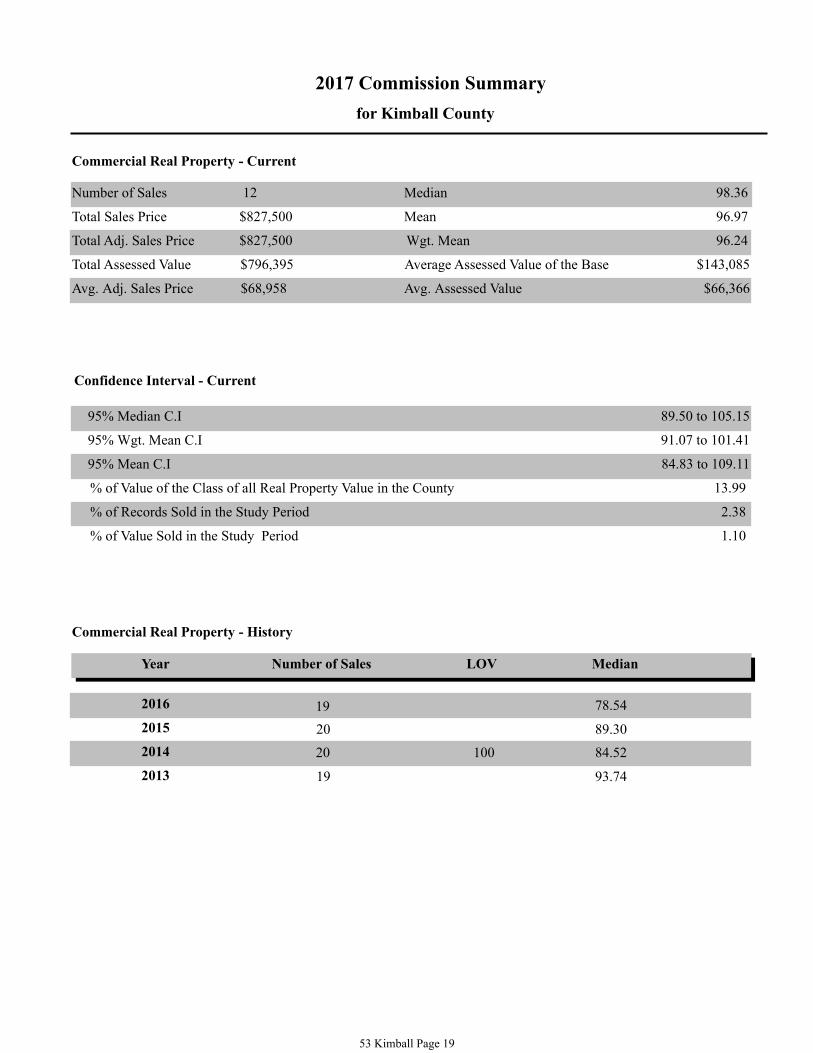
2017 Commission Summary
for Kimball County
Commercial Real Property - Current
Number of Sales
Total Sales Price
Total Adj. Sales Price
Total Assessed Value
Avg. Adj. Sales Price Avg. Assessed Value
Median
Wgt. Mean
Mean
95% Median C.I
95% Wgt. Mean C.I
95% Mean C.I
% of Value of the Class of all Real Property Value in the County
% of Records Sold in the Study Period
% of Value Sold in the Study Period
Average Assessed Value of the Base
Commercial Real Property - History
Year
2015
Number of Sales LOV
12
89.50 to 105.15
91.07 to 101.41
84.83 to 109.11
13.99
2.38
1.10
$143,085
Confidence Interval - Current
Median
2013
$827,500
$827,500
$796,395
$68,958 $66,366
96.97
98.36
96.24
2014
19 93.74
84.52 100 20
89.30 20
19 78.542016
53 Kimball Page 19
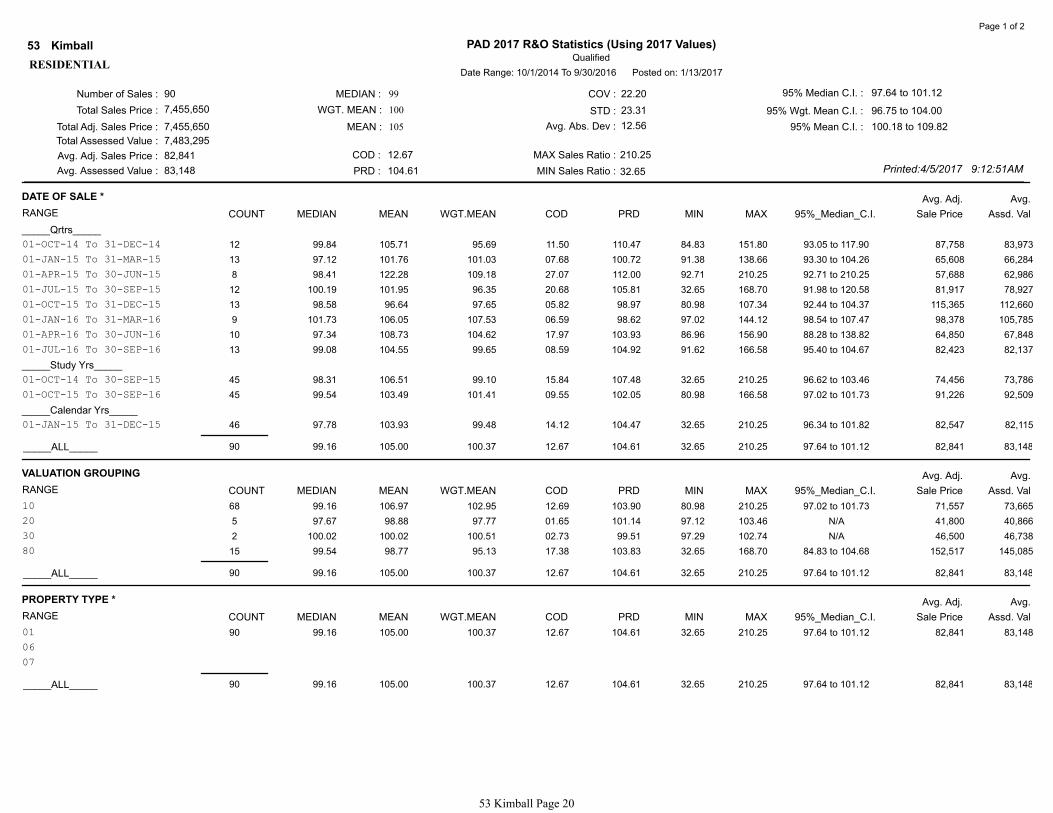
Number of Sales :
Total Sales Price :
Total Adj. Sales Price :
Total Assessed Value :
Avg. Adj. Sales Price :
Avg. Assessed Value :
MEDIAN :
WGT. MEAN :
MEAN :
COD :
PRD :
COV :
STD :
Avg. Abs. Dev :
MAX Sales Ratio :
MIN Sales Ratio :
95% Median C.I. :
95% Wgt. Mean C.I. :
95% Mean C.I. :
90
7,455,650
7,455,650
7,483,295
82,841
83,148
12.67
104.61
22.20
23.31
12.56
210.25
32.65
97.64 to 101.12
96.75 to 104.00
100.18 to 109.82
Printed:4/5/2017 9:12:51AM
Qualified
PAD 2017 R&O Statistics (Using 2017 Values)Kimball53
Date Range: 10/1/2014 To 9/30/2016 Posted on: 1/13/2017
99
100
105
RESIDENTIAL
Page 1 of 2
Avg. Adj.
RANGE Assd. ValSale Price95%_Median_C.I.MAXMINPRDCODWGT.MEANMEANMEDIANCOUNT
Avg.DATE OF SALE *
_____Qrtrs_____
01-OCT-14 To 31-DEC-14 12 99.84 105.71 95.69 11.50 110.47 84.83 151.80 93.05 to 117.90 87,758 83,973
01-JAN-15 To 31-MAR-15 13 97.12 101.76 101.03 07.68 100.72 91.38 138.66 93.30 to 104.26 65,608 66,284
01-APR-15 To 30-JUN-15 8 98.41 122.28 109.18 27.07 112.00 92.71 210.25 92.71 to 210.25 57,688 62,986
01-JUL-15 To 30-SEP-15 12 100.19 101.95 96.35 20.68 105.81 32.65 168.70 91.98 to 120.58 81,917 78,927
01-OCT-15 To 31-DEC-15 13 98.58 96.64 97.65 05.82 98.97 80.98 107.34 92.44 to 104.37 115,365 112,660
01-JAN-16 To 31-MAR-16 9 101.73 106.05 107.53 06.59 98.62 97.02 144.12 98.54 to 107.47 98,378 105,785
01-APR-16 To 30-JUN-16 10 97.34 108.73 104.62 17.97 103.93 86.96 156.90 88.28 to 138.82 64,850 67,848
01-JUL-16 To 30-SEP-16 13 99.08 104.55 99.65 08.59 104.92 91.62 166.58 95.40 to 104.67 82,423 82,137
_____Study Yrs_____
01-OCT-14 To 30-SEP-15 45 98.31 106.51 99.10 15.84 107.48 32.65 210.25 96.62 to 103.46 74,456 73,786
01-OCT-15 To 30-SEP-16 45 99.54 103.49 101.41 09.55 102.05 80.98 166.58 97.02 to 101.73 91,226 92,509
_____Calendar Yrs_____
01-JAN-15 To 31-DEC-15 46 97.78 103.93 99.48 14.12 104.47 32.65 210.25 96.34 to 101.82 82,547 82,115
_____ALL_____ 90 99.16 105.00 100.37 12.67 104.61 32.65 210.25 97.64 to 101.12 82,841 83,148
Avg. Adj.
RANGE Assd. ValSale Price95%_Median_C.I.MAXMINPRDCODWGT.MEANMEANMEDIANCOUNT
Avg.VALUATION GROUPING
10 68 99.16 106.97 102.95 12.69 103.90 80.98 210.25 97.02 to 101.73 71,557 73,665
20 5 97.67 98.88 97.77 01.65 101.14 97.12 103.46 N/A 41,800 40,866
30 2 100.02 100.02 100.51 02.73 99.51 97.29 102.74 N/A 46,500 46,738
80 15 99.54 98.77 95.13 17.38 103.83 32.65 168.70 84.83 to 104.68 152,517 145,085
_____ALL_____ 90 99.16 105.00 100.37 12.67 104.61 32.65 210.25 97.64 to 101.12 82,841 83,148
Avg. Adj.
RANGE Assd. ValSale Price95%_Median_C.I.MAXMINPRDCODWGT.MEANMEANMEDIANCOUNT
Avg.PROPERTY TYPE *
01 90 99.16 105.00 100.37 12.67 104.61 32.65 210.25 97.64 to 101.12 82,841 83,148
06 0 00.00 00.00 00.00 00.00 00.00 00.00 00.00 N/A 0 0
07 0 00.00 00.00 00.00 00.00 00.00 00.00 00.00 N/A 0 0
_____ALL_____ 90 99.16 105.00 100.37 12.67 104.61 32.65 210.25 97.64 to 101.12 82,841 83,148
53 Kimball Page 20

Number of Sales :
Total Sales Price :
Total Adj. Sales Price :
Total Assessed Value :
Avg. Adj. Sales Price :
Avg. Assessed Value :
MEDIAN :
WGT. MEAN :
MEAN :
COD :
PRD :
COV :
STD :
Avg. Abs. Dev :
MAX Sales Ratio :
MIN Sales Ratio :
95% Median C.I. :
95% Wgt. Mean C.I. :
95% Mean C.I. :
90
7,455,650
7,455,650
7,483,295
82,841
83,148
12.67
104.61
22.20
23.31
12.56
210.25
32.65
97.64 to 101.12
96.75 to 104.00
100.18 to 109.82
Printed:4/5/2017 9:12:51AM
Qualified
PAD 2017 R&O Statistics (Using 2017 Values)Kimball53
Date Range: 10/1/2014 To 9/30/2016 Posted on: 1/13/2017
99
100
105
RESIDENTIAL
Page 2 of 2
Avg. Adj.
RANGE Assd. ValSale Price95%_Median_C.I.MAXMINPRDCODWGT.MEANMEANMEDIANCOUNT
Avg.SALE PRICE *
_____Low $ Ranges_____
Less Than 5,000 0 00.00 00.00 00.00 00.00 00.00 00.00 00.00 N/A 0 0
Less Than 15,000 1 103.46 103.46 103.46 00.00 100.00 103.46 103.46 N/A 6,500 6,725
Less Than 30,000 10 103.20 114.30 114.36 15.15 99.95 92.25 166.58 97.12 to 151.80 20,500 23,444
__Ranges Excl. Low $__
Greater Than 4,999 90 99.16 105.00 100.37 12.67 104.61 32.65 210.25 97.64 to 101.12 82,841 83,148
Greater Than 14,999 89 99.08 105.02 100.37 12.77 104.63 32.65 210.25 97.29 to 101.12 83,698 84,006
Greater Than 29,999 80 98.82 103.84 99.98 12.15 103.86 32.65 210.25 97.02 to 100.97 90,633 90,611
__Incremental Ranges__
0 TO 4,999 0 00.00 00.00 00.00 00.00 00.00 00.00 00.00 N/A 0 0
5,000 TO 14,999 1 103.46 103.46 103.46 00.00 100.00 103.46 103.46 N/A 6,500 6,725
15,000 TO 29,999 9 102.93 115.50 114.72 16.82 100.68 92.25 166.58 97.12 to 151.80 22,056 25,301
30,000 TO 59,999 28 101.05 112.02 110.87 20.48 101.04 32.65 210.25 97.29 to 105.77 41,893 46,448
60,000 TO 99,999 26 99.09 101.40 100.80 07.86 100.60 86.96 133.52 94.68 to 104.16 77,788 78,409
100,000 TO 149,999 17 97.66 100.52 100.95 05.36 99.57 92.71 144.12 94.60 to 100.97 118,494 119,616
150,000 TO 249,999 7 95.40 90.87 90.05 07.01 100.91 73.33 99.54 73.33 to 99.54 175,107 157,679
250,000 TO 499,999 2 94.60 94.60 94.78 10.33 99.81 84.83 104.37 N/A 407,500 386,235
500,000 TO 999,999 0 00.00 00.00 00.00 00.00 00.00 00.00 00.00 N/A 0 0
1,000,000 + 0 00.00 00.00 00.00 00.00 00.00 00.00 00.00 N/A 0 0
_____ALL_____ 90 99.16 105.00 100.37 12.67 104.61 32.65 210.25 97.64 to 101.12 82,841 83,148
53 Kimball Page 21
Number of Sales :
Total Sales Price :
Total Adj. Sales Price :
Total Assessed Value :
Avg. Adj. Sales Price :
Avg. Assessed Value :
MEDIAN :
WGT. MEAN :
MEAN :
COD :
PRD :
COV :
STD :
Avg. Abs. Dev :
MAX Sales Ratio :
MIN Sales Ratio :
95% Median C.I. :
95% Wgt. Mean C.I. :
95% Mean C.I. :
12
827,500
827,500
796,395
68,958
66,366
12.97
100.76
19.71
19.11
12.76
140.27
66.27
89.50 to 105.15
91.07 to 101.41
84.83 to 109.11
Printed:4/5/2017 9:12:52AM
Qualified
PAD 2017 R&O Statistics (Using 2017 Values)Kimball53
Date Range: 10/1/2013 To 9/30/2016 Posted on: 1/13/2017
98
96
97
COMMERCIAL
Page 1 of 2
Avg. Adj.
RANGE Assd. ValSale Price95%_Median_C.I.MAXMINPRDCODWGT.MEANMEANMEDIANCOUNT
Avg.DATE OF SALE *
_____Qrtrs_____
01-OCT-13 To 31-DEC-13 0 00.00 00.00 00.00 00.00 00.00 00.00 00.00 N/A 0 0
01-JAN-14 To 31-MAR-14 1 105.15 105.15 105.15 00.00 100.00 105.15 105.15 N/A 65,000 68,350
01-APR-14 To 30-JUN-14 1 140.27 140.27 140.27 00.00 100.00 140.27 140.27 N/A 13,000 18,235
01-JUL-14 To 30-SEP-14 1 98.02 98.02 98.02 00.00 100.00 98.02 98.02 N/A 75,000 73,515
01-OCT-14 To 31-DEC-14 2 101.67 101.67 101.67 00.00 100.00 101.67 101.67 N/A 60,000 61,000
01-JAN-15 To 31-MAR-15 0 00.00 00.00 00.00 00.00 00.00 00.00 00.00 N/A 0 0
01-APR-15 To 30-JUN-15 1 69.33 69.33 69.33 00.00 100.00 69.33 69.33 N/A 12,000 8,320
01-JUL-15 To 30-SEP-15 4 95.26 97.73 94.28 07.42 103.66 89.50 110.92 N/A 129,000 121,623
01-OCT-15 To 31-DEC-15 1 66.27 66.27 66.27 00.00 100.00 66.27 66.27 N/A 18,500 12,260
01-JAN-16 To 31-MAR-16 0 00.00 00.00 00.00 00.00 00.00 00.00 00.00 N/A 0 0
01-APR-16 To 30-JUN-16 1 90.31 90.31 90.31 00.00 100.00 90.31 90.31 N/A 8,000 7,225
01-JUL-16 To 30-SEP-16 0 00.00 00.00 00.00 00.00 00.00 00.00 00.00 N/A 0 0
_____Study Yrs_____
01-OCT-13 To 30-SEP-14 3 105.15 114.48 104.64 13.39 109.40 98.02 140.27 N/A 51,000 53,367
01-OCT-14 To 30-SEP-15 7 98.69 94.80 95.19 09.21 99.59 69.33 110.92 69.33 to 110.92 92,571 88,116
01-OCT-15 To 30-SEP-16 2 78.29 78.29 73.53 15.35 106.47 66.27 90.31 N/A 13,250 9,743
_____Calendar Yrs_____
01-JAN-14 To 31-DEC-14 5 101.67 109.36 103.33 09.00 105.84 98.02 140.27 N/A 54,600 56,420
01-JAN-15 To 31-DEC-15 6 90.66 87.76 92.78 14.03 94.59 66.27 110.92 66.27 to 110.92 91,083 84,512
_____ALL_____ 12 98.36 96.97 96.24 12.97 100.76 66.27 140.27 89.50 to 105.15 68,958 66,366
Avg. Adj.
RANGE Assd. ValSale Price95%_Median_C.I.MAXMINPRDCODWGT.MEANMEANMEDIANCOUNT
Avg.VALUATION GROUPING
10 8 100.18 100.45 96.77 11.73 103.80 66.27 140.27 66.27 to 140.27 97,688 94,537
20 1 89.50 89.50 89.50 00.00 100.00 89.50 89.50 N/A 20,000 17,900
30 1 90.31 90.31 90.31 00.00 100.00 90.31 90.31 N/A 8,000 7,225
80 2 90.13 90.13 83.19 23.08 108.34 69.33 110.92 N/A 9,000 7,488
_____ALL_____ 12 98.36 96.97 96.24 12.97 100.76 66.27 140.27 89.50 to 105.15 68,958 66,366
Avg. Adj.
RANGE Assd. ValSale Price95%_Median_C.I.MAXMINPRDCODWGT.MEANMEANMEDIANCOUNT
Avg.PROPERTY TYPE *
02 0 00.00 00.00 00.00 00.00 00.00 00.00 00.00 N/A 0 0
03 12 98.36 96.97 96.24 12.97 100.76 66.27 140.27 89.50 to 105.15 68,958 66,366
04 0 00.00 00.00 00.00 00.00 00.00 00.00 00.00 N/A 0 0
_____ALL_____ 12 98.36 96.97 96.24 12.97 100.76 66.27 140.27 89.50 to 105.15 68,958 66,366
53 Kimball Page 22

Number of Sales :
Total Sales Price :
Total Adj. Sales Price :
Total Assessed Value :
Avg. Adj. Sales Price :
Avg. Assessed Value :
MEDIAN :
WGT. MEAN :
MEAN :
COD :
PRD :
COV :
STD :
Avg. Abs. Dev :
MAX Sales Ratio :
MIN Sales Ratio :
95% Median C.I. :
95% Wgt. Mean C.I. :
95% Mean C.I. :
12
827,500
827,500
796,395
68,958
66,366
12.97
100.76
19.71
19.11
12.76
140.27
66.27
89.50 to 105.15
91.07 to 101.41
84.83 to 109.11
Printed:4/5/2017 9:12:52AM
Qualified
PAD 2017 R&O Statistics (Using 2017 Values)Kimball53
Date Range: 10/1/2013 To 9/30/2016 Posted on: 1/13/2017
98
96
97
COMMERCIAL
Page 2 of 2
Avg. Adj.
RANGE Assd. ValSale Price95%_Median_C.I.MAXMINPRDCODWGT.MEANMEANMEDIANCOUNT
Avg.SALE PRICE *
_____Low $ Ranges_____
Less Than 5,000 0 00.00 00.00 00.00 00.00 00.00 00.00 00.00 N/A 0 0
Less Than 15,000 4 100.62 102.71 103.68 22.75 99.06 69.33 140.27 N/A 9,750 10,109
Less Than 30,000 6 89.91 94.43 91.09 21.58 103.67 66.27 140.27 66.27 to 140.27 12,917 11,766
__Ranges Excl. Low $__
Greater Than 4,999 12 98.36 96.97 96.24 12.97 100.76 66.27 140.27 89.50 to 105.15 68,958 66,366
Greater Than 14,999 8 98.36 94.10 95.87 07.83 98.15 66.27 105.15 66.27 to 105.15 98,563 94,495
Greater Than 29,999 6 100.18 99.50 96.77 03.32 102.82 91.82 105.15 91.82 to 105.15 125,000 120,967
__Incremental Ranges__
0 TO 4,999 0 00.00 00.00 00.00 00.00 00.00 00.00 00.00 N/A 0 0
5,000 TO 14,999 4 100.62 102.71 103.68 22.75 99.06 69.33 140.27 N/A 9,750 10,109
15,000 TO 29,999 2 77.89 77.89 78.34 14.92 99.43 66.27 89.50 N/A 19,250 15,080
30,000 TO 59,999 0 00.00 00.00 00.00 00.00 00.00 00.00 00.00 N/A 0 0
60,000 TO 99,999 4 101.67 101.63 101.49 01.75 100.14 98.02 105.15 N/A 65,000 65,966
100,000 TO 149,999 0 00.00 00.00 00.00 00.00 00.00 00.00 00.00 N/A 0 0
150,000 TO 249,999 1 98.69 98.69 98.69 00.00 100.00 98.69 98.69 N/A 175,000 172,715
250,000 TO 499,999 1 91.82 91.82 91.82 00.00 100.00 91.82 91.82 N/A 315,000 289,220
500,000 TO 999,999 0 00.00 00.00 00.00 00.00 00.00 00.00 00.00 N/A 0 0
1,000,000 + 0 00.00 00.00 00.00 00.00 00.00 00.00 00.00 N/A 0 0
_____ALL_____ 12 98.36 96.97 96.24 12.97 100.76 66.27 140.27 89.50 to 105.15 68,958 66,366
Avg. Adj.
RANGE Assd. ValSale Price95%_Median_C.I.MAXMINPRDCODWGT.MEANMEANMEDIANCOUNT
Avg.OCCUPANCY CODE
Blank 2 79.42 79.42 81.94 12.70 96.92 69.33 89.50 N/A 16,000 13,110
306 1 98.69 98.69 98.69 00.00 100.00 98.69 98.69 N/A 175,000 172,715
326 1 90.31 90.31 90.31 00.00 100.00 90.31 90.31 N/A 8,000 7,225
336 1 105.15 105.15 105.15 00.00 100.00 105.15 105.15 N/A 65,000 68,350
344 1 101.67 101.67 101.67 00.00 100.00 101.67 101.67 N/A 60,000 61,000
352 2 94.92 94.92 93.01 03.27 102.05 91.82 98.02 N/A 195,000 181,368
353 1 140.27 140.27 140.27 00.00 100.00 140.27 140.27 N/A 13,000 18,235
384 1 101.67 101.67 101.67 00.00 100.00 101.67 101.67 N/A 60,000 61,000
409 1 110.92 110.92 110.92 00.00 100.00 110.92 110.92 N/A 6,000 6,655
434 1 66.27 66.27 66.27 00.00 100.00 66.27 66.27 N/A 18,500 12,260
_____ALL_____ 12 98.36 96.97 96.24 12.97 100.76 66.27 140.27 89.50 to 105.15 68,958 66,366
53 Kimball Page 23

Tax Growth % Growth Value Ann.%chg Net Taxable % Chg Net
Year Value Value of Value Exclud. Growth w/o grwth Sales Value Tax. Sales
2006 57,910,742$ 1,824,145$ 3.15% 56,086,597$ - 23,791,791$ -
2007 59,601,577$ 111,569$ 0.19% 59,490,008$ 2.73% 25,969,285$ 9.15%
2008 62,574,426$ 209,355$ 0.33% 62,365,071$ 4.64% 26,038,219$ 0.27%
2009 62,481,862$ 2,043,704$ 3.27% 60,438,158$ -3.41% 21,915,679$ -15.83%
2010 62,908,152$ 1,662,293$ 2.64% 61,245,859$ -1.98% 27,243,598$ 24.31%
2011 64,082,610$ 1,293,559$ 2.02% 62,789,051$ -0.19% 30,225,252$ 10.94%
2012 63,918,386$ 1,395,984$ 2.18% 62,522,402$ -2.43% 41,818,055$ 38.35%
2013 64,017,288$ 299,811$ 0.47% 63,717,477$ -0.31% 37,249,144$ -10.93%
2014 66,834,472$ 2,997,645$ 4.49% 63,836,827$ -0.28% 29,122,936$ -21.82%
2015 70,448,729$ 58,498$ 0.08% 70,390,231$ 5.32% 26,974,951$ -7.38%
2016 70,517,449$ 179,080$ 0.25% 70,338,369$ -0.16% 23,791,686$ -11.80%
Ann %chg 1.99% Average 0.39% 1.40% 1.53%
Tax Cmltv%chg Cmltv%chg Cmltv%chg County Number 53
Year w/o grwth Value Net Sales County Name Kimball
2006 - - -
2007 2.73% 2.92% 9.15%
2008 7.69% 8.05% 9.44%
2009 4.36% 7.89% -7.89%
2010 5.76% 8.63% 14.51%
2011 8.42% 10.66% 27.04%
2012 7.96% 10.37% 75.77%
2013 10.03% 10.54% 56.56%
2014 10.23% 15.41% 22.41%
2015 21.55% 21.65% 13.38%
2016 21.46% 21.77% 0.00%
Cumulative Change
-20%
-10%
0%
10%
20%
30%
40%
50%
60%
70%
80%
2006 2007 2008 2009 2010 2011 2012 2013 2014 2015 2016
Commercial & Industrial Value Change Vs. Net Taxable Sales Change
Comm.&Ind w/o Growth
Comm.&Ind. Value Chg
Net Tax. Sales Value Change
Linear (Comm.&Ind w/oGrowth)Linear (Net Tax. Sales ValueChange)
Sources:
Value; 2006-2016 CTL Report
Growth Value; 2006-2016 Abstract Rpt
Net Taxable Sales; Dept. of Revenue
website.
53 Kimball Page 24
Number of Sales :
Total Sales Price :
Total Adj. Sales Price :
Total Assessed Value :
Avg. Adj. Sales Price :
Avg. Assessed Value :
MEDIAN :
WGT. MEAN :
MEAN :
COD :
PRD :
COV :
STD :
Avg. Abs. Dev :
MAX Sales Ratio :
MIN Sales Ratio :
95% Median C.I. :
95% Wgt. Mean C.I. :
95% Mean C.I. :
69
16,526,330
16,506,330
11,420,715
239,222
165,518
15.64
105.80
21.01
15.38
11.61
126.21
41.45
67.97 to 77.85
64.23 to 74.15
69.57 to 76.83
Printed:4/5/2017 9:12:53AM
Qualified
PAD 2017 R&O Statistics (Using 2017 Values)Kimball53
Date Range: 10/1/2013 To 9/30/2016 Posted on: 1/13/2017
74
69
73
AGRICULTURAL LAND
Page 1 of 2
Avg. Adj.
RANGE Assd. ValSale Price95%_Median_C.I.MAXMINPRDCODWGT.MEANMEANMEDIANCOUNT
Avg.DATE OF SALE *
_____Qrtrs_____
01-OCT-13 To 31-DEC-13 3 74.97 89.72 79.45 25.89 112.93 67.97 126.21 N/A 127,600 101,375
01-JAN-14 To 31-MAR-14 4 54.53 60.32 50.45 33.38 119.56 41.45 90.77 N/A 464,390 234,303
01-APR-14 To 30-JUN-14 4 59.80 61.30 70.43 13.61 87.04 49.81 75.78 N/A 340,956 240,125
01-JUL-14 To 30-SEP-14 11 71.20 72.30 69.71 15.83 103.72 57.29 101.16 57.71 to 94.09 254,136 177,147
01-OCT-14 To 31-DEC-14 5 75.92 78.72 76.04 12.51 103.52 60.99 101.28 N/A 126,196 95,960
01-JAN-15 To 31-MAR-15 8 68.81 72.38 67.58 20.42 107.10 54.31 109.84 54.31 to 109.84 254,125 171,742
01-APR-15 To 30-JUN-15 6 75.52 72.91 73.89 06.46 98.67 64.76 78.69 64.76 to 78.69 215,650 159,343
01-JUL-15 To 30-SEP-15 6 71.29 73.52 65.86 15.95 111.63 59.10 98.50 59.10 to 98.50 229,367 151,055
01-OCT-15 To 31-DEC-15 8 78.37 76.61 74.96 10.18 102.20 57.73 90.43 57.73 to 90.43 208,275 156,121
01-JAN-16 To 31-MAR-16 6 69.36 70.53 71.03 15.24 99.30 54.46 86.24 54.46 to 86.24 308,833 219,360
01-APR-16 To 30-JUN-16 4 77.10 76.84 77.17 04.12 99.57 72.93 80.25 N/A 191,625 147,878
01-JUL-16 To 30-SEP-16 4 79.05 76.35 81.65 18.66 93.51 51.11 96.20 N/A 121,716 99,376
_____Study Yrs_____
01-OCT-13 To 30-SEP-14 22 68.50 70.49 64.85 20.77 108.70 41.45 126.21 57.71 to 78.46 290,895 188,657
01-OCT-14 To 30-SEP-15 25 74.63 74.05 69.67 13.87 106.29 54.31 109.84 64.76 to 78.69 213,363 148,645
01-OCT-15 To 30-SEP-16 22 77.07 74.95 74.47 11.99 100.64 51.11 96.20 68.43 to 81.09 216,935 161,552
_____Calendar Yrs_____
01-JAN-14 To 31-DEC-14 24 70.12 69.81 65.08 18.63 107.27 41.45 101.28 57.80 to 78.46 276,994 180,255
01-JAN-15 To 31-DEC-15 28 74.78 73.94 70.42 13.41 105.00 54.31 109.84 65.10 to 78.69 227,475 160,189
_____ALL_____ 69 74.21 73.20 69.19 15.64 105.80 41.45 126.21 67.97 to 77.85 239,222 165,518
Avg. Adj.
RANGE Assd. ValSale Price95%_Median_C.I.MAXMINPRDCODWGT.MEANMEANMEDIANCOUNT
Avg.AREA (MARKET)
1 46 73.52 73.48 72.57 16.31 101.25 42.80 109.84 66.26 to 78.59 212,024 153,868
2 23 74.39 72.64 64.31 14.59 112.95 41.45 126.21 64.76 to 78.72 293,619 188,816
_____ALL_____ 69 74.21 73.20 69.19 15.64 105.80 41.45 126.21 67.97 to 77.85 239,222 165,518
53 Kimball Page 25

Number of Sales :
Total Sales Price :
Total Adj. Sales Price :
Total Assessed Value :
Avg. Adj. Sales Price :
Avg. Assessed Value :
MEDIAN :
WGT. MEAN :
MEAN :
COD :
PRD :
COV :
STD :
Avg. Abs. Dev :
MAX Sales Ratio :
MIN Sales Ratio :
95% Median C.I. :
95% Wgt. Mean C.I. :
95% Mean C.I. :
69
16,526,330
16,506,330
11,420,715
239,222
165,518
15.64
105.80
21.01
15.38
11.61
126.21
41.45
67.97 to 77.85
64.23 to 74.15
69.57 to 76.83
Printed:4/5/2017 9:12:53AM
Qualified
PAD 2017 R&O Statistics (Using 2017 Values)Kimball53
Date Range: 10/1/2013 To 9/30/2016 Posted on: 1/13/2017
74
69
73
AGRICULTURAL LAND
Page 2 of 2
Avg. Adj.
RANGE Assd. ValSale Price95%_Median_C.I.MAXMINPRDCODWGT.MEANMEANMEDIANCOUNT
Avg.95%MLU By Market Area
_____Irrigated_____
County 1 78.69 78.69 78.69 00.00 100.00 78.69 78.69 N/A 435,000 342,305
1 1 78.69 78.69 78.69 00.00 100.00 78.69 78.69 N/A 435,000 342,305
_____Dry_____
County 15 72.93 72.27 70.19 17.84 102.96 42.80 126.21 62.74 to 78.59 161,936 113,664
1 10 69.60 66.12 67.30 15.09 98.25 42.80 79.34 49.81 to 78.59 176,620 118,858
2 5 75.92 84.55 77.90 22.95 108.54 64.76 126.21 N/A 132,568 103,275
_____Grass_____
County 26 72.71 72.08 67.94 13.93 106.09 54.31 101.28 60.99 to 78.89 220,758 149,992
1 17 69.03 72.05 67.13 16.99 107.33 54.31 101.28 59.10 to 81.24 171,541 115,160
2 9 74.39 72.14 68.78 07.85 104.89 58.22 80.25 60.31 to 79.80 313,722 215,785
_____ALL_____ 69 74.21 73.20 69.19 15.64 105.80 41.45 126.21 67.97 to 77.85 239,222 165,518
Avg. Adj.
RANGE Assd. ValSale Price95%_Median_C.I.MAXMINPRDCODWGT.MEANMEANMEDIANCOUNT
Avg.80%MLU By Market Area
_____Irrigated_____
County 2 60.07 60.07 51.36 31.00 116.96 41.45 78.69 N/A 817,500 419,845
1 1 78.69 78.69 78.69 00.00 100.00 78.69 78.69 N/A 435,000 342,305
2 1 41.45 41.45 41.45 00.00 100.00 41.45 41.45 N/A 1,200,000 497,385
_____Dry_____
County 23 72.10 70.47 69.30 16.38 101.69 42.80 126.21 62.74 to 76.82 188,871 130,888
1 15 72.10 66.99 69.70 12.86 96.11 42.80 79.34 56.50 to 76.82 199,113 138,776
2 8 70.51 76.98 68.43 23.51 112.49 54.46 126.21 54.46 to 126.21 169,668 116,097
_____Grass_____
County 29 71.20 72.19 68.39 13.92 105.56 54.31 101.28 62.67 to 78.89 225,714 154,372
1 20 69.61 72.22 68.10 16.08 106.05 54.31 101.28 60.99 to 81.09 186,110 126,737
2 9 74.39 72.14 68.78 07.85 104.89 58.22 80.25 60.31 to 79.80 313,722 215,785
_____ALL_____ 69 74.21 73.20 69.19 15.64 105.80 41.45 126.21 67.97 to 77.85 239,222 165,518
53 Kimball Page 26

2 3 4 5 6 7 8 9 10 11 12
Mkt
Area1A1 1A 2A1 2A 3A1 3A 4A1 4A
WEIGHTED
AVG IRR
1 n/a 1,650 1,645 1,640 1,625 1,625 1,500 1,500 1,599
2 n/a 1,975 1,975 1,625 1,625 1,625 1,625 1,500 1,712
1 n/a 2,000 1,900 1,800 1,800 1,800 1,600 1,292 1,734
1 n/a 2,460 2,450 2,445 2,440 2,335 2,100 1,950 2,412
3 n/a 2,780 2,775 2,770 2,765 2,600 2,525 2,480 2,751
1 13 14 15 16 17 18 19 20 21 Mkt
Area1D1 1D 2D1 2D 3D1 3D 4D1 4D
WEIGHTED
AVG DRY
1 n/a 520 485 450 380 361 315 315 385
2 n/a 565 525 505 415 390 350 345 452
1 n/a 550 530 530 490 440 420 410 504
1 n/a 739 572 639 707 619 569 491 685
3 n/a 940 935 875 865 850 835 825 921
22 23 24 25 26 27 28 29 30Mkt
Area1G1 1G 2G1 2G 3G1 3G 4G1 4G
WEIGHTED
AVG GRASS
1 n/a 460 380 370 345 325 310 310 323
2 n/a 435 365 345 325 300 300 300 310
1 n/a 470 460 430 410 400 390 348 380
1 n/a 436 430 392 381 378 367 300 346
3 n/a 636 611 606 600 551 551 325 453
Source: 2017 Abstract of Assessment, Form 45, Schedule IX and Grass Detail from Schedule XIII.
Kimball County 2017 Average Acre Value Comparison
Cheyenne
County
Kimball
Kimball
County
Kimball
Kimball
Banner
Cheyenne
Cheyenne
County
Kimball
Kimball
Banner
Cheyenne
Cheyenne
Cheyenne
Banner
53 Kimball Page 27

Kimball
Banner
Cheyenne
Morrill
53_1
4_1
53_2
17_1
17_3
62_32511
2811
2513
3101
2515
28312827
2533
3105
2535
2519
3103
2825
2517
2241
31073109
2239
2823
2237
2809
2829
2527
2813
2529
2243 2245
2807
2531
2805
2509
2247
3111
2525
2815
2821
2537
2833
2803
3099
2521
2235
3117 3119 312731253121 3123 3129
ST71
ST53
ST4
ST53 ST53
LegendCounty LinesMarket AreasGeo CodesModerately well drained silty soils on uplands and in depressions formed in loessModerately well drained silty soils with clayey subsoils on uplandsWell drained silty soils formed in loess on uplandsWell drained silty soils formed in loess and alluvium on stream terracesWell to somewhat excessively drained loamy soils formed in weathered sandstone and eolian material on uplandsExcessively drained sandy soils formed in alluvium in valleys and eolian sand on uplands in sandhillsExcessively drained sandy soils formed in eolian sands on uplands in sandhillsSomewhat poorly drained soils formed in alluvium on bottom landsLakes and PondsIrrigationWells
Kimball County Map
§
53 Kimball Page 28
Tax Residential & Recreational (1)
Commercial & Industrial (1)
Total Agricultural Land (1)
Year Value Amnt Value Chg Ann.%chg Cmltv%chg Value Amnt Value Chg Ann.%chg Cmltv%chg Value Amnt Value Chg Ann.%chg Cmltv%chg
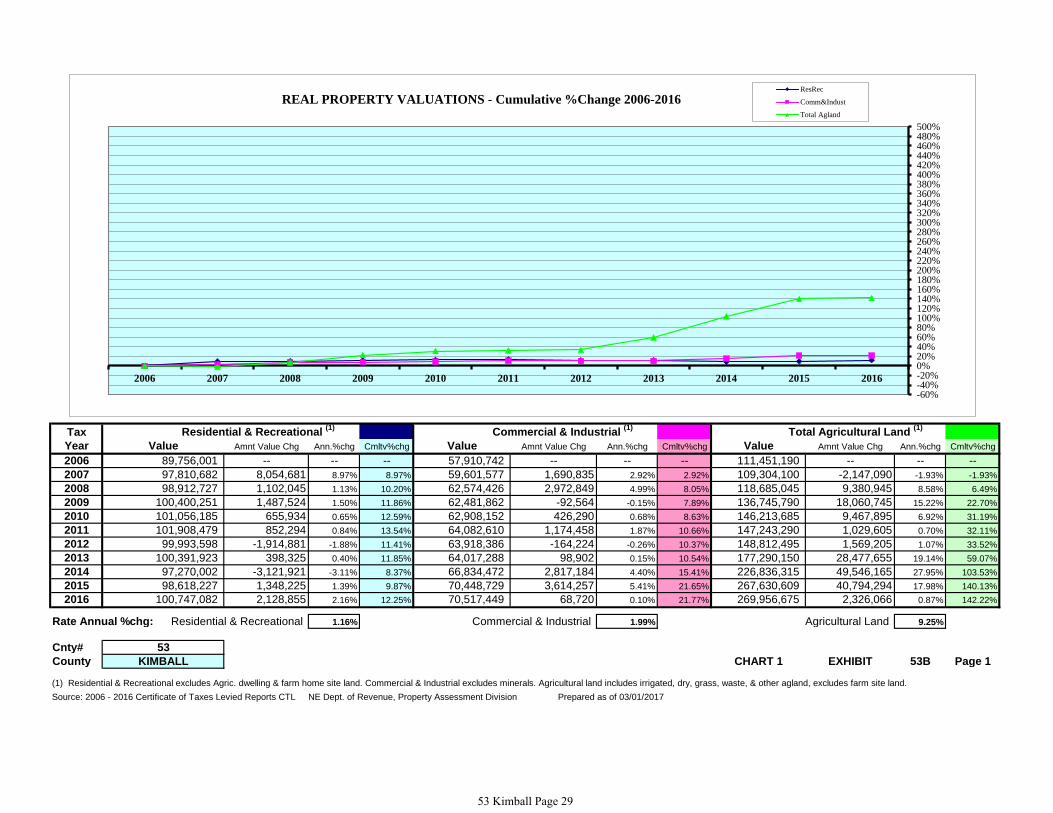
2006 89,756,001 -- -- -- 57,910,742 -- -- -- 111,451,190 -- -- --
2007 97,810,682 8,054,681 8.97% 8.97% 59,601,577 1,690,835 2.92% 2.92% 109,304,100 -2,147,090 -1.93% -1.93%
2008 98,912,727 1,102,045 1.13% 10.20% 62,574,426 2,972,849 4.99% 8.05% 118,685,045 9,380,945 8.58% 6.49%
2009 100,400,251 1,487,524 1.50% 11.86% 62,481,862 -92,564 -0.15% 7.89% 136,745,790 18,060,745 15.22% 22.70%
2010 101,056,185 655,934 0.65% 12.59% 62,908,152 426,290 0.68% 8.63% 146,213,685 9,467,895 6.92% 31.19%
2011 101,908,479 852,294 0.84% 13.54% 64,082,610 1,174,458 1.87% 10.66% 147,243,290 1,029,605 0.70% 32.11%
2012 99,993,598 -1,914,881 -1.88% 11.41% 63,918,386 -164,224 -0.26% 10.37% 148,812,495 1,569,205 1.07% 33.52%
2013 100,391,923 398,325 0.40% 11.85% 64,017,288 98,902 0.15% 10.54% 177,290,150 28,477,655 19.14% 59.07%
2014 97,270,002 -3,121,921 -3.11% 8.37% 66,834,472 2,817,184 4.40% 15.41% 226,836,315 49,546,165 27.95% 103.53%
2015 98,618,227 1,348,225 1.39% 9.87% 70,448,729 3,614,257 5.41% 21.65% 267,630,609 40,794,294 17.98% 140.13%
2016 100,747,082 2,128,855 2.16% 12.25% 70,517,449 68,720 0.10% 21.77% 269,956,675 2,326,066 0.87% 142.22%
Rate Annual %chg: Residential & Recreational 1.16% Commercial & Industrial 1.99% Agricultural Land 9.25%
Cnty# 53
County KIMBALL CHART 1 EXHIBIT 53B Page 1
(1) Residential & Recreational excludes Agric. dwelling & farm home site land. Commercial & Industrial excludes minerals. Agricultural land includes irrigated, dry, grass, waste, & other agland, excludes farm site land.
Source: 2006 - 2016 Certificate of Taxes Levied Reports CTL NE Dept. of Revenue, Property Assessment Division Prepared as of 03/01/2017
-60%-40%-20%0%20%40%60%80%100%120%140%160%180%200%220%240%260%280%300%320%340%360%380%400%420%440%460%480%500%
2006 2007 2008 2009 2010 2011 2012 2013 2014 2015 2016
REAL PROPERTY VALUATIONS - Cumulative %Change 2006-2016ResRec
Comm&Indust
Total Agland
53 Kimball Page 29
Residential & Recreational (1)
Commercial & Industrial (1)
Tax Growth % growth Value Ann.%chg Cmltv%chg Growth % growth Value Ann.%chg Cmltv%chg
Year Value Value of value Exclud. Growth w/o grwth w/o grwth Value Value of value Exclud. Growth w/o grwth w/o grwth
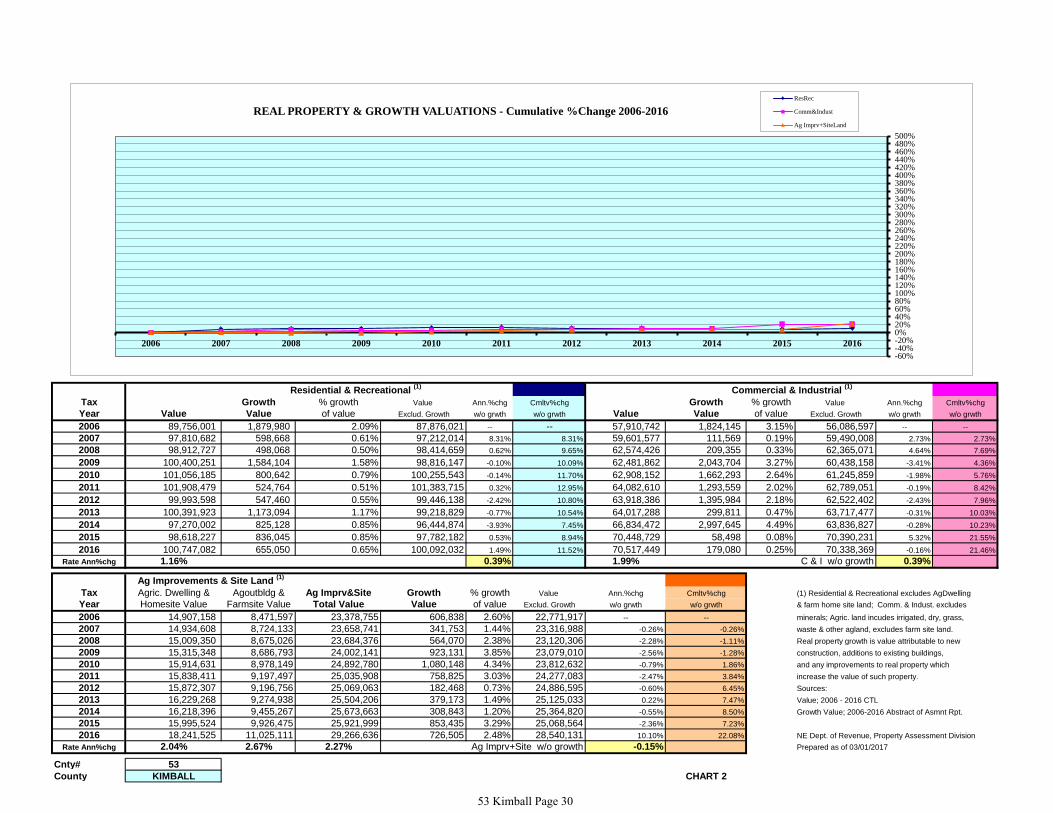
2006 89,756,001 1,879,980 2.09% 87,876,021 -- -- 57,910,742 1,824,145 3.15% 56,086,597 -- --
2007 97,810,682 598,668 0.61% 97,212,014 8.31% 8.31% 59,601,577 111,569 0.19% 59,490,008 2.73% 2.73%
2008 98,912,727 498,068 0.50% 98,414,659 0.62% 9.65% 62,574,426 209,355 0.33% 62,365,071 4.64% 7.69%
2009 100,400,251 1,584,104 1.58% 98,816,147 -0.10% 10.09% 62,481,862 2,043,704 3.27% 60,438,158 -3.41% 4.36%
2010 101,056,185 800,642 0.79% 100,255,543 -0.14% 11.70% 62,908,152 1,662,293 2.64% 61,245,859 -1.98% 5.76%
2011 101,908,479 524,764 0.51% 101,383,715 0.32% 12.95% 64,082,610 1,293,559 2.02% 62,789,051 -0.19% 8.42%
2012 99,993,598 547,460 0.55% 99,446,138 -2.42% 10.80% 63,918,386 1,395,984 2.18% 62,522,402 -2.43% 7.96%
2013 100,391,923 1,173,094 1.17% 99,218,829 -0.77% 10.54% 64,017,288 299,811 0.47% 63,717,477 -0.31% 10.03%
2014 97,270,002 825,128 0.85% 96,444,874 -3.93% 7.45% 66,834,472 2,997,645 4.49% 63,836,827 -0.28% 10.23%
2015 98,618,227 836,045 0.85% 97,782,182 0.53% 8.94% 70,448,729 58,498 0.08% 70,390,231 5.32% 21.55%
2016 100,747,082 655,050 0.65% 100,092,032 1.49% 11.52% 70,517,449 179,080 0.25% 70,338,369 -0.16% 21.46%
Rate Ann%chg 1.16% 0.39% 1.99% C & I w/o growth 0.39%
Ag Improvements & Site Land (1)
Tax Agric. Dwelling & Agoutbldg & Ag Imprv&Site Growth % growth Value Ann.%chg Cmltv%chg (1) Residential & Recreational excludes AgDwelling
Year Homesite Value Farmsite Value Total Value Value of value Exclud. Growth w/o grwth w/o grwth & farm home site land; Comm. & Indust. excludes
2006 14,907,158 8,471,597 23,378,755 606,838 2.60% 22,771,917 -- -- minerals; Agric. land incudes irrigated, dry, grass,
2007 14,934,608 8,724,133 23,658,741 341,753 1.44% 23,316,988 -0.26% -0.26% waste & other agland, excludes farm site land.
2008 15,009,350 8,675,026 23,684,376 564,070 2.38% 23,120,306 -2.28% -1.11% Real property growth is value attributable to new
2009 15,315,348 8,686,793 24,002,141 923,131 3.85% 23,079,010 -2.56% -1.28% construction, additions to existing buildings,
2010 15,914,631 8,978,149 24,892,780 1,080,148 4.34% 23,812,632 -0.79% 1.86% and any improvements to real property which
2011 15,838,411 9,197,497 25,035,908 758,825 3.03% 24,277,083 -2.47% 3.84% increase the value of such property.
2012 15,872,307 9,196,756 25,069,063 182,468 0.73% 24,886,595 -0.60% 6.45% Sources:
2013 16,229,268 9,274,938 25,504,206 379,173 1.49% 25,125,033 0.22% 7.47% Value; 2006 - 2016 CTL
2014 16,218,396 9,455,267 25,673,663 308,843 1.20% 25,364,820 -0.55% 8.50% Growth Value; 2006-2016 Abstract of Asmnt Rpt.
2015 15,995,524 9,926,475 25,921,999 853,435 3.29% 25,068,564 -2.36% 7.23%
2016 18,241,525 11,025,111 29,266,636 726,505 2.48% 28,540,131 10.10% 22.08% NE Dept. of Revenue, Property Assessment Division
Rate Ann%chg 2.04% 2.67% 2.27% Ag Imprv+Site w/o growth -0.15% Prepared as of 03/01/2017
Cnty# 53
County KIMBALL CHART 2
-60%-40%-20%0%20%40%60%80%100%120%140%160%180%200%220%240%260%280%300%320%340%360%380%400%420%440%460%480%500%
2006 2007 2008 2009 2010 2011 2012 2013 2014 2015 2016
REAL PROPERTY & GROWTH VALUATIONS - Cumulative %Change 2006-2016ResRec
Comm&Indust
Ag Imprv+SiteLand
53 Kimball Page 30

Tax Irrigated Land Dryland Grassland
Year Value Value Chg Ann%chg Cmltv%chg Value Value Chg Ann%chg Cmltv%chg Value Value Chg Ann%chg Cmltv%chg
2006 19,045,830 -- -- -- 46,977,720 -- -- -- 45,315,605 -- -- --
2007 20,272,655 1,226,825 6.44% 6.44% 44,120,405 -2,857,315 -6.08% -6.08% 44,799,900 -515,705 -1.14% -1.14%
2008 23,209,715 2,937,060 14.49% 21.86% 47,526,985 3,406,580 7.72% 1.17% 47,802,515 3,002,615 6.70% 5.49%
2009 28,410,690 5,200,975 22.41% 49.17% 52,174,370 4,647,385 9.78% 11.06% 56,160,730 8,358,215 17.48% 23.93%
2010 28,246,780 -163,910 -0.58% 48.31% 58,711,030 6,536,660 12.53% 24.98% 59,255,875 3,095,145 5.51% 30.76%
2011 28,176,190 -70,590 -0.25% 47.94% 58,816,510 105,480 0.18% 25.20% 60,250,590 994,715 1.68% 32.96%
2012 28,290,670 114,480 0.41% 48.54% 58,927,725 111,215 0.19% 25.44% 61,594,100 1,343,510 2.23% 35.92%
2013 40,961,985 12,671,315 44.79% 115.07% 69,442,615 10,514,890 17.84% 47.82% 66,885,550 5,291,450 8.59% 47.60%
2014 53,436,430 12,474,445 30.45% 180.57% 86,719,185 17,276,570 24.88% 84.60% 86,680,700 19,795,150 29.60% 91.28%
2015 66,747,407 13,310,977 24.91% 250.46% 105,402,902 18,683,717 21.55% 124.37% 95,479,080 8,798,380 10.15% 110.70%
2016 66,861,035 113,628 0.17% 251.05% 106,188,090 785,188 0.74% 126.04% 96,907,550 1,428,470 1.50% 113.85%
Rate Ann.%chg: Irrigated 13.38% Dryland 8.50% Grassland 7.90%
Tax Waste Land (1)
Other Agland (1)
Total Agricultural
Year Value Value Chg Ann%chg Cmltv%chg Value Value Chg Ann%chg Cmltv%chg Value Value Chg Ann%chg Cmltv%chg
2006 108,845 -- -- -- 3,190 -- -- -- 111,451,190 -- -- --
2007 107,950 -895 -0.82% -0.82% 3,190 0 0.00% 0.00% 109,304,100 -2,147,090 -1.93% -1.93%
2008 107,905 -45 -0.04% -0.86% 37,925 34,735 1088.87% 1088.87% 118,685,045 9,380,945 8.58% 6.49%
2009 0 -107,905 -100.00% -100.00% 0 -37,925 -100.00% -100.00% 136,745,790 18,060,745 15.22% 22.70%
2010 0 0 -100.00% 0 0 -100.00% 146,213,685 9,467,895 6.92% 31.19%
2011 0 0 -100.00% 0 0 -100.00% 147,243,290 1,029,605 0.70% 32.11%
2012 0 0 -100.00% 0 0 -100.00% 148,812,495 1,569,205 1.07% 33.52%
2013 0 0 -100.00% 0 0 -100.00% 177,290,150 28,477,655 19.14% 59.07%
2014 0 0 -100.00% 0 0 -100.00% 226,836,315 49,546,165 27.95% 103.53%
2015 0 0 -100.00% 1,220 1,220 -61.76% 267,630,609 40,794,294 17.98% 140.13%
2016 0 0 -100.00% 0 -1,220 -100.00% -100.00% 269,956,675 2,326,066 0.87% 142.22%
Cnty# 53 Rate Ann.%chg: Total Agric Land 9.25%
County KIMBALL
Source: 2006 - 2016 Certificate of Taxes Levied Reports CTL NE Dept. of Revenue, Property Assessment Division Prepared as of 03/01/2017 CHART 3 EXHIBIT 53B Page 3
-60%-40%-20%0%20%40%60%80%100%120%140%160%180%200%220%240%260%280%300%320%340%360%380%400%420%440%460%480%500%
2006 2007 2008 2009 2010 2011 2012 2013 2014 2015 2016
AGRICULTURAL LAND VALUATIONS - Cumulative %Change 2006-2016
Irrigated
Dryland
Total Agland
Grassland
53 Kimball Page 31
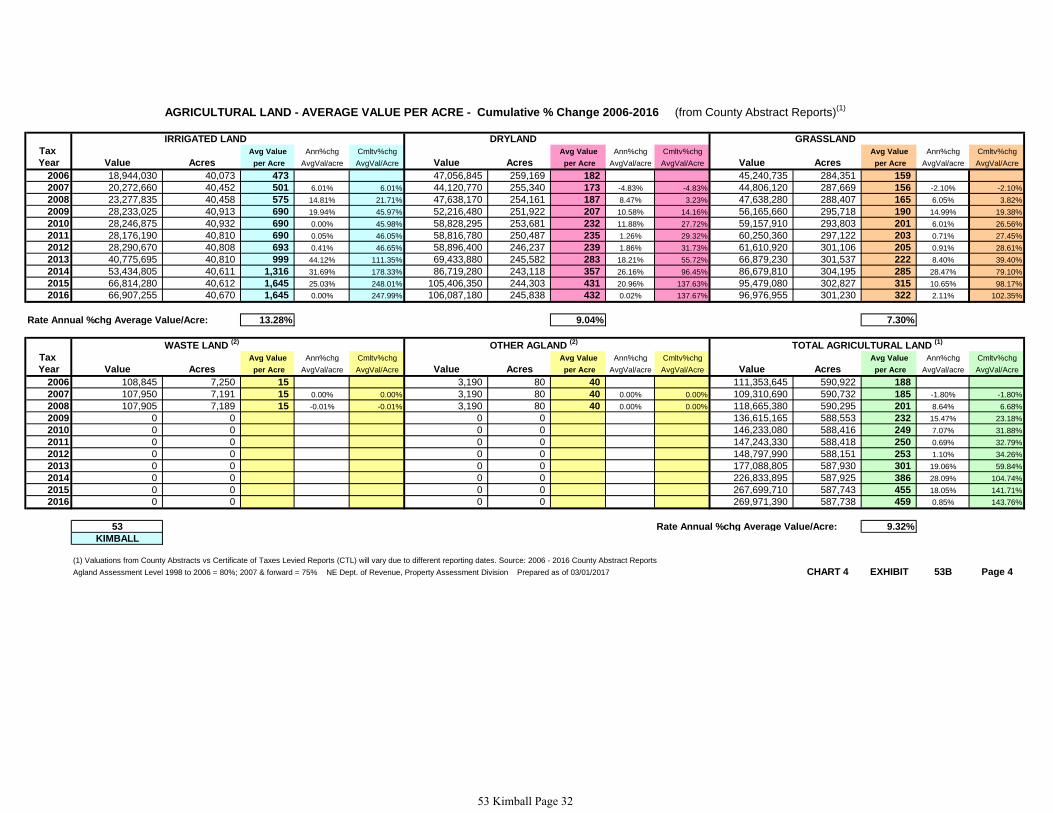
AGRICULTURAL LAND - AVERAGE VALUE PER ACRE - Cumulative % Change 2006-2016 (from County Abstract Reports)(1)
IRRIGATED LAND DRYLAND GRASSLAND
Tax Avg Value Ann%chg Cmltv%chg Avg Value Ann%chg Cmltv%chg Avg Value Ann%chg Cmltv%chg
Year Value Acres per Acre AvgVal/acre AvgVal/Acre Value Acres per Acre AvgVal/acre AvgVal/Acre Value Acres per Acre AvgVal/acre AvgVal/Acre
2006 18,944,030 40,073 473 47,056,845 259,169 182 45,240,735 284,351 159
2007 20,272,660 40,452 501 6.01% 6.01% 44,120,770 255,340 173 -4.83% -4.83% 44,806,120 287,669 156 -2.10% -2.10%
2008 23,277,835 40,458 575 14.81% 21.71% 47,638,170 254,161 187 8.47% 3.23% 47,638,280 288,407 165 6.05% 3.82%
2009 28,233,025 40,913 690 19.94% 45.97% 52,216,480 251,922 207 10.58% 14.16% 56,165,660 295,718 190 14.99% 19.38%
2010 28,246,875 40,932 690 0.00% 45.98% 58,828,295 253,681 232 11.88% 27.72% 59,157,910 293,803 201 6.01% 26.56%
2011 28,176,190 40,810 690 0.05% 46.05% 58,816,780 250,487 235 1.26% 29.32% 60,250,360 297,122 203 0.71% 27.45%
2012 28,290,670 40,808 693 0.41% 46.65% 58,896,400 246,237 239 1.86% 31.73% 61,610,920 301,106 205 0.91% 28.61%
2013 40,775,695 40,810 999 44.12% 111.35% 69,433,880 245,582 283 18.21% 55.72% 66,879,230 301,537 222 8.40% 39.40%
2014 53,434,805 40,611 1,316 31.69% 178.33% 86,719,280 243,118 357 26.16% 96.45% 86,679,810 304,195 285 28.47% 79.10%
2015 66,814,280 40,612 1,645 25.03% 248.01% 105,406,350 244,303 431 20.96% 137.63% 95,479,080 302,827 315 10.65% 98.17%
2016 66,907,255 40,670 1,645 0.00% 247.99% 106,087,180 245,838 432 0.02% 137.67% 96,976,955 301,230 322 2.11% 102.35%
Rate Annual %chg Average Value/Acre: 13.28% 9.04% 7.30%
WASTE LAND (2)
OTHER AGLAND (2)
TOTAL AGRICULTURAL LAND (1)
Tax Avg Value Ann%chg Cmltv%chg Avg Value Ann%chg Cmltv%chg Avg Value Ann%chg Cmltv%chg
Year Value Acres per Acre AvgVal/acre AvgVal/Acre Value Acres per Acre AvgVal/acre AvgVal/Acre Value Acres per Acre AvgVal/acre AvgVal/Acre
2006 108,845 7,250 15 3,190 80 40 111,353,645 590,922 188
2007 107,950 7,191 15 0.00% 0.00% 3,190 80 40 0.00% 0.00% 109,310,690 590,732 185 -1.80% -1.80%
2008 107,905 7,189 15 -0.01% -0.01% 3,190 80 40 0.00% 0.00% 118,665,380 590,295 201 8.64% 6.68%
2009 0 0 0 0 136,615,165 588,553 232 15.47% 23.18%
2010 0 0 0 0 146,233,080 588,416 249 7.07% 31.88%
2011 0 0 0 0 147,243,330 588,418 250 0.69% 32.79%
2012 0 0 0 0 148,797,990 588,151 253 1.10% 34.26%
2013 0 0 0 0 177,088,805 587,930 301 19.06% 59.84%
2014 0 0 0 0 226,833,895 587,925 386 28.09% 104.74%
2015 0 0 0 0 267,699,710 587,743 455 18.05% 141.71%
2016 0 0 0 0 269,971,390 587,738 459 0.85% 143.76%
53 Rate Annual %chg Average Value/Acre: 9.32%
KIMBALL
(1) Valuations from County Abstracts vs Certificate of Taxes Levied Reports (CTL) will vary due to different reporting dates. Source: 2006 - 2016 County Abstract Reports
Agland Assessment Level 1998 to 2006 = 80%; 2007 & forward = 75% NE Dept. of Revenue, Property Assessment Division Prepared as of 03/01/2017 CHART 4 EXHIBIT 53B Page 4
53 Kimball Page 32

2016 County and Municipal Valuations by Property TypePop. County: Personal Prop StateAsd PP StateAsdReal Residential Commercial Industrial Recreation Agland Agdwell&HS AgImprv&FS Minerals Total Value
3,821 KIMBALL 36,974,242 67,938,513 78,719,802 100,747,082 30,896,735 39,620,714 0 269,956,675 18,241,525 11,025,111 33,133,199 687,253,598
cnty sectorvalue % of total value: 5.38% 9.89% 11.45% 14.66% 4.50% 5.77% 39.28% 2.65% 1.60% 4.82% 100.00%
Pop. Municipality: Personal Prop StateAsd PP StateAsd Real Residential Commercial Industrial Recreation Agland Agdwell&HS AgImprv&FS Minerals Total Value
124 BUSHNELL 56,162 461,235 1,467,931 3,308,870 444,258 0 0 0 0 2,590 0 5,741,046
3.25% %sector of county sector 0.15% 0.68% 1.86% 3.28% 1.44% 0.02% 0.84% %sector of municipality 0.98% 8.03% 25.57% 57.64% 7.74% 0.05% 100.00%
255 DIX 110,345 464,206 1,227,582 5,684,354 844,255 0 0 0 0 0 0 8,330,742
6.67% %sector of county sector 0.30% 0.68% 1.56% 5.64% 2.73% 1.21% %sector of municipality 1.32% 5.57% 14.74% 68.23% 10.13% 100.00%
2,496 KIMBALL 7,112,288 2,744,218 6,091,300 63,456,124 20,761,025 5,492,369 0 0 0 0 22,140 105,679,464
65.32% %sector of county sector 19.24% 4.04% 7.74% 62.99% 67.19% 13.86% 0.07% 15.38% %sector of municipality 6.73% 2.60% 5.76% 60.05% 19.65% 5.20% 0.02% 100.00%
2,875 Total Municipalities 7,278,795 3,669,659 8,786,813 72,449,348 22,049,538 5,492,369 0 0 0 2,590 22,140 119,751,252
75.24% %all municip.sect of cnty 19.69% 5.40% 11.16% 71.91% 71.37% 13.86% 0.02% 0.07% 17.42%Cnty# County Sources: 2016 Certificate of Taxes Levied CTL, 2010 US Census; Dec. 2016 Municipality Population per Research Division NE Dept. of Revenue, Property Assessment Division Prepared as of 03/01/2017
53 KIMBALL CHART 5 EXHIBIT 53B Page 5
53 Kimball Page 33

KimballCounty 53 2017 County Abstract of Assessment for Real Property, Form 45
01. Res UnImp Land
02. Res Improve Land
148 614,900 32 122,245 115 321,940 295 1,059,085
1,280 9,932,865 98 1,455,735 163 3,607,110 1,541 14,995,710
1,332 70,720,175 112 8,448,040 197 16,013,315 1,641 95,181,530
1,936 111,236,325 227,945
464,458 78 44,255 9 49,255 15 370,948 54
312 3,666,545 29 215,525 32 116,662 373 3,998,732
28,427,140 418 511,485 50 7,601,435 45 20,314,220 323
496 32,890,330 325,015
03. Res Improvements
04. Res Total
05. Com UnImp Land
06. Com Improve Land
07. Com Improvements
08. Com Total
4,879 516,550,019 927,758 Total Real Property
Growth Value : Records : Sum Lines 17, 25, & 30 Sum Lines 17, 25, & 41
09. Ind UnImp Land
10. Ind Improve Land
11. Ind Improvements
12. Ind Total
13. Rec UnImp Land
14. Rec Improve Land
15. Rec Improvements
16. Rec Total
17. Taxable Total
0 0 0 0 1 110,650 1 110,650
7 207,750 0 0 1 81,585 8 289,335
7 5,041,310 0 0 1 33,926,275 8 38,967,585
9 39,367,570 0
0 0 0 0 0 0 0 0
0 0 0 0 0 0 0 0
0 0 0 0 0 0 0 0
0 0 0
2,441 183,494,225 552,960
Urban SubUrban Rural Total GrowthRecords Value Records Value Records Value Records Value
Schedule I : Non-Agricultural Records
% of Res Total
% of Com Total
% of Ind Total
% of Rec Total
% of Taxable Total
% of Res & Rec Total
Res & Rec Total
% of Com & Ind Total
Com & Ind Total
76.45 73.06 7.44 9.01 16.12 17.93 39.68 21.53
15.28 29.83 50.03 35.52
384 29,600,773 60 7,866,215 61 34,790,912 505 72,257,900
1,936 111,236,325 1,480 81,267,940 312 19,942,365 144 10,026,020
73.06 76.45 21.53 39.68 9.01 7.44 17.93 16.12
0.00 0.00 0.00 0.00 0.00 0.00 0.00 0.00
40.97 76.04 13.99 10.35 10.89 11.88 48.15 12.08
22.22 86.67 0.18 7.62 0.00 0.00 13.33 77.78
74.04 76.01 6.37 10.17 23.92 12.10 2.04 11.90
9.75 8.36 60.42 76.36
312 19,942,365 144 10,026,020 1,480 81,267,940
59 672,402 60 7,866,215 377 24,351,713
2 34,118,510 0 0 7 5,249,060
0 0 0 0 0 0
1,864 110,868,713 204 17,892,235 373 54,733,277
35.03
0.00
0.00
24.57
59.60
35.03
24.57
325,015
227,945
53 Kimball Page 34
KimballCounty 53 2017 County Abstract of Assessment for Real Property, Form 45
18. Residential
Records
TotalRural
SubUrban Urban
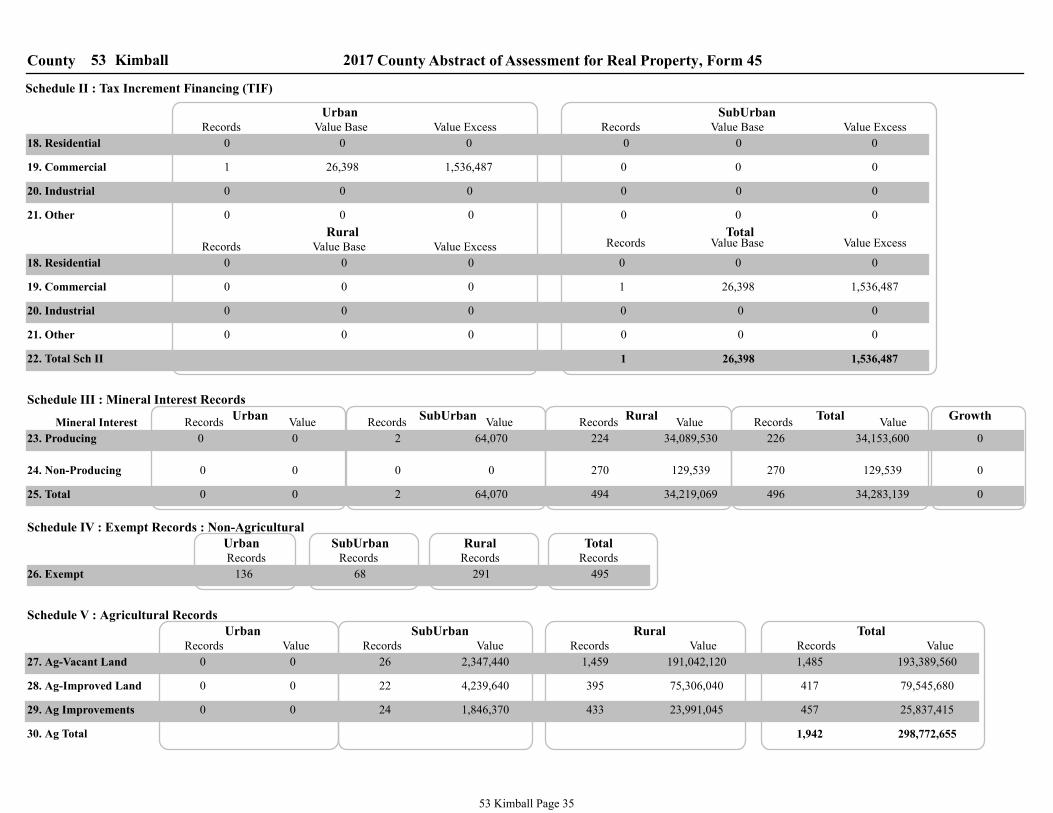
Schedule II : Tax Increment Financing (TIF)
Value Base Value Excess Value ExcessValue BaseRecords
0 0 0 0 0 0
19. Commercial
20. Industrial
21. Other
22. Total Sch II
1 26,398 1,536,487
0 0 0
0 0 0 0 0 0
0 0 0
0 0 0
Value ExcessValue BaseRecordsValue ExcessValue BaseRecords
21. Other
20. Industrial
19. Commercial
18. Residential 0 0 0 0 0 0
0 0 0 1 26,398 1,536,487
0 0 0 0 0 0
0 0 0 0 0 0
1 26,398 1,536,487
23. Producing
GrowthValueRecords
TotalValueRecords
RuralValueRecords
SubUrbanValueRecords
UrbanSchedule III : Mineral Interest Records
0 0 2 64,070 224 34,089,530 226 34,153,600 0
0 0 0 0 270 129,539 270 129,539 0
0 0 2 64,070 494 34,219,069 496 34,283,139 0
Mineral Interest
24. Non-Producing
25. Total
Schedule IV : Exempt Records : Non-Agricultural
Schedule V : Agricultural Records
Records Records Records RecordsTotalRural SubUrban Urban
26. Exempt 136 68 291 495
30. Ag Total
29. Ag Improvements
28. Ag-Improved Land
ValueRecordsTotal
ValueRecordsRural
Records Value SubUrban
ValueRecords
27. Ag-Vacant Land
Urban
0 0 26 2,347,440 1,459 191,042,120 1,485 193,389,560
0 0 22 4,239,640 395 75,306,040 417 79,545,680
0 0 24 1,846,370 433 23,991,045 457 25,837,415
1,942 298,772,655
53 Kimball Page 35
KimballCounty 53 2017 County Abstract of Assessment for Real Property, Form 45
31. HomeSite UnImp Land
Records
TotalRural
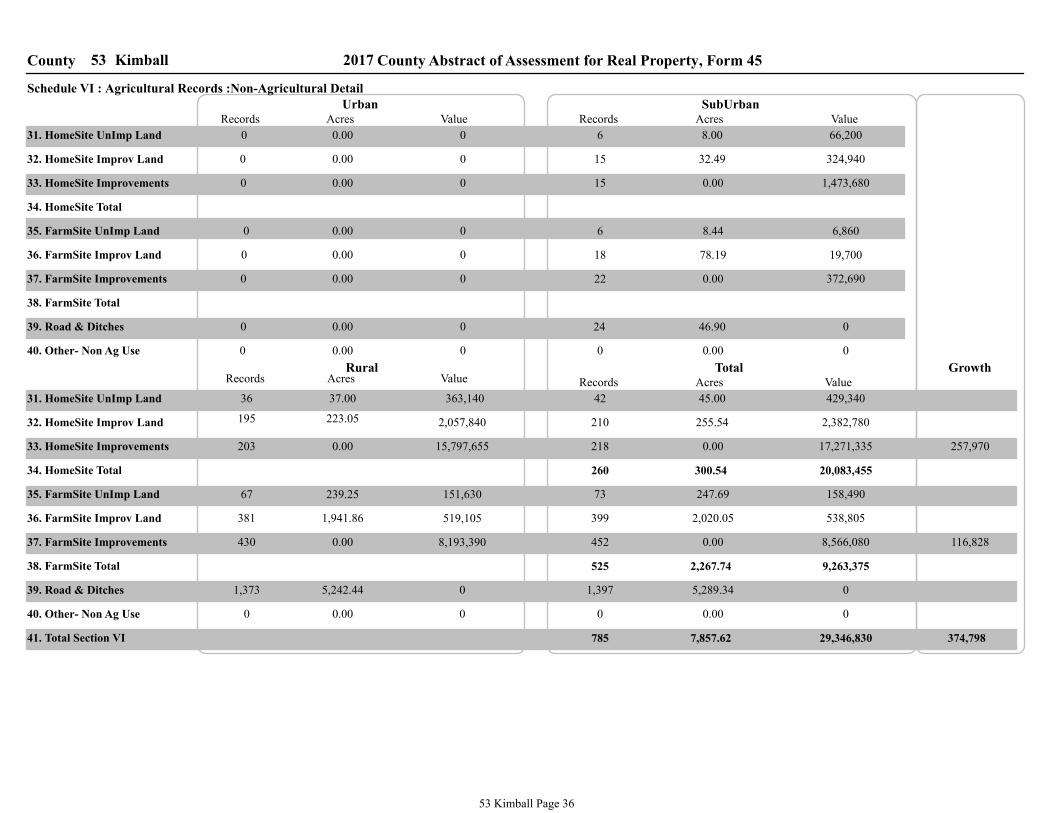
SubUrban UrbanSchedule VI : Agricultural Records :Non-Agricultural Detail
Acres Value ValueAcresRecords
32. HomeSite Improv Land
33. HomeSite Improvements
34. HomeSite Total
ValueAcresRecordsValueAcres
34. HomeSite Total
33. HomeSite Improvements
32. HomeSite Improv Land
31. HomeSite UnImp Land
35. FarmSite UnImp Land
36. FarmSite Improv Land
37. FarmSite Improvements
38. FarmSite Total
37. FarmSite Improvements
36. FarmSite Improv Land
35. FarmSite UnImp Land
39. Road & Ditches
38. FarmSite Total
39. Road & Ditches
Records
40. Other- Non Ag Use
40. Other- Non Ag Use
41. Total Section VI
0 0.00 0 6 8.00 66,200
0 0.00 0
0 0.00 0 15
0 0.00 0 6
0 0.00 0 18
0 0.00 0 22
0 0.00 0 24
0 0.00 0 0 0.00 0
0 46.90
372,690 0.00
19,700 78.19
8.44 6,860
1,473,680 0.00
324,940 32.49 15
36 363,140 37.00 42 45.00 429,340
195 223.05 2,057,840 210 255.54 2,382,780
203 0.00 15,797,655 218 0.00 17,271,335
260 300.54 20,083,455
239.25 67 151,630 73 247.69 158,490
381 1,941.86 519,105 399 2,020.05 538,805
430 0.00 8,193,390 452 0.00 8,566,080
525 2,267.74 9,263,375
1,373 5,242.44 0 1,397 5,289.34 0
0 0.00 0 0 0.00 0
785 7,857.62 29,346,830
Growth
116,828
257,970
374,798
53 Kimball Page 36

KimballCounty 53 2017 County Abstract of Assessment for Real Property, Form 45
42. Game & Parks
ValueAcresRecords
SubUrban
ValueAcresRecords
Urban
0 0.00 0 0 0.00 0
42. Game & Parks
ValueAcresRecordsTotal
ValueAcresRecordsRural
Schedule VII : Agricultural Records :Ag Land Detail - Game & Parks
0 0.00 0 0 0.00 0
Schedule VIII : Agricultural Records : Special Value
43. Special Value
ValueAcresRecords SubUrban
ValueAcresRecords Urban
43. Special Value
ValueAcresRecordsTotal
ValueAcresRecordsRural
44. Recapture Value N/A
44. Market Value
0 0.00 0 0 0.00 0
0 0.00 0 0 0.00 0
0 0.00 0 0 0.00 0
* LB 968 (2006) for tax year 2009 and forward there will be no Recapture value.
0 0 0 0 0 0
53 Kimball Page 37
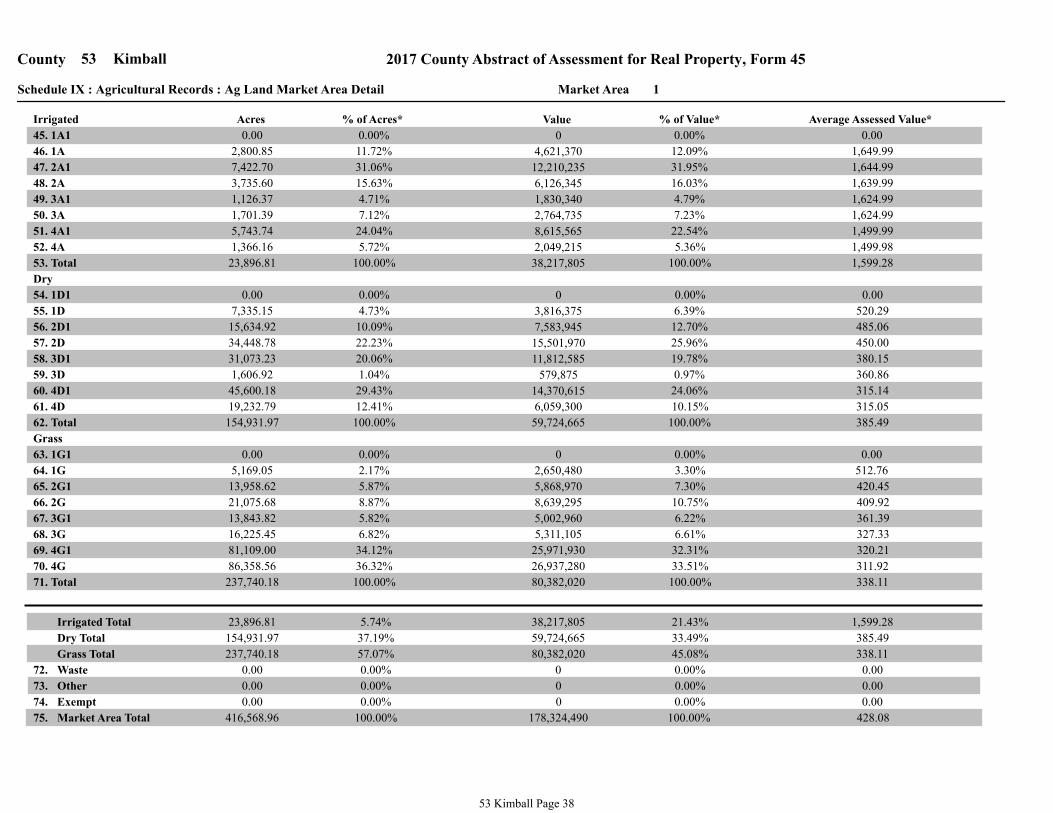
1Market AreaSchedule IX : Agricultural Records : Ag Land Market Area Detail
2017 County Abstract of Assessment for Real Property, Form 45Kimball53County
45. 1A1
ValueAcres
46. 1A
47. 2A1
48. 2A
49. 3A1
50. 3A
51. 4A1
52. 4A
53. Total
54. 1D1
55. 1D
56. 2D1
57. 2D
58. 3D1
59. 3D
60. 4D1
61. 4D
62. Total
63. 1G1
64. 1G
65. 2G1
66. 2G
67. 3G1
68. 3G
69. 4G1
70. 4G
71. Total
Waste
Other
Exempt
Irrigated
Dry
Grass
Market Area Total 178,324,490 416,568.96
0 0.00
0 0.00
0 0.00
80,382,020 237,740.18
26,937,280 86,358.56
25,971,930 81,109.00
5,311,105 16,225.45
5,002,960 13,843.82
8,639,295 21,075.68
5,868,970 13,958.62
2,650,480 5,169.05
0 0.00
59,724,665 154,931.97
6,059,300 19,232.79
45,600.18 14,370,615
579,875 1,606.92
11,812,585 31,073.23
15,501,970 34,448.78
7,583,945 15,634.92
3,816,375 7,335.15
0 0.00
38,217,805 23,896.81
2,049,215 1,366.16
8,615,565 5,743.74
2,764,735 1,701.39
1,830,340 1,126.37
6,126,345 3,735.60
12,210,235 7,422.70
4,621,370 2,800.85
0 0.00
% of Acres* % of Value*
0.00%
11.72%
4.73%
0.00%
0.00%
2.17%
15.63%
31.06%
22.23%
10.09%
8.87%
5.87%
4.71%
7.12%
1.04%
20.06%
5.82%
6.82%
5.72%
24.04%
29.43%
12.41%
36.32%
34.12%
100.00%
100.00%
100.00%
Grass Total
Dry Total
Irrigated Total 23,896.81
154,931.97
237,740.18
38,217,805
59,724,665
80,382,020
5.74%
37.19%
57.07%
0.00%
0.00%
0.00%
100.00%
Average Assessed Value*
12.09%
0.00%
16.03%
31.95%
4.79%
7.23%
22.54%
5.36%
100.00%
0.00%
6.39%
3.30%
0.00%
12.70%
25.96%
7.30%
10.75%
19.78%
0.97%
6.22%
6.61%
24.06%
10.15%
32.31%
33.51%
100.00%
100.00%
0.00
1,649.99
520.29
0.00
0.00
512.76
1,639.99
1,644.99
485.06
450.00
409.92
420.45
1,624.99
1,624.99
380.15
360.86
361.39
327.33
1,499.99
1,499.98
315.14
315.05
311.92
320.21
1,599.28
385.49
338.11
0.00% 0.00
0.00% 0.00
100.00% 428.08
385.49 33.49%
338.11 45.08%
1,599.28 21.43%
0.00 0.00%72.
73.
74.
75.
53 Kimball Page 38

2Market AreaSchedule IX : Agricultural Records : Ag Land Market Area Detail
2017 County Abstract of Assessment for Real Property, Form 45Kimball53County
45. 1A1
ValueAcres
46. 1A
47. 2A1
48. 2A
49. 3A1
50. 3A
51. 4A1
52. 4A
53. Total
54. 1D1
55. 1D
56. 2D1
57. 2D
58. 3D1
59. 3D
60. 4D1
61. 4D
62. Total
63. 1G1
64. 1G
65. 2G1
66. 2G
67. 3G1
68. 3G
69. 4G1
70. 4G
71. Total
Waste
Other
Exempt
Irrigated
Dry
Grass
Market Area Total 91,101,335 170,937.33
0 0.00
0 0.00
0 0.00
21,832,685 64,005.37
5,914,865 19,586.31
7,662,380 23,978.44
1,011,400 3,133.10
1,110,510 3,169.53
3,678,305 8,953.62
1,489,155 3,292.96
966,070 1,891.41
0 0.00
40,827,685 90,319.51
778,580 2,256.85
30,680.41 10,738,080
712,125 1,825.93
1,529,820 3,686.34
16,130,955 31,942.75
4,208,730 8,016.66
6,729,395 11,910.57
0 0.00
28,440,965 16,612.45
884,620 589.77
8,700,930 5,354.48
1,692,615 1,041.61
412,005 253.53
8,175,530 5,031.14
4,849,775 2,455.58
3,725,490 1,886.34
0 0.00
% of Acres* % of Value*
0.00%
11.35%
13.19%
0.00%
0.00%
2.96%
30.29%
14.78%
35.37%
8.88%
13.99%
5.14%
1.53%
6.27%
2.02%
4.08%
4.95%
4.90%
3.55%
32.23%
33.97%
2.50%
30.60%
37.46%
100.00%
100.00%
100.00%
Grass Total
Dry Total
Irrigated Total 16,612.45
90,319.51
64,005.37
28,440,965
40,827,685
21,832,685
9.72%
52.84%
37.44%
0.00%
0.00%
0.00%
100.00%
Average Assessed Value*
13.10%
0.00%
28.75%
17.05%
1.45%
5.95%
30.59%
3.11%
100.00%
0.00%
16.48%
4.42%
0.00%
10.31%
39.51%
6.82%
16.85%
3.75%
1.74%
5.09%
4.63%
26.30%
1.91%
35.10%
27.09%
100.00%
100.00%
0.00
1,974.98
564.99
0.00
0.00
510.77
1,624.99
1,975.00
525.00
505.00
410.82
452.22
1,625.07
1,625.00
415.00
390.01
350.37
322.81
1,624.98
1,499.94
350.00
344.99
301.99
319.55
1,712.03
452.04
341.11
0.00% 0.00
0.00% 0.00
100.00% 532.95
452.04 44.82%
341.11 23.97%
1,712.03 31.22%
0.00 0.00%72.
73.
74.
75.
53 Kimball Page 39

County 2017 County Abstract of Assessment for Real Property, Form 45Kimball53
Schedule X : Agricultural Records :Ag Land Total
76. Irrigated
TotalValueAcresAcres Value
RuralAcres Value ValueAcres
SubUrban Urban
77. Dry Land
78. Grass
79. Waste
80. Other
81. Exempt
82. Total
0.00 0 2,736.03 4,453,965 37,773.23 62,204,805 40,509.26 66,658,770
0.00 0 1,119.57 483,210 244,131.91 100,069,140 245,251.48 100,552,350
0.00 0 3,812.58 1,232,205 297,932.97 100,982,500 301,745.55 102,214,705
0.00 0 0.00 0 0.00 0 0.00 0
0.00 0 0.00 0 0.00 0 0.00 0
0.00 0
0.00 0 7,668.18 6,169,380
0.00 0 0.00 0 0.00 0
579,838.11 263,256,445 587,506.29 269,425,825
Irrigated
Dry Land
Grass
Waste
Other
Exempt
Total 269,425,825 587,506.29
0 0.00
0 0.00
0 0.00
102,214,705 301,745.55
100,552,350 245,251.48
66,658,770 40,509.26
% of Acres*Acres Value % of Value* Average Assessed Value*
410.00 41.74% 37.32%
0.00 0.00% 0.00%
338.74 51.36% 37.94%
1,645.52 6.90% 24.74%
0.00 0.00% 0.00%
458.59 100.00% 100.00%
0.00 0.00% 0.00%
53 Kimball Page 40

GrowthUnimproved Land Improved Land Improvements Total
2017 County Abstract of Assessment for Real Property, Form 45County 53 Kimball
Records Value Records Value Records Value Records Value
Schedule XI : Residential Records - Assessor Location Detail
Assessor LocationLine# L
0 0 1 3,100 1 17,535 1 20,635 083.1 N/a Or Error
39 92,510 90 367,325 97 2,913,095 136 3,372,930 1,10083.2 Bushnell
38 74,080 132 477,225 138 5,413,020 176 5,964,325 30,04583.3 Dix
71 448,310 1,058 9,092,850 1,098 62,532,330 1,169 72,073,490 130,51083.4 Kimball
147 444,185 260 5,055,210 307 24,305,550 454 29,804,945 66,29083.5 Rural
295 1,059,085 1,541 14,995,710 1,641 95,181,530 1,936 111,236,325 227,94584 Residential Total
53 Kimball Page 41
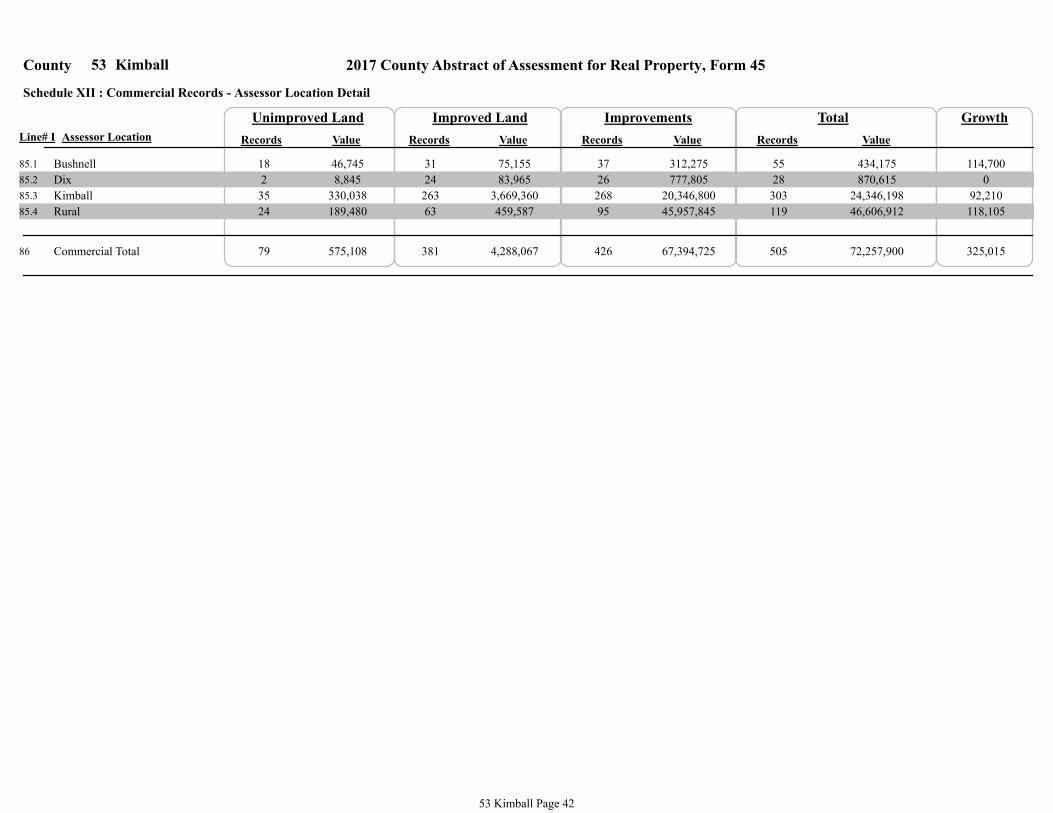
GrowthUnimproved Land Improved Land Improvements Total
2017 County Abstract of Assessment for Real Property, Form 45County 53 Kimball
Records Value Records Value Records Value Records Value
Schedule XII : Commercial Records - Assessor Location Detail
Assessor LocationLine# L
18 46,745 31 75,155 37 312,275 55 434,175 114,70085.1 Bushnell
2 8,845 24 83,965 26 777,805 28 870,615 085.2 Dix
35 330,038 263 3,669,360 268 20,346,800 303 24,346,198 92,21085.3 Kimball
24 189,480 63 459,587 95 45,957,845 119 46,606,912 118,10585.4 Rural
79 575,108 381 4,288,067 426 67,394,725 505 72,257,900 325,01586 Commercial Total
53 Kimball Page 42

1Market AreaSchedule XIII : Agricultural Records : Grass Land Detail By Market Area
2017 County Abstract of Assessment for Real Property, Form 45Kimball53County
87. 1G1
ValueAcres
88. 1G
89. 2G1
90. 2G
91. 3G1
92. 3G
93. 4G1
94. 4G
95. Total
96. 1C1
97. 1C
98. 2C1
99. 2C
100. 3C1
101. 3C
102. 4C1
103. 4C
104. Total
105. 1T1
106. 1T
107. 2T1
108. 2T
109. 3T1
110. 3T
111. 4T1
112. 4T
113. Total
Pure Grass
CRP
Timber
114. Market Area Total 80,382,020 237,740.18
57,768,385 178,870.78
23,329,325 75,257.13
17,788,630 57,389.17
4,965,585 15,278.81
2,529,740 7,335.35
3,906,835 10,559.10
3,587,495 9,440.83
1,660,775 3,610.39
0 0.00
% of Acres* % of Value*
0.00%
2.02%
5.90%
5.28%
4.10%
8.54%
42.07%
32.08%
100.00%
Grass TotalCRP Total
Timber Total
178,870.78 57,768,385 75.24%
100.00%
Average Assessed Value*
2.87%
0.00%
6.21%
6.76%
4.38%
8.60%
30.79%
40.38%
100.00%
0.00
460.00
370.00
380.00
344.87
325.00
309.99
309.96
322.96
100.00% 338.11
322.96 71.87%
0.00
0.00
1,558.66
4,517.79
10,516.58
6,508.47
946.64
23,719.83
11,101.43
58,869.40 22,613,635
3,607,955
8,183,300
345,520
2,473,220
4,732,460
2,281,475
989,705
0
0
0.00 0
0.00 0
0.00 0
0.00 0
0.00 0
0.00 0
0.00 0
0.00 0
2.65% 634.97 4.38%
0.00% 0.00 0.00%
0.00% 0.00 0.00% 0.00% 0.00 0.00%
17.86% 450.00 20.93%
7.67% 505.00 10.09%
0.00% 0.00 0.00% 0.00% 0.00 0.00%
1.61% 365.00 1.53% 11.06% 380.00 10.94%
0.00% 0.00 0.00%
0.00% 0.00 0.00%
18.86% 325.00 15.95%
40.29% 345.00 36.19%
0.00% 0.00 0.00%
0.00% 0.00 0.00%
100.00% 100.00% 384.13
0.00% 0.00%
24.76%
0.00% 0.00
0.00
384.13 28.13%
0.00% 0.00 0
58,869.40 22,613,635
53 Kimball Page 43
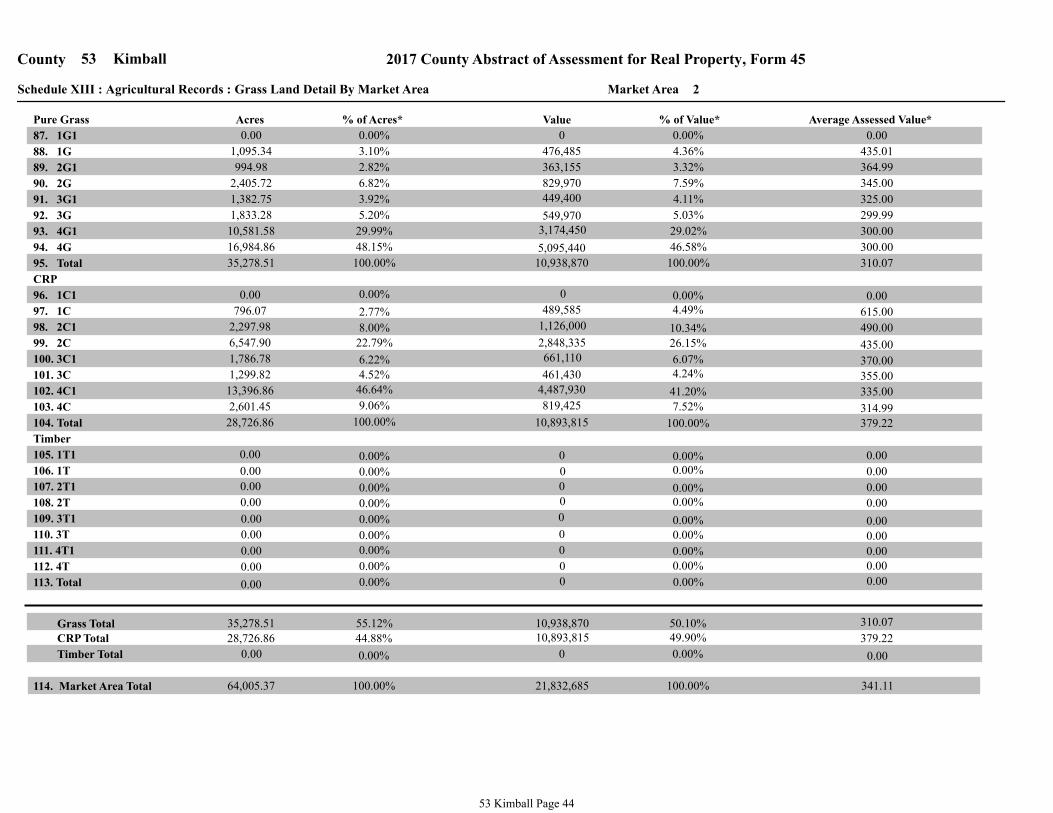
2Market AreaSchedule XIII : Agricultural Records : Grass Land Detail By Market Area
2017 County Abstract of Assessment for Real Property, Form 45Kimball53County
87. 1G1
ValueAcres
88. 1G
89. 2G1
90. 2G
91. 3G1
92. 3G
93. 4G1
94. 4G
95. Total
96. 1C1
97. 1C
98. 2C1
99. 2C
100. 3C1
101. 3C
102. 4C1
103. 4C
104. Total
105. 1T1
106. 1T
107. 2T1
108. 2T
109. 3T1
110. 3T
111. 4T1
112. 4T
113. Total
Pure Grass
CRP
Timber
114. Market Area Total 21,832,685 64,005.37
10,938,870 35,278.51
5,095,440 16,984.86
3,174,450 10,581.58
549,970 1,833.28
449,400 1,382.75
829,970 2,405.72
363,155 994.98
476,485 1,095.34
0 0.00
% of Acres* % of Value*
0.00%
3.10%
6.82%
2.82%
3.92%
5.20%
48.15%
29.99%
100.00%
Grass TotalCRP Total
Timber Total
35,278.51 10,938,870 55.12%
100.00%
Average Assessed Value*
4.36%
0.00%
3.32%
7.59%
4.11%
5.03%
29.02%
46.58%
100.00%
0.00
435.01
345.00
364.99
325.00
299.99
300.00
300.00
310.07
100.00% 341.11
310.07 50.10%
0.00
0.00
796.07
2,297.98
6,547.90
1,786.78
1,299.82
13,396.86
2,601.45
28,726.86 10,893,815
819,425
4,487,930
461,430
661,110
2,848,335
1,126,000
489,585
0
0
0.00 0
0.00 0
0.00 0
0.00 0
0.00 0
0.00 0
0.00 0
0.00 0
2.77% 615.00 4.49%
0.00% 0.00 0.00%
0.00% 0.00 0.00% 0.00% 0.00 0.00%
22.79% 435.00 26.15%
8.00% 490.00 10.34%
0.00% 0.00 0.00% 0.00% 0.00 0.00%
4.52% 355.00 4.24% 6.22% 370.00 6.07%
0.00% 0.00 0.00%
0.00% 0.00 0.00%
9.06% 314.99 7.52%
46.64% 335.00 41.20%
0.00% 0.00 0.00%
0.00% 0.00 0.00%
100.00% 100.00% 379.22
0.00% 0.00%
44.88%
0.00% 0.00
0.00
379.22 49.90%
0.00% 0.00 0
28,726.86 10,893,815
53 Kimball Page 44

2017 County Abstract of Assessment for Real Property, Form 45
53 KimballCompared with the 2016 Certificate of Taxes Levied Report (CTL)
2016 CTL
County Total
2017 Form 45
County Total
Value Difference Percent
Change
2017 Growth Percent Change
excl. Growth
100,747,082
0
01. Residential
02. Recreational
03. Ag-Homesite Land, Ag-Res Dwelling
04. Total Residential (sum lines 1-3)
05. Commercial
06. Industrial
07. Total Commercial (sum lines 5-6)
08. Ag-Farmsite Land, Outbuildings
09. Minerals
10. Non Ag Use Land
11. Total Non-Agland (sum lines 8-10)
12. Irrigated
13. Dryland
14. Grassland
15. Wasteland
16. Other Agland
18. Total Value of all Real Property
(Locally Assessed)
(2017 form 45 - 2016 CTL) (New Construction Value)
18,241,525
118,988,607
30,896,735
39,620,714
70,517,449
11,025,111
33,133,199
0
44,158,310
66,861,035
106,188,090
96,907,550
0
0
269,956,675
111,236,325
0
20,083,455
131,319,780
32,890,330
39,367,570
72,257,900
9,263,375
34,283,139
0
43,546,514
66,658,770
100,552,350
102,214,705
0
0
269,425,825
10,489,243
0
1,841,930
12,331,173
1,993,595
-253,144
1,740,451
-1,761,736
1,149,940
0
-611,796
-202,265
-5,635,740
5,307,155
0
0
-530,850
10.41%
10.10%
10.36%
6.45%
-0.64%
2.47%
-15.98%
3.47
-1.39%
-0.30%
-5.31%
5.48%
-0.20%
227,945
0
485,915
325,015
0
325,015
116,828
0
10.19%
8.68%
9.95%
5.40%
-0.64%
2.01%
-17.04%
3.47%
257,970
17. Total Agricultural Land
503,621,041 516,550,019 12,928,978 2.57% 927,758 2.38%
116,828 -1.65%
53 Kimball Page 45

2017 Assessment Survey for Kimball County
A. Staffing and Funding Information
Deputy(ies) on staff:1.
One
Appraiser(s) on staff:2.
None
Other full-time employees:3.
Two
Other part-time employees:4.
None
Number of shared employees:5.
None
Assessor’s requested budget for current fiscal year:6.
$142,228
Adopted budget, or granted budget if different from above:7.
$141,250
Amount of the total assessor’s budget set aside for appraisal work:8.
None.
If appraisal/reappraisal budget is a separate levied fund, what is that amount:9.
$62,501--a separate, but not levied fund.
Part of the assessor’s budget that is dedicated to the computer system:10.
$12,528--$6,825 of this is for GIS support.
Amount of the assessor’s budget set aside for education/workshops:11.
$4,000
Other miscellaneous funds:12.
None.
Amount of last year’s assessor’s budget not used:13.
$10,396.17
53 Kimball Page 46
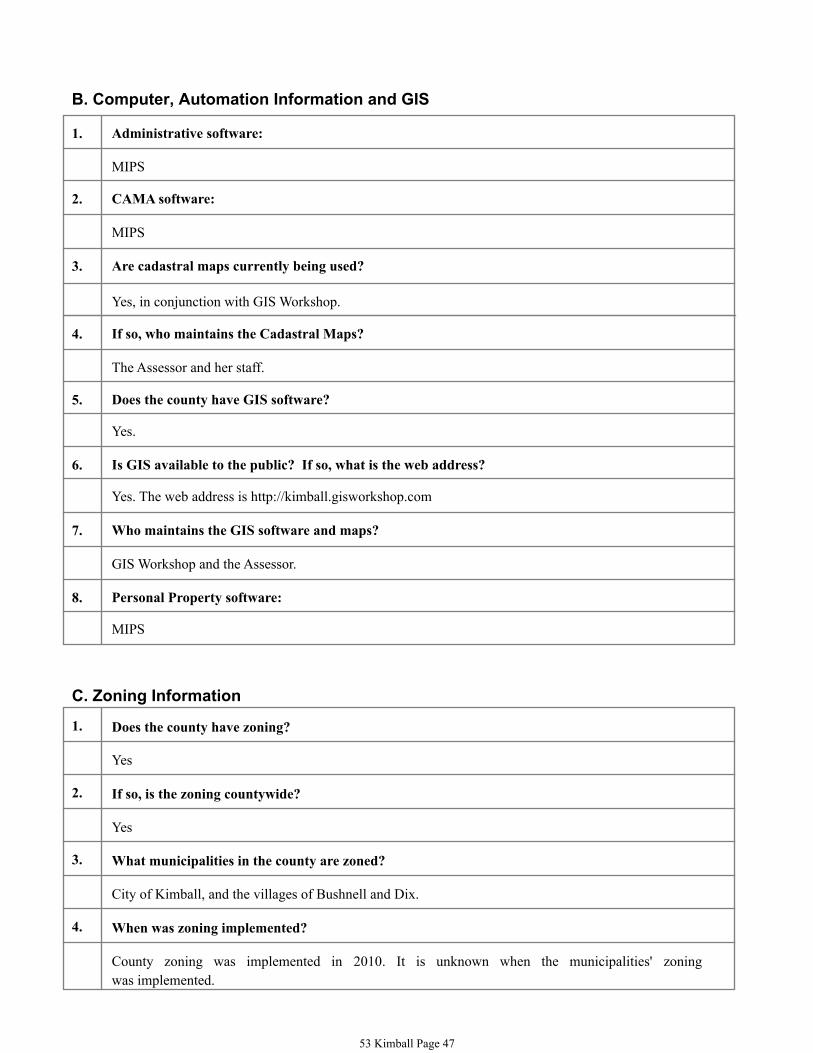
B. Computer, Automation Information and GIS
1. Administrative software:
MIPS
2. CAMA software:
MIPS
3. Are cadastral maps currently being used?
Yes, in conjunction with GIS Workshop.
4. If so, who maintains the Cadastral Maps?
The Assessor and her staff.
5. Does the county have GIS software?
Yes.
6. Is GIS available to the public? If so, what is the web address?
Yes. The web address is http://kimball.gisworkshop.com
7. Who maintains the GIS software and maps?
GIS Workshop and the Assessor.
8. Personal Property software:
MIPS
C. Zoning Information
1. Does the county have zoning?
Yes
2. If so, is the zoning countywide?
Yes
3. What municipalities in the county are zoned?
City of Kimball, and the villages of Bushnell and Dix.
4. When was zoning implemented?
County zoning was implemented in 2010. It is unknown when the municipalities' zoning
was implemented.
53 Kimball Page 47
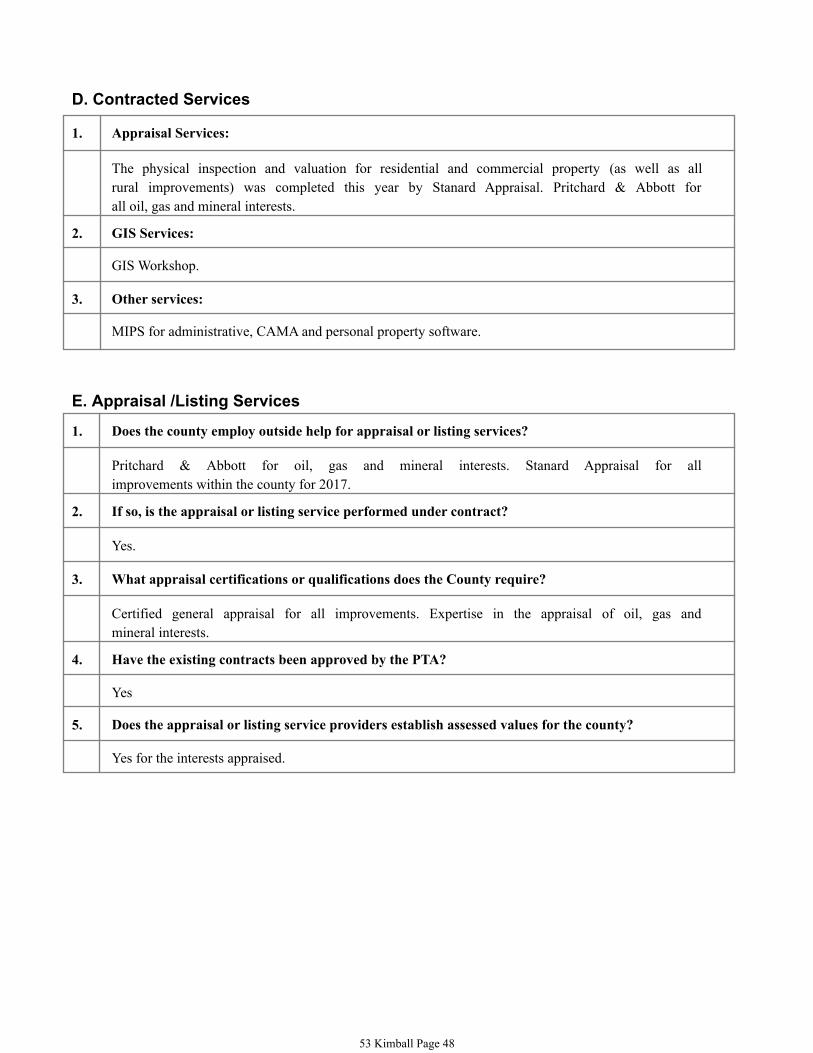
D. Contracted Services
1. Appraisal Services:
The physical inspection and valuation for residential and commercial property (as well as all
rural improvements) was completed this year by Stanard Appraisal. Pritchard & Abbott for
all oil, gas and mineral interests.
2. GIS Services:
GIS Workshop.
3. Other services:
MIPS for administrative, CAMA and personal property software.
E. Appraisal /Listing Services
1. Does the county employ outside help for appraisal or listing services?
Pritchard & Abbott for oil, gas and mineral interests. Stanard Appraisal for all
improvements within the county for 2017.
2. If so, is the appraisal or listing service performed under contract?
Yes.
3. What appraisal certifications or qualifications does the County require?
Certified general appraisal for all improvements. Expertise in the appraisal of oil, gas and
mineral interests.
4. Have the existing contracts been approved by the PTA?
Yes
5. Does the appraisal or listing service providers establish assessed values for the county?
Yes for the interests appraised.
53 Kimball Page 48

2017 Residential Assessment Survey for Kimball County
1. Valuation data collection done by:
Stanard Appraisal, in conjunction with the Assessor and her staff.
List the valuation groupings recognized by the County and describe the unique
characteristics of each:
2.
Description of unique characteristicsValuation
Grouping
10 Kimball: all residential parcels within the City of Kimball.
20 Bushnell: the residential parcels within the village of Bushnell
30 Dix: all residential parcels within the village of Dix.
80 Rural: the remaining residential parcels not found within the aforementioned valuation
groupings, including those that could be called suburban.
AG Agricultural homes and outbuildings.
3. List and describe the approach(es) used to estimate the market value of residential
properties.
The cost approach.
4. If the cost approach is used, does the County develop the depreciation study(ies) based on
local market information or does the county use the tables provided by the CAMA vendor?
For the re-appraisal, local market depreciation was used.
5. Are individual depreciation tables developed for each valuation grouping?
No.
6. Describe the methodology used to determine the residential lot values?
The market approach is used, and then values are determined on a square foot basis.
7. Describe the methodology used to determine value for vacant lots being held for sale or
resale?
The Assessor is not aware of any vacant lots being held for sale or resale.
8. Valuation
Grouping
Date of
Costing
Date of
Lot Value Study
Date of
Last Inspection
Date of
Depreciation Tables
10 2016 2016 2016 2016
20 2016 2016 2016 2016
30 2016 2016 2016 2016
80 2016 2016 2016 2016
AG 2016 2016 2016 2016
53 Kimball Page 49

53 Kimball Page 50

2017 Commercial Assessment Survey for Kimball County
1. Valuation data collection done by:
Stanard Appraisal for assessment year 2017.
List the valuation groupings recognized in the County and describe the unique characteristics
of each:
2.
Description of unique characteristicsValuation
Grouping
10 Kimball: all commercial properties within the city of Kimball and the commercial properties
considered to be suburban, since there is no separate suburban commercial market.
20 Bushnell: commercial parcels within the village of Bushnell.
30 Dix: commercial parcels within the village of Dix.
80 Rural: all commercial parcels not within the above valuation groupings.
3. List and describe the approach(es) used to estimate the market value of commercial
properties.
All three approaches: cost, income and sales comparison.
3a. Describe the process used to determine the value of unique commercial properties.
The County contracted with Stanard Appraisal to perform unique industrial property appraisals—
such as Clean Harbors.
4. If the cost approach is used, does the County develop the depreciation study(ies) based on
local market information or does the county use the tables provided by the CAMA vendor?
The county utilized the local market information.
5. Are individual depreciation tables developed for each valuation grouping?
No.
6. Describe the methodology used to determine the commercial lot values.
Commercial lot values appeared to be scattered--therefore they were put in a manageable order and
equalized.
7. Date of
Depreciation Tables
Valuation
Grouping
Date of
Costing
Date of
Lot Value Study
Date of
Last Inspection
10 2016 2016 2016 2016
20 2016 2016 2016 2016
30 2016 2016 2016 2016
80 2016 2016 2016 2016
53 Kimball Page 51
2017 Agricultural Assessment Survey for Kimball County
1. Valuation data collection done by:
Stanard Appraisal for all improvements.
List each market area, and describe the location and the specific characteristics that make
each unique.
2.
Year Land Use
Completed
Description of unique characteristicsMarket
Area
1 This area is in the southern portion of the County, and is bordered by the
State of Wyoming on the west and the State of Colorado on the south.
2011
2 This Market Area is located in the northern portion of the county. Banner
County borders this area to the north and Cheyenne County borders to the
east. This area has some of the better irrigated land within the County.
2011
CRP is updated annually by letters sent to taxpayers who currently have CRP contracts.
3. Describe the process used to determine and monitor market areas.
Sales within the agricultural areas are reviewed yearly to determine the need for any changes to
the areas’ geographic composition or other possible trends.
4. Describe the process used to identify rural residential land and recreational land in the
county apart from agricultural land.
Primary use of the land is used to distinguish both rural residential and recreational land from
agricultural land. Rural residential land (other than the home and first acre farm site) is valued by
market comparison with other similar parcels. Recreational use of land has not been seen within
the county at this time.
5. Do farm home sites carry the same value as rural residential home sites? If not, what are
the market differences?
Yes, they are valued the same.
6. If applicable, describe the process used to develop assessed values for parcels enrolled in
the Wetland Reserve Program.
There are currently no parcels enrolled in the Wetland Reserve Program.
If your county has special value applications, please answer the following
7a. How many special valuation applications are on file?
N/A
7b. What process was used to determine if non-agricultural influences exist in the county?
N/A
If your county recognizes a special value, please answer the following
7c. Describe the non-agricultural influences recognized within the county.
N/A
53 Kimball Page 52

7d. Where is the influenced area located within the county?
N/A
7e. Describe in detail how the special values were arrived at in the influenced area(s).
N/A
53 Kimball Page 53
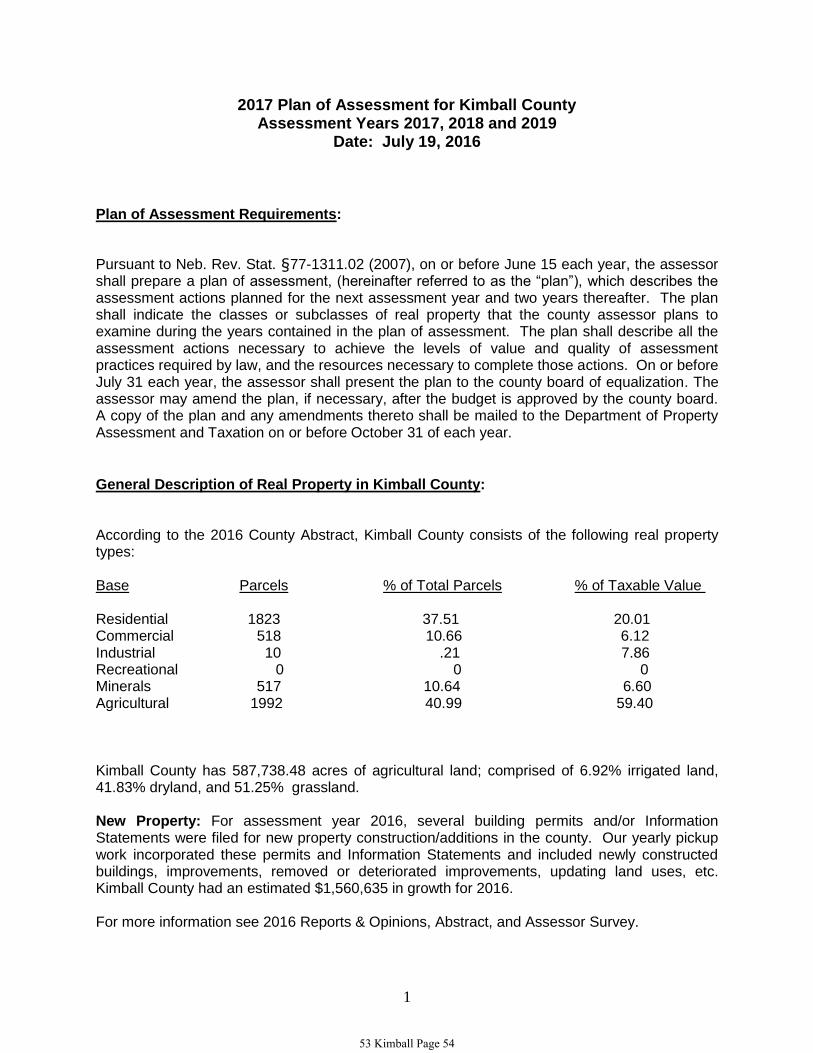
1
2017 Plan of Assessment for Kimball County Assessment Years 2017, 2018 and 2019
Date: July 19, 2016
Plan of Assessment Requirements:
Pursuant to Neb. Rev. Stat. §77-1311.02 (2007), on or before June 15 each year, the assessor shall prepare a plan of assessment, (hereinafter referred to as the “plan”), which describes the assessment actions planned for the next assessment year and two years thereafter. The plan shall indicate the classes or subclasses of real property that the county assessor plans to examine during the years contained in the plan of assessment. The plan shall describe all the assessment actions necessary to achieve the levels of value and quality of assessment practices required by law, and the resources necessary to complete those actions. On or before July 31 each year, the assessor shall present the plan to the county board of equalization. The assessor may amend the plan, if necessary, after the budget is approved by the county board. A copy of the plan and any amendments thereto shall be mailed to the Department of Property Assessment and Taxation on or before October 31 of each year.
General Description of Real Property in Kimball County: According to the 2016 County Abstract, Kimball County consists of the following real property types: Base Parcels % of Total Parcels % of Taxable Value Residential 1823 37.51 20.01 Commercial 518 10.66 6.12 Industrial 10 .21 7.86 Recreational 0 0 0 Minerals 517 10.64 6.60 Agricultural 1992 40.99 59.40 Kimball County has 587,738.48 acres of agricultural land; comprised of 6.92% irrigated land, 41.83% dryland, and 51.25% grassland. New Property: For assessment year 2016, several building permits and/or Information Statements were filed for new property construction/additions in the county. Our yearly pickup work incorporated these permits and Information Statements and included newly constructed buildings, improvements, removed or deteriorated improvements, updating land uses, etc. Kimball County had an estimated $1,560,635 in growth for 2016. For more information see 2016 Reports & Opinions, Abstract, and Assessor Survey.
53 Kimball Page 54

2
Current Resources: Staff: Deputy Assessor and three clerks.
Appraisal: Stanard Appraisal Service Inc. has been contracted to do the County-wide reappraisal for 2017.
Assessment Actions Planned for Assessment Year 2017: Residential Property: We are in the process of a County-wide reappraisal. Physical inspections will be made on all residential and rural residential properties. New pictures will be taken along with updated measurements and gathering of all property characteristics. Changes will be noted on the write-ups that are kept in the property record card. If the property owner is at home, data collectors will ask whether any changes have been made to the property and review the interior to determine the condition of the home. If the owner is not home a questionnaire will be left along with a follow-up visit scheduled. All data collected will be updated into the CAMA system. All residential homes will be organized by quality, era and condition to ensure that properties with similar characteristics are being rated similarly. An updated lot value study in Kimball will be completed to determine if value changes are necessary to equalize values and obtain uniformity. Once all of the data is compiled and correct, a new market study will be done. Also a current sales analysis study will be completed and an updated depreciation table will be developed. All of our residential houses will have new cost tables and depreciation applied to them for 2016. Necessary adjustments to valuation will be made once the review is completed. Pickup work will be continuing for this term. The Assessor’s office obtains building permits from the City of Kimball, gathers information from the local newspaper, and records observations concerning changes to real estate to identify potential pickup work. The property is visited as close to December 31st as possible. It is assigned a partial value for the amount of construction completed. Residential real estate sales will continue to be monitored for the median level. Ratio studies will be conducted for each class and subclass of property and adjusted as necessary to reflect market values. Sale questionnaires are sent out on every transfer to collect information concerning the sale. Commercial Property: We are in the process of a County-wide reappraisal. Physical inspections will be made on all commercial properties. New pictures will be taken along with updated measurements and gathering of all property characteristics. Changes will be noted on the write-ups that are kept in the property record card. If the property owner is at location, data collectors will ask whether any changes have been made to the property and review the interior to determine the condition of the property. If the owner is not at the location a questionnaire will be left along with a follow-up visit scheduled. All data collected will be updated into the CAMA system. All commercial will
53 Kimball Page 55
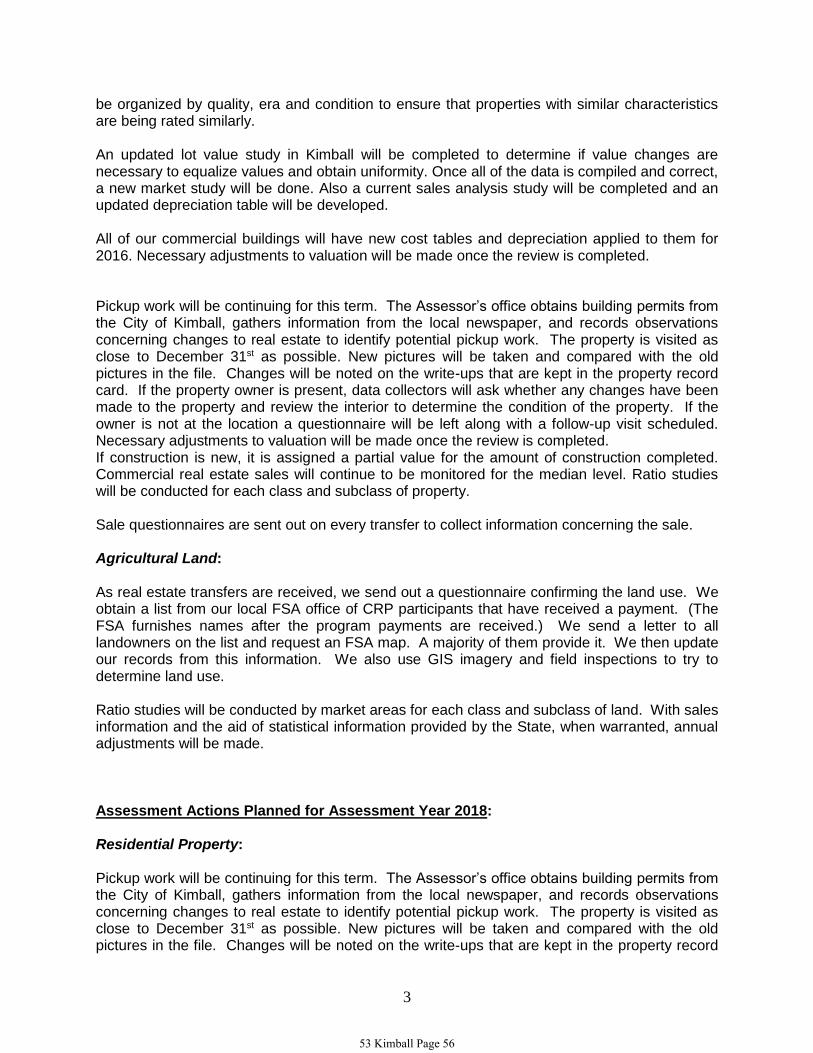
3
be organized by quality, era and condition to ensure that properties with similar characteristics are being rated similarly. An updated lot value study in Kimball will be completed to determine if value changes are necessary to equalize values and obtain uniformity. Once all of the data is compiled and correct, a new market study will be done. Also a current sales analysis study will be completed and an updated depreciation table will be developed. All of our commercial buildings will have new cost tables and depreciation applied to them for 2016. Necessary adjustments to valuation will be made once the review is completed. Pickup work will be continuing for this term. The Assessor’s office obtains building permits from the City of Kimball, gathers information from the local newspaper, and records observations concerning changes to real estate to identify potential pickup work. The property is visited as close to December 31st as possible. New pictures will be taken and compared with the old pictures in the file. Changes will be noted on the write-ups that are kept in the property record card. If the property owner is present, data collectors will ask whether any changes have been made to the property and review the interior to determine the condition of the property. If the owner is not at the location a questionnaire will be left along with a follow-up visit scheduled. Necessary adjustments to valuation will be made once the review is completed. If construction is new, it is assigned a partial value for the amount of construction completed. Commercial real estate sales will continue to be monitored for the median level. Ratio studies will be conducted for each class and subclass of property. Sale questionnaires are sent out on every transfer to collect information concerning the sale. Agricultural Land: As real estate transfers are received, we send out a questionnaire confirming the land use. We obtain a list from our local FSA office of CRP participants that have received a payment. (The FSA furnishes names after the program payments are received.) We send a letter to all landowners on the list and request an FSA map. A majority of them provide it. We then update our records from this information. We also use GIS imagery and field inspections to try to determine land use. Ratio studies will be conducted by market areas for each class and subclass of land. With sales information and the aid of statistical information provided by the State, when warranted, annual adjustments will be made. Assessment Actions Planned for Assessment Year 2018: Residential Property: Pickup work will be continuing for this term. The Assessor’s office obtains building permits from the City of Kimball, gathers information from the local newspaper, and records observations concerning changes to real estate to identify potential pickup work. The property is visited as close to December 31st as possible. New pictures will be taken and compared with the old pictures in the file. Changes will be noted on the write-ups that are kept in the property record
53 Kimball Page 56

4
card. If the property owner is at home, data collectors will ask whether any changes have been made to the property and review the interior to determine the condition of the home. If the owner is not home a questionnaire will be left along with a follow-up visit scheduled. Necessary adjustments to valuation will be made once the review is completed. If construction is new, it is assigned a partial value for the amount of construction completed. Residential real estate sales will continue to be monitored for the median level. Ratio studies will be conducted for each class and subclass of property and adjusted as necessary to reflect market values. Sale questionnaires are sent out on every transfer to collect information concerning the sale. Commercial Property: Pickup work will be continuing for this term. The Assessor’s office obtains building permits from the City of Kimball, gathers information from the local newspaper, and records observations concerning changes to real estate to identify potential pickup work. The property is visited as close to December 31st as possible. New pictures will be taken and compared with the old pictures in the file. Changes will be noted on the write-ups that are kept in the property record card. If the property owner is present, data collectors will ask whether any changes have been made to the property and review the interior to determine the condition of the property. If the owner is not at the location a questionnaire will be left along with a follow-up visit scheduled. Necessary adjustments to valuation will be made once the review is completed. If construction is new, it is assigned a partial value for the amount of construction completed. Commercial real estate sales will continue to be monitored for the median level. Ratio studies will be conducted for each class and subclass of property. Sale questionnaires are sent out on every transfer to collect information concerning the sale. Agricultural Land: A complete land use review will be completed. All agricultural land will be reviewed using GIS and current FSA maps to verify correct land use. Once verified, changes will be made as needed to maintain accuracy on all land usage. As real estate transfers are received, we send out a questionnaire confirming the land use. We obtain a list from our local FSA office of CRP participants that have received a payment. (The FSA furnishes names after the program payments are received.) We send a letter to all landowners on the list and request an FSA map. A majority of them provide it. We then update our records from this information. We also use GIS imagery and field inspections to try to determine land use. Ratio studies will be conducted by market areas for each class and subclass of land. With sales information and the aid of statistical information provided by the State, when warranted, annual adjustments will be made. Assessment Actions Planned for Assessment Year 2019:
53 Kimball Page 57
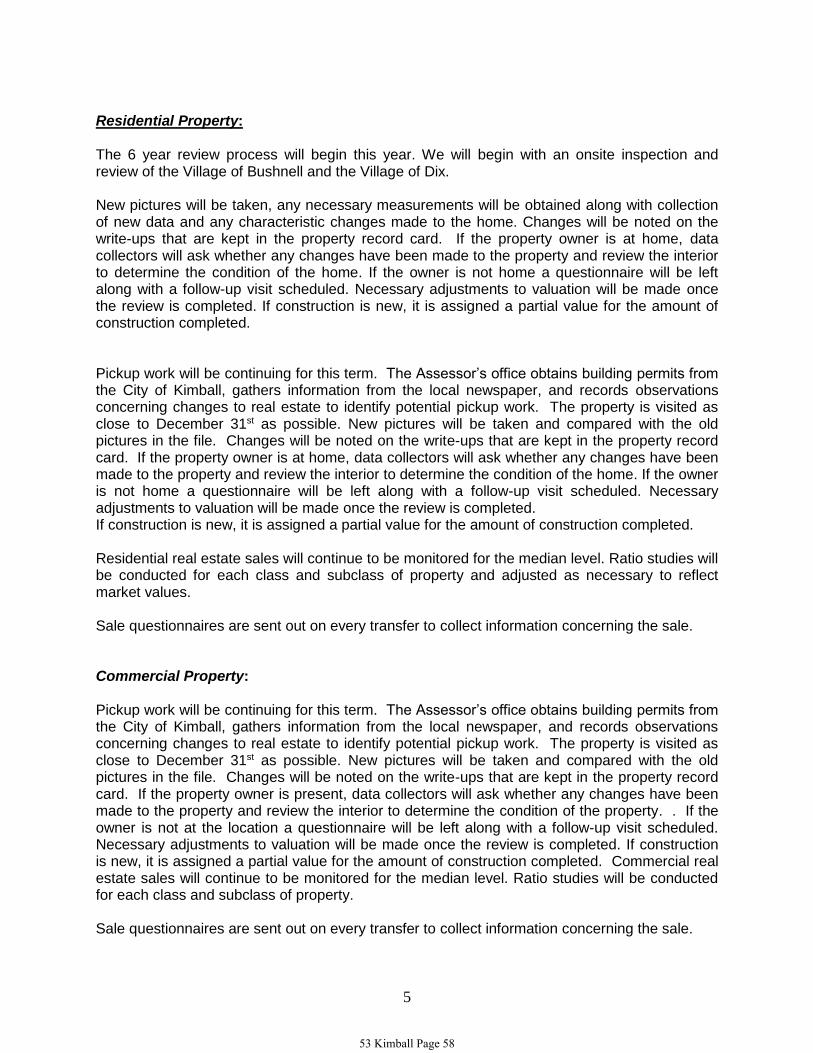
5
Residential Property: The 6 year review process will begin this year. We will begin with an onsite inspection and review of the Village of Bushnell and the Village of Dix. New pictures will be taken, any necessary measurements will be obtained along with collection of new data and any characteristic changes made to the home. Changes will be noted on the write-ups that are kept in the property record card. If the property owner is at home, data collectors will ask whether any changes have been made to the property and review the interior to determine the condition of the home. If the owner is not home a questionnaire will be left along with a follow-up visit scheduled. Necessary adjustments to valuation will be made once the review is completed. If construction is new, it is assigned a partial value for the amount of construction completed. Pickup work will be continuing for this term. The Assessor’s office obtains building permits from the City of Kimball, gathers information from the local newspaper, and records observations concerning changes to real estate to identify potential pickup work. The property is visited as close to December 31st as possible. New pictures will be taken and compared with the old pictures in the file. Changes will be noted on the write-ups that are kept in the property record card. If the property owner is at home, data collectors will ask whether any changes have been made to the property and review the interior to determine the condition of the home. If the owner is not home a questionnaire will be left along with a follow-up visit scheduled. Necessary adjustments to valuation will be made once the review is completed. If construction is new, it is assigned a partial value for the amount of construction completed. Residential real estate sales will continue to be monitored for the median level. Ratio studies will be conducted for each class and subclass of property and adjusted as necessary to reflect market values. Sale questionnaires are sent out on every transfer to collect information concerning the sale. Commercial Property: Pickup work will be continuing for this term. The Assessor’s office obtains building permits from the City of Kimball, gathers information from the local newspaper, and records observations concerning changes to real estate to identify potential pickup work. The property is visited as close to December 31st as possible. New pictures will be taken and compared with the old pictures in the file. Changes will be noted on the write-ups that are kept in the property record card. If the property owner is present, data collectors will ask whether any changes have been made to the property and review the interior to determine the condition of the property. . If the owner is not at the location a questionnaire will be left along with a follow-up visit scheduled. Necessary adjustments to valuation will be made once the review is completed. If construction is new, it is assigned a partial value for the amount of construction completed. Commercial real estate sales will continue to be monitored for the median level. Ratio studies will be conducted for each class and subclass of property. Sale questionnaires are sent out on every transfer to collect information concerning the sale.
53 Kimball Page 58

6
Agricultural Land: As real estate transfers are received, we send out a questionnaire confirming the land use. We obtain a list from our local FSA office of CRP participants that have received a payment. (The FSA furnishes names after the program payments are received.) We send a letter to all landowners on the list and request an FSA map. A majority of them provide it. We then update our records from this information. We also use GIS imagery and field inspections to try to determine land use. Ratio studies will be conducted by market areas for each class and subclass of land. With sales information and the aid of statistical information provided by the State, when warranted, annual adjustments will be made. Other functions performed by the assessor’s office including, but not limited to: 1. Personal Property: Assist taxpayers with preprinted schedules mailed to them and prepare new schedules when there are changes. Prepare notices of failure to file, penalties, unsigned returns, etc. as required. 2. Homestead Exemption Program: Assist applicants with forms. Send reminders or telephone previous year applicants that haven’t filed by June 15th. Process the applications before mailing to State. 3. Annually prepare and file administrative reports as required by law or regulation with the Property Tax Administrator including: Personal Property Abstract Real Property Abstract Annual Plan of Assessment Assessor Survey School District Taxable Value Report Average Residential Value for Homestead Exemption purposes Homestead Exemption Tax Loss Report Certificate of Taxes Levied Report 4. Permissive Exemptions: administer annual filings of applications for new or continued exempt use, review and make recommendations to the county board. 5. Annual review of government owned property not used for a public purpose and send notice of intent to tax. 6. Certify values to Political Subdivisions. 7. Record maintenance, mapping updates, and ownership changes. 8. On or before June 1st send Notices of Valuation Change to owners of record. 9. Centrally Assessed: review of valuations of entities as certified by PAD for railroad and public service entities. Establish assessment records for each subdivision taxed to each company and tax billing for tax list provided to the County Treasurer. 10. Tax Increment Financing: management of record/valuation information for properties in community redevelopment projects for proper reporting on administrative reports and allocation of ad valorem tax. Two parcels for each TIF property, one real estate card with the base value and one for the excess value of the property are maintained. 11. Tax Districts and Tax Rates – management of school district and other tax entity boundary changes necessary for correct assessment and tax information; input/review of tax rates used for tax billing process. 12. Tax Lists: prepare and certify tax lists to county treasurer for real property, personal property, and centrally assessed property.
53 Kimball Page 59
7
13. Tax List Corrections: prepare tax list correction documents for county board approval. 14. Annual Inventory: update report designating personal property of the assessor’s office by August 25th each year. 15. County Board of Equalization: attend all County Board of Equalization meetings. Assemble and provide information for valuation protests. 16. TERC Appeals – prepare information and attend taxpayer appeal hearings before TERC. 17. TERC Statewide Equalization – attend hearings if applicable to county, defend values and/or implement orders of the TERC. 18. Pull real estate cards, make copies, and answer questions in person, over the phone or through email. Among those we assist are appraisers, realtors, lending institutions, property owners, attorneys, surveyors, general public and other county offices. 19. Education: Assessor and Deputy Assessor must attend meetings, workshops and educational classes to obtain required hours of continuing education to maintain assessor certification. Conclusion: We strive to operate a well-organized, non-adversarial, congenial office that serves the public and educates them about the assessment process. Our aim is equalization and uniformity of valuation of all property in the county and completing the duties and responsibilities required of the assessor by Nebraska Statutes, Regulations and Directives. Respectfully submitted to the Kimball County Board of Equalization: Sherry Winstrom Kimball County Assessor August 16, 2016
53 Kimball Page 60