Embed Size (px)
Citation preview

2020 REPORTS AND OPINIONS
OF THE PROPERTY TAX ADMINISTRATOR
KEITH COUNTY

April 7, 2020 Commissioner Hotz: The Property Tax Administrator has compiled the 2020 Reports and Opinions of the Property Tax Administrator for Keith County pursuant to Neb. Rev. Stat. § 77-5027. This Report and Opinion will inform the Tax Equalization and Review Commission of the level of value and quality of assessment for real property in Keith County. The information contained within the County Reports of the Appendices was provided by the county assessor pursuant to Neb. Rev. Stat. § 77-1514.
For the Tax Commissioner Sincerely,
Ruth A. Sorensen Property Tax Administrator 402-471-5962 cc: Renae Zink, Keith County Assessor
51 Keith Page 2

Table of Contents
2020 Reports and Opinions of the Property Tax Administrator:
Certification to the Commission
Introduction
County Overview
Residential Correlation
Commercial Correlation
Agricultural Land Correlation
Property Tax Administrator’s Opinion
Appendices:
Commission Summary
Statistical Reports and Displays:
Residential Statistics
Commercial Statistics
Chart of Net Sales Compared to Commercial Assessed Value
Agricultural Land Statistics
Table-Average Value of Land Capability Groups
Special Valuation Statistics (if applicable)
Market Area Map
Valuation History Charts
County Reports:
County Abstract of Assessment for Real Property, Form 45
County Abstract of Assessment for Real Property Compared to the Prior Year
Certificate of Taxes Levied (CTL).
Assessor Survey
Three-Year Plan of Assessment
Special Value Methodology (if applicable)
Ad Hoc Reports Submitted by County (if applicable)
51 Keith Page 3

Introduction
Pursuant to Neb. Rev. Stat. § 77-5027 , annually, the Property Tax Administrator (PTA) shall prepare and deliver to each county assessor and to the Tax Equalization and Review Commission (Commission) the Reports and Opinions (R&O). The R&O contains statistical and narrative reports informing the Commission of the certified opinion of the PTA regarding the level of value and the quality of assessment of the classes and subclasses of real property in each county. In addition, the PTA may make nonbinding recommendations for class or subclass adjustments for consideration by the Commission.
The statistical and narrative reports in the R&O provide an analysis of the assessment process implemented by each county to reach the levels of value and quality of assessment required by Nebraska law. The PTA’s opinion of the level of value and quality of assessment in each county is a conclusion based upon all the data provided by the county assessor and information gathered by the Nebraska Department of Revenue, Property Assessment Division (Division) regarding the assessment activities in the county during the preceding year.
The statistical reports are developed using the statewide sales file that contains all transactions as required by Neb. Rev. Stat. § 77-1327. From this sales file, the Division prepares a statistical analysis comparing assessments to sale prices for arm’s-length sales (assessment sales ratio). After analyzing all available information to determine that the sales represent the class or subclass of real property being measured, inferences are drawn regarding the level of assessment and quality of assessment of that class or subclass of real property. The statistical reports contained in the R&O are developed based on standards developed by the International Association of Assessing Officers (IAAO).
The analysis of assessment practices in each county is necessary to give proper context to the statistical inferences from the assessment sales ratio studies and the overall quality of assessment in the county. The assessment practices are evaluated in the county to ensure professionally accepted mass appraisal methods are used and that those methods will generally produce uniform and proportionate valuations.
The PTA considers the statistical reports and the analysis of assessment practices when forming conclusions on both the level of value and quality of assessment. The consideration of both the statistical indicators and assessment processes used to develop valuations is necessary to accurately determine the level of value and quality of assessment. Assessment practices that produce a biased sales file will generally produce a biased statistical indicator, which, on its face, would otherwise appear to be valid. Likewise, statistics produced on small, unrepresentative, or otherwise unreliable samples, may indicate issues with assessment uniformity and assessment level—however, a detailed review of the practices and valuation models may suggest otherwise. For these reasons, the detail of the PTA’s analysis is presented and contained within the Residential, Commercial, and Agricultural land correlations of the R&O.
51 Keith Page 4

In 2019, Neb. Rev. Stat. § 77-1363 was amended with the passage of LB 372. The bill became operative on August 31, 2019 and specified that Land Capability Group (LCG) classifications must be based on land-use specific productivity data from the Natural Resources Conservation Service (NRCS). The Division used the NRCS data to develop a new LCG structure to comply with the statutory change. Each county received the updated land capability group changes and applied them to the inventory of land in the 2020 assessment year.
Statistical Analysis:
Before relying upon any calculated statistical measures to evaluate a county’s assessment performance, the Division must evaluate whether the statistical sample is both representative of the population and statistically reliable. A statistically sufficient reliable sample of sales is one in which the features of the sample contain information necessary to compute an estimate of the population. To determine whether the sample of sales is sufficient in size to evaluate the class of real property, measures of reliability are considered, such as the coefficient of dispersion (COD) or the width of the confidence interval. Generally, the broader the qualitative measures, the more sales will be needed to have reliability in the ratio study. A representative sample is a group of sales from a larger population of parcels, such that statistical indicators calculated from the sample can be expected to reflect the characteristics of the sold and unsold population being studied. The accuracy of statistics as estimators of the population depends on the degree to which the sample represents the population. Since multiple factors affect whether a sample is statistically sufficient, reliable, and representative, single test thresholds cannot be used to make determinations regarding sample reliability or representativeness.
For the analysis in determining a point estimate of the level of value, the PTA considers three measures as indicators of the central tendency of assessment: the median ratio, weighted mean ratio, and mean ratio. The use and reliability of each measure is based on inherent strengths and weaknesses which are the quantity and quality of the information from which it was calculated and the defined scope of the analysis.
The median ratio is considered the most appropriate statistical measure to determine a level of value for direct equalization, which is the process of adjusting the values of classes or subclasses of property in response to an unacceptable required level of value. Since the median ratio is considered neutral in relationship to either assessed value or selling price, adjusting the class or subclass of properties based upon the median measure will not change the relationships between assessed value and level of value already present in the class of property. Additionally, the median ratio is less influenced by the presence of extreme ratios, commonly called outliers, which can skew the outcome in the other measures.
The weighted mean ratio best reflects a comparison of the fully assessable valuation of a jurisdiction, by measuring the total assessed value against the total of selling prices. The weighted mean ratio can be heavily influenced by sales of large-dollar property with extreme ratios.
51 Keith Page 5

The mean ratio is used as a basis for other statistical calculations, such as the Price Related Differential (PRD) and Coefficient of Variation (COV). As a simple average of the ratios, the mean ratio has limited application in the analysis of the level of value because it assumes a normal distribution of the data set around the mean ratio with each ratio having the same impact on the calculation regardless of the assessed value or the selling price.
The quality of assessment relies in part on statistical indicators as well. If the weighted mean ratio, because of its dollar-weighting feature, is significantly different from the mean ratio, it may be an indication of disproportionate assessments. Assessments are disproportionate when properties within a class are assessed at noticeably different levels of market value. The coefficient produced by this calculation is referred to as the PRD and measures the assessment level of lower-priced properties relative to the assessment level of higher-priced properties.
The Coefficient of Dispersion (COD) is a measure also used in the evaluation of assessment quality. The COD measures the average absolute deviation calculated about the median and is expressed as a percentage of the median. A COD of 15% indicates that half of the assessment ratios are expected to fall within 15% of the median. The closer the ratios are grouped around the median the more equitable the property assessments tend to be.
The confidence interval is another measure used to evaluate the reliability of the statistical indicators. The Division primarily relies upon the median confidence interval, although the mean and weighted mean confidence intervals are calculated as well. While there are no formal standards regarding the acceptable width of such measure, the range established is often useful in determining the range in which the true level of value is expected to exist. Pursuant to Neb. Rev. Stat. §77-5023, the acceptable range is 69% to 75% of actual value for agricultural land and 92% to 100% for all other classes of real property.
Nebraska law does not provide for a range of acceptability for the COD or PRD; however, the IAAO Standard on Ratio Studies establishes the following range of acceptability for the COD:
A COD under 5% indicates that the properties in the sample are either unusually homogenous, or possibly indicative of a non-representative sample due to the selective reappraisal of sold parcels. The reliability of the COD can be directly affected by extreme ratios.
The PRD range stated in IAAO standards is 98% to 103%. A perfect match in assessment level
51 Keith Page 6

between the low-dollar properties and high-dollar properties indicates a PRD of 100%. The reason for the extended range on the high end is IAAO’s recognition of the inherent bias in assessment. The IAAO Standard on Ratio Studies notes that the PRD is sensitive to sales with higher prices even if the ratio on higher priced sales do not appear unusual relative to other sales, and that small samples, samples with high dispersion, or extreme ratios may not provide an accurate indication of assessment regressivity or progressivity, appraisal biases that occur when high-value properties are appraised higher or lower than low-value properties in relation to market values. Analysis of Assessment Practices:
The Division reviews assessment practices that ultimately affect the valuation of real property in each county. This review is done to ensure the reliability of the statistical analysis and to ensure professionally accepted mass appraisal methods are used to establish uniform and proportionate valuations. The review of assessment practices is based on information provided by the county assessors in Assessment Surveys and Assessed Value Updates (AVU), along with observed assessment practices in the county.
To ensure county assessors are submitting all Real Estate Transfer Statements, required for the development of the state sales file pursuant to Neb. Rev. Stat. §77-1327, a random sample from the county registers of deeds’ records is audited to confirm that the required sales have been submitted and reflect accurate information. The timeliness of the submission is also reviewed to ensure the sales file allows analysis of up-to-date information. The sales verification and qualification procedures used by the county assessors are reviewed to ensure that sales are properly considered arm’s-length transactions unless determined to be otherwise through the verification process. Proper sales verification practices ensure the statistical analysis is based on an unbiased sample of sales.
Valuation groups and market areas are also examined to identify whether the groups and areas being measured truly represent economic areas within the county. The measurement of economic areas is the method by which the PTA ensures intra-county equalization exists. The progress of the county’s six-year inspection and review cycle is documented to ensure compliance with Neb. Rev. Stat. § 77-1311.03 and also to confirm that all property is being uniformly listed and described for valuation purposes.
Valuation methodologies developed by the county assessor are reviewed for both appraisal logic and to ensure compliance with professionally accepted mass appraisal methods. Methods and sales used to develop lot values, agricultural outbuildings, and agricultural site values are also reviewed to ensure the land component of the valuation process is based on the local market and economic area.
Compliance with statutory reporting requirements is also a component of the assessment practices review. Late, incomplete, or excessive errors in statutory reports can be problematic for property owners, county officials, the Division, the Commission, and others. The late, incomplete, or excessive errors in statutory reporting highlights potential issues in other areas of the assessment process. Public trust in the assessment process demands transparency, and assessment practices
51 Keith Page 7

are reviewed to ensure taxpayers are served with such transparency.
Comprehensive review of assessment practices in each county is conducted throughout the year. When practical, potential issues are identified they are presented to the county assessor for clarification and correction, if necessary. The county assessor can then work to implement corrective measures prior to establishing assessed values. The PTA’s conclusion that assessment quality is either compliant or not compliant with professionally accepted mass appraisal methods is based on the totality of the assessment practices in the county.
Reviews of the timeliness of submission of sales information, equalization of sold/unsold properties in the county, the accuracy of the AVU data, and the compliance with statutory reports, are completed annually for each county. If there are inconsistencies or concerns about any of these reviews, those inconsistencies or concerns are addressed in the Correlation Section of the R&O for the subject real property, for the applicable county, along with any applicable corrective measures taken by the county assessor to address the inconsistencies or concerns and the results of those corrective measures.
*Further information may be found in Exhibit 94
51 Keith Page 8

County Overview With a total area of 1,062 square miles, Keith County had 8,021 residents, per the Census Bureau Quick Facts for 2018, a 4% population decline from the 2010 U.S. Census. Reports indicated that 71% of county residents were homeowners and 81% of residents occupied the same residence as in the prior year (Census Quick Facts). The average home value is $118,071 (2019 Average Residential Value, Neb. Rev. Stat. § 77-3506.02).
The majority of the commercial properties in Keith County are located in and around Ogallala, the county seat. According to the U.S. Census Bureau, there were 344 employer establishments with total employment of 2,640.
Agricultural land contributes to approximately 53% of the county’s overall valuation base. Grassland makes up the majority of the land in the county. Keith County is included in the Twin Platte Natural Resources District.
A recreational attraction in Keith County is Lake McConaughy. It is Nebraska’s largest lake and the largest reservoir in a three state region. The Lake is 20 miles long, 4 miles wide and 142 feet deep at the dam. It is located on the edge of the Nebraska Sand Hills and offers natural white sand beaches, excellent fishing, boating, camping and all types of outdoor recreation.
2009 2019 ChangeBRULE 372 326 -12.4%OGALLALA 5,142 4,737 -7.9%PAXTON 614 523 -14.8%
CITY POPULATION CHANGENE Dept. of Revenue, Research Division 2020
RESIDENTIAL39%
COMMERCIAL9%
OTHER2%
IRRIGATED28%
DRYLAND8%
GRASSLAND13%WASTELAND
0%
AGLAND-OTHER
1%
AG50%
County Value Breakdown
2019 Certificate of Taxes Levied
51 Keith Page 9

2020 Residential Correlation for Keith County Assessment Actions
For the residential class, the county assessor’s staff physically inspected parcels around Lake McConaughy. Following inspection, new land models and depreciation tables were created with 2019 costing based on neighborhoods around the lake. A detailed methodology can be found in the county assessor’s office.
A market analysis indicated that several valuation groups were under assessed. The adjustments made to Ogallala are as follows Neighborhoods 1100, 1200, 1300, 1301, and 1400 received a 10% increase to land and a 10% increase to the local cost factor, while Neighborhood 1500 was created for 2020 and encompasses the mobile home parks within Ogallala. The Village of Paxton received a 10% increase to the land tables and a 10% local factor to the costing. The Village of Brule, Keystone, Roscoe and Sarben’s land tables increased 25% along with a 25% factor to the costing. A 20% blanket adjustment was applied to the rural residential improvements while a 25% blanket adjustment was applied to the Ogallala suburban improvements.
All routine maintenance was completed in a timely manner.
Assessment Practice Review
As explained in the Introduction of this Report and Opinion, the review of the assessment practices to determine compliance and the review to ensure that all data submitted to the State sales file is timely and accurate, were completed.
Sales qualification and verification processes were discussed. The county assessor utilizes sales questionnaires to gain a better understanding of transactions. If questionnaires are not returned, the assessor will conduct follow-up conversations if there are any lingering questions about a transaction. Review of the qualified and non-qualified sales rosters show adequate comments for exclusion along with a comprehensive knowledge of the transactions. The usability rate for the residential class was similar to other counties statewide, supporting that all arm’s-length transactions were made available for measurement.
Valuation Groups were also evaluated to ensure that unique economic influences that could affect value were identified and adequately captured. The county assessor has identified six separate valuation groups for the residential class. Valuation Group 1 is the town of Ogallala, the county seat. The market in Ogallala is more stable than the other smaller towns. Valuation Group 2 and 3 are the villages of Paxton and Brule. The residential market in these towns is less stable than Ogallala but housing markets are more desirable here than in the smallest villages. Valuation Group 4 is comprised of all rural residential parcels outside of city limits; the market is strong here and continues to increase. Valuation Group 5 encompasses parcels surrounding Lake McConaughy. Due to the recreational influence, the economics are unique within this valuation
51 Keith Page 10

2020 Residential Correlation for Keith County group. Valuation Group 8 is the combination of the remaining smaller villages. The villages of Keystone, Roscoe, and Sarben have few amenities and an erratic residential market. Overall, the current stratification adequately identifies the differing economic forces within Keith County.
Another aspect of the review involves the examination of the frequency of the six-year inspection and review cycle. The county assessor’s staff completes the physical inspection for the residential class in-house. Keith County is currently in compliance with the six-year inspection and review cycle.
The final portion includes the review of the appraisal tables. For the residential class, the county assessor keeps the costing, depreciation and lot models current. The appraisal tables are normally updated along with the physical inspection. They are also updated if a market analysis indicates that a portion of the residential class is outside the acceptable range.
Description of Analysis
The residential class is divided into six separate market areas, with the majority of the sales occurring in the City of Ogallala.
Valuation Group Description 1 Ogallala 2 Paxton 3 Brule 4 Rural 5 Lake McConaughy 8 Keystone, Roscoe, Sarben
Review of the statistical sampling overall shows all three measures of central tendency are within the acceptable range. The qualitative statistics indicate general uniformity and equalization, however, PRD is slightly elevated above the parameters recommended by IAAO. When stratified by valuation groups, Valuation Groups 1, 4, and 5 all have medians within the acceptable range with adequate qualitative statistics. Although Valuation Group 2, 3 and 8 have acceptable medians the sample sizes are small with the widest ranges of dispersion amongst the valuation groups. Additional tests on the stability of the median were conducted. For Valuation Group 2, when one ratio on either side of the median is removed, the median is consistent and barely shifts, moving from 93-95%, supporting the use of the median for the valuation group. In Valuation Group 3, when the same test is conducted, the median swings widely from 92% to 104%, indicating that the median is not a reliable indication of the level of value for Valuation Group 3. Valuation Group 8 contains the smallest sample with just four sales with the ratios range from 50%-140%. There is no reliability of the median due to the small sample size and the dispersion between the ratios.
51 Keith Page 11

2020 Residential Correlation for Keith County Further analysis was completed to ensure that all of the residential class was keeping pace with the increasing residential market trends. Historical changes to value over the prior decade were compared to the changes of similar communities in the surrounding counties. The smaller villages appear to have changed 2-3% yearly, while Ogallala increased 4% annually. The valuation changes are similar to the changes saw in towns with like economics from the counties of Lincoln, Garden, Deuel and Perkins.
Review of the 2020 County Abstract of Assessment for Real Property, Form 45 Compared with the 2019 Certificate of Taxes Levied Report (CTL) shows the residential class increased approximately 17%, similar to the movement of the sales file sampling. Review of the individual valuation groups with an adequate number of sales show that the sample changed at a similar rate to the population as well. This supports that the valuation changes to the residential class were uniformly and proportionately applied to both the sold and unsold parcels.
Equalization and Quality of Assessment
The statistics along with acceptable assessment practices indicate that the assessment within the residential class are equalized. The quality of assessment of the residential class of real property complies with generally accepted mass appraisal techniques.
Level of Value
Based on analysis of all available information, the level of value for the residential property in Keith County is 97%.
51 Keith Page 12

2020 Commercial Correlation for Keith County Assessment Actions
For the commercial class, a market analysis was conducted. As a result, a 5% increase was applied to all land tables. For the commercial improvements, a 5% factor was applied to either the appraisal file values or the prior year’s values depending on the neighborhood. These actions resulted in overall changes of approximately 3-6%. Pick-up work was also conducted in a timely manner. A detailed description of the 2020 commercial valuation changes is available in the county assessor’s office.
Assessment Practice Review
As explained in the Introduction of this Report and Opinion, the review of the assessment practices to determine compliance and the review to ensure that all data submitted to the State sales file is timely and accurate, were completed.
Review of the valuation groups for the commercial class shows that Keith County has identified six valuation groups based on differing economics. Valuation Group 1 is the City of Ogallala. Ogallala is the county seat. Most sales occur within Valuation Group 1. The remainder of the valuation groups mimic the structure of the residential valuation groups.
The six-year inspection and review cycle was also discussed. All valuation groups were physically inspected with the help of a contract appraiser in 2018. The county assessor is in compliance with the six-year inspection and review cycle for the commercial class. Review of the currency of the appraisal tables indicate that the depreciation tables, costing and lot studies were updated in 2018 following the physical inspection work. The county conducts market analyses annually to keep pace with changes in the market.
Description of Analysis
Keith County has six valuation groups for the commercial class separated by economic factors. Most sales will occur in Valuation Group 1.
Valuation Group Description 1 Ogallala
2 Paxton
3 Brule
4 Rural
5 Lake McConaughy
8 Keystone, Roscoe, and Sarben
Review of the statistical sample shows 23 qualified sales within three valuation groups. Overall, two of the three measures of central tendency are within the acceptable range. The weighted mean
51 Keith Page 13

2020 Commercial Correlation for Keith County and PRD are adversely affected by one singular high dollar sale with a low ratio. Review of the sale shows this is an Arby’s franchise. Franchises can be difficult to capture all personal property, tangible or intangible. Hypothetically, if this one sale was removed from the sample, the PRD would fall to 106% and the weighted mean would be 91%. These statistics would still be outside the acceptable parameters; however, they more closely correlate to the other statistics, indicating general uniformity of the commercial class. Additional stratification into valuation groups would further minimize the sample sizes and would not be considered a useful analysis. Further analysis of the historical valuation changes over the past decade was conducted. Brule and Paxton both increased about 1-2% annually while Ogallala increase about 4% yearly. These increases (including growth) are consistent with the changes occurring in similar communities of the surrounding counties including Lincoln, Perkins, Deuel and Garden. This further supports that the commercial class has achieved an acceptable level of value. Reviewing the 2020 County Abstract of Assessment for Real Property, Form 45 Compared with the 2019 Certificate of Taxes Levied Report (CTL) shows an increase of 5% to the population, while the sample increased approximately 2%. The industrial class shows a large increase, however, the growth was accidently populated in the commercial instead of the industrial class. Overall, the sales and population moved in a relatively similar pattern.
Equalization and Quality of Assessment
A review of the assessment practices along with valuation changes suggest that commercial assessments within the county are valued within the acceptable parameters and therefore considered equalized. The quality of assessment of the commercial class of property complies with generally accepted mass appraisal techniques.
Level of Value
Although the median overall and the median of Valuation Group 1 is within the acceptable range, the sample size is still insufficient to be a reliable indication of the level of value. Based on analysis of all available information, the level of value for the commercial property in Keith County has achieved the statutory level of value of 100%
51 Keith Page 14

2020 Agricultural Correlation for Keith County Assessment Actions
For the 2020 assessment year, the county assessor completed the Land Capability Group (LCG) conversion in a timely manner. After the conversion, a market analysis was conducted. In Market Area 1, both irrigated and dryland values stayed the same while grass values decreased approximately 1% overall. For Market Area 2, irrigated land approximately decreased 3%, dryland 2%, and grassland 4%. Market Area 3 saw the largest decreases where irrigated land decreased 5%, dryland 6%, and grassland 5%. As a result of the above actions, countywide the irrigated subclass decreased approximately 5%, dryland 4%, and the grassland less than 1%.
For agricultural improvements, a 20% blanket adjustment was applied to equalize with the changes made to the rural residential subclass.
Assessment Practice Review
As explained in the Introduction of this Report and Opinion, the review of the assessment practices to determine compliance and the review to ensure that all data submitted to the State sales file is timely and accurate, were completed.
Agricultural market areas were evaluated to ensure that geographical and topographical differences that affect market values are adequately defined. Keith County recognizes three distinct market areas for agricultural land. Market Area 1 is the northern region of the county and is part of the Nebraska Sandhills Ecosystem. Grazing is the most productive use of Market Area 1 where the makeup of the land is mainly native grass covered sand dunes. Market Area 1 is most comparable to counties within the Sandhills including Garden, Arthur, McPherson, and Lincoln Market Area 2. Market Area 2 is located in between the North Platte River and the South Platte River, The land is comprised of 60% hard grass, approximately 32% dryland and 6% irrigated. Counties along the river are the most comparable to Market Area 2 this includes Lincoln County Market Area 1 and Deuel County. Market Area 3 is the most southern market area. Here cropland represents the majority of the land use with only approximately 20% of the area used for grassland. The surrounding counties of Perkins, Lincoln Market Area 3 and portions of Lincoln Market Area 1 are comparable.
The six-year inspection and review cycle was also discussed. The agricultural improvements were physically reviewed in conjunction with the rural residential review. This was last completed in 2019 in-house by the county assessor’s staff. Land use is also reviewed using aerial imagery and Farm Credit Services (FSA) maps. The county assessor’s staff is currently in the process of reviewing and correcting land use. Currency of appraisal tables were also inspected. Agricultural homes and outbuildings are valued using the same appraisal methods as the rural residential parcel. The depreciation models and costing tables are current as of 2018. Additionally, the county
51 Keith Page 15

2020 Agricultural Correlation for Keith County assessor conducts market analyses annually for improvements and land values, adjusting when needed to achieve an acceptable level of market value.
Description of Analysis
The statistical sample overall showcases 33 qualified sales dispersed between all three market areas. All three measures of central tendency are with the acceptable range. When stratified by valuation group, only Valuation Group 3 has a sufficient number of sales to use the median as an accurate measure of the level of value. Although Valuation Groups 1 and 2 lack an adequate number of sales both valuation groups have medians within the range.
When broke down into 80% Majority Land Use (MLU), the irrigated land subclass is the only subclass with enough sales for review. The median is within the range for the irrigated subclass 80% MLU with all sales occurring in Market Area 3. Although the 80% MLU dryland and grassland lack sales for a true representation of market value, both have medians within the acceptable range as well.
Comparison of values set by the county assessor versus the surrounding comparable counties’ values was conducted. The agricultural land values for all three market areas and three subclasses blended cohesively with the neighboring counties, support that an acceptable level of market values has been achieved in Keith County.
Equalization and Quality of Assessment
Although when separated into market areas and 80% MLU and the samples become inadequate to pinpoint the level of value, the overall statistics along with the assessment practice review and comparison to neighboring counties indicate that values set for the agricultural class are equalized inter and intra county. Additionally agricultural improvements have been valued using the same appraisal practices as the rural residential, which has been measured within at an acceptable level; therefore, agricultural improvements are believed to be at a sufficient portion of market value. Based on the review of all available information, the quality of assessment for the agricultural class complies with generally accepted mass appraisal techniques.
Level of Value
Based on analysis of all available information, the level of value of agricultural land in Keith County is 72%.
51 Keith Page 16
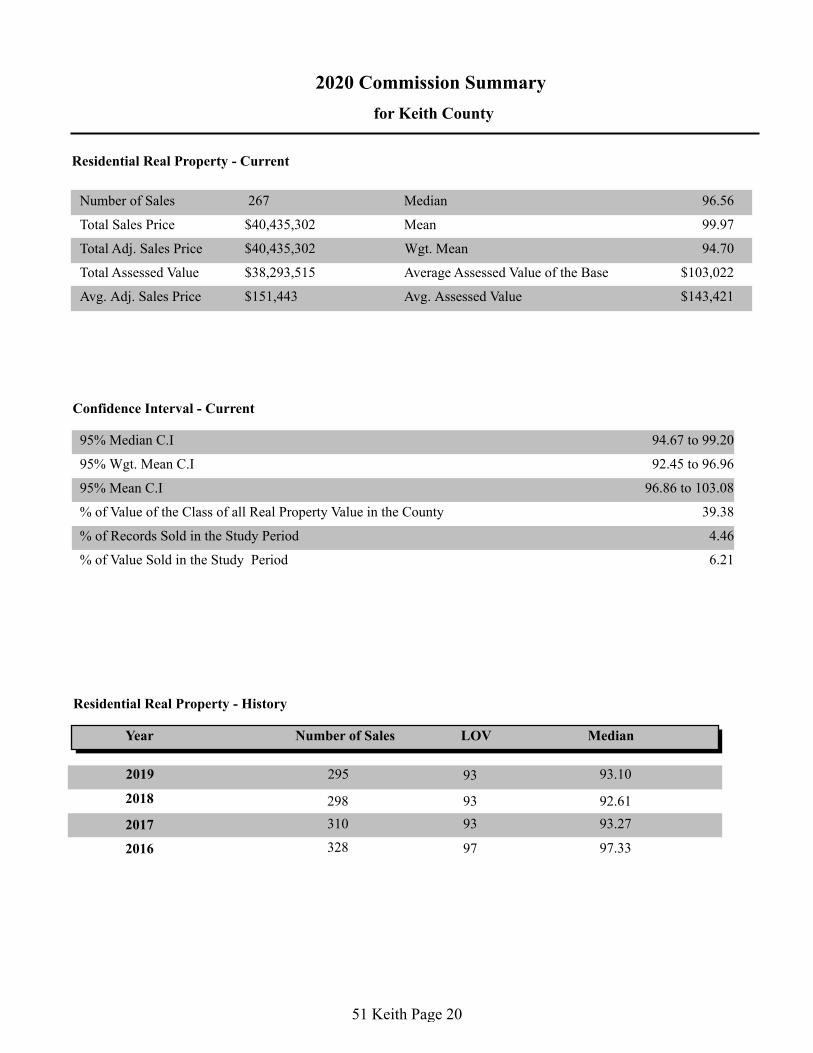
2020 Agricultural Correlation for Keith County Special Valuation
A review of agricultural land value in Keith County in areas that have other non-agricultural influences indicates that the assessed values used are similar to the values used in the portion of Market Area 2 where no non-agricultural influences exist. Therefore, it is the opinion of the Property Tax Administrator that the level of value for Special Valuation of agricultural land is 72%.
51 Keith Page 17

2020 Opinions of the Property Tax Administrator
for Keith County
My opinions and recommendations are stated as a conclusion based on all of the factors known to me
regarding the assessment practices and statistical analysis for this county. See, Neb. Rev. Stat. § 77-5027
(Reissue 2018). While the median assessment sales ratio from the Qualified Statistical Reports for each
class of real property is considered, my opinion of the level of value for a class of real property may be
determined from other evidence contained within these Reports and Opinions of the Property Tax
Administrator. My opinion of quality of assessment for a class of real property may be influenced by the
assessment practices of the county assessor.
Residential Real
Property
Commercial Real
Property
Agricultural Land
Class Level of Value Quality of Assessment
100
72
97
Meets generally accepted mass appraisal
techniques.
Meets generally accepted mass appraisal
techniques.
Meets generally accepted mass appraisal
techniques.
No recommendation.
No recommendation.
No recommendation.
Non-binding recommendation
Meets generally accepted mass appraisal
techniques.72 No recommendation.Special Valuation
of Agricultural
Land
**A level of value displayed as NEI (not enough information) represents a class of property with insufficient
information to determine a level of value.
Dated this 7th day of April, 2020.
Ruth A. Sorensen
Property Tax Administrator
51 Keith Page 18

Appendices
APPENDICES
51 Keith Page 19
2020 Commission Summary
for Keith County
Residential Real Property - Current
Number of Sales
Total Sales Price
Total Adj. Sales Price
Total Assessed Value
Avg. Adj. Sales Price Avg. Assessed Value
Median
Wgt. Mean
Mean
95% Median C.I
95% Wgt. Mean C.I
95% Mean C.I
94.67 to 99.20
92.45 to 96.96
96.86 to 103.08
% of Value of the Class of all Real Property Value in the County
% of Records Sold in the Study Period
% of Value Sold in the Study Period
Average Assessed Value of the Base
39.38
4.46
6.21
$103,022
Residential Real Property - History
Year
2016
2017
Number of Sales LOV
Confidence Interval - Current
Median
267
99.97
96.56
94.70
$40,435,302
$40,435,302
$38,293,515
$151,443 $143,421
97.33 328 97
2018
93 93.27 310
93 92.61 298
295 93.10 932019
51 Keith Page 20
2020 Commission Summary
for Keith County
Commercial Real Property - Current
Number of Sales
Total Sales Price
Total Adj. Sales Price
Total Assessed Value
Avg. Adj. Sales Price Avg. Assessed Value
Median
Wgt. Mean
Mean
95% Median C.I
95% Wgt. Mean C.I
95% Mean C.I
% of Value of the Class of all Real Property Value in the County
% of Records Sold in the Study Period
% of Value Sold in the Study Period
Average Assessed Value of the Base
Commercial Real Property - History
Year
2016
Number of Sales LOV
23
82.84 to 102.73
37.33 to 103.47
81.86 to 104.42
8.86
3.25
2.63
$196,075
Confidence Interval - Current
Median
$5,187,820
$5,187,820
$3,652,195
$225,557 $158,791
93.14
94.08
70.40
42 96.61 97
2017 100 91.94 38
2018 98.75 47 0
2019 31 93.19 93
51 Keith Page 21

Number of Sales :
Total Sales Price :
Total Adj. Sales Price :
Total Assessed Value :
Avg. Adj. Sales Price :
Avg. Assessed Value :
MEDIAN :
WGT. MEAN :
MEAN :
COD :
PRD :
COV :
STD :
Avg. Abs. Dev :
MAX Sales Ratio :
MIN Sales Ratio :
95% Median C.I. :
95% Wgt. Mean C.I. :
95% Mean C.I. :
267
40,435,302
40,435,302
38,293,515
151,443
143,421
17.21
105.56
25.93
25.92
16.62
248.30
47.38
94.67 to 99.20
92.45 to 96.96
96.86 to 103.08
Printed:4/2/2020 12:39:54PM
Qualified
PAD 2020 R&O Statistics (Using 2020 Values)Keith51
Date Range: 10/1/2017 To 9/30/2019 Posted on: 1/31/2020
97
95
100
RESIDENTIAL
Page 1 of 2
Avg. Adj.
RANGE Assd. ValSale Price95%_Median_C.I.MAXMINPRDCODWGT.MEANMEANMEDIANCOUNT
Avg.DATE OF SALE *
_____Qrtrs_____
01-OCT-17 To 31-DEC-17 30 101.03 103.13 102.37 11.64 100.74 79.24 143.14 92.01 to 112.49 152,500 156,111
01-JAN-18 To 31-MAR-18 20 104.65 110.97 107.32 11.23 103.40 84.69 156.99 99.91 to 120.66 118,068 126,712
01-APR-18 To 30-JUN-18 49 97.06 96.96 93.56 15.08 103.63 57.57 158.39 91.42 to 100.73 170,047 159,096
01-JUL-18 To 30-SEP-18 30 96.28 106.70 98.96 22.81 107.82 50.11 172.68 90.40 to 108.71 125,557 124,246
01-OCT-18 To 31-DEC-18 29 94.80 96.20 92.06 13.38 104.50 62.67 139.90 85.14 to 104.21 162,213 149,335
01-JAN-19 To 31-MAR-19 30 99.49 102.40 97.69 16.55 104.82 59.57 157.55 92.19 to 108.05 147,250 143,853
01-APR-19 To 30-JUN-19 35 90.06 90.76 88.65 12.06 102.38 49.63 134.08 86.50 to 96.22 159,324 141,245
01-JUL-19 To 30-SEP-19 44 93.08 99.74 88.97 25.57 112.11 47.38 248.30 81.78 to 96.51 152,317 135,523
_____Study Yrs_____
01-OCT-17 To 30-SEP-18 129 100.33 102.83 98.45 15.59 104.45 50.11 172.68 95.79 to 102.87 147,561 145,276
01-OCT-18 To 30-SEP-19 138 94.74 97.30 91.37 17.89 106.49 47.38 248.30 90.23 to 96.78 155,072 141,688
_____Calendar Yrs_____
01-JAN-18 To 31-DEC-18 128 98.96 101.26 95.95 16.17 105.53 50.11 172.68 94.74 to 100.75 149,723 143,656
_____ALL_____ 267 96.56 99.97 94.70 17.21 105.56 47.38 248.30 94.67 to 99.20 151,443 143,421
Avg. Adj.
RANGE Assd. ValSale Price95%_Median_C.I.MAXMINPRDCODWGT.MEANMEANMEDIANCOUNT
Avg.VALUATION GROUP
1 175 97.44 101.89 95.63 18.49 106.55 57.57 248.30 93.63 to 100.18 128,188 122,590
2 8 93.87 101.12 95.27 14.25 106.14 83.05 137.09 83.05 to 137.09 73,250 69,786
3 7 97.06 101.61 104.62 21.00 97.12 61.42 136.94 61.42 to 136.94 59,500 62,248
4 18 93.89 94.52 92.23 11.79 102.48 49.63 158.39 88.27 to 99.20 243,949 225,003
5 55 97.19 95.64 93.44 12.73 102.35 47.38 143.14 94.92 to 100.33 218,857 204,492
8 4 95.32 95.08 96.04 34.93 99.00 50.11 139.55 N/A 142,925 137,265
_____ALL_____ 267 96.56 99.97 94.70 17.21 105.56 47.38 248.30 94.67 to 99.20 151,443 143,421
Avg. Adj.
RANGE Assd. ValSale Price95%_Median_C.I.MAXMINPRDCODWGT.MEANMEANMEDIANCOUNT
Avg.PROPERTY TYPE *
01 267 96.56 99.97 94.70 17.21 105.56 47.38 248.30 94.67 to 99.20 151,443 143,421
06 0 00.00 00.00 00.00 00.00 00.00 00.00 00.00 N/A 0 0
07 0 00.00 00.00 00.00 00.00 00.00 00.00 00.00 N/A 0 0
_____ALL_____ 267 96.56 99.97 94.70 17.21 105.56 47.38 248.30 94.67 to 99.20 151,443 143,421
51 Keith Page 22
Number of Sales :
Total Sales Price :
Total Adj. Sales Price :
Total Assessed Value :
Avg. Adj. Sales Price :
Avg. Assessed Value :
MEDIAN :
WGT. MEAN :
MEAN :
COD :
PRD :
COV :
STD :
Avg. Abs. Dev :
MAX Sales Ratio :
MIN Sales Ratio :
95% Median C.I. :
95% Wgt. Mean C.I. :
95% Mean C.I. :
267
40,435,302
40,435,302
38,293,515
151,443
143,421
17.21
105.56
25.93
25.92
16.62
248.30
47.38
94.67 to 99.20
92.45 to 96.96
96.86 to 103.08
Printed:4/2/2020 12:39:54PM
Qualified
PAD 2020 R&O Statistics (Using 2020 Values)Keith51
Date Range: 10/1/2017 To 9/30/2019 Posted on: 1/31/2020
97
95
100
RESIDENTIAL
Page 2 of 2
Avg. Adj.
RANGE Assd. ValSale Price95%_Median_C.I.MAXMINPRDCODWGT.MEANMEANMEDIANCOUNT
Avg.SALE PRICE *
_____Low $ Ranges_____
Less Than 5,000 0 00.00 00.00 00.00 00.00 00.00 00.00 00.00 N/A 0 0
Less Than 15,000 0 00.00 00.00 00.00 00.00 00.00 00.00 00.00 N/A 0 0
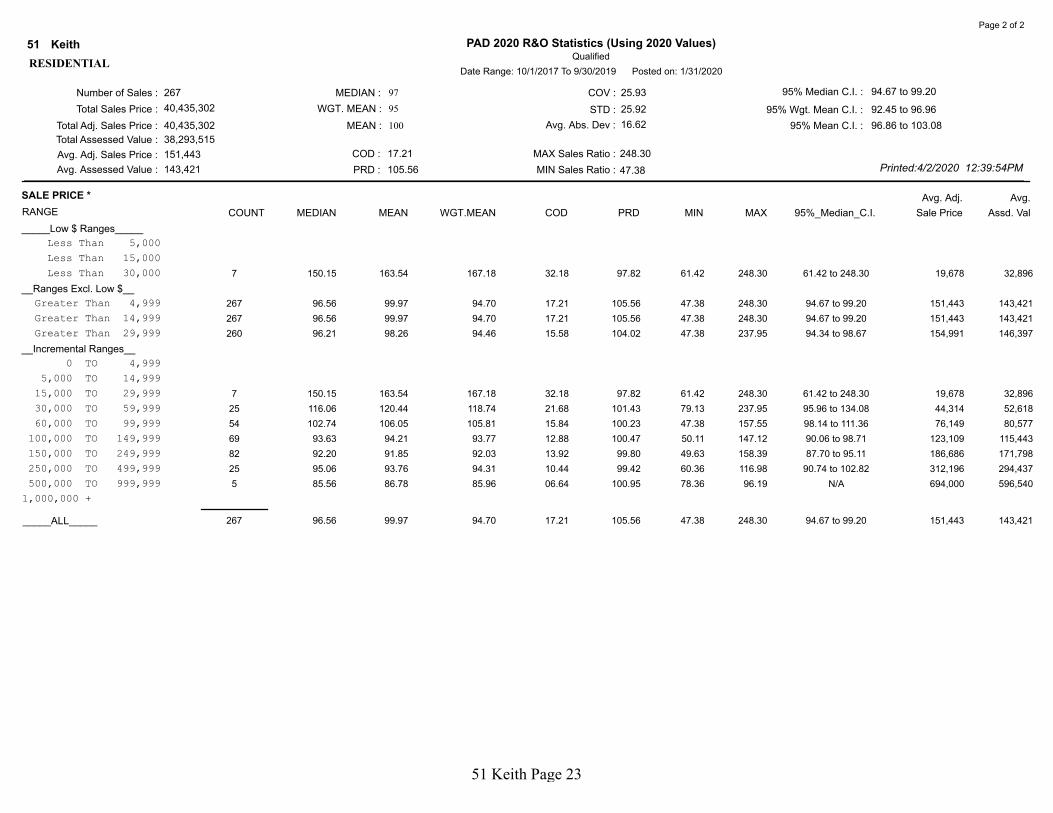
Less Than 30,000 7 150.15 163.54 167.18 32.18 97.82 61.42 248.30 61.42 to 248.30 19,678 32,896
__Ranges Excl. Low $__
Greater Than 4,999 267 96.56 99.97 94.70 17.21 105.56 47.38 248.30 94.67 to 99.20 151,443 143,421
Greater Than 14,999 267 96.56 99.97 94.70 17.21 105.56 47.38 248.30 94.67 to 99.20 151,443 143,421
Greater Than 29,999 260 96.21 98.26 94.46 15.58 104.02 47.38 237.95 94.34 to 98.67 154,991 146,397
__Incremental Ranges__
0 TO 4,999 0 00.00 00.00 00.00 00.00 00.00 00.00 00.00 N/A 0 0
5,000 TO 14,999 0 00.00 00.00 00.00 00.00 00.00 00.00 00.00 N/A 0 0
15,000 TO 29,999 7 150.15 163.54 167.18 32.18 97.82 61.42 248.30 61.42 to 248.30 19,678 32,896
30,000 TO 59,999 25 116.06 120.44 118.74 21.68 101.43 79.13 237.95 95.96 to 134.08 44,314 52,618
60,000 TO 99,999 54 102.74 106.05 105.81 15.84 100.23 47.38 157.55 98.14 to 111.36 76,149 80,577
100,000 TO 149,999 69 93.63 94.21 93.77 12.88 100.47 50.11 147.12 90.06 to 98.71 123,109 115,443
150,000 TO 249,999 82 92.20 91.85 92.03 13.92 99.80 49.63 158.39 87.70 to 95.11 186,686 171,798
250,000 TO 499,999 25 95.06 93.76 94.31 10.44 99.42 60.36 116.98 90.74 to 102.82 312,196 294,437
500,000 TO 999,999 5 85.56 86.78 85.96 06.64 100.95 78.36 96.19 N/A 694,000 596,540
1,000,000 + 0 00.00 00.00 00.00 00.00 00.00 00.00 00.00 N/A 0 0
_____ALL_____ 267 96.56 99.97 94.70 17.21 105.56 47.38 248.30 94.67 to 99.20 151,443 143,421
51 Keith Page 23

Number of Sales :
Total Sales Price :
Total Adj. Sales Price :
Total Assessed Value :
Avg. Adj. Sales Price :
Avg. Assessed Value :
MEDIAN :
WGT. MEAN :
MEAN :
COD :
PRD :
COV :
STD :
Avg. Abs. Dev :
MAX Sales Ratio :
MIN Sales Ratio :
95% Median C.I. :
95% Wgt. Mean C.I. :
95% Mean C.I. :
23
5,187,820
5,187,820
3,652,195
225,557
158,791
18.76
132.30
28.01
26.09
17.65
148.29
22.07
82.84 to 102.73
37.33 to 103.47
81.86 to 104.42
Printed:4/2/2020 12:39:55PM
Qualified
PAD 2020 R&O Statistics (Using 2020 Values)Keith51
Date Range: 10/1/2016 To 9/30/2019 Posted on: 1/31/2020
94
70
93
COMMERCIAL
Page 1 of 3
Avg. Adj.
RANGE Assd. ValSale Price95%_Median_C.I.MAXMINPRDCODWGT.MEANMEANMEDIANCOUNT
Avg.DATE OF SALE *
_____Qrtrs_____
01-OCT-16 To 31-DEC-16 3 95.42 98.06 88.91 10.79 110.29 83.94 114.83 N/A 189,775 168,732
01-JAN-17 To 31-MAR-17 3 82.84 88.35 84.43 09.36 104.64 79.47 102.73 N/A 123,326 104,125
01-APR-17 To 30-JUN-17 2 105.72 105.72 105.44 01.49 100.27 104.14 107.29 N/A 85,000 89,623
01-JUL-17 To 30-SEP-17 3 126.76 124.30 134.89 13.27 92.15 97.84 148.29 N/A 73,667 99,370
01-OCT-17 To 31-DEC-17 0 00.00 00.00 00.00 00.00 00.00 00.00 00.00 N/A 0 0
01-JAN-18 To 31-MAR-18 0 00.00 00.00 00.00 00.00 00.00 00.00 00.00 N/A 0 0
01-APR-18 To 30-JUN-18 0 00.00 00.00 00.00 00.00 00.00 00.00 00.00 N/A 0 0
01-JUL-18 To 30-SEP-18 3 82.05 84.24 80.63 06.90 104.48 76.84 93.83 N/A 141,667 114,232
01-OCT-18 To 31-DEC-18 0 00.00 00.00 00.00 00.00 00.00 00.00 00.00 N/A 0 0
01-JAN-19 To 31-MAR-19 2 70.46 70.46 54.03 29.48 130.41 49.69 91.23 N/A 167,500 90,498
01-APR-19 To 30-JUN-19 1 65.74 65.74 65.74 00.00 100.00 65.74 65.74 N/A 130,000 85,465
01-JUL-19 To 30-SEP-19 6 95.86 89.87 58.87 20.88 152.66 22.07 129.46 22.07 to 129.46 494,586 291,186
_____Study Yrs_____
01-OCT-16 To 30-SEP-17 11 102.73 103.96 97.42 14.32 106.71 79.47 148.29 82.84 to 126.76 120,937 117,811
01-OCT-17 To 30-SEP-18 3 82.05 84.24 80.63 06.90 104.48 76.84 93.83 N/A 141,667 114,232
01-OCT-18 To 30-SEP-19 9 93.38 82.87 58.66 23.21 141.27 22.07 129.46 49.69 to 102.57 381,391 223,731
_____Calendar Yrs_____
01-JAN-17 To 31-DEC-17 8 103.44 106.17 103.78 14.94 102.30 79.47 148.29 79.47 to 148.29 95,122 98,716
01-JAN-18 To 31-DEC-18 3 82.05 84.24 80.63 06.90 104.48 76.84 93.83 N/A 141,667 114,232
_____ALL_____ 23 94.08 93.14 70.40 18.76 132.30 22.07 148.29 82.84 to 102.73 225,557 158,791
Avg. Adj.
RANGE Assd. ValSale Price95%_Median_C.I.MAXMINPRDCODWGT.MEANMEANMEDIANCOUNT
Avg.VALUATION GROUP
1 17 95.42 97.12 69.54 18.90 139.66 22.07 148.29 82.05 to 114.83 245,117 170,457
2 4 78.49 76.13 58.65 23.46 129.80 49.69 97.84 N/A 120,250 70,529
5 2 93.26 93.26 87.49 09.99 106.60 83.94 102.57 N/A 269,913 236,158
_____ALL_____ 23 94.08 93.14 70.40 18.76 132.30 22.07 148.29 82.84 to 102.73 225,557 158,791
51 Keith Page 24

Number of Sales :
Total Sales Price :
Total Adj. Sales Price :
Total Assessed Value :
Avg. Adj. Sales Price :
Avg. Assessed Value :
MEDIAN :
WGT. MEAN :
MEAN :
COD :
PRD :
COV :
STD :
Avg. Abs. Dev :
MAX Sales Ratio :
MIN Sales Ratio :
95% Median C.I. :
95% Wgt. Mean C.I. :
95% Mean C.I. :
23
5,187,820
5,187,820
3,652,195
225,557
158,791
18.76
132.30
28.01
26.09
17.65
148.29
22.07
82.84 to 102.73
37.33 to 103.47
81.86 to 104.42
Printed:4/2/2020 12:39:55PM
Qualified
PAD 2020 R&O Statistics (Using 2020 Values)Keith51
Date Range: 10/1/2016 To 9/30/2019 Posted on: 1/31/2020
94
70
93
COMMERCIAL
Page 2 of 3
Avg. Adj.
RANGE Assd. ValSale Price95%_Median_C.I.MAXMINPRDCODWGT.MEANMEANMEDIANCOUNT
Avg.PROPERTY TYPE *
02 0 00.00 00.00 00.00 00.00 00.00 00.00 00.00 N/A 0 0
03 23 94.08 93.14 70.40 18.76 132.30 22.07 148.29 82.84 to 102.73 225,557 158,791
04 0 00.00 00.00 00.00 00.00 00.00 00.00 00.00 N/A 0 0
_____ALL_____ 23 94.08 93.14 70.40 18.76 132.30 22.07 148.29 82.84 to 102.73 225,557 158,791
Avg. Adj.
RANGE Assd. ValSale Price95%_Median_C.I.MAXMINPRDCODWGT.MEANMEANMEDIANCOUNT
Avg.SALE PRICE *
_____Low $ Ranges_____
Less Than 5,000 0 00.00 00.00 00.00 00.00 00.00 00.00 00.00 N/A 0 0
Less Than 15,000 0 00.00 00.00 00.00 00.00 00.00 00.00 00.00 N/A 0 0
Less Than 30,000 1 97.84 97.84 97.84 00.00 100.00 97.84 97.84 N/A 16,000 15,655
__Ranges Excl. Low $__
Greater Than 4,999 23 94.08 93.14 70.40 18.76 132.30 22.07 148.29 82.84 to 102.73 225,557 158,791
Greater Than 14,999 23 94.08 93.14 70.40 18.76 132.30 22.07 148.29 82.84 to 102.73 225,557 158,791
Greater Than 29,999 22 93.96 92.92 70.31 19.46 132.16 22.07 148.29 82.05 to 104.14 235,083 165,297
__Incremental Ranges__
0 TO 4,999 0 00.00 00.00 00.00 00.00 00.00 00.00 00.00 N/A 0 0
5,000 TO 14,999 0 00.00 00.00 00.00 00.00 00.00 00.00 00.00 N/A 0 0
15,000 TO 29,999 1 97.84 97.84 97.84 00.00 100.00 97.84 97.84 N/A 16,000 15,655
30,000 TO 59,999 1 91.23 91.23 91.23 00.00 100.00 91.23 91.23 N/A 35,000 31,930
60,000 TO 99,999 7 95.42 98.50 98.46 08.32 100.04 82.05 114.83 82.05 to 114.83 68,714 67,659
100,000 TO 149,999 6 103.36 105.06 103.33 20.65 101.67 65.74 148.29 65.74 to 148.29 107,413 110,986
150,000 TO 249,999 2 104.47 104.47 102.44 23.93 101.98 79.47 129.46 N/A 185,000 189,513
250,000 TO 499,999 4 80.39 77.03 78.88 17.12 97.65 49.69 97.64 N/A 350,456 276,438
500,000 TO 999,999 1 94.08 94.08 94.08 00.00 100.00 94.08 94.08 N/A 675,000 635,035
1,000,000 + 1 22.07 22.07 22.07 00.00 100.00 22.07 22.07 N/A 1,564,516 345,275
_____ALL_____ 23 94.08 93.14 70.40 18.76 132.30 22.07 148.29 82.84 to 102.73 225,557 158,791
51 Keith Page 25

Number of Sales :
Total Sales Price :
Total Adj. Sales Price :
Total Assessed Value :
Avg. Adj. Sales Price :
Avg. Assessed Value :
MEDIAN :
WGT. MEAN :
MEAN :
COD :
PRD :
COV :
STD :
Avg. Abs. Dev :
MAX Sales Ratio :
MIN Sales Ratio :
95% Median C.I. :
95% Wgt. Mean C.I. :
95% Mean C.I. :
23
5,187,820
5,187,820
3,652,195
225,557
158,791
18.76
132.30
28.01
26.09
17.65
148.29
22.07
82.84 to 102.73
37.33 to 103.47
81.86 to 104.42
Printed:4/2/2020 12:39:55PM
Qualified
PAD 2020 R&O Statistics (Using 2020 Values)Keith51
Date Range: 10/1/2016 To 9/30/2019 Posted on: 1/31/2020
94
70
93
COMMERCIAL
Page 3 of 3
Avg. Adj.
RANGE Assd. ValSale Price95%_Median_C.I.MAXMINPRDCODWGT.MEANMEANMEDIANCOUNT
Avg.OCCUPANCY CODE
151 1 79.47 79.47 79.47 00.00 100.00 79.47 79.47 N/A 200,000 158,935
304 1 83.94 83.94 83.94 00.00 100.00 83.94 83.94 N/A 436,825 366,665
306 1 148.29 148.29 148.29 00.00 100.00 148.29 148.29 N/A 105,000 155,700
341 1 93.38 93.38 93.38 00.00 100.00 93.38 93.38 N/A 75,000 70,035
344 3 102.73 102.11 91.63 16.20 111.44 76.84 126.76 N/A 149,500 136,993
349 1 22.07 22.07 22.07 00.00 100.00 22.07 22.07 N/A 1,564,516 345,275
350 1 97.64 97.64 97.64 00.00 100.00 97.64 97.64 N/A 380,000 371,030
352 1 94.08 94.08 94.08 00.00 100.00 94.08 94.08 N/A 675,000 635,035
353 2 82.45 82.45 82.54 00.49 99.89 82.05 82.84 N/A 85,740 70,768
384 1 129.46 129.46 129.46 00.00 100.00 129.46 129.46 N/A 170,000 220,090
386 2 78.49 78.49 60.59 36.69 129.54 49.69 107.29 N/A 185,000 112,085
406 1 93.83 93.83 93.83 00.00 100.00 93.83 93.83 N/A 75,000 70,375
442 2 109.49 109.49 108.45 04.89 100.96 104.14 114.83 N/A 83,750 90,825
466 1 102.57 102.57 102.57 00.00 100.00 102.57 102.57 N/A 103,000 105,650
471 1 97.84 97.84 97.84 00.00 100.00 97.84 97.84 N/A 16,000 15,655
472 1 91.23 91.23 91.23 00.00 100.00 91.23 91.23 N/A 35,000 31,930
528 2 80.58 80.58 75.63 18.42 106.55 65.74 95.42 N/A 97,500 73,743
_____ALL_____ 23 94.08 93.14 70.40 18.76 132.30 22.07 148.29 82.84 to 102.73 225,557 158,791
51 Keith Page 26

Tax Growth % Growth Value Ann.%chg Net Taxable % Chg Net
Year Value Value of Value Exclud. Growth w/o grwth Sales Value Tax. Sales
2008 88,199,275$ 942,580$ 87,256,695$ -- 90,672,173$ --
2009 86,791,150$ 634,975$ 0.73% 86,156,175$ -- 89,363,137$ --
2010 86,954,055$ 1,157,285$ 1.33% 85,796,770$ -1.15% 94,763,283$ 6.04%
2011 87,666,360$ 599,350$ 0.68% 87,067,010$ 0.13% 97,867,008$ 3.28%
2012 92,246,280$ 1,702,665$ 1.85% 90,543,615$ 3.28% 103,414,197$ 5.67%
2013 95,871,540$ 2,182,705$ 2.28% 93,688,835$ 1.56% 101,720,938$ -1.64%
2014 98,592,825$ 990,265$ 1.00% 97,602,560$ 1.81% 105,234,506$ 3.45%
2015 99,107,250$ 1,328,895$ 1.34% 97,778,355$ -0.83% 115,012,584$ 9.29%
2016 107,873,128$ 857,120$ 0.79% 107,016,008$ 7.98% 113,580,114$ -1.25%
2017 128,365,990$ 3,723,685$ 2.90% 124,642,305$ 15.55% 111,402,250$ -1.92%
2018 130,345,150$ 2,449,165$ 1.88% 127,895,985$ -0.37% 108,643,438$ -2.48%
2019 126,712,020$ 983,120$ 0.78% 125,728,900$ -3.54% 114,867,196$ 5.73%
Ann %chg 3.86% Average 2.44% 2.54% 2.62%
Tax Cmltv%chg Cmltv%chg Cmltv%chg County Number 51
Year w/o grwth Value Net Sales County Name Keith
2009 - - -
2010 -1.15% 0.19% 6.04%
2011 0.32% 1.01% 9.52%
2012 4.32% 6.29% 15.72%
2013 7.95% 10.46% 13.83%
2014 12.46% 13.60% 17.76%
2015 12.66% 14.19% 28.70%
2016 23.30% 24.29% 27.10%
2017 43.61% 47.90% 24.66%
2018 47.36% 50.18% 21.58%
2019 44.86% 46.00% 28.54%
Cumulative Change
-20%
-10%
0%
10%
20%
30%
40%
50%
60%
2009 2010 2011 2012 2013 2014 2015 2016 2017 2018 2019
Commercial & Industrial Value Change Vs. Net Taxable Sales Change
Comm.&Ind w/o Growth
Comm.&Ind. Value Chg
Net Tax. Sales Value Change
Linear (Comm.&Ind w/o Growth)
Linear (Net Tax. Sales ValueChange)
Sources:
Value; 2009-2019 CTL Report
Growth Value; 2009-2019 Abstract Rpt
Net Taxable Sales; Dept. of Revenue website.
51 Keith Page 27

Number of Sales :
Total Sales Price :
Total Adj. Sales Price :
Total Assessed Value :
Avg. Adj. Sales Price :
Avg. Assessed Value :
MEDIAN :
WGT. MEAN :
MEAN :
COD :
PRD :
COV :
STD :
Avg. Abs. Dev :
MAX Sales Ratio :
MIN Sales Ratio :
95% Median C.I. :
95% Wgt. Mean C.I. :
95% Mean C.I. :
33
18,759,003
18,759,003
13,863,480
568,455
420,105
12.96
101.64
16.04
12.05
09.29
101.97
47.96
69.21 to 81.83
69.95 to 77.86
71.00 to 79.22
Printed:4/2/2020 12:39:57PM
Qualified
PAD 2020 R&O Statistics (Using 2020 Values)Keith51
Date Range: 10/1/2016 To 9/30/2019 Posted on: 1/31/2020
72
74
75
AGRICULTURAL LAND
Page 1 of 2
Avg. Adj.
RANGE Assd. ValSale Price95%_Median_C.I.MAXMINPRDCODWGT.MEANMEANMEDIANCOUNT
Avg.DATE OF SALE *
_____Qrtrs_____
01-OCT-16 To 31-DEC-16 2 78.44 78.44 76.25 07.10 102.87 72.87 84.00 N/A 284,475 216,925
01-JAN-17 To 31-MAR-17 6 69.17 69.15 69.27 03.02 99.83 64.51 73.38 64.51 to 73.38 620,833 430,021
01-APR-17 To 30-JUN-17 2 67.10 67.10 66.29 03.20 101.22 64.95 69.24 N/A 232,500 154,128
01-JUL-17 To 30-SEP-17 0 00.00 00.00 00.00 00.00 00.00 00.00 00.00 N/A 0 0
01-OCT-17 To 31-DEC-17 2 80.76 80.76 75.83 11.27 106.50 71.66 89.85 N/A 337,500 255,940
01-JAN-18 To 31-MAR-18 6 78.21 72.29 75.18 13.34 96.16 47.96 88.06 47.96 to 88.06 316,217 237,742
01-APR-18 To 30-JUN-18 7 69.99 74.81 73.85 09.96 101.30 66.60 92.99 66.60 to 92.99 756,111 558,389
01-JUL-18 To 30-SEP-18 1 61.68 61.68 61.68 00.00 100.00 61.68 61.68 N/A 1,069,975 659,975
01-OCT-18 To 31-DEC-18 1 101.97 101.97 101.97 00.00 100.00 101.97 101.97 N/A 505,000 514,970
01-JAN-19 To 31-MAR-19 2 93.03 93.03 87.96 09.27 105.76 84.41 101.65 N/A 692,500 609,133
01-APR-19 To 30-JUN-19 4 77.59 76.03 72.47 12.24 104.91 62.56 86.38 N/A 793,750 575,248
01-JUL-19 To 30-SEP-19 0 00.00 00.00 00.00 00.00 00.00 00.00 00.00 N/A 0 0
_____Study Yrs_____
01-OCT-16 To 30-SEP-17 10 69.36 70.60 69.81 05.07 101.13 64.51 84.00 64.95 to 73.38 475,895 332,223
01-OCT-17 To 30-SEP-18 16 72.27 73.79 72.83 13.34 101.32 47.96 92.99 66.60 to 85.38 558,441 406,689
01-OCT-18 To 30-SEP-19 7 84.67 84.59 79.65 12.24 106.20 62.56 101.97 62.56 to 101.97 723,571 576,318
_____Calendar Yrs_____
01-JAN-17 To 31-DEC-17 10 69.36 71.06 69.89 05.75 101.67 64.51 89.85 64.95 to 73.38 486,500 340,026
01-JAN-18 To 31-DEC-18 15 72.88 74.74 74.27 15.11 100.63 47.96 101.97 66.60 to 85.38 584,337 434,008
_____ALL_____ 33 71.66 75.11 73.90 12.96 101.64 47.96 101.97 69.21 to 81.83 568,455 420,105
Avg. Adj.
RANGE Assd. ValSale Price95%_Median_C.I.MAXMINPRDCODWGT.MEANMEANMEDIANCOUNT
Avg.AREA (MARKET)
1 5 72.87 74.91 70.11 10.46 106.85 62.56 88.06 N/A 718,161 503,516
2 9 71.66 72.57 70.60 14.82 102.79 47.96 89.85 59.47 to 86.38 221,106 156,108
3 19 70.87 76.37 75.43 12.69 101.25 61.68 101.97 67.80 to 84.67 693,592 523,207
_____ALL_____ 33 71.66 75.11 73.90 12.96 101.64 47.96 101.97 69.21 to 81.83 568,455 420,105
51 Keith Page 28

Number of Sales :
Total Sales Price :
Total Adj. Sales Price :
Total Assessed Value :
Avg. Adj. Sales Price :
Avg. Assessed Value :
MEDIAN :
WGT. MEAN :
MEAN :
COD :
PRD :
COV :
STD :
Avg. Abs. Dev :
MAX Sales Ratio :
MIN Sales Ratio :
95% Median C.I. :
95% Wgt. Mean C.I. :
95% Mean C.I. :
33
18,759,003
18,759,003
13,863,480
568,455
420,105
12.96
101.64
16.04
12.05
09.29
101.97
47.96
69.21 to 81.83
69.95 to 77.86
71.00 to 79.22
Printed:4/2/2020 12:39:57PM
Qualified
PAD 2020 R&O Statistics (Using 2020 Values)Keith51
Date Range: 10/1/2016 To 9/30/2019 Posted on: 1/31/2020
72
74
75
AGRICULTURAL LAND
Page 2 of 2
Avg. Adj.
RANGE Assd. ValSale Price95%_Median_C.I.MAXMINPRDCODWGT.MEANMEANMEDIANCOUNT
Avg.95%MLU By Market Area
_____Irrigated_____
County 1 70.87 70.87 70.87 00.00 100.00 70.87 70.87 N/A 800,000 566,990
3 1 70.87 70.87 70.87 00.00 100.00 70.87 70.87 N/A 800,000 566,990
_____Dry_____
County 7 68.87 74.76 73.46 15.00 101.77 59.47 92.99 59.47 to 92.99 259,707 190,792
2 5 68.87 73.07 69.00 12.85 105.90 59.47 86.38 N/A 221,190 152,632
3 2 78.97 78.97 80.39 17.75 98.23 64.95 92.99 N/A 356,000 286,193
_____Grass_____
County 9 69.99 71.11 69.67 11.44 102.07 47.96 88.06 62.56 to 81.83 448,453 312,422
1 5 72.87 74.91 70.11 10.46 106.85 62.56 88.06 N/A 718,161 503,516
2 2 63.11 63.11 62.17 24.01 101.51 47.96 78.26 N/A 104,500 64,965
3 2 69.62 69.62 69.53 00.55 100.13 69.24 69.99 N/A 118,137 82,145
_____ALL_____ 33 71.66 75.11 73.90 12.96 101.64 47.96 101.97 69.21 to 81.83 568,455 420,105
Avg. Adj.
RANGE Assd. ValSale Price95%_Median_C.I.MAXMINPRDCODWGT.MEANMEANMEDIANCOUNT
Avg.80%MLU By Market Area
_____Irrigated_____
County 14 73.13 78.02 76.56 12.40 101.91 64.51 101.97 67.80 to 85.38 797,143 610,306
3 14 73.13 78.02 76.56 12.40 101.91 64.51 101.97 67.80 to 85.38 797,143 610,306
_____Dry_____
County 7 68.87 74.76 73.46 15.00 101.77 59.47 92.99 59.47 to 92.99 259,707 190,792
2 5 68.87 73.07 69.00 12.85 105.90 59.47 86.38 N/A 221,190 152,632
3 2 78.97 78.97 80.39 17.75 98.23 64.95 92.99 N/A 356,000 286,193
_____Grass_____
County 9 69.99 71.11 69.67 11.44 102.07 47.96 88.06 62.56 to 81.83 448,453 312,422
1 5 72.87 74.91 70.11 10.46 106.85 62.56 88.06 N/A 718,161 503,516
2 2 63.11 63.11 62.17 24.01 101.51 47.96 78.26 N/A 104,500 64,965
3 2 69.62 69.62 69.53 00.55 100.13 69.24 69.99 N/A 118,137 82,145
_____ALL_____ 33 71.66 75.11 73.90 12.96 101.64 47.96 101.97 69.21 to 81.83 568,455 420,105
51 Keith Page 29

2 3 4 5 6 7 8 9 10 11 12.00
Mkt
Area1A1 1A 2A1 2A 3A1 3A 4A1 4A
WEIGHTED
AVG IRR
1 n/a 2100 2100 2100 2100 2100 2100 2100 2100
1 2245 2245 n/a 2200 2200 2190 2190 2190 2208
1 n/a 2100 2100 2100 2100 2100 2100 2100 2100
1 n/a 2100 n/a 2100 2100 n/a 2100 2100 2100
2 2500 2485 2500 2483 2398 2403 2487 2479 2479
2 2750 2750 2750 2750 2650 2650 2650 2650 2732
1 3024 3018 2945 2844 2973 2678 2619 2309 2957
1 4398 4392 4173 4144 4023 3887 4013 3895 4240
3 3785 3785 3785 3610 3610 3610 3610 3610 3723
1 4398 4392 4173 4144 4023 3887 4013 3895 4240
3 3497 3499 3500 3497 3464 3418 3481 3456 3474
1 3624 3645 3066 3535 3493 3142 3415 3397 3551
1 13 14 15 16 17 18 19 20 21Mkt
Area1D1 1D 2D1 2D 3D1 3D 4D1 4D
WEIGHTED
AVG DRY
1 n/a 625 625 625 600 600 600 600 611
1 n/a 755 n/a 750 750 n/a 730 730 752
1 n/a n/a n/a n/a n/a n/a n/a n/a n/a
1 n/a 725 n/a 725 725 n/a n/a 725 725
2 0 1300 1300 1300 1300 1300 1300 1300 1300
2 n/a 905 n/a 905 875 876 875 875 900
1 n/a 700 696 597 597 n/a 506 497 659
1 1675 1675 1675 1675 1675 1675 1675 1675 1675
3 n/a 1350 1350 1265 1265 1260 1230 1230 1316
1 1675 1675 1675 1675 1675 1675 1675 1675 1675
3 0 1080 1080 1080 1080 1080 1080 1080 1080
1 n/a 975 975 910 910 n/a 855 855 942
22 23 24 25 26 27 28 29 30Mkt
Area1G1 1G 2G1 2G 3G1 3G 4G1 4G
WEIGHTED
AVG GRASS
1 495 495 n/a 450 450 450 450 450 451
1 415 n/a 418 415 410 410 405 405 409
1 407 407 407 407 407 407 n/a 407 407
1 450 450 450 450 450 450 450 450 450
2 495 495 495 495 495 480 480 473 491
2 500 n/a n/a 500 n/a 475 470 470 473
1 385 n/a 385 417 n/a 387 385 385 386
1 1025 1025 1025 1025 1025 1025 1025 1025 1025
3 525 n/a 500 500 n/a 500 480 480 495
1 1025 1025 1025 1025 1025 1025 1025 1025 1025
3 598 600 600 600 600 575 575 575 577
1 585 n/a n/a 585 n/a 585 585 585 585
32 33 31
Keith County 2020 Average Acre Value Comparison
Lincoln
Lincoln
Lincoln
Lincoln
County
Keith
Garden
Deuel
Keith
Keith
Lincoln
Lincoln
Garden
Arthur
McPherson
Lincoln
Keith
County
Keith
Garden
Arthur
McPherson
Deuel
County
Keith
Lincoln
Keith
Lincoln
Perkins
McPherson
Lincoln
Keith
Deuel
Arthur
Keith
Perkins
Perkins
Lincoln
Lincoln
51 Keith Page 30
Mkt
AreaCRP TIMBER WASTE
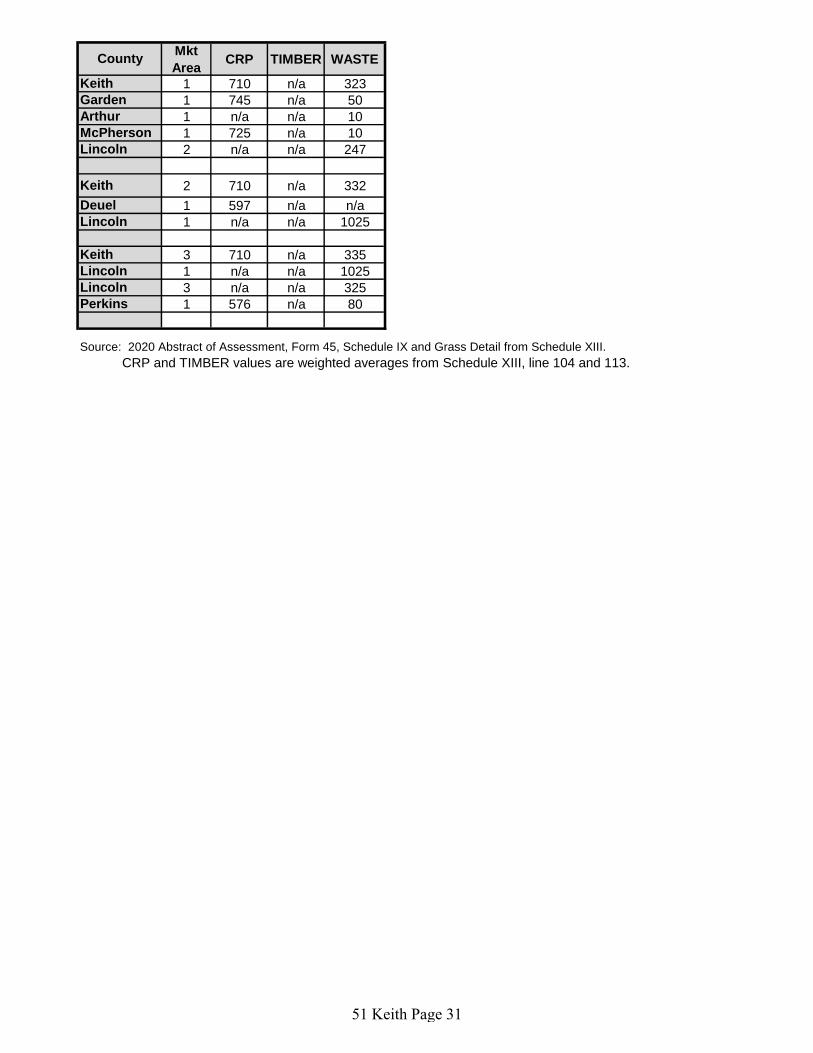
1 710 n/a 323
1 745 n/a 50
1 n/a n/a 10
1 725 n/a 10
2 n/a n/a 247
2 710 n/a 332
1 597 n/a n/a
1 n/a n/a 1025
3 710 n/a 335
1 n/a n/a 1025
3 n/a n/a 325
1 576 n/a 80
Source: 2020 Abstract of Assessment, Form 45, Schedule IX and Grass Detail from Schedule XIII.
CRP and TIMBER values are weighted averages from Schedule XIII, line 104 and 113.
Keith
Lincoln
Lincoln
Perkins
Lincoln
Keith
Deuel
Lincoln
County
Keith
Garden
Arthur
McPherson
51 Keith Page 31

k
kk
k
k
k
k
k
k
k
kk
k
k
k
kk
k
k
k
k
k
kk
k
k
k
k
k
k
k
k
k
k
k
k
k
k
k
k
k
k
kk
k
k
k
k
k
k
k
k
k
k
kk
k
k
k
k
k
k
kk
k
k
k
k
k
k
kkk
kk
k
k k
k
kk
k
k
k
k
k
kk
k
k
k
k
k
k
k
kk
k
k
k
kk
k
k
k
k
kk
k
k
k
k
k
k
k
k
k
k
k
k
k
k
k
k k
k
k
k
k
k
k
k
k
kk
k
k
k
kk
k
k
k
k
kk
k
k
k
k
kk
k
kk
k
k
k
k
kk k
k
k
kk
k
k
k
k
k
k
k
k
k
kk
k
k
k
k
k
k
k
k
k
k
k
k
k
k
k
k
k
k
k
k
k
k
k
k kk
k
k
k
k
kk
k
k
k
k
kk
k
k
kkk
k
k
k
k
k
k
kkkk
k
k
k
k
k
k
kk
k
k
k
kk
kk
k
k
k
k
k
k
k
k
k
k
k
k
k
k
k
k
k
k
k
k
k
k
k
k
k
k
k
k kk
kk
k
kk
k
k
kk
k
k
k k
k
k
k
k
k
kk
k
k
kk
k
k
kk
k
k
kk
k
k
k
k
k
k
k
k
k
k
kk
k
k
k
kkk
kk
k
k k
k
k
k
k
k
k
k
k
k
k
k
k
k
k
k
k
k
k
k
k k
k
k
k
k
k
k
k
k
k
k
k k
kk
k
k
k
k
k
k
k
k
k
k
k
k
k
k
k
k
k
k
k
k
k
k
k
kk
k
k
k
k
k
k
kk
k
k
kk
k
k
k
k
k
k
k
k
k
k
k
k
k
kk
k k
k
k
k
k
k
k
k
k
k
k
k
k
k
k
k
k
k
k
k
k
kk
kk
k
k
k
k
k
k
k
k
k
k
k
k
k
k
k
k
kk
k
k k
k
k
k
k
k
k
k
k
k
kk
k
k
k
k
k
k
k
k
k
k
k
k
k
k
k
k
k
k
k
k
k
k
k
k
k
k
k
k
k
k
k
k
k
k
k
k
k
k
k
k
k
k
k
k
k
k
k
k
k
k
k
k
k
k
k
k
k
k
k
k
k
k
k
k
k
k
k
k
k k
k
k
k
k
k
k
k
k
k
k
k
k
k
k
k
k
k
k
k
k
k
k
k
k
kk
k
k
k
k
k
k
k
k
k
k
kk
k
k
k
k
k k
k
k
k
k
k
k
k
k
k
k
k k
k
k
k
k
k
k
kk
k
k
k
k
k
k
k k
k
k
k
k
k
k
k
k
k
k
k
k
kk
k
k kk
k
k
k
k
k
k
k
k
k
k
k
k
k
k
k
k
k
k
k
k
k
k
k
k
k
k
k
k
k
k
k
k
k
k
k
k
k
k
k
k
k
k
k
k
k
k
k
k
k
k
k
k
k
k
k
k
k
k
k
k
k
k
kk
k
k
k
k
k
k
k
k
k k
k
k
k
k
k
k
k
k
k
k
k
k
k
k
k
k
k
k
k
k
k
k
k
k
k
k
k
k
k
k
k
k
k
kk
k
k
k k
k
k
k
k
k
k
k
k
k
k
k
k
k
k
k
k
k
k
k
kk
k
k
k
k
k
k
k
k
k
k
k
k
kk
k
k
k
k
k
k
k
k
k
kk
k
kkk
kk
k
k k
k
k
k k
k
k
k
k
k
k
k
k
k
k
k
k
k k
k
k
k
k
k
kk
k
k
k
k
k
k
k
k
kk
k
k
k
k
k
k
k
k
kk
k
k
k
k
k
k
k
k
k
k
k
k
kk
k k
k
k
k
k
k
k
k
k
k
k
k
k k
k
k
k
k
k
k
k
k
k
k
k
k
k
k
k
k
k
k
k
k
k
k
k
k
k
k
k
k k
k
k
k
k
k
kk
k
k
k
k
k
k
k
k
k
k
k
k
k
k
k
k
k
k
k
k
k
k
k
k
k
k
k
kk k
k
k
k
k
k
k
k
k
k
kk
k
k
k
k
k
k
k
k
k
k
k
k
k
k
k
k
k
k
k
k
kk
k k
kk
k
k
k
k
k
k
k
k k
k
k
k
k
k
k
k
k
k
k
k
k
k
k
k
k
k
k
k
kk
k k
k
k
k
k
k
k
k
k
k
k
k
k
k
k
k
k
k
k
k
k
k
k
k
k
k
k
k
k
k
k
k
k
k
k
k
k
k
k
k
k
k
k
k
k
k
k
k
k
k
k
k
k
k
k
k
kk
k
k
k
k
kk
k
k
k
k
kk
k
k
k
kk
k
k
k
kk
k
k
k
k
k
k
k
k
k
kk
k
k
k
k
k
k
k
k
k
k
k
k
k
k
k
k
k
k
k
k
k
k
kk
k
k
k
k
k
k
k
k
k
k
k k
k
k
kk
k
k
k
k
kk
k
k
k
k
k
k
k
k
k
k
k
k
k
k
k
k
k
k
k
k
k
k
k
k
k
k
k
k
k k
k
k
k
k
k
k
k
k
k
k
k
k
k
k
k
k k
k k
k
k
k
k
k
k
k
k
k
k
k
k
k
k
k
k k
k
k
k
k
k
k
k
k
k
k
k
k
k
k
k
k
k
k
k
k
k
kk
k
k
k
k
k
k
k
k
k
kk
k
k
k
k
k
k
kk
k
k
k
k
k
k
k
k
k
k
k
k
k
k
k
k
k
k
k
k
k
k
k
k
k
k
k
k
k
k
k
k
k
k
k
k
k
k
k
k
k
k k
k k
k
k
k
k k
k
k
k
k
k
k
k
k
k
k
k
k
k
k
k
k
k
k
k
k
k
k
k
k
k
k
k
k
k
k
k
k
k
k
k
k
k
k
k
k
k
k
k
k
k
k
k
k
k
k
k
k
k
k
k
k
k
k
k
k
k
k
k
k k
k
k
k
k
k k
k
k
k
k
k
k
k
k
k
k
k
k
k
k
k
k k
k
k
k
k
kk
k
k
k
k
k
k
k
k
k
k
k
k
k
k
k k
k
k
k
k
k
k
k
k
k
k
k
k
k
k
k
kk
k
k k
k
k
k
k
k
kkk
k
k k k
k
k
k
k
k
k
k
k
k
k
k
k
k
k
k
k
k
k
k
k
k
k
k
kk
k
k
k
k
k
kkk
kk
k
k
k
k
k
k
k
k
k
k
kk
kk
k
k
k
k
k
k
k
k
k
k
k
k k
k
k
k
k
k
k
kk
k
kk
k
k
k
k
k
k
k
k
k
k
k
k
k
k
k
k
k
k
k
k
kk
k
k
k
k
k
k
k
k
k
k
k
k
k k
k
k
k
k
k
k
k
k
k
k
k
k
k
k
k
kk
k
k
k
k
k
k
k
k
k
k
k
kk
k
k
k
k
k
k
kk
k
k
k
k
k k
k
k
k
k
k
k
k
k
k
k
kk
k
k
k
k
k
k
kk
k
k
k
k
k
k
k
k
k
k
k
k
k
k
kk
k
k
k
kk
k
k
k
k
k
k
k
k
k
k
k
k
k
k
k
kk
k
k
k
k
k
k
k
k
k
k
k
k
k
k
k
k
k
k
k
k
k
k
k
k
k
k
k
k
k
k
k
k
k
k k
k
k
k
k
k
k
k
k
k
k
k
k
k
k
k
k
k
k
k
k k
k
kk
k k
k
k
k
k
k
k
k
k
k
k
k
k
k
k
k
k
k
k
k k
k
k
k
k
k
k
k
k
k
k
kk
k
k
k
k
k
k
k
k
k
k
k
kk
k
k
k
k
k
k
k
k
k
k
k
k
k
k
k
k
k
k
kk
k k
k
k
k
k
k
k
k
k
k
kk
k
k
k
k
k
k
k
k
k
k
k
k
k
kk
k
k
k
k
k k
k
kk
k
k
k
k
k
k
k
k
k
k
k
k
k
kk
k
k
k
k
k
k
k
k
k
k
k
k
k
k
k
kk
k
k
k k
k
k
k
k
k
k
k
k
k
k
k kk
k
k
k
k
k
k
k
k
k
k
k
k
k
k
k
k
k
k
k
k
k
k
k
k
k
k
k
k
k
k
k k
k
k
kk
k
k
k
k
kk
k
k
k
k
k
k
k k
kk
k
k
k
k
k
k
k
k
k
k
k
k
k
k
k
kk
k
k
k
k
k
k k
k
k
k
k
k
k
k
k
k
k
k
k
k
k
k
k
k
k
k
k
k
k
k
k
k
k
k
k
k
k
k
k
k
k
k
k
k
k
k
k
k
k
k
kk
k
k
k
k
k
k
k
k
k
k
k
k
k
k
k
k
k
k
k
kk
k
k
k
k
k
k
k
k
k
k
k
k
k
k
k
k
k
k
k
k
k
k
k
k
k
k
k
k
k
k
k
k
kk
k
k
k
k
kk
k
k
k
k
k
k
k
k
k
k
kk
k
k
k
k
k
k
k
k
k
kk
k
k
k
k
k
k
k
k
k
k
k
k
k
k
k
kk
k
k
k
k
k
k
k k
k
k
k
k
k
k k
k
k
k
k
k
k
k
k
k
k
k
k
k
k k
k
k
k
k
k
k
k
k
k k
k
k
k
k
kk
k
k
k
k
k
k
k
k
k
k
k
k
k
k
k
k
k
k
k
k
kk
k
k
k
k
k
k
k
k
k
k
k
k
kk
k
k
k
k
k
k
k
k k
k
k
k
k
k
k k
kk
k
k
k
k
k
k k
k
k
k
k
kk
k
k k
kk
kk
k k
k
kk
k
k
k
k
k
k
k
k
k
k
k
k
k
k
k
k
k
k
k
k
k
k
k
k
k
k
k
k
k
k
k
k
k
k
k
k
k
k
k
k
k
k
k
k
k
k
k
k
k
k
k k
k
k
k
k
k
k
k
k
k
k
k
k
k
k
k
k
k
k
kk
k
k
kk
k
k
k
k
k
k
k
kk
k
k
k
k
k k
k
k
k
k
k
k
k
k
k
k
k
k
k
k
k
k
k
k
k
k
kk
k
k
k
kk
k
kk
k
k
kk
k
k
k
k
k
k
k
k
k
k
k
k
k
k
k
k
k
k
k
k
k
k
k
k
k
k
k
k
k
k
k
k
k kk
kk
k
k
k
k
k
k
k
k
k
kk
k
k
k
k
k
k
k
k
k
kk
k
k
k
k
k
k
k
k
k
k
k
k
k
k
k
k
k
k
k
k
k
k
k
k
k
k
k
k
k
k
k
k
k
k
k
k
k k
k
k
k
k
k
k
k
k
k
k
k
k
k
k
k k
k
k
k
k
k
k
k
k
k
k
k
k
k
k
k
k
k
k
k
k
k
k
k
k
kkk
k
k
k
k
k
k
k
kk
k
k
k
k
k
k
k
k
k
k
kk
k
k
k
k
k
k
k
k
k
k
k
k
k
k
k
k
k
k
k
k
k
k
k
k
k
k
k
k
k
k
k
k
k
k
k
kk
kk
k
k
k k k
k
k
k
k k
k
k
k
k
k
k
k
k
k
k
k
k
k
k
k
k
k
k
kk
k
k
k
k
k
k
k
k
k
k kk
k
k
k
k
k
k
kk
k
k
k
k
k
k
k k
kk
kk
k
k
kk
k
k
k
k
kkk
k
k
kkk
k
k
k
k
k
k
k
k
k
k
k
k
k
k
k
kk
k
k
k
k
k k
k
k
kkk
k
k
k
k
k
k
k
kk
k
k
k
k
k
k
k
k
k
k
k
k
k
k
k
k
kk
k
k
k
k
k
k
k
k
k
k
k
k
k
k
kk
k
k
k
k
k
k
k
k
kk
k
k
k
k
k
k
k
k
k
k
k
k
k
k
k
k
k
k
k
k
k
k
k
k
k
k
k
kk
kk
k
k
k
k
k
k
k
k
k
k
k
k
k
k
k
k
k
k
k
k
k
k
k
k
kk
k
k
k
k
k
k
k kk
kk
k
k
k
k
k
k
k
k
k
k
k
k
k
k
k
k
k
k
k
k
k
k
k
k
k
k
k
k
k
k
k
k
k
kk
k
k
k
k
k
k
k
k
k
k
k
k
k
k
k
kk
k
k
k
k
k
kk
k
k
k
k
k
k
k
k
k
k
k
k
k
k
k
k k
k
k
k
kk
k
k
k
k
k
k
k
k
k
k
k
k
k
k
k
k
k
k
k
k
k
k
k
k
k
k
k
k
k
k
k
k
k
k
k
k
k
k
kk
k
kk
k
k
k
k
k
kk
k
k
k
k
k
k
k
k
k
k
k
k
k
k
k
k
k
kk
k
k
k
k
k
k
k
k
k
k
k
k
k
k
k
k
k
k
k
k
k
k
k
Ogallala
Grant
Belmar
Big Springs
Brule
Lewellen
Madrid
Paxton
WallaceElsie
Keystone
LemoyneMartin
RoscoeSarben
2201 2199 2197 2195 2193 2191 2189 2187 2185 2183
2267 2269 2271 2273 2275 2277 2279 2281 2283 2285
2489 2487 2485 2483 2481 2479 2477 2475 2473 2471
2557 2559 2561 2563 2565 2567 2569 2571 25732575
2783 2781 2779 2777 2775 2773 2771 2769 27672765
2853 2855 28572859
2861 2863 2865 2867
2869
2871
3079 3077 3075 3073 3071 3069 3067 3065 30633061
3147 31493151 3153 3155 3157 3159 3161 3163 3165 3167
3373 33713369
33673365 3363 3361 3359
3357
3375 3377 3379 3381 33830
3385 3387 33893391
0 3597 3595 3593 3591 3589 3587 3585 3583 3581
GardenArthur McPherson
Keith Lincoln
Deuel
Perkins
51_1
51_3
3_1
68_1
51_2 56_4
KEITH COUNTY ´
LegendMarket_AreaCounty
k Registered_WellsDNRgeocodeFederal Roads
SoilsCLASS
Excesssive drained sandy soils formed in alluvium in valleys and eolian sand on uplands in sandhillsExcessively drained sandy soils formed in eolian sands on uplands in sandhillsModerately well drained silty soils on uplands and in depressions formed in loessWell drained silty soils formed in loess on uplandsWell drained silty soils formed in loess and alluvium on stream terracesWell to somewhat excessively drained loamy soils formed in weathered sandstone and eolian material on uplandsSomewhat poorly drained soils formed in alluvium on bottom landsModerately well drained silty soils with clay subsoils on uplandsLakes
51 Keith Page 32

Tax Residential & Recreational (1)
Commercial & Industrial (1)
Total Agricultural Land (1)
Year Value Amnt Value Chg Ann.%chg Cmltv%chg Value Amnt Value Chg Ann.%chg Cmltv%chg Value Amnt Value Chg Ann.%chg Cmltv%chg
2009 328,190,710 -- -- -- 86,791,150 -- -- -- 292,654,395 -- -- --
2010 334,129,510 5,938,800 1.81% 1.81% 86,954,055 162,905 0.19% 0.19% 317,502,475 24,848,080 8.49% 8.49%
2011 329,377,695 -4,751,815 -1.42% 0.36% 87,666,360 712,305 0.82% 1.01% 338,244,890 20,742,415 6.53% 15.58%
2012 333,648,235 4,270,540 1.30% 1.66% 92,246,280 4,579,920 5.22% 6.29% 350,530,405 12,285,515 3.63% 19.78%
2013 341,462,055 7,813,820 2.34% 4.04% 95,871,540 3,625,260 3.93% 10.46% 436,629,290 86,098,885 24.56% 49.20%
2014 350,691,700 9,229,645 2.70% 6.86% 98,592,825 2,721,285 2.84% 13.60% 567,610,755 130,981,465 30.00% 93.95%
2015 368,082,665 17,390,965 4.96% 12.16% 99,107,250 514,425 0.52% 14.19% 706,691,440 139,080,685 24.50% 141.48%
2016 413,237,412 45,154,747 12.27% 25.91% 107,873,128 8,765,878 8.84% 24.29% 782,428,060 75,736,620 10.72% 167.36%
2017 439,259,790 26,022,378 6.30% 33.84% 128,365,990 20,492,862 19.00% 47.90% 768,176,910 -14,251,150 -1.82% 162.49%
2018 460,152,436 20,892,646 4.76% 40.21% 130,345,150 1,979,160 1.54% 50.18% 733,539,115 -34,637,795 -4.51% 150.65%
2019 516,332,990 56,180,554 12.21% 57.33% 126,712,020 -3,633,130 -2.79% 46.00% 732,353,790 -1,185,325 -0.16% 150.25%
Rate Annual %chg: Residential & Recreational 4.64% Commercial & Industrial 3.86% Agricultural Land 9.61%
Cnty# 51
County KEITH CHART 1
(1) Residential & Recreational excludes Agric. dwelling & farm home site land. Commercial & Industrial excludes minerals. Agricultural land includes irrigated, dry, grass, waste, & other agland, excludes farm site land.
Source: 2009 - 2019 Certificate of Taxes Levied Reports CTL NE Dept. of Revenue, Property Assessment Division Prepared as of 03/01/2020
-60%-40%-20%0%20%40%60%80%100%120%140%160%180%200%220%240%260%280%300%320%340%360%380%400%420%440%460%480%500%
2009 2010 2011 2012 2013 2014 2015 2016 2017 2018 2019
CHART 1 - REAL PROPERTY VALUATIONS - Cumulative %Change 2009-2019ResRec
Comm&Indust
Total Agland
51 Keith Page 33

Residential & Recreational (1)
Commercial & Industrial (1)
Tax Growth % growth Value Ann.%chg Cmltv%chg Growth % growth Value Ann.%chg Cmltv%chg
Year Value Value of value Exclud. Growth w/o grwth w/o grwth Value Value of value Exclud. Growth w/o grwth w/o grwth
2009 328,190,710 2,610,356 0.80% 325,580,354 -- -- 86,791,150 634,975 0.73% 86,156,175 -- --
2010 334,129,510 3,136,775 0.94% 330,992,735 0.85% 0.85% 86,954,055 1,157,285 1.33% 85,796,770 -1.15% -1.15%
2011 329,377,695 3,375,563 1.02% 326,002,132 -2.43% -0.67% 87,666,360 599,350 0.68% 87,067,010 0.13% 0.32%
2012 333,648,235 3,574,004 1.07% 330,074,231 0.21% 0.57% 92,246,280 1,702,665 1.85% 90,543,615 3.28% 4.32%
2013 341,462,055 2,062,060 0.60% 339,399,995 1.72% 3.42% 95,871,540 2,182,705 2.28% 93,688,835 1.56% 7.95%
2014 350,691,700 6,315,095 1.80% 344,376,605 0.85% 4.93% 98,592,825 990,265 1.00% 97,602,560 1.81% 12.46%
2015 368,082,665 4,533,360 1.23% 363,549,305 3.67% 10.77% 99,107,250 1,328,895 1.34% 97,778,355 -0.83% 12.66%
2016 413,237,412 5,675,133 1.37% 407,562,279 10.73% 24.18% 107,873,128 857,120 0.79% 107,016,008 7.98% 23.30%
2017 439,259,790 7,276,707 1.66% 431,983,083 4.54% 31.63% 128,365,990 3,723,685 2.90% 124,642,305 15.55% 43.61%
2018 460,152,436 8,682,225 1.89% 451,470,211 2.78% 37.56% 130,345,150 2,449,165 1.88% 127,895,985 -0.37% 47.36%
2019 516,332,990 9,474,572 1.83% 506,858,418 10.15% 54.44% 126,712,020 983,120 0.78% 125,728,900 -3.54% 44.86%
Rate Ann%chg 4.64% 3.31% 3.86% C & I w/o growth 2.44%
Ag Improvements & Site Land (1)
Tax Agric. Dwelling & Agoutbldg & Ag Imprv&Site Growth % growth Value Ann.%chg Cmltv%chg
Year Homesite Value Farmsite Value Total Value Value of value Exclud. Growth w/o grwth w/o grwth
2009 33,106,280 16,817,405 49,923,685 1,587,935 3.18% 48,335,750 -- -- (1) Residential & Recreational excludes AgDwelling
2010 33,011,130 17,112,960 50,124,090 1,445,390 2.88% 48,678,700 -2.49% -2.49% & farm home site land; Comm. & Indust. excludes
2011 35,743,265 18,042,740 53,786,005 1,624,760 3.02% 52,161,245 4.06% 4.48% minerals; Agric. land includes irrigated, dry, grass,
2012 36,824,515 17,617,475 54,441,990 1,661,988 3.05% 52,780,002 -1.87% 5.72% waste & other agland, excludes farm site land.
2013 37,309,115 22,844,325 60,153,440 2,707,340 4.50% 57,446,100 5.52% 15.07% Real property growth is value attributable to new
2014 38,889,360 23,410,395 62,299,755 3,127,015 5.02% 59,172,740 -1.63% 18.53% construction, additions to existing buildings,
2015 40,009,685 23,426,275 63,435,960 1,376,065 2.17% 62,059,895 -0.39% 24.31% and any improvements to real property which
2016 40,139,220 23,460,265 63,599,485 1,005,280 1.58% 62,594,205 -1.33% 25.38% increase the value of such property.
2017 40,223,197 23,932,945 64,156,142 951,390 1.48% 63,204,752 -0.62% 26.60% Sources:
2018 39,903,544 24,040,580 63,944,124 779,615 1.22% 63,164,509 -1.55% 26.52% Value; 2009 - 2019 CTL
2019 49,916,840 36,920,685 86,837,525 768,915 0.89% 86,068,610 34.60% 72.40% Growth Value; 2009-2019 Abstract of Asmnt Rpt.
Rate Ann%chg 4.19% 8.18% 5.69% Ag Imprv+Site w/o growth 3.43%
Cnty# 51 NE Dept. of Revenue, Property Assessment Division
County KEITH CHART 2 Prepared as of 03/01/2020
-60%-40%-20%0%20%40%60%80%100%120%140%160%180%200%220%240%260%280%300%320%340%360%380%400%420%440%460%480%500%
2009 2010 2011 2012 2013 2014 2015 2016 2017 2018 2019
CHART 2 - REAL PROPERTY & GROWTH VALUATIONS - Cumulative %Change 2009-2019ResRec
Comm&Indust
Ag Imprv+SiteLand
51 Keith Page 34

Tax Irrigated Land Dryland Grassland
Year Value Value Chg Ann%chg Cmltv%chg Value Value Chg Ann%chg Cmltv%chg Value Value Chg Ann%chg Cmltv%chg
2009 153,811,890 -- -- -- 42,525,450 -- -- -- 94,160,670 -- -- --
2010 155,554,455 1,742,565 1.13% 1.13% 47,630,205 5,104,755 12.00% 12.00% 111,920,430 17,759,760 18.86% 18.86%
2011 170,224,510 14,670,055 9.43% 10.67% 54,046,205 6,416,000 13.47% 27.09% 110,464,590 -1,455,840 -1.30% 17.31%
2012 173,179,285 2,954,775 1.74% 12.59% 58,967,060 4,920,855 9.10% 38.66% 112,674,250 2,209,660 2.00% 19.66%
2013 232,814,915 59,635,630 34.44% 51.36% 85,414,165 26,447,105 44.85% 100.85% 112,333,770 -340,480 -0.30% 19.30%
2014 323,944,205 91,129,290 39.14% 110.61% 115,961,525 30,547,360 35.76% 172.69% 120,742,990 8,409,220 7.49% 28.23%
2015 410,673,885 86,729,680 26.77% 167.00% 142,814,790 26,853,265 23.16% 235.83% 145,830,570 25,087,580 20.78% 54.87%
2016 458,346,890 47,673,005 11.61% 197.99% 142,895,685 80,895 0.06% 236.02% 173,149,735 27,319,165 18.73% 83.89%
2017 436,577,015 -21,769,875 -4.75% 183.84% 134,464,255 -8,431,430 -5.90% 216.20% 189,079,125 15,929,390 9.20% 100.80%
2018 412,524,360 -24,052,655 -5.51% 168.20% 123,752,370 -10,711,885 -7.97% 191.01% 188,944,080 -135,045 -0.07% 100.66%
2019 411,377,910 -1,146,450 -0.28% 167.46% 123,654,105 -98,265 -0.08% 190.78% 188,776,715 -167,365 -0.09% 100.48%
Rate Ann.%chg: Irrigated 10.34% Dryland 11.26% Grassland 7.20%
Tax Waste Land (1)
Other Agland (1)
Total Agricultural
Year Value Value Chg Ann%chg Cmltv%chg Value Value Chg Ann%chg Cmltv%chg Value Value Chg Ann%chg Cmltv%chg
2009 2,147,430 -- -- -- 8,955 -- -- -- 292,654,395 -- -- --
2010 2,397,385 249,955 11.64% 11.64% 0 -8,955 -100.00% -100.00% 317,502,475 24,848,080 8.49% 8.49%
2011 3,509,585 1,112,200 46.39% 63.43% 0 0 -100.00% 338,244,890 20,742,415 6.53% 15.58%
2012 14,165 -3,495,420 -99.60% -99.34% 5,695,645 5,695,645 63502.96% 350,530,405 12,285,515 3.63% 19.78%
2013 14,520 355 2.51% -99.32% 6,051,920 356,275 6.26% 67481.46% 436,629,290 86,098,885 24.56% 49.20%
2014 6,139,905 6,125,385 42185.85% 185.92% 822,130 -5,229,790 -86.42% 9080.68% 567,610,755 130,981,465 30.00% 93.95%
2015 1,833,420 -4,306,485 -70.14% -14.62% 5,538,775 4,716,645 573.71% 61751.20% 706,691,440 139,080,685 24.50% 141.48%
2016 2,011,925 178,505 9.74% -6.31% 6,023,825 485,050 8.76% 67167.73% 782,428,060 75,736,620 10.72% 167.36%
2017 155,800 -1,856,125 -92.26% -92.74% 7,900,715 1,876,890 31.16% 88126.86% 768,176,910 -14,251,150 -1.82% 162.49%
2018 155,800 0 0.00% -92.74% 8,162,505 261,790 3.31% 91050.25% 733,539,115 -34,637,795 -4.51% 150.65%
2019 155,800 0 0.00% -92.74% 8,389,260 226,755 2.78% 93582.41% 732,353,790 -1,185,325 -0.16% 150.25%
Cnty# 51 Rate Ann.%chg: Total Agric Land 9.61%
County KEITH
Source: 2009 - 2019 Certificate of Taxes Levied Reports CTL NE Dept. of Revenue, Property Assessment Division Prepared as of 03/01/2020 CHART 3
-60%-40%-20%0%20%40%60%80%100%120%140%160%180%200%220%240%260%280%300%320%340%360%380%400%420%440%460%480%500%
2009 2010 2011 2012 2013 2014 2015 2016 2017 2018 2019
CHART 3 - AGRICULTURAL LAND VALUATIONS - Cumulative %Change 2009-2019
Irrigated
Dryland
Total Agland
Grassland
51 Keith Page 35

CHART 4 - AGRICULTURAL LAND - AVERAGE VALUE PER ACRE - Cumulative % Change 2009-2019 (from County Abstract Reports)(1)
IRRIGATED LAND DRYLAND GRASSLAND
Tax Avg Value Ann%chg Cmltv%chg Avg Value Ann%chg Cmltv%chg Avg Value Ann%chg Cmltv%chg
Year Value Acres per Acre AvgVal/acre AvgVal/Acre Value Acres per Acre AvgVal/acre AvgVal/Acre Value Acres per Acre AvgVal/acre AvgVal/Acre
2009 151,960,815 108,042 1,407 42,977,285 113,106 380 98,495,410 399,280 247
2010 155,181,690 112,643 1,378 -2.05% -2.05% 47,830,570 109,585 436 14.87% 14.87% 111,350,395 399,518 279 12.98% 12.98%
2011 170,289,025 110,472 1,541 11.89% 9.60% 54,243,085 107,908 503 15.17% 32.29% 111,124,590 405,148 274 -1.59% 11.19%
2012 172,801,045 110,522 1,563 1.43% 11.16% 58,794,685 107,209 548 9.10% 44.33% 112,480,880 404,572 278 1.36% 12.71%
2013 232,972,615 113,587 2,051 31.18% 45.83% 85,270,595 105,495 808 47.39% 112.72% 112,310,610 404,097 278 -0.03% 12.67%
2014 323,756,345 113,685 2,848 38.85% 102.48% 116,131,510 105,668 1,099 35.97% 189.24% 120,876,430 404,005 299 7.65% 21.29%
2015 410,707,420 113,399 3,622 27.18% 157.50% 142,844,735 105,489 1,354 23.21% 256.37% 145,799,580 404,343 361 20.52% 46.17%
2016 458,346,380 113,475 4,039 11.52% 187.18% 142,915,300 105,462 1,355 0.07% 256.64% 173,083,090 404,181 428 18.76% 73.60%
2017 436,577,015 113,106 3,860 -4.44% 174.43% 134,578,625 105,740 1,273 -6.08% 234.95% 189,022,285 404,280 468 9.18% 89.54%
2018 412,542,325 112,876 3,655 -5.31% 159.85% 123,707,720 105,619 1,171 -7.97% 208.25% 188,998,295 404,233 468 0.00% 89.53%
2019 411,415,160 112,592 3,654 -0.02% 159.80% 123,614,365 105,547 1,171 -0.01% 208.23% 188,815,845 403,884 468 -0.01% 89.51%
Rate Annual %chg Average Value/Acre: 10.02% 11.91% 6.60%
WASTE LAND (2)
OTHER AGLAND (2)
TOTAL AGRICULTURAL LAND (1)
Tax Avg Value Ann%chg Cmltv%chg Avg Value Ann%chg Cmltv%chg Avg Value Ann%chg Cmltv%chg
Year Value Acres per Acre AvgVal/acre AvgVal/Acre Value Acres per Acre AvgVal/acre AvgVal/Acre Value Acres per Acre AvgVal/acre AvgVal/Acre
2009 2,237,275 15,082 148 0 0 295,670,785 635,510 465
2010 2,501,010 14,487 173 16.38% 16.38% 100,085 125 798 316,963,750 636,358 498 7.06% 7.06%
2011 2,475,940 14,344 173 -0.01% 16.36% 0 0 338,132,640 637,872 530 6.43% 13.94%
2012 6,757,150 14,299 473 173.77% 218.57% 0 0 350,833,760 636,601 551 3.96% 18.45%
2013 14,520 579 25 -94.69% -83.10% 6,096,625 14,377 424 436,664,965 638,136 684 24.17% 47.08%
2014 7,094,715 13,789 515 1952.35% 246.85% 1,081,045 884 1,223 188.36% 568,940,045 638,031 892 30.31% 91.66%
2015 1,833,420 3,574 513 -0.30% 245.80% 5,740,435 10,556 544 -55.53% 706,925,590 637,360 1,109 24.38% 138.40%
2016 2,011,925 3,574 563 9.74% 279.46% 6,023,825 10,599 568 4.51% 782,380,520 637,291 1,228 10.69% 163.87%
2017 2,020,065 3,573 565 0.45% 281.16% 6,036,450 10,596 570 0.24% 768,234,440 637,294 1,205 -1.81% 159.10%
2018 155,800 562 277 -50.95% 86.97% 8,153,875 13,712 595 4.38% 733,558,015 637,001 1,152 -4.47% 147.52%
2019 155,800 562 277 0.00% 86.97% 8,349,095 14,126 591 -0.61% 732,350,265 636,711 1,150 -0.12% 147.22%
51 Rate Annual %chg Average Value/Acre: 9.47%
KEITH
(1) Valuations from County Abstracts vs Certificate of Taxes Levied Reports (CTL) will vary due to different reporting dates. Source: 2009 - 2019 County Abstract Reports
Agland Assessment Level 1998 to 2006 = 80%; 2007 & forward = 75% NE Dept. of Revenue, Property Assessment Division Prepared as of 03/01/2020 CHART 4
51 Keith Page 36

CHART 5 - 2019 County and Municipal Valuations by Property Type
Pop. County: Personal Prop StateAsd PP StateAsdReal Residential Commercial Industrial Recreation Agland Agdwell&HS AgImprv&FS Minerals Total Value
8,368 KEITH 63,874,572 52,346,696 213,708,979 495,472,160 121,409,615 5,302,405 20,860,830 732,353,790 49,916,840 36,920,685 138,830 1,792,305,402
cnty sectorvalue % of total value: 3.56% 2.92% 11.92% 27.64% 6.77% 0.30% 1.16% 40.86% 2.79% 2.06% 0.01% 100.00%
Pop. Municipality: Personal Prop StateAsd PP StateAsd Real Residential Commercial Industrial Recreation Agland Agdwell&HS AgImprv&FS Minerals Total Value
326 BRULE 427,654 704,082 1,452,796 11,049,425 2,846,260 49,675 0 0 0 0 0 16,529,892
3.90% %sector of county sector 0.67% 1.35% 0.68% 2.23% 2.34% 0.94% 0.92% %sector of municipality 2.59% 4.26% 8.79% 66.85% 17.22% 0.30% 100.00%
4,737 OGALLALA 10,828,502 6,160,360 7,443,980 185,331,540 86,161,345 4,566,750 0 170,245 0 0 0 300,662,722
56.61% %sector of county sector 16.95% 11.77% 3.48% 37.41% 70.97% 86.13% 0.02% 16.78% %sector of municipality 3.60% 2.05% 2.48% 61.64% 28.66% 1.52% 0.06% 100.00%
523 PAXTON 491,534 1,022,669 2,764,429 16,790,370 4,663,345 454,590 0 178,505 0 0 0 26,365,442
6.25% %sector of county sector 0.77% 1.95% 1.29% 3.39% 3.84% 8.57% 0.02% 1.47% %sector of municipality 1.86% 3.88% 10.49% 63.68% 17.69% 1.72% 0.68% 100.00%
5,586 Total Municipalities 11,747,690 7,887,111 11,661,205 213,171,335 93,670,950 5,071,015 0 348,750 0 0 0 343,558,056
66.75% %all municip.sectors of cnty 18.39% 15.07% 5.46% 43.02% 77.15% 95.64% 0.05% 19.17%
51 KEITH Sources: 2019 Certificate of Taxes Levied CTL, 2010 US Census; Dec. 2019 Municipality Population per Research Division NE Dept. of Revenue, Property Assessment Division Prepared as of 03/01/2020 CHART 5
51 Keith Page 37

KeithCounty 51 2020 County Abstract of Assessment for Real Property, Form 45
01. Res UnImp Land
02. Res Improve Land
204 2,553,325 42 950,135 317 8,175,375 563 11,678,835
2,255 25,989,305 180 7,108,665 1,995 48,476,140 4,430 81,574,110
2,376 208,043,210 188 38,522,505 2,061 248,281,190 4,625 494,846,905
5,188 588,099,850 11,992,588
5,626,880 163 1,339,210 34 850,880 16 3,436,790 113
398 12,527,155 35 1,720,115 72 3,010,825 505 17,258,095
107,976,625 529 14,155,665 80 10,108,995 40 83,711,965 409
692 130,861,600 4,379,690
03. Res Improvements
04. Res Total
05. Com UnImp Land
06. Com Improve Land
07. Com Improvements
08. Com Total
9,181 1,564,674,325 17,120,983 Total Real Property
Growth Value : Records : Sum Lines 17, 25, & 30 Sum Lines 17, 25, & 41
09. Ind UnImp Land
10. Ind Improve Land
11. Ind Improvements
12. Ind Total
13. Rec UnImp Land
14. Rec Improve Land
15. Rec Improvements
16. Rec Total
17. Taxable Total
1 26,250 1 34,230 0 0 2 60,480
12 450,455 1 35,725 0 0 13 486,180
12 7,047,410 1 169,580 0 0 13 7,216,990
15 7,763,650 0
0 0 0 0 709 15,383,910 709 15,383,910
0 0 0 0 83 1,915,195 83 1,915,195
0 0 0 0 84 10,778,525 84 10,778,525
793 28,077,630 0
6,688 754,802,730 16,372,278
Urban SubUrban Rural Total GrowthRecords Value Records Value Records Value Records Value
Schedule I : Non-Agricultural Records
% of Res Total
% of Com Total
% of Ind Total
% of Rec Total
% of Taxable Total
% of Res & Rec Total
Res & Rec Total
% of Com & Ind Total
Com & Ind Total
49.73 40.23 4.43 7.92 45.84 51.85 56.51 37.59
49.12 46.57 72.85 48.24
535 107,200,025 58 12,919,525 114 18,505,700 707 138,625,250
5,981 616,177,480 2,580 236,585,840 3,171 333,010,335 230 46,581,305
38.40 43.14 39.38 65.15 7.56 3.85 54.04 53.02
0.00 0.00 1.79 8.64 0.00 0.00 100.00 100.00
77.33 75.67 8.86 7.70 9.32 8.20 13.35 16.12
0.00 0.00 0.16 0.50 3.09 13.33 96.91 86.67
76.17 75.43 8.36 7.54 9.69 8.09 14.14 16.47
7.88 4.31 45.55 46.58
2,378 304,932,705 230 46,581,305 2,580 236,585,840
114 18,505,700 56 12,679,990 522 99,675,910
0 0 2 239,535 13 7,524,115
793 28,077,630 0 0 0 0
3,115 343,785,865 288 59,500,830 3,285 351,516,035
25.58
0.00
0.00
70.05
95.63
25.58
70.05
4,379,690
11,992,588
51 Keith Page 38

KeithCounty 51 2020 County Abstract of Assessment for Real Property, Form 45
18. Residential
Records
TotalRural
SubUrban Urban
Schedule II : Tax Increment Financing (TIF)
Value Base Value Excess Value ExcessValue BaseRecords
5 0 47,490 0 772,705 0
19. Commercial
20. Industrial
21. Other
22. Total Sch II
25 3,340,275 30,919,620
0 0 0
0 0 0 0 0 0
0 0 0
0 0 0
Value ExcessValue BaseRecordsValue ExcessValue BaseRecords
21. Other
20. Industrial
19. Commercial
18. Residential 0 0 0 5 47,490 772,705
0 0 0 25 3,340,275 30,919,620
0 0 0 0 0 0
0 0 0 0 0 0
30 3,387,765 31,692,325
23. Producing
GrowthValueRecords
TotalValueRecords
RuralValueRecords
SubUrbanValueRecords
UrbanSchedule III : Mineral Interest Records
0 0 0 0 63 138,830 63 138,830 0
0 0 0 0 0 0 0 0 0
0 0 0 0 63 138,830 63 138,830 0
Mineral Interest
24. Non-Producing
25. Total
Schedule IV : Exempt Records : Non-Agricultural
Schedule V : Agricultural Records
Records Records Records RecordsTotalRural SubUrban Urban
26. Exempt 230 78 364 672
29. Ag Improvements
28. Ag-Improved Land
ValueRecordsTotal
ValueRecordsRural
Records Value SubUrban
ValueRecords
27. Ag-Vacant Land
Urban
4 347,460 124 29,026,545 1,797 520,644,405 1,925 550,018,410
0 0 39 8,222,615 442 164,259,335 481 172,481,950
0 0 40 5,204,100 465 82,028,305 505 87,232,405
51 Keith Page 39

KeithCounty 51 2020 County Abstract of Assessment for Real Property, Form 45
30. Ag Total 2,430 809,732,765
31. HomeSite UnImp Land
Records
TotalRural
SubUrban UrbanSchedule VI : Agricultural Records :Non-Agricultural Detail
Acres Value ValueAcresRecords
32. HomeSite Improv Land
33. HomeSite Improvements
34. HomeSite Total
ValueAcresRecordsValueAcres
34. HomeSite Total
33. HomeSite Improvements
32. HomeSite Improv Land
31. HomeSite UnImp Land
35. FarmSite UnImp Land
36. FarmSite Improv Land
37. FarmSite Improvements
38. FarmSite Total
37. FarmSite Improvements
36. FarmSite Improv Land
35. FarmSite UnImp Land
39. Road & Ditches
38. FarmSite Total
39. Road & Ditches
Records
40. Other- Non Ag Use
40. Other- Non Ag Use
41. Total Section VI
0 0.00 0 0 0.00 0
0 0.00 0
0 0.00 0 23
0 0.00 0 2
0 0.00 0 28
0 0.00 0 39
0 0.00 0 75
0 0.00 0 0 0.00 0
0 193.70
2,257,750 0.00
167,550 29.81
2.80 12,550
2,946,350 0.00
750,000 25.00 22
26 780,000 26.00 26 26.00 780,000
283 319.00 9,570,000 305 344.00 10,320,000
298 0.00 42,931,760 321 0.00 45,878,110
347 370.00 56,978,110
14.25 13 57,150 15 17.05 69,700
302 356.15 1,678,375 330 385.96 1,845,925
448 0.00 39,096,545 487 0.00 41,354,295
502 403.01 43,269,920
1,333 4,864.41 0 1,408 5,058.11 0
5 87.13 44,625 5 87.13 44,625
849 5,918.25 100,292,655
Growth
525,360
223,345
748,705
51 Keith Page 40

KeithCounty 51 2020 County Abstract of Assessment for Real Property, Form 45
42. Game & Parks
ValueAcresRecords
SubUrban
ValueAcresRecords
Urban
0 0.00 0 2 0.00 0
42. Game & Parks
ValueAcresRecordsTotal
ValueAcresRecordsRural
Schedule VII : Agricultural Records :Ag Land Detail - Game & Parks
3 0.00 0 5 0.00 0
Schedule VIII : Agricultural Records : Special Value
43. Special Value
ValueAcresRecords SubUrban
ValueAcresRecords Urban
43. Special Value
ValueAcresRecordsTotal
ValueAcresRecordsRural
44. Market Value
44. Market Value
1 26.66 28,820 53 4,671.52 7,493,985
197 37,936.43 46,991,025 251 42,634.61 54,513,830
1 26.66 42,130 53 4,671.52 12,325,140
0 0 0 0 0 0
51 Keith Page 41
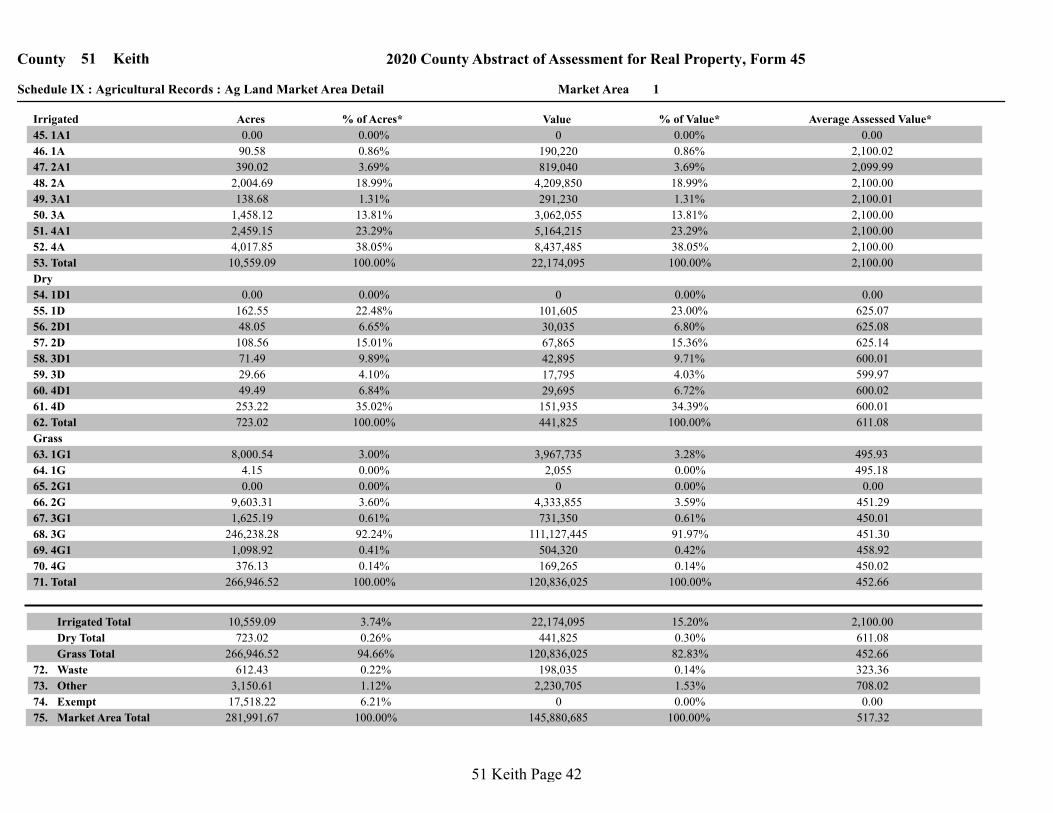
1Market AreaSchedule IX : Agricultural Records : Ag Land Market Area Detail
2020 County Abstract of Assessment for Real Property, Form 45Keith51County
45. 1A1
ValueAcres
46. 1A
47. 2A1
48. 2A
49. 3A1
50. 3A
51. 4A1
52. 4A
53. Total
54. 1D1
55. 1D
56. 2D1
57. 2D
58. 3D1
59. 3D
60. 4D1
61. 4D
62. Total
63. 1G1
64. 1G
65. 2G1
66. 2G
67. 3G1
68. 3G
69. 4G1
70. 4G
71. Total
Waste
Other
Exempt
Irrigated
Dry
Grass
Market Area Total 145,880,685 281,991.67
0 17,518.22
2,230,705 3,150.61
198,035 612.43
120,836,025 266,946.52
169,265 376.13
504,320 1,098.92
111,127,445 246,238.28
731,350 1,625.19
4,333,855 9,603.31
0 0.00
2,055 4.15
3,967,735 8,000.54
441,825 723.02
151,935 253.22
49.49 29,695
17,795 29.66
42,895 71.49
67,865 108.56
30,035 48.05
101,605 162.55
0 0.00
22,174,095 10,559.09
8,437,485 4,017.85
5,164,215 2,459.15
3,062,055 1,458.12
291,230 138.68
4,209,850 2,004.69
819,040 390.02
190,220 90.58
0 0.00
% of Acres* % of Value*
0.00%
0.86%
22.48%
0.00%
3.00%
0.00%
18.99%
3.69%
15.01%
6.65%
3.60%
0.00%
1.31%
13.81%
4.10%
9.89%
0.61%
92.24%
38.05%
23.29%
6.84%
35.02%
0.14%
0.41%
100.00%
100.00%
100.00%
Grass Total
Dry Total
Irrigated Total 10,559.09
723.02
266,946.52
22,174,095
441,825
120,836,025
3.74%
0.26%
94.66%
0.22%
6.21%
1.12%
100.00%
Average Assessed Value*
0.86%
0.00%
18.99%
3.69%
1.31%
13.81%
23.29%
38.05%
100.00%
0.00%
23.00%
0.00%
3.28%
6.80%
15.36%
0.00%
3.59%
9.71%
4.03%
0.61%
91.97%
6.72%
34.39%
0.42%
0.14%
100.00%
100.00%
0.00
2,100.02
625.07
0.00
495.93
495.18
2,100.00
2,099.99
625.08
625.14
451.29
0.00
2,100.01
2,100.00
600.01
599.97
450.01
451.30
2,100.00
2,100.00
600.02
600.01
450.02
458.92
2,100.00
611.08
452.66
0.00% 0.00
1.53% 708.02
100.00% 517.32
611.08 0.30%
452.66 82.83%
2,100.00 15.20%
323.36 0.14%72.
73.
74.
75.
51 Keith Page 42
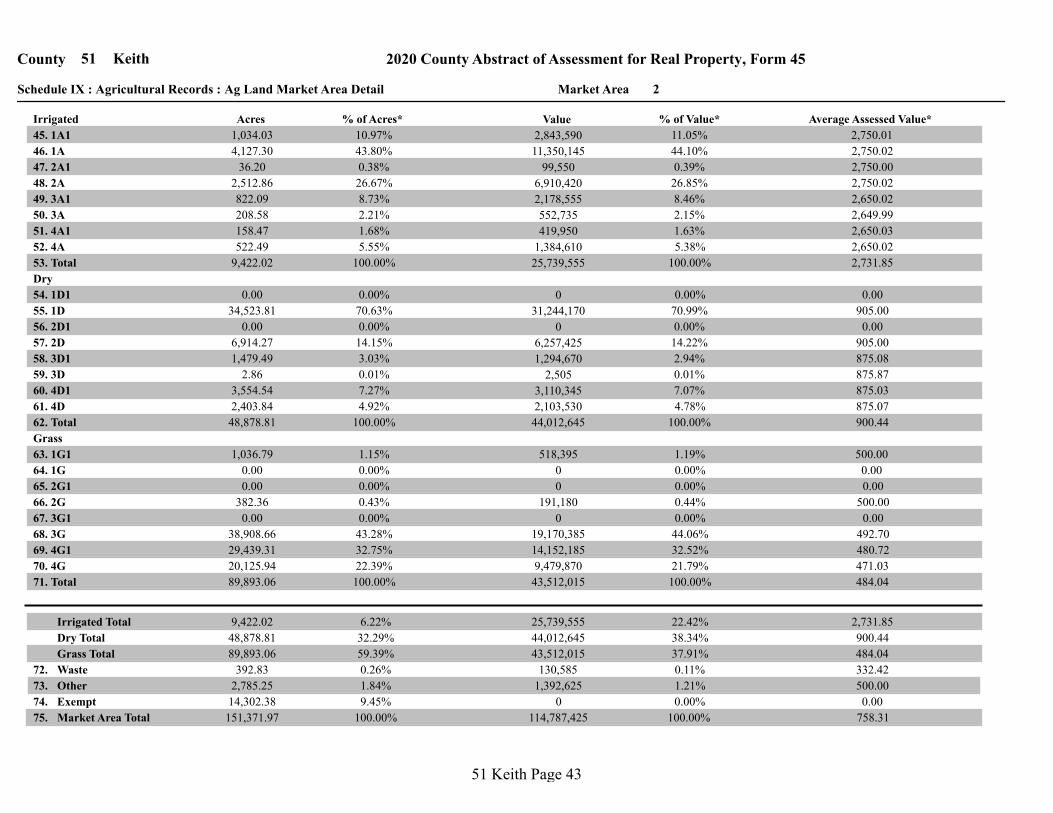
2Market AreaSchedule IX : Agricultural Records : Ag Land Market Area Detail
2020 County Abstract of Assessment for Real Property, Form 45Keith51County
45. 1A1
ValueAcres
46. 1A
47. 2A1
48. 2A
49. 3A1
50. 3A
51. 4A1
52. 4A
53. Total
54. 1D1
55. 1D
56. 2D1
57. 2D
58. 3D1
59. 3D
60. 4D1
61. 4D
62. Total
63. 1G1
64. 1G
65. 2G1
66. 2G
67. 3G1
68. 3G
69. 4G1
70. 4G
71. Total
Waste
Other
Exempt
Irrigated
Dry
Grass
Market Area Total 114,787,425 151,371.97
0 14,302.38
1,392,625 2,785.25
130,585 392.83
43,512,015 89,893.06
9,479,870 20,125.94
14,152,185 29,439.31
19,170,385 38,908.66
0 0.00
191,180 382.36
0 0.00
0 0.00
518,395 1,036.79
44,012,645 48,878.81
2,103,530 2,403.84
3,554.54 3,110,345
2,505 2.86
1,294,670 1,479.49
6,257,425 6,914.27
0 0.00
31,244,170 34,523.81
0 0.00
25,739,555 9,422.02
1,384,610 522.49
419,950 158.47
552,735 208.58
2,178,555 822.09
6,910,420 2,512.86
99,550 36.20
11,350,145 4,127.30
2,843,590 1,034.03
% of Acres* % of Value*
10.97%
43.80%
70.63%
0.00%
1.15%
0.00%
26.67%
0.38%
14.15%
0.00%
0.43%
0.00%
8.73%
2.21%
0.01%
3.03%
0.00%
43.28%
5.55%
1.68%
7.27%
4.92%
22.39%
32.75%
100.00%
100.00%
100.00%
Grass Total
Dry Total
Irrigated Total 9,422.02
48,878.81
89,893.06
25,739,555
44,012,645
43,512,015
6.22%
32.29%
59.39%
0.26%
9.45%
1.84%
100.00%
Average Assessed Value*
44.10%
11.05%
26.85%
0.39%
8.46%
2.15%
1.63%
5.38%
100.00%
0.00%
70.99%
0.00%
1.19%
0.00%
14.22%
0.00%
0.44%
2.94%
0.01%
0.00%
44.06%
7.07%
4.78%
32.52%
21.79%
100.00%
100.00%
2,750.01
2,750.02
905.00
0.00
500.00
0.00
2,750.02
2,750.00
0.00
905.00
500.00
0.00
2,650.02
2,649.99
875.08
875.87
0.00
492.70
2,650.03
2,650.02
875.03
875.07
471.03
480.72
2,731.85
900.44
484.04
0.00% 0.00
1.21% 500.00
100.00% 758.31
900.44 38.34%
484.04 37.91%
2,731.85 22.42%
332.42 0.11%72.
73.
74.
75.
51 Keith Page 43

3Market AreaSchedule IX : Agricultural Records : Ag Land Market Area Detail
2020 County Abstract of Assessment for Real Property, Form 45Keith51County
45. 1A1
ValueAcres
46. 1A
47. 2A1
48. 2A
49. 3A1
50. 3A
51. 4A1
52. 4A
53. Total
54. 1D1
55. 1D
56. 2D1
57. 2D
58. 3D1
59. 3D
60. 4D1
61. 4D
62. Total
63. 1G1
64. 1G
65. 2G1
66. 2G
67. 3G1
68. 3G
69. 4G1
70. 4G
71. Total
Waste
Other
Exempt
Irrigated
Dry
Grass
Market Area Total 448,772,000 203,362.80
0 0.00
6,320,780 8,380.40
71,530 213.47
23,909,945 46,133.20
1,386,195 2,843.80
6,250,595 12,654.41
13,633,065 25,581.87
0 0.00
886,070 1,772.14
38,690 70.63
0 0.00
1,715,330 3,210.35
73,732,665 56,033.46
4,382,215 3,562.72
1,947.82 2,395,825
28,715 22.79
4,579,395 3,620.04
14,017,615 11,081.06
224,495 166.29
48,104,405 35,632.74
0 0.00
344,737,080 92,602.27
5,074,170 1,405.59
24,523,975 6,793.33
2,919,830 808.82
8,945,055 2,477.86
77,412,895 21,444.01
3,776,605 997.78
170,199,770 44,966.90
51,884,780 13,707.98
% of Acres* % of Value*
14.80%
48.56%
63.59%
0.00%
6.96%
0.00%
23.16%
1.08%
19.78%
0.30%
3.84%
0.15%
2.68%
0.87%
0.04%
6.46%
0.00%
55.45%
1.52%
7.34%
3.48%
6.36%
6.16%
27.43%
100.00%
100.00%
100.00%
Grass Total
Dry Total
Irrigated Total 92,602.27
56,033.46
46,133.20
344,737,080
73,732,665
23,909,945
45.54%
27.55%
22.69%
0.10%
0.00%
4.12%
100.00%
Average Assessed Value*
49.37%
15.05%
22.46%
1.10%
2.59%
0.85%
7.11%
1.47%
100.00%
0.00%
65.24%
0.00%
7.17%
0.30%
19.01%
0.16%
3.71%
6.21%
0.04%
0.00%
57.02%
3.25%
5.94%
26.14%
5.80%
100.00%
100.00%
3,785.01
3,785.00
1,350.01
0.00
534.31
0.00
3,610.00
3,785.01
1,350.02
1,265.01
500.00
547.78
3,609.99
3,609.99
1,265.01
1,259.98
0.00
532.92
3,610.01
3,609.99
1,230.00
1,230.02
487.44
493.95
3,722.77
1,315.87
518.28
0.00% 0.00
1.41% 754.23
100.00% 2,206.76
1,315.87 16.43%
518.28 5.33%
3,722.77 76.82%
335.08 0.02%72.
73.
74.
75.
51 Keith Page 44

County 2020 County Abstract of Assessment for Real Property, Form 45Keith51
Schedule X : Agricultural Records :Ag Land Total
76. Irrigated
TotalValueAcresAcres Value
RuralAcres Value ValueAcres
SubUrban Urban
77. Dry Land
78. Grass
79. Waste
80. Other
81. Exempt
82. Total
76.09 250,145 7,523.17 26,884,710 104,984.12 365,515,875 112,583.38 392,650,730
94.10 92,210 4,179.30 4,491,740 101,361.89 113,603,185 105,635.29 118,187,135
4.00 1,900 8,225.96 4,068,520 394,742.82 184,187,565 402,972.78 188,257,985
0.00 0 53.01 17,755 1,165.72 382,395 1,218.73 400,150
6.41 3,205 1,551.55 856,335 12,758.30 9,084,570 14,316.26 9,944,110
0.00 0
180.60 347,460 21,532.99 36,319,060
0.00 0 31,820.60 0 31,820.60 0
615,012.85 672,773,590 636,726.44 709,440,110
Irrigated
Dry Land
Grass
Waste
Other
Exempt
Total 709,440,110 636,726.44
0 31,820.60
9,944,110 14,316.26
400,150 1,218.73
188,257,985 402,972.78
118,187,135 105,635.29
392,650,730 112,583.38
% of Acres*Acres Value % of Value* Average Assessed Value*
1,118.82 16.59% 16.66%
0.00 5.00% 0.00%
467.17 63.29% 26.54%
3,487.64 17.68% 55.35%
694.60 2.25% 1.40%
1,114.20 100.00% 100.00%
328.33 0.19% 0.06%
51 Keith Page 45

GrowthUnimproved Land Improved Land Improvements Total
2020 County Abstract of Assessment for Real Property, Form 45County 51 Keith
Records Value Records Value Records Value Records Value
Schedule XI : Residential Records - Assessor Location Detail
Assessor LocationLine# L
25 217,870 166 1,473,730 174 12,106,280 199 13,797,880 1,612,93083.1 Brule
0 0 122 8,585,000 122 24,265,840 122 32,850,840 412,41083.2 K-areas
47 618,640 111 859,955 113 6,361,985 160 7,840,580 141,32583.3 Key/roscoe/sarben
848 18,574,040 1,554 28,376,100 1,606 181,520,805 2,454 228,470,945 5,764,73383.4 Lake
35 758,285 163 6,446,775 166 34,698,495 201 41,903,555 686,69083.5 Og Sub
145 1,890,915 1,866 21,759,500 1,978 180,291,400 2,123 203,941,815 1,666,70083.6 Ogallala
35 482,460 222 2,663,630 222 15,396,305 257 18,542,395 416,07083.7 Paxton
137 4,520,535 309 13,324,615 328 50,984,320 465 68,829,470 1,291,73083.8 Rural
1,272 27,062,745 4,513 83,489,305 4,709 505,625,430 5,981 616,177,480 11,992,58884 Residential Total
51 Keith Page 46

GrowthUnimproved Land Improved Land Improvements Total
2020 County Abstract of Assessment for Real Property, Form 45County 51 Keith
Records Value Records Value Records Value Records Value
Schedule XII : Commercial Records - Assessor Location Detail
Assessor LocationLine# L
22 104,385 40 339,315 43 6,568,635 65 7,012,335 4,76585.1 Brule
0 0 6 46,965 6 195,870 6 242,835 085.2 Key/roscoe/sarben
20 742,575 58 2,835,335 63 12,411,495 83 15,989,405 3,76085.3 Lake
13 761,085 27 1,436,190 30 4,065,195 43 6,262,470 085.4 Og Sub
77 3,244,765 333 12,384,180 340 82,641,720 417 98,270,665 3,575,00085.5 Ogallala
17 116,750 42 393,530 44 5,232,140 61 5,742,420 085.6 Paxton
16 717,800 12 308,760 16 4,078,560 32 5,105,120 796,16585.7 Rural
165 5,687,360 518 17,744,275 542 115,193,615 707 138,625,250 4,379,69086 Commercial Total
51 Keith Page 47

1Market AreaSchedule XIII : Agricultural Records : Grass Land Detail By Market Area
2020 County Abstract of Assessment for Real Property, Form 45Keith51County
87. 1G1
ValueAcres
88. 1G
89. 2G1
90. 2G
91. 3G1
92. 3G
93. 4G1
94. 4G
95. Total
96. 1C1
97. 1C
98. 2C1
99. 2C
100. 3C1
101. 3C
102. 4C1
103. 4C
104. Total
105. 1T1
106. 1T
107. 2T1
108. 2T
109. 3T1
110. 3T
111. 4T1
112. 4T
113. Total
Pure Grass
CRP
Timber
114. Market Area Total 120,836,025 266,946.52
119,877,620 265,596.65
169,265 376.13
477,555 1,061.22
110,254,120 245,008.24
731,350 1,625.19
4,300,270 9,556.01
0 0.00
2,055 4.15
3,943,005 7,965.71
% of Acres* % of Value*
3.00%
0.00%
3.60%
0.00%
0.61%
92.25%
0.14%
0.40%
100.00%
Grass TotalCRP Total
Timber Total
265,596.65 119,877,620 99.49%
100.00%
Average Assessed Value*
0.00%
3.29%
0.00%
3.59%
0.61%
91.97%
0.40%
0.14%
100.00%
495.00
495.18
450.01
0.00
450.01
450.00
450.02
450.01
451.35
100.00% 452.66
451.35 99.21%
0.00
34.83
0.00
0.00
47.30
0.00
1,230.04
37.70
0.00
1,349.87 958,405
0
26,765
873,325
0
33,585
0
0
24,730
0
0.00 0
0.00 0
0.00 0
0.00 0
0.00 0
0.00 0
0.00 0
0.00 0
0.00% 0.00 0.00%
2.58% 710.02 2.58%
0.00% 0.00 0.00% 0.00% 0.00 0.00%
3.50% 710.04 3.50%
0.00% 0.00 0.00%
0.00% 0.00 0.00% 0.00% 0.00 0.00%
91.12% 710.00 91.12% 0.00% 0.00 0.00%
0.00% 0.00 0.00%
0.00% 0.00 0.00%
0.00% 0.00 0.00%
2.79% 709.95 2.79%
0.00% 0.00 0.00%
0.00% 0.00 0.00%
100.00% 100.00% 710.00
0.00% 0.00%
0.51%
0.00% 0.00
0.00
710.00 0.79%
0.00% 0.00 0
1,349.87 958,405
51 Keith Page 48

2Market AreaSchedule XIII : Agricultural Records : Grass Land Detail By Market Area
2020 County Abstract of Assessment for Real Property, Form 45Keith51County
87. 1G1
ValueAcres
88. 1G
89. 2G1
90. 2G
91. 3G1
92. 3G
93. 4G1
94. 4G
95. Total
96. 1C1
97. 1C
98. 2C1
99. 2C
100. 3C1
101. 3C
102. 4C1
103. 4C
104. Total
105. 1T1
106. 1T
107. 2T1
108. 2T
109. 3T1
110. 3T
111. 4T1
112. 4T
113. Total
Pure Grass
CRP
Timber
114. Market Area Total 43,512,015 89,893.06
40,437,215 85,562.29
9,418,695 20,039.77
13,218,425 28,124.13
17,090,520 35,979.24
0 0.00
191,180 382.36
0 0.00
0 0.00
518,395 1,036.79
% of Acres* % of Value*
1.21%
0.00%
0.45%
0.00%
0.00%
42.05%
23.42%
32.87%
100.00%
Grass TotalCRP Total
Timber Total
85,562.29 40,437,215 95.18%
100.00%
Average Assessed Value*
0.00%
1.28%
0.00%
0.47%
0.00%
42.26%
32.69%
23.29%
100.00%
500.00
0.00
500.00
0.00
0.00
475.01
470.00
470.00
472.61
100.00% 484.04
472.61 92.93%
0.00
0.00
0.00
0.00
0.00
0.00
2,929.42
1,315.18
86.17
4,330.77 3,074,800
61,175
933,760
2,079,865
0
0
0
0
0
0
0.00 0
0.00 0
0.00 0
0.00 0
0.00 0
0.00 0
0.00 0
0.00 0
0.00% 0.00 0.00%
0.00% 0.00 0.00%
0.00% 0.00 0.00% 0.00% 0.00 0.00%
0.00% 0.00 0.00%
0.00% 0.00 0.00%
0.00% 0.00 0.00% 0.00% 0.00 0.00%
67.64% 709.99 67.64% 0.00% 0.00 0.00%
0.00% 0.00 0.00%
0.00% 0.00 0.00%
1.99% 709.93 1.99%
30.37% 709.99 30.37%
0.00% 0.00 0.00%
0.00% 0.00 0.00%
100.00% 100.00% 709.99
0.00% 0.00%
4.82%
0.00% 0.00
0.00
709.99 7.07%
0.00% 0.00 0
4,330.77 3,074,800
51 Keith Page 49

3Market AreaSchedule XIII : Agricultural Records : Grass Land Detail By Market Area
2020 County Abstract of Assessment for Real Property, Form 45Keith51County
87. 1G1
ValueAcres
88. 1G
89. 2G1
90. 2G
91. 3G1
92. 3G
93. 4G1
94. 4G
95. Total
96. 1C1
97. 1C
98. 2C1
99. 2C
100. 3C1
101. 3C
102. 4C1
103. 4C
104. Total
105. 1T1
106. 1T
107. 2T1
108. 2T
109. 3T1
110. 3T
111. 4T1
112. 4T
113. Total
Pure Grass
CRP
Timber
114. Market Area Total 23,909,945 46,133.20
20,326,870 41,086.57
1,320,815 2,751.72
5,705,865 11,887.17
10,785,810 21,571.62
0 0.00
886,070 1,772.14
27,285 54.57
0 0.00
1,601,025 3,049.35
% of Acres* % of Value*
7.42%
0.00%
4.31%
0.13%
0.00%
52.50%
6.70%
28.93%
100.00%
Grass TotalCRP Total
Timber Total
41,086.57 20,326,870 89.06%
100.00%
Average Assessed Value*
0.00%
7.88%
0.13%
4.36%
0.00%
53.06%
28.07%
6.50%
100.00%
525.04
0.00
500.00
500.00
0.00
500.00
480.00
480.00
494.73
100.00% 518.28
494.73 85.01%
0.00
161.00
0.00
16.06
0.00
0.00
4,010.25
767.24
92.08
5,046.63 3,583,075
65,380
544,730
2,847,255
0
0
11,405
0
114,305
0
0.00 0
0.00 0
0.00 0
0.00 0
0.00 0
0.00 0
0.00 0
0.00 0
0.00% 0.00 0.00%
3.19% 709.97 3.19%
0.00% 0.00 0.00% 0.00% 0.00 0.00%
0.00% 0.00 0.00%
0.32% 710.15 0.32%
0.00% 0.00 0.00% 0.00% 0.00 0.00%
79.46% 709.99 79.46% 0.00% 0.00 0.00%
0.00% 0.00 0.00%
0.00% 0.00 0.00%
1.82% 710.03 1.82%
15.20% 709.99 15.20%
0.00% 0.00 0.00%
0.00% 0.00 0.00%
100.00% 100.00% 709.99
0.00% 0.00%
10.94%
0.00% 0.00
0.00
709.99 14.99%
0.00% 0.00 0
5,046.63 3,583,075
51 Keith Page 50

2020 County Abstract of Assessment for Real Property, Form 45
51 KeithCompared with the 2019 Certificate of Taxes Levied Report (CTL)
2019 CTL
County Total
2020 Form 45
County Total
Value Difference Percent
Change
2020 Growth Percent Change
excl. Growth
495,472,160
20,860,830
01. Residential
02. Recreational
03. Ag-Homesite Land, Ag-Res Dwelling
04. Total Residential (sum lines 1-3)
05. Commercial
06. Industrial
07. Total Commercial (sum lines 5-6)
08. Ag-Farmsite Land, Outbuildings
09. Minerals
10. Non Ag Use Land
11. Total Non-Agland (sum lines 8-10)
12. Irrigated
13. Dryland
14. Grassland
15. Wasteland
16. Other Agland
18. Total Value of all Real Property
(Locally Assessed)
(2020 form 45 - 2019 CTL) (New Construction Value)
49,916,840
566,249,830
121,409,615
5,302,405
126,712,020
36,877,005
138,830
43,680
37,059,515
411,377,910
123,654,105
188,776,715
155,800
8,389,260
732,353,790
588,099,850
28,077,630
56,978,110
673,155,590
130,861,600
7,763,650
138,625,250
43,269,920
138,830
44,625
43,453,375
392,650,730
118,187,135
188,257,985
400,150
9,944,110
709,440,110
92,627,690
7,216,800
7,061,270
106,905,760
9,451,985
2,461,245
11,913,230
6,392,915
0
945
6,393,860
-18,727,180
-5,466,970
-518,730
244,350
1,554,850
-22,913,680
18.69%
34.59%
14.15%
18.88%
7.79%
46.42%
9.40%
17.34%
0.00
2.16%
17.25%
-4.55%
-4.42%
-0.27%
156.84%
18.53%
-3.13%
11,992,588
0
12,215,933
4,379,690
0
4,379,690
525,360
0
34.59%
16.27%
13.70%
16.72%
4.18%
46.42%
5.95%
15.91%
0.00%
223,345
17. Total Agricultural Land
1,462,375,155 1,564,674,325 102,299,170 7.00% 17,120,983 5.82%
525,360 15.84%
51 Keith Page 51
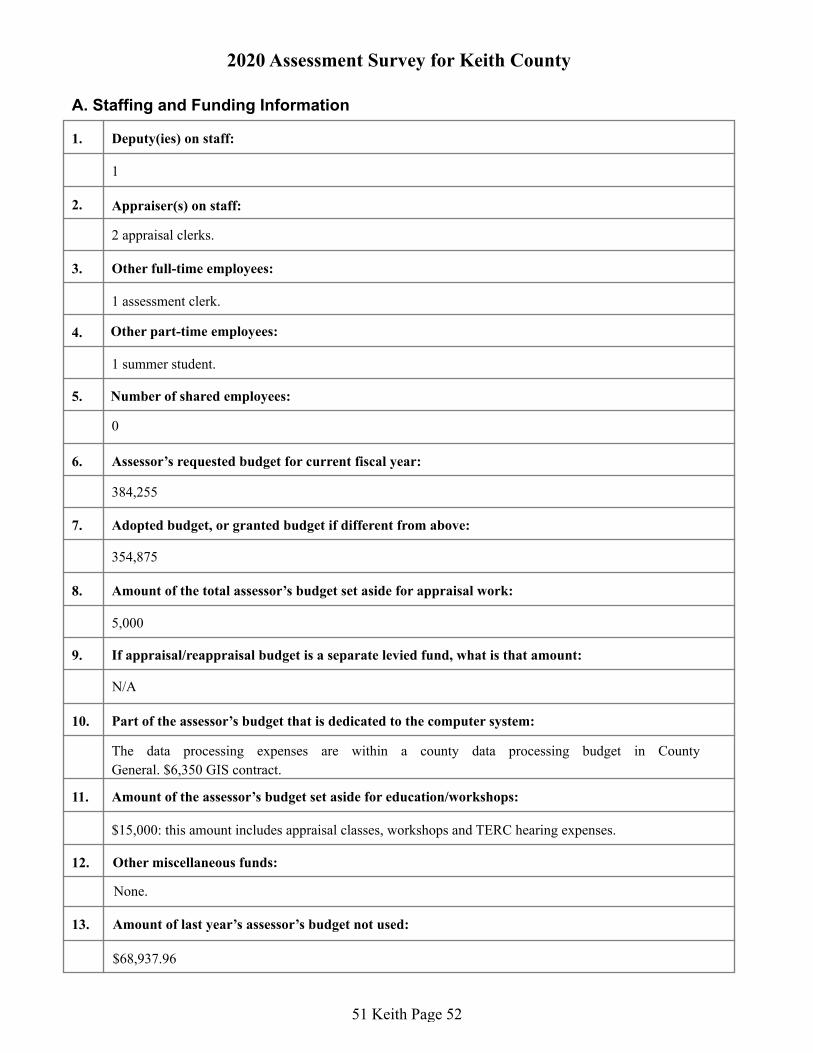
2020 Assessment Survey for Keith County
A. Staffing and Funding Information
1. Deputy(ies) on staff:
1
2. Appraiser(s) on staff:
2 appraisal clerks.
3. Other full-time employees:
1 assessment clerk.
4. Other part-time employees:
1 summer student.
5. Number of shared employees:
0
6. Assessor’s requested budget for current fiscal year:
384,255
7. Adopted budget, or granted budget if different from above:
354,875
8. Amount of the total assessor’s budget set aside for appraisal work:
5,000
9. If appraisal/reappraisal budget is a separate levied fund, what is that amount:
N/A
10. Part of the assessor’s budget that is dedicated to the computer system:
The data processing expenses are within a county data processing budget in County
General. $6,350 GIS contract.
11. Amount of the assessor’s budget set aside for education/workshops:
$15,000: this amount includes appraisal classes, workshops and TERC hearing expenses.
12. Other miscellaneous funds:
None.
13. Amount of last year’s assessor’s budget not used:
$68,937.96
51 Keith Page 52

B. Computer, Automation Information and GIS
1. Administrative software:
MIPS
2. CAMA software:
MIPS
3. Are cadastral maps currently being used?
Yes, as historic research work.
4. If so, who maintains the Cadastral Maps?
These were maintained through December 31, 2012.
5. Does the county have GIS software?
Yes
6. Is GIS available to the public? If so, what is the web address?
Yes. www.keith.gWorks.com
7. Who maintains the GIS software and maps?
gWorks
8. What type of aerial imagery is used in the cyclical review of properties?
gworks imagery
9. When was the aerial imagery last updated?
2018
10. Personal Property software:
MIPS
C. Zoning Information
1. Does the county have zoning?
Yes, for both city and county.
2. If so, is the zoning countywide?
Yes
51 Keith Page 53

3. What municipalities in the county are zoned?
Ogallala, Brule, and Paxton are zoned.
4. When was zoning implemented?
1975
D. Contracted Services
1. Appraisal Services:
None.
2. GIS Services:
gWorks (f.k.a. GIS Workshop)
3. Other services:
None.
E. Appraisal /Listing Services
1. Does the county employ outside help for appraisal or listing services?
None at present.
2. If so, is the appraisal or listing service performed under contract?
N/A
3. What appraisal certifications or qualifications does the County require?
The county requires a credentialed real property appraiser.
4. Have the existing contracts been approved by the PTA?
N/A
5. Does the appraisal or listing service providers establish assessed values for the county?
N/A
51 Keith Page 54

2020 Residential Assessment Survey for Keith County
1. Valuation data collection done by:
Assessor and staff.
2. List the valuation group recognized by the County and describe the unique characteristics of
each:
Description of unique characteristicsValuation
Group
1 City of Ogallala - the county seat and primary provider of services.
2 Village of Paxton approximately 20 miles east of Ogallala, the economy is somewhat
stable. But nearest major service providers would be in either Ogallala to the west or
North Platte to the east.
3 Village of Brule approximately 7 miles west of Ogallala, the economy is somewhat
stable. Major service provider would be Ogallala or larger towns further to the east or
west.
4 Rural - parcels located outside the City or Village limits and excluding Lake
McConaughy. Also includes neighborhoods 9021 and 9037 (previously were valued as
in Lake area, but in reality are rural).
5 Lake McConaughy - recreational properties and "K' areas (IOLL's)
8 Villages of Keystone, Roscoe and Sarben - small villages with stale to no economic
activity.
AG Homes and outbuildings on rural residential and agricultural parcels.
3. List and describe the approach(es) used to estimate the market value of residential
properties.
The cost approach is used for determining market value for residential property.
4. For the cost approach does the County develop the deprecation study(ies) based on the local
market information or does the county use the tables provided by the CAMA vendor?
Neighborhoods are reviewed and market data is used to develop depreciation models. Tables are
then entered into the CAMA.
5. Are individual depreciation tables developed for each valuation group?
Yes, and with the 6-year review and inspection cycle will be updating the depreciation models and
the land tables in the CAMA system.
6. Describe the methodology used to determine the residential lot values?
A sales analysis of the land is derived from the local market per neighborhood and valuation
grouping.
7. How are rural residential site values developed?
51 Keith Page 55

The assessor considers the cost of amenities to improve the site, such a well, septic system and
leach field based on servicing the typical three-bedroom home. The cost of these amenities is
considered to be 20,000. Thus a $10,000 home site with above amenities would be $30,000 (on a
parcel with 1 acre only). In the country club area, the vacant first acre of land would be $23,000.
8. Are there form 191 applications on file?
Yes
9. Describe the methodology used to determine value for vacant lots being held for sale or
resale?
The methodology used to determine value for vacant lots being held for sale or resale requires a
discounted cash flow analysis for the subdivision being developed. Things to look at are estimated
time to sell off the lots, average sale price of the lots, expenses and developing a discount rate.
10. Valuation
Group
Date of
Costing
Date of
Lot Value Study
Date of
Last Inspection
Date of
Depreciation Tables
1 2018 2018 2018 2015
2 2018 2018 2018 2016
3 2018 2018 2018 2016
4 2018 2018 2018-2019 2017-2018
5 2019 2019 2019 2019
8 2016 6/2016 2016 2016
AG 2018 2018 2018 2017-2018
51 Keith Page 56

2020 Commercial Assessment Survey for Keith County
1. Valuation data collection done by:
Assessor, staff and Tax Valuation Inc.
2. List the valuation group recognized in the County and describe the unique characteristics of
each:
Description of unique characteristicsValuation
Group
1 City of Ogallala - the county seat and primary provider of services.
2 Village of Paxton approximately 20 miles east of Ogallala, the economy is somewhat stable.
The nearest major service providers would be Ogallala to the west or North Platte to the east.
3 Village of Brule approximately 7 miles west of Ogallala, the economy is somewhat stable.
The primary service providers would be towns further to the east or west.
4 Rural - parcels located outside the City of Village limits and excluding Lake McConaughy.
5 Lake McConaughy
8 Villages of Keystone, Roscoe and Sarben - small villages with stale or no economic activity.
3. List and describe the approach(es) used to estimate the market value of commercial
properties.
The cost approach is primarily used for determining market value for commercial property.
3a. Describe the process used to determine the value of unique commercial properties.
The assessor has taken several classes and would value unique properties in house if possible. If
needed, the assessor would hire an independent appraiser.
4. For the cost approach does the County develop the deprecation study(ies) based on the local
market information or does the county use the tables provided by the CAMA vendor?
Depreciation tables are developed from the market study during the six-year review.
5. Are individual depreciation tables developed for each valuation grouping?
Ogallala is on their own depreciation table while the other valuation groups share a depreciation
table. The land values vary by location to capture the differences in the market
6. Describe the methodology used to determine the commercial lot values.
Market data is used to establish the lot values.
51 Keith Page 57
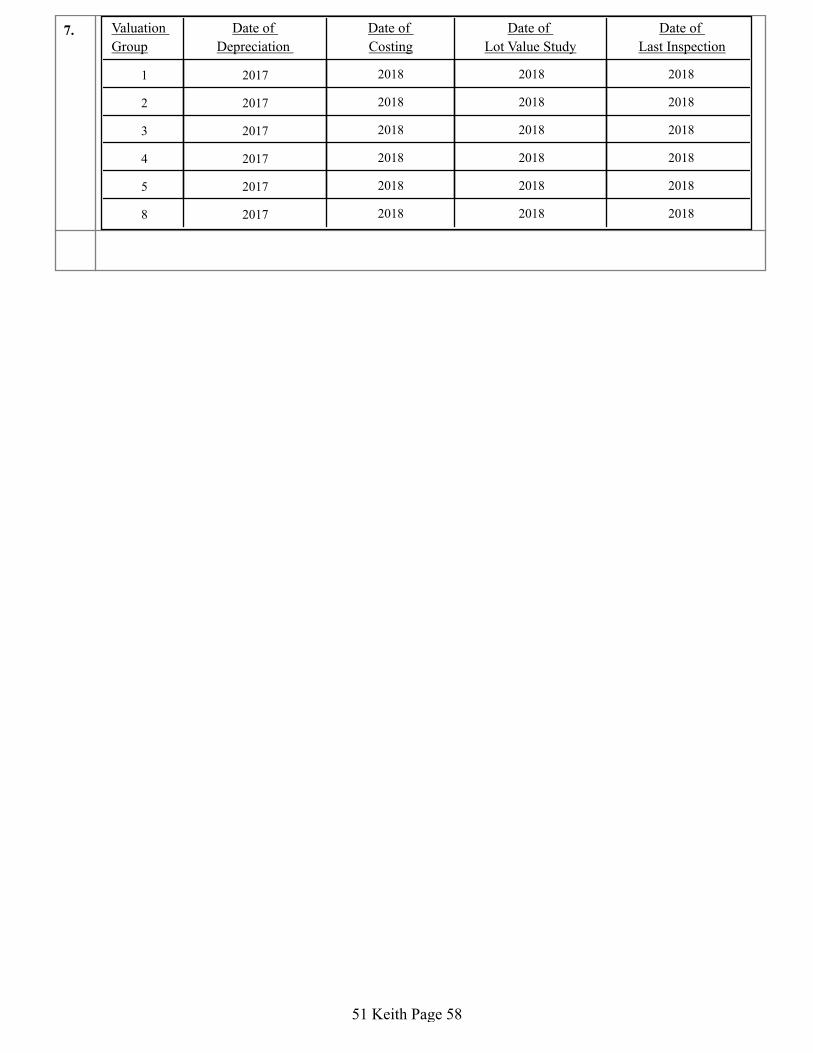
7. Date of
Depreciation
Valuation
Group
Date of
Costing
Date of
Lot Value Study
Date of
Last Inspection
1 2017 2018 2018 2018
2 2017 2018 2018 2018
3 2017 2018 2018 2018
4 2017 2018 2018 2018
5 2017 2018 2018 2018
8 2017 2018 2018 2018
51 Keith Page 58

2020 Agricultural Assessment Survey for Keith County
1. Valuation data collection done by:
Assessor and staff.
2. List each market area, and describe the location and the specific characteristics that make
each unique.
Year Land Use
Completed
Description of unique characteristicsMarket
Area
1 Market Area 01 is in the northern part of Keith County; north of the North
Platte River and Lake McConaughy. It is part of the Nebraska Sand Hill
region that consists primarily of native grasses suitable for grazing. There
is a limited amount of cropland in this area. Travel is by county roads,
Highway 92 that runs along the north side of Lake McConaugy and
Highway 61 that runs north to south across the county. The Union Pacific
Railroad maintains two lines that run east to west along the north side of
the lake.
2017-2018
2 Market Area 02 is south of the North Platte River and Lake McConuaghy
but, north of the South Platte River. This land begins as a plateau that
descends southerly down into the Platte River Valley. The area comprises
approximately two-thirds hard grass, one-third dry land and a small
percent of irrigation. Highway 26 goes northwest out of Ogallala and a
small portion of Highway 61 goes across it.
2017-2018
3 Market Area 03 includes the South Platte River and goes to the southern
boundary of the county. Highway 30 and Interstate 80 run east to west
through this area, along with the Union Pacific Railroad. The area is
approximately 43% irrigated, dry and grass making up about 29% and
24% respectively.
2017-2018
Every two years the county reviews aerial imagery for land use. Additionally, the county
physically inspects all parcels in the course of their six-year review.
3. Describe the process used to determine and monitor market areas.
GIS maps, topography and comparable maps of surrounding counties help to identify the unique
characteristics that drive the market in each of these areas.
4. Describe the process used to identify rural residential land and recreational land in the
county apart from agricultural land.
The actual use of the parcel is determined by physical reviews which identify the classification
of either rural residential or agricultural land.
5. Do farm home sites carry the same value as rural residential home sites? If not what
methodology is used to determine market value?
Yes
6. What separate market analysis has been conducted where intensive use is identified in the
county?
Commercial feedlots were updated during the rural review. Buildings and structures were priced
out in the same manner as ag and rural residential outbuildings. The assessor completed a market
analysis and left the feedlot acres at the prior value of $1,375.
51 Keith Page 59

7. If applicable, describe the process used to develop assessed values for parcels enrolled in the
Wetland Reserve Program.
An analysis is done of the sales and if availaible, the contracts will be examined as well, to try
and establish a value for the WRP acres.
If your county has special value applications, please answer the following
8a. How many parcels have a special valuation application on file?
346
8b. What process was used to determine if non-agricultural influences exist in the county?
Market data of sales with similar influences are analyzed.
If your county recognizes a special value, please answer the following
8c. Describe the non-agricultural influences recognized within the county.
Recreational, primarily used for hunting.
8d. Where is the influenced area located within the county?
Primarily along the North and South Platte Rivers,
8e. Describe in detail how the special values were arrived at in the influenced area(s).
It is a sales comparison approach, the sales are verified and the market data is analyzed to arrive
at a market value in the influenced area.
51 Keith Page 60

Plan of Assessment Requirements
PLAN OF ASSESSMENT
FOR
KEITH COUNTY
Pursuant to Neb. Rev. Stat. §77-1311.02, on or before June 15 of each year, the assessor shall prepare a plan of assessment, (herein after referred to as the "plan"), which describes the assessment actions planned for the next assessment year and two years thereafter. The plan shall indicate the classes or subclasses of real property that the county assessor plans to examine during the years contained in the plan of assessment. The plan shall describe all the assessment actions
necessary to achieve the levels of value and quality of assessment practices required by law, and the resources necessary to complete those actions. On or before July 31 of each year, the assessor shall present the plan to the county board of equalization and the assessor may amend the plan, if necessary, after the budget is approved by the county board. A copy of the plan and any amendments thereto shall be mailed to the Department of Revenue, Property Assessment Division,
on or before October 31 of each year.
Real Property Assessment Requirements
All property in the State of Nebraska is subject to property tax unless expressly exempt by the Nebraska Constitution, Article VIII, or permitted by the constitution and enabling legislation adopted by the legislature. The uniform standard for the assessed value of real property for tax purposes is called actual value, which is defined by law as "the market value of real property in
the ordinary course of trade." Neb. Rev. Stat. §77-112 (2003).
Assessment levels required for real property are as follows:
1) 100% of actual value for all classes of real property excluding agricultural and horticultural
land;2) 75% of actual value for agricultural land and horticultural land; and
3) 75% of special value for agricultural and horticultural land which meets the qualificationsfor special valuation under §77-1344.
See Neb. Rev. Stat. §77-201 (2009).
General Description of Real Property in Keith County
Per the 2019 Abstract, Keith County consists of the following real property types:
Residential
Commercial
Industrial
Recreational
Agricultural
Minerals
Parcels
5,194
706
15
792
2,425
63
% of Total
Parcels
56.49%
7.67%
0.16%
8.61%
26.37%
68.00%
%of
Taxable Value Base Value
494,602,420 33.72%
122,804,880 11.05%
5,298,790 3.61%
20,920,885 1.42%
822,941,835 56.11%
138,830 0.00%
51 Keith Page 61

Sub Total Exempt
Game and Parks
Total Special Value
Tax Increment Financing
9,195
672
5
9,872 250
30
1.67303 1,466,707,640
7.3 0
0.05 0
9.02303 1,466,707,640
25,905,195
Total Valuation excluding TIF Excess j 1,440,802,445.00
Agricultural Land Use Irrigated
Dry
Grass
Waste
Other (primarily Accretion)
Sub-Total Land Only Ag Home Sites
Ag Farm Sites
Improvements
Public Road/Ditches
Sub-Total Sites+ IMPS Total Agricultural Valuation
Acres 112,581.76
105,546.87
403,884.04
561.75
14,126.14
636,700.56 377.00
350.63
87.13
814.76 637,515.32
Value 411,415,160
123,614,365
188,815,845
155,800
8,349,095
732,350,265 11,310,000
2,629,710
76,608,180
43,680
90,591,570.00 822,941,835
105.91%
0.00%
0.00%
105.91%
All of this and more information can be found in the 2019 County Abstract of Assessment for Real Property, Form 45
While the Agricultural parcel count consists of less than half of the Residential parcel count, the Agricultural total valuations are almost twice the valuation of the Residential total valuation. As you can see from the acre count and values listed above, the majority of Agricultural land use consists of Grassland. The majority of the Grassland lies in the northern region of Keith County, which is north of Lake Mcconaughy and the North Platte River in Area 1. The Irrigated acres consist of a little over a fourth of the Grassland acres. Irrigated Land Market total valuation of Irrigated land is more than double the valuation of the total Grassland valuation for 2019. However, we were able to hold agricultural values this year and nothing increased or decreased. Dry land consists of slightly.less acres than Irrigated and it comprises the least amount of valuation per use. Dryland Acres were historically more than the Irrigated Acres. This change is due to the Well
51 Keith Page 62

Moratorium and in 2011, there was a shift when Irrigated Acres exceeded the Dryland Acres. Despite the Moratorium, producers are still able, with the approval of the Twin Platte NRD, to convert their Dryland or Grassland Acres to Irrigated. There are many requirements that must be met prior to approval by the NRD. With the high grain prices, Irrigated Acres were quite desirable, therefore, property owners requested transfer of acres from one location to another location so they are able to utilize their "right to irrigate" in a more productive way. In some cases they transfer acres into a bank with the NRD and wait until they have banked enough acres to drop a new pivot in another location. Some property owners are also buying the Certified Irrigated Acres (CIA), without the land attached, from the land owner; which allows them to move the Certified Irrigated Acres to former Dry or Grass land. All transfers and new wells must be approved by the NRD. The NRD works well with the Keith County Assessor Office on all transfers t9 ensure accuracy of acre counts on correct parcels.
The first year that market value on Accretion was implemented in Keith County was in 2007. This was when all of the county was reviewed and was again reviewed in 2011. We currently review properties with accretion and use the Special Value Methodology when reviewing accretion properties.
New Property: For the assessment year of 2019, approximately 233 building permits for new property/construction/additions, and 268 parcels to be rechecked from the year before. That could be from new homes not being finished at the first of the year the prior year, discovery, and interior inspections from property owners. Additional parcels were reviewed for new property construction/additions in Keith County due to other forms of discovery than building permit reporting. Unfortunately, Keith County now does require building permits for our Agricultural zoned parcels to be completed and filed with the zoning department. In the fall of 2017, GIS Workshop flew Keith County for oblique imagery to assist us with identification and a remedy to this issue of new construction in the rural areas. For more information see 2019 Reports & Opinion, Abstract and Assessor Survey
Current Resources
A. Staff/Budget/Training: 1 Assessor, 1 Deputy, 2 Appraisal Clerks, 1 Summer FulltimeStudent Appraisal Clerk, 1 Assessment Clerk/office manager,
The current Assessor has her Appraiser license and is current with required continuededucation classes and is working to meet all of the required continuing education for theAssessor Certificate. The assessor and deputy attend workshops, classes, and meetings tofurther our knowledge of the assessment field and to receive continuing education for ourlicenses. For the 2019 Assessment year, we have 2 new appraisal clerks Alex Simmermanand Sadie Schwartzkopf. This is our second year with our student summer position. She isclassified in the appraisal field working with our appraisal clerks. The Other AssessmentClerk/office manager stays busy with Homestead, 521 's and sales letters and anything elseneeded done in the office ..
51 Keith Page 63

The adopted budget for 2018-2019 was $344,255, the actual expense used was $275,287.04. The budget for 2019-2020 has been requested at $384.255. The adopted budget has been approved at $354,875.
B. Pursuant to Neb. Rev. Stat. §77-1329 the Assessor shall maintain tax maps. We arecontracted with GWORKS and they help us to maintain our maps and mapping systems.
C. Property Record Cards: Our property record files are electronically generated. Wehaven't updated hard cards for years.
D. Software for CAMA, Assessment Administration, and GIS: Keith County is on theMIPS CAMA system package. GWORKS provides the software for the web based GISsystem.
E. Web based :-- property record information access:
www .keith.gworks.com and nebraskaassessorsonline.us
Current Assessment Procedures for Real Property
A. Discover, list & inventory all property.B. Data collection.C. Review assessment sales ratio studies before assessment actions.D. All approaches to value are looked at. However, the Cost Approach bears the most
weight.E. Land valuation studies, establish market areas, special value for agricultural land:
Reconciliation of final value and documentation.
F. Review assessment sales ratio studies after assessment actions.G. Notices and public relations are completed by the County Assessor.
Level of Value, Quality, and Uniformity for assessment year 2015
PROPERTY CLASS MEDIAN RA TIO COD* Residential 93% 19.70% Commercial 93% 13.12% Agricultural 70% 13.31% Special Value Agricultural 70%
PRD* 106.67% 113.31 % 102.27%
*COD means Coefficient of Dispersion and PRD means Price Related Differential. For more information regardingstatistical measures see 2019 Reports & Opinions.
Assessment Actions Planned for Assessment Year 2020
Residential (05 and/or subclasses): For Assessment year 2020 our complete reappraisal will be on the Lake (residential subclass 05). This will include the K-Areas as well as all of the lake mobile home parks. Included in this review we will be reviewing quality, condition, re-measuring all improvements, and taking new photos. Every property's sketch will be verified into the CAMA system and new land and
51 Keith Page 64

depreciation tables will be built derived from current sales. New costing tables will be updated to the current tables from Marshall and Swift. This will involve approximately 2,236 lake residential and 533 mobile home park parcels.
We will continue ratio studies of all county residential neighborhoods and sales. Possible percentage adjustments will be applied if needed.
Commercial (and/or subclasses): For the Assessment year of 2020, we will continue ratio studies of all county commercial neighborhoods and sales. Possible percentage adjustments will be applied if needed.
Agricultural Land (and/or subclasses): Each year we will continue the analysis of Ag Land Market Areas and sales. Any needed adjustments will be made in the price per acre. We also are planning on reviewing home site and farm site values this year. Land use will be updated per FSA maps received as well as increase or decreasing the home and farm site acreage measurements. Sales will determine if they need adjusted. We will continue to process all irrigation transfers of Certified Base Areas approved by the NRD, map all new splits and subdivisions, process all NRD transfer of irrigated acres, utilize NRD maps to identify irrigated land use, request FSA Maps for use verification to all new Agland owners per Sales File and identify and remap agricultural land use changes.
Special Value-Agland: We will continue analysis of Special Valuation properties and any Agland influences for other than agriculture-horticulture use. New photographs will be taken for new agricultural/horticultural use and any changes will be documented. All sales will be reviewed and valued accordingly. We will process and send disqualification letters to all owners not meeting
qualifications per our special valuation methodology.
New Construction/Building Permits: We will complete all pickup work and help value any new construction or existing building construction that wasn't completed last year. Any changes made to properties will be entered into MIPS, and updated in GIS. An analysis of sales will be reviewed for all sold properties dated October l, 2017 to September 30, 2019, Commercial and Ag from October 1, 2016 to September 30, 2019, and sales reviews will be sent to both buyer and seller. Any changes will be edited in the Property Assessment Divisions Sales File to ensure it is identical to the Assessor's CAMA sales file. We will work to complete all pickup work from all forms of Discovery by
March 1.
Assessment Actions Planned for Assessment Year 2021
Residential (Land/or subclasses): For Assessment year 2021, we will either work on completing our lake 6 year reappraisal if we aren't finished or we will be starting on Ogallala Residential. Both would be 6 year reviews and next in line with our list of what needs to be done. It we are starting our Ogallala Residential review. We have four neighborhoods in Ogallala and we did Ogallala in 2016. Since both areas are already sketched into our computer our entering time will not be as time consuming as it was
51 Keith Page 65

before and we might be able to speed through getting our reviews finished in one year. It's just hard to say since we haven't been able to accomplish that situation as of yet. Included in these reviews we will be reviewing quality, condition, re-measuring and verifying all improvements are correct, and taking new photos. Every property's sketch will be verified into the CAMA system and new land and depreciation tables will be built derived from current sales. New costing tables will b� updated to the current tables from Marshall and Swift.
We will continue ratio studies of all county residential neighborhoods and sales. Possible percentage adjustments will be applied if needed.
Commercial (and/or subclasses): For the Assessment year of 2020, we will continue ratio studies of all county commercial neighborhoods and sales. Possible percentage adjustments will be applied if needed.
Agricultural Land (and/or subclasses): Each year we will continue the analysis of Ag Land Market Areas and sales. Any needed adjustments will be made in the price per acre. Sales will determine if they need adjusted. We will continue to process all irrigation transfers of Certified Base Areas approved by the NRD, map all new splits and subdivisions, process all NRD transfer of irrigated acres, utilize NRD maps to identify irrigated land use, request FSA Maps for use verification to all new Agland owners per Sales File and identify and remap agricultural land use changes.
Special Value - Agland: We will continue analysis of Special Valuation properties and any Agland influences for other than agriculture-horticulture use. New photographs will be taken for new agricultural/horticultural use and any changes will be documented. All sales will be reviewed and valued accordingly. We will process and send disqualification letters to all owners not meeting qualifications per our special valuation methodology.
New Construction/Building Permits: We will complete all pickup work and help value any new construction or existing building construction that wasn't completed last year. Any changes made to properties will be entered into MIPS, and updated in GIS. An analysis of sales will be reviewed for all sold properties dated October 1, 2018 to September 30, 2020, Commercial and Ag from October 1, 2017 to September 30, 2020� and sales reviews will be sent to both buyer and seller. Any changes will be edited in the Property Assessment Divisions Sales File to ensure it is identical to the Assessor's CAMA sales file. We will work to complete all pickup work from all forms of Discovery by March 1.
Assessment Actions Planned for Assessment Year 2022
Residential (and/or subclasses): For Assessment year 2020, Paxton (Residential subclass 02), Brule (Residential subclass 03), Keystone, Roscoe, ·and Sarben (all Residential subclass 08) will be reviewed. Included in this review will be reviewing quality, condition, re-measuring all improvements, and taking new photos. Every property will be re-sketched into the CAMA system and new land and
51 Keith Page 66

depreciation tables will be built derived from current sales. This review will involve approximately 633 parcels.
Commercial (and/or subclasses): For Assessment year 2017, Keith County Commercial neighborhoods will be reviewed. This will consist of a two year project. They will be completing Ogallala Commercial for the first year and the rest of the county for the second year. Included in this review will be reviewing quality, condition, re-measuring all improvements, and taking new photos. Every property will be resketched into the CAMA system and new land and depreciation tables will be built derived from current sales. This review will involve approximately 694 parcels. We currently do not have a Certified General appraiser on staff, we are hiring out to Tax Valuation Inc. for services. This project is to start in August 2016.
Agricultural Land (and/or subclasses): We will continue the analysis of Ag Land Market Areas and sales. Any adjustments will be made in price per acre if needed. Sales will determine if they need adjusted. We will continue to process all Irrigation Transfers of Certified Base Areas approved by the NRD, map all new splits and subdivisions, process all NRD transfer of irrigated acres, utilize NRD maps to identify irrigated land use, request FSA Maps for use verification to all new Agland owners per Sales File, identify and remap agricultural land use changes. We will convert a new soil survey into our CAMA system from the Department also this year. GIS will be notified and will update our maps with the new soils.
Special Value-Agland: We will continue analysis of Special Valuation properties and any Agland influences for other than agriculture-horticulture use. All sales will be reviewed and valued accordingly. We will process and send disqualification letters to all owners not meeting qualifications per our special valuation methodology.
New Construction/Building Permits: We will complete all pickup work and help value any new construction or existing building construction that wasn't completed the previous year. Any changes made to properties will be entered into MIPS, and updated in GIS. An analysis of sales will be reviewed for all sold properties dated October 1, 2019 to September 30, 2021, Commercial and Ag from October 1, 2018 to September 30, 2021, and sales reviews will be sent to both buyer and seller. Any changes will be edited in the Property Assessment Divisions Sales File to insure it is identical to the Assessor's CAMA sales file. We will work to complete all pickup work from all forms of Discovery by March 1.
Other functions performed by the assessor's office, but not limited to
Record Maintenance, Mapping updates, & Ownership changes: Pursuant to Neb. Rev. Stat. §77-1303 and §77-1331. Since we were a State office, and now a county office, record maintenance has been kept current on computerized forms with reliance solely on computer generated cards since 2007. In 2010 all of our property record cards had appraisal information that supported the
51 Keith Page 67

values of the property and were completely generated by the computer system. The Appraisal and Administrative File balanced and were generated on all parcels in CAMA. Now that we have a new CAMA, the depreciation and cost tables need to be reviewed so that the Appraisal information again supports the values on the Administrative File of the Property Record Card. With the reliance on computerized record maintenance we need to be assured that CAMA stores all the annual property record cards. Property Record Cards contain the information as set forth in Regulation 10-004.04 and 10-001.10 including ownership, legal description, cadastral map reference data, parcel I.D ., property classification codes, taxing district, land information, building characteristics and annual value postings.
The sketches and appraisal information were updated in the Terra Scan CAMA; however, some of the sketches need to be redrawn as some of the sketches currently in the new CAMA did not convert accurately. For the Assessment year 2019 everything will be sketched into the MIPS CAMA system and will be table driven off of current costing tables and depreciation tables derived from the market. All information within the Appraisal File will continue to be verified for accuracy. Our goal after the review of each year will be that the Appraisal File will match the Assessment File.
All agricultural sales and land values were reviewed for all three market areas. New land values were set by soil type if changes were needed. We continue to process any irrigation transfers of certified base acres approved by the Twin Platte Natural Resource District. We continue to use the Farm Service Agency (FSA) maps provided from a request that was made in 2018, unless the owner brings in changes to the property and a new FSA map. Agricultural land received new pictures with the review of the Rural Residential and Ogallala Suburban properties in the county for our two-year project for assessment year 2019. Type of crop and irrigation was noted at this time. New soils were implemented for 2017 by reviewing the United States Department of Agricultural web soil survey map to the new soil conversion and compared with every Agland acre in the county to the current record. Changes were made accordingly.
Currently we use the GIS website GWORKS for our acre counts per soil and use, however, we do not change the total number of acres within the parcel. We have a blue line cadastral map that includes both the aerial picture and the ownership boundary lines. There are also separate pages for each subdivision filed directly behind the section map that the subdivision is located in. For each blue line cadastral map there is a corresponding page that lists Cadastral Map#, Parcel#, Ownership Name, and Legal Description.
1. Annually prepare and file Assessor Reports required by law/regulation
a. Assessor Surveyb. Sales information to PAD rosters & annual Assessed Value Update with Abstractc. Notice of Taxable Status to Governmental Entities that lease Property for other
than Public Purposed. Special Valuation Methodologye. Real Property Abstractf. Annual Plan of Assessment Reportg. Certification of Value to Political Subdivisionsh. School District Taxable Value Report
51 Keith Page 68

1. Average Assessed Value Report for Homestead ExemptionJ. Generate Tax Rollk. Certificate of Taxes Levied Report1. Homestead Exemption Tax Loss Report (in conjunction with Treasurer)
2. Updating 521/0wnership Transfers3. Permissive Exemption
4. Mobile Home Report
5. Personal Property
6. Notice of Taxable Status
7. Change of Value Notices
8. Homestead Exemptions
9. Centrally Assessed
10. Tax Increment Financing
11. Special Valuation
12. Tax Districts and Tax Rates
13. Tax Lists
14. Tax List Corrections
15. County Board of Equalization
16. TERC Appeals
17. TERC Statewide Equalization
18. Education
Conclusion
With all the entities of county government that utilize the assessor's records in their operation, it is important for us to maintain the most accurate data as possible.
We will continue to strive to be completely table driven on all areas in Keith County within five years. With the continual review of all properties and implementation of GIS, records will become more accurate and values will be assessed more equitable and uniformly across the county. With a well-developed plan in place, this process can flow more smoothly. A sales review will continue to be important in order to adjust for market areas in the county.
Respectfully submitted
� Assessor signature: <0_ � � Date /()-2 a' --/9
51 Keith Page 69

2020 Special Valuation Methodology For Keith County
Identification of the Influenced Area The Special Valuation Area is the accretion land along the North & South Platte Rivers and Lake Mc Conaughy. This area was first recognized in Assessment year 2007. This area is not in any specific Market Area as it is located within each of the three Agricultural Market Areas.
The highest and best use of Properties in the Influenced Area The highest and best use of the accretion market area is for recreational use. The Special Valuation Area was determined by market trends as the majority of all the agricultural properties that have sold along either river have been purchased for residential living and/or recreational use. The highest and best use is legally permitted, physically possible, economically feasible, and the most profitable. Every parcel with accretion was reviewed. If the parcel contained more accretion acres than deeded acres we then looked at adjoining parcels to identify adjoining parcels with the same ownership as the parcel with accretion. If the total acres of adjoining parcels contained more deeded acres used for agricultural purpose, than accretion areas; these parcels were determined to be primarily agricultural purpose and therefore, are allowed Special Valuation. If the total deeded acres used for agricultural purpose, is a small difference than the accretion acres, these parcels were determined to be primarily agricultural purpose and therefore, are allowed Special Valuation. If the Accretion Acres contain some acres used for agricultural purpose, then these acres are valued as all other land of similar use and considered agricultural purpose and added to the deeded acres to determine whether a parcel is primarily agricultural purpose. Parcels with slivers or small tracts of deeded land lying adjacent to larger accretion acres are not typical agricultural land in Keith County and are considered food plots or wildlife forage. Also, putting a few head of horses or cattle for a few months a year on these parcels with more accretion acres, does not qualify the parcel as being used primarily for agricultural purpose. After inspection, it was determined that the primary use of parcels with slivers or small tracts lying adjacent to larger accretion acres on the same parcel; or a few head of livestock for a few months annually, is not considered agricultural production in Keith County. Parcels determined as not being primarily used for agricultural purposes were sent Disqualification Letters.
Valuation Models Used for Value Estimates
The valuation models used in these areas are unit comparison or value per acre. The models were created by using sold properties with accretion acres that were influenced by other than agricultural use. This Special Valuation Area was selected because the sold properties were not reflecting the true agricultural market. This Special Valuation Area was developed to define a market trend for agricultural parcels being used for residential or recreational use within Keith County
Market areas Analyzed-In County and out of County
All three market areas within Keith County area analyzed on an annual basis. Market trends are analyzed and sales within the Special Valuation area are used to determine the areas and market value.
51 Keith Page 70

We have also reviewed adjoining counties, Garden and Lincoln, Special Valuation Areas and their Valuation Methodology.
Adjustments made to Sales to reflect current cash equivalency of typical market conditions
We have not adjusted the sales. Typically the most recent sales reflect current cash equivalency. We rely on the most recent sales in determining value.
Estimates of Economic Rent or Net Operating Income
We have not studied rents for these properties. Typically actual income information is not readily available to our office.
Typical Expenses Allowed in Income Capitalization Approach
We have not studied the income approach for these properties. Typically actual income information is not readily available to our office.
Overall Capitalization Rate used in Income Capitalization Approach
We have not studied the income approach for these properties. Typically actual income information is not readily available to our office.
Other Supporting Information for the estimate of Special Value
Market trends for agricultural land in Keith County have been highly influenced by residential and recreational uses due to Lake McConaughy, the North Platte River and the South Platte River. This area is primarily agricultural parcels. The Special Valuation Market Area is determined by current sales within Keith County. The Special Value Methodologies are used to value agricultural land that is influenced by market factors other than purely agricultural or horticultural purposes. The Keith County Assessment office maintains a file of all data used for determining the special and actual valuation. This file shall be available for inspection at the Keith County Assessor Office by any interested person. Our Special Valuation area is currently being reviewed. Special valuation properties as well as all vacant agland in the county is included in a three year project. In 2019, we physically took pictures of all of the vacant land and special valuation land in the county. This year we started reviewing each parcel with our GIS website and are sketching out shelterbelts, trees, home sites, farm sites, and reviewing the acres by soil type. These are being compared with FSA maps that have been provided from the property owners or lessee’s of the property. We are currently half way through and this study will be finished for assessment year for 2021. Submitted by Renae Zink Keith County Assessor
51 Keith Page 71