Embed Size (px)
Citation preview

2021 REPORTS AND OPINIONS
OF THE PROPERTY TAX ADMINISTRATOR
FRONTIER COUNTY

April 7, 2021 Commissioner Hotz : The Property Tax Administrator has compiled the 2021 Reports and Opinions of the Property Tax Administrator for Frontier County pursuant to Neb. Rev. Stat. § 77-5027. This Report and Opinion will inform the Tax Equalization and Review Commission of the level of value and quality of assessment for real property in Frontier County. The information contained within the County Reports of the Appendices was provided by the county assessor pursuant to Neb. Rev. Stat. § 77-1514.
For the Tax Commissioner Sincerely,
Ruth A. Sorensen Property Tax Administrator 402-471-5962 cc: Regina Andrijeski, Frontier County Assessor
32 Frontier Page 2

Table of Contents
2021 Reports and Opinions of the Property Tax Administrator:
Certification to the Commission Introduction County Overview Residential Correlation Commercial Correlation Agricultural Land Correlation Property Tax Administrator’s Opinion
Appendices:
Commission Summary
Statistical Reports and Displays:
Residential Statistics Commercial Statistics Chart of Net Sales Compared to Commercial Assessed Value Agricultural Land Statistics Table-Average Value of Land Capability Groups Special Valuation Statistics (if applicable)
Market Area Map Valuation History Charts
County Reports:
County Abstract of Assessment for Real Property, Form 45 County Abstract of Assessment for Real Property Compared to the Prior Year Certificate of Taxes Levied (CTL) Assessor Survey Three-Year Plan of Assessment Special Value Methodology (if applicable) Ad Hoc Reports Submitted by County (if applicable)
32 Frontier Page 3

Introduction
Pursuant to Neb. Rev. Stat. § 77-5027, annually, the Property Tax Administrator (PTA) shall prepare and deliver to each county assessor and to the Tax Equalization and Review Commission (Commission) the Reports and Opinions (R&O). The R&O contains statistical and narrative reports informing the Commission of the certified opinion of the PTA regarding the level of value and the quality of assessment of the classes and subclasses of real property in each county. In addition, the PTA may make nonbinding recommendations for class or subclass adjustments for consideration by the Commission.
The statistical and narrative reports in the R&O provide an analysis of the assessment process implemented by each county to reach the levels of value and quality of assessment required by Nebraska law. The PTA’s opinion of the level of value and quality of assessment in each county is a conclusion based upon all the data provided by the county assessor and information gathered by the Nebraska Department of Revenue, Property Assessment Division (Division) regarding the assessment activities in the county during the preceding year.
The statistical reports are developed using the statewide sales file that contains all transactions as required by Neb. Rev. Stat. § 77-1327. From this sales file, the Division prepares a statistical analysis comparing assessments to sale prices for arm’s-length sales (assessment sales ratio). After analyzing all available information to determine that the sales represent the class or subclass of real property being measured, inferences are drawn regarding the level of assessment and quality of assessment of that class or subclass of real property. The statistical reports contained in the R&O are developed based on standards developed by the International Association of Assessing Officers (IAAO).
The analysis of assessment practices in each county is necessary to give proper context to the statistical inferences from the assessment sales ratio studies and the overall quality of assessment in the county. The assessment practices are evaluated in the county to ensure professionally accepted mass appraisal methods are used and that those methods will generally produce uniform and proportionate valuations.
The PTA considers the statistical reports and the analysis of assessment practices when forming conclusions on both the level of value and quality of assessment. The consideration of both the statistical indicators and assessment processes used to develop valuations is necessary to accurately determine the level of value and quality of assessment. Assessment practices that produce a biased sales file will generally produce a biased statistical indicator, which, on its face, would otherwise appear to be valid. Likewise, statistics produced on small, unrepresentative, or otherwise unreliable samples, may indicate issues with assessment uniformity and assessment level – however, a detailed review of the practices and valuation models may suggest otherwise. For these reasons, the detail of the PTA’s analysis is presented and contained within the Residential, Commercial, and Agricultural land correlations of the R&O.
32 Frontier Page 4

Statistical Analysis:
Before relying upon any calculated statistical measures to evaluate a county assessor’s assessment performance, the Division must evaluate whether the statistical sample is both representative of the population and statistically reliable. A statistically sufficient reliable sample of sales is one in which the features of the sample contain information necessary to compute an estimate of the population. To determine whether the sample of sales is sufficient in size to evaluate the class of real property, measures of reliability are considered, such as the coefficient of dispersion (COD) or the width of the confidence interval. Generally, the broader the qualitative measures, the more sales will be needed to have reliability in the ratio study. A representative sample is a group of sales from a larger population of parcels, such that statistical indicators calculated from the sample can be expected to reflect the characteristics of the sold and unsold population being studied. The accuracy of statistics as estimators of the population depends on the degree to which the sample represents the population. Since multiple factors affect whether a sample is statistically sufficient, reliable, and representative, single test thresholds cannot be used to make determinations regarding sample reliability or representativeness.
For the analysis in determining a point estimate of the level of value, the PTA considers three measures as indicators of the central tendency of assessment: the median ratio, weighted mean ratio, and mean ratio. The use and reliability of each measure is based on inherent strengths and weaknesses which are the quantity and quality of the information from which it was calculated and the defined scope of the analysis.
The median ratio is considered the most appropriate statistical measure to determine a level of value for direct equalization, which is the process of adjusting the values of classes or subclasses of property in response to an unacceptable required level of value. Since the median ratio is considered neutral in relationship to either assessed value or selling price, adjusting the class or subclass of properties based upon the median measure will not change the relationships between assessed value and level of value already present in the class of property. Additionally, the median ratio is less influenced by the presence of extreme ratios, commonly called outliers, which can skew the outcome in the other measures.
The weighted mean ratio best reflects a comparison of the fully assessable valuation of a jurisdiction, by measuring the total assessed value against the total of selling prices. The weighted mean ratio can be heavily influenced by sales of large-dollar property with extreme ratios.
The mean ratio is used as a basis for other statistical calculations, such as the Price Related Differential (PRD) and Coefficient of Variation (COV). As a simple average of the ratios, the mean ratio has limited application in the analysis of the level of value because it assumes a normal distribution of the data set around the mean ratio with each ratio having the same impact on the
32 Frontier Page 5

calculation regardless of the assessed value or the selling price.
The quality of assessment relies in part on statistical indicators as well. If the weighted mean ratio, because of its dollar-weighting feature, is significantly different from the mean ratio, it may be an indication of disproportionate assessments. Assessments are disproportionate when properties within a class are assessed at noticeably different levels of market value. The coefficient produced by this calculation is referred to as the PRD and measures the assessment level of lower-priced properties relative to the assessment level of higher-priced properties.
The Coefficient of Dispersion (COD) is a measure also used in the evaluation of assessment quality. The COD measures the average absolute deviation calculated about the median and is expressed as a percentage of the median. A COD of 15% indicates that half of the assessment ratios are expected to fall within 15% of the median. The closer the ratios are grouped around the median the more equitable the property assessments tend to be.
The confidence interval is another measure used to evaluate the reliability of the statistical indicators. The Division primarily relies upon the median confidence interval, although the mean and weighted mean confidence intervals are calculated as well. While there are no formal standards regarding the acceptable width of such measure, the range established is often useful in determining the range in which the true level of value is expected to exist. Pursuant to Neb. Rev. Stat. §77-5023, the acceptable range is 69% to 75% of actual value for agricultural land and 92% to 100% for all other classes of real property.
Nebraska law does not provide for a range of acceptability for the COD or PRD; however, the IAAO Standard on Ratio Studies establishes the following range of acceptability for the COD:
A COD under 5% indicates that the properties in the sample are either unusually homogenous, or possibly indicative of a non-representative sample due to the selective reappraisal of sold parcels. The IAAO utilizes varying upper bounds for the COD range to recognize that sample size, property type, variation of property ages and market conditions directly impact the COD. The Division considers this chart and the analyses of factors impacting the COD to determine whether the calculated COD is within an acceptable range. The reliability of the COD can also be directly affected by extreme ratios.
32 Frontier Page 6

The PRD range stated in IAAO standards is 98% to 103%. A perfect match in assessment level between the low-dollar properties and high-dollar properties indicates a PRD of 100%. The reason for the extended range on the high end is IAAO’s recognition of the inherent bias in assessment. The IAAO Standard on Ratio Studies notes that the PRD is sensitive to sales with higher prices even if the ratio on higher priced sales do not appear unusual relative to other sales, and that small samples, samples with high dispersion, or extreme ratios may not provide an accurate indication of assessment regressivity or progressivity, appraisal biases that occur when high-value properties are appraised higher or lower than low-value properties in relation to market values. Analysis of Assessment Practices:
The Division reviews assessment practices that ultimately affect the valuation of real property in each county. This review is done to ensure the reliability of the statistical analysis and to ensure professionally accepted mass appraisal methods are used to establish uniform and proportionate valuations. The review of assessment practices is based on information provided by the county assessors in Assessment Surveys and Assessed Value Updates (AVU), along with observed assessment practices in the county.
To ensure county assessors are submitting all Real Estate Transfer Statements, required for the development of the state sales file pursuant to Neb. Rev. Stat. §77-1327, a random sample from the county registers of deeds’ records is audited to confirm that the required sales have been submitted and reflect accurate information. The timeliness of the submission is also reviewed to ensure the sales file allows analysis of up-to-date information. The sales verification and qualification procedures used by the county assessors are reviewed to ensure that sales are properly considered arm’s-length transactions unless determined to be otherwise through the verification process. Proper sales verification practices ensure the statistical analysis is based on an unbiased sample of sales.
Valuation groups and market areas are also examined to identify whether the groups and areas being measured truly represent economic areas within the county. The measurement of economic areas is the method by which the PTA ensures intra-county equalization exists. The progress of the county assessor’s six-year inspection and review cycle is documented to ensure compliance with Neb. Rev. Stat. § 77-1311.03 and also to confirm that all property is being uniformly listed and described for valuation purposes.
Valuation methodologies developed by the county assessor are reviewed for both appraisal logic and to ensure compliance with professionally accepted mass appraisal methods. Methods and sales used to develop lot values, agricultural outbuildings, and agricultural site values are also reviewed to ensure the land component of the valuation process is based on the local market and economic area.
Compliance with statutory reporting requirements is also a component of the assessment practices review. Late, incomplete, or excessive errors in statutory reports can be problematic for property owners, county officials, the Division, the Commission, and others. The late, incomplete, or excessive errors in statutory reporting highlights potential issues in other areas of the assessment
32 Frontier Page 7

process. Public trust in the assessment process demands transparency, and assessment practices are reviewed to ensure taxpayers are served with such transparency.
Comprehensive review of assessment practices in each county is conducted throughout the year. When practical, if potential issues are identified they are presented to the county assessor for clarification and correction, if necessary. The county assessor can then work to implement corrective measures prior to establishing assessed values. The PTA’s conclusion that assessment quality is either compliant or not compliant with professionally accepted mass appraisal methods is based on the totality of the assessment practices in the county.
Reviews of the timeliness of submission of sales information, equalization of sold/unsold properties in the county, the accuracy of the AVU data, and the compliance with statutory reports, are completed annually for each county. If there are inconsistencies found or concerns about any of these reviews, those inconsistencies or concerns are addressed in the Correlation Section of the R&O for the subject real property, for the applicable county. Any applicable corrective measures taken by the county assessor to address the inconsistencies or concerns are reported along with the results of those corrective measures.
*Further information may be found in Exhibit 94
32 Frontier Page 8

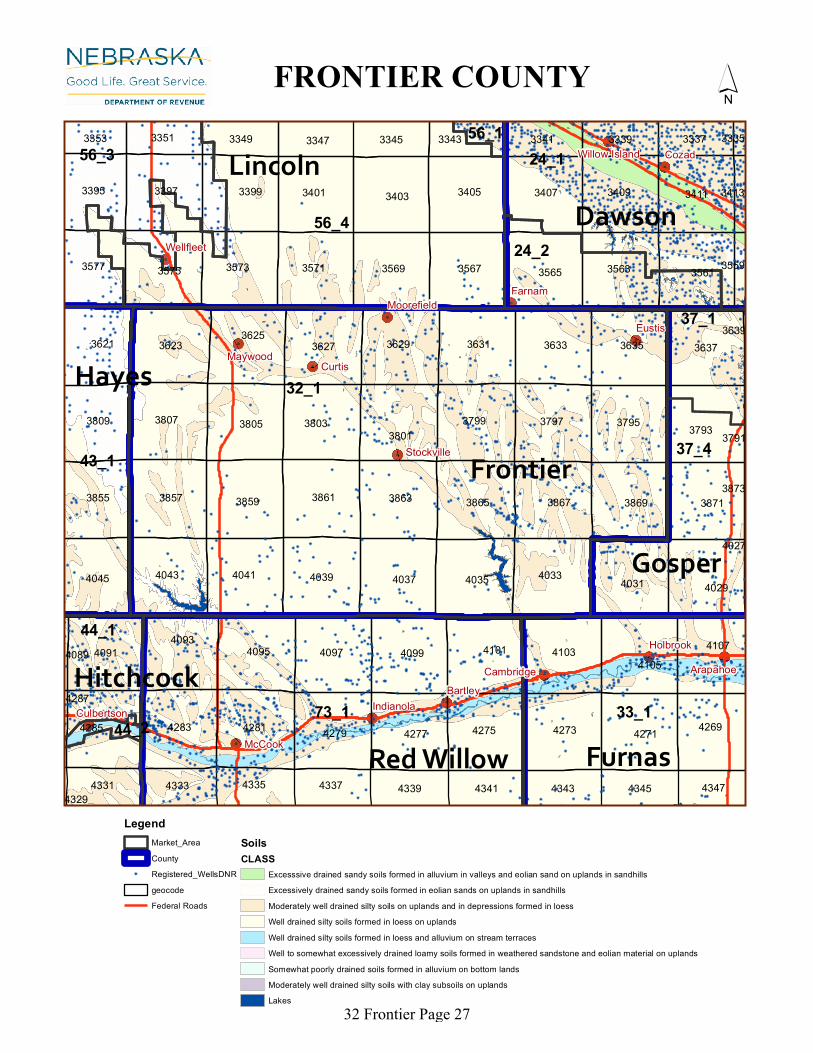
County Overview With a total area of 975 square miles, Frontier County has 2,627 residents, per the Census Bureau Quick Facts for 2019, reflecting a 5% overall population decline from the 2010 U.S. Census. Reports indicate that 75% of county residents are homeowners and 84% of residents occupy the same residence as in the prior year (Census Quick Facts). The average home value is $86,426 (2020 Average Residential Value, Neb. Rev. Stat. § 77-3506.02).
The majority of the commercial properties in Frontier County are located in and around Curtis, the largest town in the county. According information available from the U.S. Census Bureau, there are 69 employer establishments with total employment of 459.
Agricultural land is the single greatest contributor to the county’s valuation base by an overwhelming majority. Grassland and irrigated land make up a majority of the land in the county. Frontier is included in the Middle Republican Natural Resources District (NRD).
2010 2020 ChangeCURTIS 832 939 12.9%EUSTIS 464 401 -13.6%MAYWOOD 331 261 -21.1%MOOREFIELD 52 32 -38.5%STOCKVILLE 36 25 -30.6%
CITY POPULATION CHANGENE Dept. of Revenue, Research Division 2021
RESIDENTIAL14%
COMMERCIAL3%
OTHER6%
IRRIGATED27%
DRYLAND23%
GRASSLAND27%
WASTELAND0%
AGLAND-OTHER
0%
AG77%
County Value Breakdown
2020 Certificate of Taxes Levied
32 Frontier Page 9

2021 Residential Correlation for Frontier County Assessment Actions
Frontier County property review is on a four-year cycle and residential properties in Curtis, Eustis, Maywood, Stockville and Moorefield were physically reviewed in 2020 with assessment values updated for 2021. A residential vacancy rate was also developed. Pick-up work was completed as well.
Assessment Practice Review
As explained in the Introduction of this Report and Opinion, the assessment practices were reviewed to determine compliance with all assessment requirements and to ensure that all data submitted to the State sales file was timely and accurate.
A review of residential sales in Frontier County revealed that sales qualification has consistently been within the typical range. Review of nonqualified sales revealed no bias in the qualification process. The assessor’s office utilizes questionnaires which are mailed during the review process to obtain interior information.
The county has identified five residential valuation groups, which represents the local market. Frontier County has an established four-year review cycle and remains in compliance of the required review schedule. The assessor has a thorough valuation methodology which explains the assessment practices and procedures.
Depreciation tables were updated this year in conjunction with the physical review. The same depreciation table is used for all residential properties; an economic depreciation of 5% is applied to Maywood and 20% is applied to Stockville and Moorefield. The new Vanguard costing will be implemented in the county in conjunction with the next review cycle as the same depreciation scheduled is used throughout the county so it will be updated starting with the next residential review.
Description of Analysis
In the statistical profile, two of the three measures of central tendency are within range. The mean is slightly high and is most influenced by outlier sales ratios. Frontier County residential sales occur primarily in Curtis, the largest community and Valuation Group 1, and the measures of central tendency for this valuation group reflect that of the overall county.
Valuation Group Description 1 Curtis 2 Eustis 3 Maywood, Stockville, Moorefield 4 Lake Properties 5 Rural Residential
32 Frontier Page 10

2021 Residential Correlation for Frontier County Countywide, the COD is within range but the PRD is slightly high. Sales price substrata indicates that the PRD is influenced by extreme low dollar sales. The statistical sample and the 2021 County Abstract of Assessment, Form 45 Compared with the 2019 Certificate of Taxes Levied (CTL) Report indicate that the population changed in a similar manner to the sales. Changes to the population and sample reflect the stated assessment actions of a reappraisal in the towns and additional economic depreciation for Maywood, Stockville and Moorefield.
Equalization and Quality of Assessment
Assessments appear to be uniform and proportionate across the residential class. Although most valuation groups have an insufficient number of sales to use in statistical analysis, all residential property in the entire county is subject to the same appraisal techniques. Valuation Groups 1 and 2 are within range, and the remaining valuation groups with few sales are within one-half percent of rounding into range. The vast majority of sales are single family homes, Property Type 1, and are within the acceptable range. A small sample of recreational sales are slightly low but appraised with the same appraisal techniques as the larger grouping of sales.
Level of Value
Based on analysis of all available information, the level of value for the residential property in Frontier County is 99%.
32 Frontier Page 11
2021 Commercial Correlation for Frontier County Assessment Actions
Routine maintenance and pickup work of commercial properties in Frontier County was completed for the 2021 assessment year.
Assessment Practice Review
As explained in the Introduction of this Report and Opinion, the assessment practices were reviewed to determine compliance with all assessment requirements and to ensure that all data submitted to the State sales file was timely and accurate.
Review of qualified and non-qualified sales showed that the Frontier County Assessor has qualified commercial sales at a slightly higher rate than the typical range across the state. There appears to be no bias based on review of the assessor’s qualification practices.
The county identifies all commercial properties in the same valuation group, which is representative of the small market. The county is in compliance with the six-year inspection requirement; all commercial properties were reviewed in 2017 and both depreciation tables and lot values were updated at that time.
Description of Analysis
Frontier County has a sporadic, limited commercial market which is reflected in the statistics. Of the three measures of central tendency, only the median is within range. The COD is within range and the PRD is slightly high, which is not uncommon in rural areas with a weak commercial market.
The County Abstract of Assessment, Form 45 compared to the Certificate of Taxes Levied (CTL) report indicates very little change in the commercial class. Both the Abstract and the sales file changes support that only routine maintenance and pickup work were completed for commercial properties in Frontier County this year.
Equalization and Quality of Assessment
Although the sample is insufficient for measurement purposes, review of assessment actions indicate Frontier County’s assessment of the commercial class appears to be equalized. It also supports that the commercial class appears to comply with generally accepted mass appraisal techniques.
Level of Value
Based on analysis of all available information, the level of value for the commercial property in Frontier County is determined to be at the statutory level of 100% of market value.
32 Frontier Page 12

2021 Agricultural Correlation for Frontier County Assessment Actions
Only routine maintenance and pickup work was completed for the agricultural class of property in Frontier County for the 2021 assessment year.
Assessment Practice Review
As explained in the Introduction of this Report and Opinion, the assessment practices were reviewed to determine compliance with all assessment requirements and to ensure that all data submitted to the State sales file was timely and accurate.
Frontier County qualifies a higher than typical percentage of agricultural sales and review of assessment practices indicates that when sales are excluded from sales measurement, sufficient documentation is provided to explain the reason for disqualification.
There are similar agricultural characteristics across the county which prompts a singular market area. Depreciation tables are from 2017; Vanguard costing is dated 2008, the 2020 costing will be implemented with the next review cycle as properties in Frontier County are reviewed every four years. Agricultural homes and outbuildings were physically reviewed in 2018, which included lot value adjustments.
Description of Analysis
Review of the statistical profile for all agricultural sales indicates that all three measures of central tendency are within the acceptable range. The overall COD is within range. When each agricultural class is reviewed by 80% Majority Land Use (MLU), the measures of central tendency are all within range for dryland and grassland sales except for the grassland weighted mean, which is slightly high. There were only a few 80% MLU irrigated sales, which is not uncommon for the county.
Equalization and Quality of Assessment
Agricultural homes and outbuildings have been valued using the same valuation process as rural residential improvements and are believed to be equalized at the statutorily required level. Agricultural land values appear to be equalized at the uniform portions of market value; all values have been determined to be acceptable and are comparable to Red Willow County, which has a similar agricultural market. The quality of assessment of agricultural land in Frontier County complies with generally accepted mass appraisal techniques.
32 Frontier Page 13

2021 Agricultural Correlation for Frontier County
Level of Value
Based on analysis of all available information, the level of value of agricultural land in Frontier County is 71%.
32 Frontier Page 14
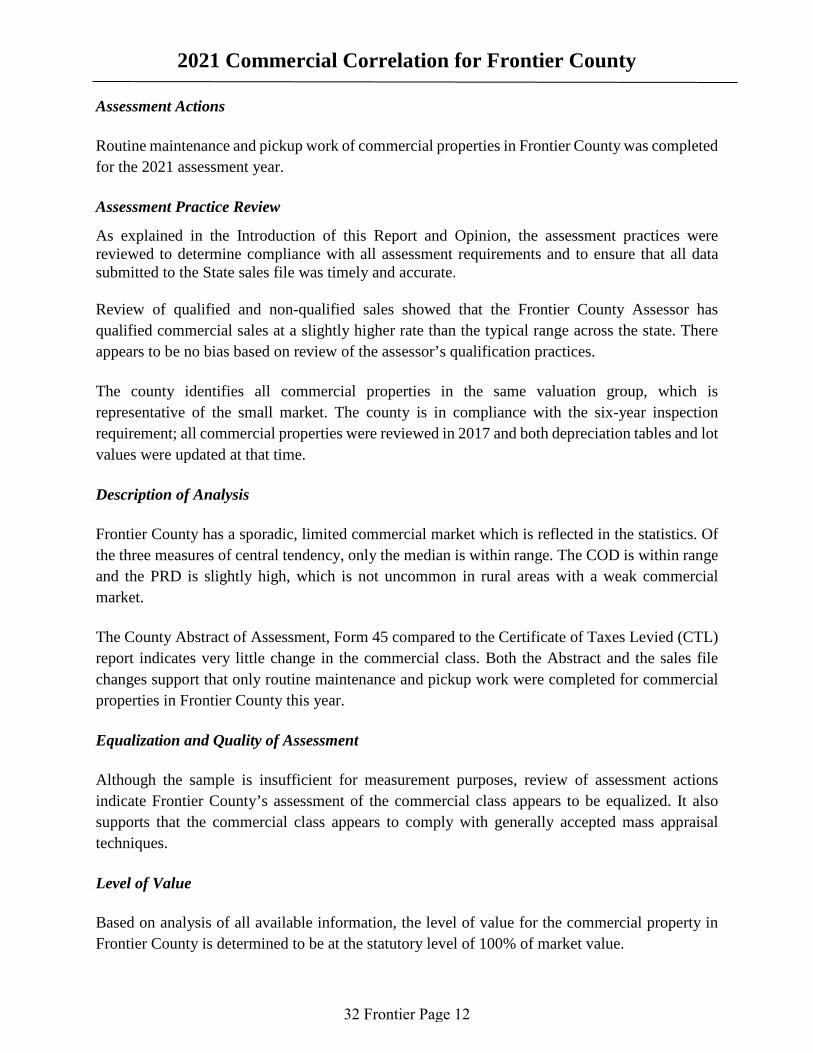
2021 Opinions of the Property Tax Administrator
for Frontier County
My opinions and recommendations are stated as a conclusion based on all of the factors known to me
regarding the assessment practices and statistical analysis for this county. See, Neb. Rev. Stat. § 77-5027
(R.R.S. 2011). While the median assessment sales ratio from the Qualified Statistical Reports for each
class of real property is considered, my opinion of the level of value for a class of real property may be
determined from other evidence contained within these Reports and Opinions of the Property Tax
Administrator. My opinion of quality of assessment for a class of real property may be influenced by the
assessment practices of the county assessor.
Residential Real
Property
Commercial Real
Property
Agricultural Land
Class Level of Value Quality of Assessment
100
71
99
Meets generally accepted mass appraisal
techniques.
Meets generally accepted mass appraisal
techniques.
Meets generally accepted mass appraisal
techniques.
No recommendation.
No recommendation.
No recommendation.
Non-binding recommendation
**A level of value displayed as NEI (not enough information) represents a class of property with insufficient
information to determine a level of value.
Dated this 7th day of April, 2021.
Ruth A. Sorensen
Property Tax Administrator
32 Frontier Page 15

Appendices
APPENDICES
32 Frontier Page 16

2021 Commission Summary
for Frontier County
Residential Real Property - Current
Number of Sales
Total Sales Price
Total Adj. Sales Price
Total Assessed Value
Avg. Adj. Sales Price Avg. Assessed Value
Median
Wgt. Mean
Mean
95% Median C.I
95% Wgt. Mean C.I
95% Mean C.I
96.71 to 102.48
92.07 to 105.48
97.63 to 108.71
% of Value of the Class of all Real Property Value in the County
% of Records Sold in the Study Period
% of Value Sold in the Study Period
Average Assessed Value of the Base
9.48
6.00
8.26
$71,947
Residential Real Property - History
Year
2017
Number of Sales LOV
Confidence Interval - Current
Median
64
103.17
98.96
98.78
$6,412,973
$6,412,973
$6,334,613
$100,203 $98,978
2018
100 99.79 51
99 99.05 61
66 98.72 992019
2020 96 96.13 60
32 Frontier Page 17
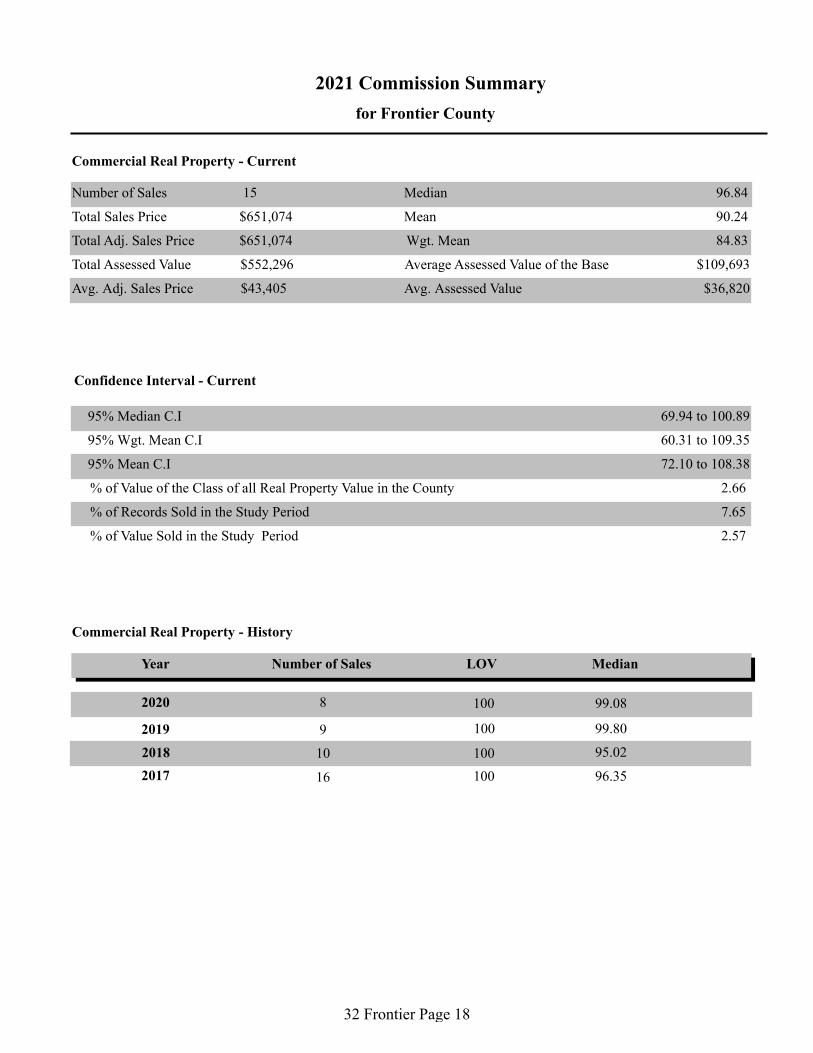
2021 Commission Summary
for Frontier County
Commercial Real Property - Current
Number of Sales
Total Sales Price
Total Adj. Sales Price
Total Assessed Value
Avg. Adj. Sales Price Avg. Assessed Value
Median
Wgt. Mean
Mean
95% Median C.I
95% Wgt. Mean C.I
95% Mean C.I
% of Value of the Class of all Real Property Value in the County
% of Records Sold in the Study Period
% of Value Sold in the Study Period
Average Assessed Value of the Base
Commercial Real Property - History
Year Number of Sales LOV
15
69.94 to 100.89
60.31 to 109.35
72.10 to 108.38
2.66
7.65
2.57
$109,693
Confidence Interval - Current
Median
$651,074
$651,074
$552,296
$43,405 $36,820
90.24
96.84
84.83
2017 100 96.35 16
2018 95.02 10 100
2019 9 99.80 100
2020 100 99.08 8
32 Frontier Page 18

Number of Sales :
Total Sales Price :
Total Adj. Sales Price :
Total Assessed Value :
Avg. Adj. Sales Price :
Avg. Assessed Value :
MEDIAN :
WGT. MEAN :
MEAN :
COD :
PRD :
COV :
STD :
Avg. Abs. Dev :
MAX Sales Ratio :
MIN Sales Ratio :
95% Median C.I. :
95% Wgt. Mean C.I. :
95% Mean C.I. :
64
6,412,973
6,412,973
6,334,613
100,203
98,978
13.28
104.44
21.92
22.61
13.14
219.91
62.91
96.71 to 102.48
92.07 to 105.48
97.63 to 108.71
Printed:3/18/2021 10:48:43AM
Qualified
PAD 2021 R&O Statistics (Using 2021 Values)Frontier32
Date Range: 10/1/2018 To 9/30/2020 Posted on: 1/31/2021
99
99
103
RESIDENTIAL
Page 1 of 2
Avg. Adj.
RANGE Assd. ValSale Price95%_Median_C.I.MAXMINPRDCODWGT.MEANMEANMEDIANCOUNT
Avg.DATE OF SALE *
_____Qrtrs_____
01-OCT-18 To 31-DEC-18 5 94.63 94.74 92.58 04.78 102.33 84.12 101.20 N/A 88,700 82,116
01-JAN-19 To 31-MAR-19 3 107.59 106.21 103.39 06.57 102.73 94.92 116.13 N/A 54,333 56,175
01-APR-19 To 30-JUN-19 5 95.11 102.88 93.96 15.02 109.49 80.22 131.61 N/A 90,960 85,469
01-JUL-19 To 30-SEP-19 11 104.96 105.59 112.67 10.28 93.72 85.46 131.45 91.04 to 120.30 121,682 137,095
01-OCT-19 To 31-DEC-19 7 98.75 99.72 94.27 12.56 105.78 62.91 124.09 62.91 to 124.09 59,500 56,092
01-JAN-20 To 31-MAR-20 7 95.70 101.79 98.84 11.23 102.98 89.71 130.77 89.71 to 130.77 94,929 93,825
01-APR-20 To 30-JUN-20 10 97.56 94.70 92.24 08.13 102.67 74.60 116.64 76.51 to 99.78 102,517 94,558
01-JUL-20 To 30-SEP-20 16 100.71 111.05 95.71 19.98 116.03 63.41 219.91 96.84 to 110.26 119,188 114,070
_____Study Yrs_____
01-OCT-18 To 30-SEP-19 24 100.42 102.84 104.78 11.04 98.15 80.22 131.61 94.09 to 109.42 99,992 104,771
01-OCT-19 To 30-SEP-20 40 98.82 103.36 95.19 14.51 108.58 62.91 219.91 96.80 to 100.90 100,329 95,503
_____Calendar Yrs_____
01-JAN-19 To 31-DEC-19 26 104.10 103.56 105.22 11.75 98.42 62.91 131.61 94.92 to 113.76 91,262 96,022
_____ALL_____ 64 98.96 103.17 98.78 13.28 104.44 62.91 219.91 96.71 to 102.48 100,203 98,978
Avg. Adj.
RANGE Assd. ValSale Price95%_Median_C.I.MAXMINPRDCODWGT.MEANMEANMEDIANCOUNT
Avg.VALUATION GROUP
1 37 99.40 103.47 97.77 11.70 105.83 74.57 219.91 96.80 to 103.83 86,107 84,184
2 8 98.11 96.85 95.54 06.48 101.37 76.51 109.42 76.51 to 109.42 122,563 117,094
3 11 100.52 109.79 101.15 13.81 108.54 92.18 170.96 94.92 to 124.09 70,545 71,358
4 5 91.04 101.18 94.96 26.54 106.55 62.91 136.24 N/A 110,100 104,548
5 3 91.02 95.29 106.02 24.92 89.88 63.41 131.45 N/A 306,667 325,126
_____ALL_____ 64 98.96 103.17 98.78 13.28 104.44 62.91 219.91 96.71 to 102.48 100,203 98,978
Avg. Adj.
RANGE Assd. ValSale Price95%_Median_C.I.MAXMINPRDCODWGT.MEANMEANMEDIANCOUNT
Avg.PROPERTY TYPE *
01 59 99.02 103.34 99.14 12.19 104.24 63.41 219.91 96.80 to 102.48 99,364 98,506
06 5 91.04 101.18 94.96 26.54 106.55 62.91 136.24 N/A 110,100 104,548
07 0 00.00 00.00 00.00 00.00 00.00 00.00 00.00 N/A 0 0
_____ALL_____ 64 98.96 103.17 98.78 13.28 104.44 62.91 219.91 96.71 to 102.48 100,203 98,978
32 Frontier Page 19

Number of Sales :
Total Sales Price :
Total Adj. Sales Price :
Total Assessed Value :
Avg. Adj. Sales Price :
Avg. Assessed Value :
MEDIAN :
WGT. MEAN :
MEAN :
COD :
PRD :
COV :
STD :
Avg. Abs. Dev :
MAX Sales Ratio :
MIN Sales Ratio :
95% Median C.I. :
95% Wgt. Mean C.I. :
95% Mean C.I. :
64
6,412,973
6,412,973
6,334,613
100,203
98,978
13.28
104.44
21.92
22.61
13.14
219.91
62.91
96.71 to 102.48
92.07 to 105.48
97.63 to 108.71
Printed:3/18/2021 10:48:43AM
Qualified
PAD 2021 R&O Statistics (Using 2021 Values)Frontier32
Date Range: 10/1/2018 To 9/30/2020 Posted on: 1/31/2021
99
99
103
RESIDENTIAL
Page 2 of 2
Avg. Adj.
RANGE Assd. ValSale Price95%_Median_C.I.MAXMINPRDCODWGT.MEANMEANMEDIANCOUNT
Avg.SALE PRICE *
_____Low $ Ranges_____
Less Than 5,000 0 00.00 00.00 00.00 00.00 00.00 00.00 00.00 N/A 0 0
Less Than 15,000 5 116.64 143.49 138.23 31.03 103.81 96.17 219.91 N/A 9,435 13,041
Less Than 30,000 8 115.20 127.94 117.81 24.52 108.60 90.08 219.91 90.08 to 219.91 14,147 16,667
__Ranges Excl. Low $__
Greater Than 4,999 64 98.96 103.17 98.78 13.28 104.44 62.91 219.91 96.71 to 102.48 100,203 98,978
Greater Than 14,999 59 98.75 99.75 98.49 10.51 101.28 62.91 136.24 95.70 to 100.90 107,895 106,261
Greater Than 29,999 56 98.61 99.63 98.44 10.60 101.21 62.91 136.24 95.70 to 100.90 112,496 110,737
__Incremental Ranges__
0 TO 4,999 0 00.00 00.00 00.00 00.00 00.00 00.00 00.00 N/A 0 0
5,000 TO 14,999 5 116.64 143.49 138.23 31.03 103.81 96.17 219.91 N/A 9,435 13,041
15,000 TO 29,999 3 98.75 102.03 103.22 09.17 98.85 90.08 117.25 N/A 22,000 22,709
30,000 TO 59,999 12 100.15 105.22 103.50 08.92 101.66 93.97 131.61 94.63 to 116.13 46,083 47,696
60,000 TO 99,999 17 101.20 102.64 102.71 08.41 99.93 74.60 130.77 94.92 to 109.42 78,971 81,110
100,000 TO 149,999 15 96.71 97.90 97.82 11.87 100.08 62.91 136.24 89.71 to 103.83 118,553 115,973
150,000 TO 249,999 10 95.41 89.72 89.16 08.06 100.63 63.41 98.89 76.51 to 98.32 185,600 165,476
250,000 TO 499,999 2 103.01 103.01 111.13 27.61 92.69 74.57 131.45 N/A 385,000 427,855
500,000 TO 999,999 0 00.00 00.00 00.00 00.00 00.00 00.00 00.00 N/A 0 0
1,000,000 + 0 00.00 00.00 00.00 00.00 00.00 00.00 00.00 N/A 0 0
_____ALL_____ 64 98.96 103.17 98.78 13.28 104.44 62.91 219.91 96.71 to 102.48 100,203 98,978
32 Frontier Page 20

Number of Sales :
Total Sales Price :
Total Adj. Sales Price :
Total Assessed Value :
Avg. Adj. Sales Price :
Avg. Assessed Value :
MEDIAN :
WGT. MEAN :
MEAN :
COD :
PRD :
COV :
STD :
Avg. Abs. Dev :
MAX Sales Ratio :
MIN Sales Ratio :
95% Median C.I. :
95% Wgt. Mean C.I. :
95% Mean C.I. :
15
651,074
651,074
552,296
43,405
36,820
23.33
106.38
36.29
32.75
22.59
173.93
33.87
69.94 to 100.89
60.31 to 109.35
72.10 to 108.38
Printed:3/18/2021 10:48:44AM
Qualified
PAD 2021 R&O Statistics (Using 2021 Values)Frontier32
Date Range: 10/1/2017 To 9/30/2020 Posted on: 1/31/2021
97
85
90
COMMERCIAL
Page 1 of 2
Avg. Adj.
RANGE Assd. ValSale Price95%_Median_C.I.MAXMINPRDCODWGT.MEANMEANMEDIANCOUNT
Avg.DATE OF SALE *
_____Qrtrs_____
01-OCT-17 To 31-DEC-17 1 72.15 72.15 72.15 00.00 100.00 72.15 72.15 N/A 65,000 46,897
01-JAN-18 To 31-MAR-18 1 99.80 99.80 99.80 00.00 100.00 99.80 99.80 N/A 22,000 21,956
01-APR-18 To 30-JUN-18 0 00.00 00.00 00.00 00.00 00.00 00.00 00.00 N/A 0 0
01-JUL-18 To 30-SEP-18 0 00.00 00.00 00.00 00.00 00.00 00.00 00.00 N/A 0 0
01-OCT-18 To 31-DEC-18 1 117.46 117.46 117.46 00.00 100.00 117.46 117.46 N/A 100,000 117,455
01-JAN-19 To 31-MAR-19 2 74.17 74.17 89.56 32.61 82.82 49.98 98.35 N/A 55,000 49,258
01-APR-19 To 30-JUN-19 0 00.00 00.00 00.00 00.00 00.00 00.00 00.00 N/A 0 0
01-JUL-19 To 30-SEP-19 1 58.52 58.52 58.52 00.00 100.00 58.52 58.52 N/A 6,000 3,511
01-OCT-19 To 31-DEC-19 2 98.87 98.87 98.76 02.05 100.11 96.84 100.89 N/A 19,000 18,764
01-JAN-20 To 31-MAR-20 3 85.18 81.48 75.99 07.58 107.22 69.94 89.31 N/A 45,833 34,827
01-APR-20 To 30-JUN-20 4 103.71 103.80 70.67 35.55 146.88 33.87 173.93 N/A 43,144 30,489
01-JUL-20 To 30-SEP-20 0 00.00 00.00 00.00 00.00 00.00 00.00 00.00 N/A 0 0
_____Study Yrs_____
01-OCT-17 To 30-SEP-18 2 85.98 85.98 79.14 16.09 108.64 72.15 99.80 N/A 43,500 34,427
01-OCT-18 To 30-SEP-19 4 78.44 81.08 101.61 34.20 79.80 49.98 117.46 N/A 54,000 54,870
01-OCT-19 To 30-SEP-20 9 96.84 95.26 75.84 23.40 125.61 33.87 173.93 69.94 to 107.41 38,675 29,329
_____Calendar Yrs_____
01-JAN-18 To 31-DEC-18 2 108.63 108.63 114.27 08.13 95.06 99.80 117.46 N/A 61,000 69,706
01-JAN-19 To 31-DEC-19 5 96.84 80.92 90.62 18.74 89.30 49.98 100.89 N/A 30,800 27,911
_____ALL_____ 15 96.84 90.24 84.83 23.33 106.38 33.87 173.93 69.94 to 100.89 43,405 36,820
Avg. Adj.
RANGE Assd. ValSale Price95%_Median_C.I.MAXMINPRDCODWGT.MEANMEANMEDIANCOUNT
Avg.VALUATION GROUP
1 15 96.84 90.24 84.83 23.33 106.38 33.87 173.93 69.94 to 100.89 43,405 36,820
_____ALL_____ 15 96.84 90.24 84.83 23.33 106.38 33.87 173.93 69.94 to 100.89 43,405 36,820
Avg. Adj.
RANGE Assd. ValSale Price95%_Median_C.I.MAXMINPRDCODWGT.MEANMEANMEDIANCOUNT
Avg.PROPERTY TYPE *
02 0 00.00 00.00 00.00 00.00 00.00 00.00 00.00 N/A 0 0
03 15 96.84 90.24 84.83 23.33 106.38 33.87 173.93 69.94 to 100.89 43,405 36,820
04 0 00.00 00.00 00.00 00.00 00.00 00.00 00.00 N/A 0 0
_____ALL_____ 15 96.84 90.24 84.83 23.33 106.38 33.87 173.93 69.94 to 100.89 43,405 36,820
32 Frontier Page 21

Number of Sales :
Total Sales Price :
Total Adj. Sales Price :
Total Assessed Value :
Avg. Adj. Sales Price :
Avg. Assessed Value :
MEDIAN :
WGT. MEAN :
MEAN :
COD :
PRD :
COV :
STD :
Avg. Abs. Dev :
MAX Sales Ratio :
MIN Sales Ratio :
95% Median C.I. :
95% Wgt. Mean C.I. :
95% Mean C.I. :
15
651,074
651,074
552,296
43,405
36,820
23.33
106.38
36.29
32.75
22.59
173.93
33.87
69.94 to 100.89
60.31 to 109.35
72.10 to 108.38
Printed:3/18/2021 10:48:44AM
Qualified
PAD 2021 R&O Statistics (Using 2021 Values)Frontier32
Date Range: 10/1/2017 To 9/30/2020 Posted on: 1/31/2021
97
85
90
COMMERCIAL
Page 2 of 2
Avg. Adj.
RANGE Assd. ValSale Price95%_Median_C.I.MAXMINPRDCODWGT.MEANMEANMEDIANCOUNT
Avg.SALE PRICE *
_____Low $ Ranges_____
Less Than 5,000 0 00.00 00.00 00.00 00.00 00.00 00.00 00.00 N/A 0 0
Less Than 15,000 2 73.92 73.92 75.62 20.83 97.75 58.52 89.31 N/A 6,750 5,105
Less Than 30,000 8 98.32 97.09 98.70 23.82 98.37 49.98 173.93 49.98 to 173.93 15,438 15,236
__Ranges Excl. Low $__
Greater Than 4,999 15 96.84 90.24 84.83 23.33 106.38 33.87 173.93 69.94 to 100.89 43,405 36,820
Greater Than 14,999 13 98.35 92.75 85.02 22.81 109.09 33.87 173.93 69.94 to 107.41 49,044 41,699
Greater Than 29,999 7 85.18 82.42 81.58 23.46 101.03 33.87 117.46 33.87 to 117.46 75,368 61,486
__Incremental Ranges__
0 TO 4,999 0 00.00 00.00 00.00 00.00 00.00 00.00 00.00 N/A 0 0
5,000 TO 14,999 2 73.92 73.92 75.62 20.83 97.75 58.52 89.31 N/A 6,750 5,105
15,000 TO 29,999 6 100.35 104.81 101.53 22.52 103.23 49.98 173.93 49.98 to 173.93 18,333 18,614
30,000 TO 59,999 2 92.59 92.59 92.79 08.00 99.78 85.18 100.00 N/A 46,287 42,952
60,000 TO 99,999 4 71.05 68.58 67.78 23.46 101.18 33.87 98.35 N/A 83,750 56,762
100,000 TO 149,999 1 117.46 117.46 117.46 00.00 100.00 117.46 117.46 N/A 100,000 117,455
150,000 TO 249,999 0 00.00 00.00 00.00 00.00 00.00 00.00 00.00 N/A 0 0
250,000 TO 499,999 0 00.00 00.00 00.00 00.00 00.00 00.00 00.00 N/A 0 0
500,000 TO 999,999 0 00.00 00.00 00.00 00.00 00.00 00.00 00.00 N/A 0 0
1,000,000 + 0 00.00 00.00 00.00 00.00 00.00 00.00 00.00 N/A 0 0
_____ALL_____ 15 96.84 90.24 84.83 23.33 106.38 33.87 173.93 69.94 to 100.89 43,405 36,820
Avg. Adj.
RANGE Assd. ValSale Price95%_Median_C.I.MAXMINPRDCODWGT.MEANMEANMEDIANCOUNT
Avg.OCCUPANCY CODE
344 2 98.87 98.87 98.76 02.05 100.11 96.84 100.89 N/A 19,000 18,764
346 1 33.87 33.87 33.87 00.00 100.00 33.87 33.87 N/A 95,000 32,178
350 2 84.97 84.97 80.73 17.69 105.25 69.94 100.00 N/A 66,287 53,514
353 5 99.80 97.93 99.57 34.64 98.35 49.98 173.93 N/A 15,600 15,533
406 3 89.31 90.95 93.72 04.92 97.04 85.18 98.35 N/A 47,500 44,515
442 1 72.15 72.15 72.15 00.00 100.00 72.15 72.15 N/A 65,000 46,897
528 1 117.46 117.46 117.46 00.00 100.00 117.46 117.46 N/A 100,000 117,455
_____ALL_____ 15 96.84 90.24 84.83 23.33 106.38 33.87 173.93 69.94 to 100.89 43,405 36,820
32 Frontier Page 22

Tax Growth % Growth Value Ann.%chg Net Taxable % Chg Net
Year Value Value of Value Exclud. Growth w/o grwth Sales Value Tax. Sales
2008 14,757,254$ 118,683$ 14,638,571$ -- 13,686,080$ --2009 15,525,605$ 921,755$ 5.94% 14,603,850$ -- 15,180,973$ --2010 16,745,440$ 270,000$ 1.61% 16,475,440$ 6.12% 13,950,982$ -8.10%2011 16,950,620$ 258,610$ 1.53% 16,692,010$ -0.32% 10,253,864$ -26.50%2012 17,310,824$ 282,322$ 1.63% 17,028,502$ 0.46% 10,734,744$ 4.69%2013 18,016,208$ 1,299,623$ 7.21% 16,716,585$ -3.43% 10,787,995$ 0.50%2014 19,833,229$ 1,144,598$ 5.77% 18,688,631$ 3.73% 10,862,702$ 0.69%2015 21,934,456$ 2,007,909$ 9.15% 19,926,547$ 0.47% 10,329,262$ -4.91%2016 22,362,106$ 387,869$ 1.73% 21,974,237$ 0.18% 10,131,869$ -1.91%2017 22,594,307$ 111,891$ 0.50% 22,482,416$ 0.54% 9,923,837$ -2.05%2018 23,303,443$ -$ 0.00% 23,303,443$ 3.14% 10,387,565$ 4.67%2019 23,785,014$ 286,436$ 1.20% 23,498,578$ 0.84% 9,940,578$ -4.30%2020 20,914,984$ -$ 0.00% 20,914,984$ -12.07% 9,990,552$ 0.50%
Ann %chg 4.36% Average 1.17% -4.15% -3.72%
Tax Cmltv%chg Cmltv%chg Cmltv%chg County Number 32Year w/o grwth Value Net Sales County Name Frontier2009 - - -2010 6.12% 7.86% -8.10%2011 7.51% 9.18% -32.46%2012 9.68% 11.50% -29.29%2013 7.67% 16.04% -28.94%2014 20.37% 27.75% -28.45%2015 28.35% 41.28% -31.96%2016 41.54% 44.03% -33.26%2017 44.81% 45.53% -34.63%2018 50.10% 50.10% -31.58%2019 51.35% 53.20% -34.52%2020 34.71% 34.71% -34.19%
Cumulative Change
-60%
-40%
-20%
0%
20%
40%
60%
2009 2010 2011 2012 2013 2014 2015 2016 2017 2018 2019 2020
Commercial & Industrial Value Change Vs. Net Taxable Sales Change
Comm.&Ind w/o Growth
Comm.&Ind. Value Chg
Net Tax. Sales Value Change
Linear (Comm.&Ind w/o Growth)
Linear (Net Tax. Sales ValueChange)
Sources:
Value; 2009-2020 CTL Report
Growth Value; 2009-2020 Abstract Rpt
Net Taxable Sales; Dept. of Revenue website.
32 Frontier Page 23

Number of Sales :
Total Sales Price :
Total Adj. Sales Price :
Total Assessed Value :
Avg. Adj. Sales Price :
Avg. Assessed Value :
MEDIAN :
WGT. MEAN :
MEAN :
COD :
PRD :
COV :
STD :
Avg. Abs. Dev :
MAX Sales Ratio :
MIN Sales Ratio :
95% Median C.I. :
95% Wgt. Mean C.I. :
95% Mean C.I. :
53
24,744,870
24,744,870
17,809,445
466,884
336,027
15.94
101.03
19.61
14.26
11.27
112.38
47.12
66.96 to 77.72
67.34 to 76.61
68.87 to 76.55
Printed:3/18/2021 10:48:45AM
Qualified
PAD 2021 R&O Statistics (Using 2021 Values)Frontier32
Date Range: 10/1/2017 To 9/30/2020 Posted on: 1/31/2021
71
72
73
AGRICULTURAL LAND
Page 1 of 2
Avg. Adj.
RANGE Assd. ValSale Price95%_Median_C.I.MAXMINPRDCODWGT.MEANMEANMEDIANCOUNT
Avg.DATE OF SALE *
_____Qrtrs_____
01-OCT-17 To 31-DEC-17 3 81.51 79.24 82.27 12.96 96.32 62.26 93.95 N/A 266,667 219,384
01-JAN-18 To 31-MAR-18 8 63.52 64.91 66.49 15.02 97.62 47.86 90.07 47.86 to 90.07 431,875 287,161
01-APR-18 To 30-JUN-18 5 67.45 68.28 67.75 03.84 100.78 64.20 74.90 N/A 427,234 289,464
01-JUL-18 To 30-SEP-18 3 68.60 66.72 69.16 06.62 96.47 58.98 72.59 N/A 284,925 197,053
01-OCT-18 To 31-DEC-18 1 93.28 93.28 93.28 00.00 100.00 93.28 93.28 N/A 450,000 419,748
01-JAN-19 To 31-MAR-19 3 72.00 72.93 70.69 04.63 103.17 68.39 78.39 N/A 337,296 238,421
01-APR-19 To 30-JUN-19 6 88.80 85.97 85.60 09.07 100.43 70.39 99.96 70.39 to 99.96 439,620 376,304
01-JUL-19 To 30-SEP-19 0 00.00 00.00 00.00 00.00 00.00 00.00 00.00 N/A 0 0
01-OCT-19 To 31-DEC-19 1 48.74 48.74 48.74 00.00 100.00 48.74 48.74 N/A 250,000 121,856
01-JAN-20 To 31-MAR-20 14 74.21 73.95 70.86 13.95 104.36 51.67 91.45 63.64 to 87.56 574,907 407,354
01-APR-20 To 30-JUN-20 7 61.17 69.94 69.76 24.85 100.26 47.12 112.38 47.12 to 112.38 574,946 401,086
01-JUL-20 To 30-SEP-20 2 76.82 76.82 73.45 06.52 104.59 71.81 81.83 N/A 537,998 395,133
_____Study Yrs_____
01-OCT-17 To 30-SEP-18 19 66.96 68.35 68.92 12.38 99.17 47.86 93.95 62.26 to 74.90 381,366 262,838
01-OCT-18 To 30-SEP-19 10 83.24 82.79 82.76 11.89 100.04 68.39 99.96 70.39 to 93.28 409,961 339,284
01-OCT-19 To 30-SEP-20 24 71.22 71.97 70.32 17.26 102.35 47.12 112.38 61.17 to 82.27 558,305 392,612
_____Calendar Yrs_____
01-JAN-18 To 31-DEC-18 17 66.96 67.89 68.96 12.08 98.45 47.86 93.28 59.98 to 74.90 405,644 279,736
01-JAN-19 To 31-DEC-19 10 76.84 78.34 79.37 14.80 98.70 48.74 99.96 68.39 to 92.59 389,961 309,494
_____ALL_____ 53 70.69 72.71 71.97 15.94 101.03 47.12 112.38 66.96 to 77.72 466,884 336,027
Avg. Adj.
RANGE Assd. ValSale Price95%_Median_C.I.MAXMINPRDCODWGT.MEANMEANMEDIANCOUNT
Avg.AREA (MARKET)
1 53 70.69 72.71 71.97 15.94 101.03 47.12 112.38 66.96 to 77.72 466,884 336,027
_____ALL_____ 53 70.69 72.71 71.97 15.94 101.03 47.12 112.38 66.96 to 77.72 466,884 336,027
32 Frontier Page 24

Number of Sales :
Total Sales Price :
Total Adj. Sales Price :
Total Assessed Value :
Avg. Adj. Sales Price :
Avg. Assessed Value :
MEDIAN :
WGT. MEAN :
MEAN :
COD :
PRD :
COV :
STD :
Avg. Abs. Dev :
MAX Sales Ratio :
MIN Sales Ratio :
95% Median C.I. :
95% Wgt. Mean C.I. :
95% Mean C.I. :
53
24,744,870
24,744,870
17,809,445
466,884
336,027
15.94
101.03
19.61
14.26
11.27
112.38
47.12
66.96 to 77.72
67.34 to 76.61
68.87 to 76.55
Printed:3/18/2021 10:48:45AM
Qualified
PAD 2021 R&O Statistics (Using 2021 Values)Frontier32
Date Range: 10/1/2017 To 9/30/2020 Posted on: 1/31/2021
71
72
73
AGRICULTURAL LAND
Page 2 of 2
Avg. Adj.
RANGE Assd. ValSale Price95%_Median_C.I.MAXMINPRDCODWGT.MEANMEANMEDIANCOUNT
Avg.95%MLU By Market Area
_____Dry_____
County 3 67.45 66.34 68.92 06.73 96.26 58.98 72.59 N/A 286,592 197,508
1 3 67.45 66.34 68.92 06.73 96.26 58.98 72.59 N/A 286,592 197,508
_____Grass_____
County 7 64.20 63.08 63.87 18.85 98.76 47.12 91.45 47.12 to 91.45 279,567 178,560
1 7 64.20 63.08 63.87 18.85 98.76 47.12 91.45 47.12 to 91.45 279,567 178,560
_____ALL_____ 53 70.69 72.71 71.97 15.94 101.03 47.12 112.38 66.96 to 77.72 466,884 336,027
Avg. Adj.
RANGE Assd. ValSale Price95%_Median_C.I.MAXMINPRDCODWGT.MEANMEANMEDIANCOUNT
Avg.80%MLU By Market Area
_____Irrigated_____
County 3 61.17 60.71 60.66 09.61 100.08 51.67 69.30 N/A 719,333 436,341
1 3 61.17 60.71 60.66 09.61 100.08 51.67 69.30 N/A 719,333 436,341
_____Dry_____
County 7 72.59 73.43 73.47 08.78 99.95 58.98 82.80 58.98 to 82.80 236,377 173,672
1 7 72.59 73.43 73.47 08.78 99.95 58.98 82.80 58.98 to 82.80 236,377 173,672
_____Grass_____
County 16 73.52 73.59 79.65 21.84 92.39 47.12 112.38 50.46 to 90.07 385,248 306,840
1 16 73.52 73.59 79.65 21.84 92.39 47.12 112.38 50.46 to 90.07 385,248 306,840
_____ALL_____ 53 70.69 72.71 71.97 15.94 101.03 47.12 112.38 66.96 to 77.72 466,884 336,027
32 Frontier Page 25

2 3 4 5 6 7 8 9 10 11 12.00Mkt
Area1A1 1A 2A1 2A 3A1 3A 4A1 4A
WEIGHTED
AVG IRR
1 2885 2881 2811 2833 2785 2785 2731 2683 2856
4 2790 2768 2278 2703 2790 2790 2496 2604 2704
2 3300 3300 3300 2857 n/a 1640 1510 1480 3112
1 4975 4975 4100 3300 n/a 3100 2900 2750 4739
4 4120 4120 3499 2943 2712 n/a 2515 2354 3489
1 3695 3695 2995 2815 n/a 2065 1980 1980 3323
1 2975 2975 2809 2744 2645 1539 2251 2225 2898
1 2480 2480 2355 2355 2275 2275 2195 2195 2448
1 2650 2650 2490 2490 2325 2325 2210 2210 25011 13 14 15 16 17 18 19 20 21
Mkt
Area1D1 1D 2D1 2D 3D1 3D 4D1 4D
WEIGHTED
AVG DRY
1 1235 1235 1185 1185 1135 n/a 1085 1085 1212
4 1250 1250 1250 1250 1250 1250 1250 1250 1250
2 n/a 1345 1345 1200 1200 1045 890 735 1132
1 n/a 1821 1730 1635 1501 1280 1215 1215 1715
4 n/a 1744 1626 1525 n/a 1177 1156 1156 1613
1 1625 1625 1115 1115 1115 n/a 1015 1015 1426
1 1270 1270 1225 1225 1135 1135 1060 1060 1241
1 1075 1075 1005 1005 935 935 830 830 1045
1 n/a 895 805 805 780 780 735 735 86322 23 24 25 26 27 28 29 30
Mkt
Area1G1 1G 2G1 2G 3G1 3G 4G1 4G
WEIGHTED
AVG GRASS
1 585 585 585 n/a 585 585 585 585 585
4 625 625 625 625 625 585 585 585 622
2 735 735 590 590 590 n/a 590 n/a 603
1 975 984 975 975 1349 n/a 975 1335 978
4 883 884 883 1252 1252 n/a 884 1252 884
1 799 800 800 800 800 n/a 800 n/a 800
1 984 847 602 589 585 593 596 753 643
1 585 585 585 585 n/a 585 585 585 585
1 515 515 n/a 515 515 515 515 515 51532 33 31Mkt
AreaCRP TIMBER WASTE
1 1070 n/a n/a4 n/a n/a 3062 n/a n/a 501 n/a n/a 1004 n/a n/a 1001 800 800 751 1220 585 251 1166 n/a 501 683 n/a 25
Source: 2021 Abstract of Assessment, Form 45, Schedule IX and Grass Detail from Schedule XIII.CRP and TIMBER values are weighted averages from Schedule XIII, line 104 and 113.
Hayes
Hayes
Gosper
Gosper
Furnas
Red Willow
Hitchcock
Dawson
Hitchcock
County
Frontier
County
Frontier
Lincoln
Dawson
Gosper
Hayes
Lincoln
Dawson
Gosper
Gosper
Furnas
Red Willow
Frontier County 2021 Average Acre Value Comparison
Gosper
Furnas
County
Frontier
Lincoln
Hitchcock
Red Willow
County
Frontier
Lincoln
Dawson
Gosper
Gosper
Furnas
Red Willow
Hitchcock
Hayes
32 Frontier Page 26
k
k
k
k
k
k
k
kk
k
k
k
k
k
k
k
k
k
k
k
k
k
kk
k
k
k
k
k
k
kk
k
k
k
k
k
k
k
k
k
k
k k
kk
k
k
k
k
k
k
k
k
k
k
k
k
k
k
kk
kk
k
k
k
k
kk
k
k
k
k
k
k
k
k
k
k
k
k
k
k
k
k
k
k
k
k
k
k
k
k
k
k
k
k
kk
k
kk
k
k
k
k
k
k
k
kk
k
k
k
k
k
k
k
k
kk
k
k
k
k
kk
k
k
k
k
k
k
k
k
k
k
k
k
kk
kk
k
k
k
k
k
k
k
k
k
k
k
kk
k
k
kk k
k
k
k
k
kk
k
k
k
k
k
k
kk
kk
k
k
k
k
k
kkk
k
k
k
k
k
k
k
kk
k
k
k
k
k
kk
k
k
k
k
k k
k
k
k k
k
k
k
kk
k
k k
k
k
k
k
k
k
k
k
k
k
k
k
k
k
k
k
k
k
k
k
k
k
k
k
k
k
k
k
k
k
k
k
k
k
k
k
k
k
k
k
k
k
k
k
k
k
k
k
k
k
k
k
k
kk
k
k
k
k
k
k
k
k
k
k
k
k
k
k
k
k
k
k
k
k
k
k
k
k kk
k
k
k
k
k
k
k
k
k
k
k
k
k
k
kk
k
k
k
k
k
k
k
k
k
k
kk
kkk
k
k
k
k
k
k
k
k
k
kkk
k k
k
k
k
k
kk
k
k
k
k
k
k
k
k
k
k
k
k
k
k
k
k
k
k
kk
kk
k
k
k
k
k
k
k
k
k
k
kk
k
k
k
k
k
kk
k
k
k
k
k
k
k
k
k
k
k
k
k
k
k
k k
k
k
k
k
k
k
k
k
k
k
k
k
k
k
k
k
k
k
k
k
k
k
k
k
k
k
k
k
k
k k
k
k
k
k
k
k
k
k
k
k
k
k
k
k
k
k
k
k
kk
k
k
k
k
k
k
k
k
k
k
k
k
kk
k
k
kk
kk
k
k
k
k
kk
k
k
kk
k
k
k
k
k
k
k k
k
k
k
k
k
k
k
k
k
k
k
k
k
k
k
k
k
k
k
k
k
k
k
k
k
k
kk
k
k
k
k
k
k
k
k
k
k
k
kk k
k
k
k
k
k
k
kk
k
k
k
k
k
k
k
k
k
k k
kk
k
k
k
k
k
k
k
k
k
k
k
k kk
k
k
k
k
k
k
k
k
k
k
k
k
k
k
k
k
k
k
k
k
k
k
k
k
k
k
k
k
k
k
k
k
k
k
k
k
k
k
k
k
k
k
k
k
k
k
kk
k
k
k
k
k
k
k
kk
k
k
k
k
k
k
kk
k
k
k
k
k
k
k
k
k
k
k
k
k
k
k
k
k
k
k
k
k
k
k
k
k
k
k
k
k
k
k
k
k
k
k
k
k
k
k
k
k
k
k
k
k
k
k
k
k
k
k
k
k
k
k
k
k
k
k
k
k
k
k
k
k
k
k
k
k
k
k
k
k
k
k
k
k
k
k
k
k
k
k
k
k
k
kk
k
k
k
k
k
k
k
k
k
k
k
kk
k
k
k
k
k
k
k
k
k
k
k
k
k
k
k
k
k
k
k
k
k
k
k
k
k
k
k
k
k
k
k
k
k
k
k
k
k
k
k
k
k
k
k
k
k
k
k
k
k
kk
k
k
k
k
k
k
k
k
k
k
k
k
k
k
k
k
kk
k
k
k
k
k
k
k
k
k
k
k
k
k
k
k
k
k
k
k
k
k
k
k
k
k
k
k
k
k
k
kk
k
k
k
k
k
k
k
k
k
k
k
k
k
k
k
k
k
k
k
k
k
kk
k
k
k
k
k
k
k
k
k
k
k
k
k
k
k
k
k
k
k
k
k
k
k
k
k
k
k
k
k
k
k
k
k
k
k
k
k
k
kk
k
k
k
k
k
k
k
k
k
k
k
k
k
kk
k
kk
k
k
k
k
k
k
k
k
k
k
k
k
kk
k
k
k
k
k
k
k
k
k
k
k
k
k
k
k
k
k
k
k
k
k
k
k
k
k
k
k
k
k
k
kk
k
k
k
k
k
k
k
k
k
k
k
k
k
k
k
k
k
k
k
k
k
k
k
k
k
kk
k
k
k
k
k
k
k
k
k
k
k
kk
k
k
k
k
k
k
k
k
k
k
k
k
k
k
k
k
k
k
k
k
k
k
k
k
k
k
k
k
k
k
k
k
k
k
k
k
k
k
k
k
k
k
k
k
k
k
k
k
k
k
k
k
k
k
k
k
k
k
k
k
k
k
k
k
k
k
k
k
kk
k
k
k
k
k
k
k
k
k
k
k
k
k
k
kkk
k
kk
k
k
k
k
k
k
k
k
k
k
k
k
k
k
k
k
k
kk
k
k
k
k
kk
k
k
k
k
k
k
k
k
kkk
k
k
k
k
k
k
k
k
k
k
k
kk
k
k
k
k
k
k
kk
k
k
k
kk
k
k
k
k
k
k
k
k
k
k
k
k
kk
k
k
k
k
k
k
k
k
k
k
k
k
k
k
k
k
k
k
k
k
k
k
k
k
k
k
k k
k
k
k
k
k
k
k
k
k
k
k
k
k
k
k
k
k
k
k
k
k
k
k
k
k
k
kk k
k
k
k
k
k
k
k
k
k
k
k
k
kk
k
k
k
k
k
k
k
kk
k
k
k
k
k
kk
k
k
kkk
k
k
k
k
k
k
k
k
k
k
k
k
k
k
k
k
k
k
kk
k
k
k
kk
k
k
k
k
k
k
k
k
k
k
k
k
k
k
k
k
k
k
k
k
k
k
k
k
k
k
k
k
k
k
k
kkk
k
k
k
k
k
k
k
k
k
k
k
k
k
k
k
k
k
k
k
k
k
k
k
k
k
k
k
k
k
k
k k
k
k
k
k
k
k
k
k
k
k
k
k
k
k
k
k
k
k
k
k
k
k
k
k
k
k
k
k
k
kk
k
k
k
k
k
k
k
k
k
k
k
k
k
k
k
kk
k
k
k
k
k
k k
k k k
k
k
k
k
k
k
k
k
k
kkk
k
k
k
k
k
kkk
k
k
k
k
k
k
k
k
k
k
k
k
k
k
k
k
k
k
k
k
k
k
k
kkk
k
k
k
k
k
k
k
k
k
k
k
k
k
k
k
k
k
k
k
k
k
k
k
k
k
k
k
k
k
k
k
k
k
k
k
k
kk
k
k
k
k
k
k
k
k
k
k
k
k
k
k
k
k
k
k
k
k
k
k
k
k
kk
k
k
k
k
k
k
k
k
k
k
k
k
k
k
k
k
k
k
kk
k
k
k
k
k
k
k
k
k
k
k
k
k
k
k
k
k
kk
k
k
k
k
k
k
k
k
k
k
k
k
k
k
k
k
k
k
k
k
k
k
k
k
k
k
k
kk
k
k
k
k
kk
k
k
k k
k
k
k
k
k
kk
k
k
k
k
k
k
k
kk
k
k
k
kk
k
k
k
k k
k
k
k
k
k
k
k
k
k
k
k
k k
k
k
k
k
k
k
k
k
k
k
k
k
k
k
kk
kk
k
k
k
k
kk
k
k
k
k
k
k
k
k
k
k
k
k
k
k
k
k
k
k
k
k
k
k
k
k
k k
k
k
k
k
k
k
k
k
k
k
k
k
k
k
k
k
k
k
k
k
k
k
k
k
k
k
k
k
k
k
k
k
k
k
k
k
k
k
kk
k
k
k
k
k
k
k
k
k
k
k
k
k
k
k
k
k
k
k
k
k
k
k
k
kk
k
k
k
k
k
k
k
k
k
k
k
k
k
k
k
k
k
k
k
k
k
kkk
kkk
kk k
k
k
k
k
k
kk
k
k
kk
k
k
k
k
k
k
k
k
k
k
kk
k
k
k
k
k
k
k
k
k
k
k
k
k
k
k
k
k
k
k
k
k
k
k
k
kk
k
kk
k
k
kk
k
k
k
k
k
k
k
k
k
k
k
kkk
k
k
k
k
k
k
k
k
k
k
k
k
k
k
k
k
k
k
k
k
k
k
k
k
k
k
k
k
k
k
k
k
k
k
k
k
kk
k
k
k
k
k
k
k
k
k
k
kk
k
k
k
k
k
k
k
k
k
kkkk
kk
k
k
k
k
k
k
k
k
k
k
k
k
k
k
k
k
k
k
k
k
k
k
k
k
k
k
k
k
k
k
k
k
k
k
k
k
k
k
k
k
k
k
k
k
k
k
k
k
k
k k
k
k
k
k
k
k
k
k
k
k
k
k
k
k
k
kk
kkk
k
k
k
kk
k
k
kk
k
k
k
k
k
k
k
k
k
k
k
k k
kk
k
k
k
k
k
k
k
k
k
k
kk
k
k
k k
k
k
k
k
k
kk
k
k
k
kk
k
k
k
k
kk
k
k
k
k
k
k
k
k
k
k
k
k
k
k
k
k
k
k
k
k k
k
k
k
k
k
kk
kk
k
kk
k
k
k
k
k
k
k
k
k
k
k
k
k
k
k
k
k
k
k
k
k
k
k
k
k
k
k
k
k
k
k
k k
k
kk
k
k
k
k
kk
k
k
k
k
k
k
k
k
k
k
k
k
k
k
k
k
k
k
k
k
k
k
k
k
k
k
kk
k k
k
k
k
k
k
k
kk
k
k
kk
k
k
k
k
k
k
k
kk
k
kk
k
kk
k
k
k
k
k
k
k
k
k
kkkkk
k
k
k
k
k
k
k
k
k
k
k
k
k
k
kk
k
k
k
k
kk
k
k
k
k
kk
kk
k
k
kk
k
k
k
k
k
k
k
k
kk
kk
k
k
k
k
k
k
k
k
k
k
k
k
k
k
k k
k k
k k k k
k
k
k
k
k
k
k
k
k
k
k
k
k
k
k
k
k
k
k
k
kk
k
k
k
k
k
k
kk
k
k
k
k
k
k
kk
k
k
k
k
k
k
k
k
k
k
k
k
k
k
k
k
k
k
k
k
k
k
k
k
k
kk
k
k k
k k
k
k
k
k
k
k
k
k
k
k
k
k
k
k
k k
k
kkk
k
k
k
k
k
kk
k
k
k
k
k
k
k
k
kkk
kkk
k
k
k
k
k
k
k
k
k
k
k
k
k
k
k
k
k
k
k
k
k
k
k
k
k
k
k
k
k
k
k
kk
k
k
k
k
k
k
k
k
k
kk
k
k
kkk
k
kk
kk
k
k
k
k
k
k
k
k
kk
k
k
kkkkk
k
k
k
k
k
k
k
k
k
k
k
k
kk
k
k
k
k
k
k
k
k
k kk
k
kk
kk
k
k
k
k
k
k
k
kk
k
k
k
k
k
k
k
k
k
k
k
k
k
k
k
k
k
k
k
kk
kk
k
k
kkkkk
k
k
kk
k
k
k
k
k
k
k
k
k
k
k
k
k
k
kkk
k
kk
k
k
k
kk
k
k
k
k
k
k
k
k
k
k
k
k
k
k
k
k
k
k
k
k
k
kk
k
k
k
k
k
k
k
k
k
k
k
k
k
k
k
k
k
kk
kk
k
k
k
k
k
k
k
k
k
k
k
k
k
k
k
k
k
k
k
k
k
k
k
kkkkkk
k
k
k
k
k
k
k
k
k
k
k
k
k
k
k
k
k
k
k
k
k
k
k
k
k
k
k
k
k
k
k
k
k
k
k k
k
kk
k k
k
k
k
k
k
k
k
k
k
k
k
k
k
k
k
k
kkk
k
k
k
k
k
k
k
k
k
k
k
k
k
kkkk
k
k
k
k
k
k
k
k
k
k
k
k
k
k
k
k
k
k
k
kk
k
k
k
kk
k
kk
k
kkkk
k
k
kk
k
k
k
k
k
k
k
k
k
k
kk
k
k
k
k
k
k
k
k
k
k
k
kk
k
k
k
k
k
k
k
k
k
k
k
k
k
k
k
k
k
k
k
k
k
k
k
k
k
k
kk
k
k
k
kk
k
k
k
k
k
k
k
k
k
k
k
kk
k
k
k
k
kk k
k
k
k
kk
k
k
k
k
k
k
k
kk
k
k
k
k
k
k
k
k
k
k
k
k
k
k
k
k
k
kk
k
k
k
k
k
k
k
k k
k
k
k
k
k
k
k
k
k
kk
kkk
k
k
k
k
k
k
k
k
k
k
k
k
k
k
k
k
k
k
k
k
k
k
k
k
k
k
k
k
k
k
k
k
k
k
kk
k
k
k
k
k
k
k
k
k
k
k
k
k
kk
k
kk
k
k
k
k
k
k
k
k
k
k
k
k
k
k
k
k
k
k
k
k
k
k
k
k
k
k
k
k
kk
k
k
k
k
k
k
k
k
k
k
k
k
k
k
k
k
k
k
k
k k
k
k
k
k
k
k
k
k
k
k
k
k
k
k
k
k
k
k
k
k
k
k
kk
k
k
k
k
kk
k
k
k
k
k
k
k
k
k
k
k
k
k
k
k
k
k
k
k
k
k
k
k
k
k
k
k
k
k
k
k
k
k
k
k
k
k
k
k
k
k
k
k
k
k
k
k
k
kk
k
k
k
k
kk
k
k
k
k
k
k
k
k
k
k
k
k
k
k
k
k
k
k
k
k
k
k
k
k
k
k
k
k
k
k
kk
k
k
k
kk
k
k
k
k
k
k
k
k
k
k
k
k
k
k
k
k
kk
k
k
k
k
k
k
k
k
k
k
k
k
k
k
k
k
k
k
k
k
k
k
k
k
k
kk
k
k
k
k
k
k
k
k
k
k
k
k
k
k
k
k
k
k
k
k
k
k
k
k
k
k
k
k
k
k
k
k
k
k
k
k
k
k
k
k
k
k
k
k
k
k
k
k
k
k
k
k
k
k
k
k
k
k
k
k
k
k
k
k
k
k
k
k
k
k
k k
k
k
k
k
k
k
k
k
k
k
k
k
k
k
k
k
k
k
k k
k
k
k
k
k
k
k
k
k
k
k
k
k
k
k
k
k
k
k
k
k
k
kk
k
k
k
k
k
k
k
k
k
k
k
k
k
k
k
k
k
k
k
k
k
k
k
k
k
k
k
k
kk k
kk
k
kk
k
k
k
k
k
k
kkk
k
k
k
k
k
kk
k
k
k
k
k
k
k
k
k
k
k
k
k
k
k
k
k
k
k
k
k
k
k
k
k
kk
k
k
k
k
k
kk
k
k
k
k
k
k
kk
k
k
k
k
k
k
k
k
kk
k
k
k
k
k
k
k
k
k
k
k
k
k
k
k
k
k
k
k
kk
k
k
k
k
k
k k
k
k
k
kk
k
k
k
k
k
k
k
k
k
k
k
k
k
k
kk
k
k
k
k
k
k
k
k
k
k
k
k
k
k
k
k
k
k
k
k
k
k
k
k
k
k
k
k
k
k
k
k
k
k
k
k
k
k
k
k
k
k
k
k
k
k
k
k
k
k
kk
k
k
k
k
k
k
k
k
k
k
k
k
k
k
k
k
k
k
k
k
k
k
k
k
k
k
k
k
k
k
k
k
k
k
k
k
k
k
k
k
kk
k
k
k
k
k
k
k
k
k
k
k
k
k
kk
k
k
k
k
k
k
k
k
k
k
k
k
k
k
k
k
k
k
k
k
k
k
k
k
k
k
k
k
k
k
k
k
k
k
k
k
k
kk
k
k
k
k
k
k
k
k
k
k
k
k
k
k
kk
k
k
k
k
k
k
kk
k
k
k
k
k
k
k
k
k
k
k
k
k
k
k
k
k
k
k
k
k
k
k
k
k
k
k
k
k
k
k
k
k
k
k
k
k
k
k
k
k
k
k
k
k
k
k
k
k
k
k
k
k
k
k
k
k
k
k
k
k
k
k
k
kk
k
k
Cozad
McCook
ArapahoeCambridge
Curtis
BartleyCulbertson
Eustis
Farnam
Holbrook
Indianola
Maywood
Moorefield
Stockville
Wellfleet
Willow Island3353 3351 3349 33453347 3343 3341 3339 3337 3335
3395 3397 3399 3401 3403 3405 3407 3409 3411 3413
3577 3575 3573 3571 3569 3567 3565 3563 3561 3559
3621 36233625
3627 3629 3631 3633 3635 36373639
3809 3807 3805 38033801
3799 3797 3795 3793 3791
38573855 3859 3861 3863 3865 3867 3869 38713873
4045 4043 4041 4039 4037 4035 4033 4031 4029
4027
4089 40914093
4095 4097 4099 4101 41034105
4107
4287
4285 4283 4281 4279 4277 4275 4273 4271 4269
43294331 4333 4335 4337 4339 4341 4343 4345 4347
Dawson
Gosper
Lincoln
Hayes
Frontier
Hitchcock
Red Willow Furnas33_1
44_1
24_2
24_1
37_4
37_1
56_3
56_4
56_1
43_1
73_1
32_1
44_2
FRONTIER COUNTY ´
LegendMarket_AreaCounty
k Registered_WellsDNRgeocodeFederal Roads
SoilsCLASS
Excesssive drained sandy soils formed in alluvium in valleys and eolian sand on uplands in sandhillsExcessively drained sandy soils formed in eolian sands on uplands in sandhillsModerately well drained silty soils on uplands and in depressions formed in loessWell drained silty soils formed in loess on uplandsWell drained silty soils formed in loess and alluvium on stream terracesWell to somewhat excessively drained loamy soils formed in weathered sandstone and eolian material on uplandsSomewhat poorly drained soils formed in alluvium on bottom landsModerately well drained silty soils with clay subsoils on uplandsLakes
32 Frontier Page 27

Tax Residential & Recreational (1)
Commercial & Industrial (1)
Year Value Amnt Value Chg Ann.%chg Cmltv%chg Value Amnt Value Chg Ann.%chg Cmltv%chg Value Amnt Value Chg Ann.%chg Cmltv%chg2010 52,281,060 '-- '-- '-- 16,745,440 '-- '-- '-- 261,200,582 '-- -- --2011 53,052,071 771,011 1.47% 1.47% 16,950,620 205,180 1.23% 1.23% 287,406,487 26,205,905 10.03% 10.03%2012 54,616,760 1,564,689 2.95% 4.47% 17,310,824 360,204 2.13% 3.38% 342,320,389 54,913,902 19.11% 31.06%2013 56,695,775 2,079,015 3.81% 8.44% 18,016,208 705,384 4.07% 7.59% 423,642,816 81,322,427 23.76% 62.19%2014 57,265,187 569,412 1.00% 9.53% 19,833,229 1,817,021 10.09% 18.44% 574,950,032 151,307,216 35.72% 120.12%2015 59,992,811 2,727,624 4.76% 14.75% 21,934,456 2,101,227 10.59% 30.99% 724,821,727 149,871,695 26.07% 177.50%2016 62,752,118 2,759,307 4.60% 20.03% 22,362,106 427,650 1.95% 33.54% 747,320,413 22,498,686 3.10% 186.11%2017 67,391,438 4,639,320 7.39% 28.90% 22,594,307 232,201 1.04% 34.93% 747,374,509 54,096 0.01% 186.13%2018 67,069,482 -321,956 -0.48% 28.29% 23,303,443 709,136 3.14% 39.16% 682,428,280 -64,946,229 -8.69% 161.27%2019 69,154,352 2,084,870 3.11% 32.27% 23,785,014 481,571 2.07% 42.04% 650,748,108 -31,680,172 -4.64% 149.14%2020 69,667,709 513,357 0.74% 33.26% 20,914,984 -2,870,030 -12.07% 24.90% 621,890,958 -28,857,150 -4.43% 138.09%
Rate Annual %chg: Residential & Recreational 2.91% Commercial & Industrial 2.25% Agricultural Land 9.06%
Cnty# 32
County FRONTIER CHART 1
(1) Residential & Recreational excludes Agric. dwelling & farm home site land. Commercial & Industrial excludes minerals. Agricultural land includes irrigated, dry, grass, waste, & other agland, excludes farm site land.Source: 2010 - 2020 Certificate of Taxes Levied Reports CTL NE Dept. of Revenue, Property Assessment Division Prepared as of 03/01/2021
Total Agricultural Land (1)
-60%-40%-20%0%20%40%60%80%100%120%140%160%180%200%220%240%260%280%300%320%340%360%380%400%420%440%460%480%500%
2010 2011 2012 2013 2014 2015 2016 2017 2018 2019 2020
CHART 1 - REAL PROPERTY VALUATIONS - Cumulative %Change 2010-2020ResRec
Comm&Indust
Total Agland
32 Frontier Page 28

Residential & Recreational (1)
Tax Growth % growth Value Ann.%chg Cmltv%chg Growth % growth Value Ann.%chg Cmltv%chgYear Value Value of value Exclud. Growth w/o grwth w/o grwth Value Value of value Exclud. Growth w/o grwth w/o grwth
2010 52,281,060 695,828 1.33% 51,585,232 '-- '-- 16,745,440 270,000 1.61% 16,475,440 '-- '--
2011 53,052,071 171,969 0.32% 52,880,102 1.15% 1.15% 16,950,620 258,610 1.53% 16,692,010 -0.32% -0.32%2012 54,616,760 267,971 0.49% 54,348,789 2.44% 3.96% 17,310,824 282,322 1.63% 17,028,502 0.46% 1.69%2013 56,695,775 104,119 0.18% 56,591,656 3.62% 8.25% 18,016,208 1,299,623 7.21% 16,716,585 -3.43% -0.17%2014 57,265,187 422,223 0.74% 56,842,964 0.26% 8.73% 19,833,229 1,144,598 5.77% 18,688,631 3.73% 11.60%2015 59,992,811 271,146 0.45% 59,721,665 4.29% 14.23% 21,934,456 2,007,909 9.15% 19,926,547 0.47% 19.00%2016 62,752,118 379,610 0.60% 62,372,508 3.97% 19.30% 22,362,106 387,869 1.73% 21,974,237 0.18% 31.23%2017 67,391,438 332,899 0.49% 67,058,539 6.86% 28.27% 22,594,307 111,891 0.50% 22,482,416 0.54% 34.26%2018 67,069,482 156,503 0.23% 66,912,979 -0.71% 27.99% 23,303,443 0 0.00% 23,303,443 3.14% 39.16%2019 69,154,352 186,068 0.27% 68,968,284 2.83% 31.92% 23,785,014 286,436 1.20% 23,498,578 0.84% 40.33%2020 69,667,709 395,639 0.57% 69,272,070 0.17% 32.50% 20,914,984 0 0.00% 20,914,984 -12.07% 24.90%
Rate Ann%chg 2.91% Resid & Recreat w/o growth 2.49% 2.25% C & I w/o growth -0.65%
Tax Agric. Dwelling & Ag Outbldg & Ag Imprv&Site Growth % growth Value Ann.%chg Cmltv%chgYear Homesite Value Farmsite Value Total Value Value of value Exclud. Growth w/o grwth w/o grwth2010 22,334,698 12,570,772 34,905,470 791,479 2.27% 34,113,991 '-- '-- (1) Residential & Recreational excludes AgDwelling2011 25,451,145 20,716,088 46,167,233 383,543 0.83% 45,783,690 31.16% 31.16% & farm home site land; Comm. & Indust. excludes2012 25,654,690 21,132,427 46,787,117 657,684 1.41% 46,129,433 -0.08% 32.16% minerals; Agric. land includes irrigated, dry, grass,2013 26,962,052 22,396,000 49,358,052 1,754,035 3.55% 47,604,017 1.75% 36.38% waste & other agland, excludes farm site land.2014 27,218,575 22,894,876 50,113,451 923,250 1.84% 49,190,201 -0.34% 40.92% Real property growth is value attributable to new 2015 36,065,239 34,165,608 70,230,847 882,806 1.26% 69,348,041 38.38% 98.67% construction, additions to existing buildings, 2016 36,741,183 35,193,180 71,934,363 1,474,544 2.05% 70,459,819 0.33% 101.86% and any improvements to real property which2017 36,865,049 36,164,082 73,029,131 1,218,171 1.67% 71,810,960 -0.17% 105.73% increase the value of such property.2018 37,490,019 36,495,795 73,985,814 750,579 1.01% 73,235,235 0.28% 109.81% Sources:2019 43,428,791 39,146,374 82,575,165 419,034 0.51% 82,156,131 11.04% 135.37% Value; 2010 - 2020 CTL2020 43,685,860 44,944,515 88,630,375 595,633 0.67% 88,034,742 6.61% 152.21% Growth Value; 2010-2020 Abstract of Asmnt Rpt.
Rate Ann%chg 6.94% 13.59% 9.77% Ag Imprv+Site w/o growth 8.90%
Cnty# 32 NE Dept. of Revenue, Property Assessment DivisionCounty FRONTIER CHART 2
Commercial & Industrial (1)
Ag Improvements & Site Land (1)
-60%-40%-20%0%20%40%60%80%100%120%140%160%180%200%220%240%260%280%300%320%340%360%380%400%420%440%460%480%500%
2010 2011 2012 2013 2014 2015 2016 2017 2018 2019 2020
CHART 2 - REAL PROPERTY & GROWTH VALUATIONS - Cumulative %Change 2010-2020ResRec
Comm&Indust
Ag Imprv+SiteLand
32 Frontier Page 29

Tax Irrigated Land Dryland
Year Value Value Chg Ann%chg Cmltv%chg Value Value Chg Ann%chg Cmltv%chg Value Value Chg Ann%chg Cmltv%chg2010 71,573,725 '-- '-- '-- 78,732,524 '-- '-- '-- 110,894,333 '-- -- '--2011 71,575,751 2,026 0.00% 0.00% 90,167,033 11,434,509 14.52% 14.52% 125,663,703 14,769,370 13.32% 13.32%2012 95,225,460 23,649,709 33.04% 33.05% 119,592,175 29,425,142 32.63% 51.90% 127,502,754 1,839,051 1.46% 14.98%2013 143,824,512 48,599,052 51.04% 100.95% 137,985,058 18,392,883 15.38% 75.26% 141,833,246 14,330,492 11.24% 27.90%2014 193,782,968 49,958,456 34.74% 170.75% 192,026,028 54,040,970 39.16% 143.90% 189,141,036 47,307,790 33.35% 70.56%2015 227,371,967 33,588,999 17.33% 217.68% 260,760,046 68,734,018 35.79% 231.20% 236,689,714 47,548,678 25.14% 113.44%2016 249,800,253 22,428,286 9.86% 249.01% 260,808,004 47,958 0.02% 231.26% 236,712,156 22,442 0.01% 113.46%2017 249,646,195 -154,058 -0.06% 248.80% 260,857,009 49,005 0.02% 231.32% 236,871,305 159,149 0.07% 113.60%2018 224,718,978 -24,927,217 -9.99% 213.97% 221,025,754 -39,831,255 -15.27% 180.73% 236,683,548 -187,757 -0.08% 113.43%2019 225,138,215 419,237 0.19% 214.55% 196,901,790 -24,123,964 -10.91% 150.09% 228,708,103 -7,975,445 -3.37% 106.24%2020 219,715,772 -5,422,443 -2.41% 206.98% 187,558,042 -9,343,748 -4.75% 138.22% 214,396,418 -14,311,685 -6.26% 93.33%
Rate Ann.%chg: Irrigated 11.87% Dryland 9.07% Grassland 6.81%
Tax Waste Land (1)
Other Agland (1)
Total Agricultural
Year Value Value Chg Ann%chg Cmltv%chg Value Value Chg Ann%chg Cmltv%chg Value Value Chg Ann%chg Cmltv%chg2010 0 '-- '-- '-- 0 '-- '-- '-- 261,200,582 '-- '-- '--2011 0 0 0 0 287,406,487 26,205,905 10.03% 10.03%2012 0 0 0 0 342,320,389 54,913,902 19.11% 31.06%2013 0 0 0 0 423,642,816 81,322,427 23.76% 62.19%2014 0 0 0 0 574,950,032 151,307,216 35.72% 120.12%2015 0 0 0 0 724,821,727 149,871,695 26.07% 177.50%2016 0 0 0 0 747,320,413 22,498,686 3.10% 186.11%2017 0 0 0 0 747,374,509 54,096 0.01% 186.13%2018 0 0 0 0 682,428,280 -64,946,229 -8.69% 161.27%2019 0 0 0 0 650,748,108 -31,680,172 -4.64% 149.14%2020 0 0 220,726 220,726 621,890,958 -28,857,150 -4.43% 138.09%
Cnty# 32 Rate Ann.%chg: Total Agric Land 9.06%
County FRONTIER
Source: 2010 - 2020 Certificate of Taxes Levied Reports CTL NE Dept. of Revenue, Property Assessment Division Prepared as of 03/01/2021 CHART 3
Grassland
-60%-40%-20%0%20%40%60%80%100%120%140%160%180%200%220%240%260%280%300%320%340%360%380%400%420%440%460%480%500%
2010 2011 2012 2013 2014 2015 2016 2017 2018 2019 2020
CHART 3 - AGRICULTURAL LAND VALUATIONS - Cumulative %Change 2010-2020
Irrigated
Dryland
Total Agland
Grassland
32 Frontier Page 30

CHART 4 - AGRICULTURAL LAND - AVERAGE VALUE PER ACRE - Cumulative % Change 2010-2020 (from County Abstract Reports)(1)
IRRIGATED LAND DRYLAND GRASSLAND
Tax Avg Value Ann%chg Cmltv%chg Avg Value Ann%chg Cmltv%chg Avg Value Ann%chg Cmltv%chgYear Value Acres per Acre AvgVal/acre AvgVal/Acre Value Acres per Acre AvgVal/acre AvgVal/Acre Value Acres per Acre AvgVal/acre AvgVal/Acre
2010 71,520,632 74,845 956 78,762,652 158,007 498 81,700,995 133,333 613
2011 71,481,169 74,859 955 -0.07% -0.07% 90,220,805 157,350 573 15.03% 15.03% 89,688,965 135,300 663 8.18% 9.46%2012 95,226,097 74,821 1,273 33.29% 33.19% 119,593,628 157,319 760 32.58% 52.50% 89,574,800 130,628 686 3.44% 13.24%2013 143,824,512 75,417 1,907 49.84% 99.57% 137,985,084 157,559 876 15.20% 75.69% 97,239,960 127,646 762 11.09% 25.80%2014 193,782,307 75,527 2,566 34.54% 168.50% 192,033,009 157,398 1,220 39.31% 144.75% 128,539,130 127,483 1,008 32.36% 66.50%2015 227,400,649 76,624 2,968 15.67% 210.57% 260,768,361 156,133 1,670 36.89% 235.06% 149,636,865 127,257 1,176 16.62% 94.17%2016 249,782,976 76,466 3,267 10.07% 241.84% 260,779,569 156,133 1,670 0.00% 235.07% 164,929,515 127,713 1,291 9.83% 113.25%2017 249,786,444 76,425 3,268 0.06% 242.03% 260,857,129 156,178 1,670 0.00% 235.07% 174,353,050 127,360 1,369 6.01% 126.06%2018 224,718,978 76,478 2,938 -10.10% 207.49% 221,025,751 156,170 1,415 -15.26% 183.92% 167,960,980 130,138 1,291 -5.72% 113.13%2019 225,138,602 76,625 2,938 0.00% 207.48% 196,904,708 154,987 1,270 -10.23% 154.87% 167,183,410 129,675 1,289 -0.11% 112.90%2020 219,727,926 76,944 2,856 -2.81% 198.84% 187,420,850 154,669 1,212 -4.62% 143.09% 214,272,129 365,026 587 -54.47% -4.20%
Rate Annual %chg Average Value/Acre: 11.57% 9.29% -0.43%
WASTE LAND (2)
OTHER AGLAND (2)
TOTAL AGRICULTURAL LAND (1)
Tax Avg Value Ann%chg Cmltv%chg Avg Value Ann%chg Cmltv%chg Avg Value Ann%chg Cmltv%chgYear Value Acres per Acre AvgVal/acre AvgVal/Acre Value Acres per Acre AvgVal/acre AvgVal/Acre Value Acres per Acre AvgVal/acre AvgVal/Acre
2010 0 0 0 0 261,151,581 596,354 438
2011 0 0 0 0 287,366,411 596,453 482 10.02% 10.02%2012 0 0 0 0 342,330,361 596,448 574 19.13% 31.06%2013 0 0 0 0 342,330,361 596,656 710 23.71% 62.14%2014 0 0 0 0 574,953,111 596,651 964 35.72% 120.05%2015 0 0 0 0 724,854,287 596,883 1,214 26.02% 177.31%2016 0 0 0 0 747,272,549 596,764 1,252 3.11% 185.95%2017 0 0 0 0 747,366,855 596,789 1,252 0.01% 185.97%2018 0 0 0 0 682,428,288 596,772 1,144 -8.69% 161.13%2019 0 0 0 0 650,663,320 596,493 1,091 -4.61% 149.09%2020 - 0 220,726 196 1,125 621,641,631 596,835 1,042 -4.52% 137.85%
32 Rate Annual %chg Average Value/Acre: 9.05%
FRONTIER
(1) Valuations from County Abstracts vs Certificate of Taxes Levied Reports (CTL) will vary due to different reporting dates. Source: 2010 - 2020 County Abstract ReportsAgland Assessment Level 1998 to 2006 = 80%; 2007 & forward = 75% NE Dept. of Revenue, Property Assessment Division Prepared as of 03/01/2021 CHART 4
Source: 2010 - 2020 Certificate of Taxes Levied Reports CTL NE Dept. of Revenue, Property Assessment Division Prepared as of 03/01/2021
32 Frontier Page 31

CHART 5 - 2020 County and Municipal Valuations by Property Type
Pop. County: Personal Prop StateAsd PP StateAsdReal Residential Commercial Industrial Recreation Agland Agdwell&HS AgImprv&FS Minerals Total Value
2,756 FRONTIER 32,972,443 13,305,777 3,192,286 60,945,508 20,914,984 0 8,722,201 621,890,958 43,685,860 44,944,515 385,920 850,960,452
cnty sectorvalue % of total value: 3.87% 1.56% 0.38% 7.16% 2.46% 1.02% 73.08% 5.13% 5.28% 0.05% 100.00%
Pop. Municipality: Personal Prop StateAsd PP StateAsd Real Residential Commercial Industrial Recreation Agland Agdwell&HS AgImprv&FS Minerals Total Value
939 CURTIS 1,965,196 474,667 100,909 21,531,998 5,053,669 0 0 67,773 0 0 0 29,194,212
34.07% %sector of county sector 5.96% 3.57% 3.16% 35.33% 24.16% 0.01% 3.43% %sector of municipality 6.73% 1.63% 0.35% 73.75% 17.31% 0.23% 100.00%
401 EUSTIS 1,400,071 271,440 52,187 15,845,967 4,324,493 0 0 12,924 0 0 0 21,907,082
14.55% %sector of county sector 4.25% 2.04% 1.63% 26.00% 20.68% 0.00% 2.57% %sector of municipality 6.39% 1.24% 0.24% 72.33% 19.74% 0.06% 100.00%
261 MAYWOOD 204,567 112,023 45,093 6,827,087 6,295,886 0 0 66,623 292,431 76,382 0 13,920,092
9.47% %sector of county sector 0.62% 0.84% 1.41% 11.20% 30.10% 0.01% 0.67% 0.17% 1.64% %sector of municipality 1.47% 0.80% 0.32% 49.04% 45.23% 0.48% 2.10% 0.55% 100.00%
32 MOOREFIELD 70,880 8,522 20,981 767,797 419,760 0 0 40,704 0 0 0 1,328,644
1.16% %sector of county sector 0.21% 0.06% 0.66% 1.26% 2.01% 0.01% 0.16% %sector of municipality 5.33% 0.64% 1.58% 57.79% 31.59% 3.06% 100.00%
25 STOCKVILLE 57,715 92,294 908 756,882 73,038 0 0 33,295 0 0 0 1,014,132
0.91% %sector of county sector 0.18% 0.69% 0.03% 1.24% 0.35% 0.01% 0.12% %sector of municipality 5.69% 9.10% 0.09% 74.63% 7.20% 3.28% 100.00%
0 0 0 0 0 0 0 0 0 0 0 0 0 0
%sector of county sector %sector of municipality
0 0 0 0 0 0 0 0 0 0 0 0 0 0
%sector of county sector %sector of municipality
0 0 0 0 0 0 0 0 0 0 0 0 0 0
%sector of county sector %sector of municipality
0 0 0 0 0 0 0 0 0 0 0 0 0 0
%sector of county sector %sector of municipality
0 0 0 0 0 0 0 0 0 0 0 0 0 0
%sector of county sector %sector of municipality
0 0 0 0 0 0 0 0 0 0 0 0 0 0
%sector of county sector %sector of municipality
0 0 0 0 0 0 0 0 0 0 0 0 0 0
%sector of county sector %sector of municipality
0 0 0 0 0 0 0 0 0 0 0 0 0 0
%sector of county sector %sector of municipality
0 0 0 0 0 0 0 0 0 0 0 0 0 0
%sector of county sector %sector of municipality
0 0 0 0 0 0 0 0 0 0 0 0 0 0
%sector of county sector %sector of municipality
1,658 Total Municipalities 3,698,429 958,946 220,078 45,729,731 16,166,846 0 0 221,319 292,431 76,382 0 67,364,162
60.16% %all municip.sectors of cnty 11.22% 7.21% 6.89% 75.03% 77.30% 0.04% 0.67% 0.17% 7.92%
32 FRONTIER Sources: 2020 Certificate of Taxes Levied CTL, 2010 US Census; Dec. 2020 Municipality Population per Research Division NE Dept. of Revenue, Property Assessment Division Prepared as of 03/01/2021 CHART 5
Source: 2010 - 2020 Certificate of Taxes Levied Reports CTL NE Dept. of Revenue, Property Assessment Division Prepared as of 03/01/2021
32 Frontier Page 32

FrontierCounty 32 2021 County Abstract of Assessment for Real Property, Form 45
01. Res UnImp Land
02. Res Improve Land
79 426,985 12 197,365 10 88,095 101 712,445
692 6,514,664 43 1,552,300 72 3,545,575 807 11,612,539
696 44,327,347 43 4,557,774 76 6,669,111 815 55,554,232
916 67,879,216 243,553
232,675 22 139,600 3 8,960 1 84,115 18
131 669,583 4 30,510 13 326,273 148 1,026,366
20,240,876 174 4,111,682 31 91,688 4 16,037,506 139
196 21,499,917 538,226
03. Res Improvements
04. Res Total
05. Com UnImp Land
06. Com Improve Land
07. Com Improvements
08. Com Total
4,005 809,079,704 1,738,280 Total Real Property
Growth Value : Records : Sum Lines 17, 25, & 30 Sum Lines 17, 25, & 41
09. Ind UnImp Land
10. Ind Improve Land
11. Ind Improvements
12. Ind Total
13. Rec UnImp Land
14. Rec Improve Land
15. Rec Improvements
16. Rec Total
17. Taxable Total
0 0 0 0 0 0 0 0
0 0 0 0 0 0 0 0
0 0 0 0 0 0 0 0
0 0 0
0 0 0 0 3 105,109 3 105,109
0 0 0 0 10 339,557 10 339,557
0 0 0 0 147 8,371,715 147 8,371,715
150 8,816,381 84,029
1,262 98,195,514 865,808
Urban SubUrban Rural Total GrowthRecords Value Records Value Records Value Records Value
Schedule I : Non-Agricultural Records
% of Res Total
% of Com Total
% of Ind Total
% of Rec Total
% of Taxable Total
% of Res & Rec Total
Res & Rec Total
% of Com & Ind Total
Com & Ind Total
84.61 75.53 6.00 9.29 9.39 15.18 22.87 8.39
21.39 24.13 31.51 12.14
157 16,791,204 5 131,158 34 4,577,555 196 21,499,917
1,066 76,695,597 775 51,268,996 236 19,119,162 55 6,307,439
66.85 72.70 9.48 26.62 8.22 5.16 24.93 22.14
0.00 0.00 1.09 3.75 0.00 0.00 100.00 100.00
78.10 80.10 2.66 4.89 0.61 2.55 21.29 17.35
0.00 0.00 0.00 0.00 0.00 0.00 0.00 0.00
78.10 80.10 2.66 4.89 0.61 2.55 21.29 17.35
6.56 4.75 69.31 73.85
86 10,302,781 55 6,307,439 775 51,268,996
34 4,577,555 5 131,158 157 16,791,204
0 0 0 0 0 0
150 8,816,381 0 0 0 0
932 68,060,200 60 6,438,597 270 23,696,717
30.96
0.00
4.83
14.01
49.81
30.96
18.85
538,226
327,582
32 Frontier Page 33

FrontierCounty 32 2021 County Abstract of Assessment for Real Property, Form 45
18. Residential
Records
TotalRural
SubUrban Urban
Schedule II : Tax Increment Financing (TIF)
Value Base Value Excess Value ExcessValue BaseRecords
0 0 0 0 0 0
19. Commercial
20. Industrial
21. Other
22. Total Sch II
1 24,672 374,285
0 0 0
0 0 0 0 0 0
0 0 0
0 0 0
Value ExcessValue BaseRecordsValue ExcessValue BaseRecords
21. Other
20. Industrial
19. Commercial
18. Residential 0 0 0 0 0 0
0 0 0 1 24,672 374,285
0 0 0 0 0 0
0 0 0 0 0 0
1 24,672 374,285
23. Producing
GrowthValueRecords
TotalValueRecords
RuralValueRecords
SubUrbanValueRecords
UrbanSchedule III : Mineral Interest Records
0 0 0 0 12 217,200 12 217,200 0
0 0 0 0 0 0 0 0 0
0 0 0 0 0 0 12 217,200 0
Mineral Interest
24. Non-Producing
25. Total
Schedule IV : Exempt Records : Non-Agricultural
Schedule V : Agricultural Records
Records Records Records RecordsTotalRural SubUrban Urban
26. Exempt 96 1 287 384
29. Ag Improvements
28. Ag-Improved Land
ValueRecordsTotal
ValueRecordsRural
Records Value SubUrban
ValueRecords
27. Ag-Vacant Land
Urban
14 229,890 0 0 2,068 433,892,473 2,082 434,122,363
1 36,752 3 465,819 617 209,989,723 621 210,492,294
1 60,339 3 398,887 645 65,593,107 649 66,052,333
32 Frontier Page 34

FrontierCounty 32 2021 County Abstract of Assessment for Real Property, Form 45
30. Ag Total 2,731 710,666,990
31. HomeSite UnImp Land
Records
TotalRural
SubUrban UrbanSchedule VI : Agricultural Records :Non-Agricultural Detail
Acres Value ValueAcresRecords
32. HomeSite Improv Land
33. HomeSite Improvements
34. HomeSite Total
ValueAcresRecordsValueAcres
34. HomeSite Total
33. HomeSite Improvements
32. HomeSite Improv Land
31. HomeSite UnImp Land
35. FarmSite UnImp Land
36. FarmSite Improv Land
37. FarmSite Improvements
38. FarmSite Total
37. FarmSite Improvements
36. FarmSite Improv Land
35. FarmSite UnImp Land
39. Road & Ditches
38. FarmSite Total
39. Road & Ditches
Records
40. Other- Non Ag Use
40. Other- Non Ag Use
41. Total Section VI
0 0.00 0 0 0.00 0
1 1.00 22,000
1 0.00 58,817 3
0 0.00 0 0
1 0.83 4,150 3
1 0.00 1,522 3
0 0.00 0 0
0 0.00 0 0 0.00 0
0 0.00
7,869 0.00
33,650 6.73
0.00 0
391,018 0.00
66,000 3.00 3
2 44,000 2.00 2 2.00 44,000
378 394.00 8,668,000 382 398.00 8,756,000
378 0.00 34,664,200 382 0.00 35,114,035
384 400.00 43,914,035
134.94 52 651,740 52 134.94 651,740
598 3,157.16 13,620,560 602 3,164.72 13,658,360
621 0.00 30,928,907 625 0.00 30,938,298
677 3,299.66 45,248,398
0 5,652.04 0 0 5,652.04 0
0 0.00 0 0 0.00 0
1,061 9,351.70 89,162,433
Growth
396,735
475,737
872,472
32 Frontier Page 35

FrontierCounty 32 2021 County Abstract of Assessment for Real Property, Form 45
42. Game & Parks
ValueAcresRecords
SubUrban
ValueAcresRecords
Urban
0 0.00 0 0 0.00 0
42. Game & Parks
ValueAcresRecordsTotal
ValueAcresRecordsRural
Schedule VII : Agricultural Records :Ag Land Detail - Game & Parks
0 0.00 0 0 0.00 0
Schedule VIII : Agricultural Records : Special Value
43. Special Value
ValueAcresRecords SubUrban
ValueAcresRecords Urban
43. Special Value
ValueAcresRecordsTotal
ValueAcresRecordsRural
44. Market Value
44. Market Value
0 0.00 0 0 0.00 0
0 0.00 0 0 0.00 0
0 0.00 0 0 0.00 0
0 0 0 0 0 0
32 Frontier Page 36

1Market AreaSchedule IX : Agricultural Records : Ag Land Market Area Detail
2021 County Abstract of Assessment for Real Property, Form 45Frontier32County
45. 1A1
ValueAcres
46. 1A
47. 2A1
48. 2A
49. 3A1
50. 3A
51. 4A1
52. 4A
53. Total
54. 1D1
55. 1D
56. 2D1
57. 2D
58. 3D1
59. 3D
60. 4D1
61. 4D
62. Total
63. 1G1
64. 1G
65. 2G1
66. 2G
67. 3G1
68. 3G
69. 4G1
70. 4G
71. Total
Waste
Other
Exempt
Irrigated
Dry
Grass
Market Area Total 621,504,557 596,807.54
0 6.80
220,726 196.20
0 0.00
214,212,291 364,990.70
324,878 555.34
348,427 595.60
14,533,148 24,810.55
155,708,567 265,890.57
0 0.00
315,770 536.11
37,153,018 62,680.67
5,828,483 9,921.86
187,507,277 154,741.24
11,641,392 10,729.33
4,607.48 4,999,137
0 0.00
149,988 132.15
27,841,566 23,494.96
2,604,042 2,197.50
139,308,558 112,800.39
962,594 779.43
219,564,263 76,879.40
17,005,698 6,339.17
4,429,529 1,622.14
395,388 141.97
26,625 9.56
20,099,794 7,095.13
4,503,677 1,602.40
139,738,335 48,503.68
33,365,217 11,565.35
% of Acres* % of Value*
15.04%
63.09%
72.90%
0.50%
2.72%
17.17%
9.23%
2.08%
15.18%
1.42%
0.00%
0.15%
0.01%
0.18%
0.00%
0.09%
72.85%
6.80%
8.25%
2.11%
2.98%
6.93%
0.15%
0.16%
100.00%
100.00%
100.00%
Grass Total
Dry Total
Irrigated Total 76,879.40
154,741.24
364,990.70
219,564,263
187,507,277
214,212,291
12.88%
25.93%
61.16%
0.00%
0.00%
0.03%
100.00%
Average Assessed Value*
63.64%
15.20%
9.15%
2.05%
0.01%
0.18%
2.02%
7.75%
100.00%
0.51%
74.30%
17.34%
2.72%
1.39%
14.85%
0.15%
0.00%
0.08%
0.00%
72.69%
6.78%
2.67%
6.21%
0.16%
0.15%
100.00%
100.00%
2,884.93
2,880.98
1,235.00
1,235.00
587.44
592.73
2,832.90
2,810.58
1,185.00
1,185.00
0.00
589.00
2,785.04
2,785.01
1,134.98
0.00
585.61
585.76
2,730.67
2,682.64
1,085.00
1,085.01
585.01
585.00
2,855.96
1,211.75
586.90
0.00% 0.00
0.04% 1,125.01
100.00% 1,041.38
1,211.75 30.17%
586.90 34.47%
2,855.96 35.33%
0.00 0.00%72.
73.
74.
75.
32 Frontier Page 37

County 2021 County Abstract of Assessment for Real Property, Form 45Frontier32
Schedule X : Agricultural Records :Ag Land Total
76. Irrigated
TotalValueAcresAcres Value
RuralAcres Value ValueAcres
SubUrban Urban
77. Dry Land
78. Grass
79. Waste
80. Other
81. Exempt
82. Total
2.01 5,640 0.00 0 76,877.39 219,558,623 76,879.40 219,564,263
170.38 207,796 150.80 184,813 154,420.06 187,114,668 154,741.24 187,507,277
46.25 27,056 310.01 181,356 364,634.44 214,003,879 364,990.70 214,212,291
0.00 0 0.00 0 0.00 0 0.00 0
0.00 0 0.00 0 196.20 220,726 196.20 220,726
0.00 0
218.64 240,492 460.81 366,169
0.00 0 6.80 0 6.80 0
596,128.09 620,897,896 596,807.54 621,504,557
Irrigated
Dry Land
Grass
Waste
Other
Exempt
Total 621,504,557 596,807.54
0 6.80
220,726 196.20
0 0.00
214,212,291 364,990.70
187,507,277 154,741.24
219,564,263 76,879.40
% of Acres*Acres Value % of Value* Average Assessed Value*
1,211.75 25.93% 30.17%
0.00 0.00% 0.00%
586.90 61.16% 34.47%
2,855.96 12.88% 35.33%
1,125.01 0.03% 0.04%
1,041.38 100.00% 100.00%
0.00 0.00% 0.00%
32 Frontier Page 38

GrowthUnimproved Land Improved Land Improvements Total
2021 County Abstract of Assessment for Real Property, Form 45County 32 Frontier
Records Value Records Value Records Value Records Value
Schedule XI : Residential Records - Assessor Location Detail
Assessor LocationLine# L
23 200,946 332 3,184,785 332 22,420,618 355 25,806,349 173,81183.1 Curtis
19 154,283 193 1,858,965 195 15,446,930 214 17,460,178 69,74283.2 Eustis
1 5,100 10 339,557 147 8,371,715 148 8,716,372 84,02983.3 Lake
22 211,563 135 1,586,364 136 6,744,106 158 8,542,033 083.4 Maywood
6 9,330 21 93,647 21 734,779 27 837,756 083.5 Moorefield
13 196,644 92 4,454,185 95 8,414,209 108 13,065,038 083.6 Rural Res
19 33,002 24 98,033 26 671,341 45 802,376 083.7 Stockville
1 6,686 10 336,560 10 1,122,249 11 1,465,495 083.8 Suburban
104 817,554 817 11,952,096 962 63,925,947 1,066 76,695,597 327,58284 Residential Total
32 Frontier Page 39

GrowthUnimproved Land Improved Land Improvements Total
2021 County Abstract of Assessment for Real Property, Form 45County 32 Frontier
Records Value Records Value Records Value Records Value
Schedule XII : Commercial Records - Assessor Location Detail
Assessor LocationLine# L
4 27,378 56 288,812 56 5,026,689 60 5,342,879 398,03985.1 Curtis
2 10,360 40 172,431 43 4,223,544 45 4,406,335 085.2 Eustis
5 36,395 25 188,431 28 6,174,949 33 6,399,775 085.3 Maywood
5 8,813 6 18,189 7 400,470 12 427,472 8,87385.4 Moorefield
4 148,560 16 352,553 35 4,259,298 39 4,760,411 085.5 Rural Com
2 1,169 5 5,950 5 155,926 7 163,045 131,31485.6 Stockville
22 232,675 148 1,026,366 174 20,240,876 196 21,499,917 538,22686 Commercial Total
32 Frontier Page 40

1Market AreaSchedule XIII : Agricultural Records : Grass Land Detail By Market Area
2021 County Abstract of Assessment for Real Property, Form 45Frontier32County
87. 1G1
ValueAcres
88. 1G
89. 2G1
90. 2G
91. 3G1
92. 3G
93. 4G1
94. 4G
95. Total
96. 1C1
97. 1C
98. 2C1
99. 2C
100. 3C1
101. 3C
102. 4C1
103. 4C
104. Total
105. 1T1
106. 1T
107. 2T1
108. 2T
109. 3T1
110. 3T
111. 4T1
112. 4T
113. Total
Pure Grass
CRP
Timber
114. Market Area Total 214,212,291 364,990.70
212,684,889 363,563.38
324,878 555.34
348,427 595.60
14,493,991 24,776.05
155,219,145 265,331.74
0 0.00
311,540 532.54
36,204,354 61,887.44
5,782,554 9,884.67
% of Acres* % of Value*
2.72%
17.02%
0.00%
0.15%
72.98%
6.81%
0.15%
0.16%
100.00%
Grass TotalCRP Total
Timber Total
363,563.38 212,684,889 99.61%
100.00%
Average Assessed Value*
17.02%
2.72%
0.15%
0.00%
72.98%
6.81%
0.16%
0.15%
100.00%
585.00
585.00
0.00
585.01
585.00
585.00
585.01
585.00
585.00
100.00% 586.90
585.00 99.29%
0.00
37.19
793.23
3.57
0.00
558.83
34.50
0.00
0.00
1,427.32 1,527,402
0
0
39,157
489,422
0
4,230
948,664
45,929
0
0.00 0
0.00 0
0.00 0
0.00 0
0.00 0
0.00 0
0.00 0
0.00 0
55.57% 1,195.95 62.11%
2.61% 1,234.98 3.01%
0.00% 0.00 0.00% 0.00% 0.00 0.00%
0.00% 0.00 0.00%
0.25% 1,184.87 0.28%
0.00% 0.00 0.00% 0.00% 0.00 0.00%
2.42% 1,134.99 2.56% 39.15% 875.80 32.04%
0.00% 0.00 0.00%
0.00% 0.00 0.00%
0.00% 0.00 0.00%
0.00% 0.00 0.00%
0.00% 0.00 0.00%
0.00% 0.00 0.00%
100.00% 100.00% 1,070.12
0.00% 0.00%
0.39%
0.00% 0.00
0.00
1,070.12 0.71%
0.00% 0.00 0
1,427.32 1,527,402
32 Frontier Page 41

2021 County Abstract of Assessment for Real Property, Form 45
32 FrontierCompared with the 2020 Certificate of Taxes Levied Report (CTL)
2020 CTL
County Total
2021 Form 45
County Total
Value Difference Percent
Change
2021 Growth Percent Change
excl. Growth
60,945,508
8,722,201
01. Residential
02. Recreational
03. Ag-Homesite Land, Ag-Res Dwelling
04. Total Residential (sum lines 1-3)
05. Commercial
06. Industrial
07. Total Commercial (sum lines 5-6)
08. Ag-Farmsite Land, Outbuildings
09. Minerals
10. Non Ag Use Land
11. Total Non-Agland (sum lines 8-10)
12. Irrigated
13. Dryland
14. Grassland
15. Wasteland
16. Other Agland
18. Total Value of all Real Property
(Locally Assessed)
(2021 form 45 - 2020 CTL) (New Construction Value)
43,685,860
113,353,569
20,914,984
0
20,914,984
44,944,515
385,920
0
45,330,435
219,715,772
187,558,042
214,396,418
0
220,726
621,890,958
67,879,216
8,816,381
43,914,035
120,609,632
21,499,917
0
21,499,917
45,248,398
217,200
0
45,465,598
219,564,263
187,507,277
214,212,291
0
220,726
621,504,557
6,933,708
94,180
228,175
7,256,063
584,933
0
584,933
303,883
-168,720
0
135,163
-151,509
-50,765
-184,127
0
0
-386,401
11.38%
1.08%
0.52%
6.40%
2.80%
2.80%
0.68%
-43.72
0.30%
-0.07%
-0.03%
-0.09%
0.00%
-0.06%
243,553
84,029
803,319
538,226
0
538,226
396,735
0
0.12%
10.98%
-0.57%
5.69%
0.22%
0.22%
-0.21%
-43.72%
475,737
17. Total Agricultural Land
801,489,946 809,079,704 7,589,758 0.95% 1,738,280 0.73%
396,735 -0.58%
32 Frontier Page 42

2021 Assessment Survey for Frontier County
A. Staffing and Funding Information
1. Deputy(ies) on staff:
0
2. Appraiser(s) on staff:
0
3. Other full-time employees:
1
4. Other part-time employees:
0
5. Number of shared employees:
0
6. Assessor’s requested budget for current fiscal year:
$154,658
7. Adopted budget, or granted budget if different from above:
same
8. Amount of the total assessor’s budget set aside for appraisal work:
$435 for the oil and gas mineral appraisal
9. If appraisal/reappraisal budget is a separate levied fund, what is that amount:
n/a
10. Part of the assessor’s budget that is dedicated to the computer system:
$29,735 for GIS and CAMA, including conversion to Vanguard
11. Amount of the assessor’s budget set aside for education/workshops:
$350
12. Amount of last year’s assessor’s budget not used:
$7,536
32 Frontier Page 43

B. Computer, Automation Information and GIS
1. Administrative software:
Vanguard
2. CAMA software:
Vanguard
3. Personal Property software:
Vanguard
4. Are cadastral maps currently being used?
No
5. If so, who maintains the Cadastral Maps?
n/a
6. Does the county have GIS software?
Yes
7. Is GIS available to the public? If so, what is the web address?
Yes, www.frontier.gworks.com
8. Who maintains the GIS software and maps?
The assessor
9. What type of aerial imagery is used in the cyclical review of properties?
GIS
10. When was the aerial imagery last updated?
2020
C. Zoning Information
1. Does the county have zoning?
Yes
2. If so, is the zoning countywide?
Yes
32 Frontier Page 44

3. What municipalities in the county are zoned?
Curtis, Eustis, and Maywood each have their own zoning; everything else (1 mile outside
city limits) is county zoning
4. When was zoning implemented?
2001
D. Contracted Services
1. Appraisal Services:
Pritchard & Abbott are contracted to conduct an oil and gas mineral appraisal annually.
2. GIS Services:
gWorks
3. Other services:
none
E. Appraisal /Listing Services
1. List any outside appraisal or listing services employed by the county for the current
assessment year
Only for the valuation of oil and gas mineral interests.
2. If so, is the appraisal or listing service performed under contract?
Yes
3. What appraisal certifications or qualifications does the County require?
The county does not specify appraiser requirements; however, the county has contracted
with Pritchard & Abbott for a number of years because they are leaders in the field of oil
and gas mineral interest appraisal. The firm employs qualified professionals who conduct
work within the county.
4. Have the existing contracts been approved by the PTA?
Yes
5. Does the appraisal or listing service providers establish assessed values for the county?
Yes, for the oil and gas mineral interests.
32 Frontier Page 45

2021 Residential Assessment Survey for Frontier County
1. Valuation data collection done by:
The assessor and staff
2. List the valuation group recognized by the County and describe the unique characteristics of
each:
Description of unique characteristicsValuation
Group
1 Curtis - largest community in the county and is home to the Nebraska College of
Technical Agriculture. The college brings jobs, commerce, and a demand for housing
that is not found in the other parts of the county.
2 Eustis - is within commuting distance of the larger towns with Dawson County providing
jobs and shopping opportunities. Eustis has some demand for housing.
3 Small Villages - Maywood, Stockville, and Moorefield. There is some demand for
housing in Maywood, but the market is sporadic and sales data is limited. Stockville and
Moorefield are less desirable. Maywood, Stockville and Moorefield receive an economic
depreciation that is not applied to Eustis or Curtis.
4 Lake Properties - residential and recreational parcels at Medicine Creek Reservoir and
the Hugh Butler Lake. These properties receive a recreational influence not found in the
other areas.
5 Rural - includes all parcels not located within the political boundaries of the villages
excluding those around the lakes. Demand for rural housing remains strong in Frontier
County.
AG Outbuildings- structures located on rural parcels throughout the county
3. List and describe the approach(es) used to estimate the market value of residential
properties.
Only the cost approach is used to value property in the residential class. There is insufficient sales
activity to establish the sales comparison approach.
4. For the cost approach does the County develop the deprecation study(ies) based on the local
market information or does the county use the tables provided by the CAMA vendor?
Depreciation is developed using local market information.
5. Are individual depreciation tables developed for each valuation group?
The same depreciation table will be used for all. An economic depreciation of 5% to Maywood,
20% to Stockville and Moorefield have been applied.
6. Describe the methodology used to determine the residential lot values?
Lot values are reviewed within the county and then by community. Typically a square foot cost is
developed; a base lot size is established using a base cost, then adjustments are made for
additional square feet. A price per acre is utilized for larger tracts and suburban. Vacant lots are
valued the same, with a vacancy rate applied.
7. How are rural residential site values developed?
32 Frontier Page 46

Sales of rural residential parcels are analyzed to develop home site values. This is conducted
during the rural review.
8. Are there form 191 applications on file?
N/A
9. Describe the methodology used to determine value for vacant lots being held for sale or
resale?
There are no lots being held for development.
10. Valuation
Group
Date of
Costing
Date of
Lot Value Study
Date of
Last Inspection
Date of
Depreciation Tables
1 2020 2008 2020 2020
2 2020 2008 2020 2020
3 2020 2008 2020 2020
4 2017 2008 2019 2019
5 2017 2008 2018 2018
AG 2017 2008 2018 2018
32 Frontier Page 47

2021 Commercial Assessment Survey for Frontier County
1. Valuation data collection done by:
The assessor and staff
2. List the valuation group recognized in the County and describe the unique characteristics of
each:
Description of unique characteristicsValuation
Group
1 There are no valuation groupings within the commercial class. The market in Frontier County
is sporadic and unorganized. There are so few sales in any three year study period that it is
not feasible to stratify them by location.
3. List and describe the approach(es) used to estimate the market value of commercial
properties.
Primarily the cost approach is used since income information is lacking.
3a. Describe the process used to determine the value of unique commercial properties.
Because there is so little sales data within the county, all commercial properties are priced using a
few general occupancy codes which relate primarily to the highest and best use of the structure.
Depreciation is established using the CAMA depreciation based off age and condition by
occupancy code. An economic locational factor is applied by occupancy code to reach market
value within Frontier County.
4. For the cost approach does the County develop the deprecation study(ies) based on the local
market information or does the county use the tables provided by the CAMA vendor?
Depreciation is developed based utilizing Vanguard (CAMA) and also market-based economic
information.
5. Are individual depreciation tables developed for each valuation grouping?
N/A
6. Describe the methodology used to determine the commercial lot values.
Lot values in town are established using a cost per square foot analysis. Rural commercial lots are
established using a cost per acre analysis.
7. Date of
Depreciation
Valuation
Group
Date of
Costing
Date of
Lot Value Study
Date of
Last Inspection
1 2017 2008 2017 2017
Costing in Vanguard is updated once every ten years but is factored in the interim years.
32 Frontier Page 48

2021 Agricultural Assessment Survey for Frontier County
1. Valuation data collection done by:
The assessor and the staff
2. List each market area, and describe the location and the specific characteristics that make
each unique.
Year Land Use
Completed
Description of unique characteristicsMarket
Area
01 There are no market areas within the county. 2019
3. Describe the process used to determine and monitor market areas.
N/A
4. Describe the process used to identify rural residential land and recreational land in the
county apart from agricultural land.
The primary use of the parcel is determined by physical inspection, sales verification, reviewing
GIS imagery, and other means of normal discovery.
5. Do farm home sites carry the same value as rural residential home sites? If not what
methodology is used to determine market value?
Yes, farm home sites and rural residential home sites are valued the same.
6. What separate market analysis has been conducted where intensive use is identified in the
county?
Feed lots and hog farms are identified as intensive use.
7. If applicable, describe the process used to develop assessed values for parcels enrolled in the
Wetland Reserve Program.
Parcels that are enrolled in the Wetland Reserve Program are assessed at full market value of
grass.
7a. Are any other agricultural subclasses used? If yes, please explain.
Irrigated grass--grass value + 40%
32 Frontier Page 49

FRONTIER COUNTY ASSESSOR’S 3-YEAR PLAN
The following is a revised 3-year plan of assessment for years 2020, 2021, and 2022 pursuant to section 77-1311, as amended by 2001 Neb. Laws LB170, Section 5 and directive 05-4. The purpose of this plan is to update and inform the County Board of Equalization and the Department of Revenue, Property Assessment Division of the progress this county has achieved from year to year. The plan and any updates shall examine the level, quality, and uniformity of assessment within Frontier County. Property Summary in Frontier County (Parcel Summary): Personal Property Property Type Total Parcel
Count Percent Of Parcels
Total Value Percent Of Total Value
Commercial 130 28% 5,492,063 17% Agricultural 348 72% 27,406,764 83% 2020 Total 478 32,898,827
2019 totals: Parcel count: 500 Total value: $34,167,293 decrease in value for ‘20 by $1,268,466
Real Property Property Type
Taxable Acres
Unimproved Parcels
Improved Parcels
Total Parcel Count
Percent Of Parcels
Total Value Percent Total Value
Commercial 21 164 185 5% 20,747,409 2.5% Agricultural 596,834 2077 647 2724 68%
Irrigated= 13% Dry= 26% Grass= 61%
710,279,262 89%
Residential
100 819 919 23% 60,958,782 7.5%
Recreational 0 3 147 150 4% 8,722,201 1% Industrial 0 0 0 0 0 0 0 Special Val 0 0 0 0 0 0 0 2020 Total 596,834 2201 1777 3978 100% 800,707,654 100%
2019 totals: Parcel count: 4,026 – decrease of 48 for ‘20 Commercial: $23,655,597 – decrease of $2,908,188 for ‘20 Agricultural: $732,703,631 – decrease of $22,424,369 for ‘20 Residential: $62,031,308 – decrease of $1,072,526 for ‘20 Recreational: $8,182,032 – increase of $540,169 for ‘20 Total value for ‘19: $826,943,248 decrease of $26,235,594 for ‘20
Misc. Parcel Counts Property Type Total Parcel
Count Total Value
TIF 1 Excess= 374285 Base=24,672
Mineral / Oil Interest 12 385,920 Exempt 384 0 Homesteads Applications for 2019
125
7,688,248
Building / Zoning Info Applications for 2019
Permits = 31
2019 totals: TIF Ex: $374,285 - no change for ‘20 Mineral: $370,680 – increase of $15,240 for ‘20
Current Resources in Frontier County: 32 Frontier Page 50

Budget: Requested Budget for 2020-2021 = $154,658
Requested Reappraisal Budget for 2020-2021 = $ 0 Adopted Budget for 2020-2021 = $ 154,658 Adopted Reappraisal Budget for 2020-2021 = $ 0
Staffing: Assessor – Regina Andrijeski Deputy - None
Training: The assessor has her assessor’s certificate and is in good standing with
the state and is completing continuing education to comply with required hours to be current through December 31, 2022, and to continue to further her education in every area of her job. So far, the assessor has taken a total of 30.75 hours toward her required 60 hours for recertification.
Maps: Frontier County is contracted with GIS Workshop for their GIS mapping
program and it was fully implemented in 2008. The aerial maps and cadastral maps are no longer updated, due to the fact that all that information is now on the GIS system and kept current on there.
CAMA: Frontier County switched from the TerraScan Administrative System to
Vanguard in 2018. As stated above the office is now contracting its mapping system with GIS Workshop. The assessor’s computer was updated in 2017. The office purchased a new PC for the deputy assessor’s workstation in 2020. The office updated to a new digital camera in 2010, that we use for taking photos of improvements, upon which are later entered into the Vanguard electronic file. The office intends to continuously review and update our equipment as needed to keep our records accurate and the office running well.
Web: Frontier County, with system provider GIS Workshop, offers a basic web
property information service. Any individual with access to the Internet will have access to county parcel information by going to the following site http://frontier.gisworkshop.com
Property Record Cards:
32 Frontier Page 51

The assessor and assessor’s clerk update each property record file, as needed both electronically and with hard copies. Only the most recent data is kept in the record card. Historic information on each parcel is kept in a separate file cabinet from the current files. Each property record file is interrelated through codes and references and contains the following:
1. Parcel information.
♦ Current owner and address ♦ Ownership changes, sales information, splits or additions, and
deed recordings ♦ Legal description and situs ♦ Property classification code, tax district, and school district ♦ Current year and up to 4 years prior history of land and
improvements assessed values 2. Ag-land land use and soil type worksheets. 3. Current copy of the electronic appraisal file worksheet.
Current Assessment Procedures for Real Property: Discover, List and Inventory all property: Sales review and procedures for processing 521’s in Frontier County:
* Current data available on sales file: 1. Agricultural land & Commercial = 3 years of data. October 1 – Sept 30
2. Residential = 2 years of data. October 1 – September 30
* All sales are deemed to be qualified sales. For a sale to be considered non-qualified or if any adjustments are to be made to the selling price the sale is reviewed pursuant to professionally accepted mass appraisal techniques and through the review documenting sufficient and compelling information regarding the sale. Opinions are based on the results of returned questionnaires and/or conversations with buyers and/or sellers.
* All 521’s are entered into the computer, however, only the 521’s with an
amount stated for Documentary Stamp Tax greater than $2.25 or consideration greater than $100.00 is captured in the sales file database as a qualified sale.
* If the stated value of personal property is more than 5% of the total sale price for residential property or more than 25% for commercial property, the sale is EXCLUDED unless the sales sample is small and there is strong evidence to support the value estimate of personal property.
* Both the assessor and the assessor’s clerk process sales. Every transfer
statement has the following work done: Updates made to the property record card, electronic appraisal file, GIS if applicable, and sales book. All sales are now sent electronically to the PAD. Sales questionnaires are sent to BOTH buyer and seller of ALL types of property (Ag, residential, commercial). A physical improvements data confirmation sheet is also sent to either the buyer or the seller. When the data sheet is returned the information is compared to that already present in the appraisal file and updated as needed. A record is kept of all individuals receiving a questionnaire and all individuals returning the
32 Frontier Page 52
questionnaire. Our return rate on the verification questionnaires is at 31% this year. The office also initiates phone contact with the buyer and seller on any sales with questions or concerns. All sales whether qualified or not are recorded in the Vanguard computer sales file. The Treasurer’s office, FSA, and the NRD office are informed of ownership changes. Lastly the offices sales spreadsheet, used to determine sales ratios, is updated.
Building Permits / Information Sheets: * No building amounting to a value of $2,500 or more shall be erected, or
structurally altered or repaired, and no electrical, heating, plumbing, or other installation or connection, or other improvement to real property, amounting to a value of $2,500 or more, shall hereafter be made until an information statement or building permit has been filed with the assessor.
* Urban Zoning regulations in place in: Curtis, Eustis, and Maywood. No zoning regulations in place in: Stockville and Moorefield. Entire rural areas of the county require a zoning permit when changes are made to the property.
* When there is an increase in square footage of a current improvement or the addition of another improvement to an urban property a building permit is required in the towns of Curtis and Eustis. Information sheets shall be used in a city or village that does not require a building permit under its zoning laws.
* All permits and information sheets are reviewed for percentage of completion and value changes in the fall (December), prior to January 1, of the year the permits were turned into the assessors’ office.
* Frontier County data logs include: Excel spreadsheet of building permits, permit collection envelope, and the electronic Vanguard permits file.
Data Collection:
* Real Property Improvements: Appraisal work is being done on a continuing basis. Our office uses data
32 Frontier Page 53

gathered from sales questionnaires as well as detailed reviews and updates. Detailed reviews include an on-site physical inspection of all improvements, by the county assessor & assessor’s clerk, interior inspections when possible, new digital photographs and any needed updating of improvement sketches. Frontier County is scheduled for detailed reviews to be performed on all property types with improvements throughout the entire County on a 4-year cycle. Rural properties & Ag properties for 2019, Lake Properties for 2020, Residential properties for 2021, Commercial properties for 2022 and then the process starts again. Either the county assessor or assessor’s clerk completes updates annually. All property types are reviewed on the computer for correctness of parcel information/ appraisal record data.
* Personal Property: Currently data is gathered primarily from the taxpayer’s federal income
tax depreciation schedule and previous personal property schedules. Occasionally owners will report new property themselves and we review all copies of any UCC filing statements and zoning permits that are recorded in the clerk’s office. Our office mails out postcard reminders a couple weeks prior to the May first deadline.
* Ag land:
January 1st 2008 Frontier County fully implemented the GIS system and it is now used to keep all of our land use current by viewing the current satellite imagery for Frontier County.
* Improvements on Leased Land: Improvements on leased land have been inspected using the same
methods as those used with other real property improvements. Assessment sales ratios and assessment actions:
* Our office now performs three review assessments. Two prior to the AVU and abstract submission and one after the Reports and Opinions has been released.
32 Frontier Page 54

* Reviews of the level of value for all types of property are done using the sales rosters provided by the state as well as using our in house “what if’s” spread sheets. The office also utilizes our field liaison when needed. We understand that the reliability of the ratio studies depends on representativeness of the sample. Therefore, when information is entered into the sales file and the rosters they are reviewed for correctness several times.
* The appraisal uniformity guide our offices employs and strives to be in compliance with is:
1. Mean / Median / Aggregate lie between:
* 92-100% for residential properties * 92-100% for commercial properties * 69-75% for Agland * In normal distribution all 3 should be equal 2. COD lies between: * <15 for residential * <20 for Agland & commercial * <5 considered extremely low, maybe a flawed study 3. PRD lies between: * 98-103% for all types of properties * PRD <98 means high value parcels are over appraised
* PRD >103 means high valued parcels are under appraised and low valued parcels are overappraised
4. Fairness and uniformity between sold and unsold properties equals a trended preliminary ratio that correlates closely with the R & O median ratio and a percentage change in the sales file and the assessed base would be similar.
Approaches to value:
* Land valuation process in Frontier County is based upon site date and the market (sales) approach for land.
1. Site data
a. Lots evaluated per use, square-foot, acre, neighborhood, size and shape, road type and access, topography, improved or unimproved, and zoning. Evaluated through onsite review and measurement (tape measure and GIS), city maps, property record card, and owner. b. Agland evaluated per acre, class (use), and subclass. Evaluated through GIS satellite imagery, GIS soil layer and land use calculator, property record card, and landowner.
2. Market sales data
a. Lots. Use comparable sales within a 2-year period for residential lots and a 3-year period for commercial lots. Only arms lengths transactions used (based upon 521 and questionnaire information). All assessments must be done on or
32 Frontier Page 55

before March 19 of each year. Review ratio studies (mean, median, aggregate, COD, and PRD) b. Agland. Valued at 75% of actual value. Use unimproved comparable sales within a 3-year period. Use only arms lengths transactions (based upon 521 and questionnaire information). All assessments must be done on or before March 19 of each year. Review ratio studies (mean, median, aggregate, COD, and PRD)
* Real property, improvement valuation process in Frontier County is based upon the cost approach (physical data), and the sales approach.
1. Improvements data noted includes conforming to highest and best use for site, size, style, construction characteristics, actual age / remaining life / effective age, plus any rehabilitation, modernization and or remodeling 2. Physical data evaluated through onsite physical inspection by assessor and/or deputy, photographs, owner, property record card, and questionnaires.
4. Cost approach. - Estimate replacement cost of improvements using Vanguard
Costing for year 2017 for residential, year 2018 for commercial, 2019 for Ag improvements and 2020 for lake.
- Deduct for physical depreciation and or economic depreciation. For residential, percent depreciation was reviewed and rebuilt in 2017 by the assessor. For commercial, percent depreciation was reviewed and rebuilt in 2018 by the assessor. For rural residential, percent depreciation was reviewed and rebuilt in 2019 by the assessor and for lake, percent depreciation was reviewed and rebuilt in 2020 by the assessor.
- Age / life components, income loss, cost to correct, completion of improvements, questionnaires, property record card, and the market.
4. Sales approach. Use comparable sales within a 2-year period. Only arm’s lengths transactions used (based upon 521 information, owner/buyer questionnaires or one on one contact with owner/buyer). Valued at 100% of actual value. Review of ratio studies (mean/median/aggregate/COD/PRD).
Customer service, Notices and Public relations:
* Our office regularly aids realtors, appraisers, insurance agents, title insurance agents, and property owners in locating parcel information by the availability of all our parcel information online. In order to access sales information and more detailed information about a parcel, we have also implemented a premium parcel information portion on our website that requires a $300/year subscription or we also do a $30/month subscription. This allows realtors, appraisers and others access to sales information, GIS images and other information not available to the general public on the website. This has helped in reducing phone calls to the office as well as having to copy and fax parcel information to these people. We currently have 4 premium subscribers and in 2019 had 11 monthly subscribers.
32 Frontier Page 56

* In addition to the required publications our office publishes reminders and notices regarding several issues. Such topics include personal property schedule reminders and homestead application reminders.
* In an attempt to educate and inform taxpayers, thus increasing public relations, the assessor produces a property information newsletter. It is mailed to all property owners in their valuation change notice. We also publish some of these informational items as articles in our local paper.
Level of Value, Quality, and Uniformity for assessment year 2020:
Property Class
Median COD PRD
Residential 96.00% (92-100)
21.74 (<15)
100.30 (98-103)
Commercial 100.00% (92-100)
23.90 (<20)
92.77 (98-103)
Ag-land 70.00 (69-75)
15.08 (<20)
101.63 (98-103)
Functions performed by the Assessor’s Office: Along with the sales reviews, property record keeping, mapping updates, ownership changes and valuing property, the assessor’s office will annually: 1. Administer Homestead Exemption Applications. Carry out the approval or denial process. Provide taxpayer assistance and notification. 2. Administer Organization Exemptions & Affidavits to PAD. Administer annual filings of applications for new or continued exempt use, review and make recommendations to the county board. 3. Review government owned property not used for public purpose and send notices of intent to tax. 4. File personal property schedules, prepare subsequent notices for incomplete filings or failure to file and apply penalties as required. 5. Review the level of value for all types of property and adjust by proper percentage to achieve the standards set out by TERC. 6. When applicable prepare information and attend taxpayer appeal hearings before TERC, defend valuation.
7. When applicable attend TERC Statewide Equalization hearings to defend values, and or implement orders of the TERC.
8. Prepare tax list correction documents for county board approval. 9. Complete valuation reports due to each subdivision for levy setting.
32 Frontier Page 57

10. Prepare and certify tax lists to the county treasurer for real property, personal property, and centrally assessed. 11. Review centrally assessed values, establish assessment records and tax billing for the tax list. 12. Management of properties in the community redevelopment projects, TIF properties, for proper reporting on administrative reports and allocation of ad valorem tax. 13. Management of school district and other tax entity boundary changes necessary for correct assessment and tax information. 14. Review of Sales and Sales Ratios especially noting the median, the COD, PRD, and aggregate. 15. Review the level of value for all Agland types and adjust by proper amount to achieve the standards set out TERC. 16. Attend CBE hearings. Prior to hearings assessor will re-inspect all protest properties and bring to the hearings recommendations. Assessor will attend CBE meetings for valuation protests, assemble and provide all needed information by the CBE. 17. Perform pickup work. Review improvements or changes that have been reported by individuals or have been found by driving by or have received building or zoning permits on or found on sales questionnaires. The assessor and deputy complete the pickup work. Pickup work is usually done in December and is completed by January 1. 18. Send out a notice of valuation change to every owner of real property where there has been either an increase or decrease in value. 19. Attend meetings, workshops, and educational classes to obtain required hours of continuing education to maintain assessor certification. 20. Complete administrative reports due to PAD. Reports include the Real Property Abstract, Personal Property Abstract, School District Taxable Value Report, Homestead Exemption Tax Loss Summary certificate, Certificate of Taxable values, and the Certificate of Taxes Levied Report, Certification of Value to Political Subdivisions, Assessed Value Update, Report of current values for properties owned by Board of Education Lands and Funds, the Annual Plan of Assessment Report, and the Report of all Exempt Property and Taxable Government Owned Property. 21. Re-grade land at owner’s request or because of changes noticed upon evaluation of GIS maps. 3-Year Appraisal Plan 2021:
Residential. A complete review (reappraisal) was completed by the assessor and assessor’s clerk on all residential properties in the county in 2020 for the
32 Frontier Page 58

2021 tax year. All properties were physically inspected, interior inspections done when possible, new digital photographs taken and any needed updating of improvement sketches performed. The cost and sale value approaches were also used whenever applicable to the property. Commercial. A complete review (reappraisal) will be completed by the assessor and assessor’s clerk on all commercial properties in the county in 2021 for the 2022 tax year. All properties will be physically inspected, interior inspections done when possible, new digital photographs taken and any needed updating of improvement sketches performed. The cost and sale value approaches were also used whenever applicable to the property. Ag-improvements. Appraisal maintenance will only be performed for Ag improvements located in the county for the 2021 tax year. Maintenance appraisal includes an evaluation of all Ag improvements for accuracy in the computer and hard copy appraisal files. Updates also include any information picked up from sales questionnaires, physical facility questionnaires and or building permits or information sheets Ag-land. A market analysis of agricultural sales by land classification group will be conducted to determine any possible adjustments to comply with statistical measures. The office uses the sales approach when determining value. The office plots land sales on a large county map, visible to all visitors, to help determine if the current market areas are supported by the current sales. Recreational improvements. Appraisal maintenance will only be performed for recreational properties in the county for the 2021 tax year. Maintenance appraisal includes an evaluation of all recreational records for accuracy in the computer and hard copy appraisal files. Updates also include any information picked up from sales questionnaires, physical facility questionnaires and or building permits or information sheets.
2022: Residential. Appraisal maintenance will only be performed for all residential properties in the county for the 2022 tax year. Maintenance appraisal includes an evaluation of all residential records for accuracy in the computer and hard copy appraisal files. Updates also include any information picked up from sales questionnaires, physical facility questionnaires and or building permits or information sheets. Commercial. A complete review (reappraisal) was completed by the assessor and assessor’s clerk on all commercial properties in the county in 2021 for the 2022 tax year. All properties were physically inspected, interior inspections done when possible, new digital photographs taken and any needed updating of improvement sketches performed. The cost and sale value approaches were also used whenever applicable to the property. Ag-land. A market analysis of agricultural sales by land classification group will be conducted to determine any possible adjustments to comply with statistical measures. The office uses the sales approach when determining value. The office plots land sales on a large county map, visible to all visitors,
32 Frontier Page 59

to help determine if the current market areas are supported by the current sales. Ag-improvements. A complete review (reappraisal) will be completed by the assessor and assessor’s clerk on all improved agricultural properties in the county in 2022 for the 2023 tax year. All properties will be physically inspected, interior inspections done when possible, new digital photographs taken and any needed updating of improvement sketches performed. The cost and sale value approaches were also used whenever applicable to the property. Recreational improvements. Appraisal maintenance will only be performed for recreational properties in the county for the 2023 tax year. Maintenance appraisal includes an evaluation of all recreational records for accuracy in the computer and hard copy appraisal files. Updates also include any information picked up from sales questionnaires, physical facility questionnaires and or building permits or information sheets.
2023: Residential. Appraisal maintenance will only be performed for all residential properties in the county for the 2023 tax year. Maintenance appraisal includes an evaluation of all residential records for accuracy in the computer and hard copy appraisal files. Updates also include any information picked up from sales questionnaires, physical facility questionnaires and or building permits or information sheets. Commercial. Appraisal maintenance will only be performed for commercial properties in the county for the 2023 tax year. Maintenance appraisal includes an evaluation of all commercial records for accuracy in the computer and hard copy appraisal files. Updates also include any information picked up from sales questionnaires, physical facility questionnaires and or building permits or information sheets. Ag-land. A market analysis of agricultural sales by land classification group will be conducted to determine any possible adjustments to comply with statistical measures. The office uses the sales approach when determining value. The office plots land sales on a large county map, visible to all visitors, to help determine if the current market areas are supported by the current sales. Ag-improvements. A complete review (reappraisal) was completed by the assessor and assessor’s clerk on all improved agriculture properties in the county in 2022 for the 2023 tax year. All properties were physically inspected, interior inspections done when possible, new digital photographs taken and any needed updating of improvement sketches performed. The cost and sale value approaches were also used whenever applicable to the property. Recreational improvements. A complete review (reappraisal) will be completed by the assessor and assessor’s clerk on all lake properties in the county in 2023 for the 2024 tax year. All properties will be physically inspected, interior inspections done when possible, new digital photographs taken and any needed updating of improvement sketches performed. The cost and sale value approaches were also used whenever applicable to the property.
32 Frontier Page 60

CLASS 2021 2022 2023 Residential Complete reappraisal of
all residential parcels in the county for tax year 2021
Appraisal maintenance Appraisal maintenance
Recreational / lake MH Appraisal maintenance Appraisal maintenance Appraisal maintenance Commercial Appraisal maintenance Complete reappraisal of
all commercial parcels in the county for tax year 2022
Appraisal maintenance
Agricultural Land & Improvements
Market analysis by land classification groupings Appraisal maintenance of ag-improvements
Market analysis by land classification groupings Appraisal maintenance of ag-improvements
Market analysis by land classification groupings Complete reappraisal of all ag-improvements parcels in the county for tax year 2023
Miscellaneous Accomplishments for 2019-2020 * Created and mailed out information letters to go along with the valuation changes
notices and tax statements. * In regards to the homestead exemption application process, our office provides
personal assistance not only in our office but also in three other locations throughout the county to better serve this group of individuals.
* Website contains parcel information, sales information and searches, tools and much more http://frontier.gisworkshop.com
* Continue to update and modify features in Vanguard to make office more efficient and up to date.
32 Frontier Page 61
* Have an in-office sales book for appraisers that contain current copies of sales sheets for the current year and prior year. Sales are filed by valuation groupings.
* Post in our office a large county plat map with the agricultural sales appropriately mapped for taxpayers to effortlessly view recent markets trends.
* Scan all new 521’s, deeds and mobile home transfers and attach to appropriate Vanguard record.
* Maintain a farm site for each improved Ag parcels and electronically attach to appropriate Vanguard record.
* Created a Facebook page to help keep taxpayers informed of important dates and just everyday activities in the Assessor’s office.
* Completed the conversion from Terrascan to Vanguard.
32 Frontier Page 62