Embed Size (px)
Citation preview

ACADEMIC AND CAREER PLANNING 2018-19 EVALUATION
WISCONSIN
EVALUATION
COLLABORATIVE

1025 West Johnson Street Ste. 1125 • Madison, WI 53706 • wec.wceruw.org • 608-265-8788
Academic and Career Planning 2018-19 Evaluation
September 2019
Robin Worth, PhD University of Wisconsin-Madison [email protected] Grant Sim University of Wisconsin-Madison [email protected] Jessica Arrigoni University of Wisconsin-Madison [email protected] Brie Chapa University of Wisconsin-Madison [email protected] Daniel Marlin University of Wisconsin-Madison [email protected]

The authors would like to thank all survey participants, the many interviewees, and focus groups for their time, perspectives, and expertise. In addition, the authors thank the Academic and Career Planning team at the Department of Public Instruction. The authors would also like to thank Jed Richardson, Steve Kimball, Lisa Geraghty, JourneyBrown Henderson, Emily Cheng, and Jenn Vadas at the Wisconsin Evaluation Collaborative for their work and support.
Copyright © 2019 by Robin Worth and Grant Sim
All rights Reserved
Readers may make verbatim copies of this document for noncommercial purposes by any means, provided that the above copyright notice appears on all copies. Any opinions, findings, or conclusions expressed in this paper are those of the authors and do not necessarily reflect the views of the funding agencies, WCER or cooperating institutions.
Wisconsin Evaluation Collaborative | wec.wceruw.org
Wisconsin Evaluation Collaborative Executive Summary
1
“It’s not about making kids choose a career that they’re going to do, but helping them realize that they have skills, that they all have things that they’re good at.” – School Counselor
Academic & Career Planning is intended to equip students in grades 6-12 with the tools necessary to make informed, career-based choices about postsecondary education and training. It is part of DPI’s overall vision for every student to graduate from high school college- and career-ready. As part of its longitudinal, mixed-methods evaluation of ACP, WEC fielded a school-level survey and conducted 10 case studies in schools across the state to investigate the extent of implementation, varieties of ACP infrastructure and activities, and stakeholder perceptions. WEC also analyzed school and student outputs and outcomes data.
Powerful PracticesThe 5 Powerful Practices identified in last year’s evaluation report (Final Projects, Job Shadowing, Mock Interviews, Resume-Building, and One-on-One Conferencing/Advising) continued to be named as particularly valuable in the ACP array of activities. As these activities grow and become institutionalized in many Wisconsin districts and schools, sharing specifics about implementation will be valuable,
Academic and Career Planning 2018-19 Evaluation Reportfor the Wisconsin Department of Public Instruction | September 2019
as will creating professional development opportunities to help support best practices. This year’s evaluation focused on Final Projects to catalogue and describe variations on this activity, with all 10 case study districts reporting multiple benefits from implementation, typically:
Recognition: Allowing students to showcase their work/school experiences and plans.
Experience: Providing the opportunity for students to gain interview and/or presentation experience.
Accountability: A means to compel students to take ACP (and future planning) more seriously.
Relationship Building: Providing opportunities for and capitalizing on relationships between students, schools, teachers, families, community members, and employers.
Recommendation: DPI should continue to promote the Powerful Practices and share resources that pertain to them.
Case Studies School Level SurveySchool & Student Outputs Student Outcome Data
Mixed-Methods Evaluation
Final projects are unlikely to function f lawlessly in the first year(s) of implementation, but with a continuous improvement process in place, they can evolve to be a Powerful Practice that helps to address a number of important goals of ACP work.
Wisconsin Evaluation Collaborative | wec.wceruw.org
Executive Summary
2
About the Wisconsin Evaluation CollaborativeThe Wisconsin Evaluation Collaborative (WEC) is housed at the Wisconsin Center for Education Research at the University of Wisconsin-Madison. WEC’s team of evaluators supports youth-serving organizations and initiatives through culturally responsive and rigorous program evaluation. Learn more at http://www.wec.wceruw.org. For questions regarding this report, please contact Robin Worth at [email protected], or Grant Sim at [email protected].
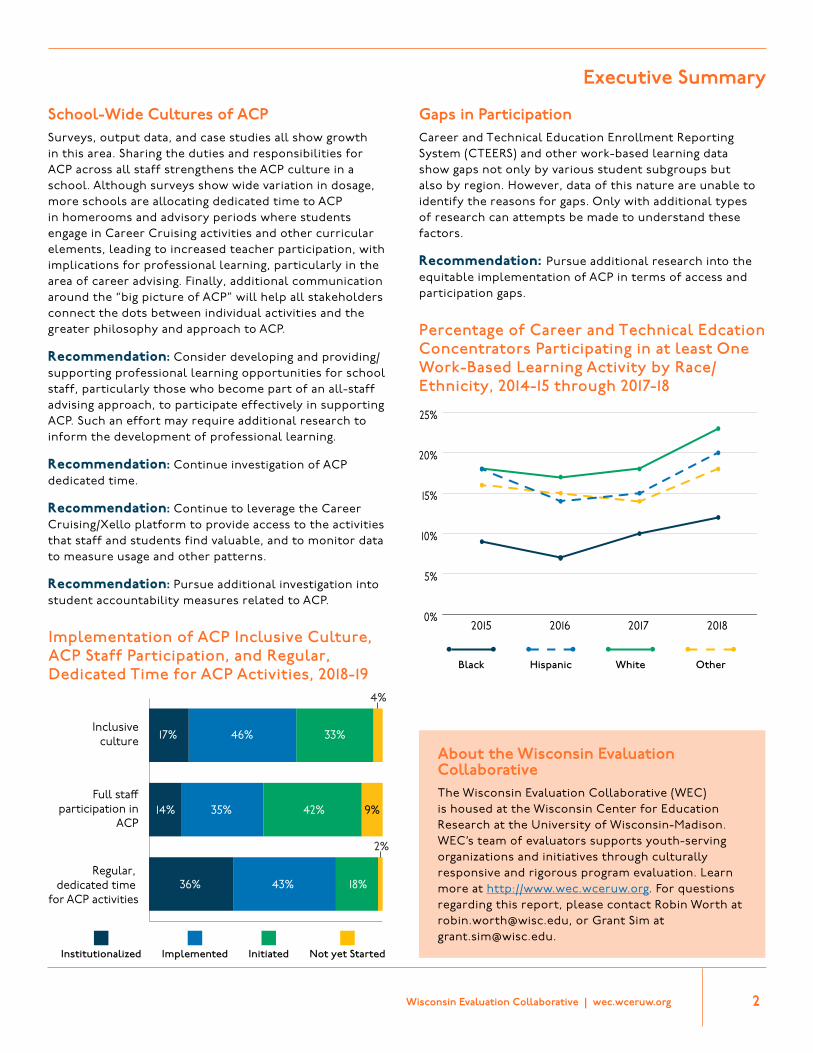
Gaps in ParticipationCareer and Technical Education Enrollment Reporting System (CTEERS) and other work-based learning data show gaps not only by various student subgroups but also by region. However, data of this nature are unable to identify the reasons for gaps. Only with additional types of research can attempts be made to understand these factors.
Recommendation: Pursue additional research into the equitable implementation of ACP in terms of access and participation gaps.
Implementation of ACP Inclusive Culture, ACP Staff Participation, and Regular, Dedicated Time for ACP Activities, 2018-19
17% 46% 33%
14%35% 42% 9%
36% 43% 18%
2%
4%
Inclusiveculture
Full sta�participation in
ACP
Regular, dedicated time
for ACP activities
17%
14%
Percentage of Career and Technical Edcation Concentrators Participating in at least One Work-Based Learning Activity by Race/Ethnicity, 2014-15 through 2017-18
0%
5%
10%
15%
20%
25%
2015 2016 2017 2018
School-Wide Cultures of ACPSurveys, output data, and case studies all show growth in this area. Sharing the duties and responsibilities for ACP across all staff strengthens the ACP culture in a school. Although surveys show wide variation in dosage, more schools are allocating dedicated time to ACP in homerooms and advisory periods where students engage in Career Cruising activities and other curricular elements, leading to increased teacher participation, with implications for professional learning, particularly in the area of career advising. Finally, additional communication around the “big picture of ACP” will help all stakeholders connect the dots between individual activities and the greater philosophy and approach to ACP.
Recommendation: Consider developing and providing/supporting professional learning opportunities for school staff, particularly those who become part of an all-staff advising approach, to participate effectively in supporting ACP. Such an effort may require additional research to inform the development of professional learning.
Recommendation: Continue investigation of ACP dedicated time.
Recommendation: Continue to leverage the Career Cruising/Xello platform to provide access to the activities that staff and students find valuable, and to monitor data to measure usage and other patterns.
Recommendation: Pursue additional investigation into student accountability measures related to ACP.
WhiteHispanicBlack Other
Institutionalized Not yet StartedImplemented Initiated
Contents Introduction .................................................................................................................................................. 1
Purpose of the Evaluation ......................................................................................................................... 1
Evaluation Questions ................................................................................................................................ 1
Methodology ................................................................................................................................................. 2
School-Level Survey of Principals .............................................................................................................. 2
School Mini Case Studies .......................................................................................................................... 3
Outputs and Outcomes Data .................................................................................................................... 7
Alignment Between Evaluation Questions and Data Sources .................................................................. 8
Limitations ................................................................................................................................................ 9
Findings ....................................................................................................................................................... 10
ACP Implementation ............................................................................................................................... 10
Stakeholder Perceptions ......................................................................................................................... 53
ACP Outcomes ........................................................................................................................................ 65
Key Findings and Recommendations .......................................................................................................... 73
Next Steps ................................................................................................................................................... 75
Areas Recommended for Further Investigation ..................................................................................... 75
Appendix A: Case Study School Leaders Interview Protocol ...................................................................... 76
Appendix B: Case Study Focus Group/Interview Protocols ........................................................................ 79
Appendix C: Technical Methodology .......................................................................................................... 82
Appendix D: ACP Implementation Tables ................................................................................................... 89
1
Introduction The following is the final report for the fourth annual (2018-19) Evaluation of Academic and Career Planning (ACP) conducted by the Wisconsin Evaluation Collaborative (WEC), part of the Wisconsin Center for Education Research (WCER) at the University of Wisconsin-Madison, for the Wisconsin Department of Public Instruction (DPI).
Purpose of the Evaluation In February 2016, DPI engaged the services of researchers at WCER to provide formative feedback via an evaluation for two and a half years (March 2016 to August 2018) for the ACP pilot and statewide implementation process. This contract was then extended for a fourth year. The partnership between DPI’s ACP team and WCER stemmed from the ACP Needs Assessment conducted by WCER personnel on behalf of DPI in the spring of 2015, the results of which informed the planning of DPI’s ACP pilot activities. The activities conducted during the initial phase of the evaluation focused on the ACP Pilot conducted in 25 Wisconsin school districts during the 2015-16 school year. Year 2 focused on further preparation for the statewide roll-out, and in Year 3 (2017-18) statewide implementation began. Year 4 continued to evaluate implementation, but also focused on identifying and describing Final Projects, one of the “Powerful Practices” identified in Year 3.
Specifically, in Year 4 of the evaluation, WEC continued to look at statewide implementation of ACP and how districts were improving their infrastructure and building more ACP activities. WEC built upon the mixed methods evaluation that took place during Years 2 and 3, conducting statewide surveys among school and district leaders to follow up on findings from the previous year, including progress made in implementation, challenges and successes, and perceptions about stakeholder awareness of and attitudes toward ACP. Baseline data was collected and analyzed on logic model outputs and outcomes in order to begin the longitudinal analysis that will be continued in the future. A focus on specific infrastructural elements and student activities (outputs) was continued to understand how they are realized in various contexts, to begin to measure their prevalence, and to gather baseline data to measure possible associations between outputs and outcomes at the school and student levels over time. Case studies focused on the implementation of a set of ACP activities collectively known as “Final Projects,” which could be realized as exit or mock interviews, or presentations. The parameters for these types of final projects varied considerably across districts, and the evaluation team sought to create a (non-exhaustive) catalogue of variations on the final project to provide educators with possible models for these practices that can be adopted/adapted to fit each district’s or school’s particular needs and context. Year 4 also included a preliminary investigation into certain aspects of equity in the implementation of ACP, with an eye towards informing future evaluations and possible research studies.
Evaluation Questions The overarching evaluation questions for the Year 4 statewide evaluation are the following:
1. To what extent are school districts and schools implementing ACP infrastructure and activities? 2. What are the varieties of ACP infrastructure and activities across different school and district
contexts? 3. What are stakeholder (administrators, school counselors, teachers, students, families)
perceptions about ACP infrastructure and activities?

2
4. What, if any, changes have occurred in terms of student outcome data compared to baseline data?
5. What, if any, associations between ACP elements and outcomes can be measured at school or student levels?
The specific infrastructure elements and student activities of interest, referred to in Evaluation Questions 1-3, are the following:
Infrastructural elements:
1. An inclusive schoolwide culture with administrative engagement, prioritized goals, staff participation and which is student-focused.
2. Regular and ongoing informing of and engaging families in their students’ ACP. 3. Regular and ongoing supportive and safe student relationships with adults. 4. Non-judgmental, informed, comprehensive education and career advising. 5. Equitable access to all ACP opportunities. 6. Regular, ongoing and dedicated time for ACP activities. 7. Outlined ACP activity curriculum that is scaffolded and developmentally appropriate (scope
and sequence). 8. Programs of Study identified by district.
Student activity components
1. Student participation in work-based learning activities. 2. Students taking dual credit, AP, IB and college level industry certification courses. 3. Students utilize knowledge and skills gained through ACP activity participation to set, modify,
and update personal, education and career goals. 4. Students choose CTE and academic courses applicable to their ACP/career goals.
Methodology To address the evaluation questions, WEC evaluators designed a study comprised of 3 major components:
1. School-level survey of principals
2. Mini case studies in 10 districts/schools that implement final projects
3. Outputs and outcomes data
School-Level Survey of Principals WEC evaluators developed and programmed a web-based survey in Qualtrics intended to gather information statewide from principals of schools with any grades 6 through 12. The purpose of the survey was to collect information related to ACP implementation during the second full year of statewide implementation. Specific areas of interest were ACP infrastructure and engagement, perceptions of ACP awareness and knowledge, and ACP component implementation. Many of these items were contained in earlier years’ versions in order to examine changes in levels of implementation. Additionally, items were added to examine opportunity and funding limitations connected to certain
3
ACP student activities, and the decision-making processes that districts/schools implemented to determine how to allocate resources and select students for participation in activities.
WEC opened the survey on December 3, 2018 and DPI sent it to school leaders representing ACP schools in Wisconsin. The survey closed on January 8, 2019. The distribution allowed recipients to forward the survey to others in their school or district who may have had better knowledge of ACP practices. As a result, the total number of respondents was 944, with 711 completing the full survey for a completion rate of 75 percent. Respondents represented 309 of the 423 ACP districts in the state1, or 73 percent of all Wisconsin ACP districts. Furthermore, total responses from respondents who indicated which school(s) they represented totaled 794 of the 1,291 ACP schools in the state, or 61 percent of all Wisconsin ACP schools. Key findings are included throughout this report. For the full survey report, please refer to Academic and Career Planning 2018-2019 Evaluation Survey Results, May 3, 2019.
School Mini Case Studies Using survey responses, web searches, referrals and snowball sampling, WEC researchers identified approximately 20 schools implementing a form of a final project. After eliminating schools that had previously been studied or whose practices were otherwise well documented and communicated (via conferences, CESA meetings, webinars or other practices), 15 schools were identified as candidates for conducting case studies. These 15 schools varied by size (enrollment), school type (rural, town, or suburban) and geographic area of the state.2 School leaders were contacted by email to invite them to participate in a telephone interview to probe deeper into their survey responses. Ultimately, 13 responded and were interviewed, and of those 13, 10 agreed to have WEC evaluators visit their schools to observe their final projects, and in most cases, conduct interviews and/or focus groups to gather stakeholder perceptions about the final project activity, and ACP more generally. These 10 schools were located around the state, distributed across 6 CESA regions, of which 3 were small rural high or middle/high schools and 7 were located in somewhat larger towns. Total enrollments in the case study districts ranged from 318 to 2995 students. In every case, each district had only 1 traditional high school.
Case studies of the selected districts included a review of their survey findings to inform the customization of the general protocol for interviewing school leader(s) (typically the principal and/or the ACP coordinator; for the general school leader interview protocol, see Appendix A). These interviews, conducted over the telephone in advance of the visit, generally lasted about 30 minutes, and were audio-recorded for note-taking purposes with the permission of the participants. Interviewees were promised confidentiality, and that audio-recordings would be used strictly to clean up notes and/or create transcriptions and then be deleted. Notes and transcriptions were analyzed and coded by theme, and findings were also used, in combination with survey and websearch findings, to prepare for site visits, particularly the observation of the final project activity, as well as in some cases to customize protocols for focus groups of students and/or teachers (for general focus group protocols, see Appendix B). Observations of final practices were documented using observation notes; documents and other artifacts were also collected for later analysis. Focus groups, interviews, and other data collection activities at select sites were also audio recorded for note-taking purposes, transcripts were created and
1 All ACP Milwaukee Independent Charter schools are aggregated into a single district in this sum. 2 No urban schools were among those that were identified as implementing final projects and/or were willing to participate in further study.

4
audio recordings were then deleted. Transcripts and field notes were analyzed to help describe specific final project practices, and were coded for common themes, particularly regarding ACP programs more generally. Table 1 shows the data collection activities in each case study site.

5
Table 1: Case Study Data Collection Methods
Site School details, approx. district enrollment (DE)
Interviews Student focus
groups
Teacher/ staff focus
groups
Evaluator role - participant
or non-participant
Other data collection methods
Site 1 High school in a town in CESA 11, DE=1250
1 with principal 1 with seniors
- Participant Artifact and document analysis, informal collection of student, parent, and community member feedback, observation of sophomore planning conference
Site 2 Small rural high school in CESA 10, DE= 750.
1 with school counselor
1 with freshmen
1 Participant Artifact and document analysis, tour of facilities, informal collection of student feedback
Site 3 High school in a town in CESA 10, DE= 2300.
1 with principal and school counselor
- 1 Non-participant Artifact and document analysis, tour of facilities, informal collection of student feedback.
Site 4 High School in town in CESA 9, DE=2000
1 with counselor, 2 with teachers,
- 1 Participant Artifact and document analysis, tour of facilities, informal collection of student feedback, 2 community member focus groups
Site 5 Combined middle and high school in town in CESA 9, DE=1300
1 with school counselor, 1 with principal, 3 with teachers
- 1 Participant Artifact and document analysis, tour of facilities, systematic collection of student feedback
Site 6 High school in a town in CESA 5, DE= 3000.
1 with principal and school counselor, 5 with students
- 1 Non-participant Artifacts and document analysis, informal collection of teacher and community member feedback
Site 7 High school in a town in CESA 4, DE=1700
1 with school counselor
- 2 with teachers, 1 with admins
Participant Artifact and document analysis, tour of facilities, informal collection of student feedback

6
Site 8 Small rural high school in CESA 2, DE=900
2 with principal, 1 with district curriculum director
- - Participant Artifact and document analysis, systematic feedback collection from 29 students (seniors), systematic feedback from community members
Site 9 Small rural all-grades school in CESA 2, DE=300
1 with principal/ superintendent
1 with seniors
- Non-participant Artifact and document analysis, systematic feedback collection from students and staff
Site 10 High school in a town in CESA 2, DE=1950
1 with school counselor
- - Participant Artifact and document analysis, systematic collection of student feedback, informal collection of teacher, community member and parent feedback

7
Outputs and Outcomes Data To evaluate the implementation of certain ACP infrastructural and student activity components, WEC requested and received statewide data for the years 2014-15 through 2017-18. These data include:
● Outputs ○ Student participation in work-based learning activities ○ Student enrollment in dual enrollment and college level industry certification courses ○ Student enrollment in Advanced Placement (AP) and International Baccalaureate (IB)
courses ○ Career Cruising activity completion
● Short-term outcomes ○ Attendance rates ○ Out-of-school suspension rates
● Intermediate outcomes ○ ACT composite scores ○ AP exam scores ○ High school completion
The majority of these sources of data cover the entire state of Wisconsin, but for a few there were restrictions on the student population. For student participation in work-based learning activities, student enrollment in dual-credit, and student enrollment in college level industry certification courses, the data source that provides these results, the Career and Technical Education Enrollment Reporting System (CTEERS), only contains information for 11th and 12th grade students. Additionally, the data on work-based learning activities are only for students who are Career and Technical Education (CTE) concentrators (students that complete a minimum of two CTE courses within a pathway and enroll in a continuing CTE course in that same pathway).
In addition to these sources, WEC also requested and received data from Career Cruising on student activity completion. Data limitations associated with Career Cruising records did not allow for linking of these records to other DPI records. Thus, the evaluation did not examine Career Cruising activity completion for various subgroup populations, unlike many of the other output data measures. Further, several Career Cruising files were not specific to a single school year, thus calculation of 2017-18 activity completion is based on best attempts to identify only activities that occurred in 2017-18 and may be slightly higher than actual activity completion rates.
To understand how ACP is associated with the short and intermediate-term outcomes noted above, the evaluation must identify a comparison group of non-ACP students and schools. As ACP was implemented statewide in 2017-18, there are no non-ACP students and schools in that year that could be used as a comparison. To account for this, the evaluation used a pre/post design to follow and compare the same schools both before and after exposure to ACP implementation. The treatment group was all schools in 2017-18 (as ACP is statewide). For a comparison group, the evaluation used the all of the same schools throughout the state in the years prior to ACP implementation. To account for any long term trends occurring throughout the state, the analysis used three prior years of baseline data on the intended outcomes (specifically 2014-15 through 2016-17). To conduct this outcomes analysis, WEC received data on these outcomes from 2014-15 through 2017-18. The evaluation then used multivariate regression models to estimate the associated impact of ACP on these outcomes while controlling for a variety of student and school-level characteristics. The models compared each outcome in 2017-18 to
8
the previous three years of outcomes within each school. The student-level controls included gender, race/ethnicity, special education status, economic status (as measured by free or reduced price lunch eligibility), English learner (EL) status, and grade level (as appropriate for the outcome). The analysis included school-level controls for locale description, including indicator variables for city, suburb, town, and rural.
In addition to examining the overall change in these outcomes, the analysis also included a variety of subgroup analyses to explore associations between ACP implementation and different types of students and schools. The subgroup analyses at the student level included race/ethnicity, special education status, economic status, and EL status. The subgroup analyses at the school level included locale description and levels of ACP implementation. The evaluation identified levels of ACP implementation from the 2017-18 ACP implementation building-level level survey3. Specifically, four different measures of ACP implementation were identified: infrastructural element implementation, equitable access implementation, dedicated ACP time implementation, and student activity component implementation. For each of these implementation metrics, the evaluation combined all relevant survey item responses into a single score with values ranging from 0 (not yet started) through 3 (institutionalized). Implementation scores near 1 indicate the initiated level, and scores near 2 indicate the implemented level. Since not all schools responded to the 2017-18 survey, only schools with answers to these items were included in this subgroup analysis.
For further information about the quantitative methodology, refer to Appendix C.
Alignment Between Evaluation Questions and Data Sources Table 2 is a crosswalk of the various data collection methods with outputs and evaluation questions:
3 Refer to the Academic and Career Planning Evaluation Implementation Year School-Level Survey Results report for further details.

9
Table 2: Crosswalk of Data Collection Methods, Outputs, and Evaluation Questions
Data Collection Method
Outputs Examined
Evaluation Question(s) Addressed
School-wide culture
Family engagem
ent
Student relationships
Career advising
Equitable access
Dedicated ACP time
ACP curriculum
Work-based learning
Dual credit/certifications
Education and career goals
Applicable course taking
Survey -School leader survey
√ √ √ √ √ √ √ √ √ √ √ 1, 2, 3
Case studies -Principal interviews
√ √ √ √ √ √ √ √ √ √ √ 2, 3
-Counselor interviews
√ √ √ √ √ √ √ √ √ √ √ 2, 3
-Teacher focus groups/interviews
√ √ √ √ √ √ √ √ √ √ √ 2, 3
-Student focus groups/interviews
√ √ √ √ √ √ √ √ √ √ √ 2, 3
-Family and community member focus groups/interviews
-Final project observation
√ √ √ √ √ √ √ √ √ √ √ 2, 3
-Document analysis √ √ √ √ √ √ √ √ 2 Output data collection
√ √ √ √ √ √ √ 1, 5
Outcome data collection
1, 4, 5
Limitations There are limitations to the extent to which findings in this evaluation can be generalized. The response rate for the school survey, although relatively high, is by no means a census; it may be that those respondents engaging less intensively in ACP activities did not choose to report their work. Generalizability is not typically a goal of case studies and other qualitative inquiries of limited scope, but rather, resulting data are used to help build theory, to probe deeper into phenomena of interest, to identify future research questions, and to inform future investigative strategies. In this evaluation year, the primary goal of the case studies was to document and describe varieties of the ACP final project

10
activity. Consequently, findings from the student, teacher, and community and family member interviews should be viewed as context-specific. At the same time, findings present ideas for future phases of evaluation, while providing authentic descriptions and perceptions of ACP work in the field by those actors experiencing the phenomena in question.
All output measures provided in this report are contingent upon available data. Additionally, results on these output measures should only be used for comparison to ACP implementation and should not be used for purposes that are more general. It is likely that results presented on these measures differ slightly than those publicly reported by DPI due to differences in data availability and calculation practices. For all purposes other than ACP evaluation use, publicly reported data from DPI should take priority in standing.
While the outcome analysis provides the most rigorous possible evaluation given the statewide implementation of ACP and available data, there are several limitations. The primary limitation is that identification of ACP impact solely relies on changes occurring in the 2017-18 school year. It is possible that the implementation of other programs and policies aligned with the start of ACP during this year. Thus, the estimated impact of ACP may also include these program or policy changes. The second limitation occurs from prior implementation of ACP practices. As many schools likely implemented several ACP infrastructural and student activity components prior to official implementation in 2017-18, the estimated impacts are likely downward biased (toward zero) from using these prior years as a comparison. Due to these limitations, the results presented in this report should not be considered causal. For further information on limitations associated with the outcomes analysis, refer to Appendix C.
Findings In this section, we present data and findings in three different categories. ACP Implementation examines the results of the evaluation pertaining to Evaluation Questions 1 and 2, Stakeholder Perceptions examines the results of the evaluation pertaining to Evaluation Question 3, and ACP Outcomes examines the results of the evaluation pertaining to Evaluation Questions 4 and 5. The findings related to ACP Implementation also include a section that catalogues and describes final project activities. Findings from this aspect will be condensed into a separate report intended for distribution to practitioners in the near future.
ACP Implementation This section of the findings covers Evaluation Question #1 (To what extent are school districts and schools implementing ACP infrastructure and activities?) and Evaluation Question #2 (What are the varieties of ACP infrastructure and activities across different school and district contexts?). The findings under these two questions focus on the extent to which ACP is being implemented in the state and on variations of the infrastructural elements and student activities as reported by case study districts. In particular, we describe the variations of the Powerful Practice referred to collectively as ACP Final Projects. In the subsequent section, Question 3 focuses on stakeholders’ perceptions about the infrastructural elements and student activities.
11
Infrastructural elements. An inclusive school wide culture with administrative engagement, prioritized goals, staff participation and which is student-focused. Most case study districts appear to have implemented ACP in a student-focused manner with staff buy-in and wide participation. In each of the case study schools, typically most or all staff helped deliver ACP-related curriculum in homeroom/advisory periods and often within the content courses.
As in previous years, a number of the schools reported that a few staff members drive ACP implementation, leaving these districts vulnerable to inconsistency and potential weakening of ACP should personnel changes occur. This risk was identified for districts via their individual evaluation reports, but this is messaging that would likely be valuable for DPI to convey statewide.
All the case study districts had high levels of administrative support and engagement, which is not surprising given the infrastructure, staff participation, scheduling, and community engagement necessary for the various final projects.
Career Cruising usage data has increased significantly between 2016-17 and 2017-18 (the latest data available), jumping from 28 schools with over 10,000 logins in 2016-17 to 48 schools with over 10,000 logins, with comparable increases across the log-in range.4 By extension, this implies that more student activities such as completing interest inventories and Matchmaker inventories, researching and saving careers of interests, and other activities are being engaged in, which are important complements to an overall ACP program.
School-level survey results also provide some insight into the levels of ACP infrastructure implementation during 2018-19. Several of the items on this survey examined the level of inclusive school wide culture. All of these items inquired as to level of implementation in a respondent’s school with response options ranging from “institutionalized” to “not yet started.” Figure 1 and Figure 2 show the results from these items. As these figures illustrate, the majority of respondents indicated that they either institutionalized or implemented ACP prioritization of ACP goals, inclusive culture, making ACP student-focused, and administrative engagement. One area that respondents thought had less implementation was full staff participation in ACP with 35 percent indicating this element was at the implemented stage and 14 percent indicating it is institutionalized.
4 Wisconsin DPI Career Cruising Annual Report: Academic Year 2016-2017 and Xello Annual Report: Wisconsin DPI 2017-2018.

12
Figure 1: Implementation of ACP Inclusive Culture and Prioritized ACP Goals, 2018-19
Source: Academic and Career Planning 2018-19 Evaluation Survey Results
Figure 2: Implementation of ACP Administrative Engagement, ACP Staff Participation, and Student-Focused ACP, 2018-19
Source: Academic and Career Planning 2018-19 Evaluation Survey Results
Regular and ongoing informing of and engaging families in their students’ ACP. Family engagement and communication efforts varied by case study school. In some cases, family members were integral parts of goal-setting, conferencing, and activities such as final projects, while in
17%
18%
46%
47%
33%
30%
4%
4%
0% 10% 20% 30% 40% 50% 60% 70% 80% 90% 100%
Inclusive culture
Prioritizing ACP-related goals
Institutionalized Implemented Initiated Not yet started
27%
14%
24%
52%
35%
52%
19%
42%
22%
2%
9%
2%
0% 10% 20% 30% 40% 50% 60% 70% 80% 90% 100%
Administrative engagement
Full staff participation in ACP
Making ACP student focused
Institutionalized Implemented Initiated Not yet started

13
others, family engagement lagged behind other efforts. One middle school noted that they do eighth-grade conferences with each student regardless of whether parents attend.
Figure 3 shows the results from the school-level survey of principals related to family engagement. While there are nearly equal levels of informing families and engaging families on ACP, nearly half of respondents indicated that these ACP elements were initiated.
Figure 3: Implementation of ACP Family Engagement, 2018-19
Source: Academic and Career Planning 2018-19 Evaluation Survey Results
Data from Career Cruising can also shed light on the extent of family engagement with ACP. Career Cruising allows for families of students to login to the software to see the student progress.5 The extent of this occurring varied by grade level as seen in Table 3. Of students in schools participating in Career Cruising, the percentage with a family member logging in at least once ranged from 0.1 percent in sixth grade to 1.5 percent in eighth grade.
5 Future tracking of family engagement through this method may change as the software transitioned from Career Cruising to Xello for the 2019-20 school year.
7%
7%
33%
31%
48%
49%
12%
13%
0% 10% 20% 30% 40% 50% 60% 70% 80% 90% 100%
Regularly informing families of their students' ACP
Regularly engaging families in their students' ACP
Institutionalized Implemented Initiated Not yet started

14
Table 3: Percentage of Students with At Least One Career Cruising Family Login by Grade, 2017-18
Grade Percentage 6 0.1% 7 0.8% 8 1.5% 9 1.1% 10 1.4% 11 1.0% 12 0.7%
Note: Schools with Career Cruising records only. Source: Career Cruising
Regular and ongoing supportive and safe student relationships with adults. Interviewees reported improved student-adult relationships at most of the case study districts and schools. In Box Elder, teachers noted that these types of relationships are “absolutely the key” to successful ACP implementation, reporting this idea as the rationale for having small advisory class groups with only 12-16 students in each, always with “kids from several different levels, so it does create a kind of family atmosphere.” Similarly, maintaining homeroom/advisory teacher assignments for all four years of high school was seen in a number of districts as a means to grow more meaningful and trusting student-adult relationships.
Similar to many of the case study districts, respondents to the school-level survey generally indicated implementation of supportive and safe student relationships with adults in the school. As Figure 4 shows, 78 percent of respondents thought their school had either institutionalized or implemented this ACP element.

15
Figure 4: Implementation of Supportive and Safe Student Relationships with Adults, 2018-19
Source: Academic and Career Planning 2018-19 Evaluation Survey Results
Non-judgmental, informed, comprehensive education and career advising. Advising practices in many of the case study schools were shared between school counselors and staff. One school reported that there is an advisor for each grade level who meets with students during the daily 35-minute “flex time” so that all students have regular access to advising. Another high school reported that within their daily advisory hour, students must meet individually with their advisor at least every three weeks to monitor and discuss grades, goals, and plans. In fact, most of the schools with dedicated advisory periods position the teachers leading them as advisors whom students can meet with in addition to school counselors.
Results from the school-level survey of principals show high levels of implementation of this ACP infrastructural element in 2018-19 as seen in Figure 5. Approximately 87 percent of respondents answered that they institutionalized or implemented informed education and career advising at their school and a similar proportion of respondents indicated likewise for non-judgmental education and career advising.
27% 51% 20% 3%
0% 10% 20% 30% 40% 50% 60% 70% 80% 90% 100%
Supportive and safe student relationship withadult/mentor
Institutionalized Implemented Initiated Not yet started

16
Figure 5: Implementation of Non-Judgmental and Informed Education and Career Advising, 2018-19
Source: Academic and Career Planning 2018-19 Evaluation Survey Results
Equitable access to all ACP opportunities. In all of the school districts visited, students, staff, and parents reported that ACP was being implemented for all students. It was reported that if necessary, special education students may have activities differentiated but no student, special education, English Learner (EL), or other, was excluded. One high school noted that some of the Final Project presentation tables were conducted in Spanish so that students and family members could participate more fully.
DPI defines educational equity as “every student [having] access to the resources and educational rigor they need at the right moment in their education, across race, gender, ethnicity, language, disability, sexual orientation, family background, and/or family income.” However, it is important to distinguish between equity in terms of access, that is, who is theoretically able to participate, and equity in actual participation rates. A wide variety of factors can create barriers to participate among students who are theoretically eligible. To provide an example of just one form of barrier, this year’s survey inquired about rates of participation in various ACP activities, percentages of interested students who are able to be served and/or funded, and decision-making processes for selecting students when interest outstrips available funding. A variety of selection processes were reported, with the probability for bias, unconscious or otherwise, likely to be quite high. For more information, see Academic & Career Planning 2018-19 Evaluation Survey Results, pages 19-24.
Throughout the state, many schools also indicated via the survey that they provided equitable access to all ACP opportunities. Figure 6 shows the results from the school-level survey of principals on an item related to this ACP element. As shown, 82 percent of respondents thought their school either institutionalized or implemented this practice.
32%
33%
54%
54%
14%
11%
1%
1%
0% 10% 20% 30% 40% 50% 60% 70% 80% 90% 100%
Informed education and career advising
Non-judgmental education and career advising
Institutionalized Implemented Initiated Not yet started

17
Figure 6: Implementation of Equitable Access to All ACP Opportunities, 2018-19
Source: Academic and Career Planning 2018-19 Evaluation Survey Results
As always, self-reported data should be recognized as such, particularly in terms of sensitive topics like equity. While including all students in ACP work, and honoring all post-graduation plans, are important, there is still the potential for these activities, practices, and policies to be implemented inequitably. Further research is required to better understand bias, unconscious or otherwise, that may affect the equitable implementation of ACP in districts and schools.
Student participation results in work-based learning activities and enrollment in dual credit and college-level industry certifications in the sections below will also highlight the extent of equitable access to ACP by providing breakdowns of participation by student subgroups. These subgroups include differences by race/ethnicity, economic status, EL status, and special education status where they exist. To examine the extent of equitable access by region, these later sections will also examine participation by CESA.
Regular, ongoing and dedicated time for ACP activities. Each of the case study districts reported having built in dedicated time for regular, ongoing ACP activities. The high schools all reported having regular homeroom or advisory periods that were dedicated all or in part to ACP activities. One middle school formerly delivered the majority of ACP curriculum in homerooms, but recently switched it to the required seventh- and eighth-grade Computers class for several reasons. First, they believed that there would be more student “accountability” in a graded course, and secondly, because much of the ACP work in middle school involved using the Career Cruising platform, it was convenient to deliver it in the computer lab. Finally, leadership identified several state standards for computers that dealt with careers and aligned with ACP work. The continuity provided by having the same teacher for these courses in both grades was also seen as an advantage.
However, regular ACP time varied from daily to monthly meetings. As noted in last year’s report, more research regarding “dosage” of ACP would be valuable in order to make recommendations regarding
29% 53% 16% 2%
0% 10% 20% 30% 40% 50% 60% 70% 80% 90% 100%
Providing equitable access
Institutionalized Implemented Initiated Not yet started

18
best practices and minimum amounts for effectiveness. A preliminary look at dosage was included in this year’s survey and found that schools with more dedicated ACP time typically also had higher levels of implementation in other areas of ACP.
Qualitative data suggests that monthly or other infrequent ACP time is likely insufficient for high-level implementation. In one school that devoted only one advisory period a month for ACP-related activities, students expressed the desire for more frequent meetings so that they would have more time to complete activities and more continuity between lessons.
In addition to dosage, the make-up and timing of advisory periods/homerooms may be important. In a minority of case study schools, the advisory/homeroom periods are single grade, but most had mixed-grade formats. Those using the mixed-grade approach reported seeing older students helping and mentoring younger students. Those using single-grade approaches mentioned the benefits of targeting lessons more closely to developmental and age-related needs. One high school, who over the course of 14 years, had tried a variety of configurations, settled on mixed grades, reporting,
“We’ve been around long enough to see several different versions of advisings, and we have found that it is most successful with mixed grades, because [students] mentor/advise each other. Especially when it comes to course selections or information about the teachers.”
Furthermore, most schools maintained the teacher-student assignment for the duration of the students’ middle or high school years, allowing for longer-term relationships of trust and continuity to be built between students and advisory teachers.
Figure 7 shows the extent of implementation of regular, ongoing, and dedicated time for ACP activities throughout the state from the school-level survey. As this figure displays, 79 percent of respondents thought their school had institutionalized or implemented this element.

19
Figure 7: Implementation of Regular, Dedicated Time for ACP Activities, 2018-19
Source: Academic and Career Planning 2018-19 Evaluation Survey Results
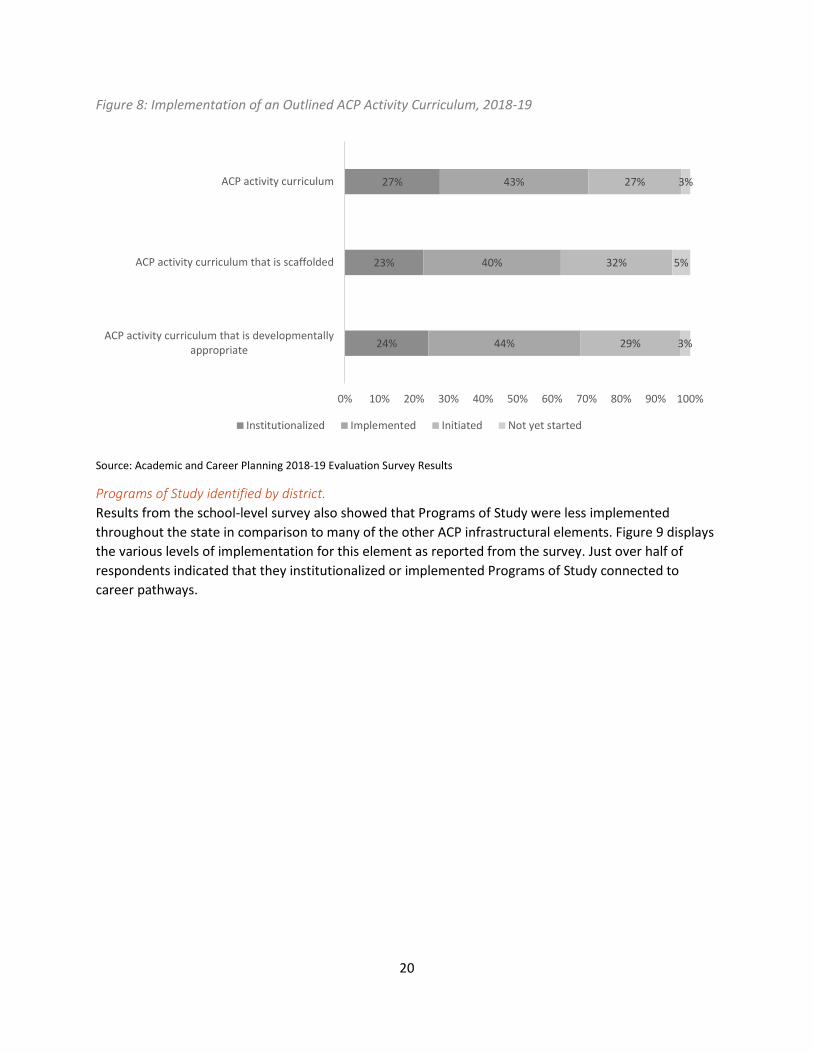
Outlined ACP activity curriculum that is scaffolded and developmentally appropriate (scope and sequence). All case study districts had an ACP scope and sequence, and many reported that they were regularly refining and updating it. In addition, many of these schools reported that they were transitioning more activities into required courses, either away from electives (for example, moving resume writing out of an elective business course and into a required English course) or from the homeroom/advisory period. These moves were intended both to provide more universal access to certain activities and to increase the sense of a “school-wide culture of ACP.”
Of the respondents to the school-level survey, 68 percent provided information that their school had institutionalized or implemented an outlined ACP activity curriculum that was developmentally appropriate, as shown in Figure 8. Similarly, 63 percent of respondents thought they had institutionalized or implemented an ACP activity curriculum that is scaffolded.
36% 43% 18% 2%
0% 10% 20% 30% 40% 50% 60% 70% 80% 90% 100%
Regular, dedicated time for ACP activities
Institutionalized Implemented Initiated Not yet started
20
Figure 8: Implementation of an Outlined ACP Activity Curriculum, 2018-19
Source: Academic and Career Planning 2018-19 Evaluation Survey Results
Programs of Study identified by district. Results from the school-level survey also showed that Programs of Study were less implemented throughout the state in comparison to many of the other ACP infrastructural elements. Figure 9 displays the various levels of implementation for this element as reported from the survey. Just over half of respondents indicated that they institutionalized or implemented Programs of Study connected to career pathways.
27%
23%
24%
43%
40%
44%
27%
32%
29%
3%
5%
3%
0% 10% 20% 30% 40% 50% 60% 70% 80% 90% 100%
ACP activity curriculum
ACP activity curriculum that is scaffolded
ACP activity curriculum that is developmentallyappropriate
Institutionalized Implemented Initiated Not yet started

21
Figure 9: Implementation of Programs of Study Connected to Career Pathways, 2018-19
Source: Academic and Career Planning 2018-19 Evaluation Survey Results
Student activity components Student participation in work-based learning activities. Most case study schools reported an increase in the number of students participating in job shadows compared to previous years. Several of these schools require students to do one or more job shadows during high school, with one school requiring five job shadows over the final three years of high school. Counselors and other school staff reported a number of strategies for increasing work-based learning opportunities, including allowing students interested in teaching to serve as Teaching Assistants in district schools, and involving community members and employers in the final projects as a way to build connections, both with the school programming and with individual students.
As with the infrastructural ACP elements above, the school-level survey also examined the level of implementation of several ACP student activity components. Two of the items on this survey asked about work-based learning activities, one related to the implementation of identifying these activities, and the other related to the implementation of encouraging these activities. Figure 10 shows the results from these items on the survey. As this figure shows, 67 percent of respondents indicated that their school either institutionalized or implemented the practice of identifying work-based learning opportunities for students and slightly more, 71 percent, indicated that their school institutionalized or implemented the practice of encouraging work-based learning opportunities for students.
16% 40% 35% 9%
0% 10% 20% 30% 40% 50% 60% 70% 80% 90% 100%
Programs of Study connected to career pathways
Institutionalized Implemented Initiated Not yet started

22
Figure 10: Implementation of Work-Based Learning Opportunities for Students, 2018-19
Source: Academic and Career Planning 2018-19 Evaluation Survey Results
Student-level data can serve as an additional source of information as to the extent of implementation throughout the state of ACP student activities. One available source of data related to work-based learning is CTEERS, which provides information on student participation in work-based learning opportunities for CTE concentrator students. While not ideal for evaluating the extent of participation of all students, over time, these data may illustrate if participation trends in these activities are increasing. Figure 11 shows the percentage of these students participating in at least one type of work-based learning methodology from 2014-15 through 2017-18 (the most recent year available).6 As this figure shows, the rate of participation increased over this period from approximately 17 percent in 2014-15 to 21 percent in 2017-18.
6 Work-based learning methodologies examined include non-certificated (co-ops, supervised occupational experiences, and internships) and certificated (youth apprenticeship programs, state certified cooperative education skills standards programs, employability skills certificate programs, and business/industry sponsored certificate programs).
22%
25%
45%
46%
26%
22%
7%
6%
0% 10% 20% 30% 40% 50% 60% 70% 80% 90% 100%
Identifying work-based learning opportunities for students
Encouraging work-based learning opportunieis forstudents
Institutionalized Implemented Initiated Not yet started

23
Figure 11: Percentage of CTE Concentrators Participating in at least One Work-Based Learning Methodology, 2014-15 through 2017-18
Source: CTEERS
Since the CTEERS data is at the student level, the evaluation can also examine the level of equitable participation in these activities by subgroup analyses. Again, it is important to provide distinction between equity in terms of access and equity in actual participation rates. While the following results show differences in actual participation rates, there may also exist a wide variety of factors that create barriers to participation for some of these subgroups of students. Figure 12 shows the rate of participation in at least one work-based learning methodology by race/ethnicity. As seen, white students participated at higher rates than other racial/ethnic groups. Figures 13–15 show similar rates of participation by economic status, English learner status, and special education status respectively. Results all show differences in participation for these subgroups with the largest difference between English learners and non-English learners.
0%
5%
10%
15%
20%
25%
2015 2016 2017 2018

24
Figure 12: Percentage of CTE Concentrators Participating in at least One Work-Based Learning Methodology by Race/Ethnicity, 2014-15 through 2017-18
Source: CTEERS
Figure 13: Percentage of CTE Concentrators Participating in at least One Work-Based Learning Methodology by Economic Status, 2014-15 through 2017-18
Source: CTEERS
0%
5%
10%
15%
20%
25%
2015 2016 2017 2018
Black Hispanic White Other
0%
5%
10%
15%
20%
25%
2015 2016 2017 2018
Non-Economically Disadvantaged Economically Disadvantaged

25
Figure 14: Percentage of CTE Concentrators Participating in at least One Work-Based Learning Methodology by EL Status, 2014-15 through 2017-18
Source: CTEERS
Figure 15: Percentage of CTE Concentrators Participating in at least One Work-Based Learning Methodology by Special Education Status, 2014-15 through 2017-18
Source: CTEERS
Another way to examine the participation in work-based learning opportunities is by region. Table 4 shows the percentage of CTE concentrators participating in at least one type of work-based learning methodology by CESA for the three years leading up to ACP implementation and first full year of ACP implementation. As seen from this table there were differences in the rates of participation, with CESA 5 and 6 having the highest participation rates and CESA 8 having the lowest participation rate in 2017-18.
0%
5%
10%
15%
20%
25%
2015 2016 2017 2018
Non-English Learner English Learner
0%
5%
10%
15%
20%
25%
2015 2016 2017 2018
Non-Special Education Special Education

26
Table 4: Percentage of CTE Concentrators Participating in at least One Work-Based Learning Methodology by CESA, 2014-15 through 2017-18
CESA 2015 2016 2017 2018 1 12.7% 10.2% 12.3% 16.3% 2 19.0% 21.6% 22.7% 22.6% 3 15.3% 16.7% 16.6% 24.4% 4 17.7% 18.9% 17.3% 30.6% 5 27.8% 31.0% 36.3% 32.2% 6 20.5% 18.3% 18.5% 24.6% 7 16.2% 17.7% 15.2% 18.6% 8 2.6% 10.2% 7.9% 14.5% 9 38.0% 25.2% 33.2% 32.0% 10 19.7% 15.6% 17.0% 25.2% 11 12.3% 12.3% 13.0% 19.3% 12 4.9% 2.4% 6.6% 15.1%
Source: CTEERS
Examining the separate types of work-based learning, Figure 16 shows the percentage of CTE concentrators participating in various types of non-certificated, work-based learning opportunities from 2014-15 to 2017-18. As this figure shows, approximately 1 to 3 percent of CTE concentrators participated in internships, 2 to 3 percent participated in co-ops, and 3 to 5 percent participated in supervised occupational experiences. For all activities, participation increased for ACP implementation in 2017-18 from the previous year.
Figure 16: Percentage of CTE Concentrators Participating in a Work-Based, Non-Certificated Learning Methodology, 2014-15 through 2017-18
Source: CTEERS
As with overall work-based learning participation, the evaluation can examine participation in the types of non-certificated learning for various subgroups. Figure 17 shows the participation rates of CTE
0%
1%
2%
3%
4%
5%
6%
7%
8%
9%
10%
2015 2016 2017 2018
Co-op Supervised Occupational Experience Internship

27
concentrators in supervised occupational experiences by the race or ethnicity of the students. As shown, white students participated in supervised occupational experiences at higher rates than black and Hispanic students. Most racial/ethnic groups participated at similar rates in co-ops and internships. An examination of participation by economic status revealed few differences in rates of participation. Examining differences in the participation rate in these work-based learning opportunities between EL and non-EL students found little differences in participation rates for co-ops and internships. For supervised occupational experiences, EL students participated at slightly lower rates, as seen in Figure 18. There were also similar rates of participation for special education and non-special education students in co-ops and internships. Figure 19 shows a slightly higher rate of participation in supervised occupational experiences for special education students than for non-special education students.
Figure 17: Percentage of CTE Concentrators Participating in Supervised Occupational Experiences by Race/Ethnicity, 2014-15 through 2017-18
Source: CTEERS
0%
1%
2%
3%
4%
5%
6%
7%
8%
9%
10%
2015 2016 2017 2018
Black Hispanic White Other

28
Figure 18: Percentage of CTE Concentrators Participating in Supervised Occupational Experiences by EL Status, 2014-15 through 2017-18
Source: CTEERS
Figure 19: Percentage of CTE Concentrators Participating in Supervised Occupational Experiences by Special Education Status, 2014-15 through 2017-18
Source: CTEERS
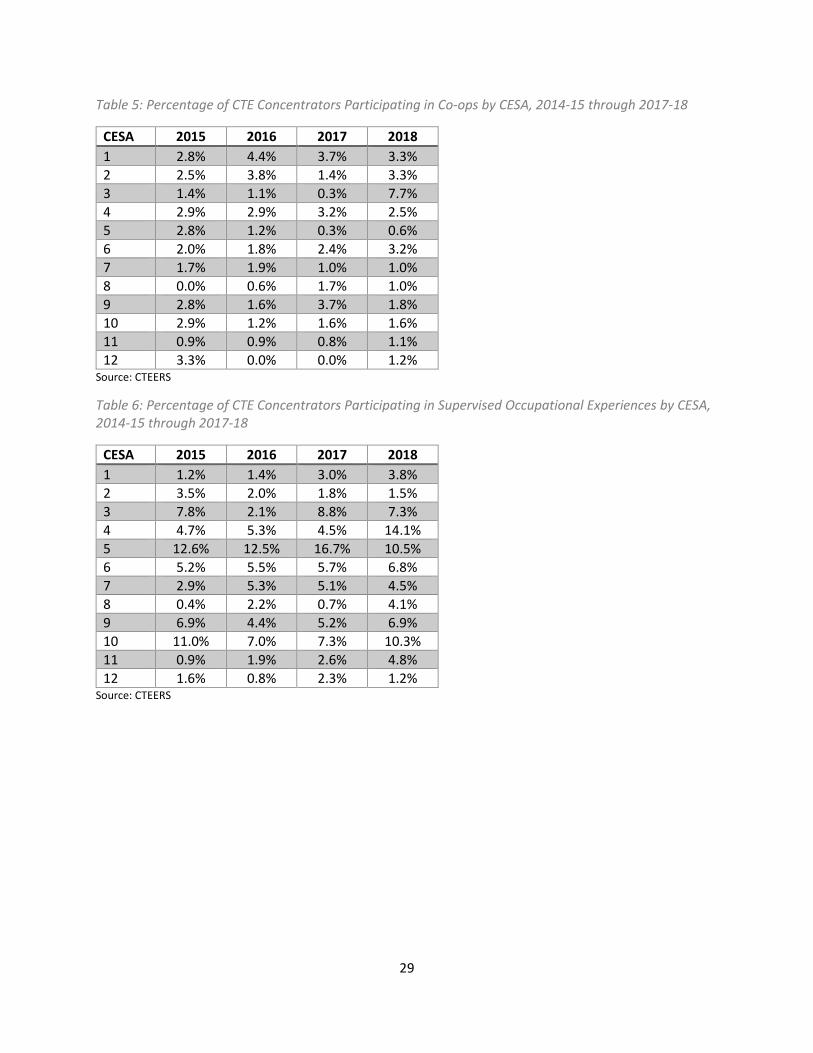
Table 5–Table 7 show the percentage of CTE concentrators participating in co-ops, supervised occupational experiences, and internships respectively by CESA. As these tables demonstrate, there was variance in the level of participation across the CESA regions. Participation in co-ops was highest in CESA 1, CESA 2, and CESA 3 and lowest in CESA 5, CESA 7, and CESA 8; participation in supervised occupational experiences was highest in CESA 4, CESA 5, and CESA 10 and lowest in CESA 2 and CESA 12; and participation in internships was highest in CESA 5 and lowest in CESA 3, CESA 10, and CESA 11 during the first year of ACP implementation.
0%
1%
2%
3%
4%
5%
6%
7%
8%
9%
10%
2015 2016 2017 2018
Non-English Learner English Learner
0%
1%
2%
3%
4%
5%
6%
7%
8%
9%
10%
2015 2016 2017 2018
Non-Special Education Special Education
29
Table 5: Percentage of CTE Concentrators Participating in Co-ops by CESA, 2014-15 through 2017-18
CESA 2015 2016 2017 2018 1 2.8% 4.4% 3.7% 3.3% 2 2.5% 3.8% 1.4% 3.3% 3 1.4% 1.1% 0.3% 7.7% 4 2.9% 2.9% 3.2% 2.5% 5 2.8% 1.2% 0.3% 0.6% 6 2.0% 1.8% 2.4% 3.2% 7 1.7% 1.9% 1.0% 1.0% 8 0.0% 0.6% 1.7% 1.0% 9 2.8% 1.6% 3.7% 1.8% 10 2.9% 1.2% 1.6% 1.6% 11 0.9% 0.9% 0.8% 1.1% 12 3.3% 0.0% 0.0% 1.2%
Source: CTEERS
Table 6: Percentage of CTE Concentrators Participating in Supervised Occupational Experiences by CESA, 2014-15 through 2017-18
CESA 2015 2016 2017 2018 1 1.2% 1.4% 3.0% 3.8% 2 3.5% 2.0% 1.8% 1.5% 3 7.8% 2.1% 8.8% 7.3% 4 4.7% 5.3% 4.5% 14.1% 5 12.6% 12.5% 16.7% 10.5% 6 5.2% 5.5% 5.7% 6.8% 7 2.9% 5.3% 5.1% 4.5% 8 0.4% 2.2% 0.7% 4.1% 9 6.9% 4.4% 5.2% 6.9% 10 11.0% 7.0% 7.3% 10.3% 11 0.9% 1.9% 2.6% 4.8% 12 1.6% 0.8% 2.3% 1.2%
Source: CTEERS

30
Table 7: Percentage of CTE Concentrators Participating in Internships by CESA, 2014-15 through 2017-18
CESA 2015 2016 2017 2018 1 1.2% 1.0% 2.1% 3.5% 2 0.6% 1.1% 2.2% 2.6% 3 0.1% 2.3% 0.9% 0.3% 4 5.0% 3.0% 2.7% 3.3% 5 4.3% 4.1% 7.0% 6.0% 6 1.7% 1.8% 1.6% 3.3% 7 0.7% 1.4% 0.6% 0.7% 8 1.3% 0.3% 0.0% 0.5% 9 2.1% 0.0% 0.5% 1.4% 10 0.0% 0.4% 1.8% 0.1% 11 0.9% 0.1% 0.4% 0.5% 12 0.0% 0.0% 0.0% 1.2%
Source: CTEERS
Student-level data from CTEERS also provides information on the participation in certificated, work-based learning opportunities in the years leading up to ACP implementation. Again, while these data are limited to CTE concentrator students, they can provide a baseline over time to compare to statewide ACP implementation in 2017-18. Figure 20 shows the participation rate of CTE concentrators for four types of certificated, work-based learning opportunities from 2014-15 through 2017-18. As shown, approximately 1 to 2 percent of CTE concentrators participated in state certified cooperative education skill standards programs, a similar percentage of students participated in employability skills certificate programs, 3 to 5 percent participated in business or industry sponsored certificate programs, and 5 to 7 percent participated in youth apprenticeship programs. Participation in business/industry sponsored certificates and youth apprenticeship programs increased in 2017-18 compared to previous years.

31
Figure 20: Percentage of CTE Concentrators Participating in a Work-Based, Certificated Learning Methodology, 2014-15 through 2017-18
Source: CTEERS
The evaluation also examined the equitability of participation in these types of work-based learning opportunities. Figure 21 shows the participation rate in youth apprenticeship programs by race/ethnicity. Participation was highest for white students at approximately 6 to 8 percent and was lowest for black students at approximately 1 to 4 percent. Figure 22 shows the participation rate in business/industry sponsored certificate programs by race/ethnicity. As seen, Hispanic students typically participated at higher rates and black students typically participated at lower rates than other racial or ethnic groups. In more recent years, there was little difference in participation in state certified cooperative education skill standards programs and employability skills certificate programs by race or ethnicity.
0%
1%
2%
3%
4%
5%
6%
7%
8%
9%
10%
2015 2016 2017 2018
Youth Apprenticeship Program
State Certified Cooperative Education Skill Standards Program
Employability Skills Certificate Program
Business/Industry Sponsored Certificate Program

32
Figure 21: Percentage of CTE Concentrators Participating in Youth Apprenticeship Programs by Race/Ethnicity, 2014-15 through 2017-18
Source: CTEERS
Figure 22: Percentage of CTE Concentrators Participating in Business/Industry Sponsored Certificate Programs by Race/Ethnicity, 2014-15 through 2017-18
Source: CTEERS
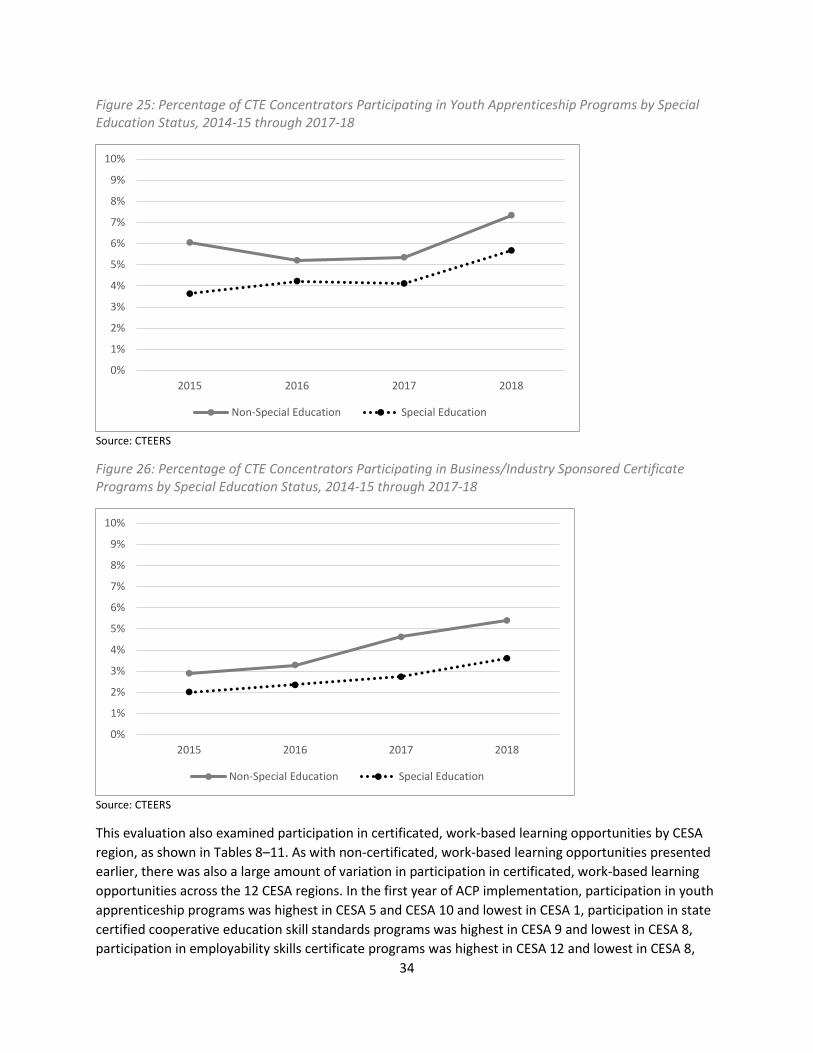
The evaluation also examined participation rates in certificated, work-based learning programs by economically disadvantaged status, English learner status, and special education status. Participation rates in the years leading up to and including statewide ACP implementation appear similar for these programs with the exception of youth apprenticeships and business/industry sponsored certificate programs. Youth apprenticeship participation was lower for economically disadvantaged students (Figure 23), non-English learner students (Figure 24), and special education students (Figure 25).
0%
1%
2%
3%
4%
5%
6%
7%
8%
9%
10%
2015 2016 2017 2018
Black Hispanic White Other
0%
1%
2%
3%
4%
5%
6%
7%
8%
9%
10%
2015 2016 2017 2018
Black Hispanic White Other

33
Participation rates in business/industry sponsored certificate programs were also lower for special education students as seen in Figure 26.
Figure 23: Percentage of CTE Concentrators Participating in Youth Apprenticeship Programs by Economic Status, 2014-15 through 2017-18
Source: CTEERS
Figure 24: Percentage of CTE Concentrators Participating in Youth Apprenticeship Programs by EL Status, 2014-15 through 2017-18
Source: CTEERS
0%
1%
2%
3%
4%
5%
6%
7%
8%
9%
10%
2015 2016 2017 2018
Non-Economically Disadvantaged Economically Disadvantaged
0%
1%
2%
3%
4%
5%
6%
7%
8%
9%
10%
2015 2016 2017 2018
Non-English Learner English Learner
34
Figure 25: Percentage of CTE Concentrators Participating in Youth Apprenticeship Programs by Special Education Status, 2014-15 through 2017-18
Source: CTEERS
Figure 26: Percentage of CTE Concentrators Participating in Business/Industry Sponsored Certificate Programs by Special Education Status, 2014-15 through 2017-18
Source: CTEERS
This evaluation also examined participation in certificated, work-based learning opportunities by CESA region, as shown in Tables 8–11. As with non-certificated, work-based learning opportunities presented earlier, there was also a large amount of variation in participation in certificated, work-based learning opportunities across the 12 CESA regions. In the first year of ACP implementation, participation in youth apprenticeship programs was highest in CESA 5 and CESA 10 and lowest in CESA 1, participation in state certified cooperative education skill standards programs was highest in CESA 9 and lowest in CESA 8, participation in employability skills certificate programs was highest in CESA 12 and lowest in CESA 8,
0%
1%
2%
3%
4%
5%
6%
7%
8%
9%
10%
2015 2016 2017 2018
Non-Special Education Special Education
0%
1%
2%
3%
4%
5%
6%
7%
8%
9%
10%
2015 2016 2017 2018
Non-Special Education Special Education

35
and finally participation in business or industry sponsored certificate programs was highest in CESA 4 and lowest in CESA 12.
Table 8: Percentage of CTE Concentrators Participating in Youth Apprenticeship Programs by CESA, 2014-15 through 2017-18
CESA 2015 2016 2017 2018 1 5.2% 3.4% 2.5% 3.1% 2 6.6% 7.1% 8.0% 8.1% 3 4.9% 8.5% 5.8% 11.6% 4 4.3% 3.8% 4.0% 6.1% 5 9.9% 11.7% 13.6% 14.4% 6 5.6% 5.3% 5.7% 8.7% 7 4.8% 4.9% 4.9% 7.3% 8 1.5% 4.6% 5.6% 6.9% 9 16.8% 9.1% 13.8% 12.1% 10 3.6% 3.2% 5.2% 13.0% 11 4.2% 4.8% 4.9% 9.7% 12 0.5% 1.6% 0.3% 5.8%
Source: CTEERS
Table 9: Percentage of CTE Concentrators Participating in State Certified Cooperative Education Skill Standards Programs by CESA, 2014-15 through 2017-18
CESA 2015 2016 2017 2018 1 1.2% 0.7% 0.7% 0.2% 2 1.6% 1.1% 1.7% 2.9% 3 3.8% 0.6% 0.4% 3.4% 4 1.6% 2.8% 1.2% 2.2% 5 3.2% 3.0% 2.6% 3.0% 6 1.7% 1.7% 2.9% 3.9% 7 4.1% 3.4% 2.2% 1.4% 8 0.0% 0.0% 0.0% 0.0% 9 9.0% 6.7% 7.5% 5.1% 10 0.6% 0.4% 0.5% 0.2% 11 1.8% 1.9% 1.8% 1.1% 12 0.0% 0.0% 0.3% 1.9%
Source: CTEERS

36
Table 10: Percentage of CTE Concentrators Participating in Employability Skills Certificate Programs by CESA, 2014-15 through 2017-18
CESA 2015 2016 2017 2018 1 1.4% 1.3% 1.8% 1.1% 2 1.8% 1.0% 2.4% 1.4% 3 2.1% 2.7% 2.2% 0.9% 4 1.1% 0.5% 0.5% 1.6% 5 3.2% 3.5% 3.0% 3.8% 6 1.0% 0.8% 1.3% 1.0% 7 2.0% 0.9% 1.2% 1.2% 8 0.0% 0.0% 0.0% 0.0% 9 4.2% 3.4% 3.7% 4.0% 10 4.1% 3.2% 2.5% 1.4% 11 4.5% 2.9% 3.7% 3.1% 12 2.7% 0.0% 0.0% 8.9%
Source: CTEERS
Table 11: Percentage of CTE Concentrators Participating in Business/Industry Sponsored Certificate Programs by CESA, 2014-15 through 2017-18
CESA 2015 2016 2017 2018 1 2.0% 2.4% 4.2% 5.3% 2 5.0% 7.4% 8.9% 7.4% 3 0.0% 0.8% 0.4% 0.9% 4 3.3% 4.3% 8.0% 9.1% 5 0.5% 2.8% 3.2% 2.2% 6 6.1% 3.9% 3.5% 4.3% 7 1.8% 2.0% 2.8% 6.4% 8 0.2% 3.7% 1.7% 2.8% 9 0.9% 1.2% 1.2% 2.8% 10 1.8% 2.1% 1.9% 4.3% 11 1.3% 0.5% 2.2% 2.1% 12 0.0% 0.0% 3.6% 0.0%
Source: CTEERS
For full tables of participation rates in the various types of work-based learning for all subgroups, refer to Appendix D.
Students taking dual credit, AP, IB and college level industry certification courses. Counselors and teachers across all the case study districts reported that dual credit opportunities were being promoted at their schools and that participation was increasing. One veteran teacher reported that dual credit used to be “AP classes or nothing, and then if you didn’t do well on that AP test, you didn’t get any credit.” She noted the increase of dual credit courses across many different disciplines, saying “now there’s lots of way for kids to earn credits. I think that opened up a lot of eyes.” Similarly, a teacher at a high school noted the relationship that they had developed with their regional technical college, who “understood the importance of us being a feeder to them, if [students] start here, and credits count, they may well continue on there after graduation. That’s a win-win.” Another teacher at

37
the same school noted the “online explosion” which allowed students to “take almost anything you could want.” She also noted that many courses offer some sort of certification, and that for online courses, the district pays the fees. She noted that
“we do push students towards the certification courses like tech ed and business areas. Those we can test kids for free in Wisconsin. Those can hold kids to a higher standard. [For example,] the Microsoft Office Skills (MOS) test, then brings money back to the district if kids pass the tests. The funding we get back from passing the test can be used to buy more tests or buy software programs to help with the testing skills needed.”
The school-level survey also asked respondents about their level of implementation regarding this ACP element. Figure 27 shows that over three-quarters of respondents institutionalized or implemented the practices of informing students about dual credit opportunities and AP or IB opportunities. Nearly two-thirds of respondents indicated that their school institutionalized or implemented the practice of informing students about college-level industry certification courses.
Figure 27: Implementation of Informing Students of Dual Credit, AP, IB, and College-Level Industry Certification Courses, 2018-19
Source: Academic and Career Planning 2018-19 Evaluation Survey Results
The source of student-level data on AP and IB course participation comes from DPI’s Coursework Completion System (CWCS) which covered 2014-15 and 2015-16 and Roster which covered 2016-17 and 2017-18. Due to the change in data systems over the period of examination, the evaluation only included schools that reported data on AP and IB over all four years. Figure 28 shows the statewide participation rate in AP/IB courses among students in Grades 11–12. The participation rate from 2014-15 through 2017-18 ranged from approximately 33 percent to 37 percent. While there was a slight decrease in participation from 2015-16 to 2016-17 (which may be due to changing data systems), there was a slight increase in participation from 2016-17 to the first year of ACP implementation in 2017-18.
35%
39%
19%
43%
40%
44%
16%
14%
30%
6%
7%
7%
0% 10% 20% 30% 40% 50% 60% 70% 80% 90% 100%
Informing students about dual credit opportunities
Informing students about AP or IB opportunities
Informing students about college-level industrycertification courses
Institutionalized Implemented Initiated Not yet started

38
Figure 28: Percentage of 11th and 12th Grade Students Participating in at least one AP or IB Course, 2014-15 through 2017-18
Source: CWCS/Roster
The evaluation also examined equitable participation in AP/IB course enrollment across student subgroups. Figures 29–32 show the participation rate by race/ethnicity, economic status, EL status, and special education status respectively. As seen from these figures, black students, Hispanic students, economically disadvantaged students, EL students, and special education students all had participation rates lower than their subgroups of comparison. As seen from Figure 31, however, the participation rate of EL students increased during the first year of statewide ACP implementation. As mentioned previously, it is unclear to the extent that participation rates are different due to barriers for course enrollment or simply differing levels of student choice in participation.
0%
5%
10%
15%
20%
25%
30%
35%
40%
45%
50%
2015 2016 2017 2018

39
Figure 29: Percentage of 11th and 12th Grade Students Participating in at least one AP or IB Course by Race/Ethnicity, 2014-15 through 2017-18
Source: CWCS/Roster
Figure 30: Percentage of 11th and 12th Grade Students Participating in at least one AP or IB Course by Economic Status, 2014-15 through 2017-18
Source: CWCS/Roster
0%
5%
10%
15%
20%
25%
30%
35%
40%
45%
50%
2015 2016 2017 2018
Black Hispanic White Other
0%
5%
10%
15%
20%
25%
30%
35%
40%
45%
50%
2015 2016 2017 2018
Non-Economically Disadvantaged Economically Disadvantaged

40
Figure 31: Percentage of 11th and 12th Grade Students Participating in at least one AP or IB Course by EL Status, 2014-15 through 2017-18
Source: CWCS/Roster
Figure 32: Percentage of 11th and 12th Grade Students Participating in at least one AP or IB Course by Special Education Status, 2014-15 through 2017-18
Source: CWCS/Roster
Regional participation in AB/IB courses also varied as seen from Table 12. During statewide implementation in 2017-18, CESA 1 had the highest participation rate and CESA 8 had the lowest.
0%
5%
10%
15%
20%
25%
30%
35%
40%
45%
50%
2015 2016 2017 2018
Non-English Learner English Learner
0%
5%
10%
15%
20%
25%
30%
35%
40%
45%
50%
2015 2016 2017 2018
Non-Special Education Special Education

41
Table 12: Percentage of High School Students Participating in at least one AP or IB Course by CESA, 2014-15 through 2017-18
CESA 2015 2016 2017 2018 1 43.5% 45.3% 42.6% 43.7% 2 38.2% 40.3% 37.8% 39.4% 3 29.3% 32.7% 23.5% 24.9% 4 28.6% 28.5% 21.8% 27.7% 5 30.1% 30.7% 18.6% 16.5% 6 33.4% 33.3% 24.1% 26.9% 7 30.9% 32.2% 31.0% 32.0% 8 17.8% 16.6% 12.9% 10.5% 9 33.2% 33.9% 30.1% 32.3% 10 31.9% 34.0% 36.0% 32.1% 11 33.6% 35.9% 25.6% 26.8% 12 20.8% 19.3% 8.3% 18.5%
Source: CWCS/Roster
Student-level data from CTEERS also provided information on participation or enrollment in dual credit courses both for CTE courses at technical colleges and for courses at universities. Unlike the previous CTEERS data which was limited to only CTE concentrator students, these dual credit data were available for all 11th and 12th grade students. Figure 33 shows the overall participation rates in both types of dual credit, technical college and university. Participation rates in university dual credit courses rose slightly from approximately 15.5 percent in 2014-15 to 20 percent in 2015-16 before dropping to 18 percent in 2016-17 and 2017-18. Over the same time period, participation rates in technical college dual credit CTE courses rose from 14 percent to 20 percent.

42
Figure 33: Percentage of 11th and 12th Grade Students Participating in Dual Credit Courses, 2014-15 through 2017-18
Source: CTEERS
As with previous student-level metrics, this report also includes information on participation in dual credit courses by student subgroup populations in an attempt to ascertain the extent of equity leading up to and including the first year of ACP statewide implementation. Figure 34 and Figure 35 show the participation rates in dual credit courses at universities and technical colleges respectively by race and ethnicity. For both types of dual credit enrollment, white students typically had the highest participation rates and black students had the lowest participation rates.
Figure 34: Percentage of 11th and 12th Grade Students Participating in University Dual Credit Courses by Race/Ethnicity, 2014-15 through 2017-18
Source: CTEERS

43
Figure 35: Percentage of 11th and 12th Grade Students Participating in Technical College Dual Credit Courses by Race/Ethnicity, 2014-15 through 2017-18
Source: CTEERS
Figures 36–38 show the participation rates in both types of dual credit courses by economic status, EL status, and special education status, respectively. All of these figures show a similar trend with a larger gap for subgroup populations in university dual credit enrollment than the gap for subgroup populations in technical college dual credit enrollment.
Figure 36: Percentage of 11th and 12th Grade Students Participating in Dual Credit Courses by Economic Status, 2014-15 through 2017-18
Source: CTEERS

44
Figure 37: Percentage of 11th and 12th Grade Students Participating in Dual Credit Courses by EL Status, 2014-15 through 2017-18
Source: CTEERS
Figure 38: Percentage of 11th and 12th Grade Students Participating in Dual Credit Courses by Special Education Status, 2014-15 through 2017-18
Source: CTEERS
Similar to the other regional examinations, there were also differences in dual credit course participation by CESA region. Tables 13 and 14 show the participation rates in dual credit courses by CESA for university courses and technical college CTE courses, respectively. As seen in Table 13, CESA 5 had the highest participation rate in university dual credit courses and CESA 9 and CESA 10 had the lowest participation rates during the first year of ACP implementation in 2017-18. Table 14 shows the
0%
5%
10%
15%
20%
25%
30%
2015 2016 2017 2018
University EL University Non-EL
Technical College EL Technical College Non-EL
0%
5%
10%
15%
20%
25%
30%
2015 2016 2017 2018
University Special Education
University Non-Special Education
Technical College Special Education
Technical College Non-Special Education

45
rates of participation in technical college dual credit course. The region with the highest participation rate in technical college dual credit courses was CESA 10 and the region with the lowest participation rate was CESA 12 during 2017-18.
Table 13: Percentage of 11th and 12th Grade Students Participating in University Dual Credit Courses by CESA, 2014-15 through 2017-18
CESA 2015 2016 2017 2018 1 21.1% 27.9% 23.1% 20.0% 2 14.8% 15.9% 16.0% 15.8% 3 7.3% 11.1% 12.0% 11.5% 4 8.5% 14.6% 10.2% 16.0% 5 28.1% 29.8% 26.5% 29.4% 6 17.2% 24.3% 24.0% 24.9% 7 16.5% 22.3% 23.5% 19.7% 8 8.0% 6.6% 3.3% 9.4% 9 0.9% 0.9% 1.5% 6.1% 10 4.3% 3.9% 3.1% 3.8% 11 5.0% 6.4% 7.5% 8.9% 12 2.8% 2.1% 1.2% 12.3%
Source: CTEERS
Table 14: Percentage of 11th and 12th Grade Students Participating in Technical College Dual Credit Courses by CESA, 2014-15 through 2017-18
CESA 2015 2016 2017 2018 1 11.2% 11.2% 16.2% 13.1% 2 13.1% 15.6% 20.4% 17.1% 3 8.1% 15.3% 22.1% 21.4% 4 8.7% 7.5% 17.2% 37.4% 5 15.9% 18.8% 22.9% 25.6% 6 18.8% 17.9% 19.8% 21.7% 7 11.9% 12.9% 23.2% 25.5% 8 13.2% 14.7% 19.0% 24.0% 9 21.2% 18.6% 26.2% 29.0% 10 17.4% 23.5% 30.4% 37.9% 11 9.3% 11.6% 14.2% 16.1% 12 6.3% 4.4% 11.0% 8.2%
Source: CTEERS
For full tables of participation rates for all subgroups, refer to Appendix D.
Students utilize knowledge and skills gained through ACP activity participation to set, modify, and update personal, education and career goals. In the case study focus groups, students often mentioned goal-setting activities, connected to interest inventories, course selection, and career preparation. In one high school, students filled out a goal sheet so that counselors could better make recommendations for courses. Goals were also often a component of final projects, with students reporting how they set, adjusted, changed, and met goals.

46
In terms of modifying specific goals and plans, this was often an area of interest in final projects, with interviewers asking students about changes that occurred in their interests and plans during high school. Most schools noted that flexibility in planning was highly encouraged, often recommending or requiring that students have a “Plan B.” Career exploration activities, whether research or work-based learning opportunities, were frequently cited as “eye-opening” for helping students to set and modify goals.
Results from the school-level survey related to this ACP element, found in Figure 39, show that approximately 75 percent of respondents thought their school implemented or institutionalized a process of supporting students to utilize knowledge and skills gained through ACP activities for career goals.
Figure 39: Implementation of Supporting Students to Utilize Knowledge and Skills Gained through ACP Activities for Career Goals, 2018-19
Source: Academic and Career Planning 2018-19 Evaluation Survey Results
A major source of data related to this ACP component is Career Cruising activity completion. At each grade level DPI provides a recommended set of Career Cruising activities for students to complete.7 Data provided by Career Cruising show the extent that students completed these activities at each grade level for students using the software. As noted in the methodology section above, limitations associated with Career Cruising records did not allow for linking of these records to other DPI records. As a result, student completion is only measured for schools with any Career Cruising records and for all ACP schools statewide. Table 15 shows each recommended Career Cruising activity and the percentage of students that completed that activity for each grade. As seen from this table, a majority of students at each grade (with the exception of sixth) completed the Career Matchmaker activity. Other activities with completion rates close to a third included My Saved Careers, Hobbies & Interests, Extracurricular 7 Refer to the following document for detailed descriptions of the recommended activities at each grade level: http://cdn.careercruising.com/clientservice/Recommended%20Default%20Portfolio%20Completion%20Standards.pdf?cdn=a0b9c8
22% 53% 22% 3%
0% 10% 20% 30% 40% 50% 60% 70% 80% 90% 100%
Supporting students to utilize knowledge and skills gainedthrough ACP activities for career goals
Institutionalized Implemented Initiated Not yet started
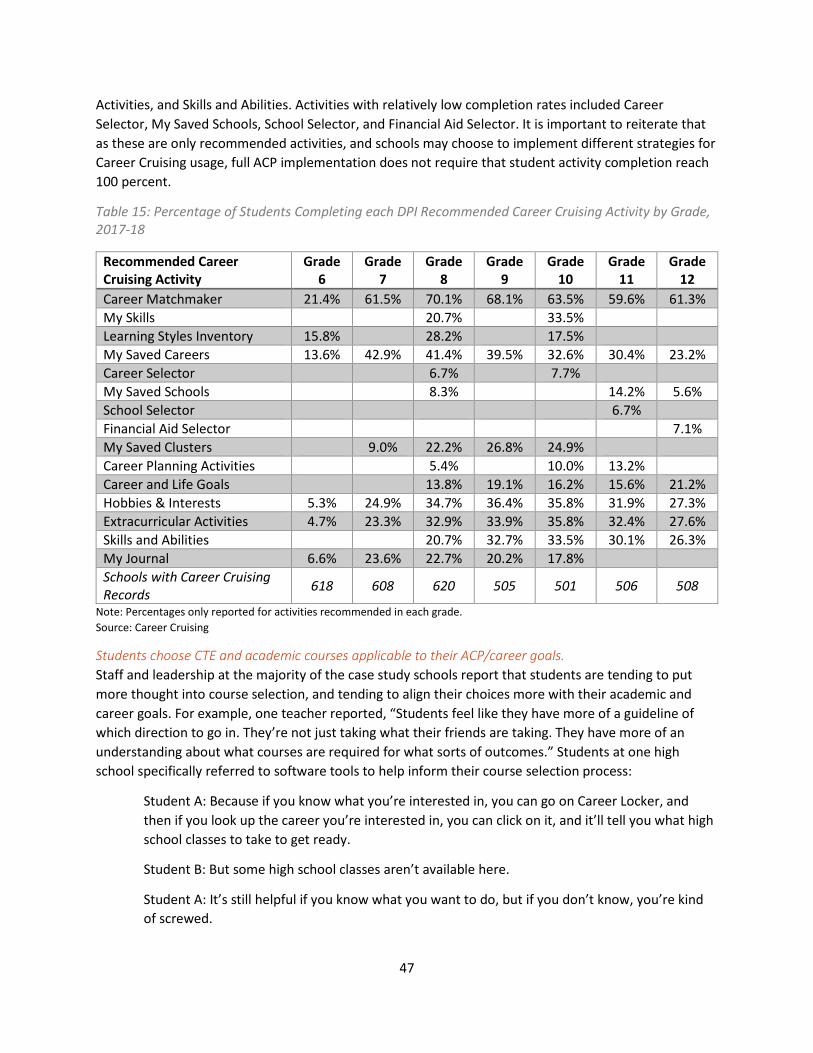
47
Activities, and Skills and Abilities. Activities with relatively low completion rates included Career Selector, My Saved Schools, School Selector, and Financial Aid Selector. It is important to reiterate that as these are only recommended activities, and schools may choose to implement different strategies for Career Cruising usage, full ACP implementation does not require that student activity completion reach 100 percent.
Table 15: Percentage of Students Completing each DPI Recommended Career Cruising Activity by Grade, 2017-18
Recommended Career Cruising Activity
Grade 6
Grade 7
Grade 8
Grade 9
Grade 10
Grade 11
Grade 12
Career Matchmaker 21.4% 61.5% 70.1% 68.1% 63.5% 59.6% 61.3% My Skills 20.7% 33.5% Learning Styles Inventory 15.8% 28.2% 17.5% My Saved Careers 13.6% 42.9% 41.4% 39.5% 32.6% 30.4% 23.2% Career Selector 6.7% 7.7% My Saved Schools 8.3% 14.2% 5.6% School Selector 6.7% Financial Aid Selector 7.1% My Saved Clusters 9.0% 22.2% 26.8% 24.9% Career Planning Activities 5.4% 10.0% 13.2% Career and Life Goals 13.8% 19.1% 16.2% 15.6% 21.2% Hobbies & Interests 5.3% 24.9% 34.7% 36.4% 35.8% 31.9% 27.3% Extracurricular Activities 4.7% 23.3% 32.9% 33.9% 35.8% 32.4% 27.6% Skills and Abilities 20.7% 32.7% 33.5% 30.1% 26.3% My Journal 6.6% 23.6% 22.7% 20.2% 17.8% Schools with Career Cruising Records 618 608 620 505 501 506 508
Note: Percentages only reported for activities recommended in each grade. Source: Career Cruising
Students choose CTE and academic courses applicable to their ACP/career goals. Staff and leadership at the majority of the case study schools report that students are tending to put more thought into course selection, and tending to align their choices more with their academic and career goals. For example, one teacher reported, “Students feel like they have more of a guideline of which direction to go in. They’re not just taking what their friends are taking. They have more of an understanding about what courses are required for what sorts of outcomes.” Students at one high school specifically referred to software tools to help inform their course selection process:
Student A: Because if you know what you’re interested in, you can go on Career Locker, and then if you look up the career you’re interested in, you can click on it, and it’ll tell you what high school classes to take to get ready.
Student B: But some high school classes aren’t available here.
Student A: It’s still helpful if you know what you want to do, but if you don’t know, you’re kind of screwed.

48
Subsequently, more time and effort is devoted to the course selection process in these high schools than it had been in the past. As one counselor noted, “we are spending more time on course selection now, and homeroom teachers do more talking to them about courses.”
Similar to most of the case study schools, most respondents to the school-level survey also thought the students at their school chose CTE and academic courses applicable to their academic and career goals. Figure 40 shows the results from an item on the survey that asked about this ACP element. As seen in this figure, 80 percent of respondents indicated that they institutionalized or implemented the practice of supporting students to choose CTE and academic courses applicable to their goals.
Figure 40: Implementation of Supporting Students to Choose CTE and Academic Courses Applicable to ACP/Career Goals, 2018-19
Source: Academic and Career Planning 2018-19 Evaluation Survey Results
ACP Final Projects. This section reports on a variety of activities known collectively as ACP Final Projects, as described by participants in the ten case study districts. These districts were selected as case study sites specifically because they had been identified as implementing a final project connected to ACP work. While the parameters for final projects vary between schools but can generally be categorized as either a presentation or an exit interview, the rationale for and benefits of these projects tend to be similar. They tend to be perceived as aligning with the following:
• Recognition: Allowing students to showcase their work/school experiences and plans. • Experience: Providing the opportunity for students to gain interview and/or presentation
experience. • Accountability: A means to compel students to take ACP (and future planning) more seriously. • Relationship Building: Providing opportunities for and capitalizing on relationships between
students, schools, teachers, families, community members, and employers.
27% 53% 17% 3%
0% 10% 20% 30% 40% 50% 60% 70% 80% 90% 100%
Career & Tech. Ed. And academic courses applicable toACP goals
Institutionalized Implemented Initiated Not yet started

49
In this section we catalogue and describe the different varieties of final projects implemented by the case study districts. We detail stakeholder perceptions about these final projects in the section reporting findings related to Evaluation Question #3.
Most final projects take place toward the end of the school year, sometimes during the school day and sometimes in the evening. Many include a student portfolio, which is typically based on students’ ACP work over time. Schools typically create a checklist of required or recommended components to be included in the portfolio, with some sort of teacher review process before the date of the final interview or presentation. Interviews typically involve the review of students’ portfolios by interviewers, whether prior to or during the actual interview. Audiences for presentations may range from small groups of peers, teachers, family, and/or community members to large groups of these same participants. There are a variety of processes for determining interviewers and/or audience members; in some cases they are invited by, selected, or scheduled by the students, in other cases they are assigned or chosen randomly. Providing students with feedback is typically a component of final projects, which are sometimes required for graduation, and may or may not be graded. Students in other grades may be involved as audience members, or may be participating in other grade-level activities, often connected to ACP. The key components of each case study district’s final project are shown in Table 16.

50
Table 16: Key Components of Case Study Districts’ ACP Final Projects
School Final Project Name/Type
Grade Level
Required for graduation?
When activity occurs Length
Who else participates?
Students in other grades involved? Goals/purpose
Where/when students prepare
How many years in place?
Site 1 “Senior Exposition”
presentation using portfolio
12 Yes Early April, during regular
school day
Can last up to 30 minutes
3 evaluators per presentation (community
members, local professionals)
Students practice presenting to
underclass during “resource”
(homeroom) periods
Handbook: “The purpose of the
Senior Exposition is for each student to present a collection
of materials that reflects their
academic progress, personal
development, future aspirations and
dreams.”
Goal-setting discussed during resource period throughout HS.
Contents of portfolio are built
through HS
Many, “long before ACP”
Site 2 Senior presentation
12 Yes Early May, during
school day
20-minute blocks
Administrator, counselor, and a
teacher whom the student needs to
contact to schedule in order
to practice appointment making skills
Students in grades 6-11 do smaller
end-of-year presentations for
their classmates in homeroom
Self-reflection and analysis of life goals,
showcase HS achievements,
future plans and where to find
resources to help meet goals,
accountability
Builds from MS through HS,
during weekly half-hour ACP
instruction
ACP-like activities for
several years, began senior
presentations 2 years ago
Site 3 Portfolio presentation
12 Yes Spring, after
school – 3:30 – 6:30
pm
15 minutes per student
Teachers, community
members, school board members,
parents
Seniors required to practice
presentations twice before the final presentations,
either in their mixed grade homerooms
or in front of a teacher. Food
science students prepare food for the
evening
Presentation practice, showcase HS achievements
and share their plans and goals.
Developing connections with
community members in related
career areas.
Many activities built into English classes (career
research report, interviews,
resumes) and most other
activities completed in advisory time
when dedicated to ACP
2

51
Site 4 Exit interview with portfolio
12 Yes Spring, daylong, during
school day, part of
Careers in Action Day,
Interviews in half-hour
increments throughout
the day; otherwise seniors are
participating in Real Life Academy
Community members (as interviewers),
approximately 40 at stations with 2 interviewers each
No. 9th and 10th graders taking ACT Aspire exam, 11th graders doing job
visits in the community
Interview experience,
showcase HS work, make community
connections, accountability
Portfolios created, interviewing
practiced in senior “Discovering Your
Career” course during 1st
semester. ACP work done in
monthly homerooms
15
Site 5 Choice Careers career
exploration poster
presentation
8 NA Late May, during the school day, 2:30-3:30
pm
1 hour 7th graders also display posters about personal
interests (Passion Project), HS
students attend, families,
community members, several judges (principal,
some staff and visitors) complete
rubrics for feedback and
nominate 1 7th and 1 8th grader
for “Best of Show.”
Yes, as an audience Demonstrate research on careers
of interest, showcase interests, practice presenting,
accountability
Research and presentation
boards completed in computers/ACP
class, bibliographies completed in
English Language Arts
Passion Project has been in
place for several years, but the switch
to Choice Careers
occurred in 2017-18.
Site 6 Exit interview using portfolio
12 Yes Late spring, entire
morning during a
school day
20 minutes per student
Interviews are conducted by a
community member and a
district staff person
No Interview experience,
showcase HS achievements,
discuss future plans, get feedback from
community members and teachers, build
relationships with community,
accountability
Dedicated time in homeroom
2018-19 is first full year, small
scale pilot I 2017-18,
conducted interviews for
December graduates during 1st semester

52
Site 7 Senior Exit Presentation
12 No Late spring at the
beginning of the
regular school day in advisory
period
Approximately 5 minutes
Advisory teacher and class (9-12
graders) plus 8th graders/rising
freshmen
Yes, students remain in the same advisory group from
9th-12th grade and comprise the
audience for the presentations
Showcase HS achievements,
reflection, report future goals, give advice to younger
students
During advisory periods
Unclear, but was in place
before district ACP plan was
developed
Site 8 Exit interview with portfolio
12 Yes Late spring,
during the school day
30 minute intervals,
interviews last 10-15
minutes, students exit
while interviewers
discuss feedback, students return to receive
feedback
Volunteer community members
(business leaders, school board
members, superintendent, retired teachers)
No Interview experience,
showcase HS achievements,
discuss their future plans, receive feedback from
community members,
accountability
ACP work in sophomore
Careers Class, throughout HS in
other courses, and have 2
dedicated days to prepare portfolio during senior year
20+
Site 9 Portfolio presentation
12 Yes Early May, during the school day
15 minute presentations
2-3 participants: teachers,
superintendent /principal
Not in the presentations, but portfolios are built over several years
Presentation experience,
showcase HS achievements, future plans,
accountability
Work on ACP during Flex time, a 35-minute general resource period.
Senior Seminar in 1st semester
includes cover letters and
resumes
4
Site 10 Senior portfolio
presentation
12 Yes Late May, 1-3:30 pm
on a school day, hour-
hour increments
in classrooms around the
school
Each presentation
about 20 minutes
followed by questions and
answers
Community members, staff,
other students in the audience, family and any other guests
invited by students
As audience, select seniors give
presentations in the audience for large groups of other HS
grade levels
Showcase HS achievements,
present their post-HS plan, reflect on
experiences, presentation
experience, offer advice to younger
students, accountability
Portfolio created throughout senior
year in homeroom, speech and
slideshow are created in speech
class.
9-10 years

53
Notable is the number of years that these case study districts have been implementing their final project activities, or some version of them as they evolve over time. Those with a long history of final projects tended to mention the revisions they’ve made over time, and the evaluation processes they put in place to refine and update these activities. Those schools that have more recently adopted final projects often mentioned other school districts upon whom they modeled their work, the evaluative processes they use to refine their projects, and the idea that it takes time to develop these activities. In other words, final projects are unlikely to function flawlessly in the first year(s) of implementation, but with a continuous improvement process in place, they can evolve to be a Powerful Practice that helps to address a number of important goals of ACP work.
All but one of the final projects documented involved high school seniors. Site 8, however, has developed a final project for eighth graders. This, to our knowledge, is the only example of a capstone project at the middle school level, and it addresses challenges identified in earlier evaluation phases, particularly the struggle to get students in middle grades to take seriously the career exploration activities, interest inventories, and other ACP-related activities typical for that age group. The eighth grade Choice Careers project is part of a combined seventh- and eighth-grade activity called the “Passion Project.” Held for one hour during the afternoon on a school day, eighth graders present findings of career exploration on trifold presentation boards to other students, teachers, families, community members, and several “judges” who provide feedback using a rubric. Students select three of the top ten careers that they were matched with when completing the Career Cruising Matchmaker activity, or two matched careers and an additional career of interest, and create poster presentations that indicate typical job responsibilities, pay ranges, education and training needed, information about several post-secondary institutions that provide the needed training, and more. Set up in a large commons area, observers are free to ask questions of the students about their boards, and students, who have prepared and practiced responses to common questions, talk about their findings. Judges nominate presenters for a “Best of Show” award. The work to prepare the boards is completed in the required computers class, which is taught by the school’s ACP coordinator, as well as in English Language Arts, where the bibliographies for their research are prepared. The rationale for this activity was similar to that of the high school-level activities observed during the case studies, but was particularly geared toward the element of accountability, as well as setting expectations for further ACP work in high school and contributing to the strong culture of ACP that this district prioritizes. The students observed (approximately 95) and the subset who were informally interviewed appeared to take the activity seriously, and were well informed and articulate when speaking about aspects of careers that they had researched. To evidence this claim, in the next section, we report stakeholder feedback about this particular activity, as well as the other final projects, and ACP infrastructure and activities more generally.
Stakeholder Perceptions In this section of the findings, intended to answer Evaluation Question #3, we report various stakeholder perceptions and opinions about the value, utility, practicality, and other qualities of the infrastructural elements and student activities, including final projects.

54
Infrastructural elements. An inclusive schoolwide culture with administrative engagement, prioritized goals, staff participation and which is student-focused. This set of case study schools tended to report a strong culture of ACP with all or many of the aspects that characterize this infrastructural element perceived to be in place. Given that these are all schools that have elected to include a capstone, final ACP project, which necessarily involves widespread involvement, administrative engagement, and a student focus, this trend towards high implementation makes sense. Some stakeholders, however, particularly in the schools that have more recently added a capstone element, note that buy-in and full engagement are evolving. They tend to report that buy-in and engagement is strongest among younger students (and their teachers) who have participated in ACP since sixth grade, and rolls up a grade level each new school year as older students graduate. School leaders seem to be aware of this potential for gradual change when they choose to institute a final project element, or view the acceptance of ACP in general. As one principal reported:
“Well, I think we have [a school-wide ACP culture] in the lower grade levels in the building, but we don’t have it in the highest grades, as we haven’t yet found the way to have it have a lot of value from the perspective of the 11th and 12th graders. I’m hoping that change will come as the students who are involved in it now in eighth and ninth grade move to the upper levels.”
The teachers in a focus group in one school reported that they believed they have a school-wide culture brought about because they were doing advisory periods before ACP was introduced, which had met less frequently and focused primarily on course selection and scheduling. Eight years ago, advisories began meeting daily, and the gradual roll-up towards ACP and Career Cruising “made buy-in easy, and teachers could see successes from each new addition.” School personnel also noted that “it takes a team” to attain a culture shift. As one counselor in a school reporting a strong ACP culture noted, “ACP is not the counselors—it's the team, the teachers, the community working together. The teachers are helping to make the connections. We work together.” Personnel from this school also noted that to have a strong culture, “we have taken it to mean that we need to be more knowledgeable about what resources are in the community, job shadow opportunities, etc.”
Communications around the holistic nature of ACP continue to be cited as a necessary concern. As one administrator reported:
“I’ve realized that we as a district don't use the term ‘ACP.’ So students might say ‘Career Cruising’ or ‘the activities we do in Advising.’ It might help parents and students see that the (final interview) is one portion of the whole thing, and meeting with your advisor is one portion, and maybe help them understand the purpose overall. That's something I’m thinking of for next year, keep (the term) ‘ACP’ and career verbiage, keep that.”
Regular and ongoing informing of and engaging families in their students’ ACP. Family engagement continues to be a challenge in some districts, as has been noted in past evaluation reports. As one teacher reported:
“The kids all get inundated at school but the parents don’t really know what this is. And without that parent’s connection to the process, that’s a disconnect.”

55
The parents interviewed informally at a number of schools during final project events were all impressed with the work, and generally very informed about ACP, but this select group of parents attending events at typically high-implementation schools cannot be said to be representative of the greater family population.
Regular and ongoing supportive and safe student relationships with adults. Perceptions of strengthened, ongoing supportive and safe student-adult relationships were most frequently reported in those high schools that had regular homerooms/advisory periods with students assigned to the same teacher/group for all four years. Typically, this continuity was seen as enabling important conversations that helped teachers get to know students better and, over time, engendered trust. As one assistant principal reported:
“For us, [advisory] has been that catalyst to have that conversation, we expect [teachers] to at least connect with students on ACP and academics once every three weeks. We see a lot of that connection out in the hallways. We’ll do our rounds in the morning, during advising time, and see teachers doing that. Sometimes out in the hall, private conversations.”
Similarly, a teacher from another school reported:
“[Four-year advisory pairings] help me to get to know them a little more, their likes and dislikes. It helps me to problem solve for them.”
Yet another teacher provided an example of getting to know students better and engaging in more meaningful conversations:
“I had a student who said he wanted to be a custodian and I was like ‘Custodian--what?’ and he said, ‘no, that’s something not on my Top 10 list, it’s something that I picked.’ And I asked why, and he said, ‘Do you see all the work they do? They get to be outside, they get to go to the football field, they get to help out the teachers, and they get paid to do all that. They start at like $35 or $40K.’ So I was like, ‘ok, yeah!’ but I wasn’t sure why he had picked that until I talked to him.”
These practices appear to strengthen relationships outside of homeroom and help to incorporate meaningful conversations in other classrooms as well. As a math teacher reported:
“In some ways we’ve gotten to know our students better. One of the things we did with ACP is that, my group I had last year in my [homeroom] is the same group I had this year. I’ve also taught them [math] last year and this year. But now we’re talking more during our ACP time about the careers they may be considering, what they thought about the [guest] speaker, so I feel like I'm getting to know them in some ways in a different way. Because we’re talking about things beyond math in the classroom.”
Non-judgmental, informed, comprehensive education and career advising.
In these case studies, education and career advising was discussed mostly in terms of teachers providing advising in homerooms or advisory periods. As one teacher reported, “Our advising is the best thing we do here, the thing I’m proudest of. I think we have phenomenal advisors, some have a way to grow, but overall pretty darn good.” Teachers in another school reported that they were using the Advisement Log on Career Cruising, which was part of a “new accountability approach.” What was less clear from these

56
interviews was how teachers gained the skills and knowledge to take on advisory roles. When asked whether they had sufficient professional development to support their roles in the ACP process, most teachers believed that they did, typically because they had been trained in the use of Career Cruising. However, a teacher in one school described a more robust approach:
“[Our PD] was planned by the school counselor. The PD for teachers included business tours—a request came from the teachers—we did a PD day for all of the teachers in the district, in groups, we toured different local businesses and then we had a forum at the school where we had some of the business leaders talk, share information, ask questions, what are they looking for in employees. Teachers asked questions, teachers learned a lot. We want to do it again next year, go to different businesses. The employers liked it too, they got a lot of valuable information and they want to grow the connection.”
Another teacher from the same school added:
"On the PD day, we had a panel of employers. The teachers asked questions about soft skills and entrance exams. After the day we reflected and wanted students to hear that information as well—it was very helpful, to hear from employers what kind of things concern them, what kinds of questions they have.”
This practice of engagement with the business community would likely allow teachers to better understand local opportunities and employers’ needs but is not likely to be a widespread practice across the state. Perhaps more importantly, while valuable, this form of professional development couldn’t be expected to address the many skills and areas of knowledge that informed advising requires. Consequently, further research into professional development opportunities that support teachers to function in an advisory role is likely warranted, and recommended to be a focus for future evaluation work.
Equitable access to all ACP opportunities. As in the past, stakeholders were asked who ACP “was for” and “who didn’t do ACP” in order to get at the extent of inclusion in ACP generally. As before, schools reported that all students participate in ACP. Some would qualify that certain students with IEPs would participate with accommodations, both for ACP learning generally, and in terms of final projects. Accommodations often included an adjustment to the presentation procedure, or adapting the portfolio checklist to information and goals in line with students’ transition plans. One special education teacher reported,
“Some [of my students] were choosing careers with really low standards, thinking they couldn't do certain careers because they weren’t smart enough. But with research they realized there are a lot of things they can do.”
All agreed that ACP was “for students” and when probed, would sometimes report that a particular school’s program tended to focus on attendance at four-year universities, or technical fields, or one general type of pathway over others. Some interviewees also tended to report that ACP tended to most benefit certain groups of students, typically, as one teacher termed it, “ACP most helps students whose parents don’t talk to them about this kind of stuff.” When asked specifically about equitable access, respondents tended to talk about providing the same activities or lessons to all students. For example, a school counselor reported,

57
“I think it should help all, but it depends once again on where you're setting the bar. The expectation that everyone has a resume before graduation leads to very good discussions with all students. Why do I need a resume? Who will be my reference? This is a life skill that they should have before they leave our doors. That one slice I think is a valuable piece for everybody."
However, as mentioned above, providing equitable access to all ACP opportunities goes much deeper than delivering ACP curriculum to all students. Systemic bias and pre-existing barriers to full participation are just two concerns that need to be addressed, but strategies for doing so may be much more difficult to identify, develop, and implement. Gaps in participation rates, shown in findings for the previous evaluation questions, and gaps in outcomes evidenced in the final evaluation question section demonstrate the need for attention to be paid to these questions. Further inquiry to better understand these gaps and possible strategies to address them is not only warranted, but planned for the coming evaluation years.
Regular, ongoing and dedicated time for ACP activities. With regular, dedicated ACP time being the norm for the case study schools, the activities such as final projects were able to be well implemented. Regular meetings allowed for ongoing project work, ample work time, and also lent a sense of importance to the curriculum that some reported didn’t occur when ACP was positioned as an “add-on” in other time periods. Multi-age groupings with the same teacher year after year were implemented in many of the case study districts, with teachers, students and administrators citing a number of benefits, including the continuity of instruction, the ability to develop more in-depth, meaningful, and long-term, trusting advisory relationships, not only between students and teachers, but among the students themselves. One high school repeatedly referred to these groupings as “advising families” and reported that students developed very protective feelings about them:
Teacher 1: The last two years my current advisees have been really concerned about who will be coming into the group. Like, is there going to be a kid that disrupts the flow of this group?
Interviewer: So they're protective?
Teacher 1: Yes, very much so.
Teacher 2: Or someone who's been there for a couple of years who's not doing what they're supposed to do, they take offense to it. It bothers them if someone is being silly or tuned out.
Interviewer: Does it feel different than regular classes?
All Teachers: Oh absolutely! Yeah (all agree).
Interviewer: How so?
Teacher 2: Like a homeroom, a little family, not that everything’s always perfect but they support each other, and feel like it’s a place they get support. And if they know someone in the group is having a tough time, sometimes someone will suggest, “I think we should get a card for so-and-so.
58
Teacher 3: I think it’s a positive for kids personally. I think we want to do the best thing for all kids. I can think of examples of seniors and how they were as freshmen, they now have a better understanding of getting their work in. I can think of examples of growth, I can imagine what might have happened without personal intervention.
Teacher 2: My eighth graders [rising ninth graders who joined their future advisory groups that day], I told them today, they’re not necessarily friend groups outside of advising, but they support and help each other within advising. As a teacher, you’d think I’d be the best source of info about scheduling, but actually some of my upperclassmen do a really good job with scheduling even.
Teacher 4: My kids are the best. They’re supportive. With grades, they’re also supportive. They advise each other. They’ve got kind of a sibling role, not necessarily friends.
Stakeholders in a number of districts also talked about the role of accountability for ACP that providing credit or grades for these periods can bring. A number of schools are experimenting with providing a quarter credit, pass/fail grades, and other measures for lending legitimacy to the activities at the high school level. Some have required courses such as financial literacy, Senior Seminar, or Discovering Your Career that deliver ACP curriculum that complements what is delivered in homeroom/advisory. As mentioned, this middle school has transferred much of their middle school ACP curriculum into the required seventh- and eighth-grade computers classes to allow it to be part of a graded course.
Programs of study identified by district. Given the focus on final projects this year, teachers, students, and parents in the case study schools did not directly address Programs of Study during interviews or focus group discussions. In one school, however, a teacher described a career tech ed program that appeared to align with Programs of Study requirements, yet which she viewed as somewhat apart from ACP work:
“We have kids who are out in our welding program earning college credits in welding, they’re getting hired right out of high school, they didn’t have to go to the tech school because there’s such a strong program. Not only are you learning life skills, you’re earning credits while you’re doing it. Even though it’s not something that’s housed under our ACP block, it just totally ties into it.”
With the changes associated with the reauthorization of the Carl D. Perkins Act (Perkins V), it may be necessary to redefine how this element of infrastructure is defined and addressed within the ongoing statewide ACP evaluation.
Student activity components Student participation in work-based learning activities. Work-based learning activities continue to grow in prevalence, with stakeholders reporting their value. As before, job shadowing was repeatedly mentioned as particularly valuable for career exploration, as it provided considerable information about a career path with a relatively small time investment. Students most frequently identified job shadows as the most beneficial ACP-related activity, along with final projects. However, in the case study school that required 5 job shadows throughout the high school years, several students and teachers reported that 5 was too many. In addition, students in a focus group there reported that because job shadows had to be set up by the students, students could “fall in

59
the gap of doing whatever based on who they already knew,” suggesting that in some cases, job shadows were being undertaken more for compliance than for career exploration. Moreover, this finding indicates another example of potential opportunity and participation gaps among students with fewer family connections to employers or networking potential.
In their final projects, students reported many types of work-based learning activities, from co-ops and internships to job shadows and afterschool jobs. Sometimes teachers were surprised to learn that students had participated in these activities, perhaps indicating a lack of overall coordination around students’ ACPs. As one teacher reported:
“Directly under our umbrella of ACP, I’ve been to [hear employer guest] speakers where they’ve talked about, ‘oh, and we have this person already working for us, and this person. They’ve come to us through the school work program and now they’re planning on staying on.’ I didn’t even realize they had hired some of our students, or that they had worked through the school-to-work and now are planning on making this a career.”
In one of the most remote rural districts, teachers wished for more “hands-on” activities for students, and suggested that perhaps some could be done virtually.
The new collection of Career Education Program data in Roster, including work-based learning data, beginning with the 2018-19 school year will hopefully result in more documentation and awareness of these types of activities.
Students taking dual credit, AP, IB and college level industry certification courses. Case study participants also mentioned the value of dual credit, AP, and industry certification courses, which were also frequently catalogued in final presentations. Given that many of the focus groups sites were in smaller rural or more remote districts, taking advantage of online offerings was a common strategy. In a focus group, one assistant principal reported having “a good share of students who look for online opportunities or other ways to look for certifications or other things.” A counselor from the same school added, “Yes, we’ve had students doing other AP classes that we don’t offer here, through online course vendors.” In another school, a teacher reported,
“Now, it’s not uncommon for kids to graduate with 15 college credits. Easily. They can earn 10 in math, they can earn 6 in English, and that’s not including all of the other options we have here. So kids are walking away with a lot of credits, which are really helping them in the long run. And I think that just helps with whichever way they go. If they go into the military, then they have credits toward a degree, which can help them become an officer. If they go to tech school, sometimes they skip a couple semesters or all those core classes and go right into their area. And when they go to the UW, it’s the same thing, you’re walking out with a semester’s worth of classes.”
With the increase in enrollment in these types of courses, the investigation of access and opportunity gaps will be important to undertake in order to understand how dual credit and similar options impact questions of equity.

60
Students utilize knowledge and skills gained through ACP activity participation to set, modify, and update personal, education and career goals. When asked whether and how ACP-related knowledge and skills are used to set or modify student goals, teachers tended to report that students had more information on which to base decisions, and were more aware of options and the steps needed to attain goals. For example, one teacher reported that students were now “more prepared, more able to make decisions.” An administrator reported that ACP “is getting our students more focused on their future goals and steps they can take in high school to meet them.” When asked how he knew that, the administrator replied:
“A lot of kids have discussions. I want to do this work-based learning because fill in the blank with career options. They don’t just want to work at McDonald’s for the sake of having a job. It’s more about preparation for a career.”
Whether students have a career path identified or not, the perception among some teachers is that ACP helps students understand that there are steps that need to be taken to arrive at any sort of career goal. As once science teacher explained, “They have a clearer idea of what it takes to do things, even if they don’t know what they themselves want to do.”
Students choose CTE and academic courses applicable to their ACP/career goals. Most school personnel, when asked about course selection activities, reported that ACP is continuing to increase the knowledge students have about the preparation necessary for careers of interest, and are consequently being ever more strategic and mindful about course selection. For example, one principal reported,
“The students feel like they have more of a guideline of which direction to go in. They're not just taking what their friends are taking. They have more of an understanding about what courses are required for what sorts of outcomes.”
Similarly, a counselor reported,
“From my seat, their reasons for choosing courses are much more informed, reasoned, pointed toward their future plans. It’s not just ‘which one’s easy or fun?’ Now it’s ‘if I take this class, I could get credit at the tech college, etc.’ I definitely think they’re more diligent.”
Strengthening the system for course selection and advising appears to a valuable practice. One teacher reported that in her school, they were “spending more time on course selection now, with homeroom teachers talking to them more about courses.” In another school, a teacher reported,
“I think we try to get students to identify career interests earlier to build a schedule and a four-year plan, even as freshmen, we try to get them to map out a plan. For instance, you might want to take more social studies electives earlier, so you can get into AP courses. I think kids are planning their four years, not haphazardly selecting.”
Another teacher in the same focus group added,
“And I think kids are more aware of college requirements—the expectations of universities. I had a lot of kids who are taking algebra and geometry and double up on math in sophomore year so they can take pre-calc and calc, because they are going into a science field. It comes from other kids talking to them, or us talking to them. And we are always revisiting what you

61
want to be. Do you want to be a nurse, you have to take science classes. Or you might want to start on CNA.”
Exploration activities are reported to impact student course selection. As one counselor reported, “They try classes they might not have tried otherwise. If we didn’t do some of the exploration activities, they may not have taken those classes.”
Students, when asked, tended to express that they often selected courses in line with career interests. One student reported that the “education plan made me think the most—thinking about the big picture and taking classes that are relevant.” When asked whether anyone made any specific shifts in course selection due to career interests, one student in a focus group reported, “I did this year. I took more biology related classes.” When asked whether that was a result of thinking about what they wanted to do long-term, this student replied, “When I was thinking about genetics, I took anatomy and a couple more specific higher-level science courses than I would have normally.”
However, in another context, a woodworking teacher reported that ACP did not impact course selection, saying, “I wish it had. Our original plan was that they should but unfortunately, most kids choose based on having friends who take that course.” However, a science teacher in the same school reported that “Students who figure out what they want to do can take courses that help them with their future—dual credit, AP. But others take random classes.” This discrepancy in perceptions within the same school is not surprising, as there will undoubtedly be considerable variation between students, areas of interest, and context.
Final projects Specific to this year’s focal activity, final projects, many successes and positives were reported, as well as some challenges and drawbacks.
The benefits that tended to be reported varied by stakeholder group. Students tended to report valuing the interview process and experience, as well as getting feedback, particularly from community members or others besides their teachers. Administrators liked seeing the “finished product” of their school system, i.e., graduating seniors, and what they had learned and accomplished. Teachers tended to value the reflective element, and hearing what students derived from their high school educations, particularly those students who tended to be less visible in school. As one teacher reported,
“Sometimes it is a little more interesting to hear what the ‘not better’ students are doing. We know the 4.0 students know what they’re going to do, they have a big plan. Students who are going to go to tech college or enter the workforce right away, what they think of this, what they’ve gotten out of school.”
All types of school staff mentioned the importance of accountability, that is, a means for having students take the ACP process more seriously.
Community members tended to appreciate the opportunity to learn more about what was happening in their local schools, and those who served as interviewers reported appreciating the involvement in the process. As one interviewer explained,
“It makes us feel like we’re involved in the school, offer support, take kids’ plans seriously. To give back to the community or school. To support the kids. Board members should do it to get

62
into schools so they know what they’re talking about and voting on, and can SEE the issues that they discuss.”
One finding that appears to stand out is not only how consistently enthusiastic and supportive the community member audience or interviewers were, but how much the students appreciated the presence of these stakeholders. Generally speaking, those final projects that included external audiences tended to be more positively viewed by the participating students.
Other benefits listed by stakeholders included networking with local businesses and financial literacy, when those were part of the curriculum or project.
Feedback and perceptions about the eighth-grade final project was mostly similar to that pertaining to seniors’ final activities, with a few age-relevant additions mentioned. The eighth-grade counselor talked about the students having some “ownership about their careers” and that they learned important concepts and vocabulary such as “bachelor's degree and associate's degree.” Taking career exploration, and then resulting classes more seriously was a very strong theme among teachers and leaders in this school. As one teacher reported, their belief was that students taking the final project more seriously “will result in better work at the high school level, if they’re held accountable for what they put into Career Cruising.” Showcasing student interests was a repeated theme, as was a student focus.
Challenges and drawbacks for final projects were relatively few, but tended to relate to the amount of paperwork or “busywork” associated with creating portfolios, or insufficient time for preparation. The bulk of these criticisms came from students in schools that were relatively new to the process, and given that all these schools had evaluative components connected to the activity, they may well be expected to improve over time. Similarly, the rare complaints of teacher pushback on the process were reported to have mitigated over time. Students in schools that presented only to teachers often wished there were external audiences involved. One student expressed the wish that school board members would be present. Although students often talked about being nervous before interviews or presentations, afterwards, they tended to report that it was “worth it” and that they needn’t have been nervous, as interviewers and audience members were supportive, kind, engaged, and positive.
Additional feedback about ACP Many of the stakeholders interviewed, whether formally or informally, were asked questions about the successes and challenges of ACP more generally, and how it may have changed their school. Common themes identified in the responses to those questions are reported below:
ACP successes Specific practices or activities that were repeatedly mentioned as “the best thing about ACP” were the final project, mock interviews, and career exploration. Both teachers and students related stories about students becoming aware of more career possibilities. For example, one teacher reported,
“The payoff is when you have a kid say, ‘well, I never thought about that.’ I’ve heard a couple of them come back and say, ‘I never thought about nursing. I didn’t know I could do that.’”
A student similarly reported,

63
“Knowing what your options are. There were jobs that I am super interested in but I didn’t even know were a thing. Like, super interested in genetic counseling as a job – I think it’s very cool, but I had no idea it was a thing until it came up on my Career Cruising.”
Another student, when asked whether ACP helped them decide on a college or career choice, responded, “Yes. With research, everything fell into place.”
Finally, a principal expressed the belief that not only students, but community and society benefited from the ACP process. He reported,
“There are so many careers they don’t know are out there, doing [ACP] really opens it up. We’re a tourist community, many grow up and leave this area, or don’t leave the area but their choices are limited. So the students benefit the most, but it also benefits our community and society benefits. The better they’re prepared, it benefits our economy. If they have jobs, it benefits everyone. If they get into a career that they’re passionate about and not just what fell in their laps, they’ll be more productive members of society and that benefits everyone—society, the economy, crimes rates, lots of things.”
ACP challenges Challenges listed were not unlike those listed in years past, but at least based on the case study sample this year, do not seem to be as prevalent. Gaining teacher buy-in and family engagement in the early phases of ACP implementation was noted. Students occasionally requested “more instruction,” “more time to do ACP work,” or more incorporation of the curriculum into “classes that correlate.” Although this year’s sample of case studies was biased towards schools with generally longer histories of doing ACP-related practices, and specifically the final projects, it is notable that they demonstrate that the common objections to ACP tend to be overcome with time.
How ACP has changed schools When staff and leaders were asked whether and how their ACP programming had changed their schools, answers tended to point to the degree to which students think about, understand, and take career exploration and planning seriously. For example, one principal of a combined middle and high school noted that he sees a “huge difference” between those students who have been doing ACP for four years as they roll up implementation, and those older students who have not had as much exposure. He characterized the difference in terms of “taking their futures and their careers seriously.” The ACP coordinator in the same school talked about a shift in “mindset.” He described that as,
“It’s not about making kids choose a career that they’re going to do, but helps them realize that they have skills, that they all have things that they’re good at, or start thinking about things that they’re good at. That mindset is one change in the school.”
He further noted that having ACP become ingrained in the school culture is a positive change:
“The expectation that we’re going to do ACP things in the school, that’s become more of a regular thing. It’s not like kids say, ‘ACP, well, what is that?’ It’s part of what we do. So I think that’s been a positive change.”
Similarly, a teacher in a different school talked about a climate change in terms of advising:

64
“ACP has made a difference on the individual school level—to have that connection with the advisor. A lot of advisees see their advisor as a surrogate parent while they’re at school, rightfully or wrongfully.”
A business teacher in a combined middle and high school reported that next year, they will “begin offering a ‘Business Concepts’ course to seventh and eighth graders. It’s been on the books for a long time, but we haven’t had sufficient enrollment to run it for years. There are 22 kids enrolled in it for next year—a huge jump.” If similar trends are seen elsewhere, schools may wish to devote effort to reviewing their elective course offerings to make sure they are up-to-date and aligned to students’ interests and needs.
In another high school, a staff focus group provided a variety of examples of change to their school:
Principal: “[The final projects] provided a great link to the community…a great connection piece. They understand what is going on in the high school and the students learn about the community.”
Counselor: “Since we started [ACP], it’s more in conversations in the classrooms than it was before. The English Department has taken Career Cruising under their wings, they do the resumes and cover letters and help push job shadowing.”
Math teacher: “Students are more aware that they need to make a career choice a little bit earlier, bringing it to the forefront a little bit.”
English teacher: “From the English perspective, back in 2016 I had about half my juniors come in with a resume and some idea of what they might want to think about. Last year, maybe 75 percent came in to class with resumes as we got a little more into Career Cruising. This year, I was very impressed, because all of the students came in with some sort of resume. The students are more prepared, they ask more questions about which classes to take, their options for senior year, and I’ve had sophomores come up to me and ask about college credit options—the independent study perspective, projects tailored to their career interests. And they ask in junior year ‘Can I start making this into a bigger project that I can connect to other classes, related to my senior artifacts?’ They’re reading about career interests, asking when can they start doing job shadowing. It’s a trickle-down process. More students are prepared every year. A lot of students are coming in and saying ‘I already know what I want to do.’ That’s awesome, we are doing our job!”
Additional needs When asked “what else is needed for your ACP program?”, some school personnel responded by indicating plans for activities they would be adding to their program, such as mock interviews, or debating whether the final project should be graded and/or become a graduation requirement. Other interviewees indicated further support that would be useful, such as more Career Cruising training, particularly on advising logs, and more support with Inspire.
Most beneficial ACP activity When asked to name the most beneficial ACP-related activity, answers were quite varied. Administrators listed mock interviews, resume building, reflection, business tours, and the final project. Teachers named the final project and reflection most frequently, but also job shadows and the

65
availability of choices and multiple paths in career exploration. Students most frequently named job shadows and Career Cruising activities, followed by final projects, guest speakers, mock interviews, resume building, reflection, and goal setting.
ACP Outcomes This section of the findings examines Evaluation Question #4 (What, if any, changes have occurred in terms of student outcome data compared to baseline data?) and Evaluation Question #5 (What, if any, associations between ACP elements and outcomes can be measured at school or student levels?). To answer these questions, this report provides results overall, by student subgroup populations, and by levels of ACP implementation. The five short- and medium-term outcomes examined this year include attendance rate, out-of-school suspension rate (percentage of students with at least one out-of-school suspension), ACT composite score, four-year high school completion rate, and AP Exam scores. For each of these outcomes, this report includes a figure of the estimated change (or impact) associated with ACP in 2017-18 (the first year of statewide implementation) compared to previous baseline data from 2014-15 through 2016-17. Each of the graphic figures that follow in this section includes a small circle which indicates the estimated impact of ACP on the relevant outcome overall, for each student subgroup, for the location of the school, and for four measures of ACP implementation. Open circles indicate estimated impacts not statistically significant from zero and solid circles indicate estimated impacts statistically significant from zero. Since results are estimated with some level of error, the figures also include bars extending from each dot which indicate the 95 percent confidence interval.
The four measures of ACP implementation include ACP infrastructural element implementation (Infrastructure); equitable access to all ACP opportunities (Equitable); regular, ongoing, and dedicated time for ACP activities (Dedicated ACP); and ACP student activity component implementation (Student Activities). These measures of implementation came from the 2017-18 implementation year survey of building leaders. Impacts presented throughout this section on these four measures show the estimated change in outcome for each level of increase in level of implementation (not yet started, initiated, implemented, and institutionalized). The inclusion of these metrics specifically examines Evaluation Question #5.
As a point of reference for the following outcome impacts, Table 17 provides the statewide average for each outcome for the baseline years (2014-15 through 2016-17).
Outcome Figures Explained
Overall
Econ Disadv
-2.0 -1.0 0.0 1.0 2.0
Outcome Scale
95% Confidence Interval
Impact Estimate (Stat. Significant)
Impact Estimate (Not Significant)
Subgroup Impact
Statewide Impact

66
Table 17: ACP Outcome Baseline Averages
Outcome Statewide Average 2014-15 through 2016-17 Attendance Rate Grades 6–8 94.84% Attendance Rate Grades 9–12 92.77% Out-of-School Suspension Rate Grades 6–8 5.48% Out-of-School Suspension Rate Grades 9–12 5.07% ACT Composite Score 19.94 Four-Year High School Completion Rate 90.15% AP Calculus Score & Standardized Score 3.18 / 0.20 AP English Lang./Comp. Score & Standardized Score 3.00 / 0.17 AP English Lit./Comp. Score & Standardized Score 2.88 / 0.13 AP Psychology Score & Standardized Score 3.41 / 0.23 AP US History Score & Standardized Score 2.85 / 0.15
Note: Standardized score is based on the national distribution to allow for comparison across time.
Attendance The first short-term outcome examined is attendance rate. The analysis conducted separate examinations of attendance rates at the middle school level (Grades 6–8) and at the high school level (Grades 9–12). Figure 41 shows the estimated change in student attendance associated with ACP for students in Grades 6-8. As seen, estimated impacts are small and not statistically significant. Figure 42 shows the estimated change in student attendance associated with ACP for Grades 9–12. Unlike the earlier grades, there are statistically significant, albeit small, results associated with ACP overall and for Hispanic students, white students, and EL students. The largest of these, the impact for EL students, is an increase in attendance rate of 0.67 percentage points, approximately equivalent to 1 more day of school.
67
Figure 41: Estimated Impact of ACP on Student Attendance, Grades 6–8
Note: Solid circles represent statistically significant results.
Overall
Asian
Black
Hispanic
White
Other race/ethnicity
Special Ed
Econ Disadv
EL
City
Rural
Suburb
Town
Infrastructure
Equitable
Dedicated ACP
Student Activities
-2.5 -2.0 -1.5 -1.0 -0.5 0.0 0.5 1.0 1.5 2.0 2.5
Percentage points
68
Figure 42: Estimated Impact of ACP on Student Attendance, Grades 9–12
Note: Solid circles represent statistically significant results.
Suspensions The second short-term outcome examined in this evaluation is student behavior as measured by the out-of-school suspension rate. As with attendance rates, the evaluation examined both middle school grades and high school grades separately. Figure 43 shows the estimated change in the out-of-school suspension rate associated with ACP implementation in Grades 6–8 and Figure 44 shows the same information for Grades 9–12. Unlike attendance, where a positive number impact is associated with an improvement, with out-of-school suspensions, a positive number impact is associated with an increase in suspensions, or reduction in student behavior. While there are no statistically significant impacts associated with ACP in Grades 6–8, overall in Grades 9–12, and for many subgroups in Grades 9–12, there are small and statistically significant impacts of increased out-of-school suspensions associated with increased equitable access and increased ACP student activity component implementation (by approximately 0.3 percentage points).
Overall
Asian
Black
Hispanic
White
Other race/ethnicity
Special Ed
Econ Disadv
EL
City
Rural
Suburb
Town
Infrastructure
Equitable
Dedicated ACP
Student Activities
-5.5 -4.5 -3.5 -2.5 -1.5 -0.5 0.5 1.5 2.5 3.5 4.5 5.5
Percentage points

69
Figure 43: Estimated Impact of ACP on Out-of-School Suspensions, Grades 6–8
Note: Solid circles represent statistically significant results.
Overall
Asian
Black
Hispanic
White
Other race/ethnicity
Special Ed
Econ Disadv
EL
City
Rural
Suburb
Town
Infrastructure
Equitable
Dedicated ACP
Student Activities
-6.5 -5.5 -4.5 -3.5 -2.5 -1.5 -0.5 0.5 1.5 2.5 3.5 4.5 5.5 6.5
Percentage points

70
Figure 44: Estimated Impact of ACP on Out-of-School Suspensions, Grades 9–12
Note: Solid circles represent statistically significant results.
ACT performance Moving to intermediate-term outcomes, Figure 45 shows the estimated change associated with ACP on average ACT composite score. As seen from this figure, there were small, but statistically significant, decreases in average composite score associated with ACP overall, and with ACP for black students, white students, other race/ethnicity students, economically disadvantaged students, students in all four location types, and related to all four implementation metrics. While these results are negative, they are also quite small with the largest estimated impact being less than a third of a point on the composite scale. These results are likely only significant due to the statistical precision associated with the large, statewide sample sized used in the analysis.
Overall
Asian
Black
Hispanic
White
Other race/ethnicity
Special Ed
Econ Disadv
EL
City
Rural
Suburb
Town
Infrastructure
Equitable
Dedicated ACP
Student Activities
-5.0 -4.0 -3.0 -2.0 -1.0 0.0 1.0 2.0 3.0 4.0 5.0
Percentage points

71
Figure 45: Estimated Impact of ACP on Average ACT Composite Score
Note: Solid circles represent statistically significant results.
High school completion The next intermediate-term outcome examined in this evaluation is four-year high school completion rate. Figure 46 shows the estimated change in high school completion rate associated with ACP overall and by subgroup. As indicated, there are statistically significant increases in the high school completion rate associated with ACP overall and with ACP for black students, Hispanic students, economically disadvantaged students, students in cities, and students in towns. The overall estimated impact is an increase of approximately 1.4 percentage points, with slightly higher impacts for black students (1.8 percentage points), Hispanic students (1.7 percentage points), and students in cities (2.9 percentage points).
Overall
Asian
Black
Hispanic
White
Other race/ethnicity
Special Ed
Econ Disadv
EL
City
Rural
Suburb
Town
Infrastructure
Equitable
Dedicated ACP
Student Activities
-2.5 -2.0 -1.5 -1.0 -0.5 0.0 0.5 1.0 1.5 2.0 2.5
Composite Score

72
Figure 46: Estimated Impact of ACP on Four-Year High School Completion
Note: Solid circles represent statistically significant results.
AP exam performance The final intermediate-term outcome examined in this year’s evaluation is AP exam performance. This outcome specifically examines the results on the five most popular AP exams: Calculus (both AB and BC), English Language and Composition, English Literature and Composition, Psychology, and United States History. Since the national distribution of AP exams fluctuates over time, the analysis controlled for this fluctuation by standardizing each student’s score based on the national distribution for each year in the analysis. Figure 47 shows the estimated change in standardized score on AP exams associated with ACP for each of the five subjects examined. As displayed in this figure, all estimated impacts were small with only the Psychology score being statistically significant. This estimated impact is a decrease in an AP Psychology score of 0.07 on the standardized scale or approximately one-tenth of a point on the 1-5 AP scale.
An additional limitation for the interpretation of results from the AP score analysis is the pool of students that take AP exams. One of the intended outputs for ACP implementation is increased enrollment in AP courses. As Figure 28 shows in the previous section, AP/IB participation increased from
Overall
Asian
Black
Hispanic
White
Other race/ethnicity
Special Ed
Econ Disadv
EL
City
Rural
Suburb
Town
Infrastructure
Equitable
Dedicated ACP
Student Activities
-9 -8 -7 -6 -5 -4 -3 -2 -1 0 1 2 3 4 5 6 7 8 9
Percentage points

73
2016-17 to 2017-18 by approximately 1.3 percentage points. When these students who may not have previously been inclined to take AP courses start to enroll, it is likely they would have lower average scores on the AP exam as compared to students who would have enrolled in an AP course regardless of ACP. Due to this limitation, there may be downward bias in the estimate of this outcome.
Figure 47: Estimated Impact of ACP on AP Exam Scores, by Exam Subject
Note: Solid circles represent statistically significant results.
Key Findings and Recommendations In this section, we detail the key findings of this year’s evaluation, as interpreted by WEC evaluators. The findings are accompanied, where appropriate, by recommendations. The subsequent section, “Next Steps,” reiterates and expands on those recommendations that involve potential future research and evaluation work.
Key Finding #1: More evidence underscores the value of Powerful Practices The 5 Powerful Practices identified in last year’s evaluation report (Final Projects, Job Shadowing, Mock Interviews, Resume-Building, and One-on-One Conferencing/Advising) continued to be named as particularly valuable activities in the ACP array of activities. As these activities appear to grow and become institutionalized in many Wisconsin districts and schools, sharing specifics about implementation will be valuable, as will professional development opportunities to help support best practices. This year’s evaluation focused on Final Projects to catalogue and describe variations on this activity, with all 10 case study districts reporting multiple benefits from implementation, typically:
• Recognition: Allowing students to showcase their work/school experiences and plans. • Experience: Providing the opportunity for students to gain interview and/or presentation
experience. • Accountability: A means to compel students to take ACP (and future planning) more seriously. • Relationship Building: Providing opportunities for and capitalizing on relationships between
students, schools, teachers, families, community members, and employers.
Calculus
English Lang/Comp
English Lit/Comp
Psychology
US History
-0.5 -0.4 -0.3 -0.2 -0.1 0.0 0.1 0.2 0.3 0.4 0.5
Standardized Score
74
Recommendation: DPI should continue to promote the Powerful Practices and share resources that pertain to them. WEC’s forthcoming Special Report on ACP Final Projects will be formatted to be accessible to practitioners.
Key Finding #2: Districts are moving towards more widespread teacher participation and “school-wide cultures of ACP.” Evidence from surveys, output data, and case studies all suggest growth in this area. Sharing the duties and responsibilities for ACP across all staff strengthens the ACP culture in a school and decreases the risk of program collapse should all knowledge and responsibility be concentrated in one or two individuals. Though surveys show wide variation in dosage, schools appear to more frequently allocate dedicated time to ACP in homerooms and advisory periods where students engage in Career Cruising activities and other curricular elements, leading to an increase in teacher participation. This, however, has implications for professional learning, particularly in the area of career advising, as teachers are engaging in this kind of work more often. Moreover, further investigation of best practices in dedicated homerooms/advisories is warranted to better understand aspects such as optimal dosage, student groupings, teacher assignment, timing, accountability measures, and more. Family engagement continues to lag behind all other measures of engagement. Finally, additional communication around the “big picture of ACP” will help all stakeholders connect the dots between individual activities and the greater philosophy and approach to ACP.
Recommendation: Continue to communicate the importance of a school-wide approach to ACP both to strengthen the culture, the offerings, and the consistency of delivery, and to mitigate the risk that a lone ACP expert/provider in a school represents.
Recommendation: Consider developing and providing/supporting professional learning opportunities for school staff, particularly those who become part of an all-staff advising approach, to participate effectively in supporting ACP. Such an effort may require additional research to inform the development of professional learning.
Recommendation: Continue investigation of ACP dedicated time.
Recommendation: Continue to leverage the Career Cruising/Xello platform to provide access to the activities that staff and students find valuable, and to monitor data to measure usage and other patterns.
Recommendation: Pursue additional investigation into student accountability measures related to ACP.
Key Finding #3: Outputs data showing evidence of gaps in participation CTEERS and other work-based learning data show gaps not only by various student subgroups but also by region. However, data of this nature is unable to identify the reasons for gaps. Only with additional types of research can attempts be made to understand these factors.
Recommendation: Pursue additional research into the equitable implementation of ACP in terms of access and participation gaps.

75
Key Finding #4: Some outcomes, such as high school graduation rates, appear to show a potential positive increase. The first year of outcomes data shows increases in some short- and medium- measures and decreases in others. Most effects were small, and quite possibly the result of statistical “noise” given the limitations associated with the analysis. For example, the possibility of interference from other, co-occurring policy changes and other factors cannot be determined given the statewide roll-out of ACP. Consequently, these outcome estimates should be interpreted with extreme caution. These findings need to be observed over time to better determine their meaning.
Recommendation: DPI is advised not to prematurely claim positive effects in terms of outcomes of ACP implementation, but instead, monitor the data longitudinally.
Next Steps In the coming years, WEC plans to continue the evaluation project, addressing these same evaluation questions, which are intended to draw connections between the infrastructural elements, student activities, and output and outcome data. Similar data sources and collection methods will be used, with a focus on one or more different activities or infrastructural elements each year. In addition, areas for possible further investigation have arisen from this year’s evaluation and should be considered as additions to the scope of future evaluation work.
Areas Recommended for Further Investigation Dedicated ACP Time. In addition to following up on the initial findings about dosage, additional research could examine:
• Homeroom/advisory period classroom make-up: single vs. mixed grade, career clusters, or other grouping strategies
• Student/teacher assignment • Timing – both time of day and length/frequency of periods • Activities occurring in homerooms/advisory periods, and consistency across classrooms and/or
schools • Teacher capacity and the need for additional professional learning, particularly for the role of
teacher-advisor.
Student Accountability Measures: Examine the variety of ways schools and districts are addressing student accountability, such as credit for advisory periods, graded final projects, graduation requirements, delivering ACP curriculum within graded courses, etc.
Participation Gaps: With a focus on equity, to begin to understand the gaps seen in participation in a variety of ACP-related activities, further research would investigate possible factors that may impact access and participation. These could include geographic factors related to distance from and availability of activities and resources, opportunity gaps, student self-efficacy, funding allocation, application procedures, decision-making strategies, bias, traditional and as yet unidentified barriers, and more.

76
Appendix A: Case Study School Leaders Interview Protocol
2018-19 ACP Evaluation Case Study Districts Introductory Principal / School Counselor/ACP Coordinator Interview Protocol – pre-visit
Purpose:
• Flesh out findings from survey to understand what they do for ACP.
• Confirm/Find out more about the Final Project.
• Introduce the idea of a visit, next steps for setting one up.
Customizing the Protocol for your particular interviewees:
This is a protocol that will need to be highly customized for each interviewee. To do so,
• review the survey data for this school/district (box)
• Review our websearch/final project data for them (box)
• do an updated websearch
In all of these, look for areas to explore and probe into more deeply. Be as aware of their ACP program as possible. Then, using the topic guidelines below, create a customized protocol according to your background research to be able to get an accurate picture of
• what they are doing,
• how it came about,
• who’s involved (and who’s not)
• successes and challenges,
• FINAL PROJECT
• Any other INNOVATIVE PRACTICES.
In all cases, look for artifacts both online and during the interview, ask the respondent what they’d be willing to share and arrange to have them send it to you. (Follow-up with a thank-you email including a reminder that they’d send you X, Y, Z). Main topic areas to include:
1. Infrastructure and student activities for ACP - details/clarifiers about what they look like, particularly in terms of the list of infrastructure and activities of focus from the survey, their levels of implementation (anything stick out?). Ask for any artifacts/ examples of interesting/successful/institutionalized practices. FINAL PROJECTS – see #3.

77
2. EQUITABLE: From the various ACP services the school/district is offering - whether they are dual credit options, Work-based learning experiences, Career & Tech ed courses, co-curriculars, community service, etc. We want to be able to talk about which of the services offered by the school/district are offered to ALL students? What happens if there’s more demand than they have funding for? How are decisions made (there is a series of questions about this on the survey—look at responses and probe if applicable)? Which of them are only offered to some? Are students w/ disabilities excluded? What about English language learners? Is it something ALL students even know about and can access? Answers to these questions are important because they determine whether ACP delivery is actually equitably provided to ALL students.
Do the background research first, and construct your questions carefully. For example, “Who all is able to participate in dual-credit options?” “Are there any students that aren’t able to do so?” If so, who? If they answer generically that “everyone” can, ask “What about ELLs?” etc.
3. FINAL PROJECT Ask them to describe their final project in more detail (required? For graduation? Timeline? How long they spend on it? When do they do the work? Who supports their work? Etc. Find out of there is an observable component (presentation / interview, etc. – if so, to whom, when, where, etc?). FIND OUT IF THIS IS SOMETHING WE CAN COME AND OBSERVE.
There are additional topics you may wish to include at the end of this document.
Discuss the topic of coming to visit their school: Are they interested? Is there a final project activity that can be observed – when, where, etc.? If not, is there some other time this spring we could come and talk to teachers and students about ACP? Who should you follow up with to work out details, etc? THEN FOLLOW UP WITH EMAIL. During your phone call or follow-up email, you can include this information:
• Participation in a case study will include:
o Today’s phone Interview (school/district ACP coordinator/ school counselor)
o Visit to school to do some focus group interviews with students and teachers and in the next couple of months, hopefully when they’re doing some sort of ACP final project activity (presentation, interview, etc. (If families are involved in final project activities, we might ask a few parents about their impressions as well).
o A complimentary report of findings for you, which would synthesize teacher and student perceptions of ACP at their school, reported in aggregate, with no individual participant names included
• All interview and other data are kept confidential and results are shared with DPI in our final report in aggregate with all schools combined, and with no identifiers included. No quotes, data, or other findings in our report will ever be connected to an individual, a school, a community, or a district.
78
Documentation: Record everything in ASANA so we can keep track of progress. Additional questions (to be used, omitted, modified as context demands in the intro interview)
1. Is there an ACP team, an ACP coordinator or other personnel “in charge” of ACP in your school/district? What are those people’s roles otherwise? This might be a good introductory question.
2. How has your ACP plan evolved over time? 3. What does your scope and sequence look like? (can it be shared?) 4. How are you delivering PD around ACP? What PD? When? To Whom? Who’s delivering it? 5. Describe your collaboration with local businesses / employers. 6. Describe your collaboration with local community organizations around ACP. 7. What would you consider your biggest success(es)? Challenge(s)? What barriers have you
overcome (and how) to be able to implement ACP 8. Do you have any sort of evaluation process or continuous improvement process for your ACP
plan? Basically, how do you know whether your ACP is “working”? 9. For school counselors: what is your role in ACP? Who else is involved? How much of the burden
is yours?

79
Appendix B: Case Study Focus Group/Interview Protocols ACP Evaluation – Year 3 (2018-19) Teacher Focus Group Protocol March 11, 2019
● Your name, assistant moderator’s name, University of Wisconsin-Madison ● Statewide evaluation of Academic and Career Planning ● Talking to groups of educators around the state ● We heard your schools are doing interesting things with ACP and wanted to learn more ● Using first names only, everything you say is completely confidential, no names will be used in
our reports ● No right or wrong answers, we just want to hear your opinions, whether positive or negative. ● Audio-recording this so we don’t miss anything ● Information will be used to help the state Department of Public Instruction better help school
districts with their ACP activities.
Questions for participants:
1. How are you personally involved in ACP? Which staff teach the ACP curriculum? Probe for evidence of all-staff participation. If all staff are participating: How was your school/district able to bring about a school-wide culture of ACP? What were some of the challenges/hurdles? How were they overcome?
2. How has implementation of ACP changed your school? (Try open-ended first, if needed, probe for changes in schedule, attitudes, goals, priorities, morale, student engagement.) How has it changed student readiness for career and college? Has it been integrated into your work?
3. Who does ACP most benefit? Who’s being left out?
4. Have you received adequate PD to prepare you to perform your role(s) within ACP? What additional training and/or resources do you need?
5. Has ACP changed the nature of teacher and student relationships? How so?
6. How has ACP changed the student course selection process, if at all? Probe for details, examples.
7. Do you think students have a clearer idea of a post-secondary plan as a result of ACP activities? How do you know? (or otherwise probe for details, examples).
8. Describe the ACP (final project). How do the kids seem to feel about it? How does it impact your work? What do you see as the benefits of the (final project)? Any drawbacks?
9. What ACP-related activity do you think is most beneficial for students?
10. How could (ACP) be improved? What would make it better?
11. What else would you like to tell us about your impressions of (ACP?)

80
ACP Evaluation – Year 4 (2018-19) Student Focus Group Protocol March 11, 2018
Intro:
● Your name, assistant moderator’s name, University of Wisconsin-Madison ● Statewide evaluation of Academic and Career Planning ● Talking to groups of 9th graders and 12th graders around the state ● We heard your school is doing interesting things with ACP (or whatever they call ACP) and
wanted to learn more ● Using first names only, everything you say is completely confidential, no names will be used in
our reports ● No right or wrong answers, we just want to hear your opinions, whether positive or negative. ● Audio-recording this so we don’t miss anything ● Information will be used to help the state Department of Public Instruction better help school
districts with their ACP activities.
Questions for participants:
1. Introduce the topic of “Academic and Career Planning”? (Or substitute a different name if district has branded it otherwise). “ACP are the activities that help you plan what classes to take during high school, in order to help you prepare for what you want to do after graduation.”
2. What kinds of activities have you done that are related to ACP? – might get this from the district/school plan, but also important to capture their perceptions. Probe: In which grades?
3. Where/when do you do these activities? – Can be eliminated if info is available from school/district plan.
4. Who is ACP for? (all kids, kids who want to go to tech colleges, etc.) Probe – who is best served/helped by this program? Who doesn’t do ACP in your school?
5. Do you think ACP overall is enjoyable? Useful? 6. For 9th graders: How is ACP different in high school than in middle school? Did they do anything
to help you move your ACP from 8th grade to high school? What did they do? 7. Do you have an assigned advisor or mentor? - check website, etc. and modify if needed
a. If yes, How often do you meet with him/her? What do you talk about? b. If no, Who can you talk to if you have questions about your ACP?
8. For 12th graders: Have you done any work-based learning, like internships, or youth apprenticeships, or job shadows, etc.?
a. If yes, what did you learn from it? Was it worthwhile? b. If no, are they available? Do you plan to take advantage of them? Why (not)?
9. Tell me about the ACP (final project). a. 12th graders:
i. How much time did you spend preparing (for) it? ii. Helpful/valuable? iii. Does your plan reflect what you really plan to do after high school? iv. Was having a final project (presentation, interview, etc.) an important
part of the overall ACP work you did for the past couple years? How so?

81
v. What advice would you give future seniors about doing the final project? vi. Are your families involved in the final project?
b. 9th graders: i. What do you know about the final ACP project? Have you begun any work on it
yet? ii. What do you think the purpose is? (beyond just the plan, but the interview,
presentation, etc.) iii. How do you feel about doing the final project? iv. What were your impressions of this year’s senior’s projects? (if
applicable) 10. Which (ACP) activities do you think are benefitting you? Why? If you had the choice, would you
do (ACP) or not? 11. Has doing (ACP) caused you to change your mind about any plans or goals or otherwise do
anything differently than you might have otherwise done? How so? (examples: Course selection? Electives? Post-high school goals, career ideas?)
12. [How could (ACP) be improved? / What would make it better? ] 13. [What else would you like to tell us about (ACP)?]

82
Appendix C: Technical Methodology This appendix provides detailed information on the ACP output and outcome measure calculations, demographic subgroups utilized in this report, and the outcomes analysis methodology. WEC requested statewide, student-level data from DPI for the school years 2014-15 through 2017-18 related to student demographics and ACP measures of outputs and outcomes. Data sets received from DPI included:
• Student attributes file with information on student demographics, district, school, and grade level
• Attendance file with information on student absences • Discipline file with information on out-of-school suspension occurrences • Career and Technical Education Enrollment Reporting System (CTEERS) file with information on
work-based learning, certificated learning methodologies, and dual credit enrollment • High school completion file • ACT results file • Coursework Completion System file with information on courses taken and AP and IB courses
(2014-15 and 2015-16) • Roster file with information on courses taken and AP and IB courses (2016-17 and 2017-18) • AP exam results file with information on tests taken and test scores
The evaluation also requested and received several statewide, student-level data sets on Career Cruising participation from the vendor for the 2017-18 school year. These data sets included:
• Ability Profiler • Assessments • Career and Life Goals • Career Cluster Interests • Career Interests • Career Planning Activities • Extracurricular Activities • Hobbies and Interests • Journal entries
• Learning Styles • Login History • Matchmaker Careers • Military Careers • School Interests • Career, School, and Financial Aid
Selectors • Skills and Abilities
The following sections of this appendix detail the subgroups used for analysis, specific data preparation methods needed for certain data sets, the output measures used to measure infrastructural elements and student activity components, and the outcomes analysis methodology.
Subgroups of analysis For all measures, this report breaks down results by school year, grade level (where applicable), race/ethnicity, socioeconomic status, disability status, English proficiency status, and locale description. For all reported statistics, the information on grade level, race/ethnicity, economically disadvantaged status, disability status, and English proficiency status came from the student attributes file. DPI defines economically disadvantaged as eligible for free or reduced-price lunch and disability as participation in special education. Locale description information is a designation based on school location that specifies

83
whether a school is in a city, suburb, town, or rural setting. These codes are specific to schools and not students. In the majority of cases, these codes came from publically available files on DPI’s website. When a school was missing a locale description code, this evaluation used the code most associated with that school’s district.
Data preparation Several data sets provided for use in the evaluation required additional preparation before analysis could occur. Reasons for this additional preparation included, but were not limited to missing values, possible errors, and duplicate records. Certain schools within the attendance file provided information with values outside what is reasonable. Thus, we removed a school when all its students had an attendance rate strictly less than 90 percent. CTEERS data preparation included the removal of all students without applicable student identifiers and duplicate records belonging to the same student within a single year. If a student had duplicate CTEERS records, the evaluation only used the most recent record that could be matched to a school they enrolled in through other records.
Career Cruising records also required data preparation before use as a measure of ACP implementation. Since a majority of Career Cruising data sets were not specific to a single school year, calculation of 2017-18 activity completion necessitated identification of only activities that occurred within that school year. Many of the Career Cruising data sets included a date stamp field to indicate when a field was overwritten with new information. This date stamp allowed the evaluation to identify activities within 2017-18 by limiting the range of this date stamp from August 1, 2017 to July 31, 2018 for the sets including this information. For the remaining Career Cruising data sets without any date stamp, the evaluation included any records associated with that activity. This likely resulted in a slightly higher than actual activity completion rate for some activities. Additionally, data limitations associated with Career Cruising records did not allow for linking of these records to other DPI records.
Output measures This report examined five output measures deriving from the data sets described above: participation in non-certificated work-based learning activities, participation in certificated work-based learning activities, AP or IB course enrollment, participation in dual credit courses, and Career Cruising activity completion.
Participation in non-certificated and certificated work-based learning and participation in dual credit courses used data from CTEERS. CTEERS data included student-level information on work-based learning to determine the percentage of students participating in co-ops, supervised occupational experiences, internships, youth apprenticeship programs, state certified cooperative education skill standards programs, employability skills certificate programs, and business/industry sponsored certificate programs. Since CTEERS only collects this information for 11th and 12th grade CTE concentrators, the evaluation can only report the percentage of students participating in these work-based learning activities for this subgroup of students. CTEERS data also included indicators for dual credit course enrollment both at universities and technical colleges, which was used to determine the percentage of students enrolling in these courses.
AP and IB course enrollment used data from the Coursework Completion System and the newer replacement system, Roster. These files contained course level information including an indicator for whether a course was an AP or IB course. The outcome measure for AP and IB used in this evaluation is
84
the percentage of students taking at least one AP or IB course. Students who were in more than one school are represented once only when we report the statistics at the state level and for subgroups other than locale description. When the evaluation computed the statistics for different locale descriptions, if a student was in two different schools and if those schools had two different values for locale description, the student entered in the computation of the statistics for both locale descriptions. Potentially a student could enter the computation of a statistic in a given year up to four times if the students went to at least four different schools and if all four schools belonged to a different locale description category. If all the schools attended have the same value for the locale description, the student entered the computation only once. Since DPI changed systems during the period of examination (2014-15 through 2017-18), the evaluation only included records from schools that appeared in all four years of data to allow for stability in the measure across data systems.
Career Cruising activity completion used data sets provided by the vendor. These data show the extent that students using the software completed various activities at each grade level. At each grade level, DPI provides a recommended set of Career Cruising activities for students to complete.8 Table C shows the activities examined in this evaluation at each grade level in alignment with DPI recommendations. For each of these activities, the evaluation reports the percentage of students in schools with at least one Career Cruising user that completed that activity. Since limitations associated with Career Cruising records did not allow for linking of these records to other DPI records, the denominator in this percentage calculation comes from public enrollment data. Where Career Cruising records indicated a higher number of student completers than enrollment at a particular grade in a particular school, the evaluation adjusted this number to match enrollment (for 100 percent completion at that grade and school).
8 Refer to the following document for detailed descriptions of the recommended activities at each grade level: http://cdn.careercruising.com/clientservice/Recommended%20Default%20Portfolio%20Completion%20Standards.pdf?cdn=a0b9c8

85
Table C: DPI Recommended Career Cruising Activities by Grade
Recommended Career Cruising Activity
Grade 6
Grade 7
Grade 8
Grade 9
Grade 10
Grade 11
Grade 12
Career Matchmaker ✓ ✓ ✓ ✓ ✓ ✓ ✓ My Skills ✓ ✓ Learning Styles Inventory ✓ ✓ My Saved Careers ✓ ✓ ✓ ✓ ✓ ✓ ✓ Career Selector ✓ ✓ My Saved Schools ✓ ✓ ✓ School Selector ✓ Financial Aid Selector ✓ My Saved Clusters ✓ ✓ ✓ ✓ Career Planning Activities ✓ ✓ ✓ Career and Life Goals ✓ ✓ ✓ ✓ ✓ Hobbies & Interests ✓ ✓ ✓ ✓ ✓ ✓ ✓ Extracurricular Activities ✓ ✓ ✓ ✓ ✓ ✓ ✓ Skills and Abilities ✓ ✓ ✓ ✓ ✓ My Journal ✓ ✓ ✓ ✓ ✓
For all of these measures, with the exception of Career Cruising activity completion, the evaluation excluded students missing demographic information.
Outcomes analysis Short-term outcome measures include attendance rate and out-of-school suspension rate. Intermediate-term outcome measures include ACT composite scores, four-year high school completion rate, and AP exam performance. AP exam performance includes scores on the five most popular AP exams: Calculus (both AB and BC), English Language and Composition, English Literature and Composition, Psychology, and United States History. To understand how ACP is associated with these short and intermediate-term outcomes, the evaluation used an interrupted time series methodology. This type of analysis compares a school’s outcomes prior to ACP implementation to that same school’s outcomes after ACP was implemented statewide in 2017-18. This methodology is ideal since there are no non-ACP students and schools in the year of implementation that could be used as a comparison. The treatment group was all schools in 2017-18 (as ACP is statewide). For a comparison group, the evaluation used within-school comparisons, meaning that each school is only compared to itself before and after ACP implementation. To account for any long term trends occurring throughout the state, the analysis used three prior years of baseline data on the intended outcomes (specifically 2014-15 through 2016-17). The evaluation then used multivariate regression models to estimate the associated impact of ACP on these outcomes while controlling for a variety of student- and school-level characteristics.
The general model specification for the outcomes analysis was:
𝑌𝑌𝑖𝑖𝑖𝑖𝑖𝑖𝑖𝑖 = 𝛾𝛾𝐴𝐴𝐴𝐴𝐴𝐴𝑖𝑖 + 𝛽𝛽𝑋𝑋𝑖𝑖𝑖𝑖 + 𝜋𝜋𝐿𝐿𝐿𝐿𝐿𝐿𝐿𝐿𝐿𝐿𝐿𝐿𝐿𝐿𝐿𝐿𝑖𝑖 + 𝜃𝜃𝑇𝑇𝑖𝑖 + 𝛿𝛿𝑖𝑖𝑖𝑖 + 𝜀𝜀𝑖𝑖𝑖𝑖𝑖𝑖𝑖𝑖

86
In this specification:
• 𝑌𝑌𝑖𝑖𝑖𝑖𝑖𝑖𝑖𝑖 is the outcome of interest for student i in grade g, school s, and year y. • 𝐴𝐴𝐴𝐴𝐴𝐴𝑖𝑖 is a binary indicator for whether the year is before or after ACP implementation (2017-18). • 𝑋𝑋𝑖𝑖𝑖𝑖 is a vector of student-level covariates including gender, race/ethnicity, special education
status, economically disadvantaged status, and English learner status. • 𝐿𝐿𝐿𝐿𝐿𝐿𝐿𝐿𝐿𝐿𝐿𝐿𝐿𝐿𝐿𝐿𝑖𝑖 is a vector of indicators for the locale description of a school including city, suburb,
town, and rural.9 • 𝑇𝑇𝑖𝑖 is a continuous, state-level time trend. • 𝛿𝛿𝑖𝑖𝑖𝑖 are grade-by-school fixed effects to control for any unobserved effects that vary by grade
and school.
Because of the multi-level nature of the specification, this multivariate regression clustered standard errors at the school level.
To account for possible impacts of ACP for various types of students and schools, the evaluation also used differential effects models. These models included an interaction term between the treatment (𝐴𝐴𝐴𝐴𝐴𝐴𝑖𝑖) and the indicator representing the subgroup of interest. These subgroups included race/ethnicity, special education, economically disadvantaged, English learner, and each of the four locale descriptions.
In addition to examining the subgroup change in these outcomes, the analysis also explored associations for levels of ACP implementation. The evaluation identified levels of ACP implementation from the 2017-18 ACP implementation building-level survey10. Specifically, four measures of ACP implementation were identified: infrastructural element implementation, equitable access implementation, dedicated ACP time implementation, and student activity component implementation. For each of these implementation metrics, the evaluation combined all relevant survey item responses into a single score with values ranging from 0 (not yet started) through 3 (institutionalized). Implementation scores near 1 indicate the initiated level, and scores near 2 indicate the implemented level. Since not all schools responded to the 2017-18 survey, only schools with answers to these items were included in this subgroup analysis. For these models, the specification included an interaction between treatment and implementation level.
Variations on model specification For the attendance outcome, the evaluation first accounted for the bound, non-linearity of the measure by converting attendance rates into the standard normal distribution using a probit transformation. To provide meaningful results, the evaluation then used an inverse transformation of the raw impact estimates before reporting.
For the suspensions outcome and the high school completion outcome, for each student, the outcome is binary (1 if the student had at least one out-of-school suspension, 0 otherwise; 1 if the student
9 The model specification includes location indicators for both narrative reasons and because it is later used as an interaction term in the subgroup analysis. Generally, the inclusion of school fixed effects also controls for any school-specific factors, and location indicators are not necessary. 10 Refer to the Academic and Career Planning Evaluation Implementation Year School-Level Survey Results report for further details.

87
completed high school within four years, 0 otherwise). As a result, the evaluation used a logit regression. The form of the logit regression is:
𝑙𝑙𝐿𝐿 �𝐴𝐴𝑃𝑃�𝑌𝑌𝑖𝑖𝑖𝑖𝑖𝑖𝑖𝑖�
1 − �𝑌𝑌𝑖𝑖𝑖𝑖𝑖𝑖𝑖𝑖�� = 𝛾𝛾𝐴𝐴𝐴𝐴𝐴𝐴𝑖𝑖 + 𝛽𝛽𝑋𝑋𝑖𝑖𝑖𝑖 + 𝜋𝜋𝐿𝐿𝐿𝐿𝐿𝐿𝐿𝐿𝐿𝐿𝐿𝐿𝐿𝐿𝐿𝐿𝑖𝑖 + 𝜃𝜃𝑇𝑇𝑖𝑖 + 𝛿𝛿𝑖𝑖𝑖𝑖 + 𝜀𝜀𝑖𝑖𝑖𝑖𝑖𝑖𝑖𝑖
For the AP exam score outcome, the analysis controlled for the fluctuation in the national distribution of scores by standardizing each student’s score based on the national distribution for each year in the analysis.
To assess the robustness of findings, the evaluation tested two alternative specifications. The first alternative specification allowed for each school within the analysis to have its own specific time trend. This specification provided interaction terms for the continuous time trend with each school fixed effect. This evaluation tested this model to account for any variation in the overall trend in the outcomes across the state between schools. The second alternative specification dual clustered the standard errors at both the student and school levels. The evaluation tested this model to account for students appearing multiple times within the same analysis. Both alternative specifications produced similar results to the main specification presented above.
Multiple Comparisons Correction Since this evaluation report includes the results from multiple estimates of the impact of ACP for several outcomes and subgroups, there is an increased likelihood for false positive results that would be statistically significant due to random chance rather than actual program impact. For example, a 0.05 significance level implies that 5 percent of statistically significant estimates are produced by random chance. The Benjamini-Hochberg procedure corrects for these multiple comparisons by accounting for the total number of statistical tests as well as the strength of the estimates, as measured by p-values.11 In this report the evaluation adapts this procedure to provide corrected confidence intervals for each of the results presented in the report. The formula used for this correction is:
𝐴𝐴𝐶𝐶𝑐𝑐 = 𝛾𝛾 ± 𝐿𝐿𝛼𝛼 2⁄ ,𝑑𝑑𝑑𝑑 �𝛾𝛾
𝐿𝐿𝑝𝑝𝑁𝑁𝑟𝑟𝑅𝑅𝑟𝑟
2� ,𝑑𝑑𝑑𝑑�
where:
• 𝐴𝐴𝐶𝐶𝑐𝑐 is the corrected confidence interval. • 𝛾𝛾 is the estimate of impact. • 𝐿𝐿𝛼𝛼 2⁄ ,𝑑𝑑𝑑𝑑 is the t-score on the t-distribution table associated with an alpha of 𝛼𝛼 (in this case 0.05)
and 𝑑𝑑𝑑𝑑 degrees of freedom. • 𝐿𝐿𝑝𝑝𝑁𝑁𝑟𝑟
𝑅𝑅𝑟𝑟2⁄ ,𝑑𝑑𝑑𝑑 is the t-score associated with an alpha of 𝑝𝑝𝑁𝑁𝑟𝑟
𝑅𝑅𝑟𝑟 and 𝑑𝑑𝑑𝑑 degrees of freedom.
• 𝑝𝑝 is the p-value of the estimate derived from the model. • 𝑁𝑁𝑟𝑟 is the total number of results across all models.
11 Benjamini, Y. & Hochberg, Y. (1995). Controlling the false discovery rate: A practical and powerful approach to multiple testing. Journal of the Royal Statistical Society: Series B (Methodological), 57(1), 289-300.

88
• 𝑅𝑅𝑟𝑟 is the numeric rank of results across all models, for example the result with the lowest p-value has a rank of 1.

89
Appendix D: ACP Implementation Tables The following tables provide information on participation rates in work-based learning activities, AP and IB courses, college level industry certification courses, and dual credit courses for all applicable students and by the following subgroups: black students, Hispanic students, white students, other race/ethnicity students, economically disadvantaged students, non-economically disadvantaged students, English learner students, non-English learner students, special education students and non-special education students. Participation rates by CESA are provided in the ACP Implementation section of the report.
Table D1: Percentage of CTE Concentrators Participating in Co-ops Overall and by Subgroup, 2014-15 through 2017-18
Subgroup 2015 2016 2017 2018 All Students 2.4% 3.0% 2.4% 2.7%
Black 1.6% 2.7% 2.7% 2.1% Hispanic 2.4% 4.2% 2.7% 2.5% White 2.5% 3.0% 2.3% 2.8% Other Race/Ethnicity 1.9% 2.4% 1.8% 1.8%
Economically Disadvantaged 2.2% 2.9% 2.2% 2.4% Non-Economically Disadvantaged 2.4% 3.0% 2.4% 2.8%
English Learner 0.8% 3.7% 2.7% 0.7% Non-English Learner 2.4% 3.0% 2.4% 2.7%
Special Education 1.9% 2.6% 2.1% 2.3% Non-Special Education 2.4% 3.0% 2.4% 2.7%
Source: CTEERS

90
Table D2: Percentage of CTE Concentrators Participating in Supervised Occupational Experiences Overall and by Subgroup, 2014-15 through 2017-18
Subgroup 2015 2016 2017 2018 All Students 3.9% 3.5% 4.4% 5.1%
Black 0.8% 0.6% 2.0% 3.1% Hispanic 2.5% 2.4% 3.6% 3.8% White 4.5% 4.1% 4.9% 5.6% Other Race/Ethnicity 2.0% 1.6% 1.8% 3.5%
Economically Disadvantaged 3.8% 3.0% 4.3% 5.5% Non-Economically Disadvantaged 4.0% 3.7% 4.5% 5.0%
English Learner 2.0% 1.2% 3.6% 3.1% Non-English Learner 4.0% 3.5% 4.4% 5.2%
Special Education 4.9% 4.3% 6.3% 7.5% Non-Special Education 3.8% 3.4% 4.2% 4.9%
Source: CTEERS
Table D3: Percentage of CTE Concentrators Participating in Internships Overall and by Subgroup, 2014-15 through 2017-18
Subgroup 2015 2016 2017 2018 All Students 1.4% 1.3% 2.0% 2.6%
Black 0.7% 1.0% 3.3% 3.3% Hispanic 1.3% 1.6% 2.7% 3.6% White 1.4% 1.3% 1.7% 2.5% Other Race/Ethnicity 1.9% 1.3% 2.3% 3.0%
Economically Disadvantaged 1.1% 1.0% 2.6% 2.5% Non-Economically Disadvantaged 1.5% 1.4% 1.7% 2.7%
English Learner 0.2% 1.1% 2.2% 2.2% Non-English Learner 1.4% 1.3% 2.0% 2.7%
Special Education 0.9% 1.0% 1.1% 1.7% Non-Special Education 1.4% 1.3% 2.0% 2.7%
Source: CTEERS

91
Table D4: Percentage of 11th and 12th Grade Students Participating in at least one AP or IB Course Overall and by Subgroup, 2014-15 through 2017-18
Subgroup 2015 2016 2017 2018 All Students 36.2% 37.6% 33.3% 34.7%
Black 23.1% 24.8% 25.7% 25.7% Hispanic 28.2% 31.2% 30.3% 30.4% White 38.8% 40.1% 34.5% 36.1% Other Race/Ethnicity 34.8% 36.7% 35.6% 38.3%
Economically Disadvantaged 21.3% 23.0% 22.0% 22.1% Non-Economically Disadvantaged 43.4% 44.4% 38.6% 41.1%
English Learner 8.2% 9.8% 10.6% 13.7% Non-English Learner 36.8% 38.3% 33.9% 35.4%
Special Education 5.4% 5.7% 5.6% 6.1% Non-Special Education 40.5% 41.9% 37.3% 38.7%
Source: CWCS/Roster
Table D5: Percentage of CTE Concentrators Participating in Youth Apprenticeship Programs Overall and by Subgroup, 2014-15 through 2017-18
Subgroup 2015 2016 2017 2018 All Students 5.8% 5.1% 5.2% 7.2%
Black 3.5% 2.3% 1.7% 1.7% Hispanic 5.2% 3.8% 3.5% 5.0% White 6.2% 5.7% 5.9% 8.1% Other Race/Ethnicity 4.2% 4.1% 3.2% 4.6%
Economically Disadvantaged 4.6% 4.0% 3.9% 5.7% Non-Economically Disadvantaged 6.3% 5.6% 5.7% 7.7%
English Learner 4.9% 4.0% 2.2% 2.5% Non-English Learner 5.8% 5.1% 5.3% 7.3%
Special Education 3.6% 4.2% 4.1% 5.7% Non-Special Education 6.1% 5.2% 5.4% 7.3%
Source: CTEERS

92
Table D6: Percentage of CTE Concentrators Participating in State Certified Cooperative Education Skill Standards Programs Overall and by Subgroup, 2014-15 through 2017-18
Subgroup 2015 2016 2017 2018 All Students 2.1% 1.7% 1.6% 1.8%
Black 1.4% 0.8% 1.0% 1.6% Hispanic 3.1% 2.3% 2.1% 2.7% White 2.0% 1.7% 1.6% 1.8% Other Race/Ethnicity 2.8% 2.0% 2.3% 1.9%
Economically Disadvantaged 2.2% 1.8% 1.8% 2.5% Non-Economically Disadvantaged 2.0% 1.6% 1.5% 1.6%
English Learner 1.8% 1.9% 2.0% 2.4% Non-English Learner 2.1% 1.7% 1.6% 1.8%
Special Education 1.4% 1.3% 1.3% 1.4% Non-Special Education 2.1% 1.7% 1.6% 1.9%
Source: CTEERS
Table D7: Percentage of CTE Concentrators Participating in Employability Skills Certificate Programs Overall and by Subgroup, 2014-15 through 2017-18
Subgroup 2015 2016 2017 2018 All Students 2.0% 1.5% 1.9% 1.5%
Black 1.1% 0.6% 1.2% 0.7% Hispanic 2.7% 2.0% 2.2% 1.4% White 2.0% 1.5% 2.0% 1.6% Other Race/Ethnicity 2.1% 1.6% 1.4% 1.9%
Economically Disadvantaged 2.1% 1.5% 1.8% 1.7% Non-Economically Disadvantaged 1.9% 1.5% 1.9% 1.5%
English Learner 1.0% 1.2% 2.6% 0.9% Non-English Learner 2.0% 1.5% 1.9% 1.6%
Special Education 2.2% 1.2% 1.9% 1.7% Non-Special Education 1.9% 1.5% 1.9% 1.5%
Source: CTEERS
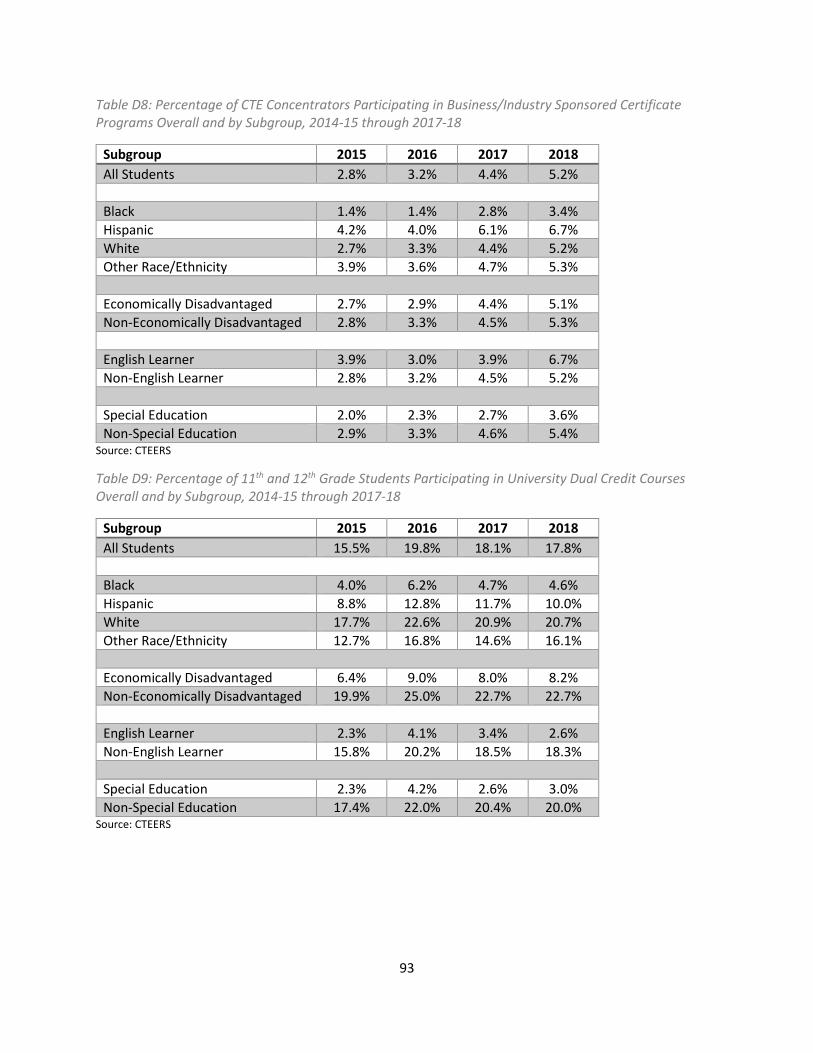
93
Table D8: Percentage of CTE Concentrators Participating in Business/Industry Sponsored Certificate Programs Overall and by Subgroup, 2014-15 through 2017-18
Subgroup 2015 2016 2017 2018 All Students 2.8% 3.2% 4.4% 5.2%
Black 1.4% 1.4% 2.8% 3.4% Hispanic 4.2% 4.0% 6.1% 6.7% White 2.7% 3.3% 4.4% 5.2% Other Race/Ethnicity 3.9% 3.6% 4.7% 5.3%
Economically Disadvantaged 2.7% 2.9% 4.4% 5.1% Non-Economically Disadvantaged 2.8% 3.3% 4.5% 5.3%
English Learner 3.9% 3.0% 3.9% 6.7% Non-English Learner 2.8% 3.2% 4.5% 5.2%
Special Education 2.0% 2.3% 2.7% 3.6% Non-Special Education 2.9% 3.3% 4.6% 5.4%
Source: CTEERS
Table D9: Percentage of 11th and 12th Grade Students Participating in University Dual Credit Courses Overall and by Subgroup, 2014-15 through 2017-18
Subgroup 2015 2016 2017 2018 All Students 15.5% 19.8% 18.1% 17.8%
Black 4.0% 6.2% 4.7% 4.6% Hispanic 8.8% 12.8% 11.7% 10.0% White 17.7% 22.6% 20.9% 20.7% Other Race/Ethnicity 12.7% 16.8% 14.6% 16.1%
Economically Disadvantaged 6.4% 9.0% 8.0% 8.2% Non-Economically Disadvantaged 19.9% 25.0% 22.7% 22.7%
English Learner 2.3% 4.1% 3.4% 2.6% Non-English Learner 15.8% 20.2% 18.5% 18.3%
Special Education 2.3% 4.2% 2.6% 3.0% Non-Special Education 17.4% 22.0% 20.4% 20.0%
Source: CTEERS
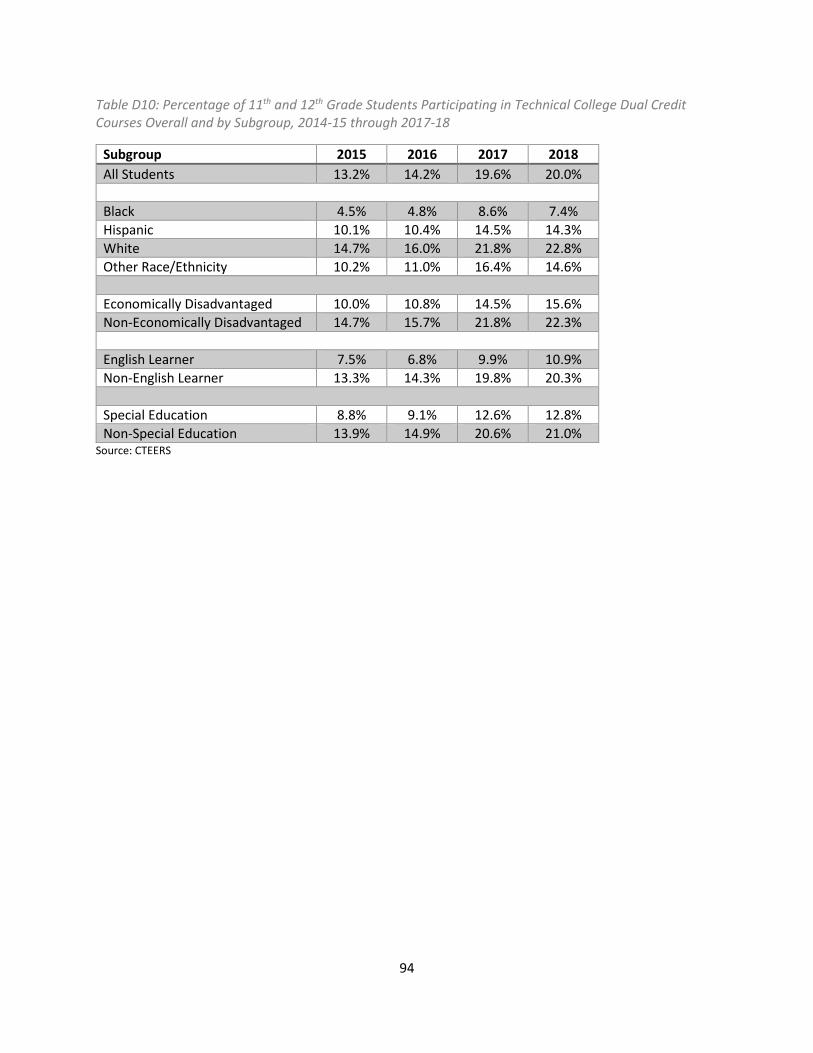
94
Table D10: Percentage of 11th and 12th Grade Students Participating in Technical College Dual Credit Courses Overall and by Subgroup, 2014-15 through 2017-18
Subgroup 2015 2016 2017 2018 All Students 13.2% 14.2% 19.6% 20.0%
Black 4.5% 4.8% 8.6% 7.4% Hispanic 10.1% 10.4% 14.5% 14.3% White 14.7% 16.0% 21.8% 22.8% Other Race/Ethnicity 10.2% 11.0% 16.4% 14.6%
Economically Disadvantaged 10.0% 10.8% 14.5% 15.6% Non-Economically Disadvantaged 14.7% 15.7% 21.8% 22.3%
English Learner 7.5% 6.8% 9.9% 10.9% Non-English Learner 13.3% 14.3% 19.8% 20.3%
Special Education 8.8% 9.1% 12.6% 12.8% Non-Special Education 13.9% 14.9% 20.6% 21.0%
Source: CTEERS