Embed Size (px)
Citation preview
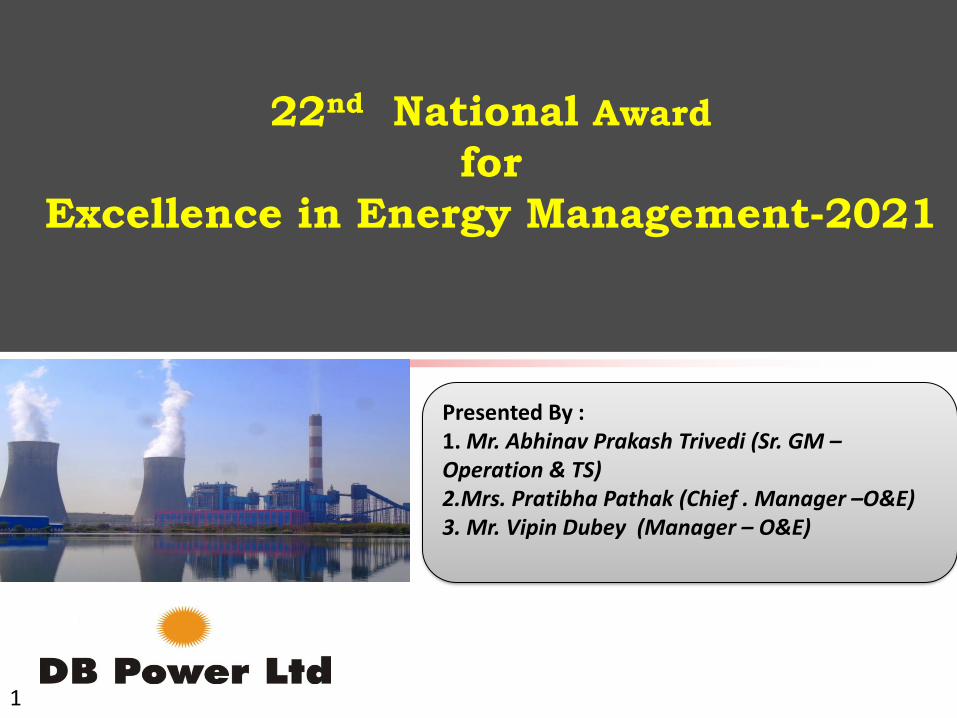
1
22nd National Award
for
Excellence in Energy Management-2021
Presented By : 1. Mr. Abhinav Prakash Trivedi (Sr. GM –Operation & TS)2.Mrs. Pratibha Pathak (Chief . Manager –O&E)3. Mr. Vipin Dubey (Manager – O&E)
2
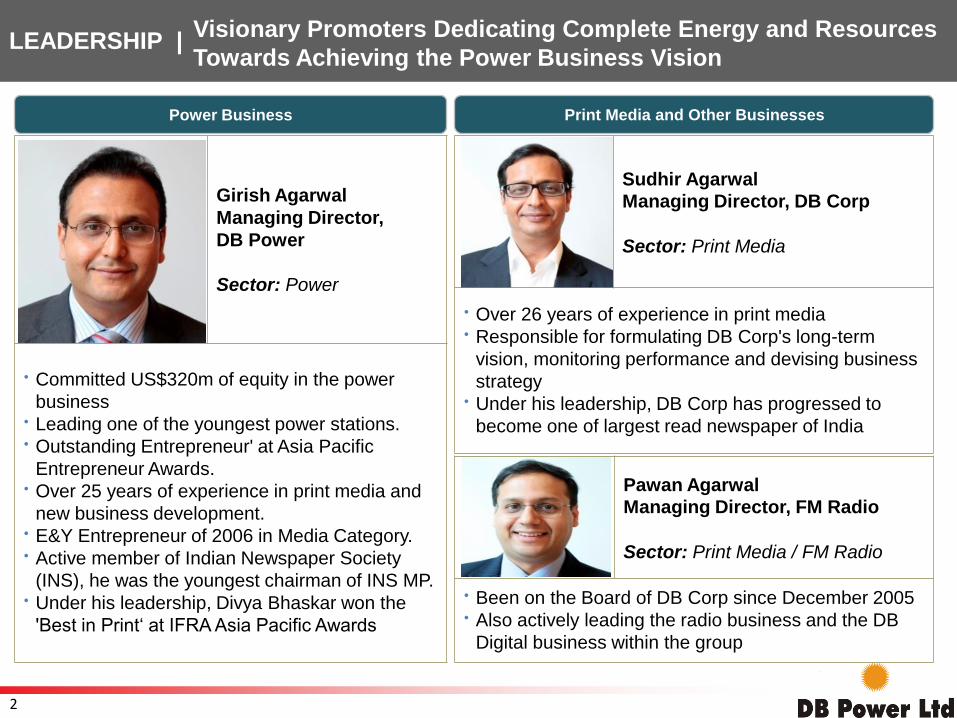
Pawan Agarwal
Managing Director, FM Radio
Sector: Print Media / FM Radio
• Been on the Board of DB Corp since December 2005• Also actively leading the radio business and the DB
Digital business within the group
Girish Agarwal
Managing Director,
DB Power
Sector: Power
• Committed US$320m of equity in the power
business• Leading one of the youngest power stations.• Outstanding Entrepreneur' at Asia Pacific
Entrepreneur Awards.• Over 25 years of experience in print media and
new business development.• E&Y Entrepreneur of 2006 in Media Category.• Active member of Indian Newspaper Society
(INS), he was the youngest chairman of INS MP.• Under his leadership, Divya Bhaskar won the
'Best in Print‘ at IFRA Asia Pacific Awards
Sudhir Agarwal
Managing Director, DB Corp
Sector: Print Media
• Over 26 years of experience in print media • Responsible for formulating DB Corp's long-term
vision, monitoring performance and devising business
strategy• Under his leadership, DB Corp has progressed to
become one of largest read newspaper of India
LEADERSHIP |
Print Media and Other Businesses Power Business
Visionary Promoters Dedicating Complete Energy and Resources
Towards Achieving the Power Business Vision
3
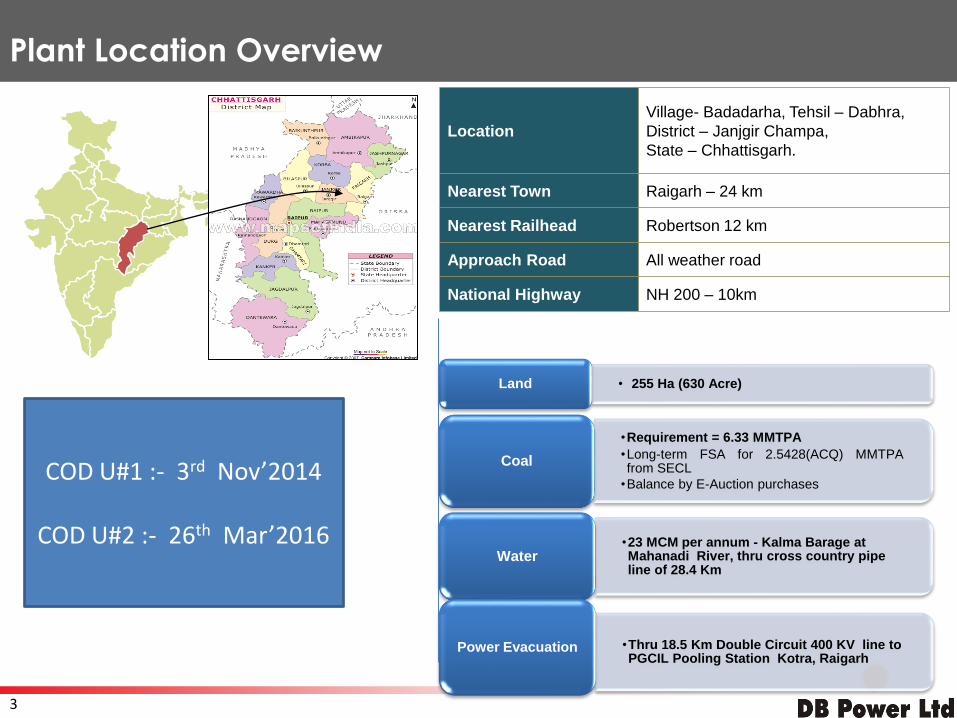
Location
Village- Badadarha, Tehsil – Dabhra,
District – Janjgir Champa,
State – Chhattisgarh.
Nearest Town Raigarh – 24 km
Nearest Railhead Robertson 12 km
Approach Road All weather road
National Highway NH 200 – 10km
Plant Location Overview
COD U#1 :- 3rd Nov’2014
COD U#2 :- 26th Mar’2016
• 255 Ha (630 Acre)Land
•Requirement = 6.33 MMTPA
•Long-term FSA for 2.5428(ACQ) MMTPAfrom SECL
•Balance by E-Auction purchases
Coal
•23 MCM per annum - Kalma Barage at Mahanadi River, thru cross country pipe line of 28.4 Km
Water
•Thru 18.5 Km Double Circuit 400 KV line to PGCIL Pooling Station Kotra, Raigarh
Power Evacuation
4
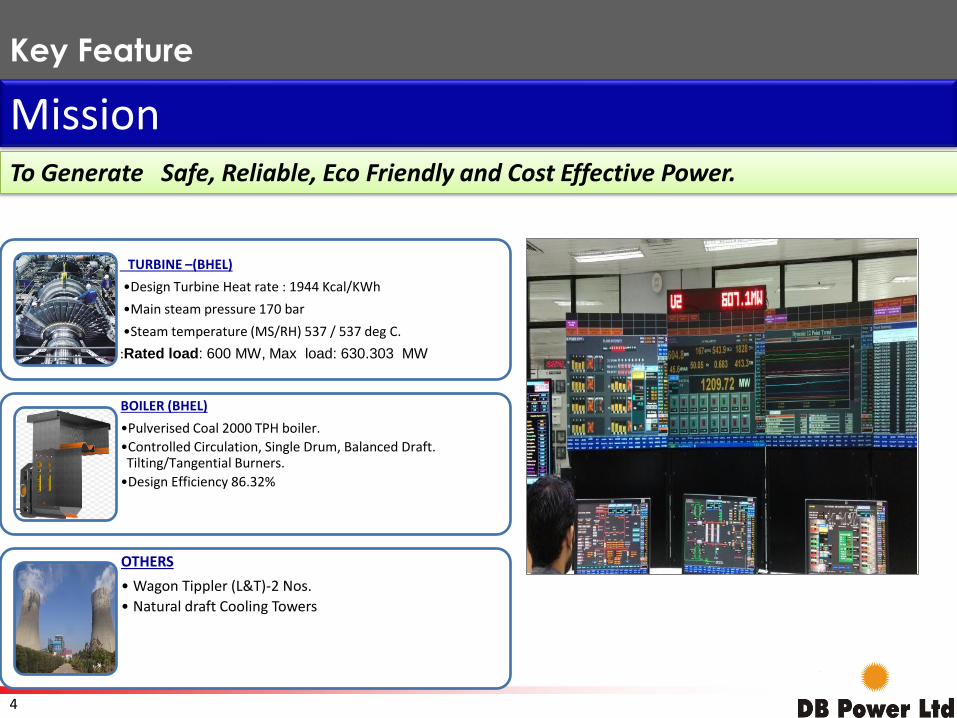
Key Feature
TURBINE –(BHEL)
•Design Turbine Heat rate : 1944 Kcal/KWh
•Main steam pressure 170 bar
•Steam temperature (MS/RH) 537 / 537 deg C.
:Rated load: 600 MW, Max load: 630.303 MW
BOILER (BHEL)
•Pulverised Coal 2000 TPH boiler.
•Controlled Circulation, Single Drum, Balanced Draft. Tilting/Tangential Burners.
•Design Efficiency 86.32%
OTHERS
• Wagon Tippler (L&T)-2 Nos.
• Natural draft Cooling Towers
MissionTo Generate Safe, Reliable, Eco Friendly and Cost Effective Power.
5
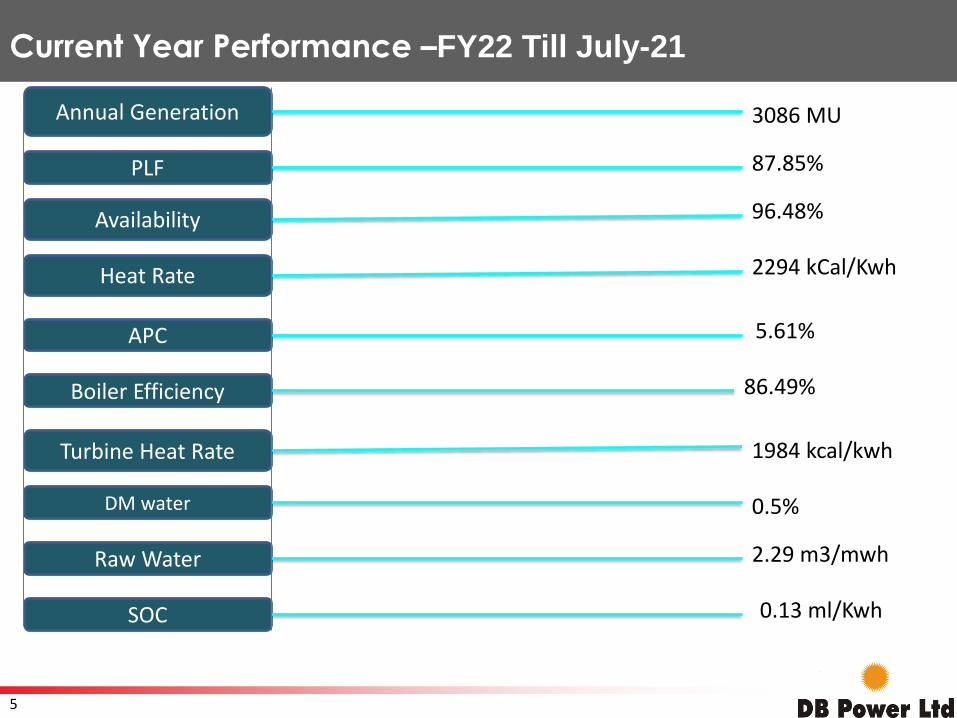
Current Year Performance –FY22 Till July-21
Annual Generation
PLF
Availability
Heat Rate
APC
Boiler Efficiency
Turbine Heat Rate
DM water
SOC
Raw Water
3086 MU
87.85%
2294 kCal/Kwh
96.48%
5.61%
86.49%
1984 kcal/kwh
0.5%
2.29 m3/mwh
0.13 ml/Kwh
6
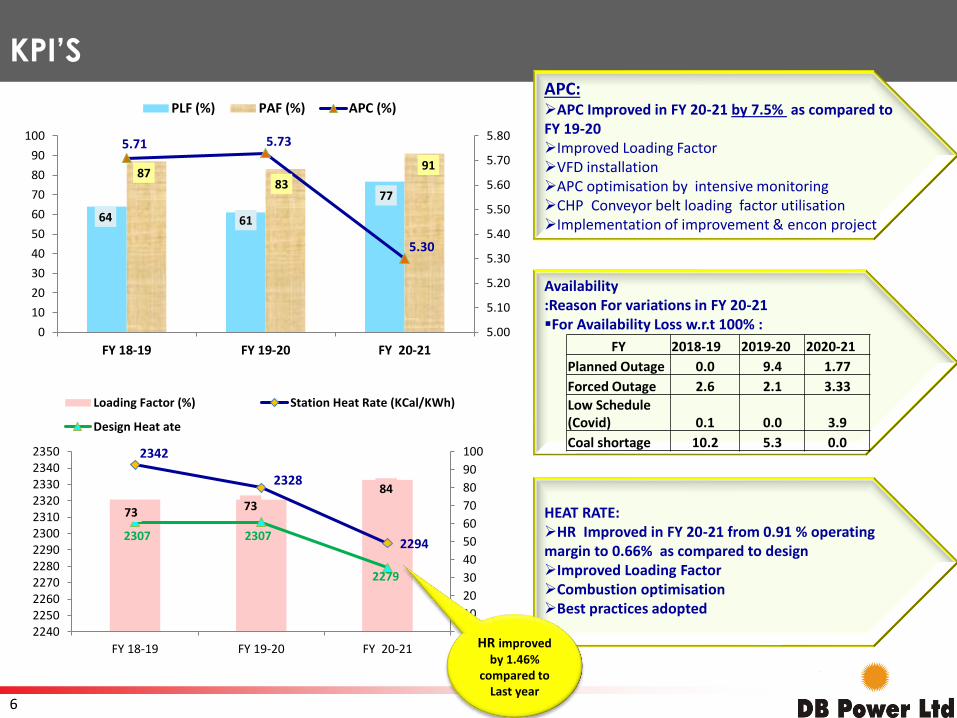
KPI’SAPC: ➢APC Improved in FY 20-21 by 7.5% as compared to FY 19-20 ➢Improved Loading Factor➢VFD installation ➢APC optimisation by intensive monitoring➢CHP Conveyor belt loading factor utilisation ➢Implementation of improvement & encon project
64 61
77
8783
91
5.71 5.73
5.30
5.00
5.10
5.20
5.30
5.40
5.50
5.60
5.70
5.80
0
10
20
30
40
50
60
70
80
90
100
FY 18-19 FY 19-20 FY 20-21
PLF (%) PAF (%) APC (%)
HEAT RATE: ➢HR Improved in FY 20-21 from 0.91 % operating margin to 0.66% as compared to design ➢Improved Loading Factor➢Combustion optimisation➢Best practices adopted
Availability :Reason For variations in FY 20-21▪For Availability Loss w.r.t 100% :
FY 2018-19 2019-20 2020-21
Planned Outage 0.0 9.4 1.77
Forced Outage 2.6 2.1 3.33
Low Schedule(Covid) 0.1 0.0 3.9
Coal shortage 10.2 5.3 0.0
73 73
84
2342
2328
22942307 2307
2279
0
10
20
30
40
50
60
70
80
90
100
224022502260227022802290230023102320233023402350
FY 18-19 FY 19-20 FY 20-21
Loading Factor (%) Station Heat Rate (KCal/KWh)
Design Heat ate
HR improved by 1.46%
compared to Last year
7
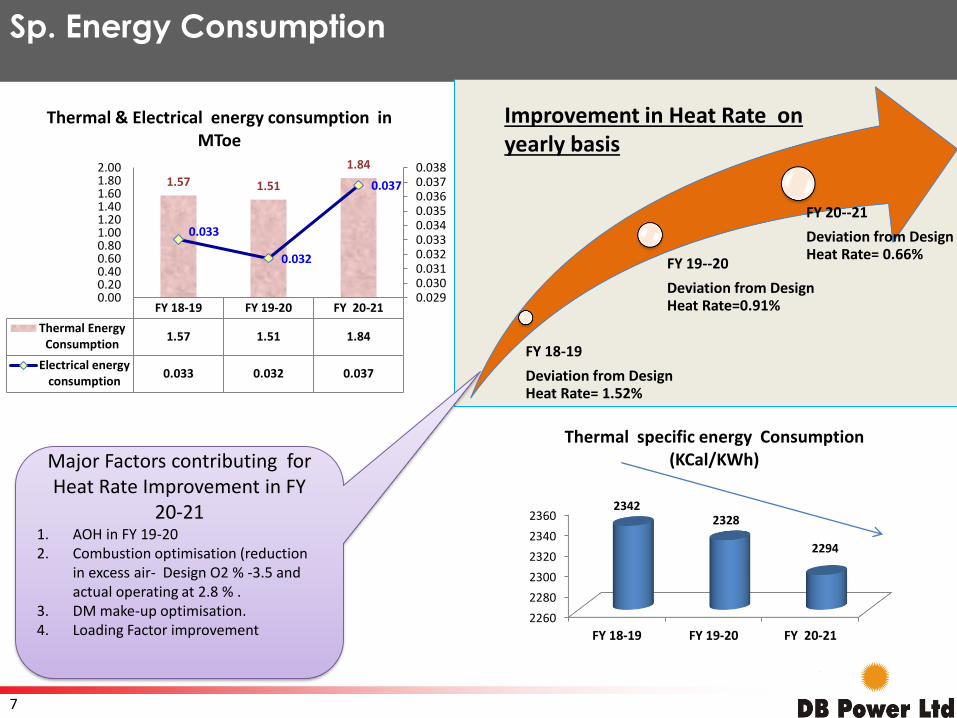
Sp. Energy Consumption
FY 18-19
Deviation from Design Heat Rate= 1.52%
FY 19--20
Deviation from Design Heat Rate=0.91%
FY 20--21
Deviation from Design Heat Rate= 0.66%
Major Factors contributing for Heat Rate Improvement in FY
20-211. AOH in FY 19-202. Combustion optimisation (reduction
in excess air- Design O2 % -3.5 and actual operating at 2.8 % .
3. DM make-up optimisation.4. Loading Factor improvement
FY 18-19 FY 19-20 FY 20-21
Thermal EnergyConsumption
1.57 1.51 1.84
Electrical energyconsumption
0.033 0.032 0.037
1.57 1.51
1.84
0.033
0.032
0.037
0.0290.0300.0310.0320.0330.0340.0350.0360.0370.038
0.000.200.400.600.801.001.201.401.601.802.00
Thermal & Electrical energy consumption in MToe
2260
2280
2300
2320
2340
2360
FY 18-19 FY 19-20 FY 20-21
23422328
2294
Thermal specific energy Consumption (KCal/KWh)
Improvement in Heat Rate on yearly basis
8
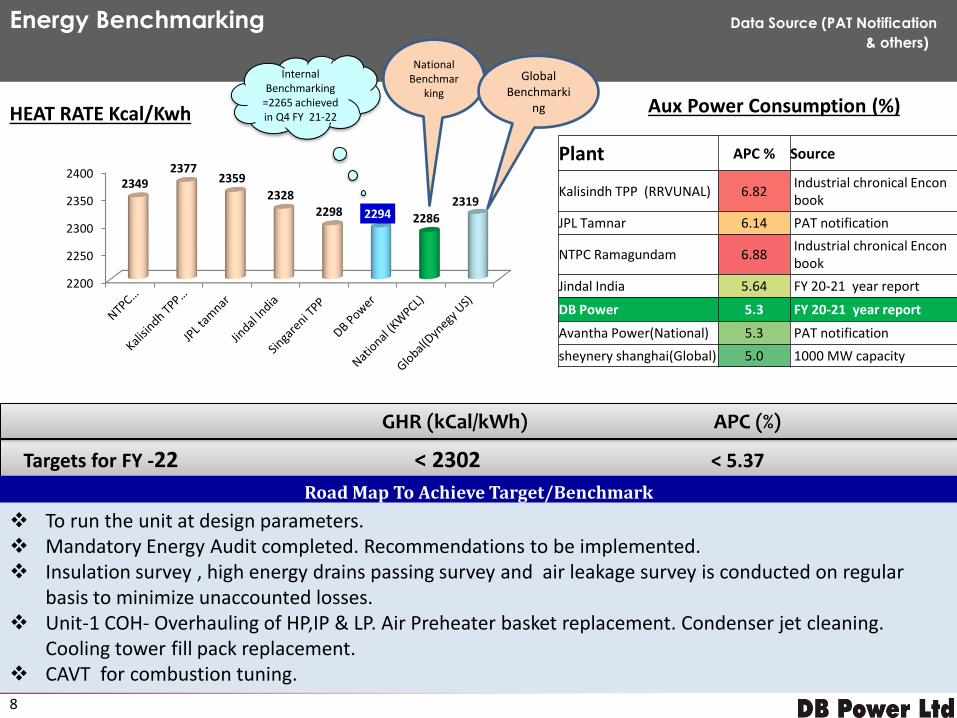
Plant APC % Source
Kalisindh TPP (RRVUNAL) 6.82Industrial chronical Enconbook
JPL Tamnar 6.14 PAT notification
NTPC Ramagundam 6.88Industrial chronical Enconbook
Jindal India 5.64 FY 20-21 year report
DB Power 5.3 FY 20-21 year report
Avantha Power(National) 5.3 PAT notification
sheynery shanghai(Global) 5.0 1000 MW capacity
Targets for FY -22 < 2302 < 5.37
GHR (kCal/kWh) APC (%)
Road Map To Achieve Target/Benchmark
❖ To run the unit at design parameters.❖ Mandatory Energy Audit completed. Recommendations to be implemented.❖ Insulation survey , high energy drains passing survey and air leakage survey is conducted on regular
basis to minimize unaccounted losses.❖ Unit-1 COH- Overhauling of HP,IP & LP. Air Preheater basket replacement. Condenser jet cleaning.
Cooling tower fill pack replacement.❖ CAVT for combustion tuning.
Aux Power Consumption (%)
Energy Benchmarking Data Source (PAT Notification
& others)
2200
2250
2300
2350
24002349
23772359
23282298 2294 2286
2319
HEAT RATE Kcal/Kwh
National Benchmar
king
Internal Benchmarking
=2265 achieved in Q4 FY 21-22
Global Benchmarki
ng
9
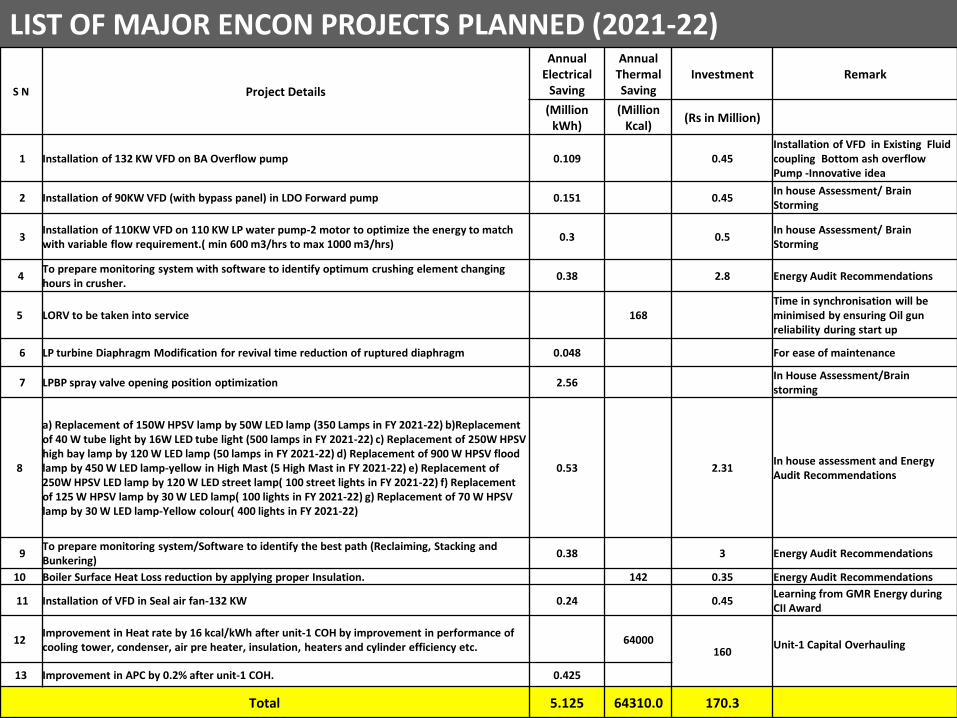
LIST OF MAJOR ENCON PROJECTS PLANNED (2021-22)
S N Project Details
Annual Electrical
Saving
Annual Thermal Saving
Investment Remark
(Million kWh)
(Million Kcal)
(Rs in Million)
1 Installation of 132 KW VFD on BA Overflow pump 0.109 0.45Installation of VFD in Existing Fluid coupling Bottom ash overflow Pump -Innovative idea
2 Installation of 90KW VFD (with bypass panel) in LDO Forward pump 0.151 0.45In house Assessment/ Brain Storming
3Installation of 110KW VFD on 110 KW LP water pump-2 motor to optimize the energy to match with variable flow requirement.( min 600 m3/hrs to max 1000 m3/hrs)
0.3 0.5In house Assessment/ Brain Storming
4To prepare monitoring system with software to identify optimum crushing element changing hours in crusher.
0.38 2.8 Energy Audit Recommendations
5 LORV to be taken into service 168Time in synchronisation will be minimised by ensuring Oil gun reliability during start up
6 LP turbine Diaphragm Modification for revival time reduction of ruptured diaphragm 0.048 For ease of maintenance
7 LPBP spray valve opening position optimization 2.56In House Assessment/Brain storming
8
a) Replacement of 150W HPSV lamp by 50W LED lamp (350 Lamps in FY 2021-22) b)Replacement of 40 W tube light by 16W LED tube light (500 lamps in FY 2021-22) c) Replacement of 250W HPSV high bay lamp by 120 W LED lamp (50 lamps in FY 2021-22) d) Replacement of 900 W HPSV flood lamp by 450 W LED lamp-yellow in High Mast (5 High Mast in FY 2021-22) e) Replacement of 250W HPSV LED lamp by 120 W LED street lamp( 100 street lights in FY 2021-22) f) Replacement of 125 W HPSV lamp by 30 W LED lamp( 100 lights in FY 2021-22) g) Replacement of 70 W HPSV lamp by 30 W LED lamp-Yellow colour( 400 lights in FY 2021-22)
0.53 2.31In house assessment and Energy Audit Recommendations
9To prepare monitoring system/Software to identify the best path (Reclaiming, Stacking and Bunkering)
0.38 3 Energy Audit Recommendations
10 Boiler Surface Heat Loss reduction by applying proper Insulation. 142 0.35 Energy Audit Recommendations
11 Installation of VFD in Seal air fan-132 KW 0.24 0.45Learning from GMR Energy during CII Award
12Improvement in Heat rate by 16 kcal/kWh after unit-1 COH by improvement in performance of cooling tower, condenser, air pre heater, insulation, heaters and cylinder efficiency etc.
64000160
Unit-1 Capital Overhauling
13 Improvement in APC by 0.2% after unit-1 COH. 0.425
Total 5.125 64310.0 170.3
10
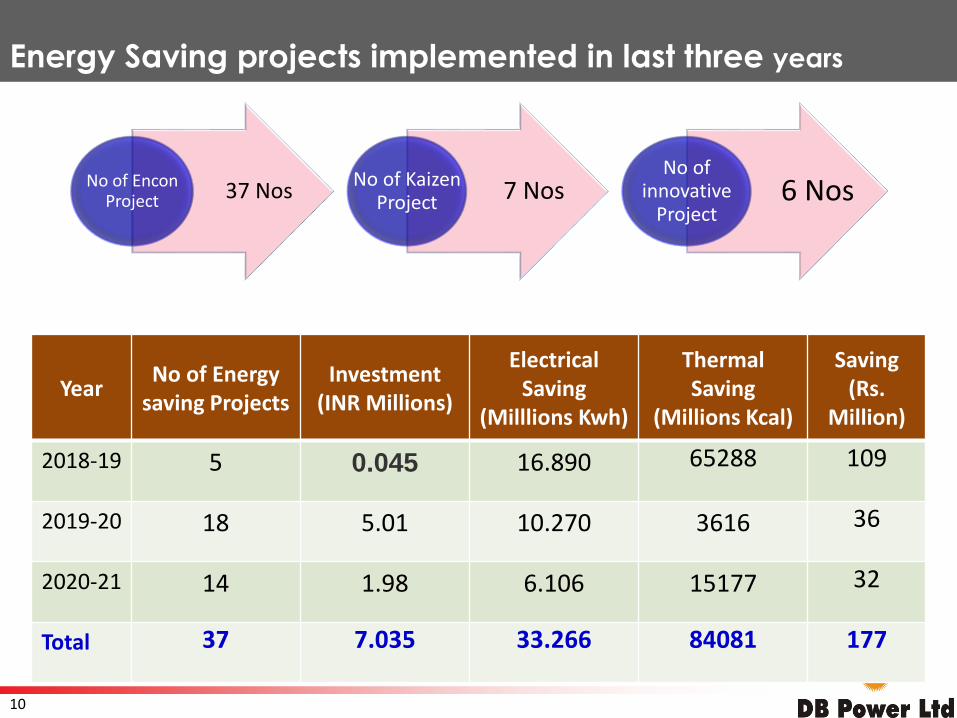
Energy Saving projects implemented in last three years
YearNo of Energy
saving Projects Investment
(INR Millions)
Electrical Saving
(Milllions Kwh)
Thermal Saving
(Millions Kcal)
Saving(Rs.
Million)
2018-19 5 0.045 16.890 65288 109
2019-20 18 5.01 10.270 3616 36
2020-21 14 1.98 6.106 15177 32
Total 37 7.035 33.266 84081 177
37 NosNo of Encon Project 7 NosNo of Kaizen
Project 6 NosNo of
innovative Project
11
INNOVATIVE PROJECTS
12
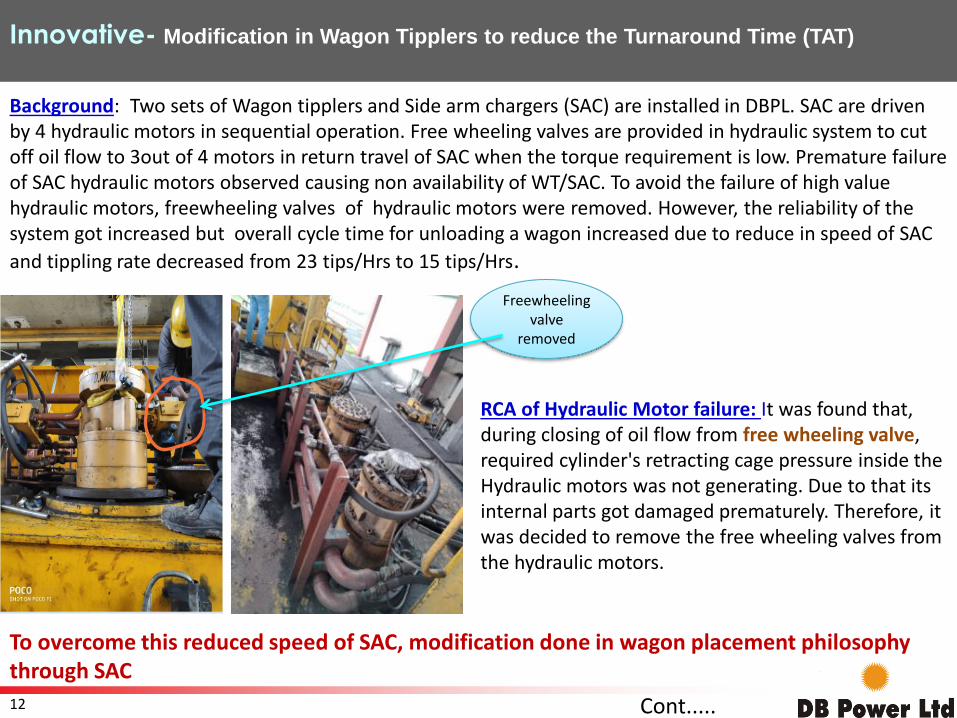
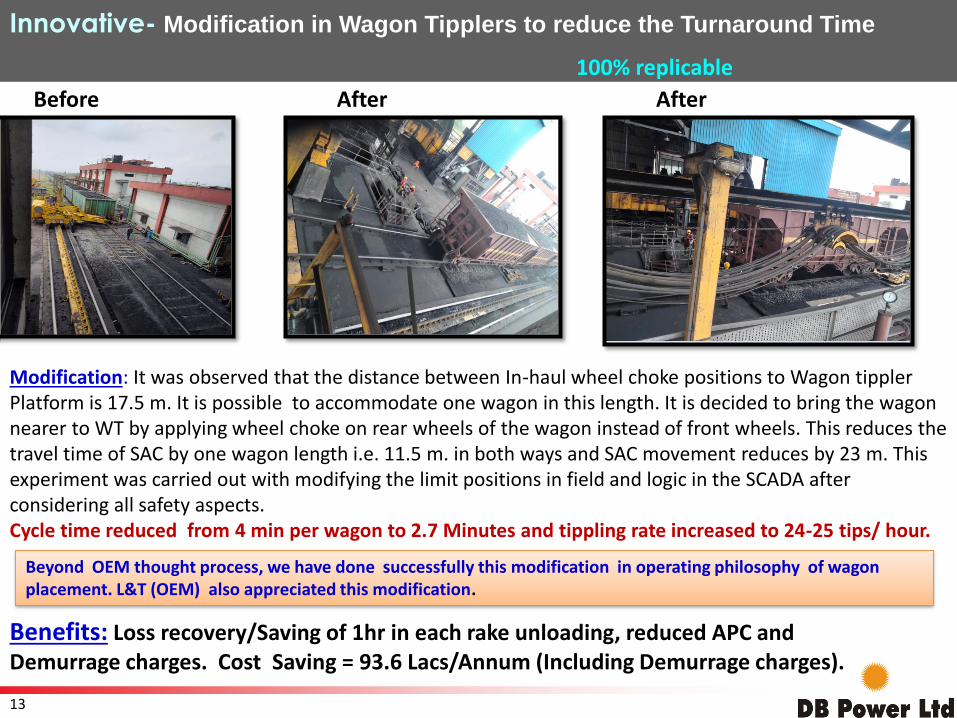
Innovative- Modification in Wagon Tipplers to reduce the Turnaround Time (TAT)
Background: Two sets of Wagon tipplers and Side arm chargers (SAC) are installed in DBPL. SAC are driven by 4 hydraulic motors in sequential operation. Free wheeling valves are provided in hydraulic system to cut off oil flow to 3out of 4 motors in return travel of SAC when the torque requirement is low. Premature failure of SAC hydraulic motors observed causing non availability of WT/SAC. To avoid the failure of high value hydraulic motors, freewheeling valves of hydraulic motors were removed. However, the reliability of the system got increased but overall cycle time for unloading a wagon increased due to reduce in speed of SAC
and tippling rate decreased from 23 tips/Hrs to 15 tips/Hrs.
RCA of Hydraulic Motor failure: It was found that, during closing of oil flow from free wheeling valve, required cylinder's retracting cage pressure inside the Hydraulic motors was not generating. Due to that its internal parts got damaged prematurely. Therefore, it was decided to remove the free wheeling valves from the hydraulic motors.
To overcome this reduced speed of SAC, modification done in wagon placement philosophy through SAC
Freewheeling valve
removed
Cont.....
13
Benefits: Loss recovery/Saving of 1hr in each rake unloading, reduced APC and Demurrage charges. Cost Saving = 93.6 Lacs/Annum (Including Demurrage charges).
Modification: It was observed that the distance between In-haul wheel choke positions to Wagon tippler Platform is 17.5 m. It is possible to accommodate one wagon in this length. It is decided to bring the wagon nearer to WT by applying wheel choke on rear wheels of the wagon instead of front wheels. This reduces the travel time of SAC by one wagon length i.e. 11.5 m. in both ways and SAC movement reduces by 23 m. This experiment was carried out with modifying the limit positions in field and logic in the SCADA after considering all safety aspects.Cycle time reduced from 4 min per wagon to 2.7 Minutes and tippling rate increased to 24-25 tips/ hour.
Innovative- Modification in Wagon Tipplers to reduce the Turnaround Time
100% replicable
Before After After
Beyond OEM thought process, we have done successfully this modification in operating philosophy of wagon placement. L&T (OEM) also appreciated this modification.
14
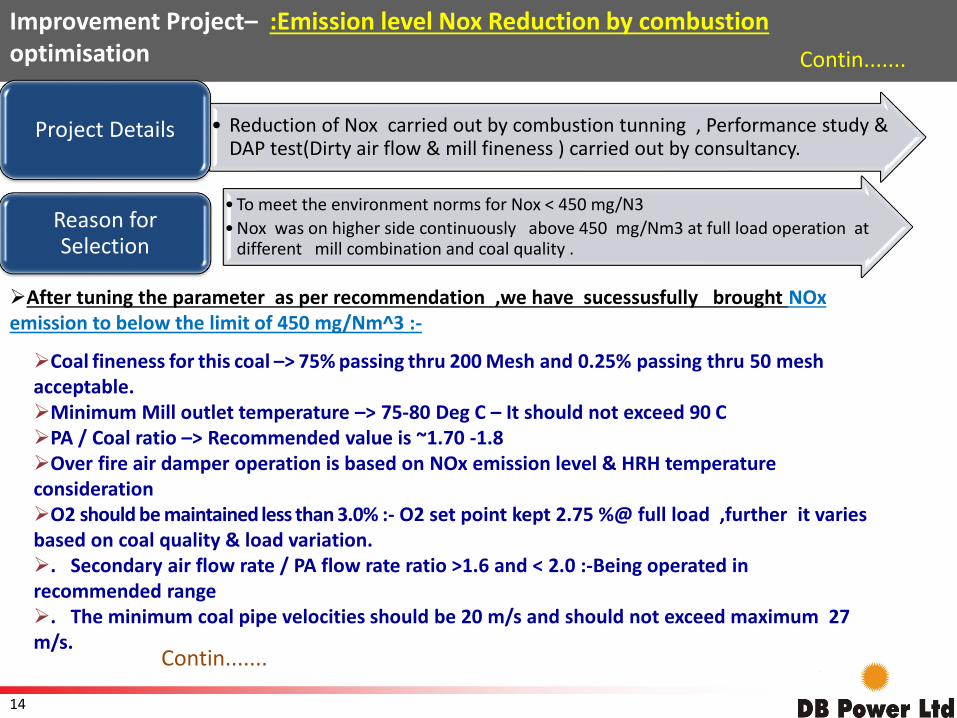
Improvement Project– :Emission level Nox Reduction by combustion optimisation
• Reduction of Nox carried out by combustion tunning , Performance study & DAP test(Dirty air flow & mill fineness ) carried out by consultancy.
Project Details
• To meet the environment norms for Nox < 450 mg/N3
• Nox was on higher side continuously above 450 mg/Nm3 at full load operation at different mill combination and coal quality .
Reason for Selection
➢After tuning the parameter as per recommendation ,we have sucessusfully brought NOxemission to below the limit of 450 mg/Nm^3 :-
➢Coal fineness for this coal –> 75% passing thru 200 Mesh and 0.25% passing thru 50 mesh acceptable.➢Minimum Mill outlet temperature –> 75-80 Deg C – It should not exceed 90 C➢PA / Coal ratio –> Recommended value is ~1.70 -1.8➢Over fire air damper operation is based on NOx emission level & HRH temperature consideration➢O2 should be maintained less than 3.0% :- O2 set point kept 2.75 %@ full load ,further it varies based on coal quality & load variation.➢. Secondary air flow rate / PA flow rate ratio >1.6 and < 2.0 :-Being operated in recommended range➢. The minimum coal pipe velocities should be 20 m/s and should not exceed maximum 27m/s.
Contin.......
Contin.......
15
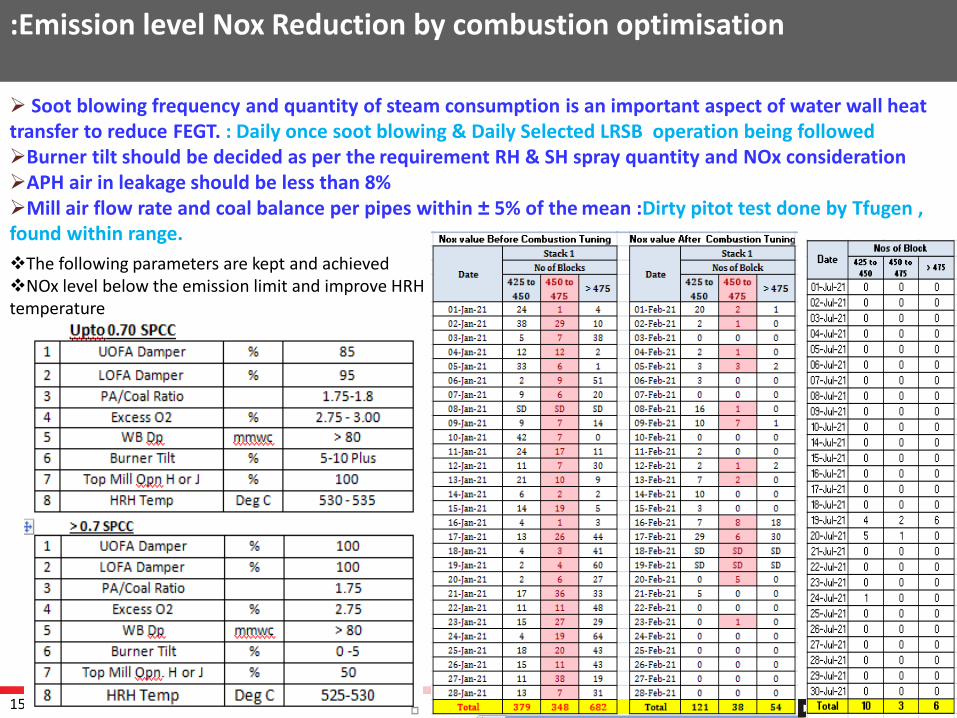
:Emission level Nox Reduction by combustion optimisation
➢ Soot blowing frequency and quantity of steam consumption is an important aspect of water wall heat transfer to reduce FEGT. : Daily once soot blowing & Daily Selected LRSB operation being followed➢Burner tilt should be decided as per the requirement RH & SH spray quantity and NOx consideration➢APH air in leakage should be less than 8%➢Mill air flow rate and coal balance per pipes within ± 5% of the mean :Dirty pitot test done by Tfugen , found within range.
❖The following parameters are kept and achieved ❖NOx level below the emission limit and improve HRH temperature
16
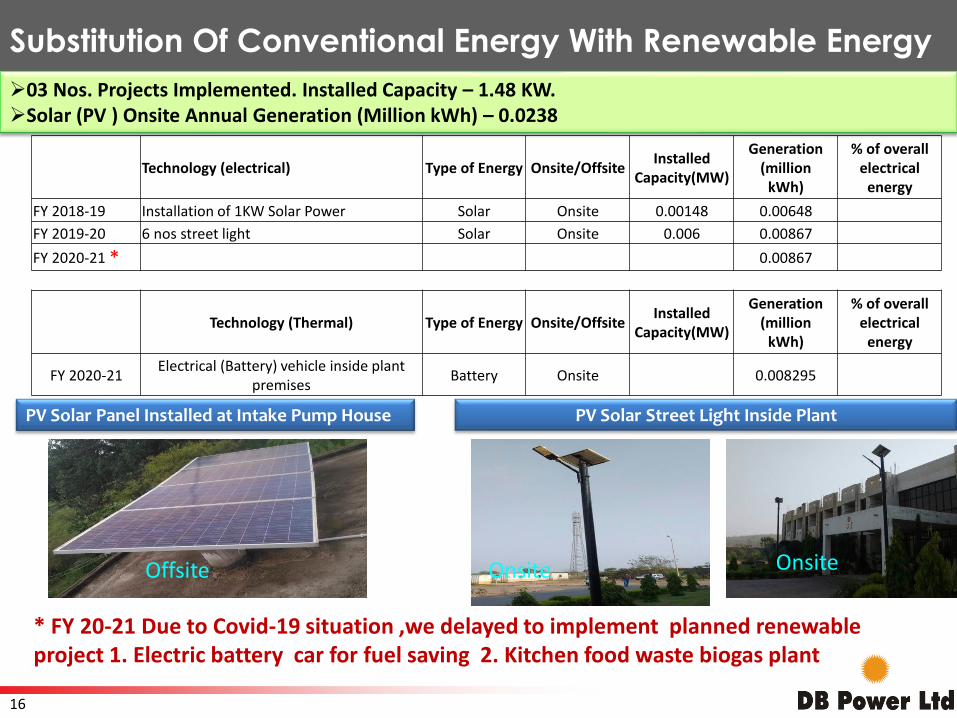
Substitution Of Conventional Energy With Renewable Energy
PV Solar Panel Installed at Intake Pump House PV Solar Street Light Inside Plant
➢03 Nos. Projects Implemented. Installed Capacity – 1.48 KW.➢Solar (PV ) Onsite Annual Generation (Million kWh) – 0.0238
* FY 20-21 Due to Covid-19 situation ,we delayed to implement planned renewable project 1. Electric battery car for fuel saving 2. Kitchen food waste biogas plant
Offsite Onsite Onsite
Technology (electrical) Type of Energy Onsite/OffsiteInstalled
Capacity(MW)
Generation(million
kWh)
% of overallelectrical
energy
FY 2018-19 Installation of 1KW Solar Power Solar Onsite 0.00148 0.00648
FY 2019-20 6 nos street light Solar Onsite 0.006 0.00867
FY 2020-21 * 0.00867
Technology (Thermal) Type of Energy Onsite/OffsiteInstalled
Capacity(MW)
Generation(million
kWh)
% of overallelectrical
energy
FY 2020-21Electrical (Battery) vehicle inside plant
premisesBattery Onsite 0.008295
17
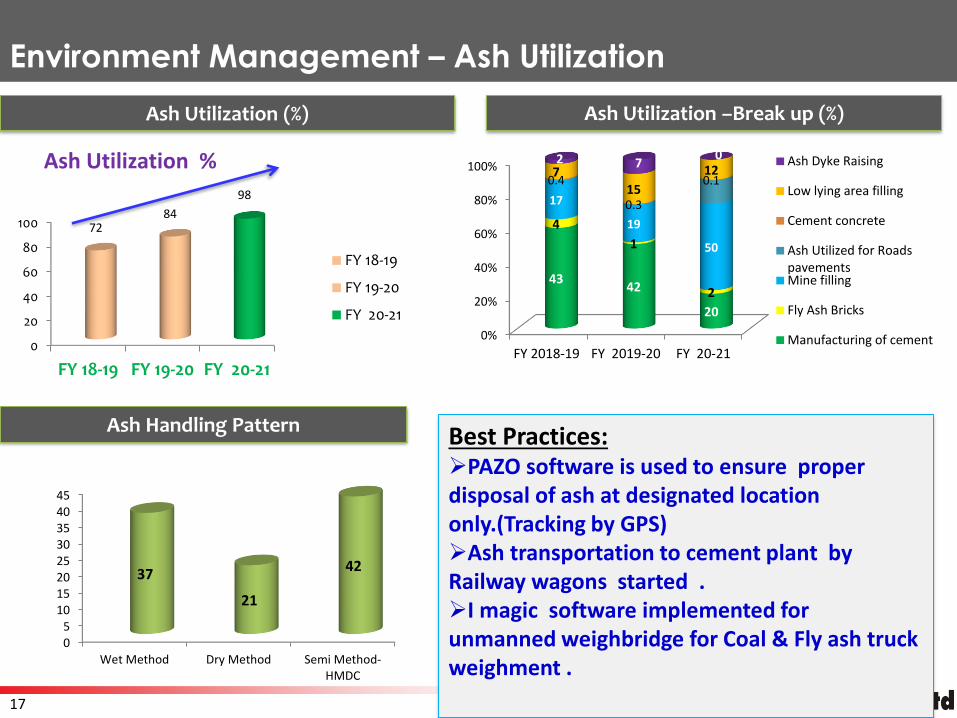
Environment Management – Ash Utilization
Ash Utilization –Break up (%)Ash Utilization (%)
Ash Handling Pattern
0
20
40
60
80
100
FY 18-19 FY 19-20 FY 20-21
7284
98
Ash Utilization %
FY 18-19
FY 19-20
FY 20-210%
20%
40%
60%
80%
100%
FY 2018-19 FY 2019-20 FY 20-21
4342
20
4
1
2
17
19
50
0.4
0.3
0.17
15
122 7
0 Ash Dyke Raising
Low lying area filling
Cement concrete
Ash Utilized for RoadspavementsMine filling
Fly Ash Bricks
Manufacturing of cement
05
1015202530354045
Wet Method Dry Method Semi Method-HMDC
37
21
42
Best Practices: ➢PAZO software is used to ensure proper disposal of ash at designated location only.(Tracking by GPS)➢Ash transportation to cement plant by Railway wagons started .➢I magic software implemented for unmanned weighbridge for Coal & Fly ash truck weighment .
18
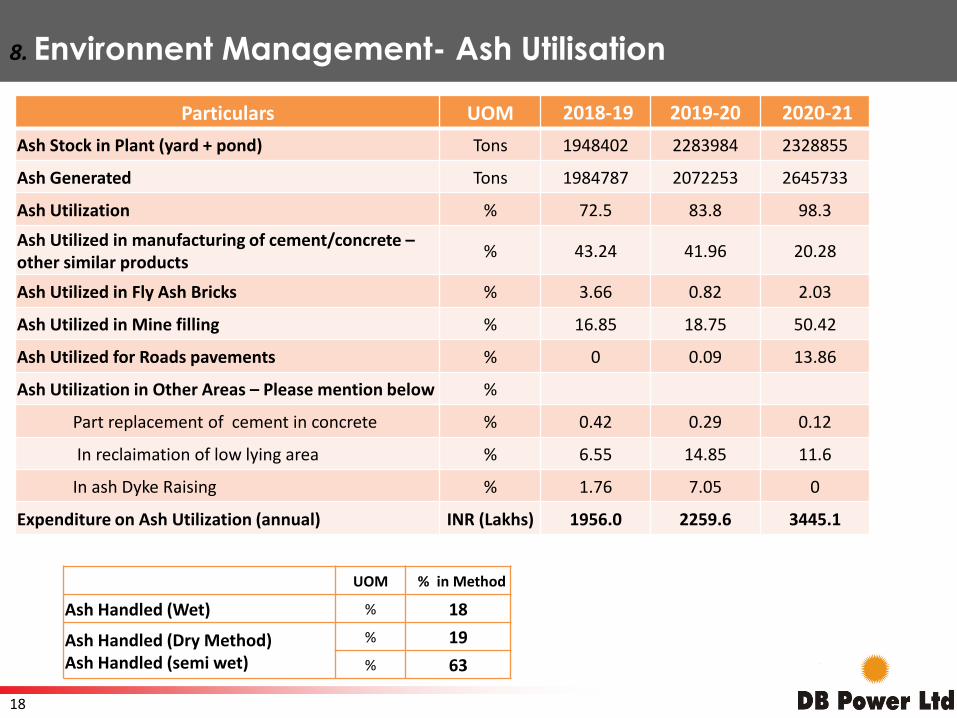
Particulars UOM 2018-19 2019-20 2020-21
Ash Stock in Plant (yard + pond) Tons 1948402 2283984 2328855
Ash Generated Tons 1984787 2072253 2645733
Ash Utilization % 72.5 83.8 98.3
Ash Utilized in manufacturing of cement/concrete –other similar products
% 43.24 41.96 20.28
Ash Utilized in Fly Ash Bricks % 3.66 0.82 2.03
Ash Utilized in Mine filling % 16.85 18.75 50.42
Ash Utilized for Roads pavements % 0 0.09 13.86
Ash Utilization in Other Areas – Please mention below %
Part replacement of cement in concrete % 0.42 0.29 0.12
In reclaimation of low lying area % 6.55 14.85 11.6
In ash Dyke Raising % 1.76 7.05 0
Expenditure on Ash Utilization (annual) INR (Lakhs) 1956.0 2259.6 3445.1
UOM % in Method
Ash Handled (Wet) % 18
Ash Handled (Dry Method)Ash Handled (semi wet)
% 19
% 63
8. Environnent Management- Ash Utilisation
19
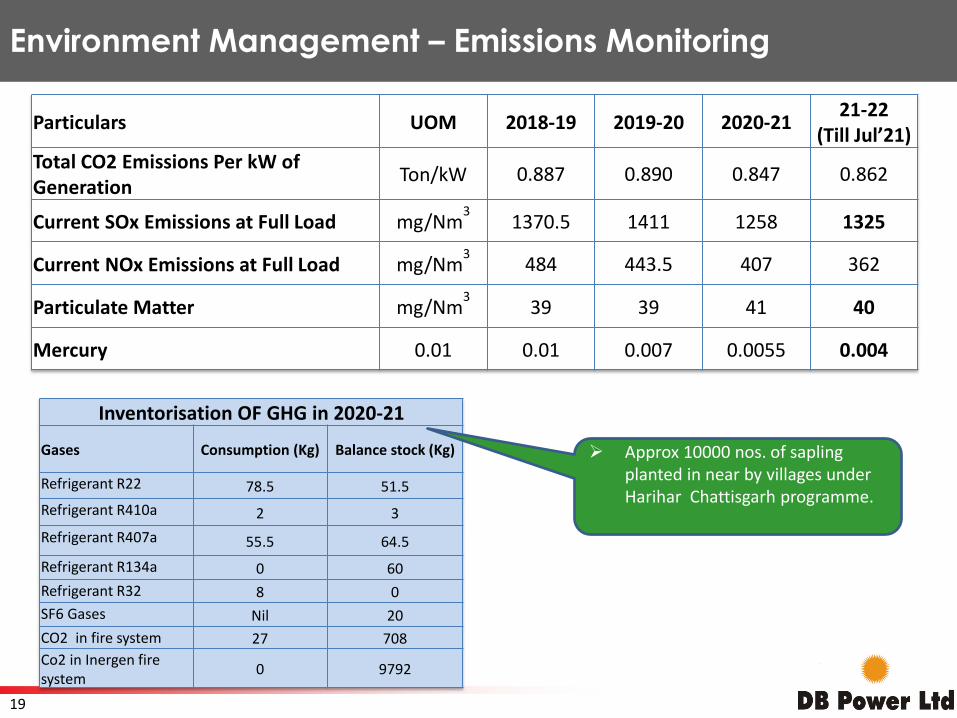
Environment Management – Emissions Monitoring
Particulars UOM 2018-19 2019-20 2020-2121-22
(Till Jul’21)Total CO2 Emissions Per kW of Generation
Ton/kW 0.887 0.890 0.847 0.862
Current SOx Emissions at Full Load mg/Nm3
1370.5 1411 1258 1325
Current NOx Emissions at Full Load mg/Nm3
484 443.5 407 362
Particulate Matter mg/Nm3
39 39 41 40
Mercury 0.01 0.01 0.007 0.0055 0.004
Inventorisation OF GHG in 2020-21
Gases Consumption (Kg) Balance stock (Kg)
Refrigerant R22 78.5 51.5
Refrigerant R410a 2 3
Refrigerant R407a 55.5 64.5
Refrigerant R134a 0 60
Refrigerant R32 8 0
SF6 Gases Nil 20
CO2 in fire system 27 708
Co2 in Inergen fire system
0 9792
➢ Approx 10000 nos. of sapling planted in near by villages under Harihar Chattisgarh programme.
20
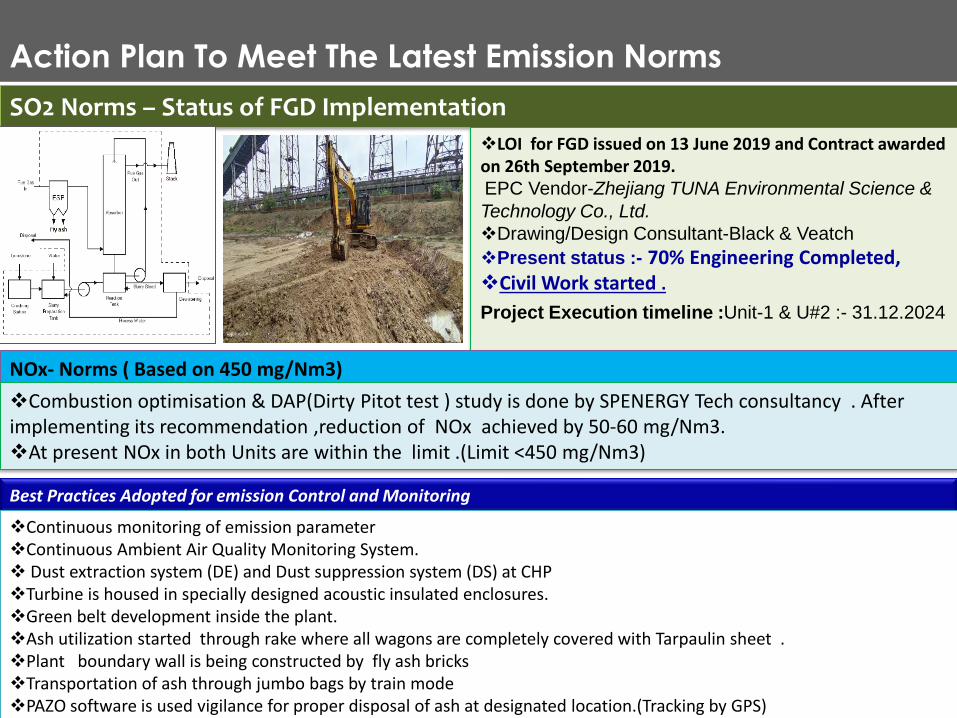
Action Plan To Meet The Latest Emission Norms
SO2 Norms – Status of FGD Implementation
❖LOI for FGD issued on 13 June 2019 and Contract awarded on 26th September 2019.EPC Vendor-Zhejiang TUNA Environmental Science &
Technology Co., Ltd.
❖Drawing/Design Consultant-Black & Veatch
❖Present status :- 70% Engineering Completed, ❖Civil Work started .
Project Execution timeline :Unit-1 & U#2 :- 31.12.2024
NOx- Norms ( Based on 450 mg/Nm3)
❖Combustion optimisation & DAP(Dirty Pitot test ) study is done by SPENERGY Tech consultancy . After implementing its recommendation ,reduction of NOx achieved by 50-60 mg/Nm3. ❖At present NOx in both Units are within the limit .(Limit <450 mg/Nm3)
28
Best Practices Adopted for emission Control and Monitoring
❖Continuous monitoring of emission parameter❖Continuous Ambient Air Quality Monitoring System.❖ Dust extraction system (DE) and Dust suppression system (DS) at CHP❖Turbine is housed in specially designed acoustic insulated enclosures.❖Green belt development inside the plant.❖Ash utilization started through rake where all wagons are completely covered with Tarpaulin sheet .❖Plant boundary wall is being constructed by fly ash bricks❖Transportation of ash through jumbo bags by train mode❖PAZO software is used vigilance for proper disposal of ash at designated location.(Tracking by GPS)
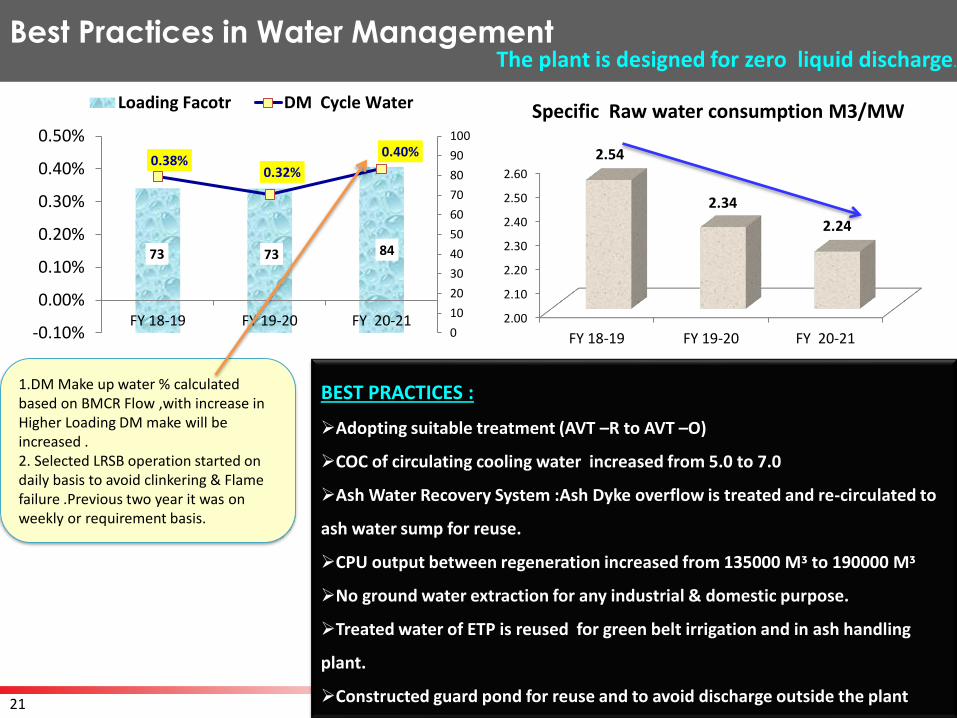
21
73 73 84
0.38%0.32%
0.40%
0
10
20
30
40
50
60
70
80
90
100
-0.10%
0.00%
0.10%
0.20%
0.30%
0.40%
0.50%
FY 18-19 FY 19-20 FY 20-21
Loading Facotr DM Cycle Water
1.DM Make up water % calculated based on BMCR Flow ,with increase in Higher Loading DM make will be increased .2. Selected LRSB operation started on daily basis to avoid clinkering & Flame failure .Previous two year it was on weekly or requirement basis.
2.00
2.10
2.20
2.30
2.40
2.50
2.60
FY 18-19 FY 19-20 FY 20-21
2.54
2.34
2.24
Specific Raw water consumption M3/MW
The plant is designed for zero liquid discharge.
Best Practices in Water Management
BEST PRACTICES :
➢Adopting suitable treatment (AVT –R to AVT –O)
➢COC of circulating cooling water increased from 5.0 to 7.0
➢Ash Water Recovery System :Ash Dyke overflow is treated and re-circulated to
ash water sump for reuse.
➢CPU output between regeneration increased from 135000 Mᶾ to 190000 Mᶾ
➢No ground water extraction for any industrial & domestic purpose.
➢Treated water of ETP is reused for green belt irrigation and in ash handling
plant.
➢Constructed guard pond for reuse and to avoid discharge outside the plant
22
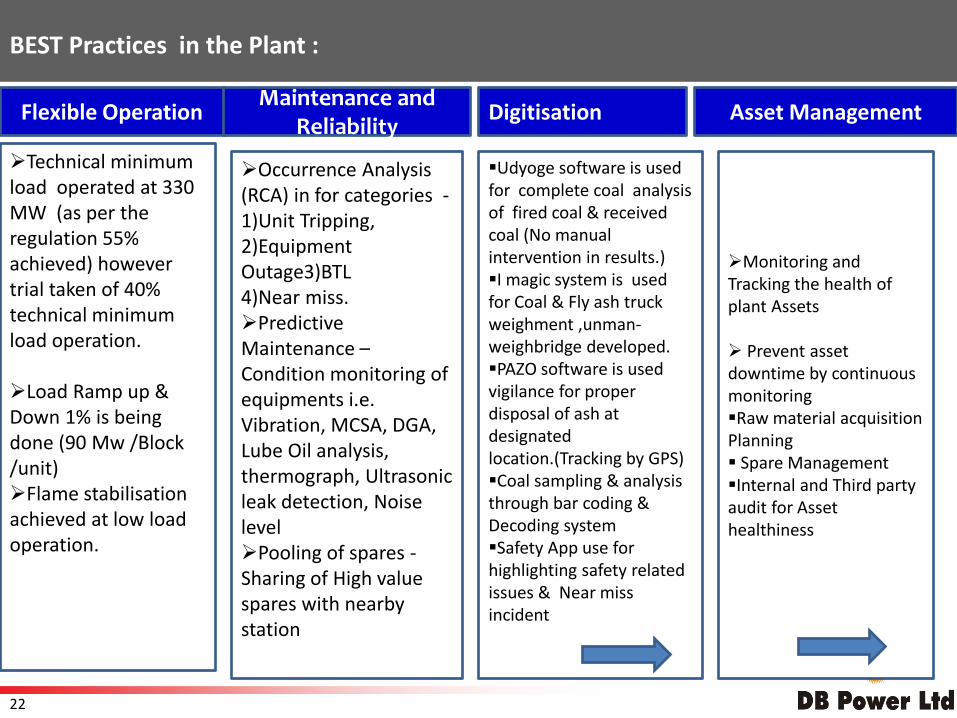
Flexible OperationMaintenance and
Reliability Digitisation Asset Management
➢Technical minimum load operated at 330 MW (as per the regulation 55% achieved) however trial taken of 40% technical minimum load operation.
➢Load Ramp up & Down 1% is being done (90 Mw /Block /unit)➢Flame stabilisation achieved at low load operation.
➢Occurrence Analysis (RCA) in for categories -1)Unit Tripping, 2)Equipment Outage3)BTL 4)Near miss.➢Predictive Maintenance –Condition monitoring of equipments i.e. Vibration, MCSA, DGA, Lube Oil analysis, thermograph, Ultrasonic leak detection, Noise level➢Pooling of spares -Sharing of High value spares with nearby station
▪Udyoge software is used for complete coal analysis of fired coal & received coal (No manual intervention in results.)▪I magic system is used for Coal & Fly ash truck weighment ,unman-weighbridge developed.▪PAZO software is used vigilance for proper disposal of ash at designated location.(Tracking by GPS)▪Coal sampling & analysis through bar coding & Decoding system▪Safety App use for highlighting safety related issues & Near miss incident
➢Monitoring and Tracking the health of plant Assets
➢ Prevent asset downtime by continuous monitoring ▪Raw material acquisition Planning▪ Spare Management▪Internal and Third party audit for Asset healthiness
BEST Practices in the Plant :
23
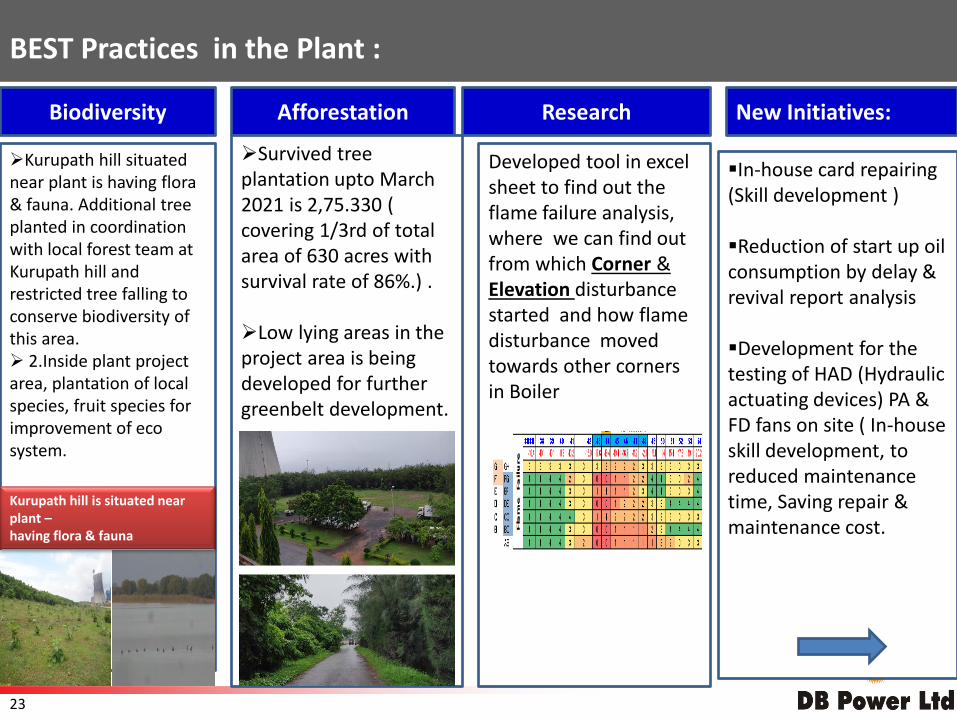
Biodiversity Afforestation New Initiatives:
➢Kurupath hill situated near plant is having flora & fauna. Additional tree planted in coordination with local forest team at Kurupath hill and restricted tree falling to conserve biodiversity of this area.➢ 2.Inside plant project area, plantation of local species, fruit species for improvement of eco system.
➢Survived tree plantation upto March 2021 is 2,75.330 ( covering 1/3rd of total area of 630 acres with survival rate of 86%.) .
➢Low lying areas in the project area is being developed for further greenbelt development.
▪In-house card repairing (Skill development )
▪Reduction of start up oil consumption by delay & revival report analysis
▪Development for the testing of HAD (Hydraulic actuating devices) PA & FD fans on site ( In-house skill development, to reduced maintenance time, Saving repair & maintenance cost.
Research
Developed tool in excel sheet to find out the flame failure analysis, where we can find out from which Corner & Elevation disturbance started and how flame disturbance moved towards other corners in Boiler
Kurupath hill is situated near plant –having flora & fauna
BEST Practices in the Plant :
24
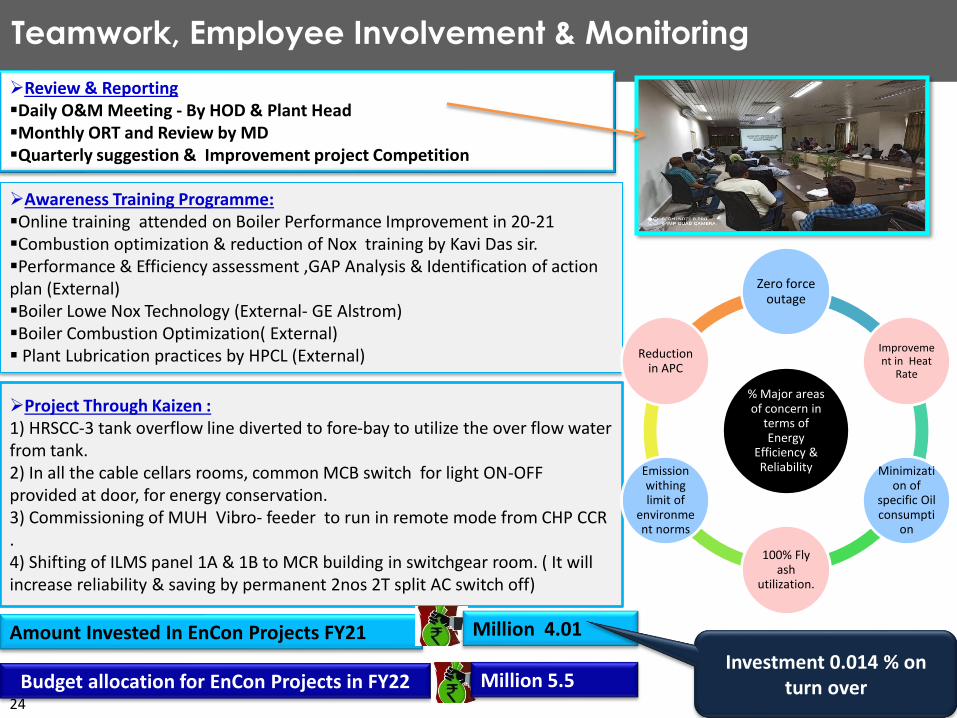
➢Review & Reporting▪Daily O&M Meeting - By HOD & Plant Head▪Monthly ORT and Review by MD ▪Quarterly suggestion & Improvement project Competition
➢Awareness Training Programme: ▪Online training attended on Boiler Performance Improvement in 20-21▪Combustion optimization & reduction of Nox training by Kavi Das sir.▪Performance & Efficiency assessment ,GAP Analysis & Identification of action plan (External)▪Boiler Lowe Nox Technology (External- GE Alstrom)▪Boiler Combustion Optimization( External)▪ Plant Lubrication practices by HPCL (External)
➢Project Through Kaizen : 1) HRSCC-3 tank overflow line diverted to fore-bay to utilize the over flow water from tank.2) In all the cable cellars rooms, common MCB switch for light ON-OFF provided at door, for energy conservation.3) Commissioning of MUH Vibro- feeder to run in remote mode from CHP CCR .4) Shifting of ILMS panel 1A & 1B to MCR building in switchgear room. ( It will increase reliability & saving by permanent 2nos 2T split AC switch off)
% Major areas of concern in
terms of Energy
Efficiency & Reliability
Zero force outage
Improvement in Heat
Rate
Minimization of
specific Oil consumpti
on
100% Fly ash
utilization.
Emission withinglimit of
environment norms
Reduction in APC
Teamwork, Employee Involvement & Monitoring
Amount Invested In EnCon Projects FY21 Million 4.01
Budget allocation for EnCon Projects in FY22 Million 5.5Investment 0.014 % on
turn over
25
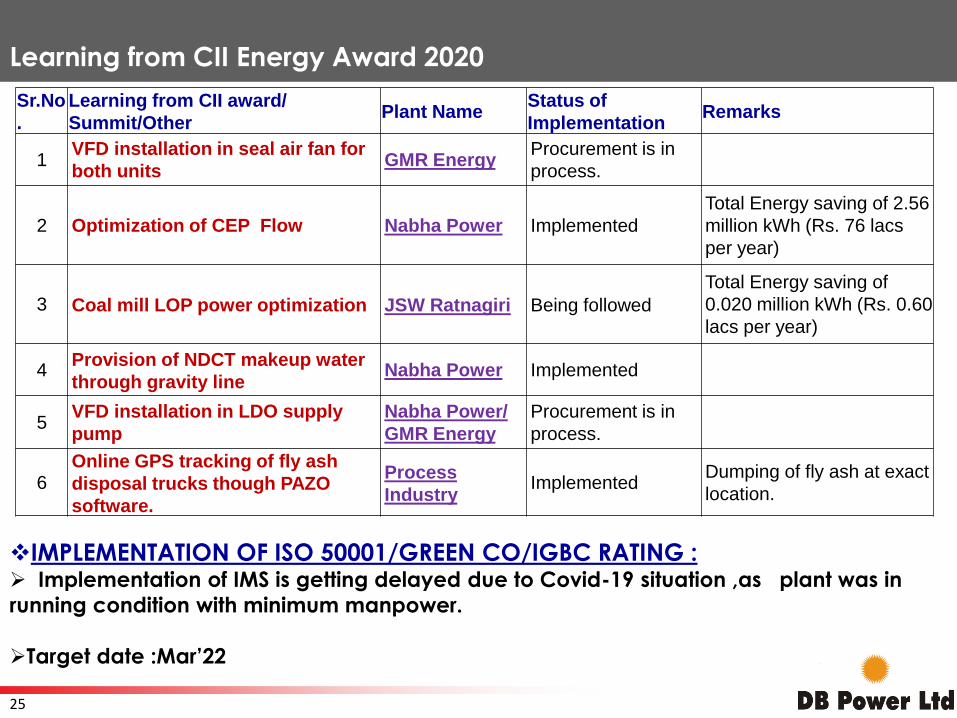
Learning from CII Energy Award 2020
Sr.No
.
Learning from CII award/
Summit/OtherPlant Name
Status of
Implementation Remarks
1VFD installation in seal air fan for
both units GMR Energy
Procurement is in
process.
2 Optimization of CEP Flow Nabha Power Implemented
Total Energy saving of 2.56
million kWh (Rs. 76 lacs
per year)
3 Coal mill LOP power optimization JSW Ratnagiri Being followed
Total Energy saving of
0.020 million kWh (Rs. 0.60
lacs per year)
4Provision of NDCT makeup water
through gravity lineNabha Power Implemented
5VFD installation in LDO supply
pump
Nabha Power/
GMR Energy
Procurement is in
process.
6Online GPS tracking of fly ash
disposal trucks though PAZO
software.
Process
IndustryImplemented
Dumping of fly ash at exact
location.
❖IMPLEMENTATION OF ISO 50001/GREEN CO/IGBC RATING :➢ Implementation of IMS is getting delayed due to Covid-19 situation ,as plant was in
running condition with minimum manpower.
➢Target date :Mar’22
26
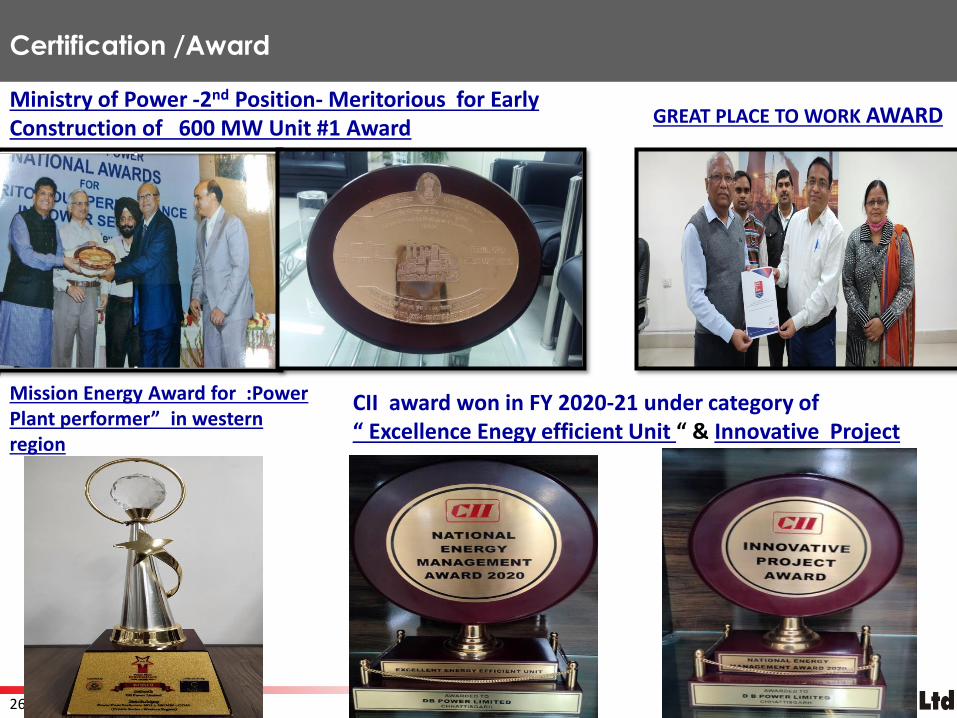
Certification /Award
Ministry of Power -2nd Position- Meritorious for Early Construction of 600 MW Unit #1 Award
Mission Energy Award for :Power Plant performer” in western region
GREAT PLACE TO WORK AWARD
CII award won in FY 2020-21 under category of “ Excellence Enegy efficient Unit “ & Innovative Project
27
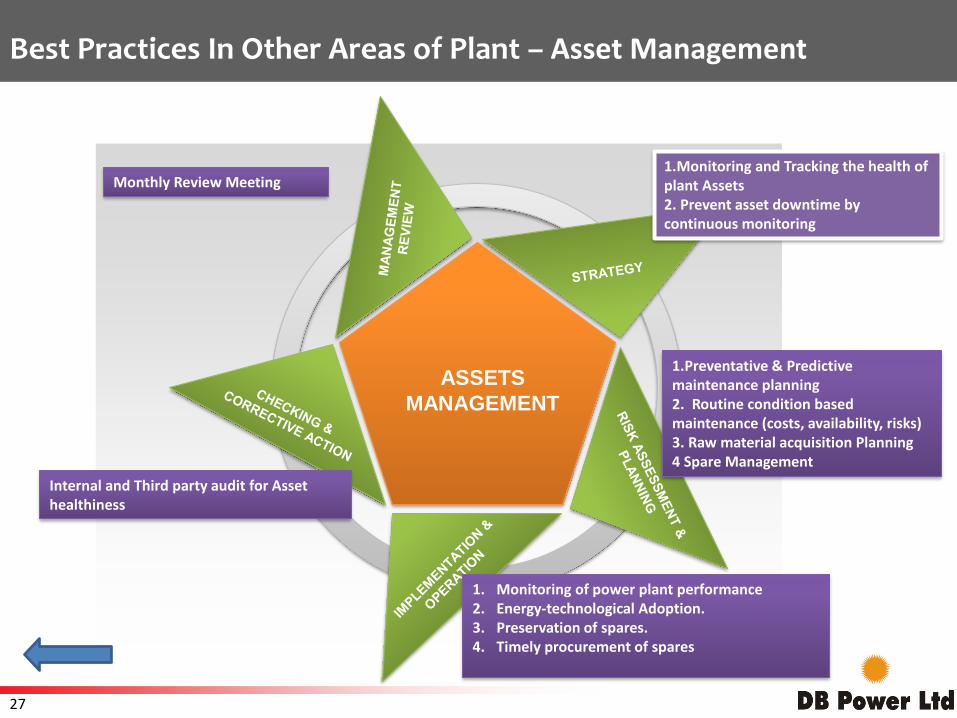
ASSETS
MANAGEMENT
1.Monitoring and Tracking the health of plant Assets2. Prevent asset downtime by continuous monitoring
1.Preventative & Predictive maintenance planning2. Routine condition based maintenance (costs, availability, risks) 3. Raw material acquisition Planning4 Spare Management
1. Monitoring of power plant performance2. Energy-technological Adoption.3. Preservation of spares.4. Timely procurement of spares
Internal and Third party audit for Asset healthiness
Monthly Review Meeting
Best Practices In Other Areas of Plant – Asset Management
28
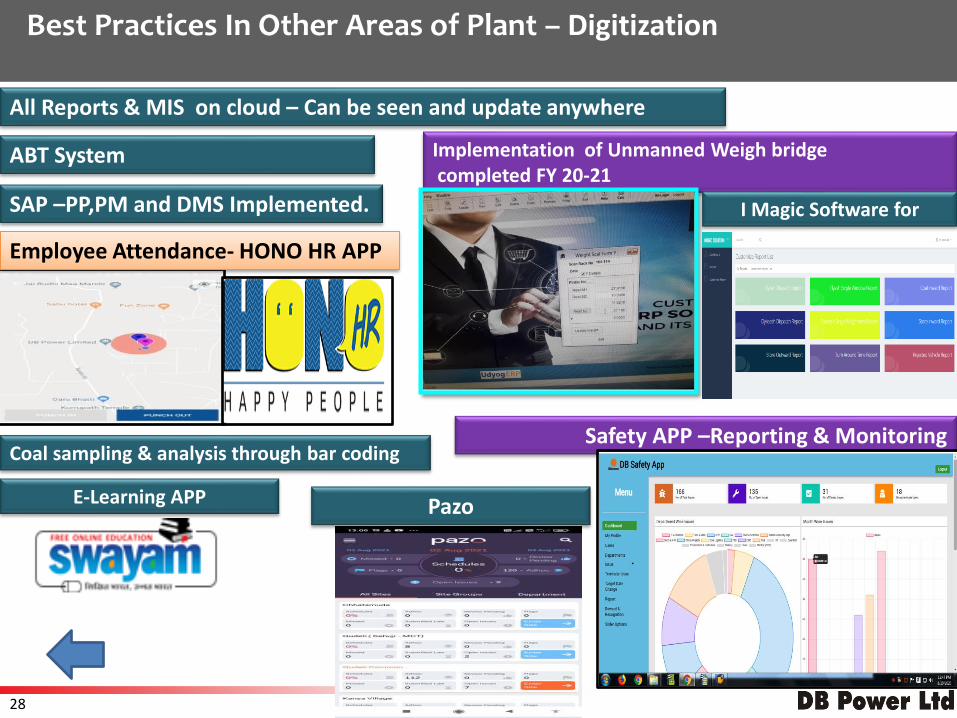
All Reports & MIS on cloud – Can be seen and update anywhere
Employee Attendance- HONO HR APP
Coal sampling & analysis through bar codingSafety APP –Reporting & Monitoring
SAP –PP,PM and DMS Implemented.
ABT System Implementation of Unmanned Weigh bridgecompleted FY 20-21
Best Practices In Other Areas of Plant – Digitization
E-Learning APP Pazo
I Magic Software for
29
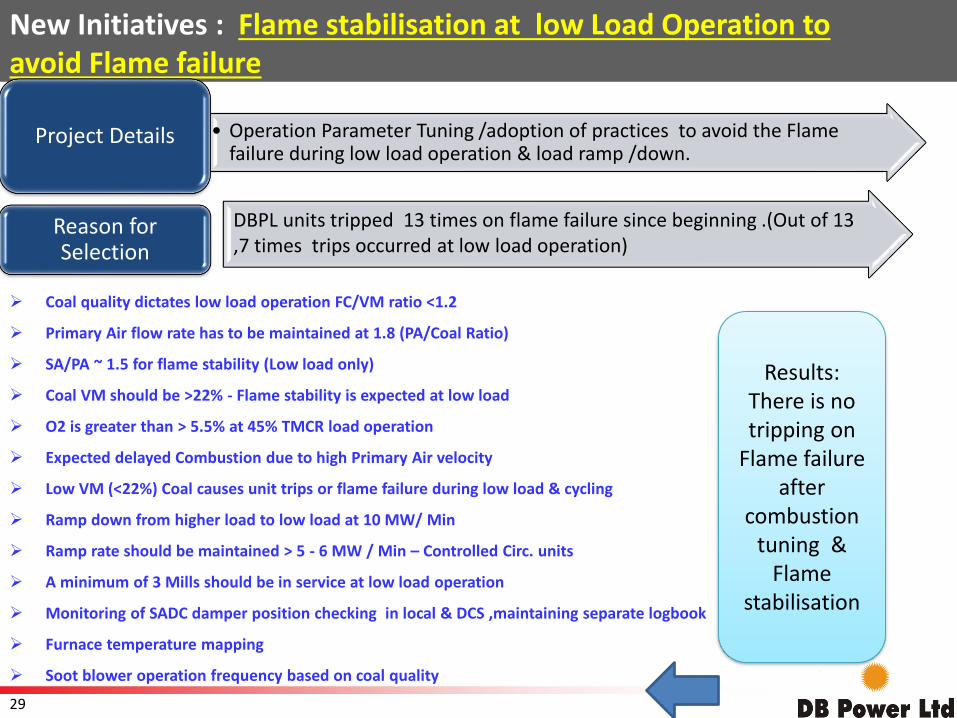
New Initiatives : Flame stabilisation at low Load Operation to avoid Flame failure
• Operation Parameter Tuning /adoption of practices to avoid the Flame failure during low load operation & load ramp /down.
Project Details
DBPL units tripped 13 times on flame failure since beginning .(Out of 13 ,7 times trips occurred at low load operation)
Reason for Selection
➢ Coal quality dictates low load operation FC/VM ratio <1.2
➢ Primary Air flow rate has to be maintained at 1.8 (PA/Coal Ratio)
➢ SA/PA ~ 1.5 for flame stability (Low load only)
➢ Coal VM should be >22% - Flame stability is expected at low load
➢ O2 is greater than > 5.5% at 45% TMCR load operation
➢ Expected delayed Combustion due to high Primary Air velocity
➢ Low VM (<22%) Coal causes unit trips or flame failure during low load & cycling
➢ Ramp down from higher load to low load at 10 MW/ Min
➢ Ramp rate should be maintained > 5 - 6 MW / Min – Controlled Circ. units
➢ A minimum of 3 Mills should be in service at low load operation
➢ Monitoring of SADC damper position checking in local & DCS ,maintaining separate logbook
➢ Furnace temperature mapping
➢ Soot blower operation frequency based on coal quality
Results: There is no tripping on
Flame failure after
combustion tuning &
Flame stabilisation
30
Thank You
31
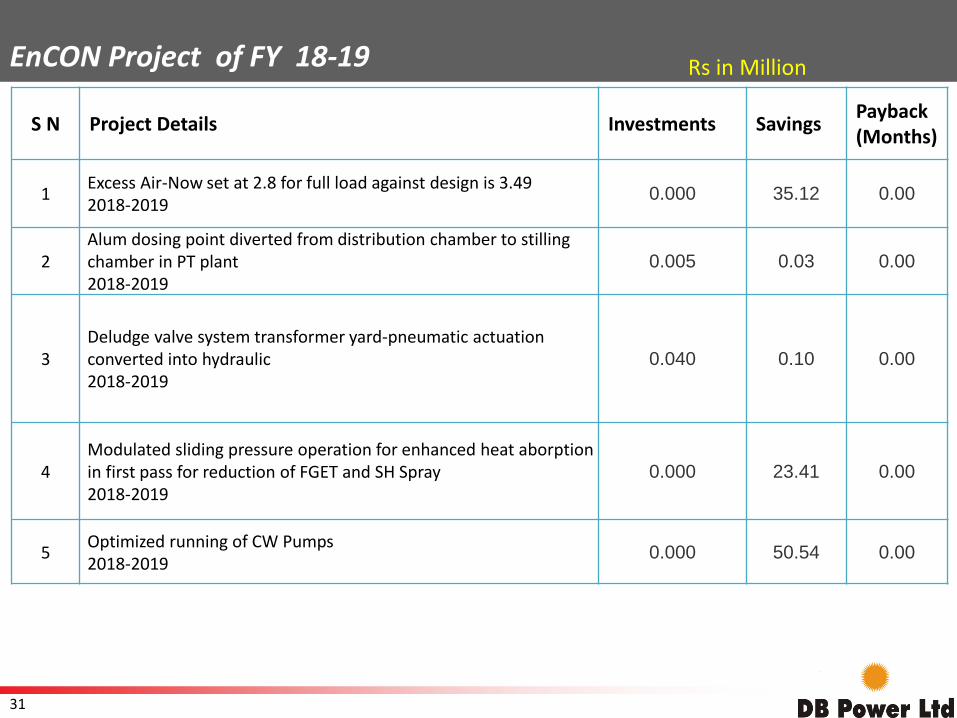
EnCON Project of FY 18-19 Rs in Million
S N Project Details Investments SavingsPayback (Months)
1Excess Air-Now set at 2.8 for full load against design is 3.492018-2019
0.000 35.12 0.00
2Alum dosing point diverted from distribution chamber to stilling chamber in PT plant2018-2019
0.005 0.03 0.00
3Deludge valve system transformer yard-pneumatic actuation converted into hydraulic2018-2019
0.040 0.10 0.00
4Modulated sliding pressure operation for enhanced heat aborption in first pass for reduction of FGET and SH Spray2018-2019
0.000 23.41 0.00
5Optimized running of CW Pumps2018-2019
0.000 50.54 0.00
32
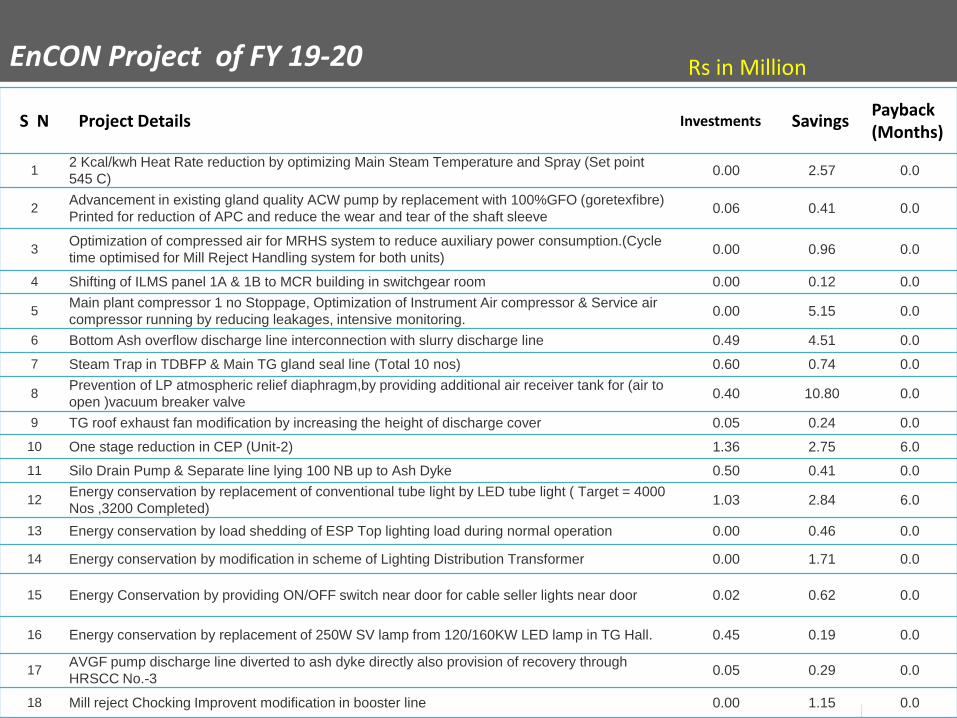
EnCON Project of FY 19-20
S N Project Details Investments SavingsPayback (Months)
12 Kcal/kwh Heat Rate reduction by optimizing Main Steam Temperature and Spray (Set point
545 C)0.00 2.57 0.0
2Advancement in existing gland quality ACW pump by replacement with 100%GFO (goretexfibre)
Printed for reduction of APC and reduce the wear and tear of the shaft sleeve0.06 0.41 0.0
3Optimization of compressed air for MRHS system to reduce auxiliary power consumption.(Cycle
time optimised for Mill Reject Handling system for both units)0.00 0.96 0.0
4 Shifting of ILMS panel 1A & 1B to MCR building in switchgear room 0.00 0.12 0.0
5Main plant compressor 1 no Stoppage, Optimization of Instrument Air compressor & Service air
compressor running by reducing leakages, intensive monitoring.0.00 5.15 0.0
6 Bottom Ash overflow discharge line interconnection with slurry discharge line 0.49 4.51 0.0
7 Steam Trap in TDBFP & Main TG gland seal line (Total 10 nos) 0.60 0.74 0.0
8Prevention of LP atmospheric relief diaphragm,by providing additional air receiver tank for (air to
open )vacuum breaker valve0.40 10.80 0.0
9 TG roof exhaust fan modification by increasing the height of discharge cover 0.05 0.24 0.0
10 One stage reduction in CEP (Unit-2) 1.36 2.75 6.0
11 Silo Drain Pump & Separate line lying 100 NB up to Ash Dyke 0.50 0.41 0.0
12Energy conservation by replacement of conventional tube light by LED tube light ( Target = 4000
Nos ,3200 Completed)1.03 2.84 6.0
13 Energy conservation by load shedding of ESP Top lighting load during normal operation 0.00 0.46 0.0
14 Energy conservation by modification in scheme of Lighting Distribution Transformer 0.00 1.71 0.0
15 Energy Conservation by providing ON/OFF switch near door for cable seller lights near door 0.02 0.62 0.0
16 Energy conservation by replacement of 250W SV lamp from 120/160KW LED lamp in TG Hall. 0.45 0.19 0.0
17AVGF pump discharge line diverted to ash dyke directly also provision of recovery through
HRSCC No.-30.05 0.29 0.0
18 Mill reject Chocking Improvent modification in booster line 0.00 1.15 0.0
Rs in Million
33
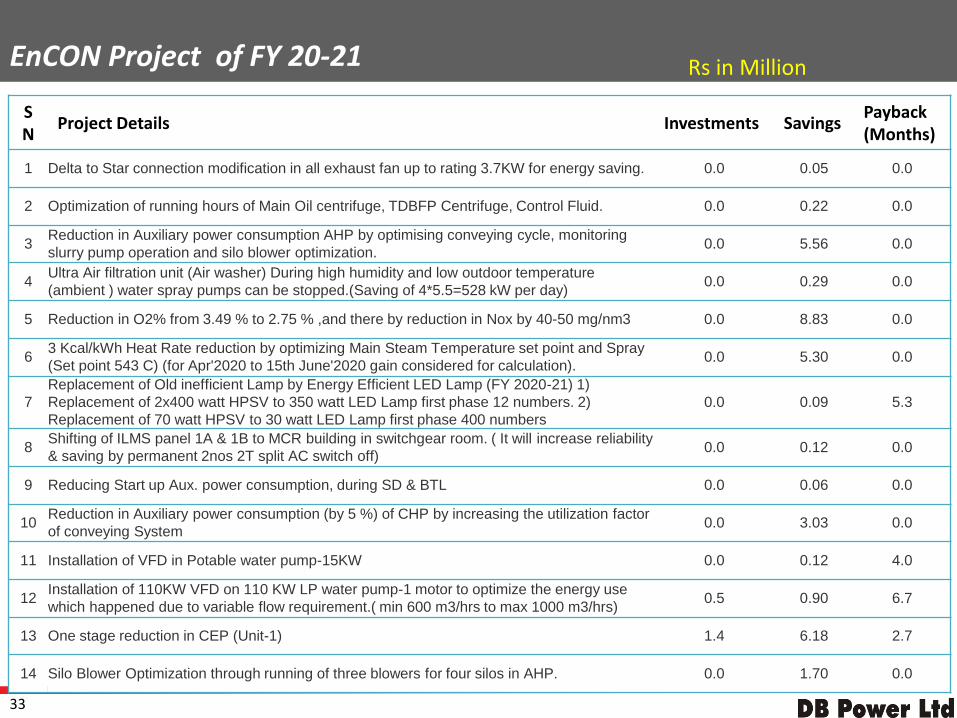
EnCON Project of FY 20-21
SN
Project Details Investments SavingsPayback (Months)
1 Delta to Star connection modification in all exhaust fan up to rating 3.7KW for energy saving. 0.0 0.05 0.0
2 Optimization of running hours of Main Oil centrifuge, TDBFP Centrifuge, Control Fluid. 0.0 0.22 0.0
3Reduction in Auxiliary power consumption AHP by optimising conveying cycle, monitoring
slurry pump operation and silo blower optimization.0.0 5.56 0.0
4Ultra Air filtration unit (Air washer) During high humidity and low outdoor temperature
(ambient ) water spray pumps can be stopped.(Saving of 4*5.5=528 kW per day)0.0 0.29 0.0
5 Reduction in O2% from 3.49 % to 2.75 % ,and there by reduction in Nox by 40-50 mg/nm3 0.0 8.83 0.0
63 Kcal/kWh Heat Rate reduction by optimizing Main Steam Temperature set point and Spray
(Set point 543 C) (for Apr'2020 to 15th June'2020 gain considered for calculation).0.0 5.30 0.0
7
Replacement of Old inefficient Lamp by Energy Efficient LED Lamp (FY 2020-21) 1)
Replacement of 2x400 watt HPSV to 350 watt LED Lamp first phase 12 numbers. 2)
Replacement of 70 watt HPSV to 30 watt LED Lamp first phase 400 numbers
0.0 0.09 5.3
8Shifting of ILMS panel 1A & 1B to MCR building in switchgear room. ( It will increase reliability
& saving by permanent 2nos 2T split AC switch off)0.0 0.12 0.0
9 Reducing Start up Aux. power consumption, during SD & BTL 0.0 0.06 0.0
10Reduction in Auxiliary power consumption (by 5 %) of CHP by increasing the utilization factor
of conveying System0.0 3.03 0.0
11 Installation of VFD in Potable water pump-15KW 0.0 0.12 4.0
12Installation of 110KW VFD on 110 KW LP water pump-1 motor to optimize the energy use
which happened due to variable flow requirement.( min 600 m3/hrs to max 1000 m3/hrs)0.5 0.90 6.7
13 One stage reduction in CEP (Unit-1) 1.4 6.18 2.7
14 Silo Blower Optimization through running of three blowers for four silos in AHP. 0.0 1.70 0.0
Rs in Million