Embed Size (px)
Citation preview
13Q19 Investor Conference Presentation
3Q19 Investor Conference PresentationNovember 4, 2019
Andrew Lane
President & CEO
Jim Braun
Executive Vice President & CFO
23Q19 Investor Conference Presentation
Forward Looking Statements and
Non-GAAP Disclaimer
2
2
This presentation contains forward-looking statements within the meaning of Section 27A of the Securities Act
and Section 21E of the Exchange Act. Words such as “will,” “expect,” “expected,” “looking forward,” “guidance,”
“on-track”, “Results in mid-cycle Adjusted EBITDA” and similar expressions are intended to identify forward-
looking statements. Statements about the company’s business, including its strategy, its industry, the company’s
future profitability, the company’s guidance on its sales, Adjusted EBITDA, gross profit, gross profit percentage,
Adjusted Gross Profit, Adjusted Gross Profit percentage, tax rate, capital expenditures and cash from
operations, growth in the company’s various markets and the company’s expectations, beliefs, plans, strategies,
objectives, prospects and assumptions are not guarantees of future performance. These statements are based
on management’s expectations that involve a number of business risks and uncertainties, any of which could
cause actual results to differ materially from those expressed in or implied by the forward-looking statements.
These statements involve known and unknown risks, uncertainties and other factors, most of which are difficult
to predict and many of which are beyond our control, including the factors described in the company’s SEC
filings, including (among others) its Current Report on Form 8-K dated October 31, 2019, that may cause our
actual results and performance to be materially different from any future results or performance expressed or
implied by these forward-looking statements.
For a discussion of key risk factors, please see the risk factors disclosed in the company’s SEC filings, which
are available on the SEC’s website at www.sec.gov and on the company’s website, www.mrcglobal.com. Our
filings and other important information are also available on the Investor Relations page of our website at
www.mrcglobal.com.
Undue reliance should not be placed on the company’s forward-looking statements. Although
forward-looking statements reflect the company’s good faith beliefs, reliance should not be placed on
forward-looking statements because they involve known and unknown risks, uncertainties and other
factors, which may cause the company’s actual results, performance or achievements or future
events to differ materially from anticipated future results, performance or achievements or future
events expressed or implied by such forward-looking statements. The company undertakes no
obligation to publicly update or revise any forward-looking statement, whether as a result of new
information, future events, changed circumstances or otherwise, except to the extent required by
law.
Statement Regarding Use of Non-GAAP
Measures:
The Non-GAAP financial measures contained
in this presentation (Adjusted EBITDA and
Adjusted Gross Profit) are not measures of
financial performance calculated in accordance
with U.S. Generally Accepted Accounting
Principles (GAAP) and should not be
considered as alternatives to net income or
gross profit. They should be viewed in addition
to, and not as a substitute for, analysis of our
results reported in accordance with GAAP.
Management believes that these non-GAAP
financial measures provide investors a view to
measures similar to those used in evaluating
our compliance with certain financial covenants
under our credit facilities and provide
meaningful comparisons between current and
prior year period results. They are also used as
a metric to determine certain components of
performance-based compensation. They are
not necessarily indicative of future results of
operations that may be obtained by the
Company.
33Q19 Investor Conference Presentation 3
Projects
28%
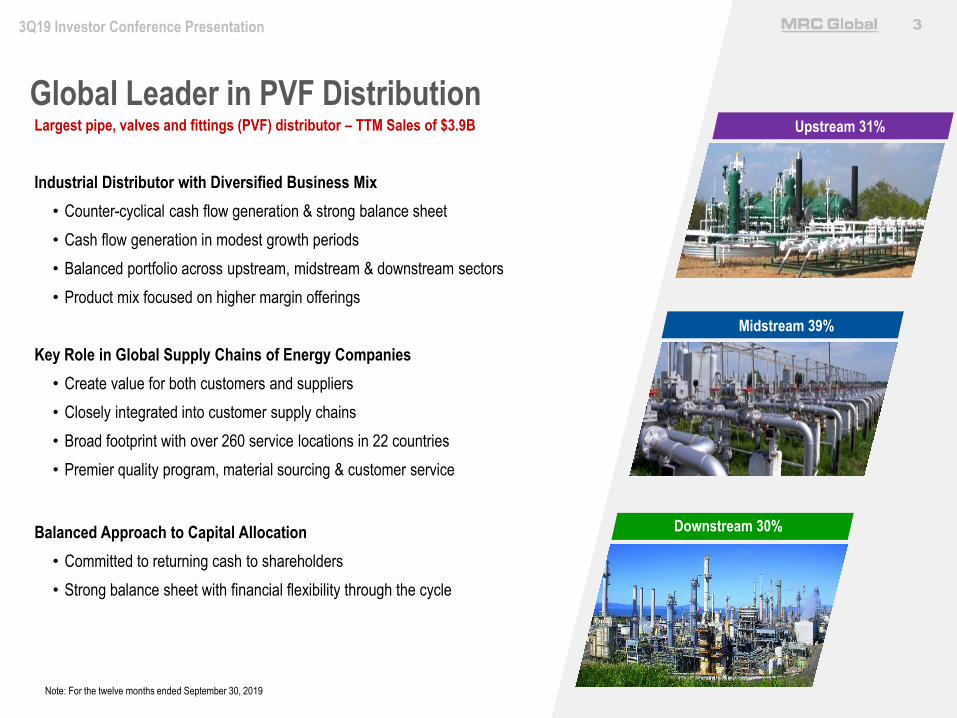
Global Leader in PVF Distribution
Note: For the twelve months ended September 30, 2019
Largest pipe, valves and fittings (PVF) distributor – TTM Sales of $3.9B
Industrial Distributor with Diversified Business Mix
• Counter-cyclical cash flow generation & strong balance sheet
• Cash flow generation in modest growth periods
• Balanced portfolio across upstream, midstream & downstream sectors
• Product mix focused on higher margin offerings
Key Role in Global Supply Chains of Energy Companies
• Create value for both customers and suppliers
• Closely integrated into customer supply chains
• Broad footprint with over 260 service locations in 22 countries
• Premier quality program, material sourcing & customer service
Balanced Approach to Capital Allocation
• Committed to returning cash to shareholders
• Strong balance sheet with financial flexibility through the cycle
Downstream 30%
Midstream 39%
Upstream 31%

43Q19 Investor Conference Presentation
Strategy for Creating Shareholder Value
• Provide superior customer service & cost-saving supply chain solutions
• Focus on blue chip customers who demand value-added service and technical expertise
• Leverage market leadership position and global footprint
• Provide multi-channel engagement to capture buying
• Opportunistic M&A
Grow Market Share
• Focus on higher margin products, end-markets & sales strategies
• Leverage scale & global supply chain
• Expand offering of value-added services to capture enhanced margin
• Focus on controlling costs & operating leverage
Maximize Profitability
• Reduce cash conversion cycle
• Optimize inventory to maximize turnover and margin
• Continual operational efficiency improvements
Maximize Working Capital Efficiency
• Optimize capital structure with financial flexibility throughout the cycle
• Invest for growth
• Return capital to shareholders
• Target leverage ratio ~2-3x net debt to adjusted EBITDA
Optimize Capital Structure

53Q19 Investor Conference Presentation
World-class Management Team
with Significant Distribution and Energy
Experience
Compelling Investment Opportunity
• Market leader in PVF distribution, serving critical function to the energy industry
• Diversified across sectors, regions and customers
• Counter-cyclical cash flow and strong balance sheet
• Differentiated global platform creates customer value
• Organic growth potential via market share gains from expanded multi-year MRO contracts and
long-term secular growth from global energy demand
• Proven history of driving continuous productivity improvements
• Industry consolidator with proven success in acquiring and integrating businesses

63Q19 Investor Conference Presentation
Diversified by Region, Industry Sector and Product Line -
Well Positioned Through Cycle
Revenue by Geography
United States80%
Canada7%
International13%
Gas Utility23%
Transmission & Gathering
16%Production
Infrastructure & Supplies
31%
Chemicals & Refining
21%
Industrial9%
Downstream
30%
Note: Percentage of sales are for the twelve months ended September 30, 2019.
Industrial includes metals & mining, fabrication, pulp & paper, power generation and general industrial.
Midstream
39%
Upstream
31%
Valves, Automation, Measurement & Instrumentation
39%
Carbon Pipe, Fittings & Flanges
32%
Gas Products14%
General Oilfield Products
10%
Stainless Steel Alloy Pipe & Fittings
5%
Revenue by Product Line
Revenue by Industry Sector

73Q19 Investor Conference Presentation
• Provide well hook-ups via on-site product trailers, above-ground
infrastructure PVF products for flow lines & tank batteries
• Serve exploration & production (E&P) operators including Shell,
Chevron, Occidental, California Resources Corporation and
Canadian Natural Resources
• Primary drivers are customers’ capital budgets for well
completions & production tank battery upgrades and
expansions
• Walk-in counter sales at strategically located branches in
active oil & gas production areas
• Located in all major basins - revenue follows basin market
activity levels
• Permian basin is our largest upstream position
representing 23% of total first nine months of 2019
upstream revenue
Upstream – Providing Completion
Infrastructure to E&P Operators
7
83Q19 Investor Conference Presentation
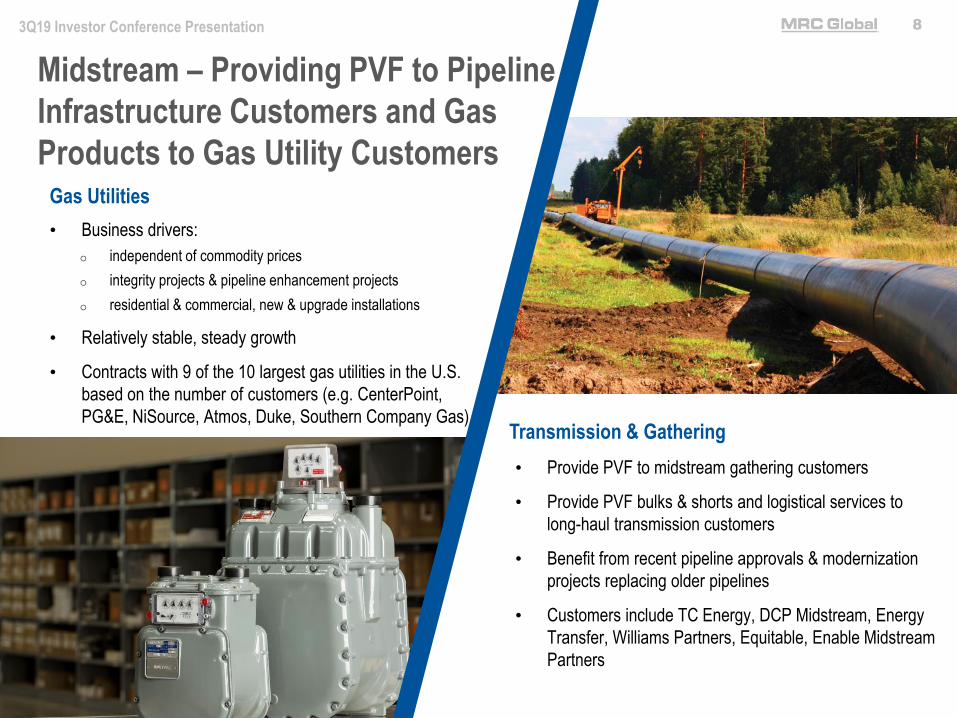
Gas Utilities
Transmission & Gathering
• Provide PVF to midstream gathering customers
• Provide PVF bulks & shorts and logistical services to
long-haul transmission customers
• Benefit from recent pipeline approvals & modernization
projects replacing older pipelines
• Customers include TC Energy, DCP Midstream, Energy
Transfer, Williams Partners, Equitable, Enable Midstream
Partners
• Business drivers:
o independent of commodity prices
o integrity projects & pipeline enhancement projects
o residential & commercial, new & upgrade installations
• Relatively stable, steady growth
• Contracts with 9 of the 10 largest gas utilities in the U.S.
based on the number of customers (e.g. CenterPoint,
PG&E, NiSource, Atmos, Duke, Southern Company Gas)
Midstream – Providing PVF to Pipeline
Infrastructure Customers and Gas
Products to Gas Utility Customers
93Q19 Investor Conference Presentation
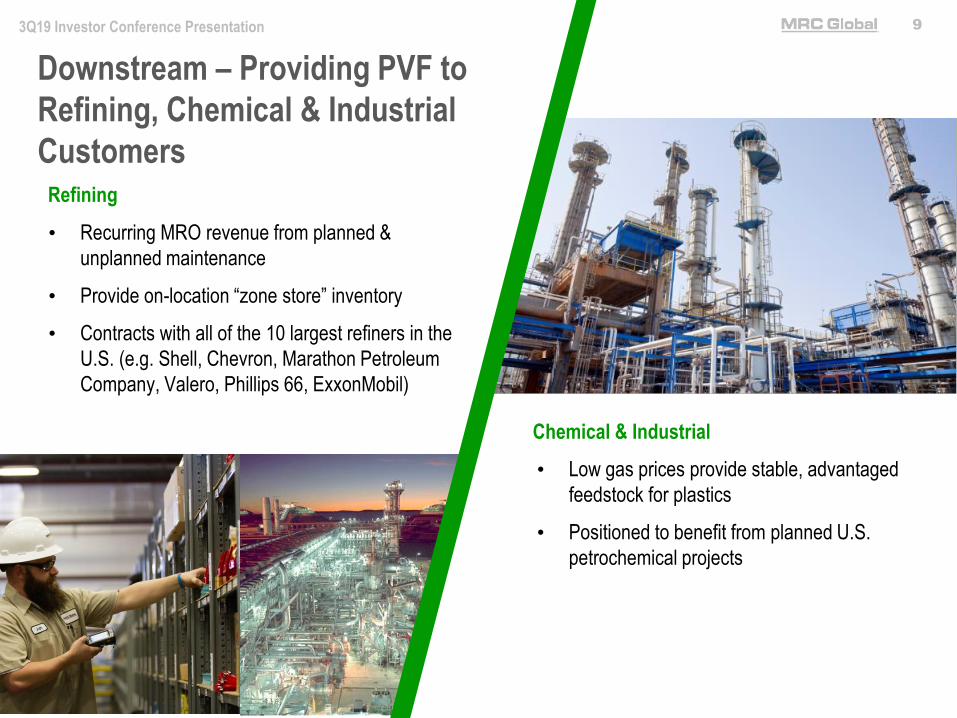
Refining
Chemical & Industrial
• Recurring MRO revenue from planned &
unplanned maintenance
• Provide on-location “zone store” inventory
• Contracts with all of the 10 largest refiners in the
U.S. (e.g. Shell, Chevron, Marathon Petroleum
Company, Valero, Phillips 66, ExxonMobil)
• Low gas prices provide stable, advantaged
feedstock for plastics
• Positioned to benefit from planned U.S.
petrochemical projects
Downstream – Providing PVF to
Refining, Chemical & Industrial
Customers
103Q19 Investor Conference Presentation
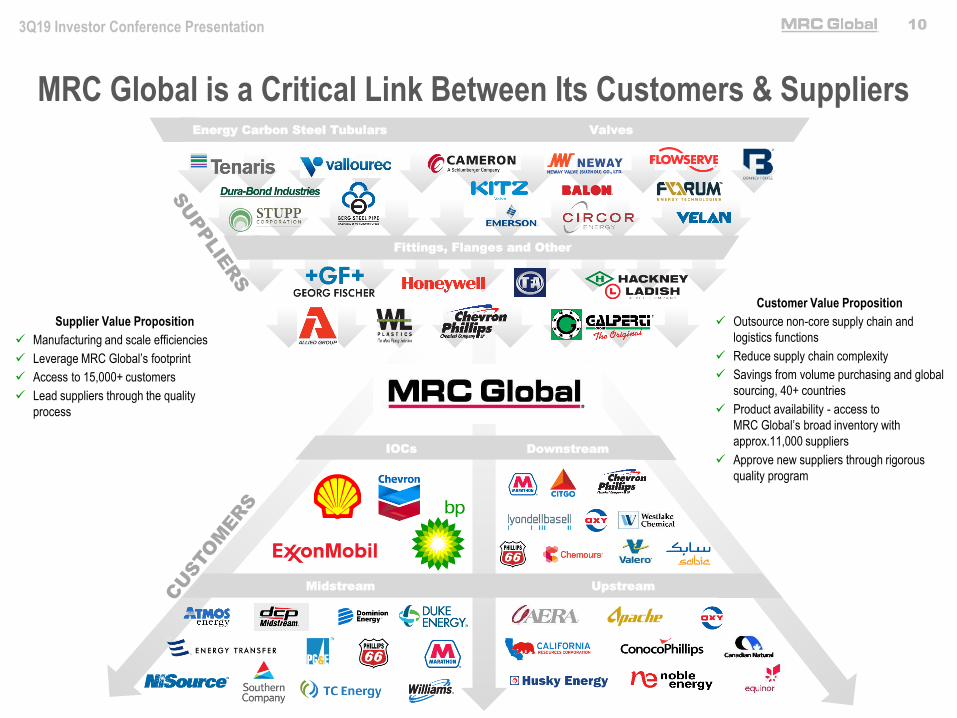
MRC Global is a Critical Link Between Its Customers & SuppliersEnergy Carbon Steel Tubulars Valves
Supplier Value Proposition
✓ Manufacturing and scale efficiencies
✓ Leverage MRC Global’s footprint
✓ Access to 15,000+ customers
✓ Lead suppliers through the quality
process
Customer Value Proposition
✓ Outsource non-core supply chain and
logistics functions
✓ Reduce supply chain complexity
✓ Savings from volume purchasing and global
sourcing, 40+ countries
✓ Product availability - access to
MRC Global’s broad inventory with
approx.11,000 suppliers
✓ Approve new suppliers through rigorous
quality program
Fittings, Flanges and Other
IOCs Downstream
Midstream Upstream

113Q19 Investor Conference Presentation
Global Footprint – Strategically Located in Key Geographies to
Deliver Solutions to Customers
North AmericaAs of
9/30/2019
Branches 118
RDCs 8
VECs 14
Employees 2,564
InternationalAs of
9/30/2019
Branches 24
RDCs 6
VECs 12
Countries 20
Employees 806
InternationalNorth America
MRC GlobalAs of
9/30/2019
Branches 142
RDCs 14
VECs 26
Countries 22
Employees 3,370
Nisku, AB
Cheyenne, WY
Odessa, TX
Bakersfield, CA
Munster, IN
Tulsa, OK
Pittsburgh, PA
Houston, TX
NORDIC
EUROPE
Stavanger, NO
Bradford, UK
Rotterdam, NLMIDDLE EAST / CASPIAN
ASIA PACIFIC
Dubai, UAE Singapore
Perth, WA

123Q19 Investor Conference Presentation
MRC Global is committed to responsible governance of the
enterprise and its interaction with its stakeholders.
Core Values Drive Actions for All Stakeholders
2018: Top Quartile Safety Performance in a NAW Survey
• 54 distribution companies with over $1 billion in revenue
Distribution Business Model Allows Expansion of Different Products, Geographies and Industrial Market Sectors
• Model can address climate change initiatives or sentiment negatively impacting traditional energy markets
MRC Global Contributes to a Sustainable Environment
• Increasing majority of valve sales ($1.6 billion in 2018) are “Low-E” valves (prevent fugitive emissions of methane and other
greenhouse gases)
• Reduced CO2 vehicle emissions from fleet by approximately 20% from 2013 levels through 2018
• Increased recycling tonnage by 5% from 2017 to 2018
Supplier Quality Process (Processes, Policies, Audits) include steps to:
• Increase ethical behavior in our supply chain
• Avoid improper labor practices
• Encourage sustainability
Programs to Develop Employees and Encourage Diversity
• 36% of Board of Directors from Diversity Groups
• 44% Women in Corporate Functions
For more information: Governance: Proxy Statement for our 2019 Annual Meeting
of Stockholders
ESG Generally: 2019 Environmental, Social Responsibility &
Corporate Governance Report
ESG Policies: Corporate Social Responsibility
Community Engagement Community Involvement
133Q19 Investor Conference Presentation
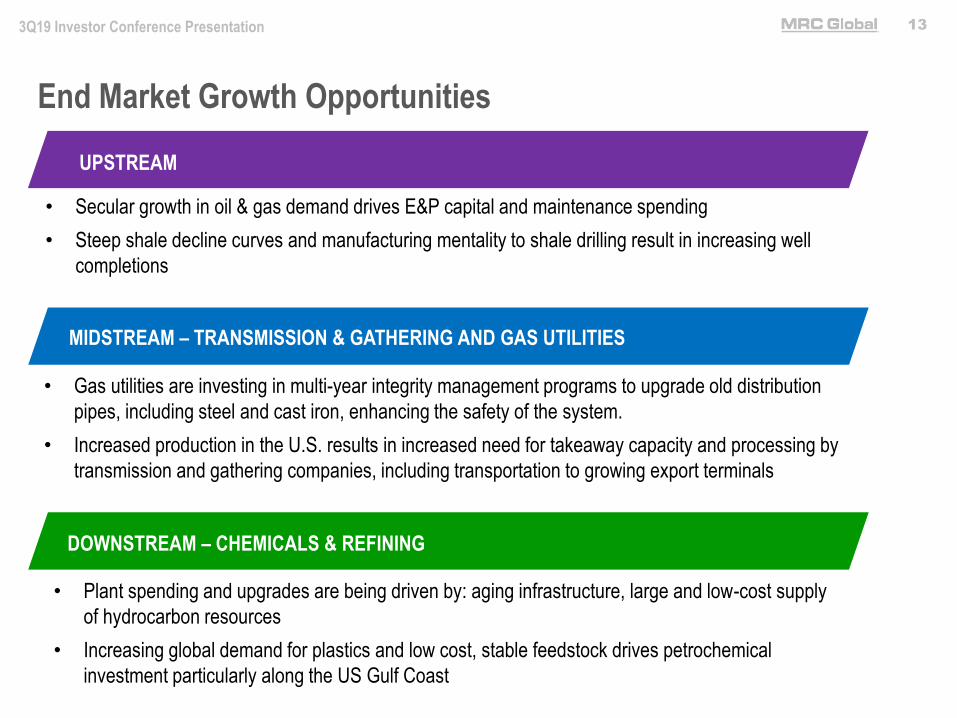
End Market Growth Opportunities
UPSTREAM
• Secular growth in oil & gas demand drives E&P capital and maintenance spending
• Steep shale decline curves and manufacturing mentality to shale drilling result in increasing well
completions
MIDSTREAM – TRANSMISSION & GATHERING AND GAS UTILITIES
DOWNSTREAM – CHEMICALS & REFINING
• Gas utilities are investing in multi-year integrity management programs to upgrade old distribution
pipes, including steel and cast iron, enhancing the safety of the system.
• Increased production in the U.S. results in increased need for takeaway capacity and processing by
transmission and gathering companies, including transportation to growing export terminals
• Plant spending and upgrades are being driven by: aging infrastructure, large and low-cost supply
of hydrocarbon resources
• Increasing global demand for plastics and low cost, stable feedstock drives petrochemical
investment particularly along the US Gulf Coast
143Q19 Investor Conference Presentation
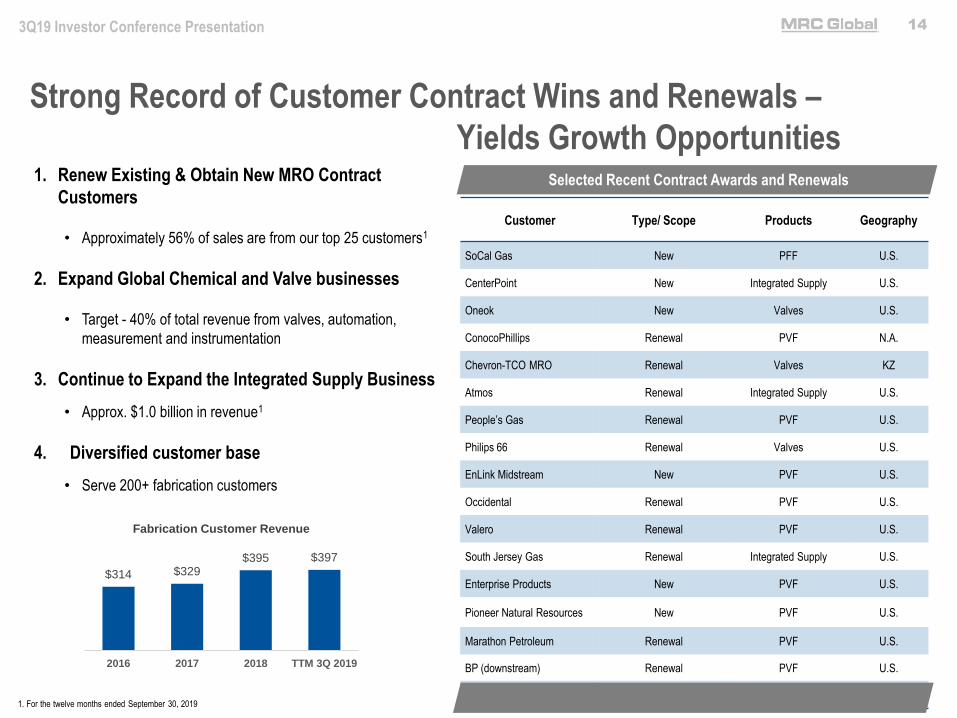
Strong Record of Customer Contract Wins and Renewals –
Yields Growth Opportunities1. Renew Existing & Obtain New MRO Contract
Customers
• Approximately 56% of sales are from our top 25 customers1
2. Expand Global Chemical and Valve businesses
• Target - 40% of total revenue from valves, automation,
measurement and instrumentation
3. Continue to Expand the Integrated Supply Business
• Approx. $1.0 billion in revenue1
4. Diversified customer base
• Serve 200+ fabrication customers
Customer Type/ Scope Products Geography
SoCal Gas New PFF U.S.
CenterPoint New Integrated Supply U.S.
Oneok New Valves U.S.
ConocoPhillips Renewal PVF N.A.
Chevron-TCO MRO Renewal Valves KZ
Atmos Renewal Integrated Supply U.S.
People’s Gas Renewal PVF U.S.
Philips 66 Renewal Valves U.S.
EnLink Midstream New PVF U.S.
Occidental Renewal PVF U.S.
Valero Renewal PVF U.S.
South Jersey Gas Renewal Integrated Supply U.S.
Enterprise Products New PVF U.S.
Pioneer Natural Resources New PVF U.S.
Marathon Petroleum Renewal PVF U.S.
BP (downstream) Renewal PVF U.S.
TC Energy Renewal PVF U.S.
Selected Recent Contract Awards and Renewals
1. For the twelve months ended September 30, 2019
$314 $329$395 $397
2016 2017 2018 TTM 3Q 2019
Fabrication Customer Revenue
153Q19 Investor Conference Presentation
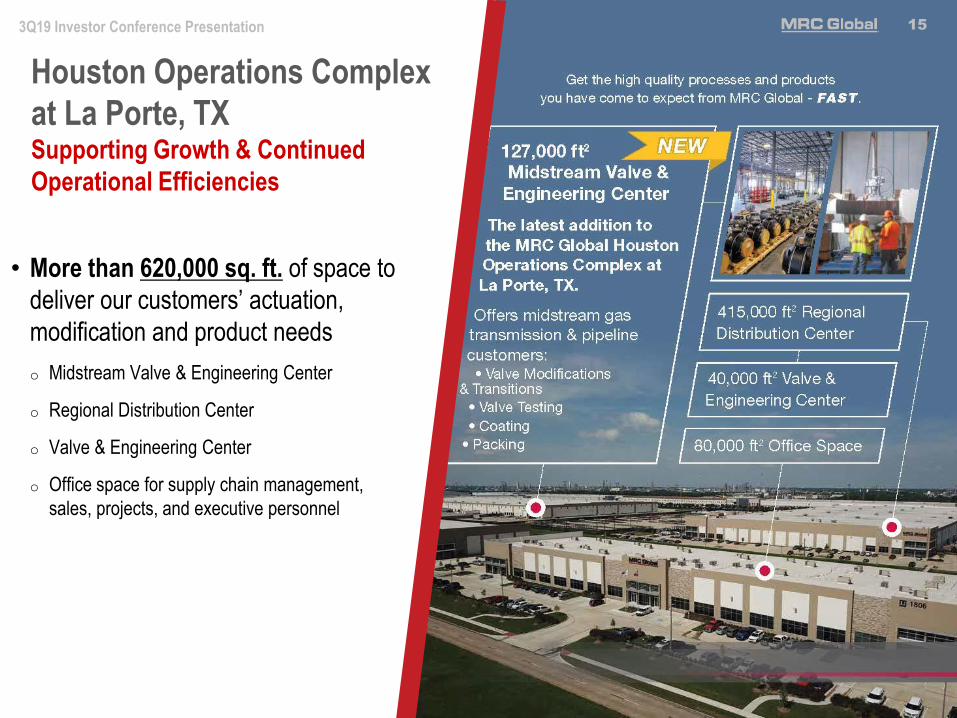
Houston Operations Complex
at La Porte, TXSupporting Growth & Continued
Operational Efficiencies
• More than 620,000 sq. ft. of space to
deliver our customers’ actuation,
modification and product needs
o Midstream Valve & Engineering Center
o Regional Distribution Center
o Valve & Engineering Center
o Office space for supply chain management,
sales, projects, and executive personnel
15

163Q19 Investor Conference Presentation
MRC Global’s Valve-Centric Strategy
• U.S. oil & gas valve market is $5.2B ($2.6B through distribution)
• $2.2B Upstream & Midstream
• $3.0B Downstream
• MRC Global’s #1 is in U.S. distributed energy valves with ~40% of
market
• Holder of 3 global, multi-year, valve contracts with IOCs (Shell,
Chevron, ExxonMobil)
• Valve, Automation, Measurement & Instrumentation (VAMI) revenue
• Expected to be 40% of total revenue in 2019 / 2020 & 45% of total
revenue in 2022
• Highly technical, complex, long lead-time, global supply chain with
value-added services and modifications leads to higher margins
Upstream44%
Midstream24%
Downstream32%
VAMI Sales TTM 9/30/19
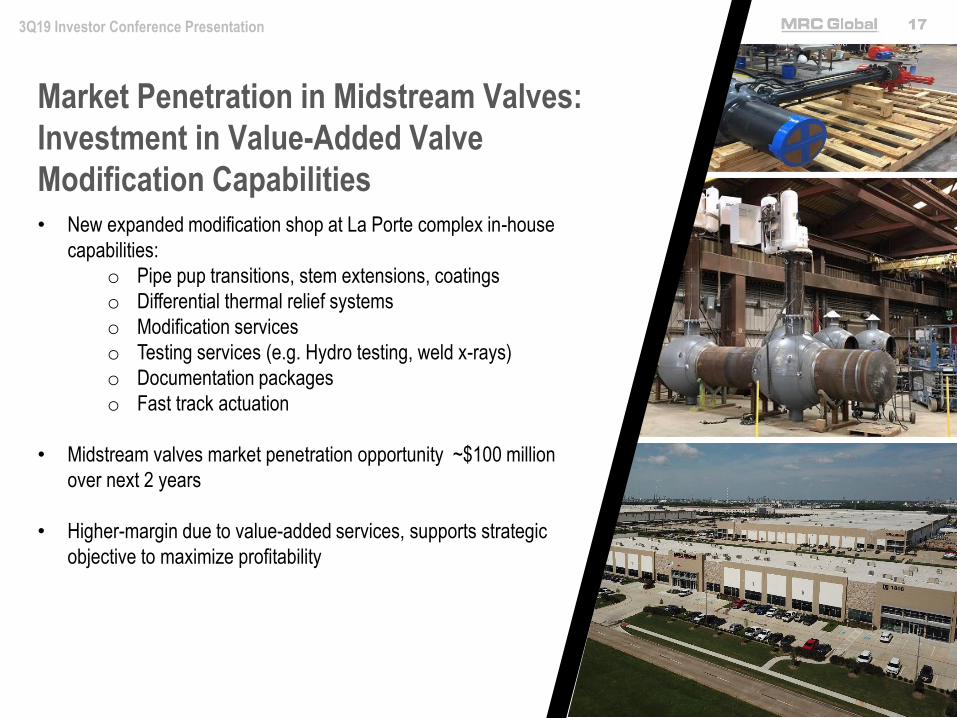
173Q19 Investor Conference Presentation
• New expanded modification shop at La Porte complex in-house
capabilities:
o Pipe pup transitions, stem extensions, coatings
o Differential thermal relief systems
o Modification services
o Testing services (e.g. Hydro testing, weld x-rays)
o Documentation packages
o Fast track actuation
• Midstream valves market penetration opportunity ~$100 million
over next 2 years
• Higher-margin due to value-added services, supports strategic
objective to maximize profitability
Market Penetration in Midstream Valves:
Investment in Value-Added Valve
Modification Capabilities
183Q19 Investor Conference Presentation
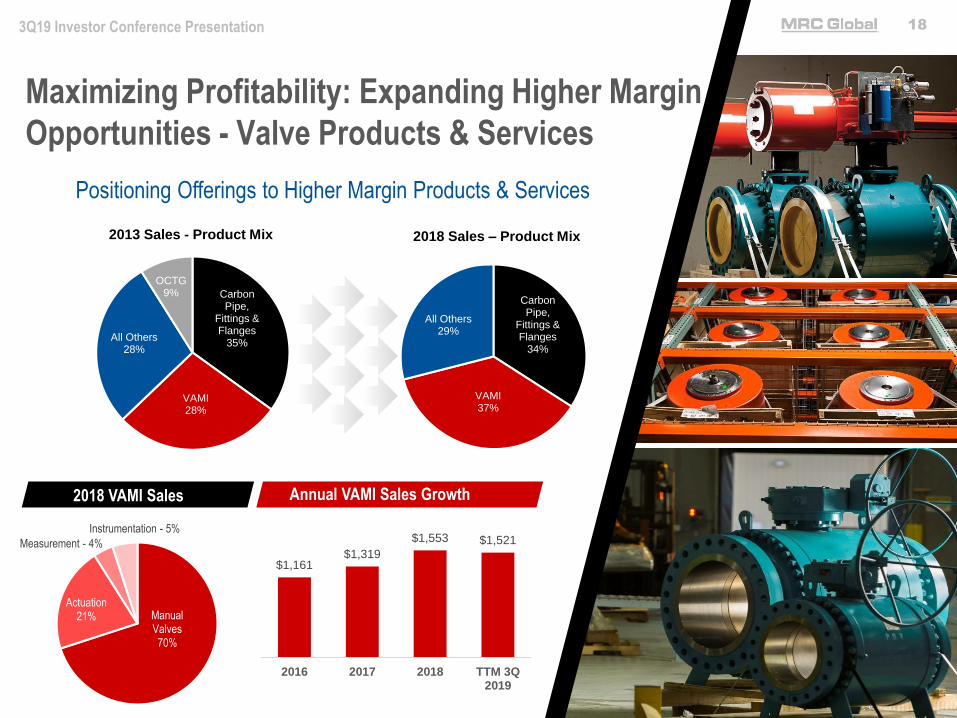
Maximizing Profitability: Expanding Higher Margin
Opportunities - Valve Products & Services
Manual Valves70%
Actuation21%
Measurement - 4%
Instrumentation - 5%
$1,161$1,319
$1,553 $1,521
2016 2017 2018 TTM 3Q2019
2018 VAMI Sales Annual VAMI Sales Growth
Positioning Offerings to Higher Margin Products & Services
Carbon Pipe,
Fittings & Flanges
35%
VAMI28%
All Others28%
OCTG9%
2013 Sales - Product Mix
Carbon Pipe,
Fittings & Flanges
34%
VAMI37%
All Others29%
2018 Sales – Product Mix
193Q19 Investor Conference Presentation
$-
$100
$200
$300
$400
$500
$600
$700
$800
$900
$1,000
Mill
ion
s
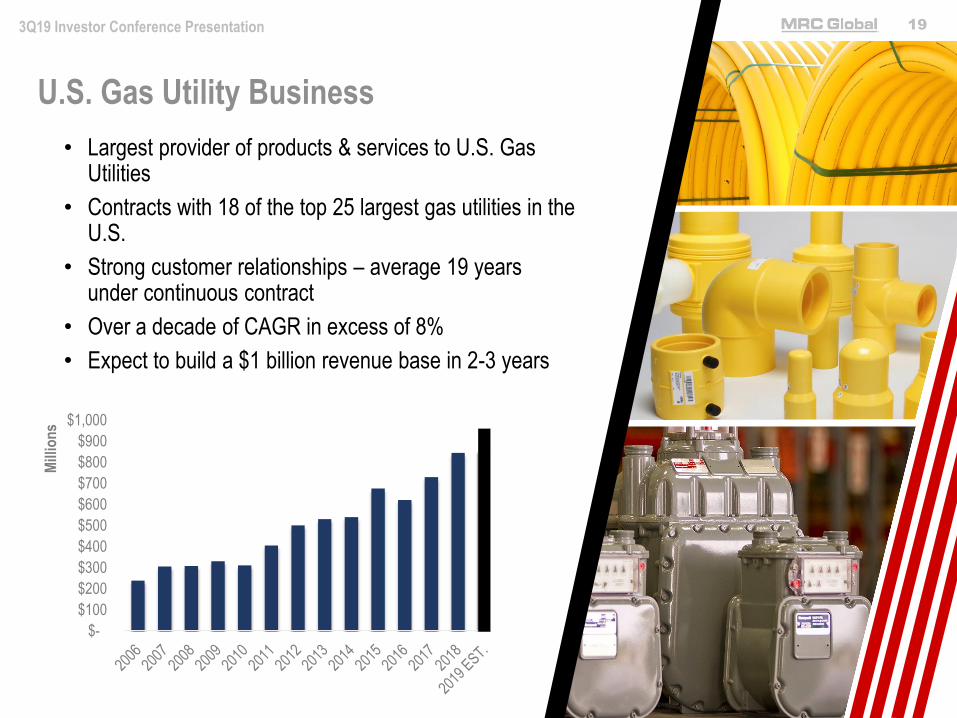
• Largest provider of products & services to U.S. Gas Utilities
• Contracts with 18 of the top 25 largest gas utilities in the U.S.
• Strong customer relationships – average 19 years under continuous contract
• Over a decade of CAGR in excess of 8%
• Expect to build a $1 billion revenue base in 2-3 years
U.S. Gas Utility Business
203Q19 Investor Conference Presentation
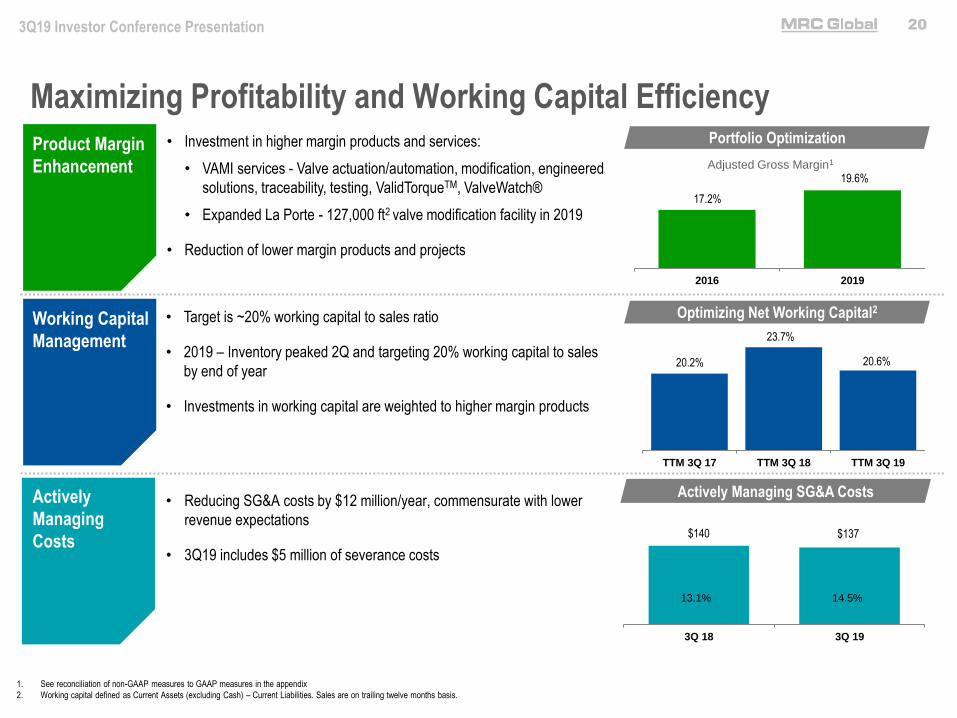
Working Capital
Management
Maximizing Profitability and Working Capital Efficiency
• Target is ~20% working capital to sales ratio
• 2019 – Inventory peaked 2Q and targeting 20% working capital to sales
by end of year
• Investments in working capital are weighted to higher margin products
Optimizing Net Working Capital2
20.2%
23.7%
20.6%
TTM 3Q 17 TTM 3Q 18 TTM 3Q 19
1. See reconciliation of non-GAAP measures to GAAP measures in the appendix
2. Working capital defined as Current Assets (excluding Cash) – Current Liabilities. Sales are on trailing twelve months basis.
$140 $137
3Q 18 3Q 19
• Reducing SG&A costs by $12 million/year, commensurate with lower
revenue expectations
• 3Q19 includes $5 million of severance costs
Actively Managing SG&A CostsActively
Managing
Costs
13.1% 14.5%
Product Margin
Enhancement
• Investment in higher margin products and services:
• VAMI services - Valve actuation/automation, modification, engineered
solutions, traceability, testing, ValidTorqueTM, ValveWatch®
• Expanded La Porte - 127,000 ft2 valve modification facility in 2019
• Reduction of lower margin products and projects
Portfolio Optimization
17.2%
19.6%
2016 2019
Adjusted Gross Margin1

213Q19 Investor Conference Presentation
Investing in Technology for Long-Term Growth & Efficiency
MRCGOTM - A Comprehensive Digital Supply Chain Solution for Oil & Gas
Pipe, Valve & Fitting Purchases
of the top 37 customers’ TTM revenue or approximately $608 million was
transacted through e-commerce (e.g. catalog, EDI)~29%
• End-to-end digital supply chain solution from a single
platform
• B-2-B for contract customers allows for easy and efficient
ordering
• Customized for each customer’s contract terms, part
numbers, commonly ordered items
• TTM 3Q 2019 results:
• $817 million of revenue transacted via e-commerce
• $129 million of revenue generated through MRCGOTM
• 80 customers and 175,000 SKUs in MRCGOTM
$685 $694
$885 $928
$817
2015 2016 2017 2018 TTM 3Q 19
Revenue Generated via E-Commerce
$ millions
223Q19 Investor Conference Presentation
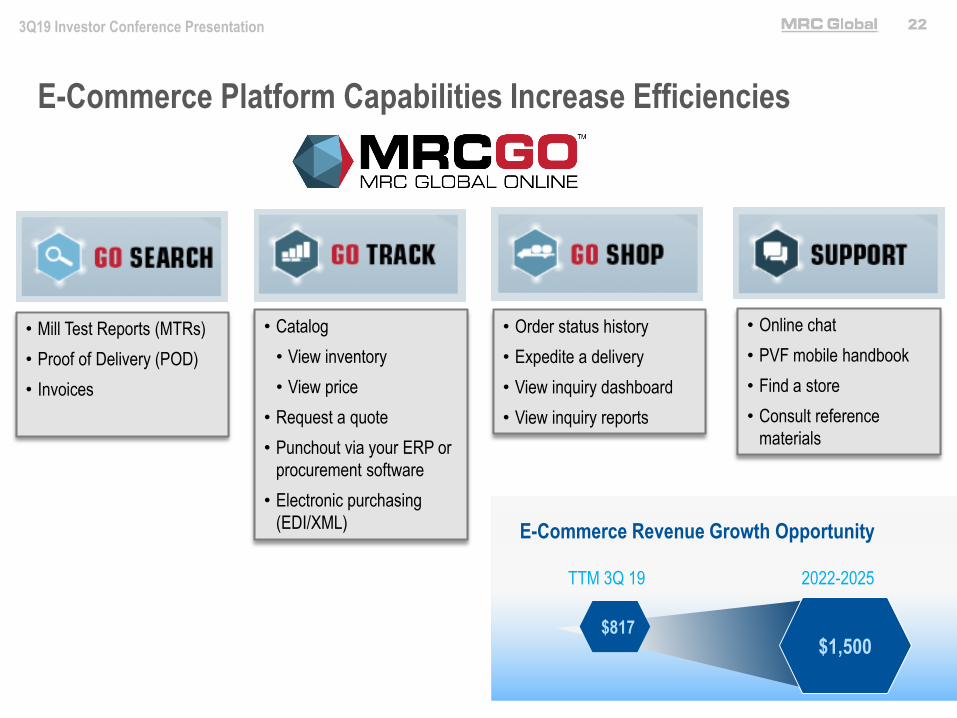
E-Commerce Platform Capabilities Increase Efficiencies
TTM 3Q 19 2022-2025
$1,500$817
E-Commerce Revenue Growth Opportunity
• Mill Test Reports (MTRs)
• Proof of Delivery (POD)
• Invoices
• Catalog
• View inventory
• View price
• Request a quote
• Punchout via your ERP or
procurement software
• Electronic purchasing
(EDI/XML)
• Order status history
• Expedite a delivery
• View inquiry dashboard
• View inquiry reports
• Online chat
• PVF mobile handbook
• Find a store
• Consult reference
materials
233Q19 Investor Conference Presentation
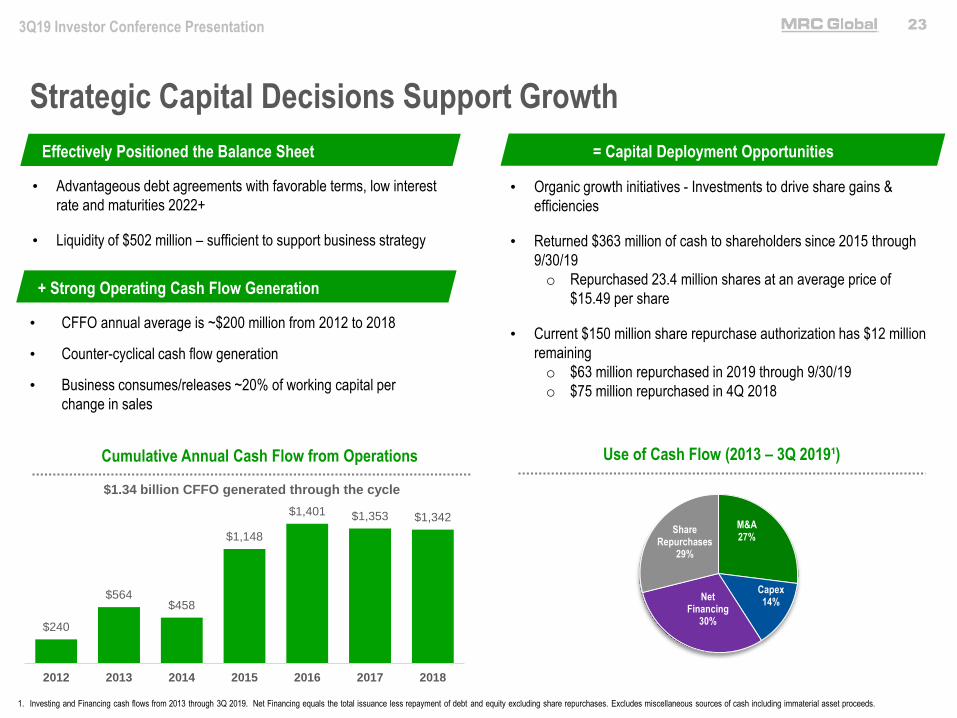
Strategic Capital Decisions Support Growth
1. Investing and Financing cash flows from 2013 through 3Q 2019. Net Financing equals the total issuance less repayment of debt and equity excluding share repurchases. Excludes miscellaneous sources of cash including immaterial asset proceeds.
Effectively Positioned the Balance Sheet
• Advantageous debt agreements with favorable terms, low interest
rate and maturities 2022+
• Liquidity of $502 million – sufficient to support business strategy
= Capital Deployment Opportunities
• Organic growth initiatives - Investments to drive share gains &
efficiencies
• Returned $363 million of cash to shareholders since 2015 through
9/30/19
o Repurchased 23.4 million shares at an average price of
$15.49 per share
• Current $150 million share repurchase authorization has $12 million
remaining
o $63 million repurchased in 2019 through 9/30/19
o $75 million repurchased in 4Q 2018
Use of Cash Flow (2013 – 3Q 2019¹)
M&A27%
Capex14%
Net Financing
30%
Share Repurchases
29%
• CFFO annual average is ~$200 million from 2012 to 2018
• Counter-cyclical cash flow generation
• Business consumes/releases ~20% of working capital per
change in sales
+ Strong Operating Cash Flow Generation
Cumulative Annual Cash Flow from Operations
$240
$564$458
$1,148
$1,401 $1,353 $1,342
2012 2013 2014 2015 2016 2017 2018
$1.34 billion CFFO generated through the cycle

243Q19 Investor Conference Presentation
Capital Allocation Opportunities and Priorities
Return Cash to Shareholders
• Track record of repurchasing shares
• Board re-evaluates quarterly, balancing near-term and long-term cash needs among all options, market projections and company cash flow expectations
Organic Growth
• Working capital for business is a priority in growth periods
• Disciplined investing in technology and facilities where appropriate
M&A Growth
• Built company from series of acquisitions
• Disciplined approached based on screens :
• Valuation
• Focus on higher margin offerings, sectors and key geographies
Debt Reduction
• Manage debt levels within target range of 2-3X net debt to adjusted EBITDA
• Appropriate use of balance sheet to maintain financial flexibility and to support the business throughout the cycle
All options are available & evaluated continually
253Q19 Investor Conference Presentation
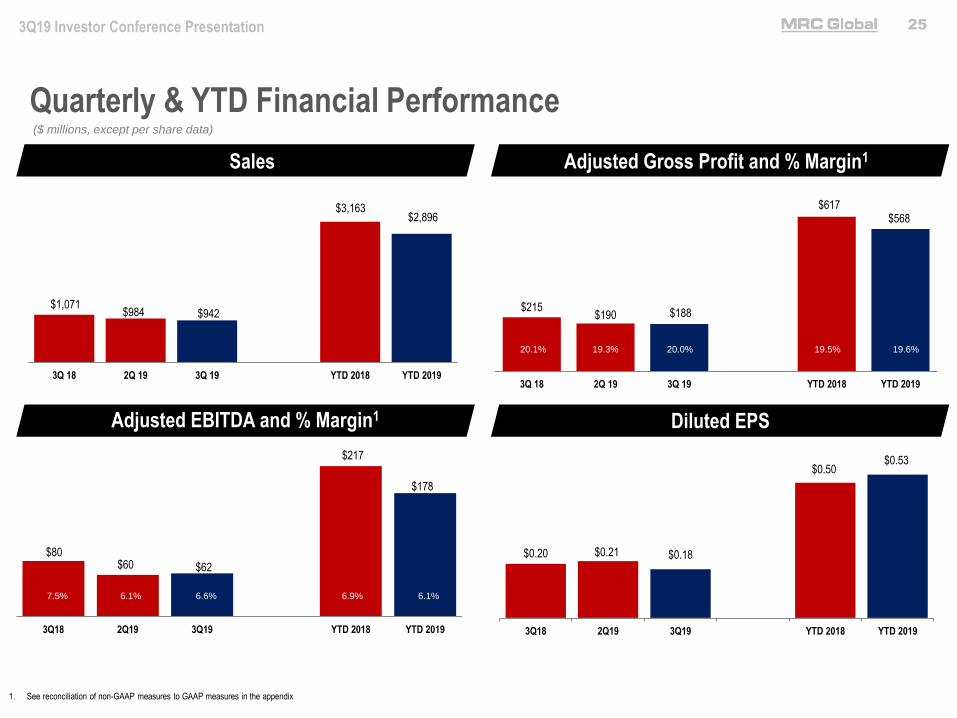
$215 $190 $188
$617 $568
3Q 18 2Q 19 3Q 19 YTD 2018 YTD 2019
$1,071 $984 $942
$3,163 $2,896
3Q 18 2Q 19 3Q 19 YTD 2018 YTD 2019
Sales Adjusted Gross Profit and % Margin1
Adjusted EBITDA and % Margin1
7.0%
8.5%
($ millions, except per share data)
Diluted EPS
Quarterly & YTD Financial Performance
1. See reconciliation of non-GAAP measures to GAAP measures in the appendix
5.8% 6.2% 5.8%
20.1% 19.3% 20.0% 19.5% 19.6%
$80 $60 $62
$217
$178
3Q18 2Q19 3Q19 YTD 2018 YTD 2019
$0.20 $0.21 $0.18
$0.50 $0.53
3Q18 2Q19 3Q19 YTD 2018 YTD 2019
7.5% 6.1% 6.6% 6.9% 6.1%
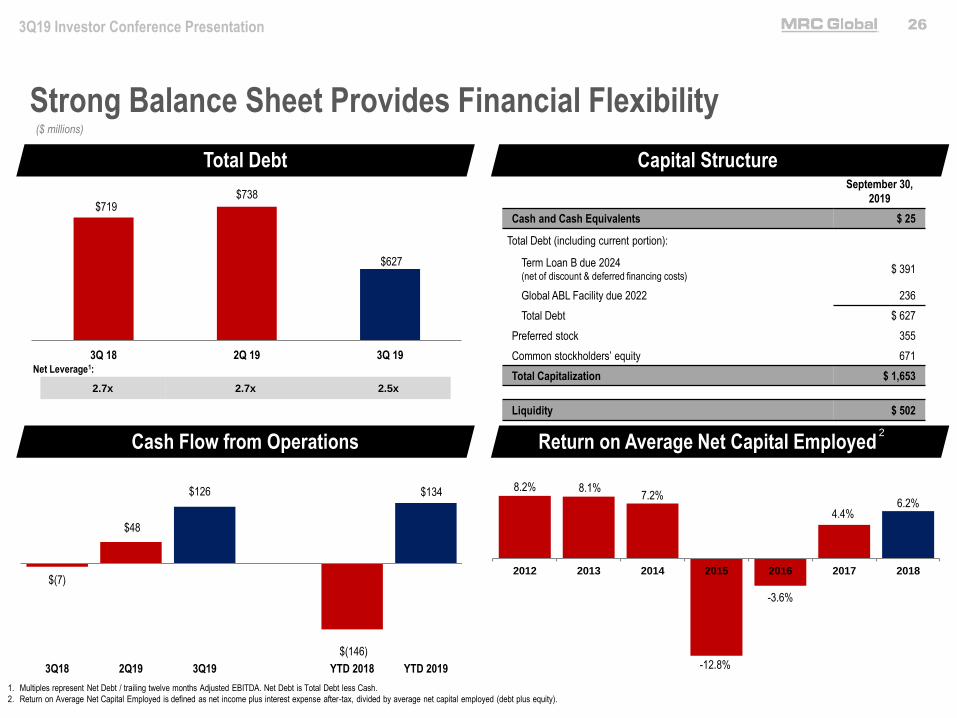
263Q19 Investor Conference Presentation
Total Debt Capital Structure
Cash Flow from Operations Return on Average Net Capital Employed
($ millions)
$719 $738
$627
3Q 18 2Q 19 3Q 19
Strong Balance Sheet Provides Financial Flexibility
1. Multiples represent Net Debt / trailing twelve months Adjusted EBITDA. Net Debt is Total Debt less Cash.
2. Return on Average Net Capital Employed is defined as net income plus interest expense after-tax, divided by average net capital employed (debt plus equity).
2.7x 2.7x 2.5x
Net Leverage1:
September 30,
2019
Cash and Cash Equivalents $ 25
Total Debt (including current portion):
Term Loan B due 2024(net of discount & deferred financing costs)
$ 391
Global ABL Facility due 2022 236
Total Debt $ 627
Preferred stock 355
Common stockholders’ equity 671
Total Capitalization $ 1,653
Liquidity $ 502
8.2% 8.1%7.2%
-12.8%
-3.6%
4.4%6.2%
2012 2013 2014 2015 2016 2017 2018
2
$(7)
$48
$126
$(146)
$134
3Q18 2Q19 3Q19 YTD 2018 YTD 2019
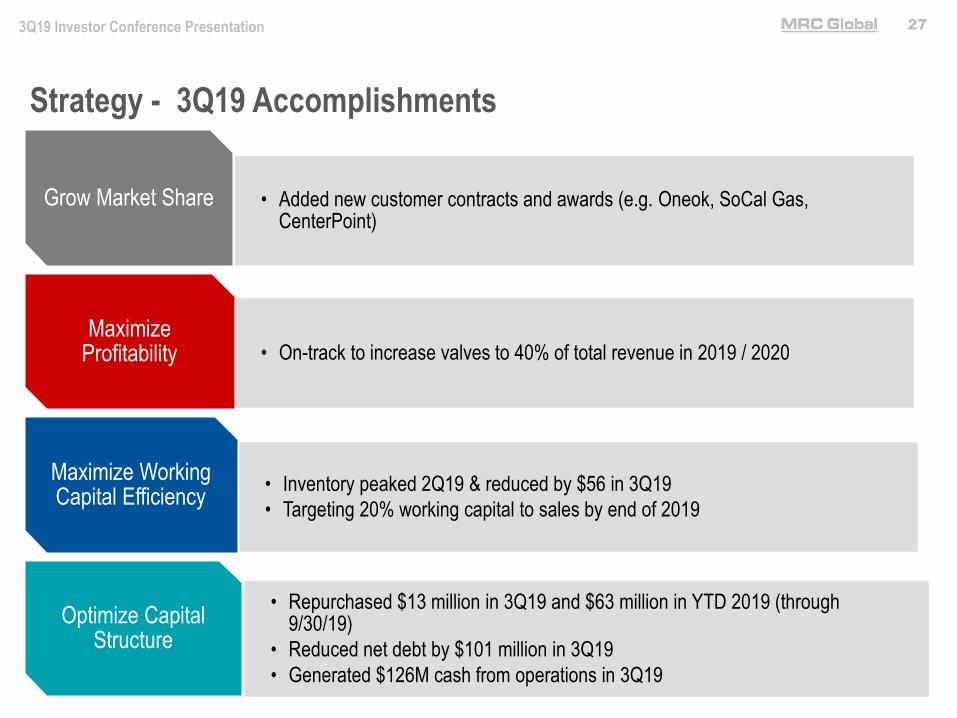
273Q19 Investor Conference Presentation
• Added new customer contracts and awards (e.g. Oneok, SoCal Gas, CenterPoint)
Grow Market Share
• On-track to increase valves to 40% of total revenue in 2019 / 2020Maximize
Profitability
• Inventory peaked 2Q19 & reduced by $56 in 3Q19
• Targeting 20% working capital to sales by end of 2019
Maximize Working Capital Efficiency
• Repurchased $13 million in 3Q19 and $63 million in YTD 2019 (through 9/30/19)
• Reduced net debt by $101 million in 3Q19
• Generated $126M cash from operations in 3Q19
Optimize Capital Structure
Strategy - 3Q19 Accomplishments
283Q19 Investor Conference Presentation
Appendix
293Q19 Investor Conference Presentation
Impact of Tariffs – Work Closely with Customers to Optimize the
Global Supply Chain
In general, inflation is a positive
• Multiple tariffs levied from Section 232 and Section 301 directly or indirectly impact all stainless & carbon products including
pipe, valves, fittings and flanges
• Various levels of financial impact from minimal to positive – amount of impact dependent on the supplier, market conditions
& product group including:
• Absorption of tariff by manufacturer
• Pass-through of tariff by distributor
• We manage the supply chain in order to minimize the impact or have a favorable outcome and we expect the most recent
round of tariffs to have minimal impact on the Company
• Our contract structure – percentage mark-up, cost plus pricing with 90 day re-pricing terms
• Revenue impact – higher cost products from inflation result in higher revenue and higher LIFO expense
• Margin dollars impact – more expensive materials with the same percentage mark-up result in more margin dollars
MRC Global proactively manages the supply chain to minimize or optimize the impact of tariffs
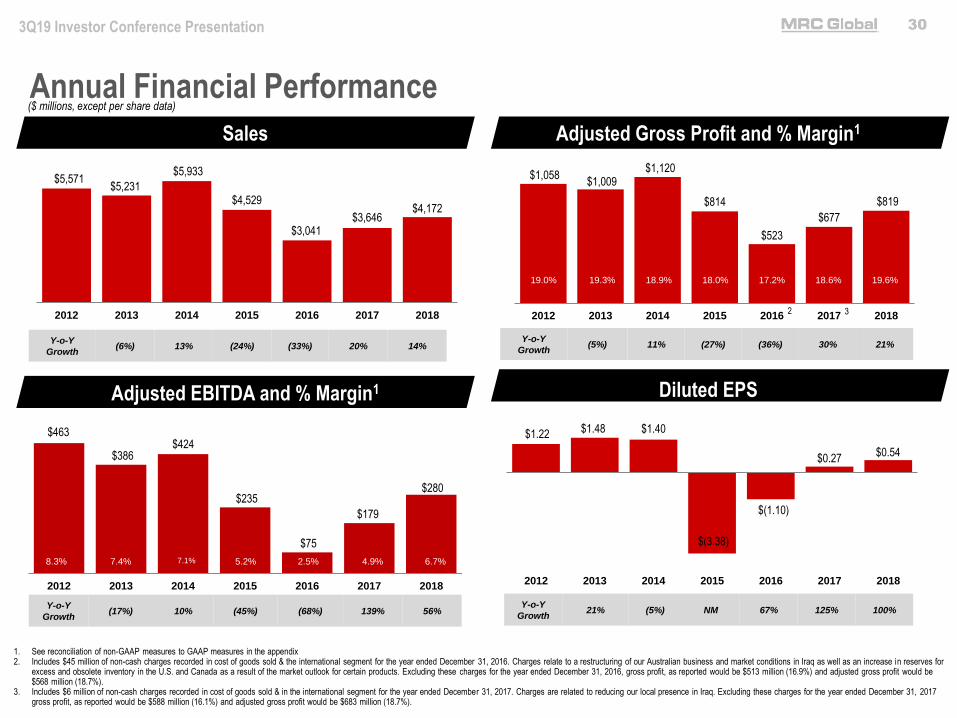
303Q19 Investor Conference Presentation
$5,571 $5,231
$5,933
$4,529
$3,041 $3,646
$4,172
2012 2013 2014 2015 2016 2017 2018
$1,058 $1,009
$1,120
$814
$523
$677
$819
2012 2013 2014 2015 2016 2017 2018
Y-o-Y
Growth(17%) 10% (45%) (68%) 139% 56%
Y-o-Y
Growth(5%) 11% (27%) (36%) 30% 21%
Sales Adjusted Gross Profit and % Margin1
Adjusted EBITDA and % Margin1
($ millions, except per share data)
$463
$386 $424
$235
$75
$179
$280
2012 2013 2014 2015 2016 2017 2018
8.3% 7.4% 7.1% 5.2% 2.5% 4.9% 6.7%
Diluted EPS
$1.22 $1.48 $1.40
$(3.38)
$(1.10)
$0.27 $0.54
2012 2013 2014 2015 2016 2017 2018
19.0% 19.3% 18.9% 18.0% 17.2% 18.6% 19.6%
Annual Financial Performance
Y-o-Y
Growth(6%) 13% (24%) (33%) 20% 14%
Y-o-Y
Growth21% (5%) NM 67% 125% 100%
1. See reconciliation of non-GAAP measures to GAAP measures in the appendix2. Includes $45 million of non-cash charges recorded in cost of goods sold & the international segment for the year ended December 31, 2016. Charges relate to a restructuring of our Australian business and market conditions in Iraq as well as an increase in reserves for
excess and obsolete inventory in the U.S. and Canada as a result of the market outlook for certain products. Excluding these charges for the year ended December 31, 2016, gross profit, as reported would be $513 million (16.9%) and adjusted gross profit would be $568 million (18.7%).
3. Includes $6 million of non-cash charges recorded in cost of goods sold & in the international segment for the year ended December 31, 2017. Charges are related to reducing our local presence in Iraq. Excluding these charges for the year ended December 31, 2017 gross profit, as reported would be $588 million (16.1%) and adjusted gross profit would be $683 million (18.7%).
32
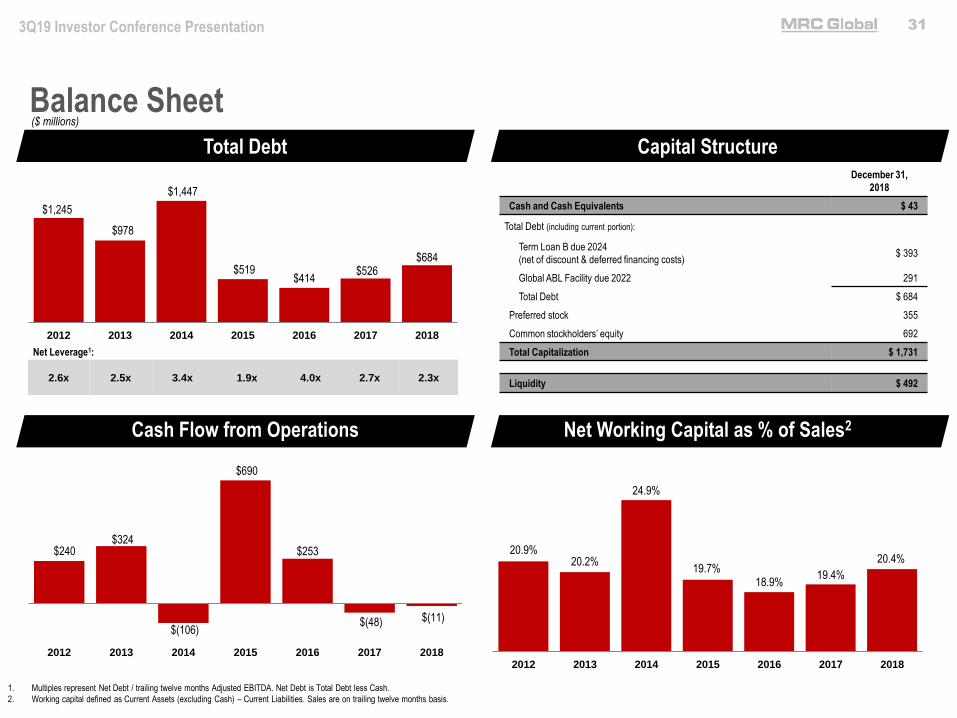
313Q19 Investor Conference Presentation
$240 $324
$(106)
$690
$253
$(48) $(11)
2012 2013 2014 2015 2016 2017 2018
Total Debt Capital Structure
Cash Flow from Operations Net Working Capital as % of Sales2
($ millions)
December 31,
2018
Cash and Cash Equivalents $ 43
Total Debt (including current portion):
Term Loan B due 2024
(net of discount & deferred financing costs)$ 393
Global ABL Facility due 2022 291
Total Debt $ 684
Preferred stock 355
Common stockholders’ equity 692
Total Capitalization $ 1,731
Liquidity $ 492
$1,245
$978
$1,447
$519 $414
$526 $684
2012 2013 2014 2015 2016 2017 2018
Balance Sheet
1. Multiples represent Net Debt / trailing twelve months Adjusted EBITDA. Net Debt is Total Debt less Cash.
2. Working capital defined as Current Assets (excluding Cash) – Current Liabilities. Sales are on trailing twelve months basis.
20.9%20.2%
24.9%
19.7%18.9%
19.4%
20.4%
2012 2013 2014 2015 2016 2017 2018
2.6x 2.5x 3.4x 1.9x 4.0x 2.7x 2.3x
Net Leverage1:
323Q19 Investor Conference Presentation
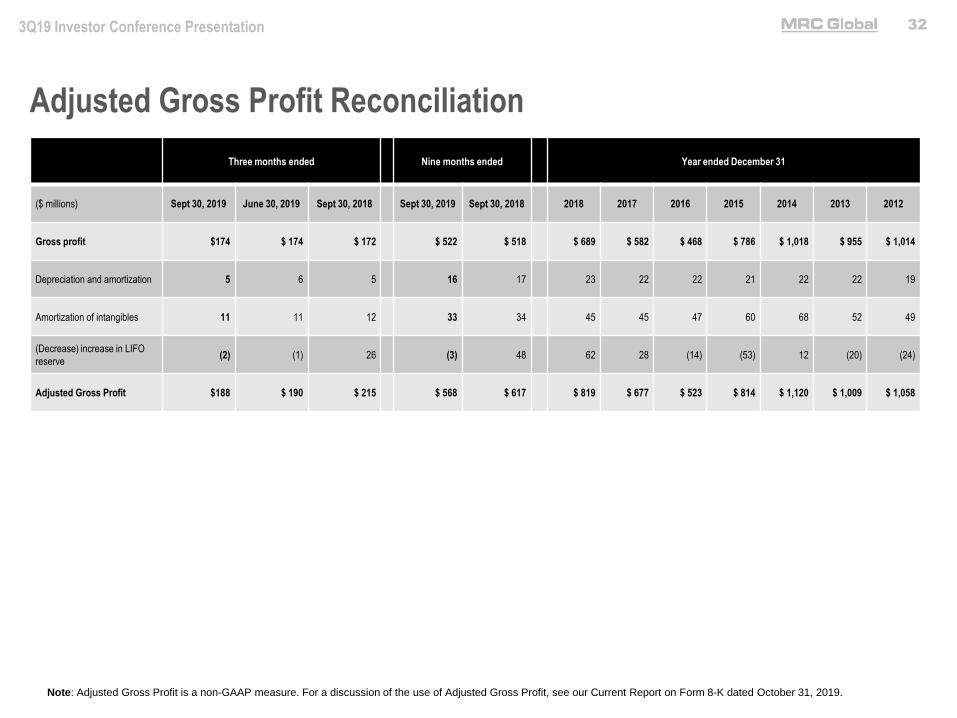
Adjusted Gross Profit Reconciliation
Three months ended Nine months ended Year ended December 31
($ millions) Sept 30, 2019 June 30, 2019 Sept 30, 2018 Sept 30, 2019 Sept 30, 2018 2018 2017 2016 2015 2014 2013 2012
Gross profit $174 $ 174 $ 172 $ 522 $ 518 $ 689 $ 582 $ 468 $ 786 $ 1,018 $ 955 $ 1,014
Depreciation and amortization 5 6 5 16 17 23 22 22 21 22 22 19
Amortization of intangibles 11 11 12 33 34 45 45 47 60 68 52 49
(Decrease) increase in LIFO
reserve(2) (1) 26 (3) 48 62 28 (14) (53) 12 (20) (24)
Adjusted Gross Profit $188 $ 190 $ 215 $ 568 $ 617 $ 819 $ 677 $ 523 $ 814 $ 1,120 $ 1,009 $ 1,058
Note: Adjusted Gross Profit is a non-GAAP measure. For a discussion of the use of Adjusted Gross Profit, see our Current Report on Form 8-K dated October 31, 2019.

333Q19 Investor Conference Presentation
Adjusted EBITDA ReconciliationThree months ended Nine months ended Year ended December 31
($ millions)Sept 30,
2019
June 30,
2019
Sept 30,
2018
Sept 30,
2019
Sept 30,
20182018 2017 2016 2015 2014 2013 2012
Net income (loss) $ 21 $ 24 $ 24 $ 63 $ 64 $ 74 $ 50 $ (83) $ (331) $ 144 $ 152 $ 118
Income tax expense (benefit) 8 8 - 22 15 21 (43) (8) (11) 82 85 64
Interest expense 10 10 10 31 28 38 31 35 48 62 61 113
Depreciation and amortization 5 6 5 16 17 23 22 22 21 22 22 19
Amortization of intangibles 11 11 12 33 34 45 45 47 60 68 52 49
(Decrease) increase in LIFO reserve (2) (1) 26 (3) 48 62 28 (14) (53) 12 (20) (24)
Inventory-related charges - - - - - - 6 40 - - - -
Goodwill & intangible asset impairment - - - - - - - - 462 - - -
Change in fair value of derivative
instruments- - - - (1) (1) 1 (1) 1 1 (5) (2)
Equity-based compensation expense 5 3 4 12 11 14 16 12 10 9 15 8
Severance & restructuring charges 5 - - 5 - 4 14 20 14 8 1 -
Write off of debt issuance costs - - - - 1 1 8 1 3 - - -
Litigation matter - - - - - - 3 - 3 - - -
Foreign currency (gains) losses (1) (1) (1) (1) - (1) (2) 4 3 3 13 (1)
Loss on disposition of non-core product line - - - - - - - - 5 10 - -
Insurance charge - - - - - - - - - - 2 -
Cancellation of executive employment
agreement (cash portion)- - - - - - - - - 3 - -
Expenses associated with refinancing - - - - - - - - - - 5 2
Loss on early extinguishment of debt - - - - - - - - - - - 114
Pension settlement - - - - - - - - - - - 4
Other expense (income) - - - - - - - - - - 3 (1)
Adjusted EBITDA $ 62 $ 60 $ 80 $ 178 $ 217 $ 280 $ 179 $ 75 $ 235 $ 424 $ 386 $ 463
Note: Adjusted EBITDA is a non-GAAP measure. For a discussion of the use of Adjusted EBITDA, see our Current Report on Form 8-K dated October 31, 2019.