Embed Size (px)
Citation preview

fcx.com
3rd Quarter 2018 Earnings Conference Call
October 24, 2018
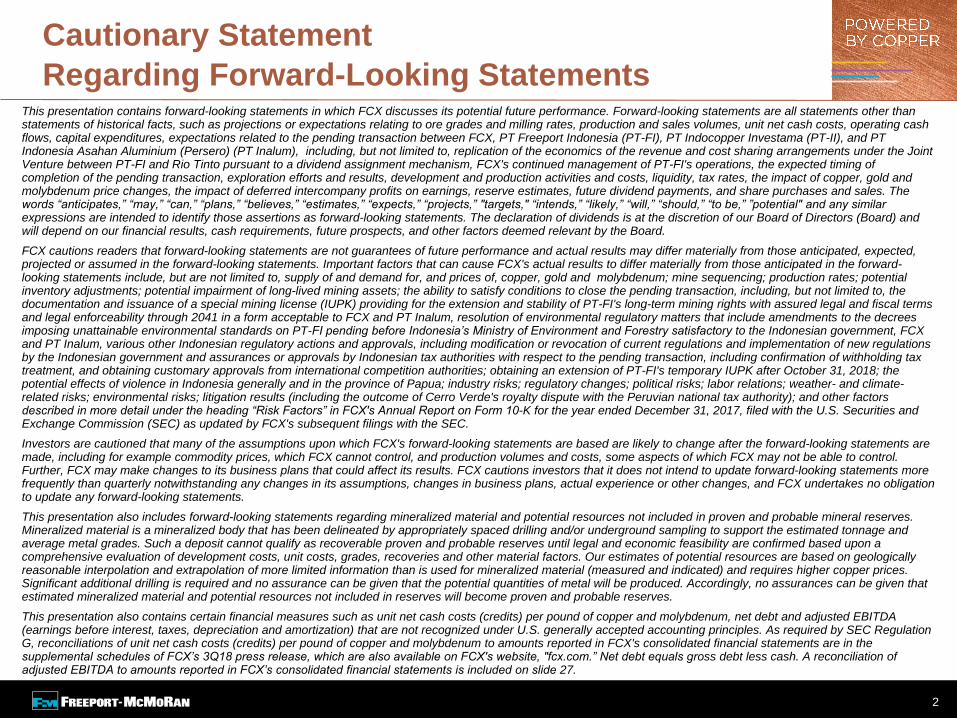
Cautionary Statement
Regarding Forward-Looking Statements This presentation contains forward-looking statements in which FCX discusses its potential future performance. Forward-looking statements are all statements other than statements of historical facts, such as projections or expectations relating to ore grades and milling rates, production and sales volumes, unit net cash costs, operating cash flows, capital expenditures, expectations related to the pending transaction between FCX, PT Freeport Indonesia (PT-FI), PT Indocopper Investama (PT-II), and PT Indonesia Asahan Aluminium (Persero) (PT Inalum), including, but not limited to, replication of the economics of the revenue and cost sharing arrangements under the Joint Venture between PT-FI and Rio Tinto pursuant to a dividend assignment mechanism, FCX's continued management of PT-FI's operations, the expected timing of completion of the pending transaction, exploration efforts and results, development and production activities and costs, liquidity, tax rates, the impact of copper, gold and molybdenum price changes, the impact of deferred intercompany profits on earnings, reserve estimates, future dividend payments, and share purchases and sales. The words “anticipates,” “may,” “can,” “plans,” “believes,” “estimates,” “expects,” “projects,” "targets," “intends,” “likely,” “will,” “should,” “to be,” ”potential" and any similar expressions are intended to identify those assertions as forward-looking statements. The declaration of dividends is at the discretion of our Board of Directors (Board) and will depend on our financial results, cash requirements, future prospects, and other factors deemed relevant by the Board.
FCX cautions readers that forward-looking statements are not guarantees of future performance and actual results may differ materially from those anticipated, expected, projected or assumed in the forward-looking statements. Important factors that can cause FCX's actual results to differ materially from those anticipated in the forward-looking statements include, but are not limited to, supply of and demand for, and prices of, copper, gold and molybdenum; mine sequencing; production rates; potential inventory adjustments; potential impairment of long-lived mining assets; the ability to satisfy conditions to close the pending transaction, including, but not limited to, the documentation and issuance of a special mining license (IUPK) providing for the extension and stability of PT-FI's long-term mining rights with assured legal and fiscal terms and legal enforceability through 2041 in a form acceptable to FCX and PT Inalum, resolution of environmental regulatory matters that include amendments to the decrees imposing unattainable environmental standards on PT-FI pending before Indonesia’s Ministry of Environment and Forestry satisfactory to the Indonesian government, FCX and PT Inalum, various other Indonesian regulatory actions and approvals, including modification or revocation of current regulations and implementation of new regulations by the Indonesian government and assurances or approvals by Indonesian tax authorities with respect to the pending transaction, including confirmation of withholding tax treatment, and obtaining customary approvals from international competition authorities; obtaining an extension of PT-FI's temporary IUPK after October 31, 2018; the potential effects of violence in Indonesia generally and in the province of Papua; industry risks; regulatory changes; political risks; labor relations; weather- and climate-related risks; environmental risks; litigation results (including the outcome of Cerro Verde's royalty dispute with the Peruvian national tax authority); and other factors described in more detail under the heading “Risk Factors” in FCX's Annual Report on Form 10-K for the year ended December 31, 2017, filed with the U.S. Securities and Exchange Commission (SEC) as updated by FCX's subsequent filings with the SEC.
Investors are cautioned that many of the assumptions upon which FCX's forward-looking statements are based are likely to change after the forward-looking statements are made, including for example commodity prices, which FCX cannot control, and production volumes and costs, some aspects of which FCX may not be able to control. Further, FCX may make changes to its business plans that could affect its results. FCX cautions investors that it does not intend to update forward-looking statements more frequently than quarterly notwithstanding any changes in its assumptions, changes in business plans, actual experience or other changes, and FCX undertakes no obligation to update any forward-looking statements.
This presentation also includes forward-looking statements regarding mineralized material and potential resources not included in proven and probable mineral reserves. Mineralized material is a mineralized body that has been delineated by appropriately spaced drilling and/or underground sampling to support the estimated tonnage and average metal grades. Such a deposit cannot qualify as recoverable proven and probable reserves until legal and economic feasibility are confirmed based upon a comprehensive evaluation of development costs, unit costs, grades, recoveries and other material factors. Our estimates of potential resources are based on geologically reasonable interpolation and extrapolation of more limited information than is used for mineralized material (measured and indicated) and requires higher copper prices. Significant additional drilling is required and no assurance can be given that the potential quantities of metal will be produced. Accordingly, no assurances can be given that estimated mineralized material and potential resources not included in reserves will become proven and probable reserves.
This presentation also contains certain financial measures such as unit net cash costs (credits) per pound of copper and molybdenum, net debt and adjusted EBITDA (earnings before interest, taxes, depreciation and amortization) that are not recognized under U.S. generally accepted accounting principles. As required by SEC Regulation G, reconciliations of unit net cash costs (credits) per pound of copper and molybdenum to amounts reported in FCX's consolidated financial statements are in the supplemental schedules of FCX’s 3Q18 press release, which are also available on FCX's website, "fcx.com.” Net debt equals gross debt less cash. A reconciliation of adjusted EBITDA to amounts reported in FCX’s consolidated financial statements is included on slide 27.
2

3Q18 Highlights($ in bn)Consolidated Results
$0.5(3)
Operating
Cash Flow CAPEX
$1.25
Key Stats 3Q18 YTD
Copper Sales (bn lbs) 1.0 3.0
Gold Sales (mm ozs) 0.8 2.1
Molybdenum Sales (mm lbs) 22 70
Realized Copper Price ($/lb) $2.80 $2.96
Unit Net Cash Costs(1)($/lb) $0.93 $0.95
Sharp Focus on Productivity, Cost
Management, Capital Discipline and
Initiatives to Build Value for Shareholders
Unit Net Cash Costs: $0.93/lb(1),
23% Below 3Q17
Operating Cash Flows Exceeded CAPEX
by $740 mm in 3Q & ~$2.5 bn YTD
Net Debt(2) of $6.6 bn at 9/30/18, $2.1 bn
Less than Start of Year
Definitive Agreement with PT Inalum –
Establishes Path Forward to Long-Term
Stability in Indonesia and De-risks World-
class Asset
Underground Transition at Grasberg
On Track
Lone Star Development Ongoing –
Potential to Grow Larger (1) Includes 7¢/lb in 3Q18 and 2¢/lb for the 9-mos ended 2018 associated with
nonrecurring charges for Cerro Verde's new 3-yr CLA
(2) Net debt equals gross debt less consolidated cash.
(3) Includes $0.4 bn in 3Q18 and $0.9 bn YTD for major projects
$1.4(3)
$3.9
3Q18 9-mos ended 2018
3
See Cautionary Statement.
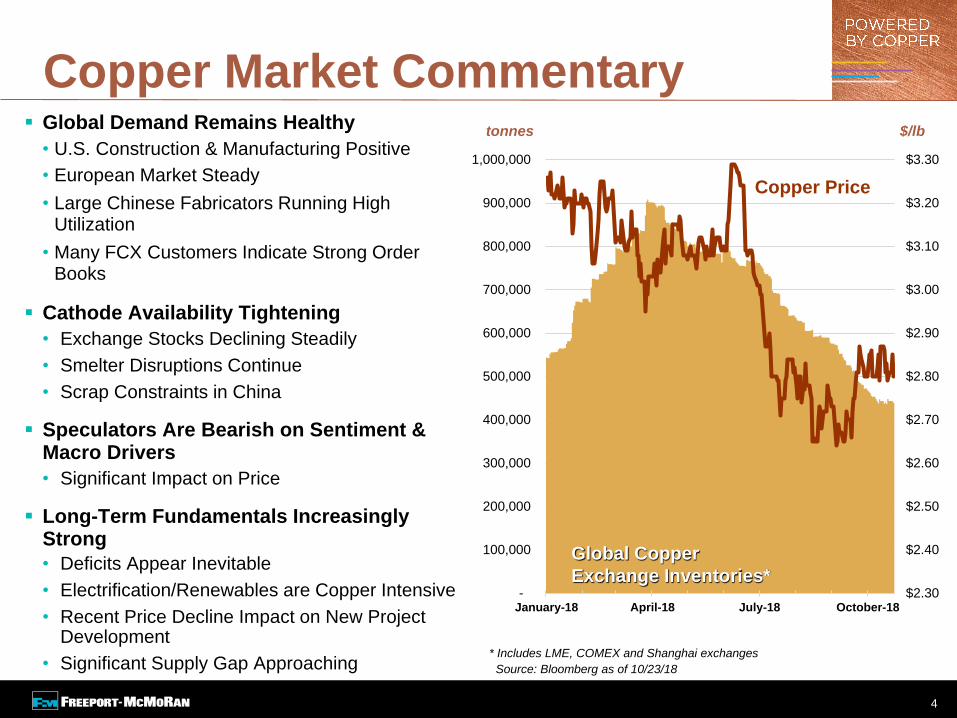
Copper Market Commentary Global Demand Remains Healthy
• U.S. Construction & Manufacturing Positive
• European Market Steady
• Large Chinese Fabricators Running High Utilization
• Many FCX Customers Indicate Strong Order Books
Cathode Availability Tightening
• Exchange Stocks Declining Steadily
• Smelter Disruptions Continue
• Scrap Constraints in China
Speculators Are Bearish on Sentiment & Macro Drivers
• Significant Impact on Price
Long-Term Fundamentals Increasingly Strong
• Deficits Appear Inevitable
• Electrification/Renewables are Copper Intensive
• Recent Price Decline Impact on New Project Development
• Significant Supply Gap Approaching
4
tonnes
$2.30
$2.40
$2.50
$2.60
$2.70
$2.80
$2.90
$3.00
$3.10
$3.20
$3.30
-
100,000
200,000
300,000
400,000
500,000
600,000
700,000
800,000
900,000
1,000,000
January-18 April-18 July-18 October-18
* Includes LME, COMEX and Shanghai exchanges
Source: Bloomberg as of 10/23/18
Global Copper
Exchange Inventories*
Copper Price
$/lb
5
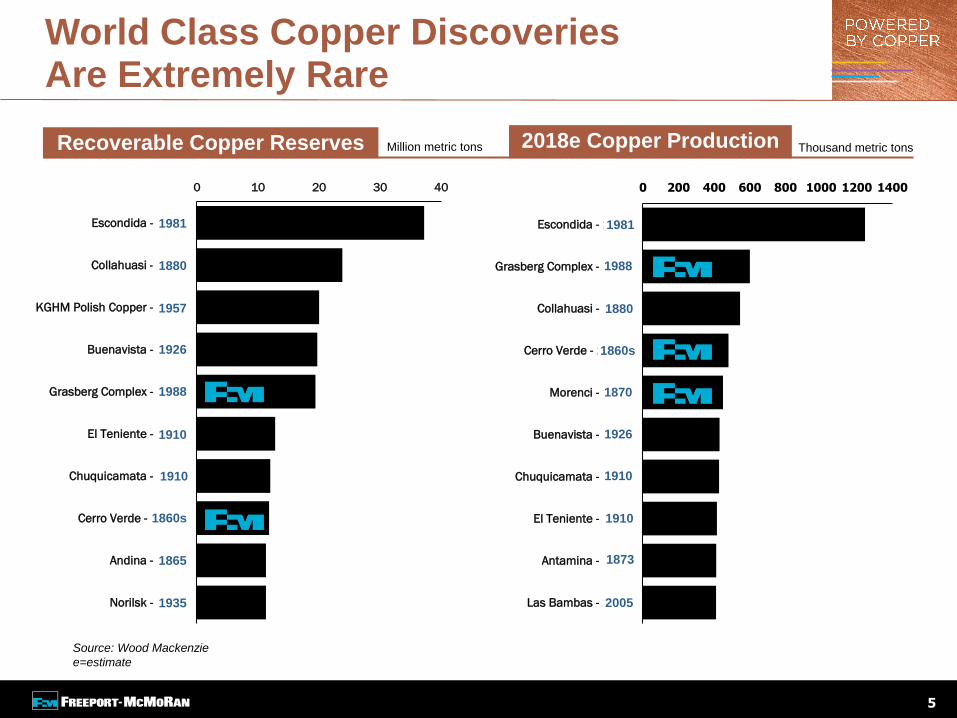
World Class Copper Discoveries Are Extremely Rare
2018e Copper Production Recoverable Copper Reserves
0 10 20 30 40
Escondida - 1981
Collahuasi - 1880
KGHM Polish Copper - 1957
Buenavista - 1899
Grasberg Complex - 1988
El Teniente - 1910
Chuquicamata - 1910
Cerro Verde - 1860s
Andina - 1865
Norilsk - 1935
0 200 400 600 800 1000 1200 1400
Escondida - 1981
Grasberg Complex - 1988
Collahuasi - 1880
Cerro Verde - 1860s
Morenci - 1870
Buenavista - 1926
Chuquicamata - 1910
El Teniente - 1910
Antamina - 1873
Las Bambas - 2005
1981
1880
1957
1926
1988
1910
1860s
1865
1935
1910
1981
1926
1880
1860s
1870
1910
1988
Source: Wood Mackenzie
e=estimate
Million metric tons Thousand metric tons
1910
1873
2005
Ongoing Focus on Productivity and Cost
Management
Production and Cost Outlook Expected to
be More Stable Following Actions in 2018
to Re-establish Full Mining Activities
Following 2015/2016 Curtailments
Expanding Mining Rates to Enhance
Long-term Options
Evaluating Mine Planning Options at
Various Copper Prices
Lone Star Development Underway –
Opportunity for World-Class Resource
Evaluating Project Pipeline to Rank/
Sequence Next Phase of Project
Development
3Q18 Operations Update
6
Americas Indonesia
Strong 3Q and YTD Performance
Mining Final Phase of Surface Mine - Pit
Steepening Has Accelerated Metal
Deep MLZ
• Commenced Hydraulic Fracturing in 3Q18to Manage Seismicity & Pre-condition Cave
• Response To Date Has Been Effective
• On Track for Mid-2019 Startup
Grasberg Block Cave
• Infrastructure in Place – Successful Testing of Underground Rail and Ore Flow in 3Q
• Conducted Initial Blast in Undercut During 3Q
• Rock Testing Indicates Suitability for Large-Scale Caving
See Cautionary Statement.
POWERED BY COPPER
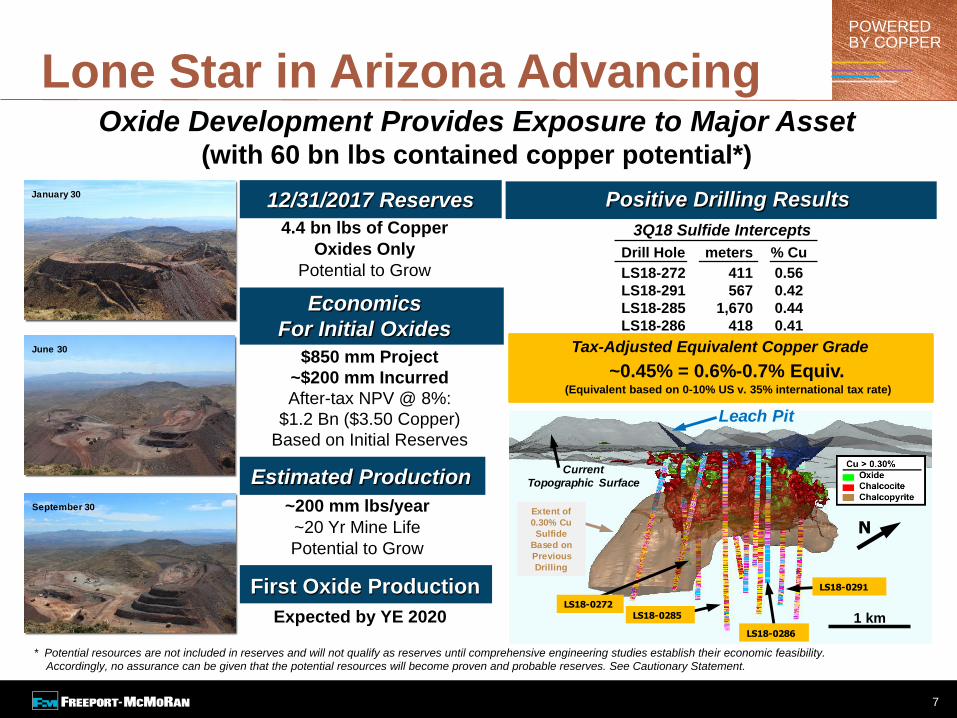
Lone Star in Arizona Advancing
* Potential resources are not included in reserves and will not qualify as reserves until comprehensive engineering studies establish their economic feasibility.
Accordingly, no assurance can be given that the potential resources will become proven and probable reserves. See Cautionary Statement.
7
Oxide Development Provides Exposure to Major Asset(with 60 bn lbs contained copper potential*)
Estimated Production
12/31/2017 Reserves
4.4 bn lbs of Copper
Oxides Only
Potential to Grow
Economics
For Initial Oxides
First Oxide Production
$850 mm Project
~$200 mm Incurred
After-tax NPV @ 8%:
$1.2 Bn ($3.50 Copper)
Based on Initial Reserves
~200 mm lbs/year
~20 Yr Mine Life
Potential to Grow
Expected by YE 2020
3Q18 Sulfide Intercepts
Drill Hole meters % Cu
LS18-272 411 0.56
LS18-291 567 0.42
LS18-285 1,670 0.44
LS18-286 418 0.41
January 30
June 30
September 30
NExtent of
0.30% Cu
Sulfide
Based on
Previous
Drilling
Leach Pit
Current
Topographic Surface
LS18-0286
LS18-0285
LS18-0272
LS18-0291
1 km
Positive Drilling Results
Tax-Adjusted Equivalent Copper Grade
~0.45% = 0.6%-0.7% Equiv. (Equivalent based on 0-10% US v. 35% international tax rate)

POWERED BY COPPERPT-FI Underground Ramp-up
Contribution by Deposit
Grasberg open pit DOZ DMLZBig Gossan Grasberg BC
2018e 2022e
1.2
2.7
1.81.9
Aggregate Metal(bn lbs Cu & mm ozs Au)
Ore Milled(000’s t/d)
176
113105
161
215
30K t/d
64K t/d
103K t/d25K t/d
58K t/d
80K t/d
2018e 2019e 2020e 2021e 2022e2023e-2027e
5-yr Avg*
1.71.8
Cu Au Cu Au Cu Au
* 2023e-2027e average includes all ore bodies as included in reserves as of year-end 2017, including Kucing LiarNote: Timing of annual sales will depend upon mine sequencing, shipping schedules and other factors. Assumes extension of PT-FI’s long term
mining rights or extension of PT-FI’s temporary IUPK after 10/31/18. See slide 23 for PT-FI’s share of metal net of Rio Tinto’s interest.
e = estimate. Amounts are projections; see Cautionary Statement.
8
Aggregate
Cu (bn lbs) 1.2 0.6 0.8 1.3 1.8
Au (mm ozs) 2.7 0.8 0.9 1.6 1.9

De-risking a World-Class Asset - “Win/Win” PartnershipWith Long-term Stability
9
Positive Long-Term Future
25.1
38.8
22.820.4
PT
-FI Y
E 2
017
PT
-FI +
Rio
Tin
to
YE
2017
Pro
Fo
rma
Aft
er
Sale
o
f P
T-I
I
FCX Equity Share
Grasberg Copper Reserves(bns of lbs)
23.2
33.9
21.018.8
PT
-FI Y
E 2
017
PT
-FI +
Rio
Tin
to
YE
2017
Grasberg Gold Reserves(mms of ozs)
FCX Equity Share
Enhanced Alignment of Interests
• ~51%/49% Partnership with Indonesian Government SOE
Extension of Long-term Operating Rights
• Rights Through 2041 with Assured Fiscal & Legal Terms and Legal Enforceability
• No Significant Change in Fiscal Terms
Governance
• FCX Management of Operations
Minimal Dilution
• FCX Economics Substantially Similar Post-Transaction
Focus on Execution
NOTE: Transaction expected to close in late 2018 or early 2019, subject to satisfaction of closing conditions. See slide 22 for summary of significant terms and conditions of
the definitive PT-FI Divestment Agreement signed on 9/27/18. Reserves (payable) based on assumed prices of $2/lb Cu and $1,000/oz Au. See Cautionary Statement.
Pro
Fo
rma
Aft
er
Sale
o
f P
T-I
I

FCX’s Diversified Global Footprint
(1) Reserves (payable) based on assumed prices of $2/lb Cu. Mineralized material (contained) based on assumed prices of $2.20/lb Cu. Mineralized Material are not
included in reserves and will not qualify as reserves until comprehensive engineering studies establish their economic feasibility. Accordingly, no assurance
can be given that the estimated mineralized material will become proven and probable reserves. See Cautionary Statement.
Global Leadership Position
Operate All Assets – Operational
Synergies, Shared Resources, Portfolio-
Based Capital Allocation
Significant Current Production Capacity
with Long-Term Expansion Options
• 75% of Reserves + Mineralized Material
in the Americas
Experienced Team: Operations,
Development, Execution, Innovation
Leading Position in U.S. with Favorable
Tax & Regulatory Environment
Exposure to Large Brown Field and
Green Field Development Opportunities
Unique Portfolio Difficult to Replicate
Copper Equivalent Capacity(2) (FCX Equity Share): ~4.5 bn lbs
Cost to Develop Green Field Capacity $8 - $10/lb
Implied Replacement Value of Current Capacity $36-$45 bn
(2) CuEq factors: assume $2.50/lb Cu, $10/lb Mo (CuEq factor: 4 lbs CuEq
per lb Mo) and $1,250/oz Au (500 lbs CuEq per oz Au)
Competitive Strengths
174 Bn Lbs87 Bn Lbs
SouthAmerica
32%
Indonesia25%
North America43%
Copper Reserves Plus Mineralized Material (1)
CopperReserves (1)
SouthAmerica
32%
Indonesia29%
North America39%
10

2018e Outlook* Copper: 3.8 Billion lbs.
Gold: 2.45 Million ozs.
Molybdenum: 95 Million lbs.
Sales
Outlook
Unit Cost
of Copper
Operating
Cash Flows (2)
Capital
Expenditures
Site Production & Delivery: $1.75/lb
After By-product Credits: $1.06/lb(1) (4Q18e: $1.45/lb)
~$4.2 Billion (@ $2.85/lb Copper for 4Q18e, Including
~$500 Million in Working Capital Uses)
Each 10¢/lb Change in Copper for 4Q18 = $105 Million
$2.0 Billion
• $1.2 Billion for Major Projects, Including $1.1 Billion for Underground
Development in Indonesia and Development of Lone Star Oxide Project
• $0.8 Billion for Other Mining
(1) Assumes average prices of $1,200/oz gold and $12/lb molybdenum for 4Q18e. 2018e includes 2¢/lb associated with nonrecurring charges for Cerro Verde's new 3-yr CLA.
(2) Assumes average prices of $1,200/oz gold and $12/lb molybdenum for 4Q18e; each $100/oz change in gold would have an approximate $30 mm impactand each $2/lb change in molybdenum would have an approximate $15 mm impact for the remainder of 2018.
* All projections for 2018 in this presentation assume extension of PT-FI’s long-term mining rights or an extension of PT-FI’s temporary IUPK after October 31, 2018.
e = estimate. See Cautionary Statement.
11

Sales Profile
Note: Consolidated copper sales include 670 mm lbs in 2017, 685 mm lbs in
2018e, 670 mm lbs in 2019e and ~690 mm lbs per year in 2020e - 2022e
for noncontrolling interest; excludes purchased copper.
*Previous estimate was 3.97 bn lbs; current estimate is 3.94 bn lbs.
e = estimate. See Cautionary Statement.
Note: Consolidated gold sales include 144k ozs in 2017, 228k ozs in 2018e, 70k ozs
in 2019e, ~135k ozs per year for 2020e-2022e for noncontrolling interest.
0
1
2
3
2017 2018e 2019e 2020e -2022e AVG
1.6
2.45
0.75
1.45
(million ozs)
(million lbs)
(billion lbs)
0
25
50
75
100
2017 2018e 2019e 2020e -2022e AVG
95 95 92 90
Molybdenum Sales
Gold SalesCopper Sales
0
1
2
3
4
2017 2018e 2019e 2020e -2022eAVG*
3.7 3.8
3.3
3.9
Tra
nsitio
n Y
ear
12

EBITDA and Cash Flow at Various Copper Prices
($1,200/oz Gold, $12/lb Molybdenum)
(US$ billions)
Note: Assumes extension of PT-FI’s long term mining rights or extension of PT-FI’s temporary IUPK after 10/31/18. For 2019e - 2020e and 2021e – 2022e average price sensitivities, see slide 25. EBITDA equals operating income plus depreciation, depletion and amortization. e = estimate. See Cautionary Statement.
Cu $3.00/lb Cu $3.25/lb Cu $3.50/lb
Excludes Working Capital Changes ($1,200/oz Gold, $12/lb Molybdenum)Average Operating Cash Flow
Average EBITDA
13
$0
$2
$4
$6
$8
$10
Average’21e/’22e
Average’19e/’20e
Cu $3.00/lb Cu $3.25/lb Cu $3.50/lb$0
$2
$4
$6
$8
Average’21e/’22e
Average’19e/’20e
Transition Yrs
Transition Yrs

2017 2018e 2019e
Capital Expenditures
Note: Includes capitalized interest; excludes potential spending on new smelter in Indonesia. e= estimate. See Cautionary Statement.
Major
Mining
Projects
$0.9
$1.2*
$2.0
$1.4
* Major mining projects include CAPEX associated with Grasberg underground development ($0.8 bn per year in 2018e and 2019e) and Lone Star ($0.24 bn in 2018e and
$0.37 bn in 2019e). Assumes extension of PT-FI’s long term mining rights or extension of PT-FI’s temporary IUPK after 10/31/18.
$1.3*
$2.3
$0.5
$0.8 $1.0Other Mining
(US$ billions)
14

Financial Policy
Net Debt at 9/30/18: $6.6 Bn*
• LTM Leverage Ratio: 0.8x
Significant Deleveraging Over Last
Two Years
Positive Market to Enable Enhanced
Returns to Shareholders
Disciplined Approach to Investing
in Attractive Growth Projects
Board Reinstated Quarterly Cash
Dividend on Common Stock in 1Q18
Board Reviews Financial Policy on
Ongoing Basis
15
* Net debt equals gross debt less consolidated cash. See Cautionary Statement.
Balanced Approach

Premier Portfolio of Copper Assets
Copper Arguably Most Attractive Fundamental Market Outlook
Strong Margins and Cash Flows
Long-lived Reserves
Attractive Long-term Development Pipeline Within Existing Portfolio
Geographically Diversified – 75% from Americas
Experienced, Disciplined and Shareholder Focused Management Team
Balance Sheet & Indonesia Overhang Addressed
Attractive Valuation/Poised for Outperformance
FCX: Primed for Success
16
See Cautionary Statement.

Reference
Slides

Financial Highlights
CopperConsolidated Volumes (mm lbs) 1,044 3,026Average Realization (per lb) $2.80 $2.96Site Production & Delivery Costs (1)
(per lb) $1.73 $1.70Unit Net Cash Costs (1)
(per lb) $0.93 $0.95
GoldConsolidated Volumes (000’s ozs) 837 2,123Average Realization (per oz) $1,191 $1,249
MolybdenumConsolidated Volumes (mm lbs) 22 70Average Realization (per lb) $12.40 $12.41
3Q18 9-mos 2018
Financial Results
(1) Includes 7¢/lb in 3Q18 and 2¢/lb for the 9-mos ended 2018 associated with nonrecurring charges for Cerro Verde's new 3-yr CLA.
(2) After adjusting for net gains of $42 mm (3¢/share), primarily reflecting $70 mm related to adjustments to assets held for sale and the fair value of potential contingent consideration, partly offset by $22 mm of nonrecurring charges for Cerro Verde's new 3-yr CLA, adjusted net income attributable to common stock totaled $514 mm (35¢/share) in 3Q18. For additional information, refer to "Adjusted Net Income" in the supplemental schedules of FCX’s 3Q18 press release, which are available on FCX's website.
(3) Net working capital sources (uses) and timing of other tax payments of $59 mm for 3Q18 and $(154) mm for 9-mos ended 2018.
Revenues $4.9 $14.9
Net Income Attributable to Common Stock $0.6 $2.1
Diluted Net Income Per Share $0.38 $1.45
Operating Cash Flows $1.25 $3.9
Capital Expenditures $0.5 $1.4
Total Debt $11.1 $11.1
Consolidated Cash $4.6 $4.6
(3)
(2)
(2)
Sales Data
(in billions, except per share amounts)
18

3Q18 Mining Operating Summary
(1) Includes 21¢/lb for South America and 7¢/lb for consolidated FCX associated with nonrecurring charges for Cerro Verde's new 3-yr CLA.
(2) Includes 7 mm lbs in 3Q18 and 8 mm lbs for the 3Q17 from South America.
(3) Silver sales totaled 1.2 mm ozs in 3Q18 and 1.0 mm ozs in 3Q17.
(4) Silver sales totaled 1.2 mm ozs in 3Q18 and 666 k ozs in 3Q17.
NOTE: For a reconciliation of unit net cash costs (credits) per pound to production and delivery costs applicable to sales reported in FCX’s consolidated financial statements, refer to “Product Revenues and Production Costs” in the supplemental schedules of FCX’s 3Q18 press release, which is available on FCX’s website.
Cash Unit Costs (Credits)
Site Production & Delivery, excluding adjustments $1.98 $1.84(1) $1.40 $1.73 (1)
By-Product Credits (0.26) (0.23) (2.72) (1.12)
Treatment Charges 0.10 0.20 0.26 0.20
Royalties & Export Duties - - 0.34 0.12
Unit Net Cash Costs (Credits) $1.82 $1.81 $(0.72) $0.93
North America
2222(2)(2)
Momm lbs
3Q18 3Q17
347350
3Q18 3Q17
Cumm lbs
Indonesia (4)
258
368
3Q18 3Q17
352
831
3Q18 3Q17
South America (3)
3Q18 3Q17
326 327
3Q18 Unit Production Costs
Sales From Mines for 3Q18 & 3Q17
North SouthAmerica America Indonesia Consolidated(per lb of Cu)
by Region
Au000 ozs
19

1,232
South America
2018e Operating Estimates
(1) Estimates assume average prices of $2.85/lb for copper, $1,200/oz for gold and $12/lb for molybdenum for 4Q18e. Quarterly unit costs will vary significantly with quarterly metal sales volumes.
(2) Production costs include profit sharing in South America and severance taxes in North America.
(3) Includes 6¢/lb for South America and 2¢/lb for FCX consolidated associated with nonrecurring charges for Cerro Verde's new 3-yr CLA.
(4) Includes molybdenum produced in South America.
(5) Includes gold produced in North America.
95 (4)
Momm lbs
1,421
Cumm lbs
North America
(per lb of Cu)North South
America America Indonesia Consolidated
Cash Unit Costs (1)
Site Production & Delivery (2) $1.92 $1.78 (3) $1.50 $1.75 (3)
By-product Credits (0.25) (0.25) (2.66) (0.98)
Treatment Charges 0.11 0.19 0.26 0.18
Royalties & Export Duties - 0.01 0.36 0.11
Unit Net Cash Costs (Credits) $1.78 $1.73 (3) ($0.54) $1.06 (3)
2018e Unit Production Costs
Note: e = estimate. See Cautionary Statement.
2018e Sales by Region
1,163
Indonesia
2.45 (5)
Aumm ozs
20

0
300
600
900
1,200
1Q18 2Q18 3Q18 4Q18e
993 9891,044
790
2018e Quarterly Sales
Note: Consolidated gold sales include approximately 57k ozs in 1Q18, 63k ozsin 2Q18, 78k ozs in 3Q18 and 30k ozs in 4Q18e for noncontrolling interest.
e = estimate. See Cautionary Statement.
Note: Consolidated copper sales include approximately 166 mm lbs in 1Q18, 176 mm lbsin 2Q18, 186 mm lbs in 3Q18 and 157 mm lbs in 4Q18e for noncontrolling interest; excludes purchased copper.
(thousand ozs)(million lbs)
(million lbs)
Gold SalesCopper Sales
Molybdenum Sales
0
5
10
15
20
25
1Q18 2Q18 3Q18 4Q18e
24 2422
25
0
250
500
750
1000
1Q18 2Q18 3Q18 4Q18e
610676
837
330
21

POWERED BY COPPER
9/27/18 Definitive PT-FI Divestment Agreement
22
PT Inalum (an Indonesian SOE) and Provincial/Local Government to Acquire:
• PT Indocopper Investama (PT-II) Shares Owned by FCX for $350 mm Cash (5.6% Interest After 2022)
• Rio Tinto JV Interests for $3.5 bn Cash (40% After 2022)
PT Inalum to Contribute JV Interests to PT-FI in Exchange for 40% of PT-FI
• New Post-Transaction Ownership of PT-FI: PT Inalum 51.2% and FCX 48.8%
• Subject to a Dividend Assignment Mechanism to Replicate the JV Economics Through 2022
At Closing, PT-FI will be Granted IUPK Providing Long-term Mining Rights with Assured Fiscal
and Legal Terms and Legal Enforceability Through 2041
• IUPK Issued at Closing will Initially be Valid Through 2031 and Include Assured Extension through 2041
upon PT-FI’s Satisfaction of Conditions Related to Smelter Construction and Payment of State Revenues
in Accordance with IUPK
FCX to Continue to Manage PT-FI Operations
PT-FI (with FCX and PT Inalum as Shareholders) to Construct Smelter Within 5 Years
of Closing
Transaction Expected to Close in Late 2018 or Early 2019 Subject to Satisfaction of Conditions*
Until Pending Transaction is Closed, PT-FI has Reserved all Rights Under COW
* See Cautionary Statement for summary of significant closing conditions.

PT-FI Mine Plan PT-FI’s Share (Net of Rio Tinto) of Metal Sales, 2017-2022e
Copper, billion lbs Gold, million ozs
Total: 5.3 billion lbs copper
Annual Average: 1.06 billion lbs
Note: Timing of annual sales will depend upon mine sequencing, shipping schedules and other factors. Assumes extension of PT-FI’s long-term mining rights or extension of PT-FI’s
temporary IUPK after 10/31/18. Shortfalls to metal strip agreement with Rio Tinto carry forward to future periods. e = estimate. Amounts are projections; see Cautionary Statement.
1.01.16
0.56
0.8
1.31.5
1.8
1.54
2.44
0.750.9
1.6
1.9 1.9
2017e 2018e 2019e 2020e 2021e 2022e 2022e
2018e – 2022e
PT-FI Share
Total: 7.6 million ozs gold
Annual Average: 1.5 million ozs
2018e – 2022e
PT-FI Share
Transition Years
23
Including Rio
Tinto’s Interest

Plan View
DOZ
DMLZ
Grasberg &Kucing Liar
BigGossan
N
N
DOZ
DMLZ
GrasbergBlock Cave
KucingLiar
Grasbergopen pit
MLA
Common Infrastructure2,500 m elev
GrasbergBC Spur
Kucing Liar Spur
Big Gossan Spur
DMLZ Spur
Portals(at Ridge Camp)
BigGossan
Amole2,900 m elev
N
Grasberg Mining District
1980’s
1990’s
2000’s
Fu
ture
• DMLZ
• Grasberg BC
• Kucing Liar
DOZ block cave mine
IOZ block cave mine
GBT block cave mineDepleted
Depleted
Operating
Future development
DOZ(operating)
DMLZ
IOZ(depleted)
GBT(depleted)
In development
Start-up
Ertsberg East
1980’s
1990’s
2000’s
Fu
ture
• DMLZ
• Grasberg BC
• Kucing Liar
DOZ block cave mine
IOZ block cave mine
GBT block cave mineDepleted
Depleted
Operating
Future development
DOZ(operating)
DMLZ
IOZ(depleted)
GBT(depleted)
In development
Start-up
Ertsberg East
PT-FI History
of Block Caving
24
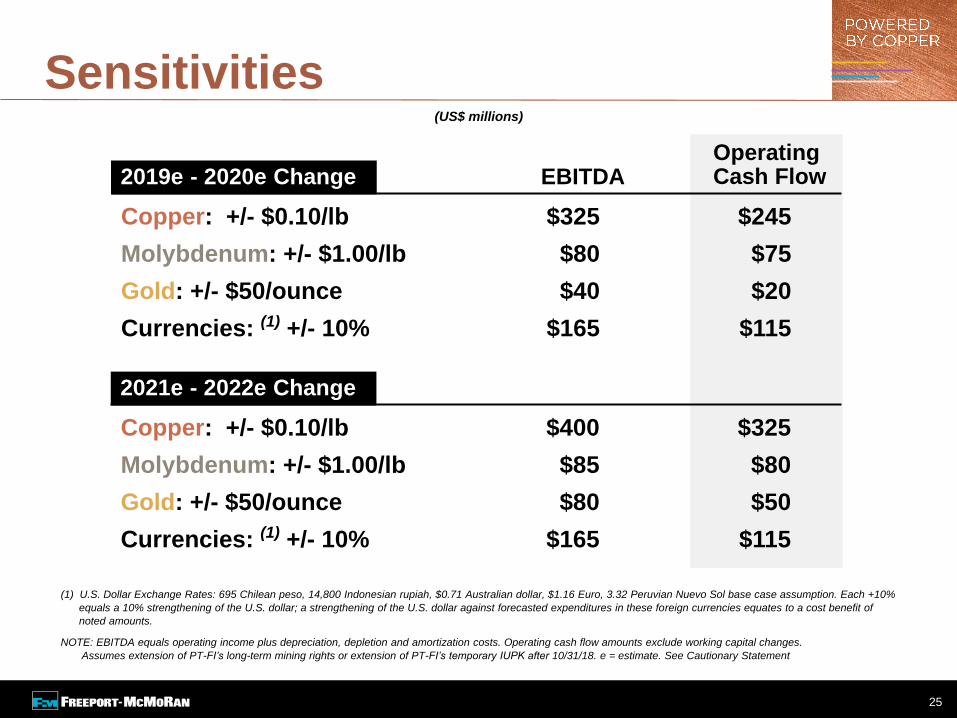
Sensitivities
(1) U.S. Dollar Exchange Rates: 695 Chilean peso, 14,800 Indonesian rupiah, $0.71 Australian dollar, $1.16 Euro, 3.32 Peruvian Nuevo Sol base case assumption. Each +10%
equals a 10% strengthening of the U.S. dollar; a strengthening of the U.S. dollar against forecasted expenditures in these foreign currencies equates to a cost benefit of
noted amounts.
NOTE: EBITDA equals operating income plus depreciation, depletion and amortization costs. Operating cash flow amounts exclude working capital changes.
Assumes extension of PT-FI’s long-term mining rights or extension of PT-FI’s temporary IUPK after 10/31/18. e = estimate. See Cautionary Statement
Copper: +/- $0.10/lb $325 $245
Molybdenum: +/- $1.00/lb $80 $75
Gold: +/- $50/ounce $40 $20
Currencies: (1) +/- 10% $165 $115
OperatingCash FlowEBITDA2019e - 2020e Change
(US$ millions)
25
Copper: +/- $0.10/lb $400 $325
Molybdenum: +/- $1.00/lb $85 $80
Gold: +/- $50/ounce $80 $50
Currencies: (1) +/- 10% $165 $115
2021e - 2022e Change
$0
$2
$4
$6
$8
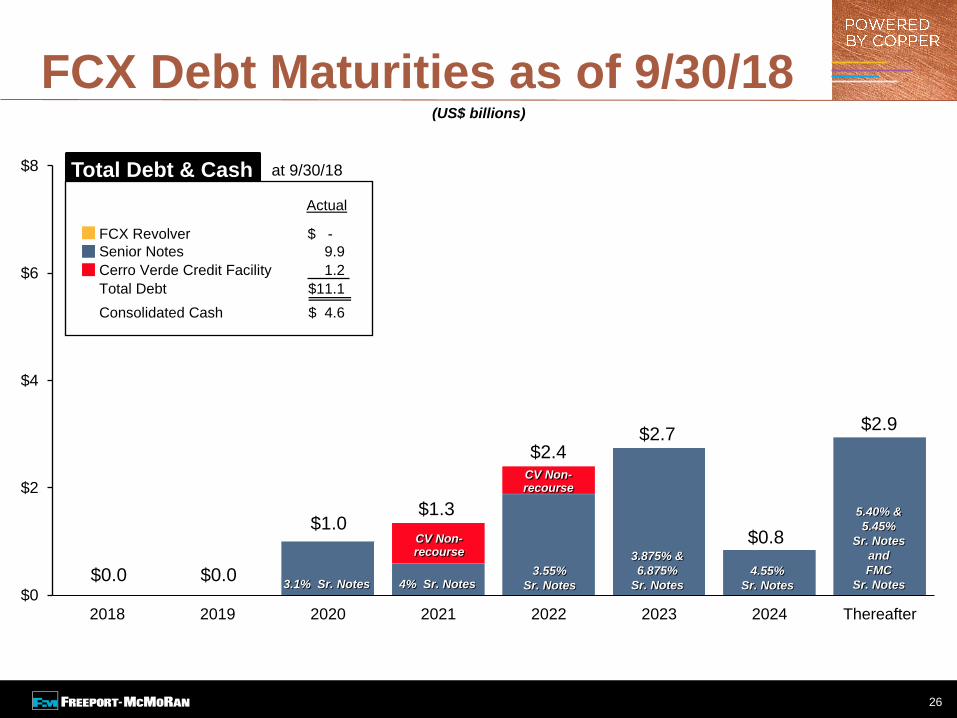
2018 2019 2020 2021 2022 2023 2024 Thereafter
FCX Debt Maturities as of 9/30/18
$0.0 $0.0
(US$ billions)
$1.3
$2.9
5.40% &
5.45%
Sr. Notes
and
FMC
Sr. Notes
$1.0
$2.4$2.7
3.875% &
6.875%
Sr. Notes
3.55%
Sr. Notes4% Sr. Notes3.1% Sr. Notes
$0.8
4.55%
Sr. Notes
CV Non-recourse
CV Non-recourse
Actual
FCX Revolver $ -
Senior Notes 9.9
Cerro Verde Credit Facility 1.2
Total Debt $11.1
Consolidated Cash $ 4.6
at 9/30/18Total Debt & Cash
26

Adjusted EBITDA Reconciliation
(in millions)
3Q18LTM Ended
9/30/18
Net Income Attributable to Common Stock – Continuing Operations $ 560 $3,161
Interest expense, net 143 604
Income tax provision 522 1,679
Depreciation, depletion and amortization 458 1,808
Net gain on sales of assets (70) (141)
Accretion 27 113
Gain on early extinguishment of debt - (21)
Other net charges (1) 71 271
Other income, net (14) (64)
Net income attributable to noncontrolling interests 108 567
Equity in affiliated companies’ net earnings (4) (9)
FCX Adjusted EBITDA – Continuing Operations (2) $1,801 $7,968
(1) Other net charges primarily include nonrecurring charges associated with Cerro Verde’s new 3-yr CLA ($69 mm before noncontrolling interest and taxes in 3Q18
and for the 12-months ended September 30, 2018). The 12-mos ended September 30, 2018, also reflects adjustments to environmental and related litigation
reserves of $209 mm.
(2) Adjusted EBITDA is a non-GAAP financial measure that is frequently used by securities analysts, investors, lenders and others to evaluate companies’ performance, including, among other things, profitability before the effect of financing and similar decisions. Because securities analysts, investors, lenders and
others use Adjusted EBITDA, management believes that our presentation of Adjusted EBITDA affords them greater transparency in assessing our financial
performance. Adjusted EBITDA should not be considered as a substitute for measures of financial performance prepared in accordance with GAAP. Adjusted EBITDA may not necessarily be comparable to similarly titled measures reported by other companies, as different companies calculate such measures differently.
27
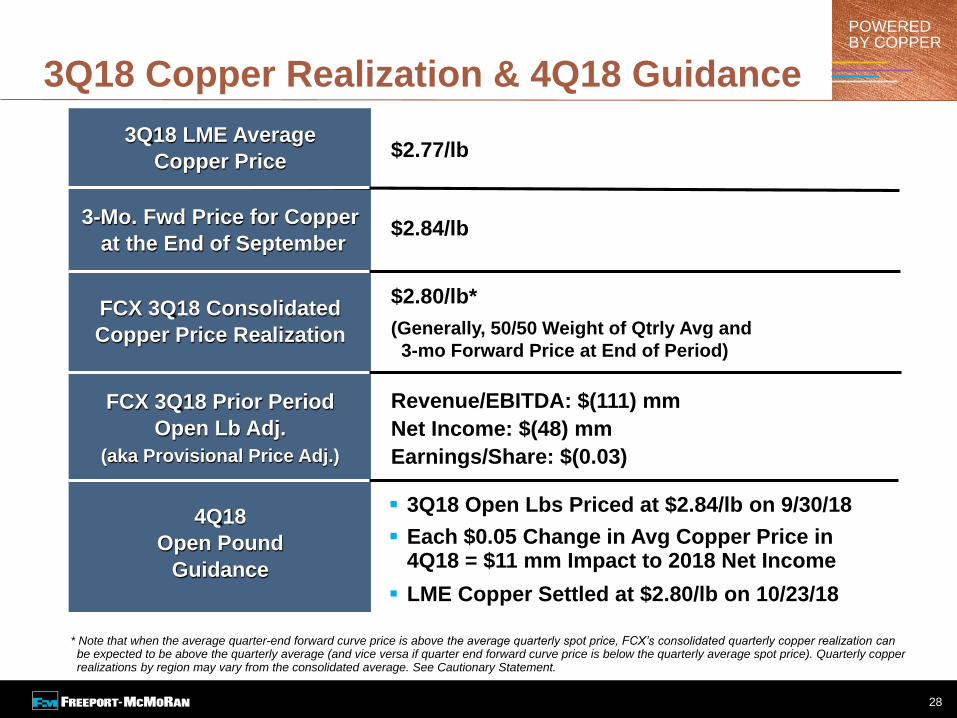
POWERED BY COPPER
$2.77/lb3Q18 LME Average
Copper Price
3-Mo. Fwd Price for Copper
at the End of September
FCX 3Q18 Consolidated
Copper Price Realization
FCX 3Q18 Prior Period
Open Lb Adj.
(aka Provisional Price Adj.)
$2.84/lb
$2.80/lb*
(Generally, 50/50 Weight of Qtrly Avg and
3-mo Forward Price at End of Period)
Revenue/EBITDA: $(111) mm
Net Income: $(48) mm
Earnings/Share: $(0.03)
* Note that when the average quarter-end forward curve price is above the average quarterly spot price, FCX’s consolidated quarterly copper realization can be expected to be above the quarterly average (and vice versa if quarter end forward curve price is below the quarterly average spot price). Quarterly copper realizations by region may vary from the consolidated average. See Cautionary Statement.
3Q18 Copper Realization & 4Q18 Guidance
3Q18 Open Lbs Priced at $2.84/lb on 9/30/18
Each $0.05 Change in Avg Copper Price in 4Q18 = $11 mm Impact to 2018 Net Income
LME Copper Settled at $2.80/lb on 10/23/18
4Q18
Open Pound
Guidance
28

POWERED BY COPPER
38% 38%1Q18
2Q18
3Q18e
4Q18e
NOTE: For financial statement purposes only; does not reflect cash taxes.
* The consolidated effective income tax rate is a function of the combined effective tax rates for the jurisdictions in which FCX operates. Accordingly, variations in the relative proportions of jurisdictional income result in fluctuations to FCX's consolidated effective income tax rate. Assuming achievement of current sales volume and cost estimates and average prices of $2.85 per pound for copper, $1,200 per ounce for gold and $12.00 per pound for molybdenum for 4Q18, FCX estimates its consolidated effective tax rate for the year 2018 will approximate 37 percent and would decrease with higher prices. e = estimate See Cautionary Statement.
2018e Consolidated Effective Tax Rate
29
Quarterly Rate
Projected
Annual Rate*
33% 36%
~32% ~37%
44% 38%