Embed Size (px)
Citation preview
5-6005-01-P4
CONFERENCE/WORKSHOP PRESENTATION
MATERIALS Jung-Su Lee and Kenneth H. Stokoe II (CTR) Thomas Scullion (TTI) Joe Leidy and Edward Oshinski (TxDOT) TxDOT Project 5-6005-01: Statewide Implementation of Total Pavement
Acceptance Device (TPAD) AUGUST 2014; PUBLISHED NOVEMBER 2014
Performing Organization: Center for Transportation Research The University of Texas at Austin 1616 Guadalupe, Suite 4.202 Austin, Texas 78701
Sponsoring Organization: Texas Department of Transportation Research and Technology Implementation Office P.O. Box 5080 Austin, Texas 78763-5080
Performed in cooperation with the Texas Department of Transportation and the Federal Highway Administration.
Introduction
Project No. 5-6005-01: Statewide Implementation of Total Pavement Acceptance Device (TPAD) is coming to completion. During the operating period of the TPAD (January 1, 2013 through August 31, 2014), the research team gave several presentations and demonstrations concerning TPAD operations and data analyses. Most demonstrations were performed in the districts where TPAD implementation testing was conducted or at symposia at CTR and TTI. This product (P4) documents the project progress by conveying papers and PowerPoint presentations given at two major research conferences. The conference papers describe the TPAD components, functionality, and operation. The papers also discuss data analyses and results primarily associated with deflection and GPR profiles. This product comprises the following documents:
• A poster displayed and discussed at the 2013 CTR Symposium
• Slide presentation given at the Transportation Research Board’s (TRB) 92nd Annual Meeting, January 13–17, 2013, in Washington, DC
• Paper presented at the 2013 TRB meeting: Development and Initial Testing of the Total Pavement Acceptance Device (TPAD)
• Slide presentation given at the 2014 FAA Worldwide Airport Technology Transfer Conference, August 5–7, 2014, in Galloway, New Jersey
• Paper presented at the 2014 FAA conference: Demonstration of a New, Multi-Function, Nondestructive Pavement Testing Device

Poster displayed at the 2013 CTR Symposium
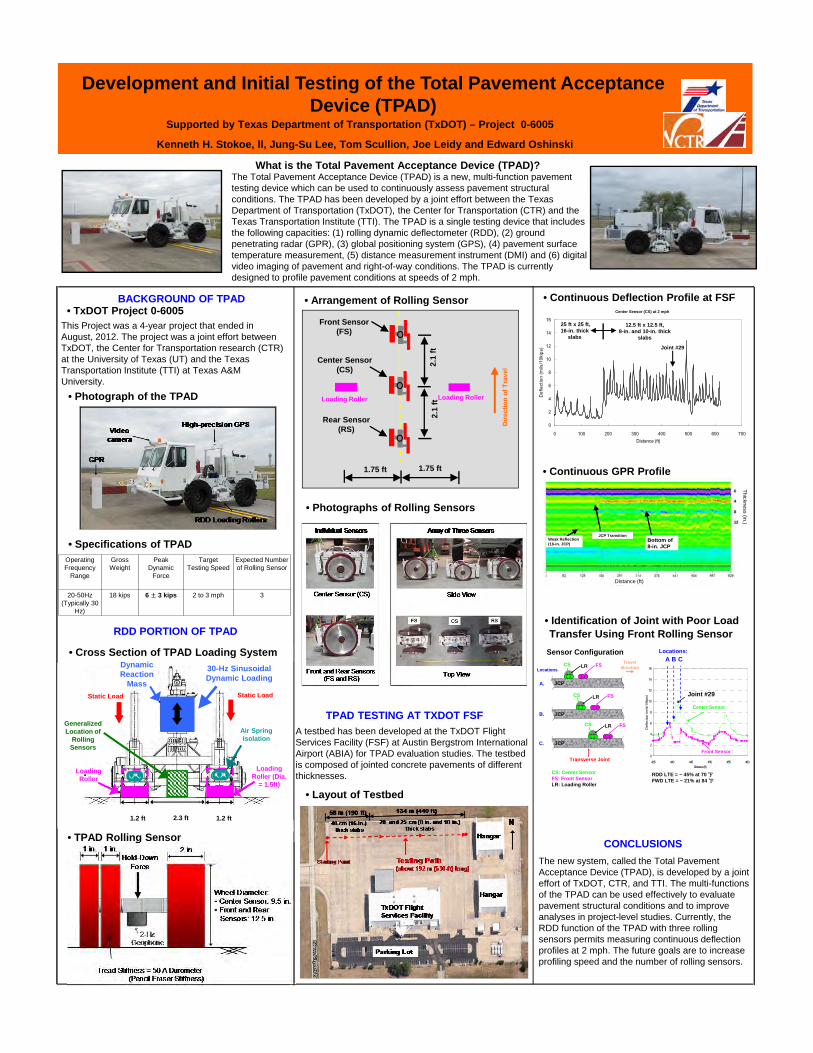
What is the Total Pavement Acceptance Device (TPAD)?The Total Pavement Acceptance Device (TPAD) is a new, multi-function pavement testing device which can be used to continuously assess pavement structural conditions. The TPAD has been developed by a joint effort between the Texas Department of Transportation (TxDOT), the Center for Transportation (CTR) and the Texas Transportation Institute (TTI). The TPAD is a single testing device that includes the following capacities: (1) rolling dynamic deflectometer (RDD), (2) ground penetrating radar (GPR), (3) global positioning system (GPS), (4) pavement surface temperature measurement, (5) distance measurement instrument (DMI) and (6) digital video imaging of pavement and right-of-way conditions. The TPAD is currently designed to profile pavement conditions at speeds of 2 mph.
Kenneth H. Stokoe, ll, Jung-Su Lee, Tom Scullion, Joe Leidy and Edward Oshinski
Development and Initial Testing of the Total Pavement Acceptance Device (TPAD)
• Specifications of TPAD
Supported by Texas Department of Transportation (TxDOT) – Project 0-6005
BACKGROUND OF TPAD
• Photograph of the TPAD
TPAD TESTING AT TXDOT FSF
• TxDOT Project 0-6005This Project was a 4-year project that ended in August, 2012. The project was a joint effort between TxDOT, the Center for Transportation research (CTR) at the University of Texas (UT) and the Texas Transportation Institute (TTI) at Texas A&M University.
A testbed has been developed at the TxDOT Flight Services Facility (FSF) at Austin Bergstrom International Airport (ABIA) for TPAD evaluation studies. The testbed is composed of jointed concrete pavements of different thicknesses.
CONCLUSIONS
The new system, called the Total Pavement Acceptance Device (TPAD), is developed by a joint effort of TxDOT, CTR, and TTI. The multi-functions of the TPAD can be used effectively to evaluate pavement structural conditions and to improve analyses in project-level studies. Currently, the RDD function of the TPAD with three rolling sensors permits measuring continuous deflection profiles at 2 mph. The future goals are to increase profiling speed and the number of rolling sensors.
1.75 ft 1.75 ft
Front Sensor(FS)
Loading Roller Loading Roller
2.1
ft
Dir
ecti
on
of
Tra
vel
2.1
ft
Center Sensor(CS)
Rear Sensor(RS)
• Photographs of Rolling Sensors
Static Load
Air Spring Isolation
Generalized Location of
Rolling Sensors
Static Load
RDD PORTION OF TPAD
25 ft x 25 ft,16-in. thick
slabs
12.5 ft x 12.5 ft,8-in. and 10-in. thick
Slabs
Distance (ft)
Thickness (in.)
Weak Reflection (16-in. JCP)
Bottom of 8-in. JCP
JCP Transition
1.2 ft 1.2 ft2.3 ft
Center Sensor (CS)_March 28, 2012
0
2
4
6
8
10
12
14
16
0 100 200 300 400 500 600 700Distance (ft)
Def
lect
ion
(mils
/10k
ips)
25 ft x 25 ft,16-in. thick
slabs
12.5 ft x 12.5 ft,8-in. and 10-in. thick
slabs
Center Sensor (CS) at 2 mph
Operating Frequency
Range
Gross Weight
Peak Dynamic
Force
TargetTesting Speed
Expected Number of Rolling Sensor
20-50Hz (Typically 30
Hz)
18 kips 6 ± 3 kips 2 to 3 mph 3
Dynamic Reaction
Mass
30-Hz Sinusoidal Dynamic Loading
Loading Roller
Loading Roller (Dia.
= 1.5ft)
RDD LTE = ~ 45% at 70 ℉FWD LTE = ~ 21% at 84 ℉
Transverse Joint
Traveldirection
Sensor Configuration
FSLRCS
A.
B.
C.
CS: Center SensorFS: Front SensorLR: Loading Roller
JCP
FSLRCS
JCP
FSLRCS
JCP
Locations
0
2
4
6
8
10
12
14
16
435 440 445 450 455 460Distance (ft)
Def
lect
ion
(mils
/10k
ips)
A B C
Joint #29
Locations:
Center Sensor
Front Sensor
• Cross Section of TPAD Loading System
• TPAD Rolling Sensor
• Arrangement of Rolling Sensor
• Layout of Testbed
Joint #29
• Continuous Deflection Profile at FSF
• Continuous GPR Profile
• Identification of Joint with Poor LoadTransfer Using Front Rolling Sensor

Slide presentation given at the Transportation Research Board’s (TRB) 92nd Annual Meeting, January 13–17, 2013, in Washington, DC

1
Kenneth H. Stokoe, II and Jung-Su Lee Center for Transportation Research
University of Texas at Austin
Thomas Scullion and Wenting Liu Texas Transportation Institute
Texas A&M University
Boo-Hyun NamUniversity of Central Florida
Joe Leidy and German Claros Texas Department of Transportation
Transportation Research Board – 92nd Annual MeetingJanuary 14, 2013
Development and Initial Testing of the Total Pavement Acceptance Device
(TPAD)
2
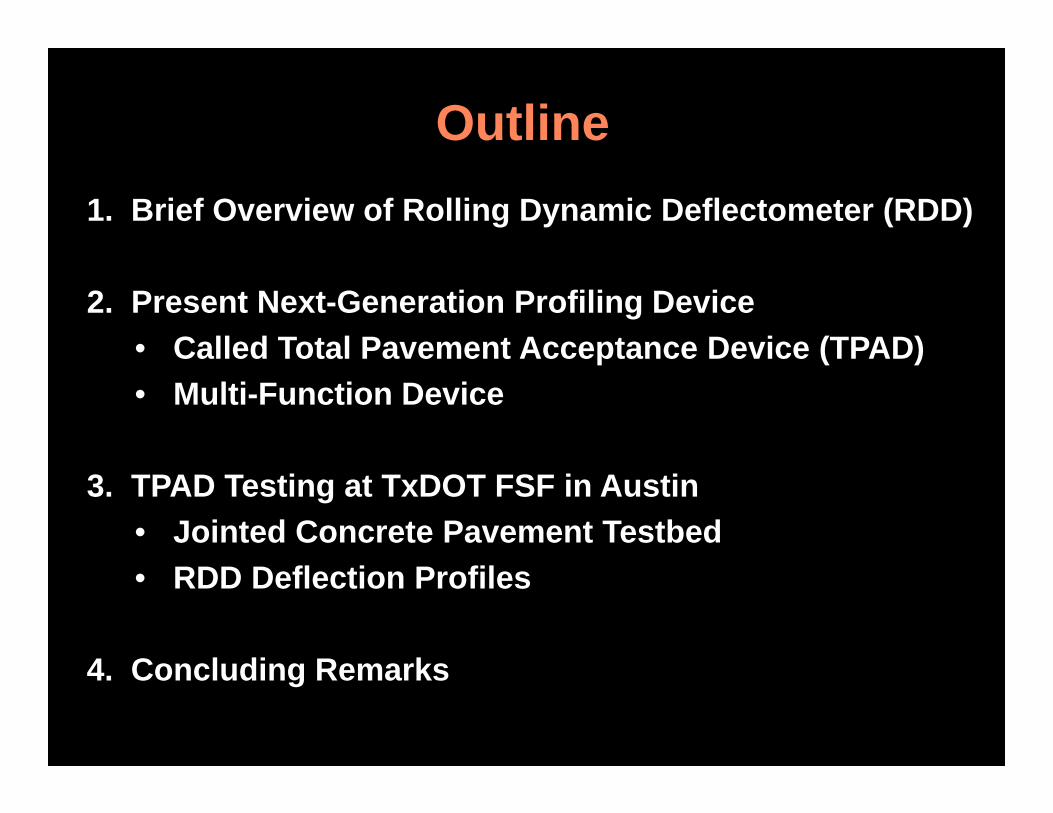
Outline
1. Brief Overview of Rolling Dynamic Deflectometer (RDD)
2. Present Next-Generation Profiling Device
• Called Total Pavement Acceptance Device (TPAD)
• Multi-Function Device
3. TPAD Testing at TxDOT FSF in Austin
• Jointed Concrete Pavement Testbed
• RDD Deflection Profiles
4. Concluding Remarks

3
Electro-Hydraulic Loading System
Rolling Sensors Two LoadingRollers
Diesel Engine: PowersHydraulic Loading System
1. Brief Overview: Original Rolling Dynamic Deflectometer (RDD),approx. 1998 - 2012
Distance Measurement

4
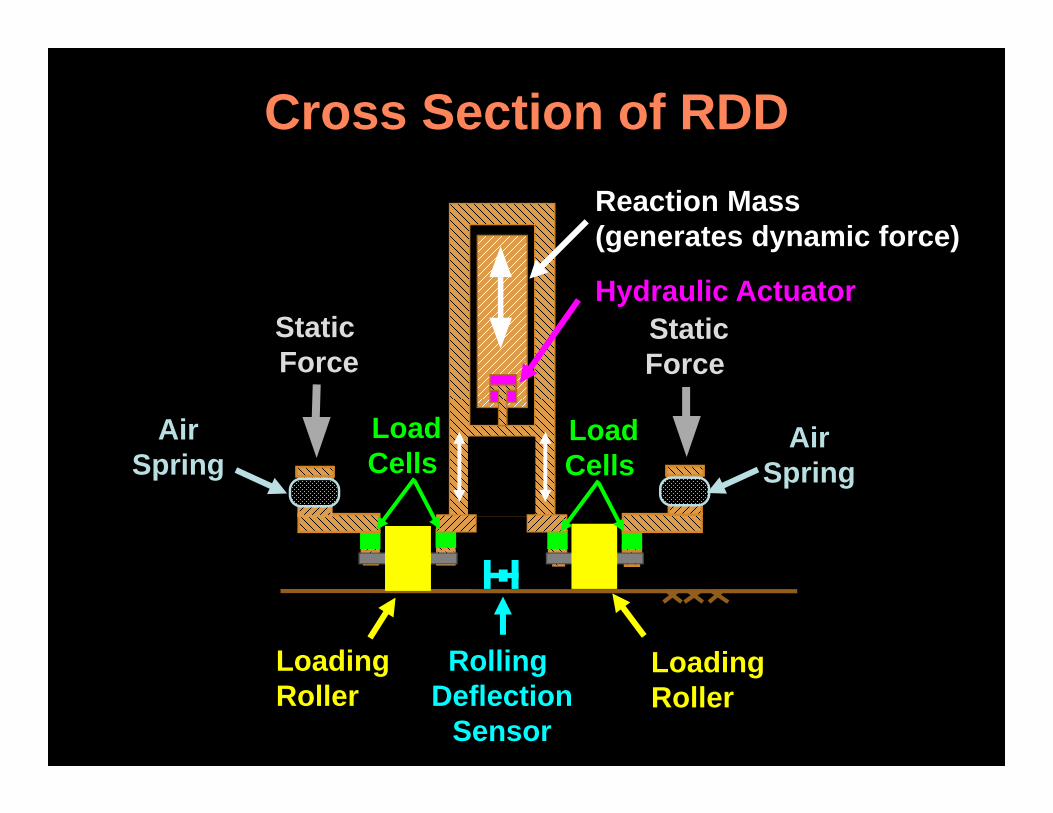
Cross Section of RDD
AirSpring
Rolling Deflection
Sensor
Static Force
StaticForce
Reaction Mass(generates dynamic force)
Loading Roller
Hydraulic Actuator
LoadCells
LoadCells
Loading Roller
AirSpring
5
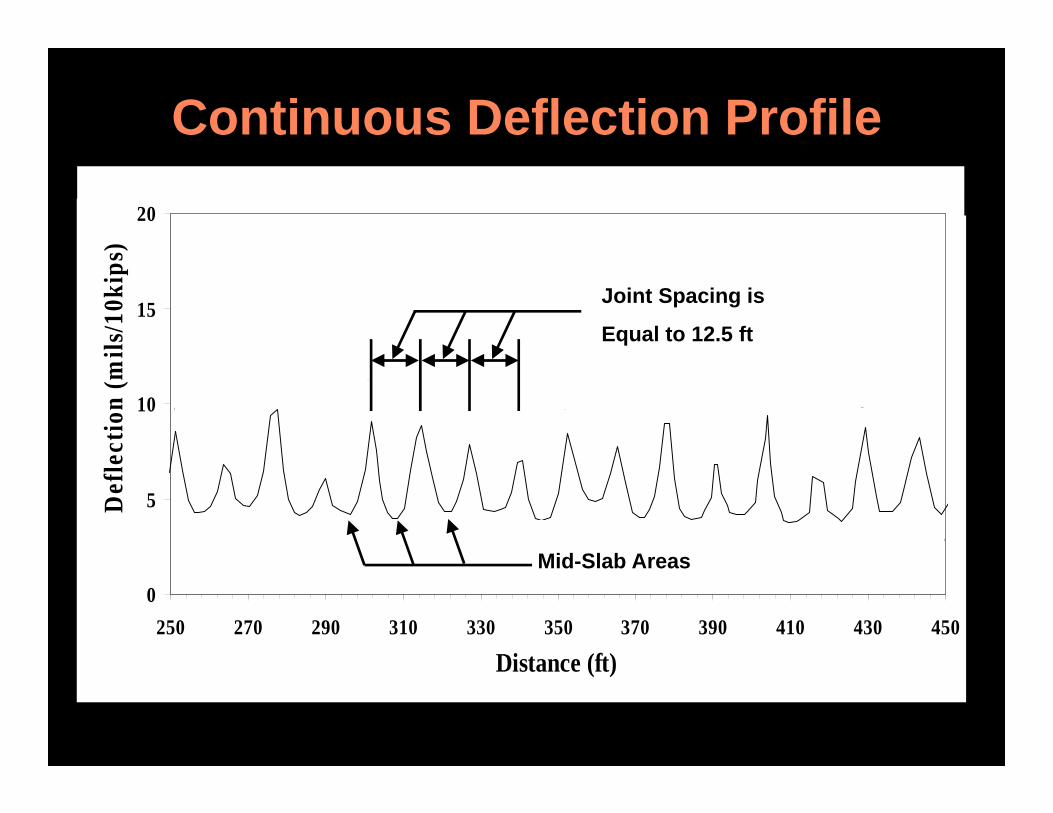
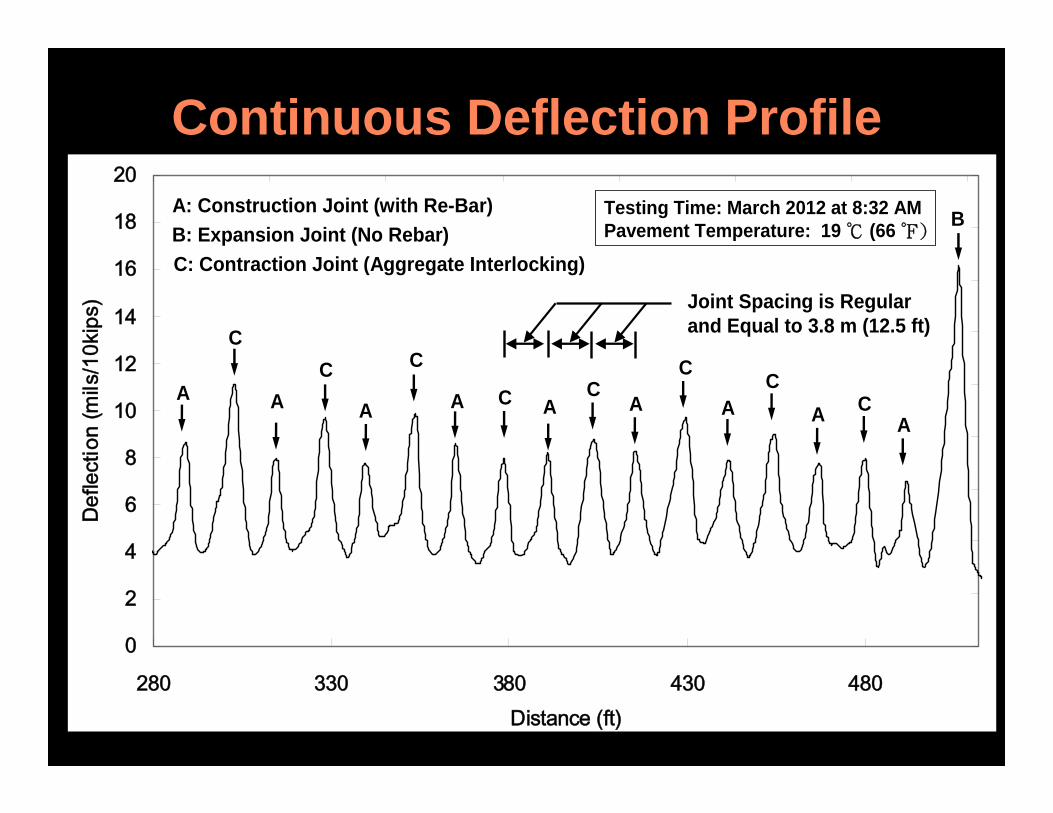
Continuous Deflection Profile
0
5
10
15
20
250 270 290 310 330 350 370 390 410 430 450
Distance (ft)
W1
Def
lect
ion
(mils
/10k
ips) J: Joint
MS: Mid-Slab Area
J
J
J
J
J JJ J J J
J
J
J
J
MS MS MS MS MS MSMS
MS MS MS MS MS MSMS
MS
Joint Spacing is Regular and Equal to 12.5 ft
MS
J
J
Joint Spacing is
Equal to 12.5 ft
Mid-Slab Areas
6
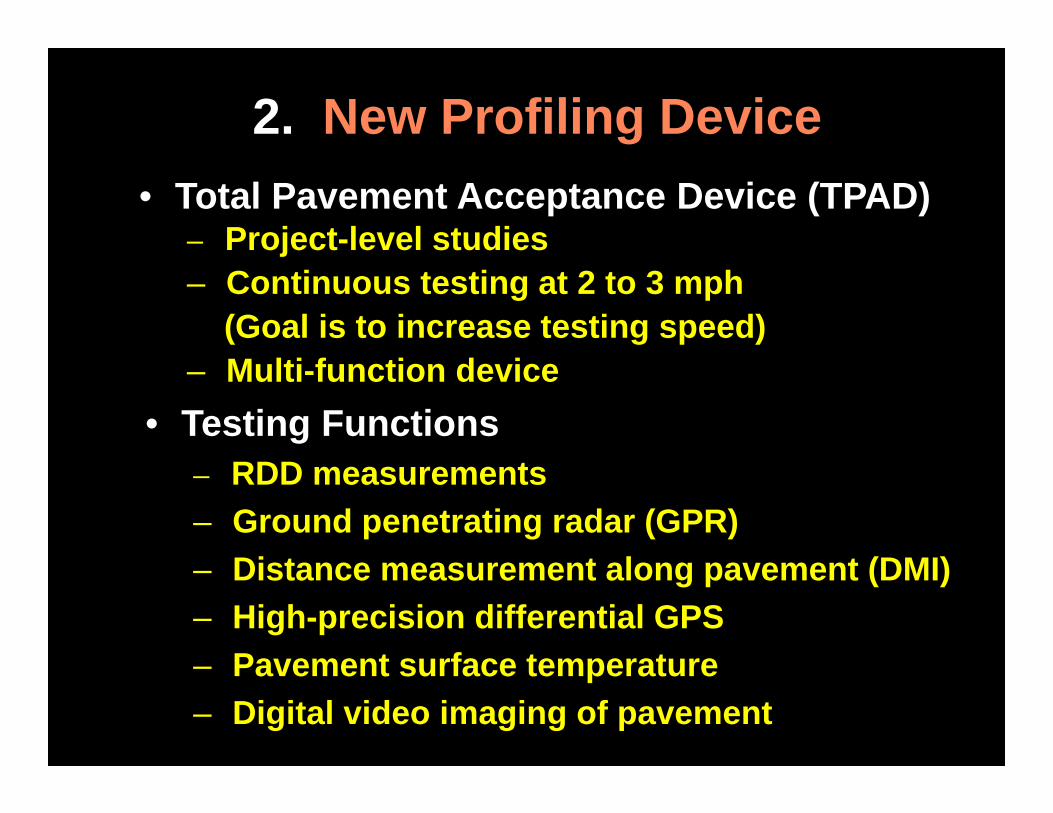
• Total Pavement Acceptance Device (TPAD)– Project-level studies– Continuous testing at 2 to 3 mph– Multi-function device
2. Next-Generation Profiling Device
• Testing Functions– RDD measurements
– Ground penetrating radar (GPR)
– Distance measurement along pavement (DMI)
– High-precision differential GPS
– Pavement surface temperature
– Digital video imaging of pavement

7
TPAD Mobile Platform:Adapted from a Minivibe
Cross-Sectional View of Pavement Loading System Shown in Next Slide
Loading Roller
8
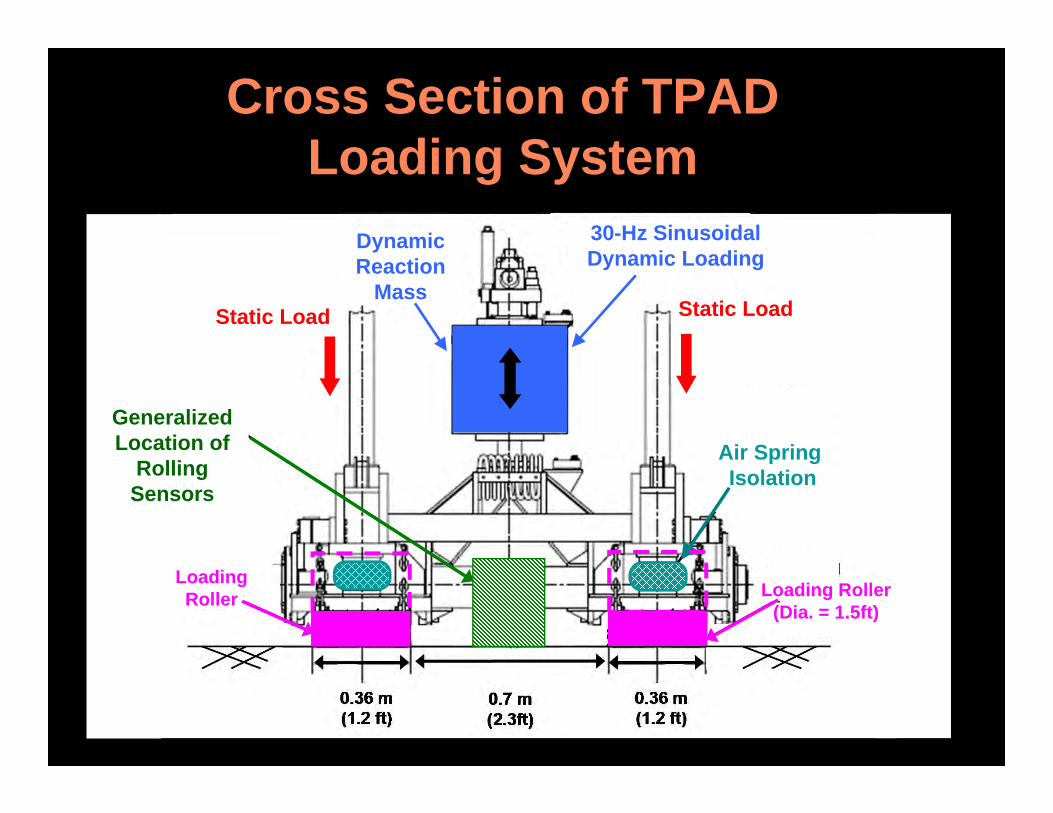
Cross Section of TPAD Loading System
Static Load
Air Spring Isolation
Dynamic Reaction
Mass
Loading Roller
30-Hz Sinusoidal Dynamic Loading
Generalized Location of
Rolling Sensors
Static Load
Loading Roller (Dia. = 1.5ft)
9
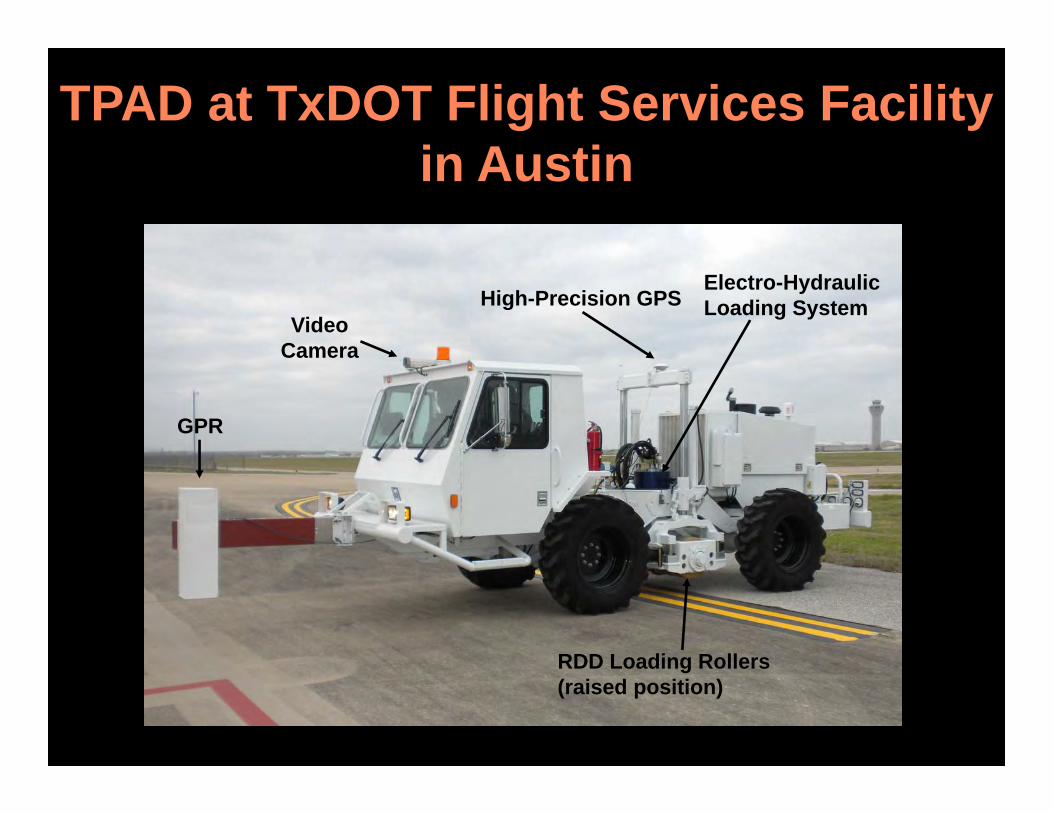
TPAD at TxDOT Flight Services Facility in Austin
GPR
VideoCamera
High-Precision GPSElectro-HydraulicLoading System
RDD Loading Rollers(raised position)
10
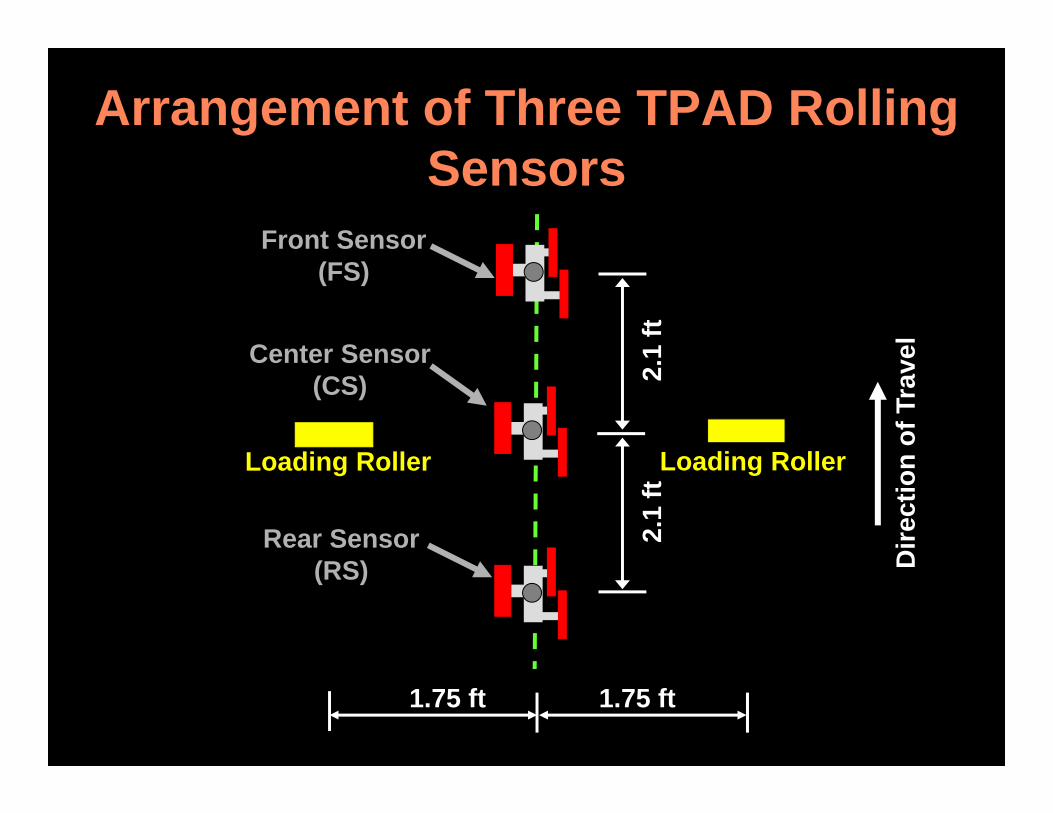
Arrangement of Three TPAD Rolling Sensors
1.75 ft 1.75 ft
Front Sensor(FS)
Loading Roller Loading Roller
2.1
ft
Dir
ecti
on
of
Trav
el
2.1
ft
Center Sensor(CS)
Rear Sensor(RS)
11
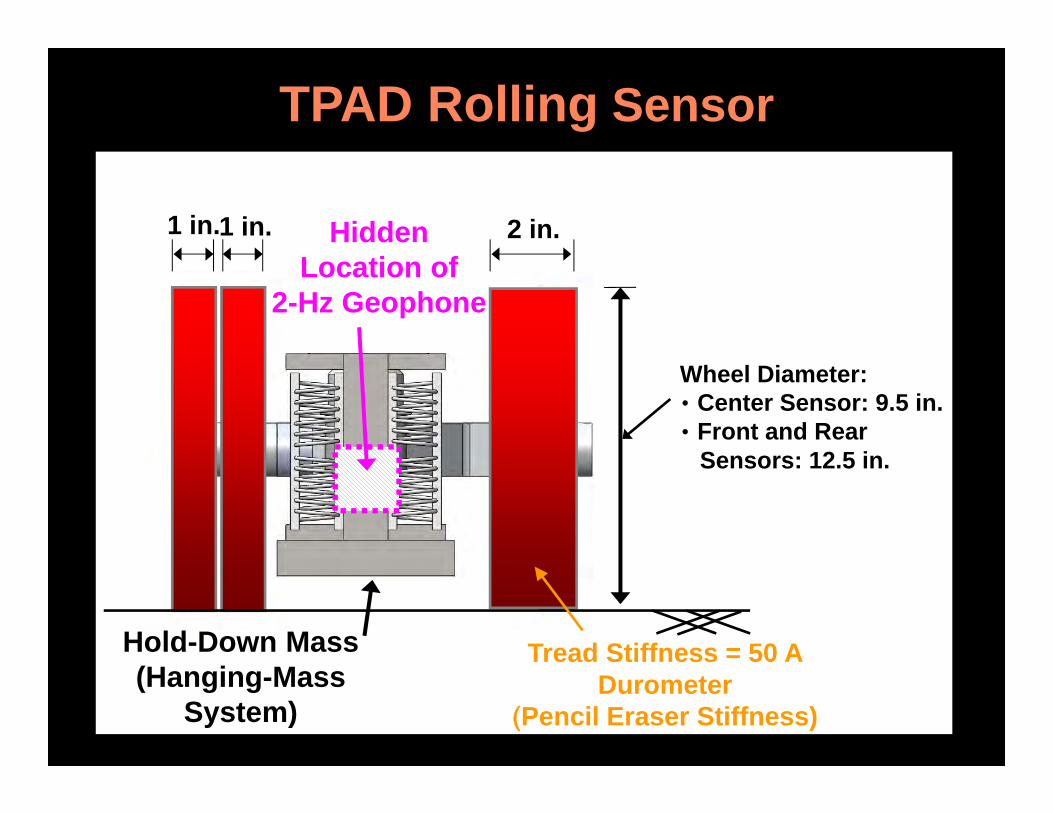
TPAD Rolling Sensor
1 in. 2 in.
Wheel Diameter:‧Center Sensor: 9.5 in. ‧Front and Rear
Sensors: 12.5 in.
1 in.
2-HzGeophone
Tread Stiffness = 50 A Durometer (Pencil Eraser Stiffness)
Hold-DownForce
12
RDD Portion of TPAD
Front Sensor (FS)
Towing Frame
Loading Rollers
Center Sensor (CS) (Hidden by
Loading Frame)
13
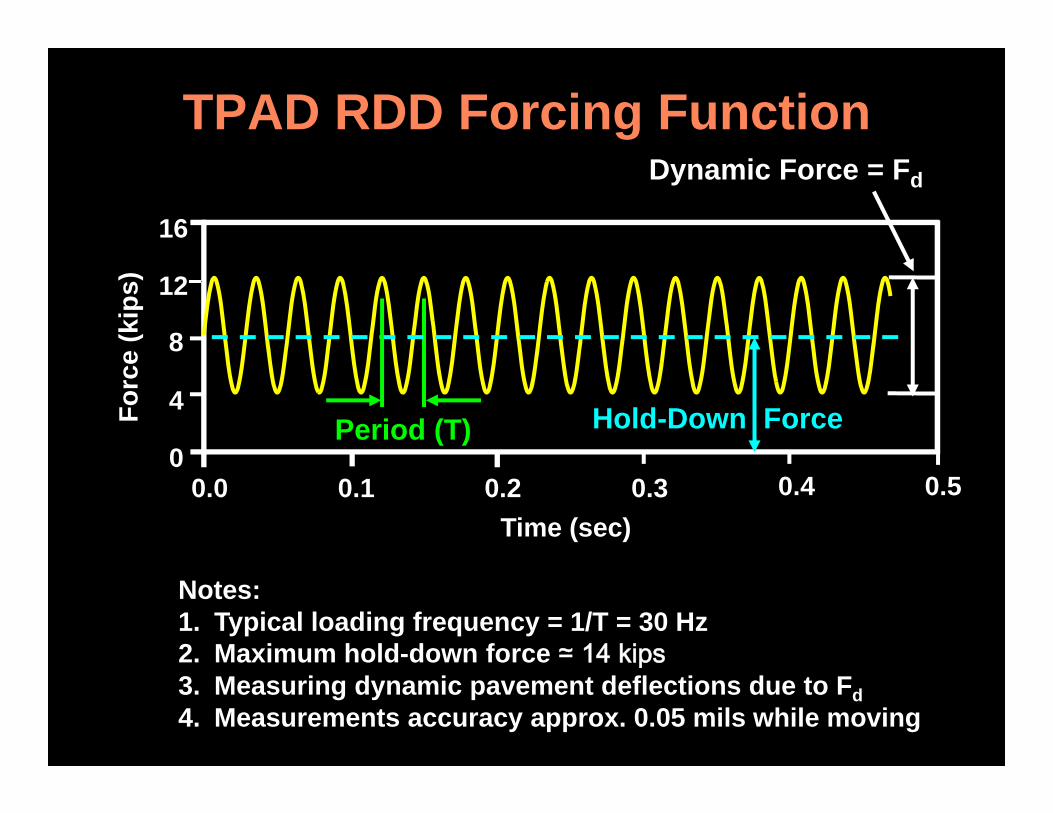
RDD Forcing Function
16
12
8
4
0
Fo
rce
(kip
s)
0.50.40.30.20.10.0
Time (sec)
Period (T) Hold-Down Force
Dynamic Force = Fd
Notes:1. Typical loading frequency = 1/T = 30 Hz2. Maximum hold-down force ≃ 14 kips3. Measuring dynamic pavement deflections due to Fd
14
TPAD on Transportation System
Tractor TPAD
Trailer

15
Hangar
Hangar
200 ft 500 ft
3. Testbed at TxDOT Flight Services Facility
16
Continuous RDD Deflection Profile at 2 mph with Center Sensor (CS)
Center Sensor (CS)_March 28, 2012
0
2
4
6
8
10
12
14
16
0 100 200 300 400 500 600 700Distance (ft)
Def
lect
ion
(mils
/10k
ips)
25 ft x 25 ft,16-in. thick
slabs
12.5 ft x 12.5 ft,8-in. and 10-in. thick
slabs
Region A
17
Expanded Profile of Region A
Center Sensor (CS)_March 28, 2012
0
2
4
6
8
10
12
14
16
400 410 420 430 440 450 460 470 480 490 500Distance (ft)
Def
lect
ion
(mils
/10k
ips)
A: Construction Joint (with Re-Bar) B: Expansion Joint (No Rebar)
C: Contraction Joint (Aggregate Interlocking)
B
AAAA
CC
C
Joint Spacing is Regular and Equal to 12.5 ft
Mid-Slab Action ~4 to 5 ft
18
Identification of Joints with Bad LoadTransfer Using Front Rolling Sensor
March 29, 2012_9:00 AM, 70F
0
2
4
6
8
10
12
14
16
0 100 200 300 400 500 600 700
Distance (ft)
Def
lect
ion
(mils
/10k
ips)
Center Sensor (CS)Front Sensor (FS)Region A
Testing Speed = 0.5 mph
19
Expanded Profile of Region A
Transverse Joint
Traveldirection
Sensor Configuration
FSLRCS
A.
B.
C.
CS: Center SensorFS: Front SensorLR: Loading Roller
RDD LTE = ~ 45% at 70 ℉FWD LTE = ~ 21% at 84 ℉
JCP
FSLRCS
JCP
FSLRCS
JCP
Locations
0
2
4
6
8
10
12
14
16
435 440 445 450 455 460Distance (ft)
Def
lect
ion
(mils
/10k
ips)
A B C
Joint #29
Locations:
Center Sensor
Front Sensor

20
Continuous GPR Profile at TxDOT FSF
25 ft x 25 ft,16-in. thick
slabs
12.5 ft x 12.5 ft,8-in. and 10-in. thick
Slabs
Distance (ft)
Thickness (in.)
Weak Reflection (16-in. JCP)
Bottom of 8-in. JCP
JCP Transition
21
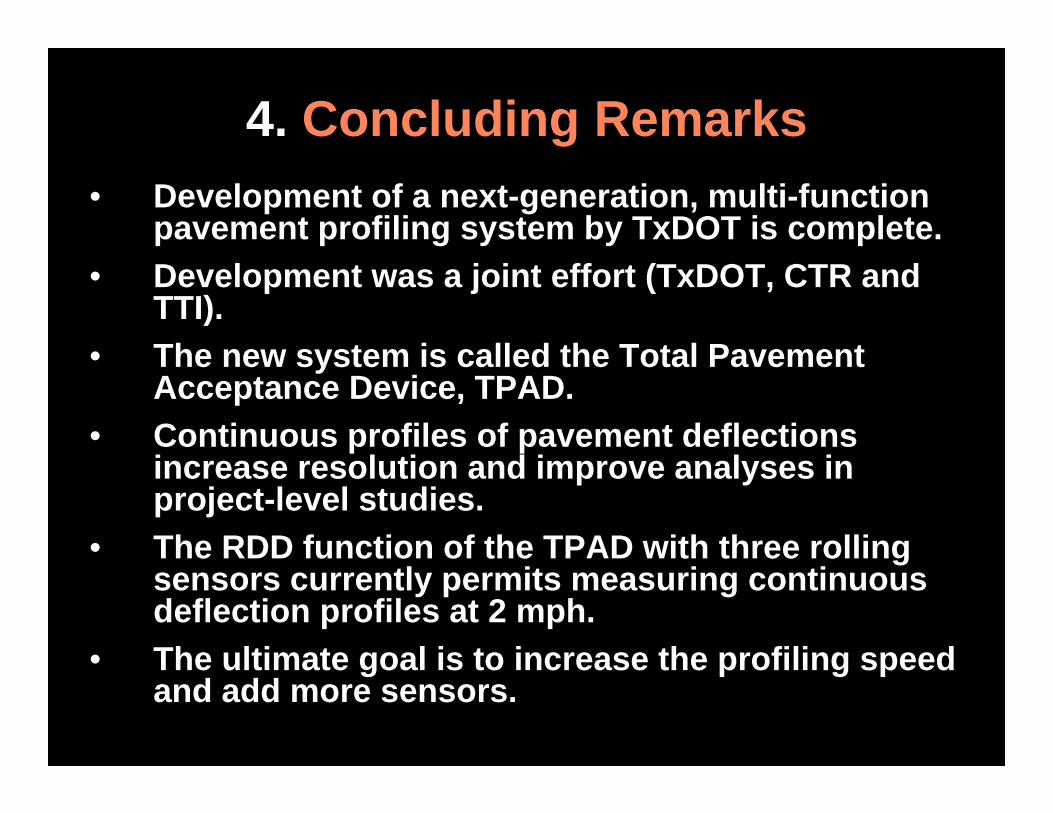
4. Concluding Remarks
• Development of a next-generation, multi-function pavement profiling system by TxDOT is complete.
• Development was a joint effort (TxDOT, CTR and TTI).
• The new system is called the Total Pavement Acceptance Device, TPAD.
• Continuous profiles of pavement deflections increase resolution and improve analyses in project-level studies.
• The RDD function of the TPAD with three rolling sensors currently permits measuring continuous deflection profiles at 2 mph.
• The ultimate goal is to increase the profiling speed and add more sensors.

22
Acknowledgements
• Funding from TxDOT Research Project 0-6005 is greatly appreciated.
Thank You

Paper presented at the 2013 TRB meeting: Development and Initial Testing of the Total Pavement Acceptance Device (TPAD)

1
Development and Initial Testing of the Total Pavement Acceptance Device (TPAD)
Kenneth H. Stokoe, II, Ph.D., P.E. Jennie C. and Milton T. Graves Chair in Engineering University of Texas at Austin, Department of Civil Engineering 1 University Station, ECJ 9.227, Campus Mail Code: C1792, Austin, TX 78712 512-471-4929 – Voice, 512-471-6548 – Fax [email protected] Jung-Su Lee (Corresponding Author) Graduate Research Assistant The University of Texas at Austin, Department of Civil Engineering 1 University Station, ECJ 9.227, Campus Mail Code: C1792, Austin, TX 78712-0273 512-699-3767 – Voice, 512-471-6548 – Fax [email protected] Boo-Hyun Nam, Ph.D. Assistant Professor The University of Central Florida, Department of Civil Engineering 4000 Central Florida Blvd., Orlando, FL 32816 +1 407-823-1361 – Voice Email: [email protected] Thomas Scullion, P.E. Senior Research Engineer Texas Transportation Institute, Texas A&M University System 3135 TAMU, College Station, TX 77843-3135 979-845-9913 – Voice, 979-845-1701 – Fax [email protected] Wenting Liu, P.E. Assistant Research Engineer Texas Transportation Institute, Texas A&M University System 3135 TAMU, College Station, TX 77843-3135 979-845-9913 – Voice, 979-845-1701 – Fax [email protected] Joe Leidy, P.E. Research Project Director Texas Department of Transportation, Construction Division (Materials and Pavements) 4203 Bull Creek #39, Austin, TX 78731 +1 512-506-5848 – Voice, +1 512-506-5839 - Fax Email: [email protected]
2
German Claros, Ph.D., P.E. Research Engineer Texas Department of Transportation, Construction Division (Materials and Pavements) 4203 Bull Creek #39, Austin, TX 78731 +1 512-416-4738 – Voice Email: [email protected] Word Count: 4,016 words + 12 × (250) = 7,016 Submission Date: August 1st, 2012
3
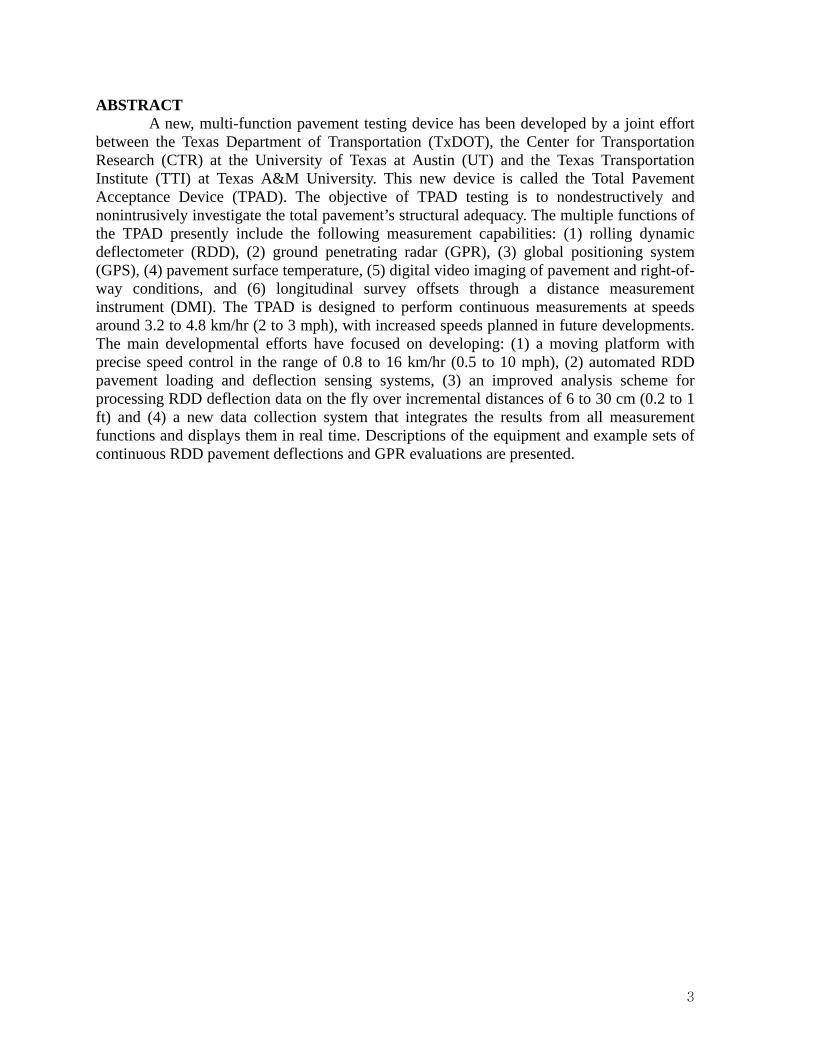
ABSTRACT A new, multi-function pavement testing device has been developed by a joint effort
between the Texas Department of Transportation (TxDOT), the Center for Transportation Research (CTR) at the University of Texas at Austin (UT) and the Texas Transportation Institute (TTI) at Texas A&M University. This new device is called the Total Pavement Acceptance Device (TPAD). The objective of TPAD testing is to nondestructively and nonintrusively investigate the total pavement’s structural adequacy. The multiple functions of the TPAD presently include the following measurement capabilities: (1) rolling dynamic deflectometer (RDD), (2) ground penetrating radar (GPR), (3) global positioning system (GPS), (4) pavement surface temperature, (5) digital video imaging of pavement and right-of-way conditions, and (6) longitudinal survey offsets through a distance measurement instrument (DMI). The TPAD is designed to perform continuous measurements at speeds around 3.2 to 4.8 km/hr (2 to 3 mph), with increased speeds planned in future developments. The main developmental efforts have focused on developing: (1) a moving platform with precise speed control in the range of 0.8 to 16 km/hr (0.5 to 10 mph), (2) automated RDD pavement loading and deflection sensing systems, (3) an improved analysis scheme for processing RDD deflection data on the fly over incremental distances of 6 to 30 cm (0.2 to 1 ft) and (4) a new data collection system that integrates the results from all measurement functions and displays them in real time. Descriptions of the equipment and example sets of continuous RDD pavement deflections and GPR evaluations are presented.

4
INTRODUCTION The Texas Department of Transportation (TxDOT) has been evaluating the structural
condition of pavements with various devices for more than four decades. In the past 15 to 20 years, new devices have been integrated into this pavement evaluation effort. One device is the rolling dynamic deflectometer (RDD). The RDD was developed through the TxDOT research program and the continuous deflection profiles have provided valuable input in pavement structural assessments. Field experience has proven that RDD deflection profiles can be used more effectively when combined with other data such as pavement thickness and subsurface conditions (Scullion, 2005, and Nam et al., 2011). Therefore, RDD profiling has been combined with a second NDT device, ground penetrating radar (GPR), which can supply this additional information. Also, pavement and right-of-way conditions from video cameras and accurate position locations have proven to be important because it is sometimes difficult to compare RDD deflection data with other NDT data, such as falling weight deflectometer measurements, logged by different equipment at different time combined with human errors. The goal of this project is to design and develop a single platform that combines the capabilities of RDD, GPR, video cameras, GPS, and DMI and moves along the pavement at speeds required for RDD testing. This device is called the Total Pavement Acceptance Device (TPAD) which is used to collect all measurements in a single pass. In addition, data analysis software that can display and analyze all types of data on-the-fly is incorporated in the TPAD. In this paper, a background on two of the nondestructive testing functions in the TPAD, the RDD and GPR systems, are briefly discussed. A description of the TPAD mobile platform and the loading system are then described. The developmental work for the speed-improved rolling sensors is also discussed. Finally, RDD deflection profiles and GPR records at two pavement sites that were collected with the TPAD are presented. The two sites are the TxDOT Flight Services Facility in Austin, Texas and highway US 81/287 near Wichita Falls, Texas. BACKGROUND: TPAD NONDESTRUCTIVE TESTING FUNCTIONS As noted above, the TPAD has been built to perform, at this time, six functions while moving along the pavement at 1.6 to 4.8 km/hr (2 to 3 mph). These functions include: (1) measuring continuous pavement deflections based on the rolling dynamic deflectometer method, (2) generating ground penetrating radar profiles (pavement thickness and subsurface conditions), (3) logging global positioning (testing location), (4) measuring pavement surface temperature, (5) collecting digital video images of pavement and right-of-way conditions, and (6) logging distance measurements along the testing paths with a DMI. Two of these functions (RDD and GPR) are discussed below. Rolling Dynamic Deflectometer (RDD) Deflection Profiling
The original rolling dynamic deflectometer (RDD) has been used as a single-function device by TxDOT for about 15 years. The RDD is a nondestructive testing (NDT) device that applies a static hold-down force combined with a dynamic sinusoidal force to the pavement surface with two loading rollers. An array of two to four rolling sensors is used to measure induced dynamic pavement deflections while the original device moved along the pavement at a speed of about 1.6 km/hr (1 mph). The RDD was developed by researchers at the

5
University of Texas at Austin (UT) in the 1990s. Dr James Bay led the developmental work and Dr. Jeffrey Lee advanced the rolling sensor design (Bay et al., 1995, Bay and Stokoe, 1998, and Jeffrey and Stokoe, 2006). As shown in Figure 1a, the original RDD is a truck-mounted device upon which an electro-hydraulic loading system delivers a combination of static and dynamic forces to the pavement through two loading rollers. The array of rolling sensors is positioned on the pavement along the longitudinal centerline of the truck, beginning mid-way between the loading rollers and extending ahead of the rollers. During RDD testing, a dynamic force is applied to the pavement as a single-frequency (typically 30 Hz) sinusoidal force. The RDD has been of great value in evaluating jointed concrete pavements. A typical continuous deflection profile, shown in Figure 1b,: (1) shows movements at all transverse joints and cracks, (2) allows joint types (construction vs. expansion vs. contraction) to be evaluated based on relative movements, (3) permits relative evaluation of load transfer at joints, and (4) permits evaluation of the extent and quality of mid-slab areas. RDD profiling has been used to: (1) delineate areas to be repaired, (2) help select possible rehabilitation treatments, (3) measure improvements due to rehabilitation, and (4) evaluate changes with time, environmental conditions, and trafficking (Bay et al., 2000 and Chen et al., 2007).
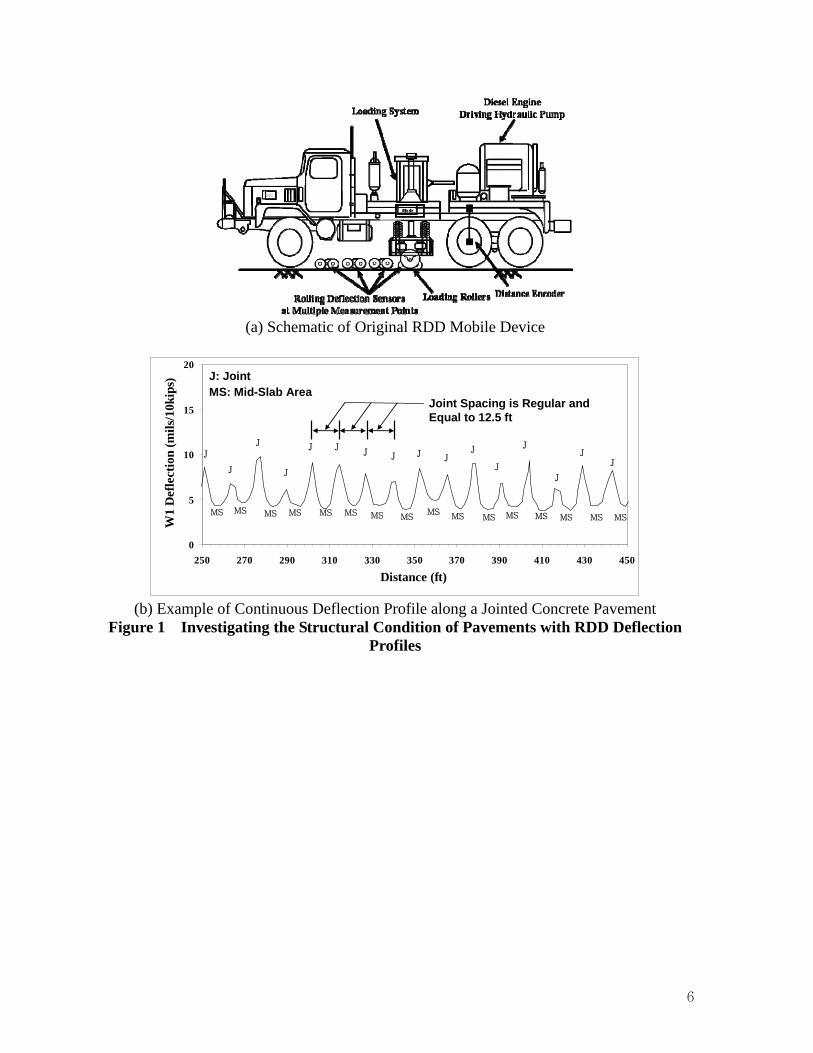
6
(a) Schematic of Original RDD Mobile Device
0
5
10
15
20
250 270 290 310 330 350 370 390 410 430 450
Distance (ft)
W1
Def
lect
ion
(mil
s/10
kips
) J: JointMS: Mid-Slab Area
J
J
J
J
J JJ J J J
J
J
J
J
MS MS MS MS MS MSMS
MS MS MS MS MS MSMS
MS
Joint Spacing is Regular and Equal to 12.5 ft
MS
J
J
(b) Example of Continuous Deflection Profile along a Jointed Concrete Pavement
Figure 1 Investigating the Structural Condition of Pavements with RDD Deflection Profiles
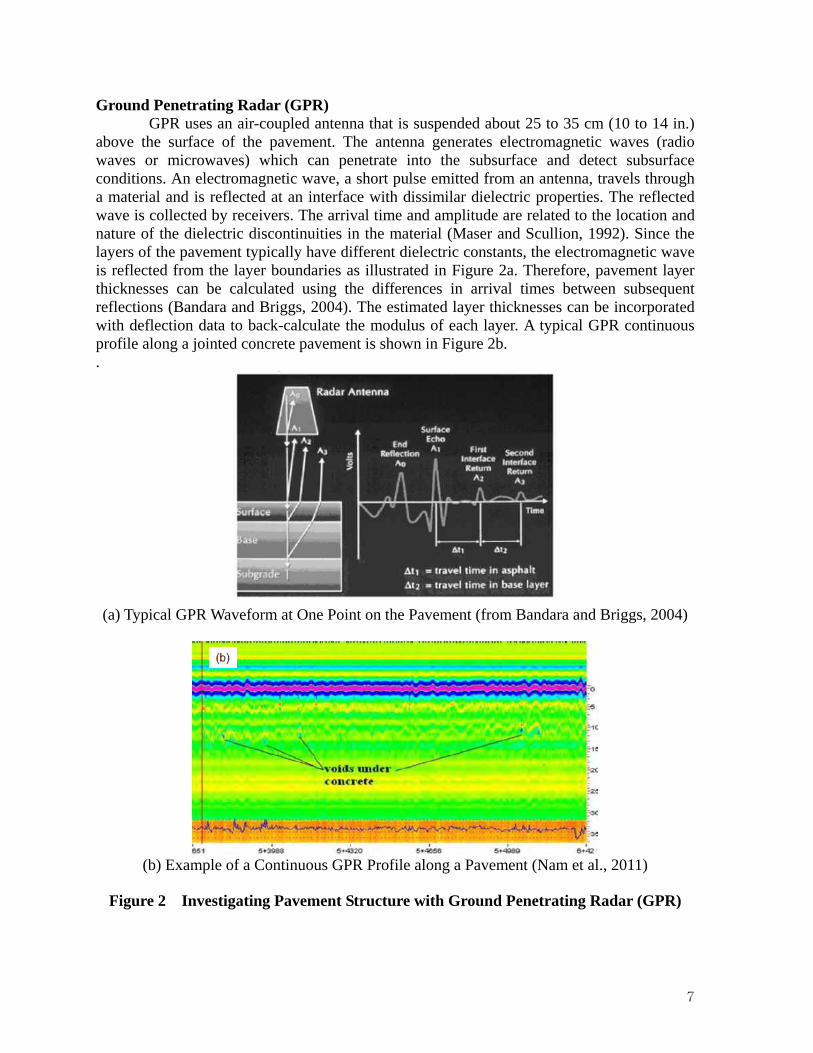
7
Ground Penetrating Radar (GPR) GPR uses an air-coupled antenna that is suspended about 25 to 35 cm (10 to 14 in.)
above the surface of the pavement. The antenna generates electromagnetic waves (radio waves or microwaves) which can penetrate into the subsurface and detect subsurface conditions. An electromagnetic wave, a short pulse emitted from an antenna, travels through a material and is reflected at an interface with dissimilar dielectric properties. The reflected wave is collected by receivers. The arrival time and amplitude are related to the location and nature of the dielectric discontinuities in the material (Maser and Scullion, 1992). Since the layers of the pavement typically have different dielectric constants, the electromagnetic wave is reflected from the layer boundaries as illustrated in Figure 2a. Therefore, pavement layer thicknesses can be calculated using the differences in arrival times between subsequent reflections (Bandara and Briggs, 2004). The estimated layer thicknesses can be incorporated with deflection data to back-calculate the modulus of each layer. A typical GPR continuous profile along a jointed concrete pavement is shown in Figure 2b. .
(a) Typical GPR Waveform at One Point on the Pavement (from Bandara and Briggs, 2004)
(b) Example of a Continuous GPR Profile along a Pavement (Nam et al., 2011)
Figure 2 Investigating Pavement Structure with Ground Penetrating Radar (GPR)
8
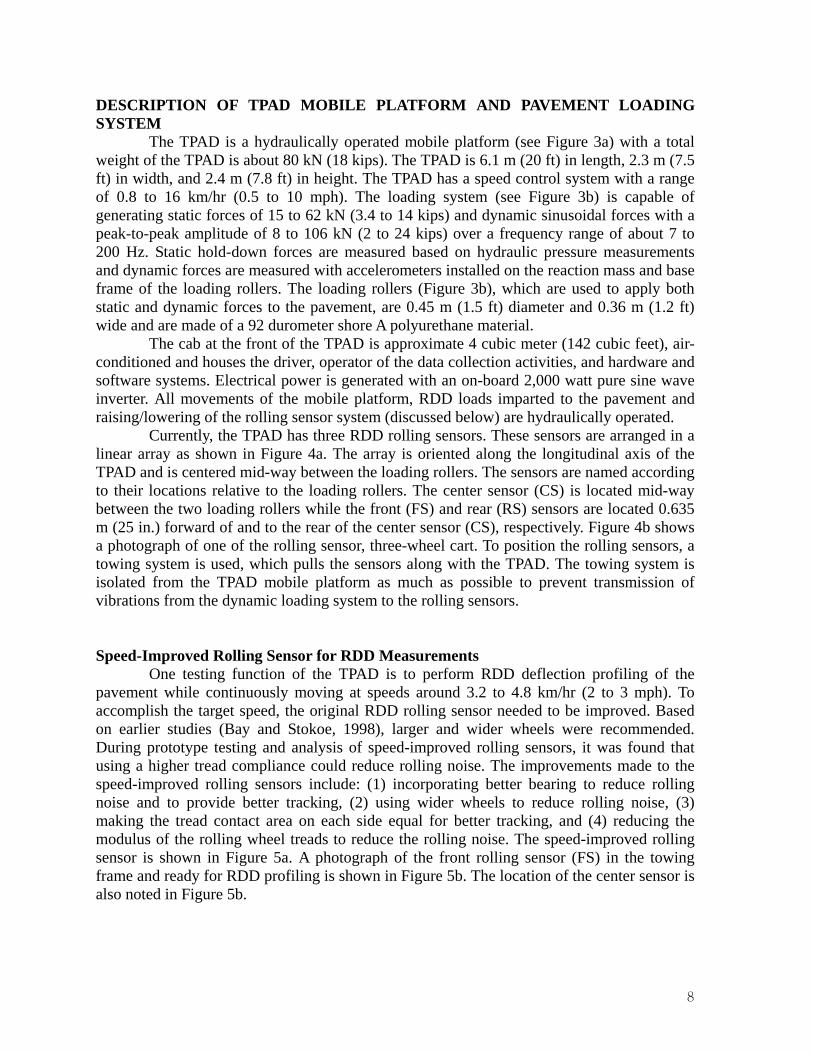
DESCRIPTION OF TPAD MOBILE PLATFORM AND PAVEMENT LOADING SYSTEM
The TPAD is a hydraulically operated mobile platform (see Figure 3a) with a total weight of the TPAD is about 80 kN (18 kips). The TPAD is 6.1 m (20 ft) in length, 2.3 m (7.5 ft) in width, and 2.4 m (7.8 ft) in height. The TPAD has a speed control system with a range of 0.8 to 16 km/hr (0.5 to 10 mph). The loading system (see Figure 3b) is capable of generating static forces of 15 to 62 kN (3.4 to 14 kips) and dynamic sinusoidal forces with a peak-to-peak amplitude of 8 to 106 kN (2 to 24 kips) over a frequency range of about 7 to 200 Hz. Static hold-down forces are measured based on hydraulic pressure measurements and dynamic forces are measured with accelerometers installed on the reaction mass and base frame of the loading rollers. The loading rollers (Figure 3b), which are used to apply both static and dynamic forces to the pavement, are 0.45 m (1.5 ft) diameter and 0.36 m (1.2 ft) wide and are made of a 92 durometer shore A polyurethane material.
The cab at the front of the TPAD is approximate 4 cubic meter (142 cubic feet), air-conditioned and houses the driver, operator of the data collection activities, and hardware and software systems. Electrical power is generated with an on-board 2,000 watt pure sine wave inverter. All movements of the mobile platform, RDD loads imparted to the pavement and raising/lowering of the rolling sensor system (discussed below) are hydraulically operated.
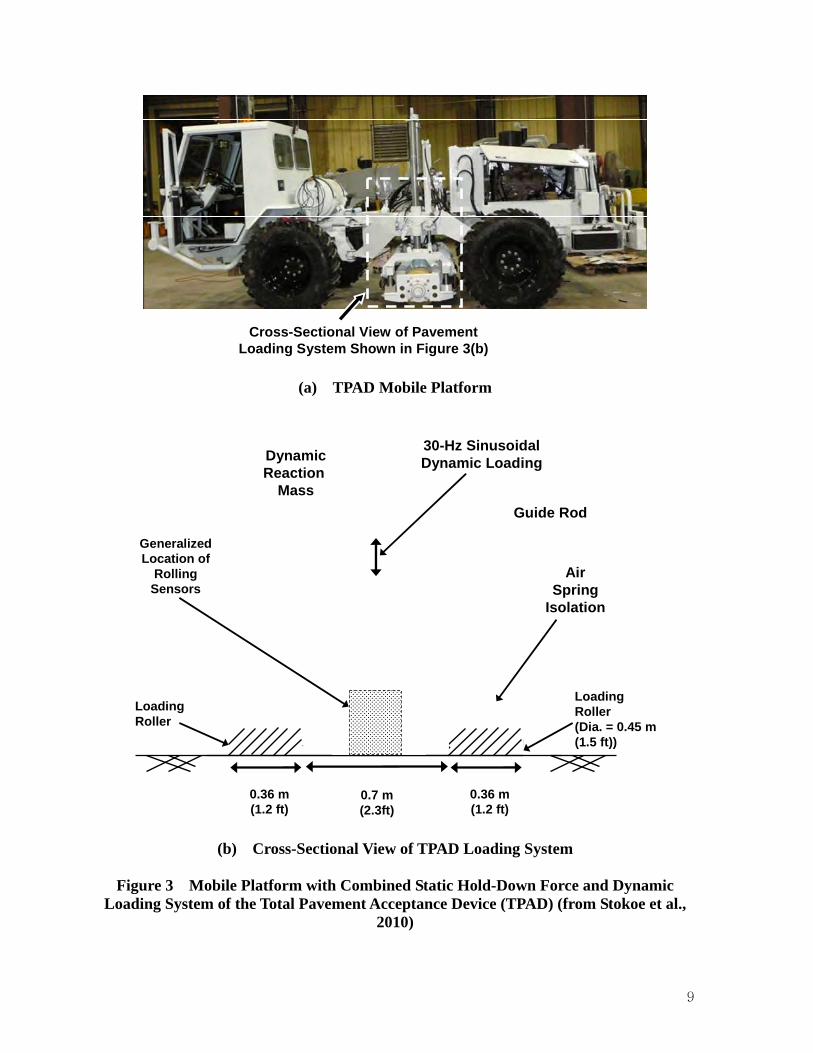
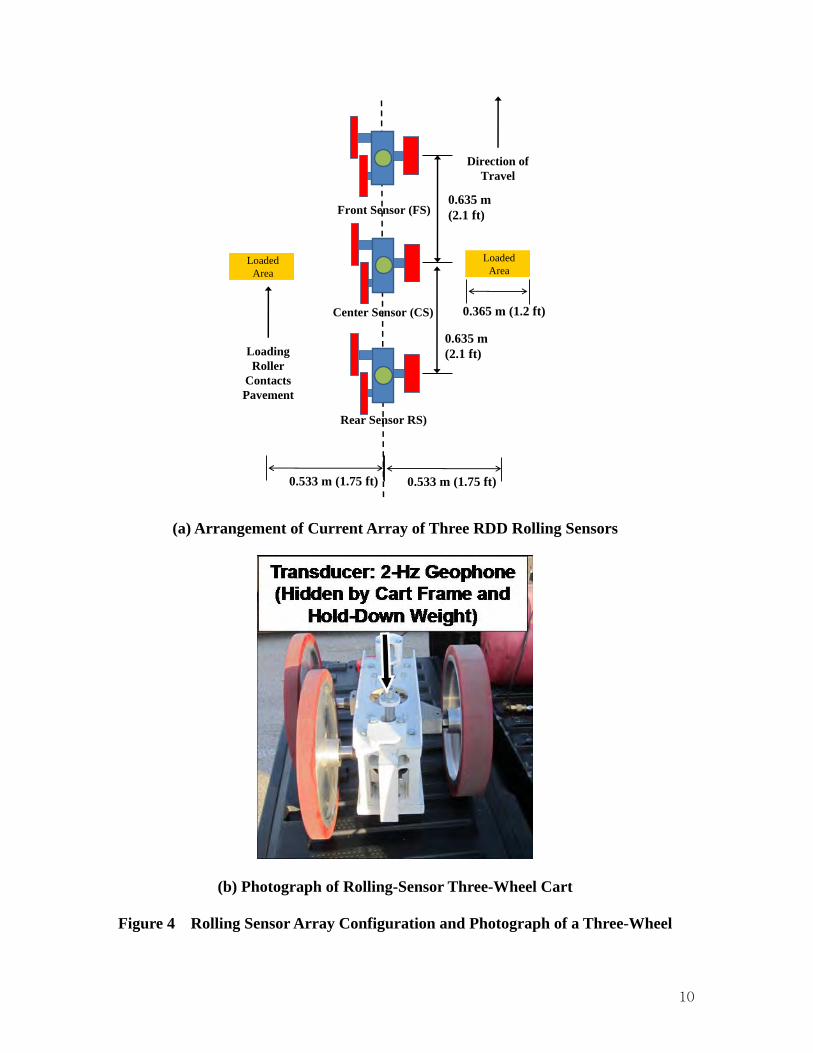
Currently, the TPAD has three RDD rolling sensors. These sensors are arranged in a linear array as shown in Figure 4a. The array is oriented along the longitudinal axis of the TPAD and is centered mid-way between the loading rollers. The sensors are named according to their locations relative to the loading rollers. The center sensor (CS) is located mid-way between the two loading rollers while the front (FS) and rear (RS) sensors are located 0.635 m (25 in.) forward of and to the rear of the center sensor (CS), respectively. Figure 4b shows a photograph of one of the rolling sensor, three-wheel cart. To position the rolling sensors, a towing system is used, which pulls the sensors along with the TPAD. The towing system is isolated from the TPAD mobile platform as much as possible to prevent transmission of vibrations from the dynamic loading system to the rolling sensors.
Speed-Improved Rolling Sensor for RDD Measurements One testing function of the TPAD is to perform RDD deflection profiling of the
pavement while continuously moving at speeds around 3.2 to 4.8 km/hr (2 to 3 mph). To accomplish the target speed, the original RDD rolling sensor needed to be improved. Based on earlier studies (Bay and Stokoe, 1998), larger and wider wheels were recommended. During prototype testing and analysis of speed-improved rolling sensors, it was found that using a higher tread compliance could reduce rolling noise. The improvements made to the speed-improved rolling sensors include: (1) incorporating better bearing to reduce rolling noise and to provide better tracking, (2) using wider wheels to reduce rolling noise, (3) making the tread contact area on each side equal for better tracking, and (4) reducing the modulus of the rolling wheel treads to reduce the rolling noise. The speed-improved rolling sensor is shown in Figure 5a. A photograph of the front rolling sensor (FS) in the towing frame and ready for RDD profiling is shown in Figure 5b. The location of the center sensor is also noted in Figure 5b.
9
Cross-Sectional View of Pavement Loading System Shown in Figure 3(b)
(a) TPAD Mobile Platform
Dynamic Reaction
Mass
AirSpring
Isolation
0.36 m(1.2 ft)
0.7 m(2.3ft)
Loading Roller(Dia. = 0.45 m (1.5 ft))
Guide Rod
30-Hz Sinusoidal Dynamic Loading
Loading Roller
Generalized Location of
Rolling Sensors
0.36 m(1.2 ft)
(b) Cross-Sectional View of TPAD Loading System
Figure 3 Mobile Platform with Combined Static Hold-Down Force and Dynamic Loading System of the Total Pavement Acceptance Device (TPAD) (from Stokoe et al.,
2010)
10
0.533 m (1.75 ft)
0.365 m (1.2 ft)
Loaded Area
Loaded Area
0.635 m(2.1 ft)
Direction of Travel
Loaded Area
Center Sensor (CS)
Rear Sensor RS)
Front Sensor (FS)
0.635 m(2.1 ft)
0.533 m (1.75 ft)
Loading Roller
Contacts Pavement
(a) Arrangement of Current Array of Three RDD Rolling Sensors
(b) Photograph of Rolling-Sensor Three-Wheel Cart
Figure 4 Rolling Sensor Array Configuration and Photograph of a Three-Wheel

11
Sensor Cart
2.54 cm(1 in.)
5.08 cm(2 in.)
24.13 cm(9.5 in.)
2-HzGeophone
Note: 50 A Durometer = Pencil Eraser Hardness
Hold-DownForce
2.54 cm(1 in.)
Poly Urethane Tread
(a) Schematic of Speed-Improved Rolling Sensor (from Stokoe et al., 2011)
Front Sensor (FS)
Towing Frame
Towing Frame Arm
Center Sensor (CS) Location(Hidden by Loading Frame)
RDD Loading Rollers
(b) Photograph of the RDD Portion of the TPAD Showing Towing Frame, Front Sensor, and Location of Center Sensor
Figure 5 Speed-Improved Rolling Sensor
12
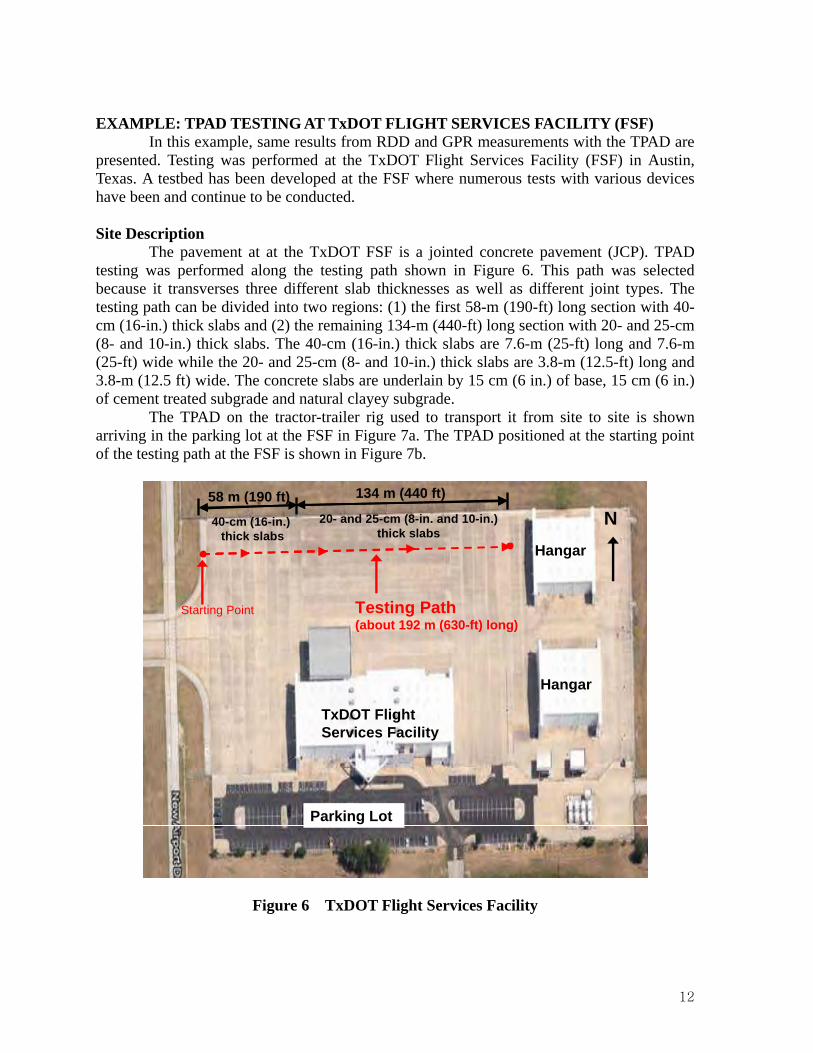
EXAMPLE: TPAD TESTING AT TxDOT FLIGHT SERVICES FACILITY (FSF) In this example, same results from RDD and GPR measurements with the TPAD are presented. Testing was performed at the TxDOT Flight Services Facility (FSF) in Austin, Texas. A testbed has been developed at the FSF where numerous tests with various devices have been and continue to be conducted. Site Description
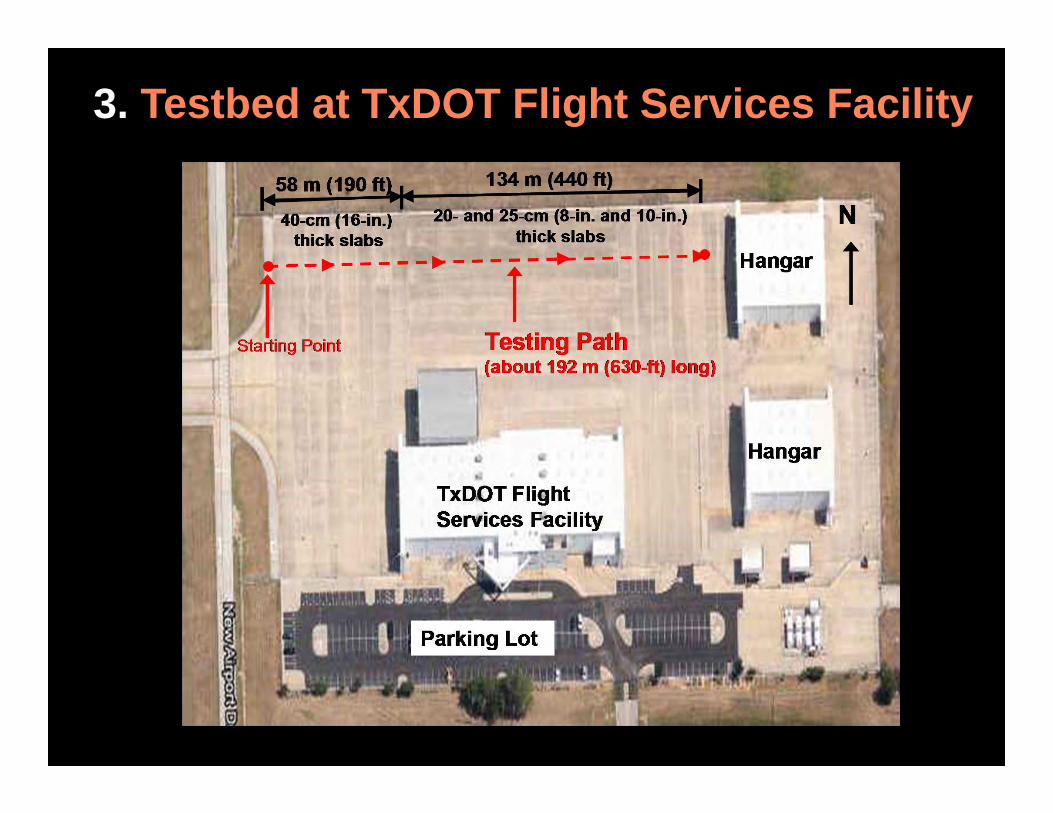
The pavement at at the TxDOT FSF is a jointed concrete pavement (JCP). TPAD testing was performed along the testing path shown in Figure 6. This path was selected because it transverses three different slab thicknesses as well as different joint types. The testing path can be divided into two regions: (1) the first 58-m (190-ft) long section with 40-cm (16-in.) thick slabs and (2) the remaining 134-m (440-ft) long section with 20- and 25-cm (8- and 10-in.) thick slabs. The 40-cm (16-in.) thick slabs are 7.6-m (25-ft) long and 7.6-m (25-ft) wide while the 20- and 25-cm (8- and 10-in.) thick slabs are 3.8-m (12.5-ft) long and 3.8-m (12.5 ft) wide. The concrete slabs are underlain by 15 cm (6 in.) of base, 15 cm (6 in.) of cement treated subgrade and natural clayey subgrade.
The TPAD on the tractor-trailer rig used to transport it from site to site is shown arriving in the parking lot at the FSF in Figure 7a. The TPAD positioned at the starting point of the testing path at the FSF is shown in Figure 7b.
N
Hangar
Parking Lot
TxDOT Flight Services Facility
Hangar
Starting Point Testing Path(about 192 m (630-ft) long)
40-cm (16-in.)thick slabs
20- and 25-cm (8-in. and 10-in.) thick slabs
58 m (190 ft) 134 m (440 ft)
Figure 6 TxDOT Flight Services Facility

13
Tractor TPAD
Trailer
(a) Photograph of the TPAD on the Tractor-Trailer Rig
(b) Photograph of the Total Pavement Acceptance Device (TPAD) at the Starting point of the Testing Path
Figure 7 Photographs of the TPAD and Tractor –Trailer Rig (from Stokoe et al., 2011)
14
Continuous RDD Deflection Profiles with Center Sensor (CS) As an example of continuous RDD deflection profiles along the testing path
collected with the center sensor (CS) with speeds of 0.8 to 3.2 km/hr (0.5 and 2 mph) are shown in Figure 8a. The testing was performed during the morning time to mitigate the potential of concrete slab curling and the pavement surface temperature was measured. As shown in Figure 8a, the difference in pavement surface temperature is very small so no effect of temperature on pavement deflections was assumed. The deflection profile shows a clear pattern of joint and mid-slab deflections: peaks at joint locations and troughs at mid-slab areas. The first 58-m (190-ft) long section with 40-cm (16-in.) thick slabs shows much lower mid-slab movements while the remaining 134-m (440-ft) long section with 20- and 25-cm (8- and 10-in.) thick slabs shows considerably higher mid-slab movements.
As seen in the Figure 8a, the two deflection profiles using different collection speeds showed nearly the same profile. A third profile collected at 4.8 km/hr (3 mph) is also matched well with the deflection profile determined at a speed of 0.8 km/hr (0.5 mph).
Continuous GPR Profile Continuous ground penetrating radar profile collected at TxDOT FSF is shown in Figure 8b. The x-axis of the figure is the distance along the testing path. As seen in the figure, the section with 20- and 25-cm (8- and 10-in.) thick slabs is clearly seen while the thickness of 40-cm (16-in.) is not seen as clearly. It seems that the pulse from the radar could not be penetrated deep enough to detect the 40-cm (16-in.) thick slab thickness.

15
Center Sensor (CS)_March 28, 2012
0
2
4
6
8
10
12
14
16
0 100 200 300 400 500 600 700
Distance (ft)
Def
lect
ion
(mils
/10k
ips)
0.5 mph (9:00AM, 70F)2 mph (9:38AM, 72F)
40 cm (16-in.) Thick Slabs
20 and 25 cm (8- and 10-in.) Thick Slabs
(a) Continuous RDD Deflection Profiles with testing speeds of 0.5 and 2 mph
40-cm (16-in.) Thick Slabs
20- and 25-cm (8- and 10-in.) Thick SlabsSlab Thickness
Transition Zones
(b) Continuous GPR Profile at TxDOT FSF
Figure 8 Continuous RDD and GPR Profiles at TxDOT FSF
16
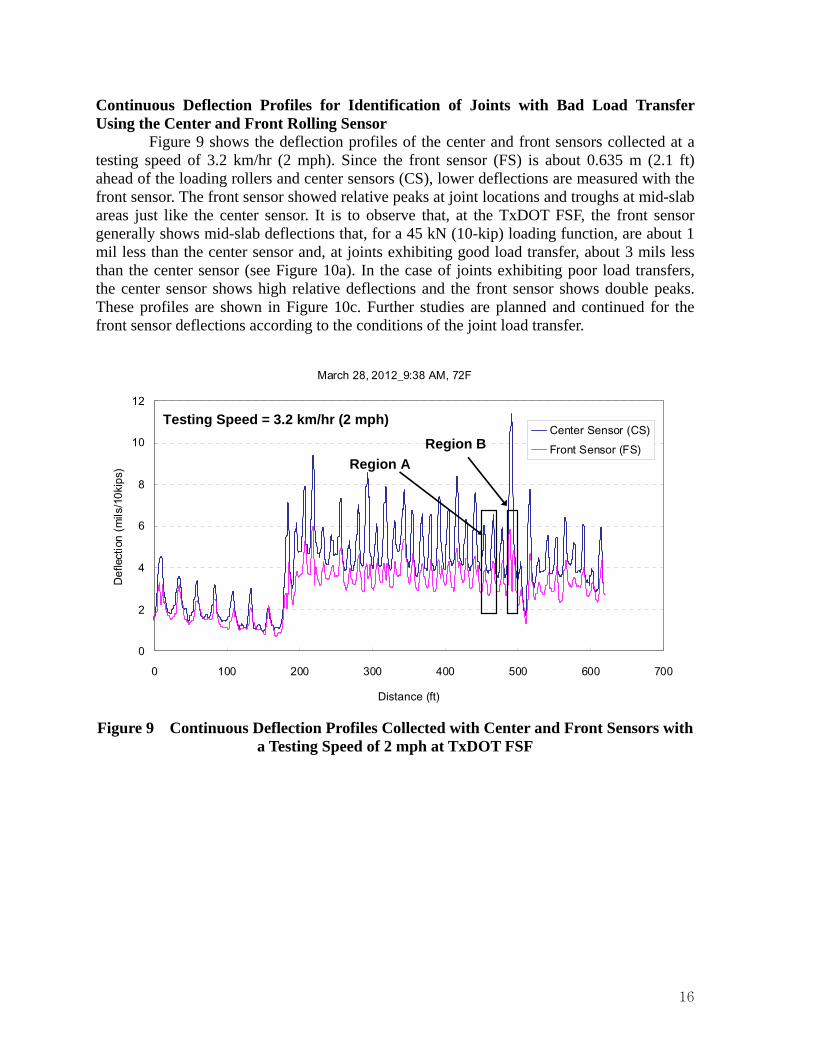
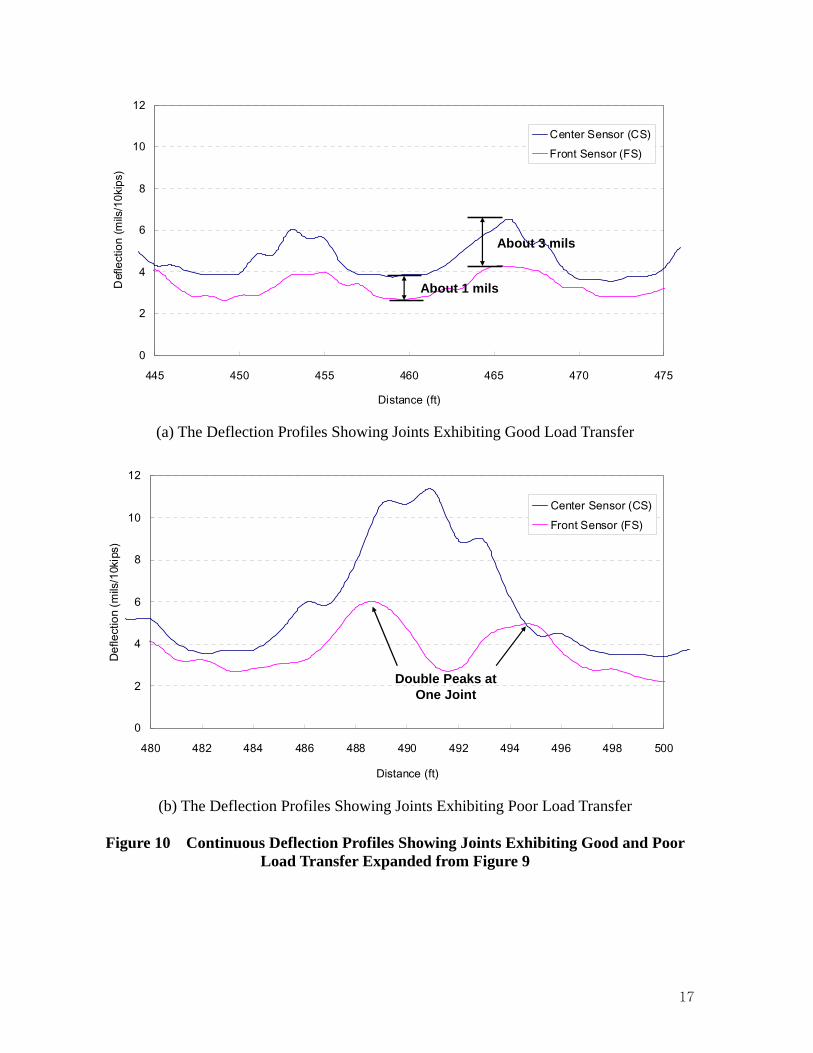
Continuous Deflection Profiles for Identification of Joints with Bad Load Transfer Using the Center and Front Rolling Sensor Figure 9 shows the deflection profiles of the center and front sensors collected at a testing speed of 3.2 km/hr (2 mph). Since the front sensor (FS) is about 0.635 m (2.1 ft) ahead of the loading rollers and center sensors (CS), lower deflections are measured with the front sensor. The front sensor showed relative peaks at joint locations and troughs at mid-slab areas just like the center sensor. It is to observe that, at the TxDOT FSF, the front sensor generally shows mid-slab deflections that, for a 45 kN (10-kip) loading function, are about 1 mil less than the center sensor and, at joints exhibiting good load transfer, about 3 mils less than the center sensor (see Figure 10a). In the case of joints exhibiting poor load transfers, the center sensor shows high relative deflections and the front sensor shows double peaks. These profiles are shown in Figure 10c. Further studies are planned and continued for the front sensor deflections according to the conditions of the joint load transfer.
March 28, 2012_9:38 AM, 72F
0
2
4
6
8
10
12
0 100 200 300 400 500 600 700
Distance (ft)
Def
lect
ion
(mils
/10k
ips)
Center Sensor (CS)Front Sensor (FS)
Testing Speed = 3.2 km/hr (2 mph)
Region BRegion A
Figure 9 Continuous Deflection Profiles Collected with Center and Front Sensors with
a Testing Speed of 2 mph at TxDOT FSF
17
0
2
4
6
8
10
12
445 450 455 460 465 470 475
Distance (ft)
Def
lect
ion
(mils
/10k
ips)
Center Sensor (CS)Front Sensor (FS)
About 3 mils
About 1 mils
(a) The Deflection Profiles Showing Joints Exhibiting Good Load Transfer
0
2
4
6
8
10
12
480 482 484 486 488 490 492 494 496 498 500
Distance (ft)
Def
lect
ion
(mils
/10k
ips)
Center Sensor (CS)Front Sensor (FS)
Double Peaks at One Joint
(b) The Deflection Profiles Showing Joints Exhibiting Poor Load Transfer
Figure 10 Continuous Deflection Profiles Showing Joints Exhibiting Good and Poor
Load Transfer Expanded from Figure 9
18
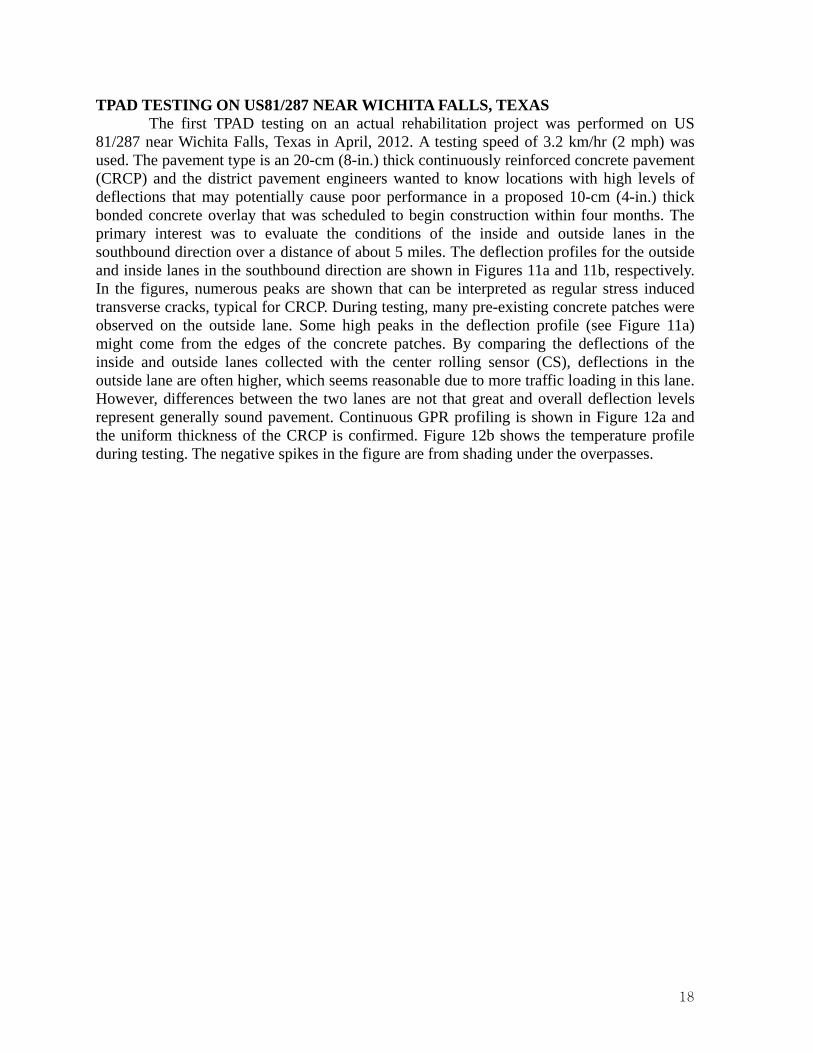
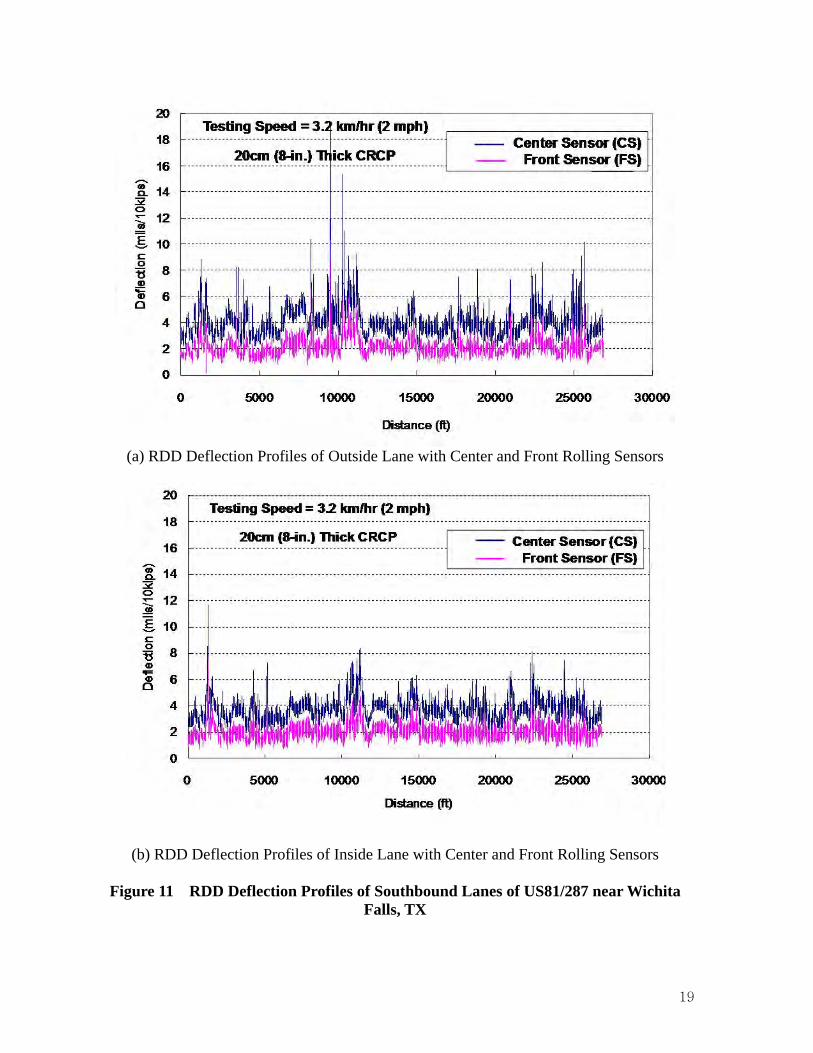
TPAD TESTING ON US81/287 NEAR WICHITA FALLS, TEXAS The first TPAD testing on an actual rehabilitation project was performed on US 81/287 near Wichita Falls, Texas in April, 2012. A testing speed of 3.2 km/hr (2 mph) was used. The pavement type is an 20-cm (8-in.) thick continuously reinforced concrete pavement (CRCP) and the district pavement engineers wanted to know locations with high levels of deflections that may potentially cause poor performance in a proposed 10-cm (4-in.) thick bonded concrete overlay that was scheduled to begin construction within four months. The primary interest was to evaluate the conditions of the inside and outside lanes in the southbound direction over a distance of about 5 miles. The deflection profiles for the outside and inside lanes in the southbound direction are shown in Figures 11a and 11b, respectively. In the figures, numerous peaks are shown that can be interpreted as regular stress induced transverse cracks, typical for CRCP. During testing, many pre-existing concrete patches were observed on the outside lane. Some high peaks in the deflection profile (see Figure 11a) might come from the edges of the concrete patches. By comparing the deflections of the inside and outside lanes collected with the center rolling sensor (CS), deflections in the outside lane are often higher, which seems reasonable due to more traffic loading in this lane. However, differences between the two lanes are not that great and overall deflection levels represent generally sound pavement. Continuous GPR profiling is shown in Figure 12a and the uniform thickness of the CRCP is confirmed. Figure 12b shows the temperature profile during testing. The negative spikes in the figure are from shading under the overpasses.
19
(a) RDD Deflection Profiles of Outside Lane with Center and Front Rolling Sensors
(b) RDD Deflection Profiles of Inside Lane with Center and Front Rolling Sensors
Figure 11 RDD Deflection Profiles of Southbound Lanes of US81/287 near Wichita Falls, TX
20
(a) GPR Profile of Southbound Lanes of US81/287 near Wichita Falls, TX
(b) Temperature Profile Collected during Testing of Southbound Lanes of US81/287 near
Wichita Falls, TX
Figure 12 GPR and Temperature Profiles Southbound Lanes of US81/287 near Wichita Falls, TX
CONCLUSIONS A new pavement testing device, called the Total Pavement Acceptance Device (TPAD), has been developed with funding from TxDOT. The objective of TPAD testing is to nondestructively and nonintrusively investigate the total pavement’s structural adequacy. The TPAD performs multiple types of continuous measurements as it moves along the pavement at speeds around 3.2 to 4.8 km/hr (2 to 3 mph). The multiple measurements include: (1) measuring continuous pavement deflections based on the rolling dynamic deflectometer method, (2) generating ground penetrating radar profiles (pavement thickness and subsurface conditions), (3) logging global positioning (testing location), (4) measuring pavement surface temperature, (5) collecting digital video images of pavement and right-of-way conditions, and (6) logging distance measurements along the testing paths with a DMI. Two examples of testing real pavements are presented to illustrate the deflection (RDD) and thickness (GPR) profiling. This work was successfully completed and the TPAD is transitioning to implementation and project-level activities. ACKNOWLEDGEMENTS Support from the TxDOT research program over the past four years to develop the TPAD is gratefully acknowledged.
21
REFERENCES
1. Bandara, N., and Briggs, R. (2004), “Nondestructive Testing of Pavement Structures,” Back to Basics Series, American Society for Nondestructive Testing, July 2004 issue.
2. Bay, J. A., Stokoe, II, K. H., and Jackson, J. D. (1995), “Development and Preliminary Investigation of Rolling Dynamic Deflectometer,” Transportation Research Record 1473, TRB, Washington, D. C., pp. 43-54.
3 Bay, J. A., and Stokoe, II, K. H., (1998), “Development of a Rolling Dynamic
Deflectometer for Continuous Deflection Testing of Pavements,” Publication Report No. FHWA/TX-99/1422-3F, FHWA/Texas Department of Transportation, Center for Transportation Research.
4. Bay, J. A., Stokoe, K. H., McNerney, M. T., Soralump, S., Vleet, D.A., and Rozycki, D. K. (2000), “Evaluating Runway Pavements at Seattle-Tacoma International Airport: Continuous Deflection Profiles Measured with the Rolling Dynamic Deflectometer,” Transportation Research Record 1716, TRB, Washington, D.C., pp. 1-9.
5. Chen, D.-H, Zhou, F., Lee, J. L., Hu, S., Stokoe, K. H., Yang, J. (2007), “Threshold Values for Reflective Cracking Based on Continuous Deflection Measurements,” Canadian Journal of Civil Engineering, Vol. 34, pp. 1257-1266.
6. Lee, J.L. and Stokoe, II, K. H., (2006), “Improved Testing Speed of the Rolling Dynamic
Deflectometer,” Publication Report No. FHWA/TX-06/0-4357-1, FHWA/Texas Department of Transportation. Center for Transportation Research.
7. Maser, K. R., and Scullion, T. (1992), “Automated Pavement Subsurface Profiling Using Radar: Case Studies of Four Experimental Field Sites,” Transportation Research Record 1344, TRB, Washington, D. C., pp. 148-154.
8. Nam, B. H., Scullion, T., Stokoe II, K. H., and Lee, J. –S (2011), “Rehabilitation
Assessment of Jointed Concrete Pavement Using the Rolling Dynamic Deflectometer and Ground Penetrating Radar,” Journal of Testing and Evaluation, ASTM. Vol 39, No. 3.
9. Scullion, T. (2005). “Using Rolling Deflectometer and Ground Penetrating Radar
Technologies for Full Coverage of Jointed Concrete Pavements,” Research Report 4517-2, Texas Transportation Institute, Texas A&M University, College Station, TX.
22
10. Stokoe, II, K. H., Kallivokas, L. F., Nam, B. H., Carpenter, C. K., Bryant, A. D., Weeks, D. A., Beno, J. H., Scullion, T., and Liu, W., (2010), “Progress During the First Year Towards Building the Total Pavement Acceptance Device (TPAD),” Publication Report No. FHWA/TX-11/0-6005-1, FHWA/Texas Department of Transportation, Center for Transportation Research and Texas Transportation Institute.
11. Stokoe, II, K. H., Kallivokas, L. F., Nam, B. H., Carpenter, C. K., Lee, J. –S., Bryant, A.
D., Weeks, D. A., Hayes, R., Scullion, T., and Liu, W., (2011), “Developing a Testing Device for Total Pavement Acceptance,” Publication Report No. FHWA/TX-11/0-6005-2, FHWA/Texas Department of Transportation, Center for Transportation Research and Texas Transportation Institute.
12. Stokoe, II, K. H., Lee, J. –S., Nam, B. H., Lewis, M., Hayes, R., Scullion, T., and Liu, W.,
(2011), “Developing a Testing Device for Total Pavement Acceptance-Third Year Report,” Publication Report No. FHWA/TX-11/0-6005-4, FHWA/Texas Department of Transportation, Center for Transportation Research and Texas Transportation Institute.

Slide presentation given at the 2014 FAA Worldwide Airport Technology Transfer Conference, August 5–7, 2014, in Galloway, New
Jersey

1
Jung-Su Lee and Kenneth H. Stokoe, IICenter for Transportation Research
University of Texas at Austin
Thomas ScullionTexas A&M Transportation Institute
Texas A&M University
Joe Leidy and Edward Oshinski Texas Department of Transportation
2014 FAA Worldwide Airport Technology Transfer ConferenceAugust 07, 2014
Demonstration of a New, Multi-Function, Nondestructive Pavement
Testing Device

2
Outline1. Overview of Rolling Dynamic Deflectometer (RDD)
• Emphasis of Presentation is Deflection
Measurements
2. Present New Profiling Device
• Called Total Pavement Acceptance Device (TPAD)
• Multi-Function Device
3. TPAD Testing at TxDOT FSF in Austin
• Jointed Concrete Pavement Testbed
• RDD Deflection Profiles
4. Concluding Remarks
33
1. Overview:Rolling Dynamic Deflectometer (RDD)
Electro-Hydraulic Loading System
Rolling Sensors Two Loading Rollers
Diesel Engine: PowersHydraulic Loading System
Distance Encoder• Mobile platform
– moves continuously along pavement– two loading rollers apply dynamic loads to pavement– multiple rolling sensors measure resulting dynamic deflections
4
Cross Section of RDD
AirSpring
Rolling Deflection
Sensor
Static Force
StaticForce
Reaction Mass(generates dynamic force)
Loading Roller
Hydraulic Actuator
LoadCells
LoadCells
Loading Roller
AirSpring
5
Continuous Deflection Profile
0
2
4
6
8
10
12
14
16
18
20
280 330 380 430 480Distance (ft)
Def
lect
ion
(mils
/10k
ips)
A: Construction Joint (with Re-Bar)
B: Expansion Joint (No Rebar)
C: Contraction Joint (Aggregate Interlocking)
B
AAAA CC
C
Joint Spacing is Regular and Equal to 3.8 m (12.5 ft)
CACA
C
A
C
AA
Testing Time: March 2012 at 8:32 AMPavement Temperature: 19 ℃ (66 ℉)
C
6
• Total Pavement Acceptance Device (TPAD)– Project-level studies– Continuous testing at 2 to 3 mph
(Goal is to increase testing speed)– Multi-function device
2. New Profiling Device
• Testing Functions– RDD measurements
– Ground penetrating radar (GPR)
– Distance measurement along pavement (DMI)
– High-precision differential GPS
– Pavement surface temperature
– Digital video imaging of pavement

7
TPAD Mobile Platform:Adapted from a Minivibe
Cross-Sectional View of Pavement Loading System Shown in Next Slide
Loading Roller
* Note: Much open space beneath frames.

8
Cross Section of TPAD Loading System
Static Load
Air Spring Isolation
Dynamic Reaction
Mass
Loading Roller
30-Hz Sinusoidal Dynamic Loading
Generalized Location of
Rolling Sensors
Static Load
Loading Roller (Dia. = 1.5ft)
9
TPAD RDD Forcing Function
16
12
8
4
0
Fo
rce
(kip
s)
0.50.40.30.20.10.0
Time (sec)
Period (T) Hold-Down Force
Dynamic Force = Fd
Notes:1. Typical loading frequency = 1/T = 30 Hz2. Maximum hold-down force ≃ 14 kips3. Measuring dynamic pavement deflections due to Fd
4. Measurements accuracy approx. 0.05 mils while moving
10
1 in.1 in. 2 in.
Hold-Down Mass (Hanging-Mass
System)
Hidden Location of
2-Hz Geophone
TPAD Rolling Sensor
Tread Stiffness = 50 A Durometer
(Pencil Eraser Stiffness)
Wheel Diameter:‧Center Sensor: 9.5 in. ‧Front and Rear
Sensors: 12.5 in.

11
Arrangement of Three TPAD Rolling Sensors
1.75 ft 1.75 ft
Front Sensor(FS)
Loading Roller Loading Roller
2.1
ft
Dir
ecti
on
of
Trav
el
2.1
ft
Center Sensor(CS)
Rear Sensor(RS)

12
RDD Portion of TPAD
Front Sensor (FS)
Towing Frame
Loading Rollers
Center Sensor (CS) (Hidden by
Loading Frame)
13
Hangar
Hangar
200 ft 500 ft
3. Testbed at TxDOT Flight Services Facility

14
TPAD at TxDOT Flight Services Facility in Austin
GPR
VideoCamera
High-Precision GPSElectro-HydraulicLoading System
RDD Loading Rollers(raised position)

15
Stationary and Continuous Deflections
Mid-Slab Difference Median = 0.120 mils/10 kips,
σ= 0.079 mils/10 kips
Mid-Slab Difference Median = 0.127 mils/10 kips,
σ= 0.149 mils/10 kips
Slab 38Slab 39
Temperature: 65 ℉ to 71 ℉ Time: 8:30 – 9:10 AM
Center Sensor_March 28, 2012
0
2
4
6
8
10
12
14
16
530 535 540 545 550 555 560 565 570 575 580
Distance (ft)
Def
lect
ion
(mils
/10k
ips)
Rolling Measurement_1 mphCenter Sensor_March 28, 2012 Rolling Measurement_1 mphStationary Measurements
Temperature: 65 ℉ to 71 ℉ Time: 8:30 – 9:10 AM
Slab Thickness = 8 in.Slab Length = 12.5 ft
Mid-Slab Difference Median = 0.120 mils/10 kips,
σ= 0.079 mils/10 kips
Mid-Slab Difference Median = 0.127 mils/10 kips,
σ= 0.149 mils/10 kips
Slab 38Slab 39

16
Continuous RDD Deflection Profiles at 0.5 and 2 mph
25 ft x 25 ft,16-in. thick
slabs
12.5 ft x 12.5 ft,8-in. and 10-in. thick
slabs
Region A
Center Sensor (CS)_March 28, 2012
0
2
4
6
8
10
12
14
16
0 100 200 300 400 500 600 700
Distance (ft)
Def
lect
ion
(mils
/10k
ips)
2 mph (9:38AM, 72F)0.5 mph (9:00AM, 70F)
16-in. Thick Slabs 8- and 10-in. Thick Slabs
17
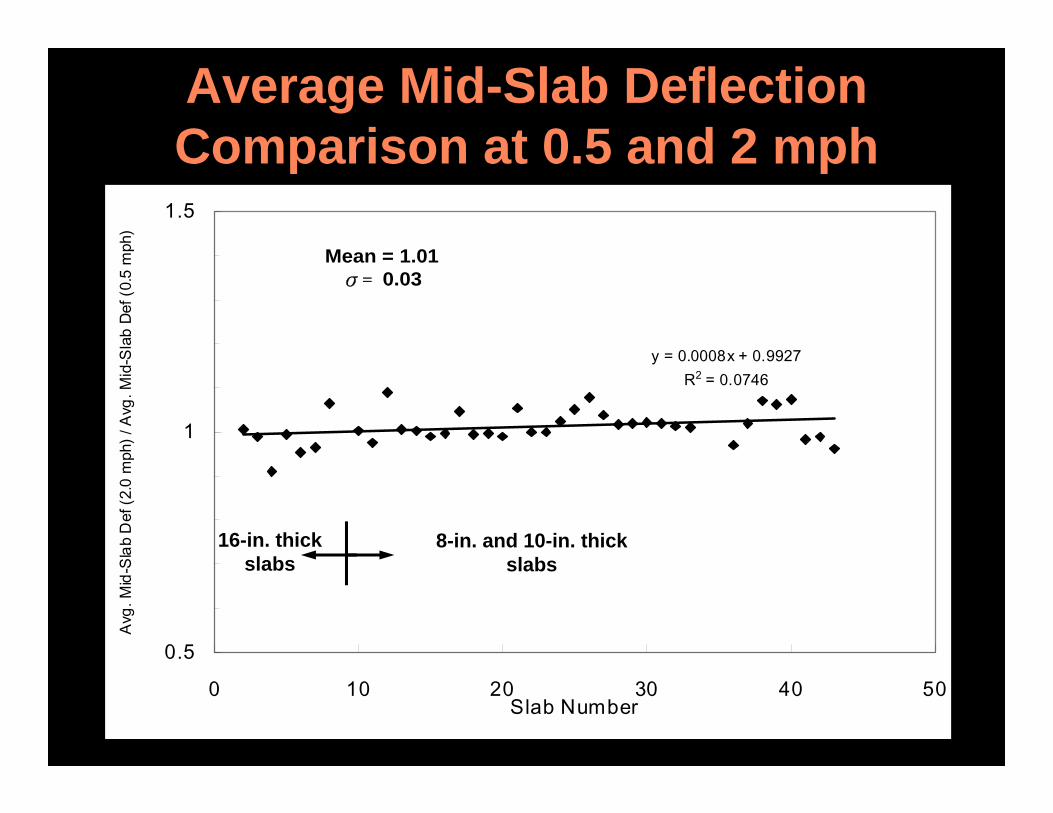
Average Mid-Slab Deflection Comparison at 0.5 and 2 mph
y = 0.0008x + 0.9927R2 = 0.0746
0.5
1
1.5
0 10 20 30 40 50Slab Number
Avg.
Mid
-Sla
b D
ef (2
.0 m
ph) /
Avg
. Mid
-Sla
b De
f (0.
5 m
ph)
Mean = 1.01σ= 0.03
16-in. thickslabs
8-in. and 10-in. thickslabs
18
Defl.
Location
Deflection Patterns Associated with Each Sensor Traversing a Joint
Dist.
Location
Joint with Poor Load Transfer
Locations of Sensors as They Traverse a Joint
CS FSRS
A
B
C
D
E
A B EDC
Deflections Associated with Sensors around Poor Load Transfer Joint
Travel Direction
Dynamic Loading
19
Expanded FS Deflection Profile
0
1
2
3
4
5
6
7
8
430 440 450 460 470 480 490 500Distance (ft)
Def
lect
ion
(mils
/10k
ips)
Joint A: FWD LTE 21%
Front Sensor (FS)
Joint E: FWD LTE 6%
Joint Spacing = 12.5 ft
Joint D: FWD LTE 98%
Joint CJoint B
20
4. Concluding Remarks
• New, multi-function pavement profiling system was developed with TxDOT funding.
• Development was a joint effort (TxDOT, CTR and TTI).
• New system is called the TPAD (Total Pavement Acceptance Device).
21
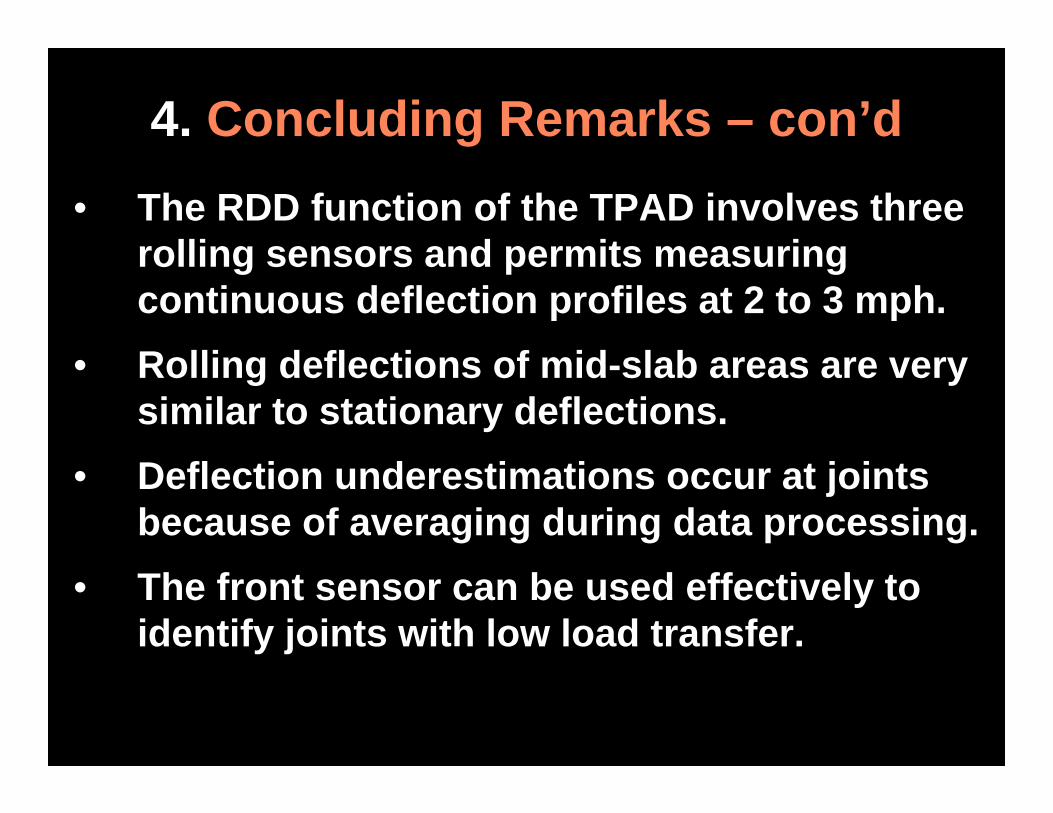
4. Concluding Remarks – con’d
• The RDD function of the TPAD involves three rolling sensors and permits measuring continuous deflection profiles at 2 to 3 mph.
• Rolling deflections of mid-slab areas are very similar to stationary deflections.
• Deflection underestimations occur at joints because of averaging during data processing.
• The front sensor can be used effectively to identify joints with low load transfer.
22
Acknowledgements
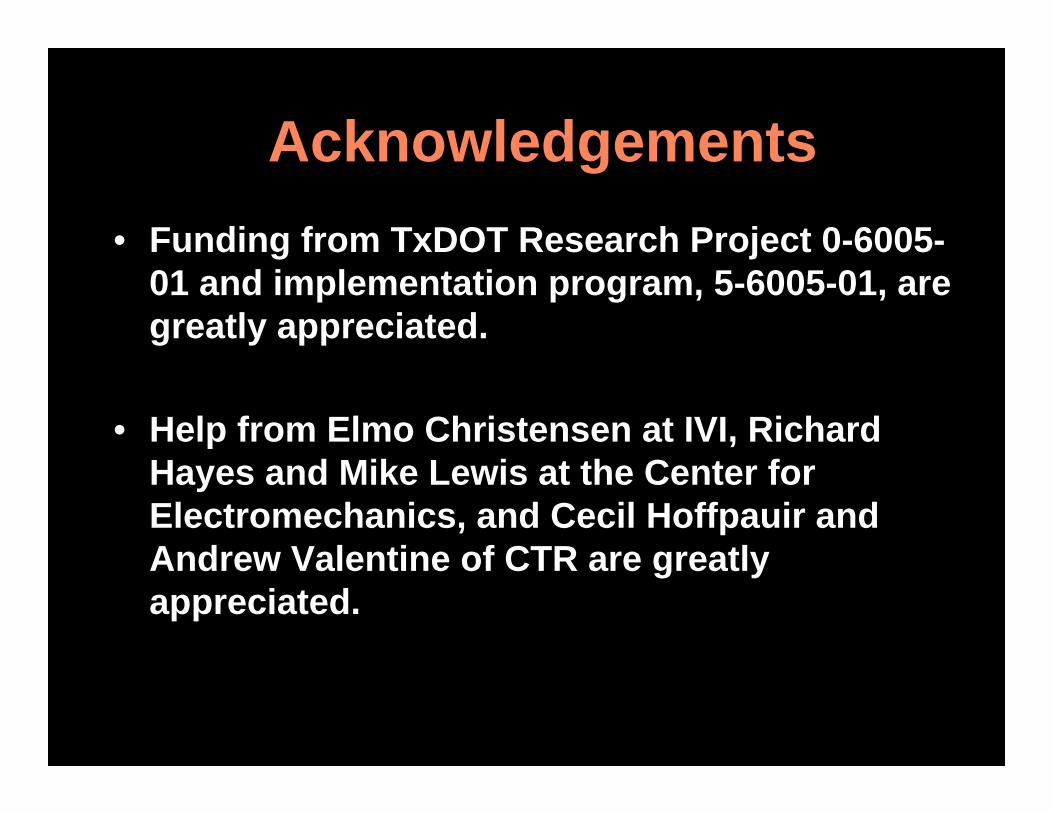
• Funding from TxDOT Research Project 0-6005-01 and implementation program, 5-6005-01, are greatly appreciated.
• Help from Elmo Christensen at IVI, Richard Hayes and Mike Lewis at the Center for Electromechanics, and Cecil Hoffpauir and Andrew Valentine of CTR are greatly appreciated.

23
Thank You
Questions?

Paper presented at the 2014 FAA conference: Demonstration of a New, Multi-Function, Nondestructive Pavement Testing Device

Demonstration of a New, Multi-Function, Nondestructive Pavement Testing Device
By:
Jung-Su Lee and Kenneth H. Stokoe II University of Texas at Austin, Department of Civil Engineering 1 University Station, ECJ 9.227, Campus Mail Code: C1792
Austin, TX 78712, USA Phone: (512) 699-3767; Fax: (512) 471-6548
[email protected] [email protected]
Thomas Scullion
Texas A&M Transportation Institute 3135 TAMU
College Station, TX 77843, USA Phone: (979) 845-9913; Fax: (979) 845-3135
Joe Leidy Texas Department of Transportation, Construction Division (Materials and Pavements)
4203 Bull Creek #39 Austin, TX 78731
Phone: (512) 506-5848; Fax: (512) 506-5839 [email protected]
Edward Oshinski
Texas Department of Transportation, Aviation Division 150 E.Riverside Drive, South Tower, 5th Floor
Austin, TX 78704 Phone: (512) 416-4534; Fax: (512) 4510-
PRESENTED FOR THE 2014 FAA WORLDWIDE AIRPORT TECHNOLOGY TRANSFER CONFERENCE
Galloway, New Jersey, USA
August 2014
Lee et al. 1
INTRODUCTION
The Texas Department of Transportation (TxDOT) has been evaluating the structural condition of highway and airport pavements with multiple types of nondestructive testing (NDT) devices for more than four decades. Over the past fifteen years, new devices have been integrated into this pavement evaluation effort. One device is the rolling dynamic deflectometer (RDD). The RDD was originally developed through the TxDOT research program to determine continuous deflection profiles that are used in pavement structural assessments (Chen et al. [1]). TxDOT researchers have shown that RDD deflection profiles can be used more effectively when combined with other data such as pavement thickness and subsurface conditions (Scullion [2], and Nam et al. [3]). Therefore, TxDOT has supported development of a multi-function device which is equipped with RDD profiling and ground penetrating radar (GPR) functions. Additional functions that have been integrated into the new device are video cameras for pavement and right-of-way conditions, pavement temperature measurements and high-precision positioning. These multi-functions permit efficient comparisons of RDD deflection data with other NDT data logged by the different methods. The new device is called the Total Pavement Acceptance Device (TPAD). The TPAD has all functions combined on a single platform that can move along the pavement at 2 to 3 mph. All measurements are collected in a single pass and analysis software permits the data to be displayed in near-real time (less than 5 minutes after collection) so that the results can be used for preliminary evaluations of pavement conditions on-the-fly or can be used for more detailed analyses at a later time.
In this paper, a background on two of the nondestructive testing functions in the TPAD, the RDD and GPR systems, are briefly discussed. A description of the TPAD mobile platform and the RDD dynamic loading system are described. The developmental work for the speed-improved rolling sensors is also discussed. Finally, the TPAD is demonstrated by presenting RDD deflection profiles and GPR records collected at a testbed created at the TxDOT Flight Services Facility (FSF) are presented. The reliability of the data were also evaluated at the FSF testbed and found to be high as described herein.
BACKGROUND ON RDD AND GPR TESTING FUNCTIONS IN THE TPAD
Rolling Dynamic Deflectometer (RDD)
The Rolling Dynamic Deflectometer (RDD) is a nondestructive testing device that involves measuring pavement deflections under controlled pavement loads while moving along the pavement. RDD deflection profiles have been used for about 15 years for structural-condition assessment of both highway and airport pavements. The RDD was developed by researchers at the University of Texas at Austin (UT) in the 1990’s (Bay and Stokoe [4]). Dr. James Bay led the developmental work and Dr. Jefferey Lee and Dr. Boo-Hyun Nam advanced the rolling sensor design (Bay et al. [5], Lee and Stokoe [6], and Nam [7]). As shown in Figure 1a, the RDD is a truck-mounted device on which an electro-hydraulic loading system is used to deliver a static hold-down force combined with a dynamic sinusoidal force (typically 30 Hz) to the pavement through two loading rollers. An array of three to four rolling sensors that are positioned along the longitudinal centerline of the truck (see Figure 1b) is used to measure induced dynamic pavement deflections while the truck is moving along the pavement at a speed of about 1 mph. Sensor #1 is located mid-way between the two loading rollers and other sensors are spaced ahead

Lee et al. 2
of Sensor #1 in intervals ranging from 1.5 to 2.5 ft based on under-carriage constraint of the RDD truck.. A Distance Measurement Instrument (DMI) is attached on the rear wheel of the truck and is used to measure the distance traveled along the pavement. The deflection profile is produced with the recorded pavement deflections and distances. A typical deflection profile collected on a jointed concrete pavement (JCP) is shown in Figure 2. This deflection profile contains significant data that: (1) shows increased movements at all transverse joints and cracks, (2) allows joint types (construction vs. expansion vs. contraction) to be evaluated based on relative movements, (3) permits relative evaluation of load transfer at joints and cracks, and (4) permits evaluation of the extent and relative quality of mid-slab areas. RDD profiling has been used to: (1) delineate areas to be repaired, (2) help select possible rehabilitation treatments, (3) measure improvements due to the rehabilitations, and (4) evaluate changes with time, environmental conditions, and trafficking (Chen et al. [1]).
Hydraulic Combined Static and Dynamic
Loading SystemMotorized
RDD Platform
Engine to Power Hydraulic Loading
System
Distance Encoder
Two Loading Rollers Rolling Deflection Sensors at
Multiple Measurement Points
(a) Major Components of the RDD.
Direction of Travel
Sensor #1 Sensor #2 Sensor #3 Sensor #4
1.93 ft
9.25 in.
2.5 ft 2.0 ft 1.5 ft
Loaded Area
Loaded Area
(b) Plan View of Loading Rollers and Rolling Deflection Sensors.
Figure 1. Schematic of the Original Rolling Dynamic Deflectometer (RDD) (Bay and Stokoe [4]).
Lee et al. 3
0
2
4
6
8
10
12
14
16
18
20
280 330 380 430 480Distance (ft)
Def
lect
ion
(mils
/10k
ips)
A: Construction Joint (with Re-Bar) B: Expansion Joint (No Rebar)C: Contraction Joint (Aggregate Interlocking)
B
AAAA CCC
Joint Spacing is Regular and Equal to 3.8 m (12.5 ft)
CACA
CA
C
AA
Testing Time: March 2012 at 8:32 AMPavement Temperature: 19 ℃ (66 ℉)
C
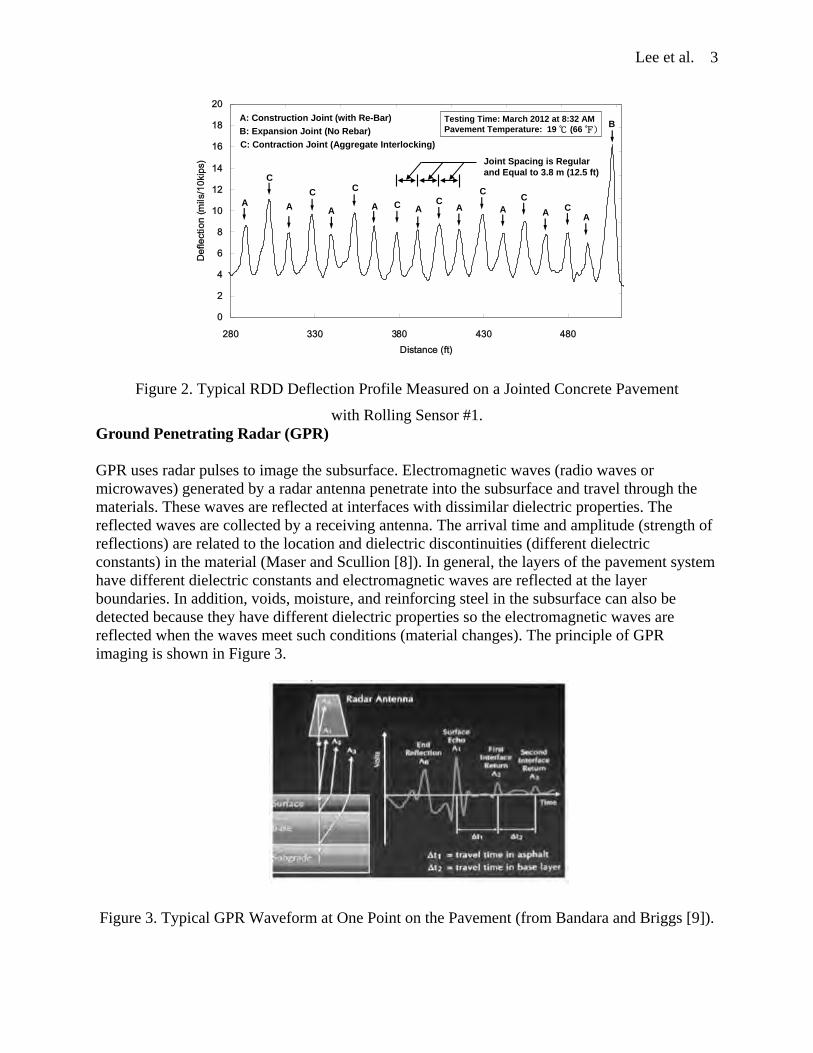
Figure 2. Typical RDD Deflection Profile Measured on a Jointed Concrete Pavement
with Rolling Sensor #1. Ground Penetrating Radar (GPR)
GPR uses radar pulses to image the subsurface. Electromagnetic waves (radio waves or microwaves) generated by a radar antenna penetrate into the subsurface and travel through the materials. These waves are reflected at interfaces with dissimilar dielectric properties. The reflected waves are collected by a receiving antenna. The arrival time and amplitude (strength of reflections) are related to the location and dielectric discontinuities (different dielectric constants) in the material (Maser and Scullion [8]). In general, the layers of the pavement system have different dielectric constants and electromagnetic waves are reflected at the layer boundaries. In addition, voids, moisture, and reinforcing steel in the subsurface can also be detected because they have different dielectric properties so the electromagnetic waves are reflected when the waves meet such conditions (material changes). The principle of GPR imaging is shown in Figure 3.
Figure 3. Typical GPR Waveform at One Point on the Pavement (from Bandara and Briggs [9]).
Lee et al. 4
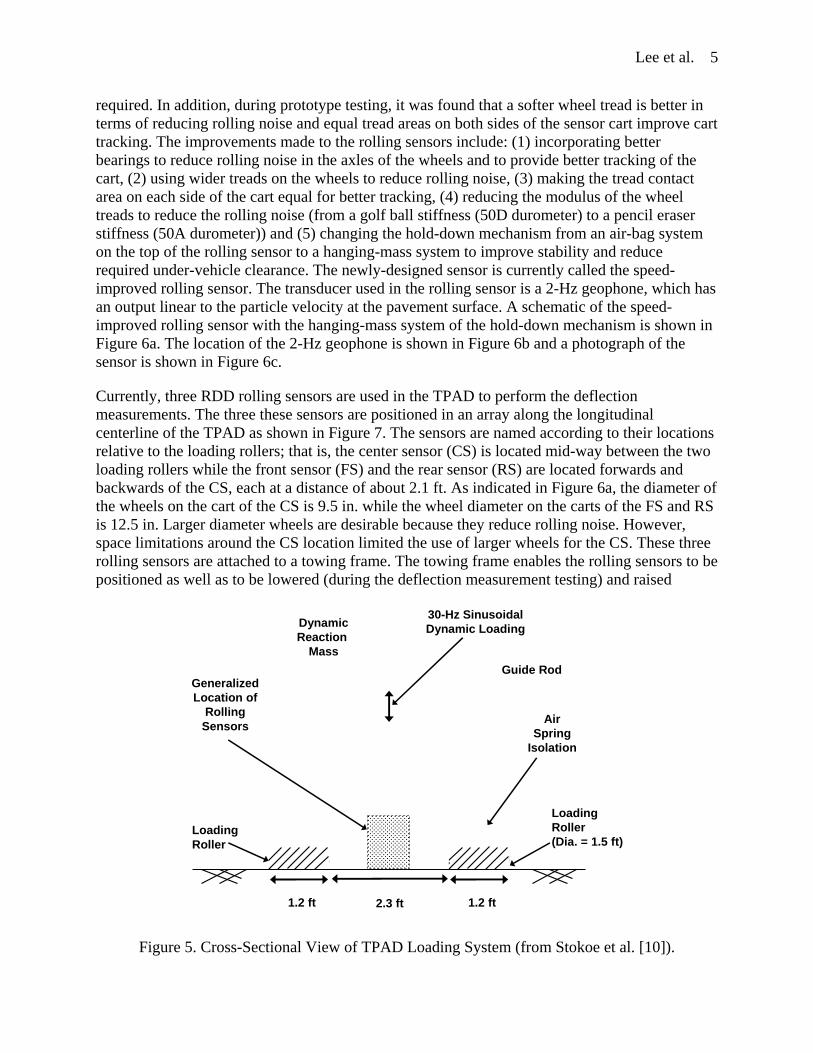
DESCRIPTION OF TPAD MOBILE PLATFORM AND PAVEMENT LOADING SYSTEM
The mobile platform of the TPAD is adapted from a small off-road vibrosies used in geophysical exploration that is built by Industrial Vehicles International (IVI) in Tulsa, OK (www.indvehicles.com). The TPAD platform is shown in Figure 4 and is hydraulically operated. The total weight of the mobile platform is about 18 kips and the dimensions are: 20 ft in length, 7.5 ft in width, and 7.8 ft in height. The TPAD has been modified to have a precise speed control system with a range of 0.5 to 10 mph. The loading system (see Figure 5) is capable of generating static forces of 3.4 to 14 kips and dynamic sinusoidal forces with a peak-to-peak amplitude of 2 to 24 kips over a frequency range of about 7 to 200 Hz. The static hold-down and dynamic sinusoidal forces are applied to the pavement through two loading rollers (see Figure 5). The loading rollers are 1.5 ft in diameter and 1.2 ft in width and made of 92 A durometer polyurethane which represents a hardness similar to a golf ball cover.
The vehicle cab has a size of 142 cubic feet and a heating/air-conditioning system to prevent temperature damage to the software and hardware system for data recording, TPAD operations and data analysis. This cab size is enough to accommodate the driver, operator of the data collection activities and all hardware systems. A 2,000-watt pure sine wave inverter is on-board to generate all electrical power required by the electrical systems. All movements of the mobile platform, RDD loading imparted to the pavement and raise/lowering capabilities of the rolling sensors (discussed below) are hydraulically powered.
SPEED-IMPROVED ROLLING SENSOR FOR TPAD RDD DEFLECTION MEASUREMENTS
One objective of the TPAD developmental work was to perform RDD deflection profiling of the pavement while continuously moving at speeds around 2 to 3 mph (or higher if readily attainable). To meet or exceed this target speed, the original RDD rolling sensors had to be improved. Based on earlier studies (Bay and Stokoe [4]), larger and wider wheels were
Cross-Sectional View of Pavement Loading System Shown in Figure 5
Figure 4. TPAD Mobile Platform (from Stokoe et al. [10]).
Lee et al. 5
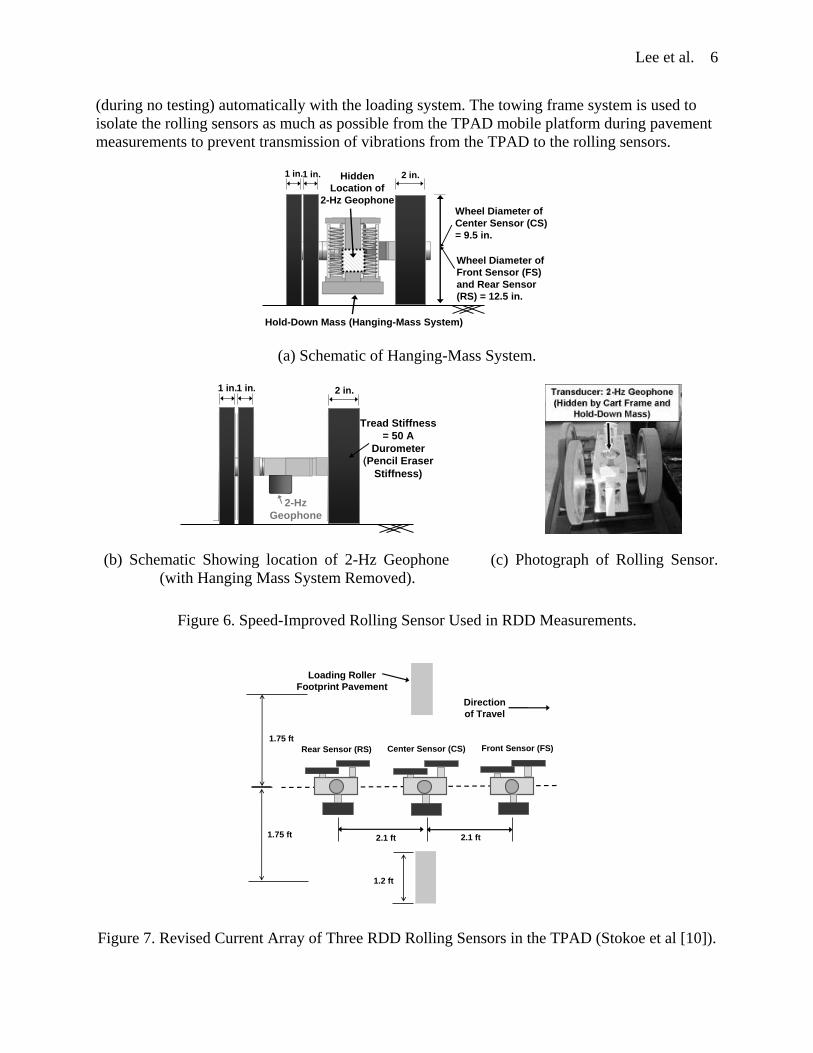
required. In addition, during prototype testing, it was found that a softer wheel tread is better in terms of reducing rolling noise and equal tread areas on both sides of the sensor cart improve cart tracking. The improvements made to the rolling sensors include: (1) incorporating better bearings to reduce rolling noise in the axles of the wheels and to provide better tracking of the cart, (2) using wider treads on the wheels to reduce rolling noise, (3) making the tread contact area on each side of the cart equal for better tracking, (4) reducing the modulus of the wheel treads to reduce the rolling noise (from a golf ball stiffness (50D durometer) to a pencil eraser stiffness (50A durometer)) and (5) changing the hold-down mechanism from an air-bag system on the top of the rolling sensor to a hanging-mass system to improve stability and reduce required under-vehicle clearance. The newly-designed sensor is currently called the speed-improved rolling sensor. The transducer used in the rolling sensor is a 2-Hz geophone, which has an output linear to the particle velocity at the pavement surface. A schematic of the speed-improved rolling sensor with the hanging-mass system of the hold-down mechanism is shown in Figure 6a. The location of the 2-Hz geophone is shown in Figure 6b and a photograph of the sensor is shown in Figure 6c.
Currently, three RDD rolling sensors are used in the TPAD to perform the deflection measurements. The three these sensors are positioned in an array along the longitudinal centerline of the TPAD as shown in Figure 7. The sensors are named according to their locations relative to the loading rollers; that is, the center sensor (CS) is located mid-way between the two loading rollers while the front sensor (FS) and the rear sensor (RS) are located forwards and backwards of the CS, each at a distance of about 2.1 ft. As indicated in Figure 6a, the diameter of the wheels on the cart of the CS is 9.5 in. while the wheel diameter on the carts of the FS and RS is 12.5 in. Larger diameter wheels are desirable because they reduce rolling noise. However, space limitations around the CS location limited the use of larger wheels for the CS. These three rolling sensors are attached to a towing frame. The towing frame enables the rolling sensors to be positioned as well as to be lowered (during the deflection measurement testing) and raised
Dynamic Reaction
Mass
AirSpring
Isolation
1.2 ft 2.3 ft
Loading Roller(Dia. = 1.5 ft)
Guide Rod
30-Hz Sinusoidal Dynamic Loading
Loading Roller
Generalized Location of
Rolling Sensors
1.2 ft
Figure 5. Cross-Sectional View of TPAD Loading System (from Stokoe et al. [10]).
Lee et al. 6
(during no testing) automatically with the loading system. The towing frame system is used to isolate the rolling sensors as much as possible from the TPAD mobile platform during pavement measurements to prevent transmission of vibrations from the TPAD to the rolling sensors.
1 in.1 in. 2 in.
Wheel Diameter of Center Sensor (CS) = 9.5 in.
Hold-Down Mass (Hanging-Mass System)
Wheel Diameter of Front Sensor (FS) and Rear Sensor (RS) = 12.5 in.
Hidden Location of
2-Hz Geophone
(a) Schematic of Hanging-Mass System.
1 in.1 in. 2 in.
Tread Stiffness = 50 A
Durometer(Pencil Eraser
Stiffness)
2-HzGeophone
(b) Schematic Showing location of 2-Hz Geophone (c) Photograph of Rolling Sensor. (with Hanging Mass System Removed).
Figure 6. Speed-Improved Rolling Sensor Used in RDD Measurements.
1.2 ft
Direction of Travel
Center Sensor (CS)Rear Sensor (RS) Front Sensor (FS)
2.1 ft1.75 ft
Loading Roller Footprint Pavement
2.1 ft
1.75 ft
Figure 7. Revised Current Array of Three RDD Rolling Sensors in the TPAD (Stokoe et al [10]).
Lee et al. 7
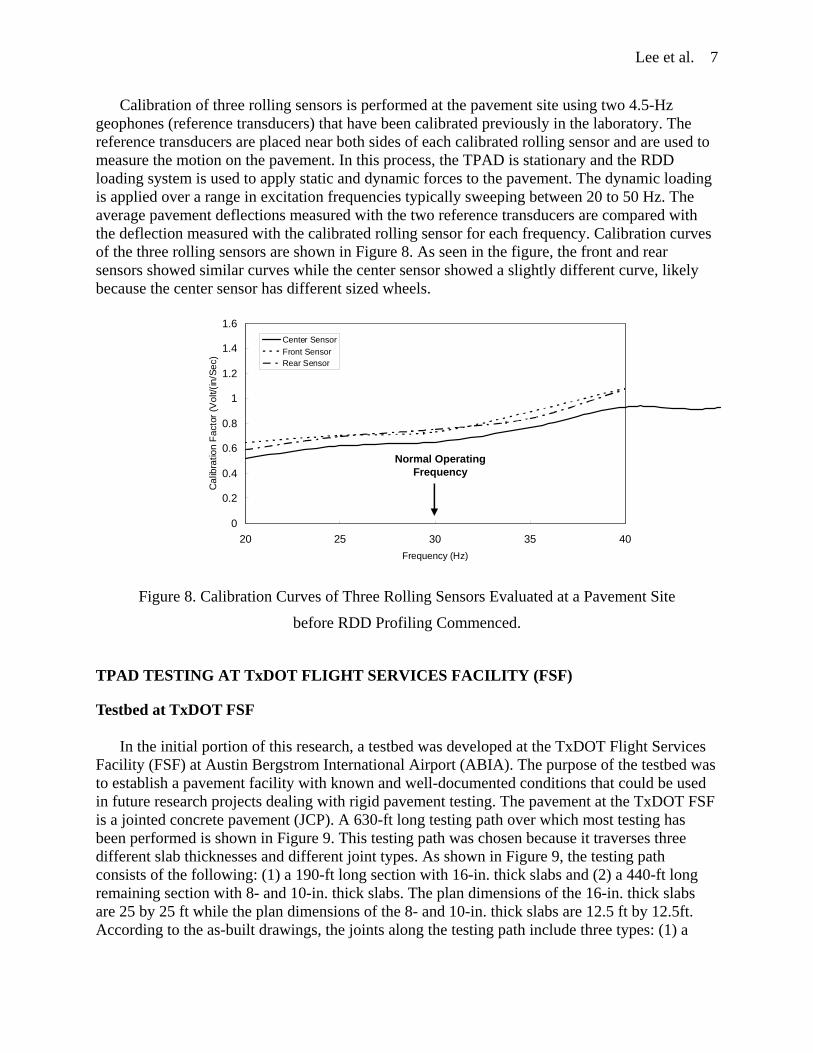
Calibration of three rolling sensors is performed at the pavement site using two 4.5-Hz geophones (reference transducers) that have been calibrated previously in the laboratory. The reference transducers are placed near both sides of each calibrated rolling sensor and are used to measure the motion on the pavement. In this process, the TPAD is stationary and the RDD loading system is used to apply static and dynamic forces to the pavement. The dynamic loading is applied over a range in excitation frequencies typically sweeping between 20 to 50 Hz. The average pavement deflections measured with the two reference transducers are compared with the deflection measured with the calibrated rolling sensor for each frequency. Calibration curves of the three rolling sensors are shown in Figure 8. As seen in the figure, the front and rear sensors showed similar curves while the center sensor showed a slightly different curve, likely because the center sensor has different sized wheels.
0
0.2
0.4
0.6
0.8
1
1.2
1.4
1.6
20 25 30 35 40Frequency (Hz)
Cal
ibra
tion
Fact
or (V
olt/(
in/S
ec)
Center SensorFront SensorRear Sensor
Normal Operating Frequency
Figure 8. Calibration Curves of Three Rolling Sensors Evaluated at a Pavement Site
before RDD Profiling Commenced.
TPAD TESTING AT TxDOT FLIGHT SERVICES FACILITY (FSF)
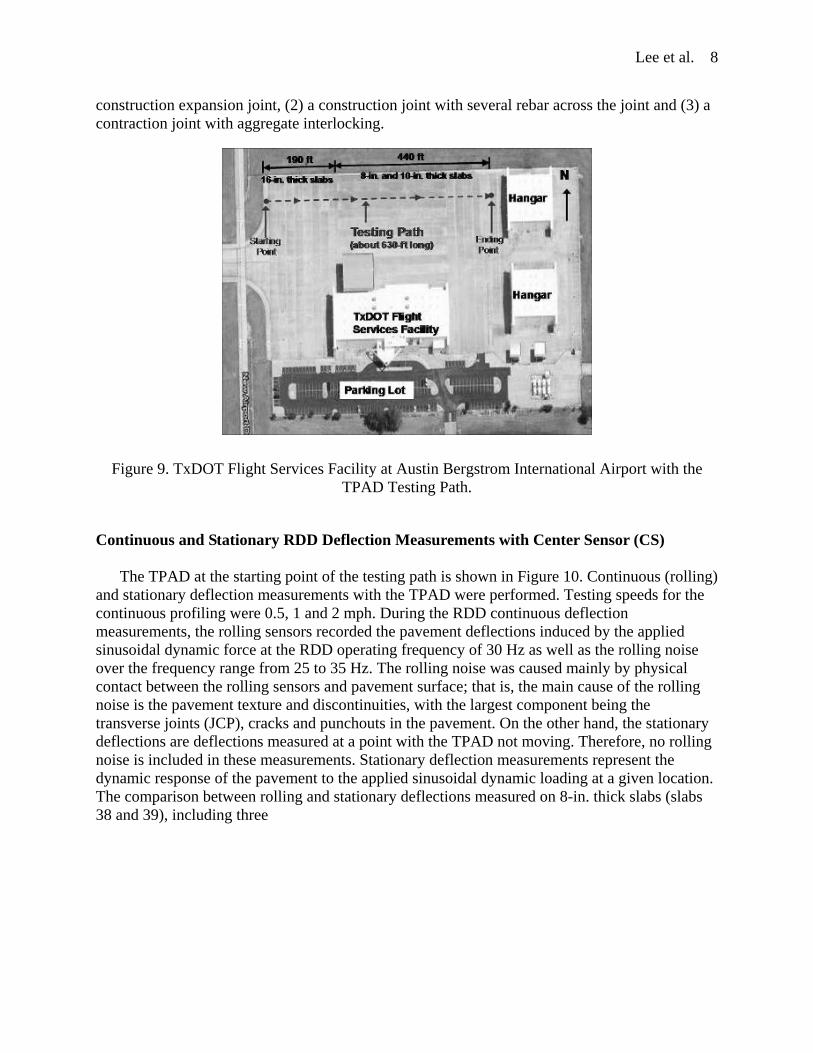
Testbed at TxDOT FSF
In the initial portion of this research, a testbed was developed at the TxDOT Flight Services Facility (FSF) at Austin Bergstrom International Airport (ABIA). The purpose of the testbed was to establish a pavement facility with known and well-documented conditions that could be used in future research projects dealing with rigid pavement testing. The pavement at the TxDOT FSF is a jointed concrete pavement (JCP). A 630-ft long testing path over which most testing has been performed is shown in Figure 9. This testing path was chosen because it traverses three different slab thicknesses and different joint types. As shown in Figure 9, the testing path consists of the following: (1) a 190-ft long section with 16-in. thick slabs and (2) a 440-ft long remaining section with 8- and 10-in. thick slabs. The plan dimensions of the 16-in. thick slabs are 25 by 25 ft while the plan dimensions of the 8- and 10-in. thick slabs are 12.5 ft by 12.5ft. According to the as-built drawings, the joints along the testing path include three types: (1) a
Lee et al. 8
construction expansion joint, (2) a construction joint with several rebar across the joint and (3) a contraction joint with aggregate interlocking.
Figure 9. TxDOT Flight Services Facility at Austin Bergstrom International Airport with the TPAD Testing Path.
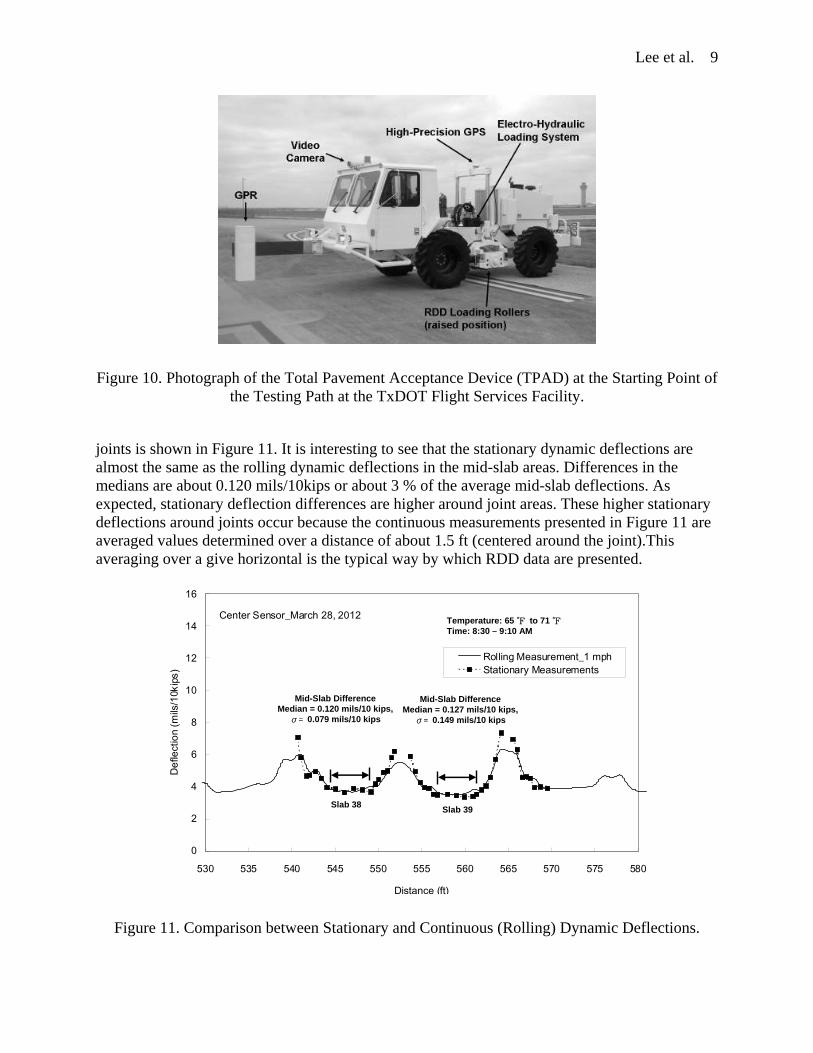
Continuous and Stationary RDD Deflection Measurements with Center Sensor (CS)
The TPAD at the starting point of the testing path is shown in Figure 10. Continuous (rolling) and stationary deflection measurements with the TPAD were performed. Testing speeds for the continuous profiling were 0.5, 1 and 2 mph. During the RDD continuous deflection measurements, the rolling sensors recorded the pavement deflections induced by the applied sinusoidal dynamic force at the RDD operating frequency of 30 Hz as well as the rolling noise over the frequency range from 25 to 35 Hz. The rolling noise was caused mainly by physical contact between the rolling sensors and pavement surface; that is, the main cause of the rolling noise is the pavement texture and discontinuities, with the largest component being the transverse joints (JCP), cracks and punchouts in the pavement. On the other hand, the stationary deflections are deflections measured at a point with the TPAD not moving. Therefore, no rolling noise is included in these measurements. Stationary deflection measurements represent the dynamic response of the pavement to the applied sinusoidal dynamic loading at a given location. The comparison between rolling and stationary deflections measured on 8-in. thick slabs (slabs 38 and 39), including three
Lee et al. 9
Figure 10. Photograph of the Total Pavement Acceptance Device (TPAD) at the Starting Point of the Testing Path at the TxDOT Flight Services Facility.
joints is shown in Figure 11. It is interesting to see that the stationary dynamic deflections are almost the same as the rolling dynamic deflections in the mid-slab areas. Differences in the medians are about 0.120 mils/10kips or about 3 % of the average mid-slab deflections. As expected, stationary deflection differences are higher around joint areas. These higher stationary deflections around joints occur because the continuous measurements presented in Figure 11 are averaged values determined over a distance of about 1.5 ft (centered around the joint).This averaging over a give horizontal is the typical way by which RDD data are presented.
Center Sensor_March 28, 2012
0
2
4
6
8
10
12
14
16
530 535 540 545 550 555 560 565 570 575 580
Distance (ft)
Def
lect
ion
(mils
/10k
ips)
Rolling Measurement_1 mphStationary Measurements
Mid-Slab Difference Median = 0.120 mils/10 kips,
σ= 0.079 mils/10 kips
Mid-Slab Difference Median = 0.127 mils/10 kips,
σ= 0.149 mils/10 kips
Slab 38 Slab 39
Temperature: 65 ℉ to 71 ℉Time: 8:30 – 9:10 AM
Figure 11. Comparison between Stationary and Continuous (Rolling) Dynamic Deflections.
Lee et al. 10
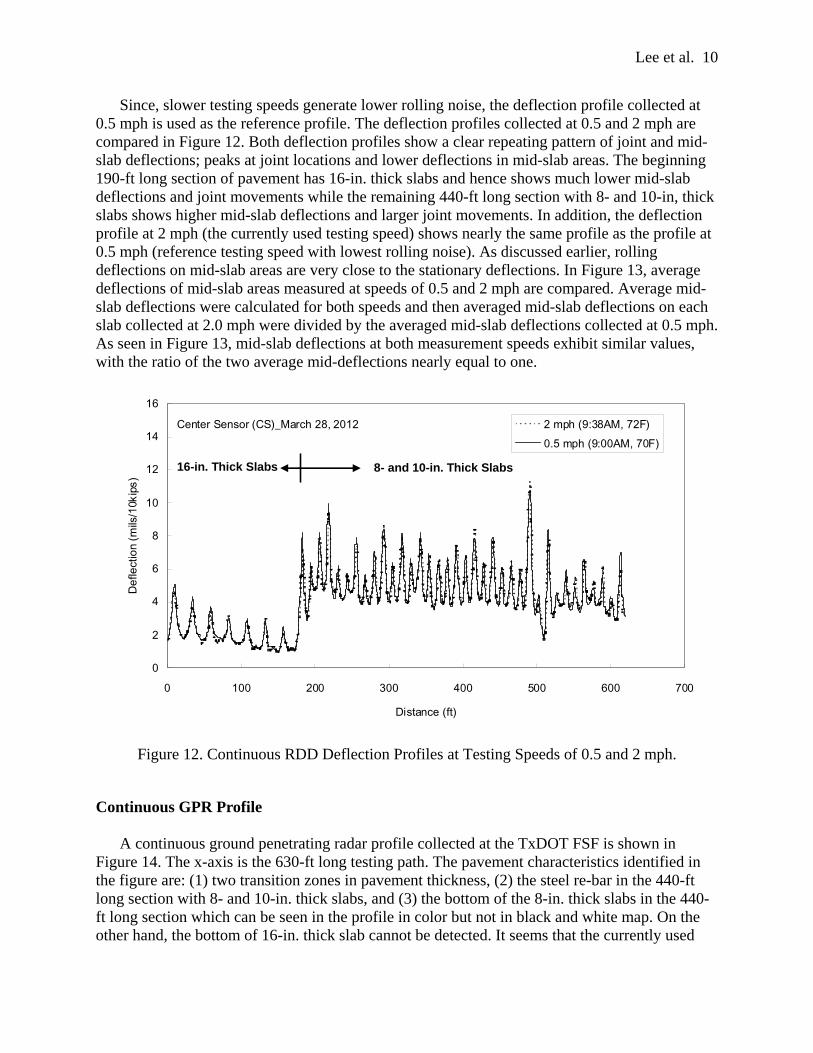
Since, slower testing speeds generate lower rolling noise, the deflection profile collected at 0.5 mph is used as the reference profile. The deflection profiles collected at 0.5 and 2 mph are compared in Figure 12. Both deflection profiles show a clear repeating pattern of joint and mid-slab deflections; peaks at joint locations and lower deflections in mid-slab areas. The beginning 190-ft long section of pavement has 16-in. thick slabs and hence shows much lower mid-slab deflections and joint movements while the remaining 440-ft long section with 8- and 10-in, thick slabs shows higher mid-slab deflections and larger joint movements. In addition, the deflection profile at 2 mph (the currently used testing speed) shows nearly the same profile as the profile at 0.5 mph (reference testing speed with lowest rolling noise). As discussed earlier, rolling deflections on mid-slab areas are very close to the stationary deflections. In Figure 13, average deflections of mid-slab areas measured at speeds of 0.5 and 2 mph are compared. Average mid-slab deflections were calculated for both speeds and then averaged mid-slab deflections on each slab collected at 2.0 mph were divided by the averaged mid-slab deflections collected at 0.5 mph. As seen in Figure 13, mid-slab deflections at both measurement speeds exhibit similar values, with the ratio of the two average mid-deflections nearly equal to one.
Center Sensor (CS)_March 28, 2012
0
2
4
6
8
10
12
14
16
0 100 200 300 400 500 600 700
Distance (ft)
Def
lect
ion
(mils
/10k
ips)
2 mph (9:38AM, 72F)0.5 mph (9:00AM, 70F)
16-in. Thick Slabs 8- and 10-in. Thick Slabs
Figure 12. Continuous RDD Deflection Profiles at Testing Speeds of 0.5 and 2 mph.
Continuous GPR Profile
A continuous ground penetrating radar profile collected at the TxDOT FSF is shown in Figure 14. The x-axis is the 630-ft long testing path. The pavement characteristics identified in the figure are: (1) two transition zones in pavement thickness, (2) the steel re-bar in the 440-ft long section with 8- and 10-in. thick slabs, and (3) the bottom of the 8-in. thick slabs in the 440-ft long section which can be seen in the profile in color but not in black and white map. On the other hand, the bottom of 16-in. thick slab cannot be detected. It seems that the currently used

Lee et al. 11
air-coupled GPR antenna pulse (Wavebound 1 GHz horn antenna) could not penetrate deep enough to detect the reflection from the bottom of 16-in. thick slab.
y = 0.0008x + 0.9927R2 = 0.0746
0.5
1
1.5
0 10 20 30 40 50Slab Number
Avg.
Mid
-Sla
b D
ef (2
.0 m
ph) /
Avg
. Mid
-Sla
b De
f (0.
5 m
ph)
Mean = 1.01σ= 0.03
Figure 13. Profile along the Pavement of the Ratio of the Mid-Slab Deflections Determined at Testing Speeds of 0.5 and 2 mph.
Figure 14. Continuous GPR Profile Collected along the Test Bed at the TxDOT Flight Services Facility (from Stokoe et al. [10]).
Lee et al. 12
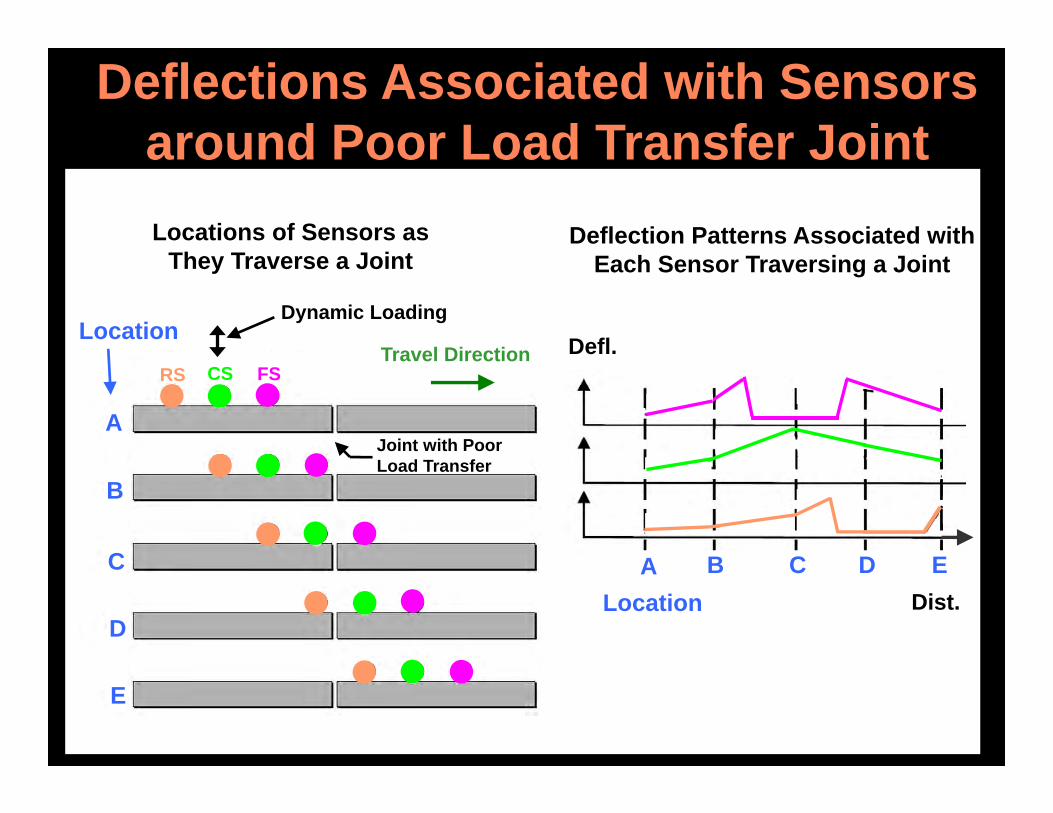
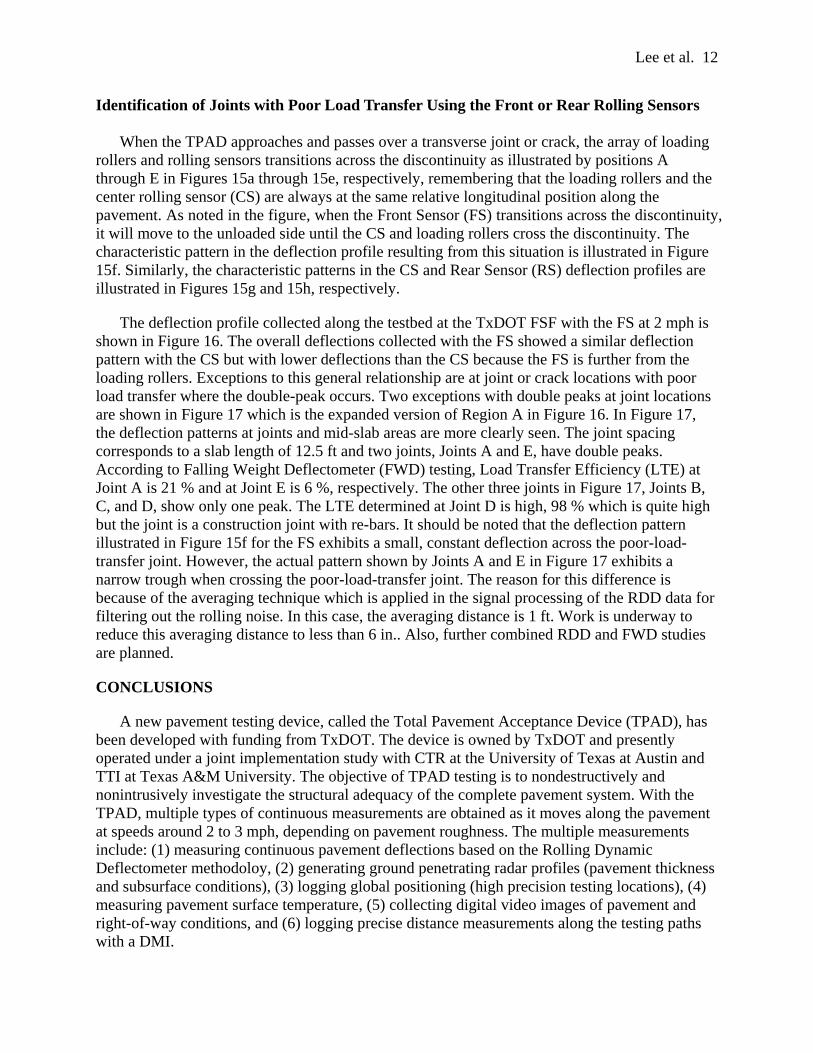
Identification of Joints with Poor Load Transfer Using the Front or Rear Rolling Sensors
When the TPAD approaches and passes over a transverse joint or crack, the array of loading rollers and rolling sensors transitions across the discontinuity as illustrated by positions A through E in Figures 15a through 15e, respectively, remembering that the loading rollers and the center rolling sensor (CS) are always at the same relative longitudinal position along the pavement. As noted in the figure, when the Front Sensor (FS) transitions across the discontinuity, it will move to the unloaded side until the CS and loading rollers cross the discontinuity. The characteristic pattern in the deflection profile resulting from this situation is illustrated in Figure 15f. Similarly, the characteristic patterns in the CS and Rear Sensor (RS) deflection profiles are illustrated in Figures 15g and 15h, respectively.
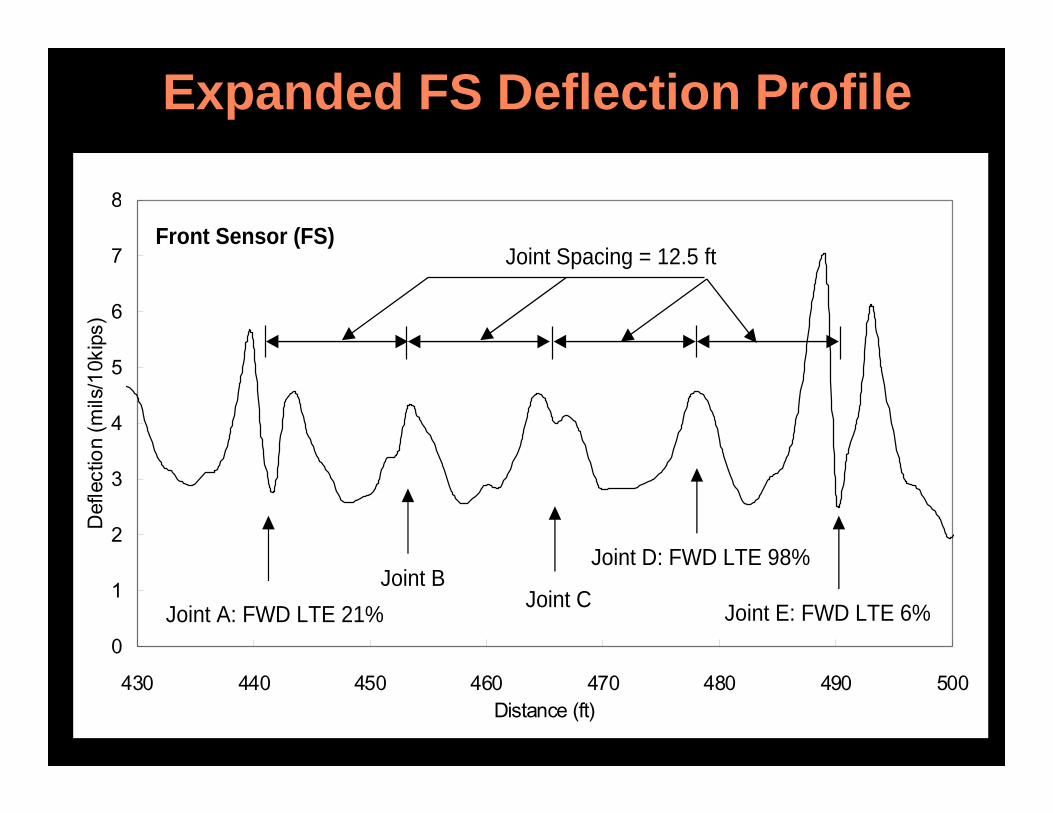
The deflection profile collected along the testbed at the TxDOT FSF with the FS at 2 mph is shown in Figure 16. The overall deflections collected with the FS showed a similar deflection pattern with the CS but with lower deflections than the CS because the FS is further from the loading rollers. Exceptions to this general relationship are at joint or crack locations with poor load transfer where the double-peak occurs. Two exceptions with double peaks at joint locations are shown in Figure 17 which is the expanded version of Region A in Figure 16. In Figure 17, the deflection patterns at joints and mid-slab areas are more clearly seen. The joint spacing corresponds to a slab length of 12.5 ft and two joints, Joints A and E, have double peaks. According to Falling Weight Deflectometer (FWD) testing, Load Transfer Efficiency (LTE) at Joint A is 21 % and at Joint E is 6 %, respectively. The other three joints in Figure 17, Joints B, C, and D, show only one peak. The LTE determined at Joint D is high, 98 % which is quite high but the joint is a construction joint with re-bars. It should be noted that the deflection pattern illustrated in Figure 15f for the FS exhibits a small, constant deflection across the poor-load-transfer joint. However, the actual pattern shown by Joints A and E in Figure 17 exhibits a narrow trough when crossing the poor-load-transfer joint. The reason for this difference is because of the averaging technique which is applied in the signal processing of the RDD data for filtering out the rolling noise. In this case, the averaging distance is 1 ft. Work is underway to reduce this averaging distance to less than 6 in.. Also, further combined RDD and FWD studies are planned.
CONCLUSIONS
A new pavement testing device, called the Total Pavement Acceptance Device (TPAD), has been developed with funding from TxDOT. The device is owned by TxDOT and presently operated under a joint implementation study with CTR at the University of Texas at Austin and TTI at Texas A&M University. The objective of TPAD testing is to nondestructively and nonintrusively investigate the structural adequacy of the complete pavement system. With the TPAD, multiple types of continuous measurements are obtained as it moves along the pavement at speeds around 2 to 3 mph, depending on pavement roughness. The multiple measurements include: (1) measuring continuous pavement deflections based on the Rolling Dynamic Deflectometer methodoloy, (2) generating ground penetrating radar profiles (pavement thickness and subsurface conditions), (3) logging global positioning (high precision testing locations), (4) measuring pavement surface temperature, (5) collecting digital video images of pavement and right-of-way conditions, and (6) logging precise distance measurements along the testing paths with a DMI.

Lee et al. 13
RS CS FS
(a)
(b)
(c)
(d)
(e)
Defl.
(f)
(g)
(h)
Sensor-Array Position
FS
CS
RS
Joint with Poor Load Transfer
Sensor-Array Position
Note: Dynamic Loading Applied to Pavement on Either side of the Center Sensor
Locations of Sensors as They Traverse a Joint
Deflection Patterns
Associated with Each Sensor Traversing a
JointDist.
Figure 15. Schematic of Deflection Patterns of Each of the Three Rolling Sensors Crossing a Joint with Poor Load Transfer (from Stokoe et al [11]).
0
1
2
3
4
5
6
7
8
0 100 200 300 400 500 600Distance (ft)
Def
lect
ion
(mils
/10k
ips)
Front Sensor (FS)
Region AShown in Fig 17
Figure 16. Deflection Profile Collected with the Front Sensor (FS) at a Testing Speed of 2 mph.
Lee et al. 14
0
1
2
3
4
5
6
7
8
430 440 450 460 470 480 490 500Distance (ft)
Def
lect
ion
(mils
/10k
ips)
Joint A: FWD LTE 21%
Front Sensor (FS)
Joint E: FWD LTE 6%
Joint Spacing = 12.5 ft
Joint D: FWD LTE 98%
Joint CJoint B
Figure 17. Expanded Deflection Profile from Figure 16a Showing Characteristic Double-Peak Patterns.
In this paper, a demonstration of TPAD testing on a testbed created at the TxDOT Flight Services Facility is presented. The RDD and GPR functions are discussed, with emphasis on the RDD measurements. The accuracy of the rolling deflection measurements were evaluated by comparing stationary and rolling dynamic deflections. Rolling deflections measured in mid-slab areas were within 3 % of the stationary values. On the other hand, rolling deflections underestimate deflections at the joint due to the longitudinal averaging performed during data processing. Work to improve (shorten the averaging distance) is underway. The use of the front sensor for identifying joints with the low load transfer is presented. The development of new device was successfully completed and the TPAD is presently transitioning from implementation projects to project-level activities.
ACKNOWLEDGEMENTS
Support from the TxDOT research program (0-6005-01) and implementation program (5-6005-01) over the past five years to develop the TPAD is gratefully acknowledged. The authors want to thank Elmo Christensen and Mike Grady at IVI for design suggestions of the TPAD platform and RDD loading rollers. Thank is also extended to Richard Hayes and Mike Lewis at the Center for Electromechanics (CEM) at the University of Texas at Austin (UT) for their suggestions in developing the speed-improved rolling sensors. Finally, the assistance of Cecil Hoffpauir and Andrew Valentine at UT for their help with equipment preparations, calibration and testing is greatly appreciated.
Lee et al. 15
REFERENCES
1. Chen, D.-H, Zhou, F., Lee, J. L., Hu, S., Stokoe, K. H., Yang, J. (2007), “Threshold Values for Reflective Cracking Based on Continuous Deflection Measurements,” Canadian Journal of Civil Engineering, Vol. 34, pp. 1257-1266.
2. Scullion, T. (2005). “Using Rolling Deflectometer and Ground Penetrating Radar Technologies for Full Coverage of Jointed Concrete Pavements,” Research Report 4517-2, Texas Transportation Institute, Texas A&M University, College Station, TX.
3. Nam, B. H., Scullion, T., Stokoe II, K. H., and Lee, J. –S (2011), “Rehabilitation Assessment of Jointed Concrete Pavement Using the Rolling Dynamic Deflectometer and Ground Penetrating Radar,” Journal of Testing and Evaluation, ASTM. Vol 39, No. 3.
4. Bay, J. A., and Stokoe, K. H. (1998), “Development of a Rolling Dynamic Deflectometer for Continuous Deflection Testing in Pavements,” Project Summary Report 1422-3F, Center for Transportation Research, The University of Texas at Austin.
5. Bay, J. A., Stokoe, II, K. H., and Jackson, J. D. (1995), “Development and Preliminary Investigation of Rolling Dynamic Deflectometer,” Transportation Research Record 1473, TRB, Washington, D. C., pp. 43-54.
6. Lee, J. L. and Stokoe, II, K. H., (2006), “Improved Testing Speed of the Rolling Dynamic Deflectometer,” Publication Report No. FHWA/TX-06/0-4357-1, FHWA/Texas Department of Transportation. Center for Transportation Research.
7. Nam, B. –H. (2010), “Improved Testing and Data Analysis Procedures for the Rolling Dynamic Deflectometer,” Ph. D. Dissertation, The University of Texas at Austin.
8. Maser, K. R., and Scullion, T. (1992), “Automated Pavement Subsurface Profiling Using Radar: Case Studies of Four Experimental Field Sites,” Transportation Research Record 1344, TRB, Washington, D. C., pp. 148-154.
9. Bandara, N., and Briggs, R. (2004), “Nondestructive Testing of Pavement Structures,” Back to Basics Series, American Society for Nondestructive Testing, July 2004 issue.
10. Stokoe, K. H., Lee, J-.S., Nam, B.H., Scullion., Liu, W.. Leidy, J., and Claros, G. (2013). “Development and Initial Testing of the Total Pavement Acceptance Device (TPAD).” Transportation Research Board 92nd Annual Meeting, TRB, Jan. 14, 2013, Washington D.C.
11. Stokoe, K. H., Lee, J-.S., Lewis, M., Hayes, R., Scullion, T., and Liu, W., (2012), “Developing a Testing Device for Total Pavements Acceptance – Final Report,”, Publication Report No. FHWA/TX-13/0-6005-3. FHWA/Texas Department of Transportation, Center for Transportation Research and Texas A&M Transportation Institute