Embed Size (px)
Citation preview
Swart, P.K., Eberli, G.P., Malone, M.J., and Sarg, J.F. (Eds.), 2000Proceedings of the Ocean Drilling Program, Scientific Results, Vol. 166
5. TURBIDITE FREQUENCY AND COMPOSITION IN THE DISTAL PART OF THE BAHAMAS TRANSECT1
Karin H. Bernet,2,4 Gregor P. Eberli,2 and Adrian Gilli3
ABSTRACT
The lower slope and toe-of-slope sediments of the western flank of the Great Bahama Bank (Sites 1003 and 1007) are char-acterized by an intercalation of turbidites and periplatform ooze. In general, turbidites form up to 12% of the total mass of thesedimentary column. Based primarily on data from the Bahamas, it has been postulated that steep-sided carbonate platformsshed most of their sediments into the basin during sea-level highstands when the platforms are flooded. This highstand shed-ding is assumed to be less pronounced along platforms with a ramp-like depositional profile where sediment production is notrestricted to sea-level highstand. Miocene to Pliocene sediments recovered in five drill holes during Leg 166 at the western mar-gin of the Great Bahama Bank reveal that turbidite distribution follows a complex pattern that is dependent on several factorssuch as sedimentation rates, sea-level changes, and slope morphology.
To identify the depositional sequences in the cores, the depths of seismic-sequence boundaries were used. The distributionof turbidites within sedimentary sequences varies strongly. Generally, turbidites are clustered at the upper and/or lower portionsof the sequences indicating deposition of carbonate turbidites during both highstand and lowstand of sea level. Analyses of theMiocene turbidites show that (1) during high sea level, 60% of all turbidites were deposited at Site 1003 (309 out of 518 turbi-dites), while during low sea level, two thirds of all turbidites were deposited at Site 1007 (332 out of 486 turbidites); (2) theaverage thickness of highstand turbidites is 1.5 times higher than the average thickness of lowstand turbidites; and (3) the tur-bidites display slight differences in composition and sorting. In general, highstand turbidites are less sorted and contain anabundant amount of shallow-water constituents such as green algae, red algae, shallow-water benthic foraminifers (miliolids),and intraclasts. The lowstand turbidites are better sorted and contain abundant planktonic foraminifers and micrite.
To complicate matters, highstand and lowstand turbidites seem to be deposited at different locations on the slope. At thelower slope (Site 1003), more turbidites were deposited during highstands, while at the toe of the slope, turbidites were domi-nantly deposited during sea-level lowstands. The result is a slope section with laterally discontinuous turbidite lenses withinperiplatform ooze, which is controlled by the interplay of sea-level changes, sediment production, and platform morphology.
1Swart, P.K., Eberli, G.P., Malone, M.J., and Sarg, J.F. (Eds.), 2000. Proc. ODP,Sci. Results, 166: College Station TX (Ocean Drilling Program).
2Rosenstiel School of Marine and Atmospheric Science, Comparative Sedimentol-ogy Laboratory, 4600 Rickenbacker Causeway, University of Miami, Miami FL 33149,USA.
3Geologisches Institut ETHZ, Sonnegstrasse 5, 8092 Zürich, Switzerland.4Present address: Rottmanssbodenstrasse 133, CH - 4102 Binningen, Switzerland.
INTRODUCTION
The origin of carbonate turbidites has been the subject of debatesince the introduction of depositional models that are guided by se-quence stratigraphy. Sequence stratigraphy has postulated that in si-liciclastic depositional systems most sediment is shed into the deepbasins during lowstands of sea level (Vail et al., 1977). Whether thisprinciple is applicable to the carbonate depositional system is at theheart of the controversy. Scientists working with carbonates havepresented evidence that carbonate depositional systems are 180° outof phase with siliciclastic systems. Carbonate platform rates of pro-duction are highest when the platform is flooded. During these times,more sediment is produced than can be accumulated on the platformtop, and this excess sediment is exported into the adjacent basins(Supko, 1963; Kier and Pilkey, 1971; Lynts et al., 1973; Hana andMoore, 1979; Hine et al., 1981; Droxler et al., 1983; Boardman andNeuman, 1984; Schlager et al., 1994). The higher sedimentation ratemay result in overloading of the slope and gravitational instability,which are major contributing factors in the generation of turbiditycurrents (Middleton and Hampton, 1976; Crevello and Schlager,1980). Therefore, it is reasonable to expect a higher frequency of tur-bidity currents during times of high slope-to-basin sedimentation,which for isolated platforms appears to correlate with relative high-stands of sea level (Mullins, 1983).
This highstand shedding of turbidites has been well documentedin the Quaternary sections surrounding the Bahamas (Droxler et al.,1983; Droxler and Schlager, 1985; Reijmer et al., 1988, Glaser andDroxler, 1991). A similar pattern of deposition has been interpretedfrom ancient slope sections surrounding isolated platforms in the Tri-assic and the Cretaceous (Reijmer et al., 1991; Harris 1994; Vecseiand Sanders, 1997). In ancient deposits, analyses of turbidite shed-ding have commonly relied on the analysis of grain composition. Inthese methods, the turbidites containing more platform interior grainswere assumed to be shed during sea-level highstand, while turbiditescontaining grains predominantly from the margin were shed in timesof low sea level (Reijmer et al., 1991).
In this study we take advantage of the geometries seen on the seis-mic sections. Seismic-sequence boundaries that indicate sea-levelfalls were determined at the platform margin of the Great BahamaBank using erosional features and onlap patterns (Eberli, Swart, Ma-lone, et al., 1997). On Leg 166, five sites were drilled on the transectof the western flank of the Great Bahama Bank. The sedimentary sec-tions drilled at these sites were correlated to a multichannel, high-resolution seismic section on which 17 third-order seismic-sequenceboundaries were traced from the platform top down to the basin(Eberli, Swart, Malone, et al., 1997). The seismic and sedimentarydata were used to define highstand and lowstand systems tracts with-in the sequences.
In this paper we show that turbidites are shed during both sea-levelhighstand and lowstand. In addition, our data indicate a shift of thedepositional location with changing sea level. For example, in theMiocene, sea-level highstands produced a high turbidite frequencyon the lower slope (Site 1003), whereas the turbidite deposits at thetoe of the slope (Site 1007) were dominantly shed during sea-levellowstand. Our analyses also document a relative small amount of tur-bidites along the entire transect, which suggests that deposition from
45
K.H. BERNET ET AL.
turbidity currents is not a dominant process in exporting sediment tothe deep-water areas.
BACKGROUND
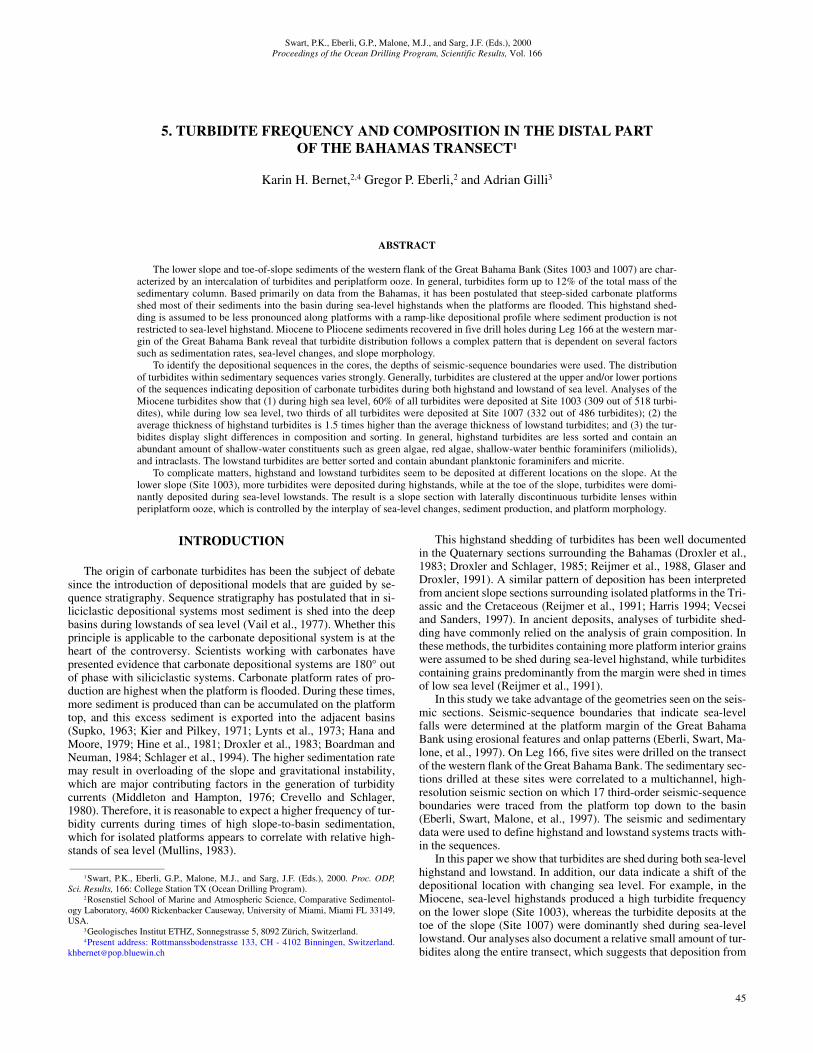
The Ocean Drilling Program (ODP) drilled seven sites along theprograding carbonate margin of the western Great Bahama Bank todocument the sedimentary record of Neogene sea-level changes(Eberli, Swart, Malone, et al., 1997). Five of these sites cover the up-per to lower slope, the toe of the slope, and the basin and represent acontinuation of the proximal Bahamas Drilling Project (BDP) sitesUnda and Clino, which were drilled on the platform top (Fig. 1). Thedepth of these sites ranges from 200 to 700 to 1300 mbsf. Four dif-ferent facies characterize the sediment along the Bahamas Transect:
1. Calcareous nannofossil ooze with changing amounts of plank-tonic foraminifers or bioclasts,
2. Monotonous peloidal wackestone to packstone,3. Redeposited carbonate sediments (mass gravity flow depos-
its), and4. Siliciclastic sediments (mainly silt and/or clay).
Along this prograding carbonate margin, alternations consistingof more neritic and more pelagic carbonate sediments form the peren-nial background sedimentation into which the redeposited beds areintercalated. The facies and the distribution of the redeposited bedschange from the slope to the basin. At the upper slope (Sites 1004 and1005), the sedimentary packages contain bioclastic packstone to
46
wackestone, pelagic intervals, some siliciclastic layers, and organicmaterial but very few redeposited beds (Eberli, Swart, Malone, et al.,1997). On the lower slope and at the toe of the slope (Sites 1003 and1007), intercalations of carbonates with mass gravity flow deposits,such as turbidites, slumps, and debris flow units, are common. Theposition of these deposits shows that most mass gravity flows by-passed the upper slope and were deposited at the break of the slope.In the basin axis (Site 1006), a thick package of current deposits con-sists of small-scale alternations of more platform-derived materialand more pelagic sediments similar to the background sedimentationon the slope but no turbidites (Eberli, Swart, Malone, et al., 1997).
METHODS
In this study, we combined seismic-sequence stratigraphic infor-mation with the analysis of the calcareous turbidites to examine therelationship between turbidite frequency and sea-level fluctuations.This methodology differs from other studies in that the separation ofsea-level highstand and lowstand is based strongly on the geometryseen on the seismic section and not on the indirect evidence such asgrain composition.
Sedimentary Sequence Analysis
Seismic-sequence boundaries were used to separate the cores intohighstand and lowstand systems tracts. The depth of the seismic-sequence boundary was calculated through the time/depth conversionfrom the vertical seismic profile shot at each site. This conversion has
0
0.5
1.0
1.5
10 km
Clino UndaSite 1006 1007
GREAT BAHAMA BANK
1003 1005
1004SW NE
qpn
mkhe i l
o
gf
p2
ef
h
g
i k lm n o
pqd
b c da
Progradation
Tw
o-w
ay tr
avel
time
(ms)
1003
N
24°
23°
25°
1007
Florida
Cuba
GreatBahama
Bank
Clino
Unda
80° 79° 78°
Figure 1. Schematic diagram of the Bahamas Transect showing the margin geometries, BDP boreholes Unda and Clino, and Leg 166 sites. Sites 1003 and 1007are located at the lower slope and the toe of the slope, respectively. This prograding carbonate margin evolved from a low-angle, ramp-like geometry to a steep-sided (Sequences d–a) platform during the early Pliocene.
TURBIDITE FREQUENCY AND COMPOSITION, BAHAMAS TRANSECT
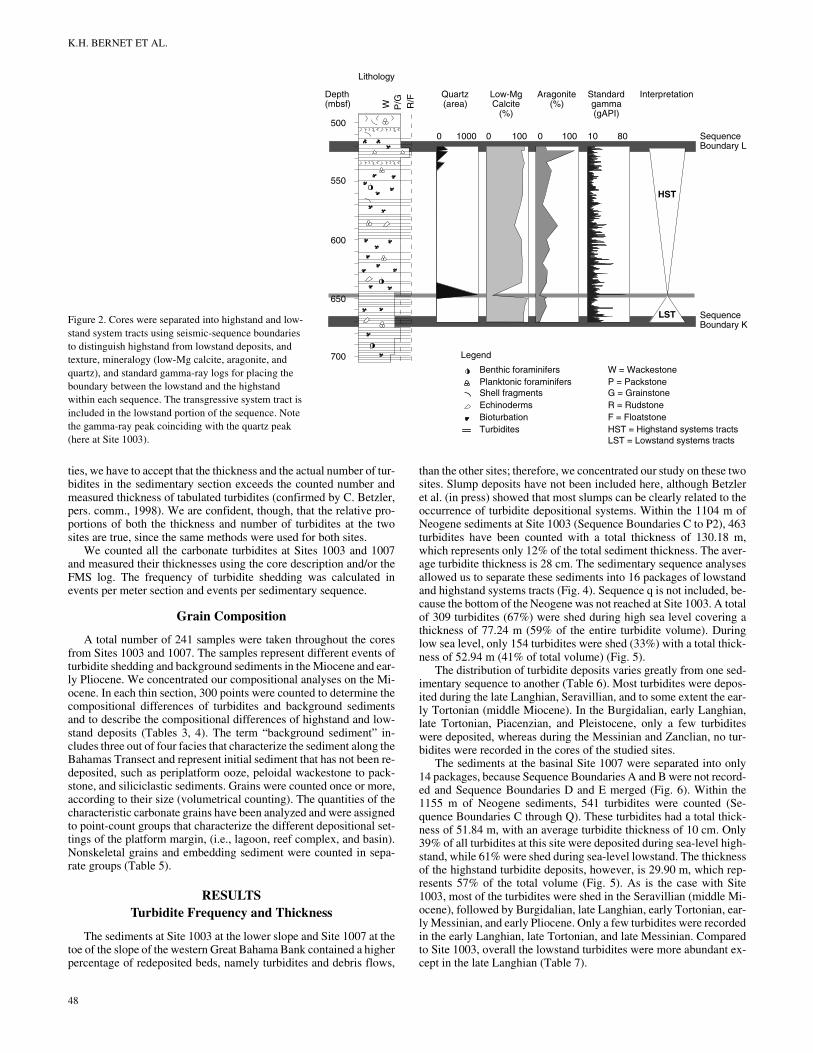
a resolution of 5–10 m maximum. The exact position of the sequenceboundary in the core is determined by sedimentologic criteria withinthe interval given by the seismic resolution (Eberli, Swart, Malone,et al., 1997). In this study, the transgressive systems tract is includedin the lowstand portion of the sequence. This can be justified by thefact that generally the platform was only flooded during highstands.To place the maximum flooding, or the turn-around from lowstand tohighstand system tracts within each sequence, we relied on changesin texture together with mineralogy (low-Mg calcite [LMC], high-Mg calcite [HMC], aragonite, and quartz) and standard gamma-raylogs. This separation was based on the following evidence:
Supko (1963) and Boardman (1978) found that aragonite with ahigh strontium content originates on the bank top (from green algae,ooids, and inorganic precipitation), whereas pteropods show a low-strontium variety and represent planktonic aragonite. Droxler et al.(1983) document that 90% of the Bahamian aragonite in fine fractionis derived from a shallow-water source. Similarly, several authors as-sume a shallow-water source for HMC in the Bahamian troughs (Kierand Pilkey, 1971; Boardman, 1978; Droxler et al., 1983). Therefore,we assume that sections with high aragonite and HMC content, whichare currently produced on the platform top, are indicative of depositsof high sea level when the platform is flooded.
In contrast, sections with increased LMC content and siliciclasticmaterial probably represent lowstand system tracts for the followingreasons: (1) Several authors showed that coccoliths and globigerin-ids, which predominantly occur in the open ocean, can account fornearly all the LMC (Kier and Pilkey, 1971; Boardman 1978; Droxleret al., 1983); (2) further, high contents of quartz, which appear when-ever aragonite contents are low (Droxler et al., 1983), are likely torepresent sea-level lowstand when the platform production is shutdown and no aragonite or HMC are produced on the bank and export-ed into the basin. We acknowledge that diagenetic alteration of themineralogic composition of the sediments may contribute to the dif-ficulty of applying the mineralogic criteria but found no inconsistentbehavior in our cores (Tables 1, 2).
A second criterion for separating lowstand from highstand sys-tems tracts is taken from the gamma-ray log. Standard gamma-raylogs record the presence of potassium, thorium, and uranium presentin potassium feldspars, micas, glauconite, and phosphate (Asquithand Gibson, 1982). Glauconite and phosphate are diagenetic mineralsthat precipitate from sea water in deeper parts of open platforms ornonrimmed margins (Scoffin, 1987). Uranium and potassium arepresent in green algae, certain corals (zoantharias and calcitic octo-corals), pelecypods, gastropods, and arthropods found on hardgroundsurfaces (Milliman et al., 1974). Hence, the natural gamma radiationincreases at hardgrounds. Kenter et al. (in press) showed that in theproximal part of the transect at Unda and Clino, each sea-level cyclehas an associated change in gamma radiation, and that the gamma-rayexcursions also represent maximum flooding surfaces. The standardgamma-ray log can be correlated to the texture and lithology of thesediment and the mineralogy. Sequence k at Site 1003 (Fig. 2), for ex-ample, documents that the texture of the carbonate sediments changes
Table 1. Mineralogical composition of samples, Site 1003.
Note: LMC = low-Mg calcite, HMC = high-Mg calcite.
This is a sample of the table that appears on the volume CD-ROM.
Depth (mbsf)
Dolomite (%)
LMC (%)
HMC (%)
Aragonite (%)
Quartz (area)
0.41 0.0 9.0 25.5 57.6 03.41 0.0 3.9 8.7 80.2 06.41 0.0 5.6 7.3 80.1 07.41 0.0 4.6 6.1 81.9 08.91 0.0 5.3 5.9 81.8 0
10.41 0.0 6.8 7.1 79.3 011.91 0.0 18.1 67.4 8.5 103912.68 0.0 8.9 41.2 45.5 013.99 0.0 20.5 4.8 69.7 10015.49 0.1 22.3 8.3 63.3 0
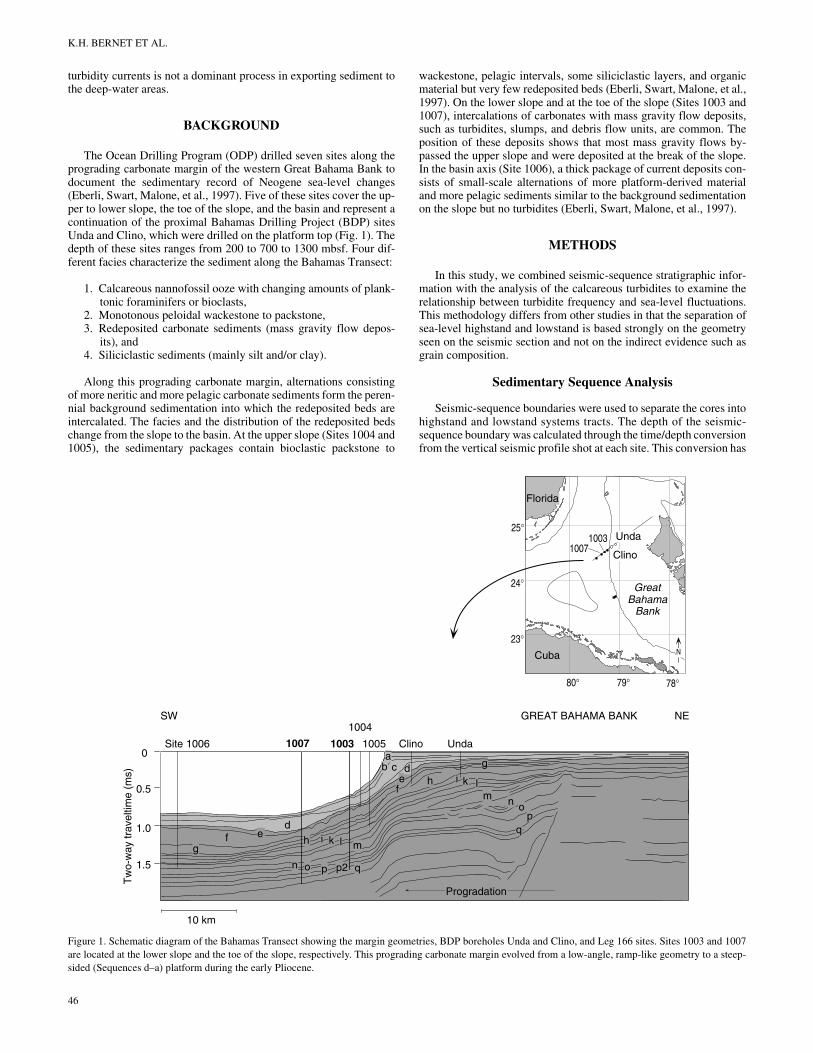
up-section from bioclastic wackestone to packstone, to peloidal pack-stone to grainstone with bioclasts, and is capped by a peloidal grain-stone to rudstone with bioclasts. At the first increase in texture, thearagonite values decrease to zero and the amount of quartz increasesdramatically. At the same depth, the standard gamma-ray log showsthe highest peak underlain by two smaller but also dominant peaks.Based on a sudden appearance of peloids following the quartz peakand the low value of aragonite (Betzler et al., in press), we assume thatthe high excursion in gamma radiation that often coincides with claylayers represents the maximum flooding surface within the sequence.In such cases, the gamma-ray peaks are used to separate lowstandfrom highstand systems tracts. The separation of sea-level highstandvs. lowstand packages based on the above criteria enables us to assessthe distribution of the turbidite composition and frequency within theindividual sequences.
Calibration of Turbidites to Log Data
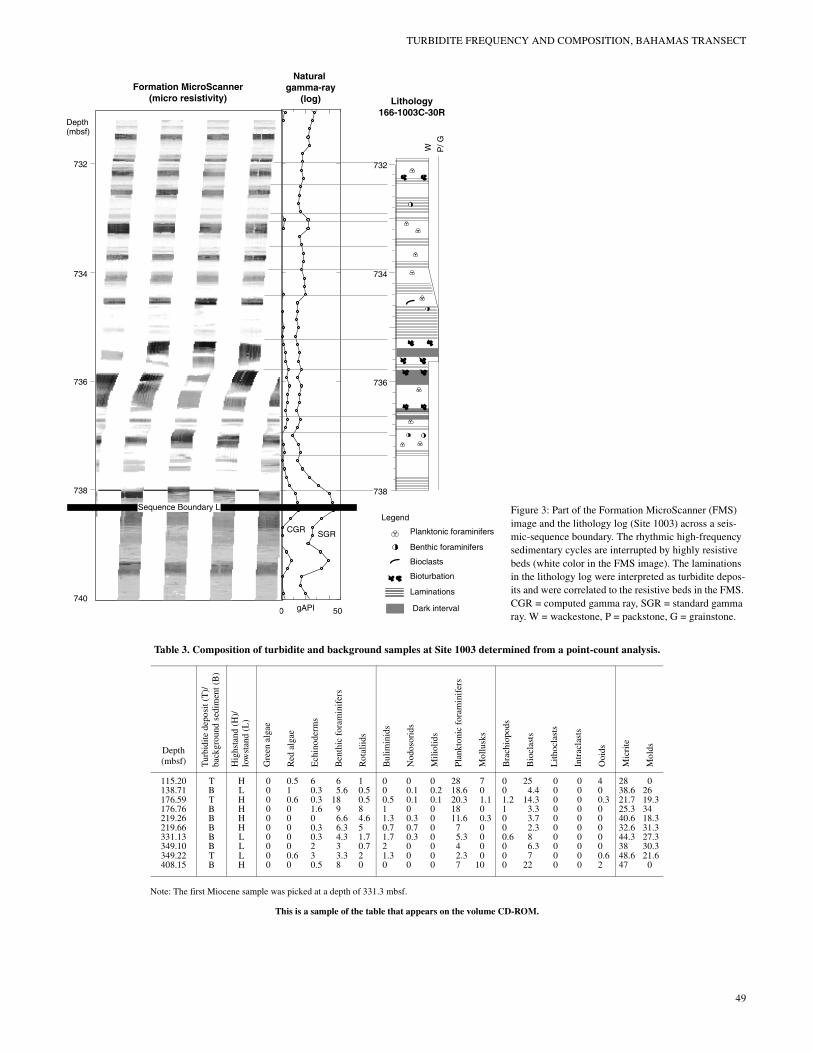
The core recovery at Sites 1003 and 1007 was 55% and 73%, re-spectively. To reveal the total amount of turbidites and their thick-ness, we calibrated the sedimentary description to the log data (Fig.3). Carbonate turbidites generally consist of coarser material than thesedimentary composition of the background sediments and, there-fore, show differences in resistivity values. The Formation Micro-Scanner (FMS) records resistivity where highly resistive intervals aredisplayed in bright colors, and layers with low resistivity values areshown in dark colors. Thus, FMS images have been powerful in dis-tinguishing turbidite deposits from background sediments (Williamsand Pirmez, in press).
In high-recovery cores, we characterized the resistivity pattern ofthe FMS log and compared it to the turbidite deposits and surround-ing sediment. Changes in texture in normally or inversely graded tur-bidite deposits were recognized as subtle color changes from brightto dark colors or from dark to bright colors. The strongest color con-trast is represented by the sudden change from fine-grained back-ground sediment to a coarse-grained turbidite layer. The resolution ofthe resistivity tool is, however, not high enough to record other sedi-mentary structures. For example, in the cores, the sediments showedparallel laminations that were rather difficult to recognize in the FMSimages. This may also be related to Mullins' (1983) and Eberli's(1991) observation that complete Bouma sequences may or may notbe present and that there appears to be a lateral segregation of top-cut-out turbidites in more proximal positions (Section 166-1003B-56X-1, 12–32 cm) and base-cut-out turbidites in more distal regions (Sec-tion 166-1007C-43R-3, 85–110 cm). In any rate, the FMS could beused to identify turbidite deposits that were not recorded in low-recovery sections. Nevertheless, we estimate that a certain number ofturbidites was not detected by the FMS logs. One of the factors of“miss-measuring” the thickness may be related to the difficulties ofrecognizing the finer grained turbidites in the FMS images, becauseit is rather difficult to separate the top of a fining-upward turbidite se-quence from the fine background sediment. Knowing these difficul-
Table 2. Mineralogical composition of samples, Site 1007.
Note: LMC = low-Mg calcite, HMC = high-Mg calcite.
This is a sample of the table that appears on the volume CD-ROM.
Depth (mbsf)
Dolomite (%)
LMC (%)
HMC (%)
Aragonite (%)
Quartz (area)
1.9 0.0 20.2 26.7 41.2 1.34.9 0.3 51.4 6.2 34.7 0.07.9 0.0 28.6 19.4 46.0 0.0
11.4 0.0 58.4 7.4 26.1 0.414.4 0.4 14.0 4.1 76.8 0.017.4 0.6 23.7 6.9 64.1 0.020.9 0.3 22.6 6.4 65.7 0.023.9 0.0 18.1 3.6 72.9 0.030.4 0.0 10.5 2.5 81.7 0.033.4 0.2 21.1 1.6 70.5 0.0
47
K.H. BERNET ET AL.
LST
0 100
Low-MgCalcite
(%)
0 100
Aragonite(%)
0 1000
Quartz(area)
700
650
600
550
500
Lithology
Depth(mbsf)
10 80
InterpretationStandardgamma(gAPI)
SequenceBoundary L
SequenceBoundary K
HST
Legend
Benthic foraminifersPlanktonic foraminifersShell fragmentsEchinodermsBioturbationTurbidites
W = WackestoneP = PackstoneG = GrainstoneR = RudstoneF = FloatstoneHST = Highstand systems tractsLST = Lowstand systems tracts
R/F
P/GW
Figure 2. Cores were separated into highstand and low-stand system tracts using seismic-sequence boundaries to distinguish highstand from lowstand deposits, and texture, mineralogy (low-Mg calcite, aragonite, and quartz), and standard gamma-ray logs for placing the boundary between the lowstand and the highstand within each sequence. The transgressive system tract is included in the lowstand portion of the sequence. Note the gamma-ray peak coinciding with the quartz peak (here at Site 1003).
ties, we have to accept that the thickness and the actual number of tur-bidites in the sedimentary section exceeds the counted number andmeasured thickness of tabulated turbidites (confirmed by C. Betzler,pers. comm., 1998). We are confident, though, that the relative pro-portions of both the thickness and number of turbidites at the twosites are true, since the same methods were used for both sites.
We counted all the carbonate turbidites at Sites 1003 and 1007and measured their thicknesses using the core description and/or theFMS log. The frequency of turbidite shedding was calculated inevents per meter section and events per sedimentary sequence.
Grain Composition
A total number of 241 samples were taken throughout the coresfrom Sites 1003 and 1007. The samples represent different events ofturbidite shedding and background sediments in the Miocene and ear-ly Pliocene. We concentrated our compositional analyses on the Mi-ocene. In each thin section, 300 points were counted to determine thecompositional differences of turbidites and background sedimentsand to describe the compositional differences of highstand and low-stand deposits (Tables 3, 4). The term “background sediment” in-cludes three out of four facies that characterize the sediment along theBahamas Transect and represent initial sediment that has not been re-deposited, such as periplatform ooze, peloidal wackestone to pack-stone, and siliciclastic sediments. Grains were counted once or more,according to their size (volumetrical counting). The quantities of thecharacteristic carbonate grains have been analyzed and were assignedto point-count groups that characterize the different depositional set-tings of the platform margin, (i.e., lagoon, reef complex, and basin).Nonskeletal grains and embedding sediment were counted in sepa-rate groups (Table 5).
RESULTSTurbidite Frequency and Thickness
The sediments at Site 1003 at the lower slope and Site 1007 at thetoe of the slope of the western Great Bahama Bank contained a higherpercentage of redeposited beds, namely turbidites and debris flows,
48
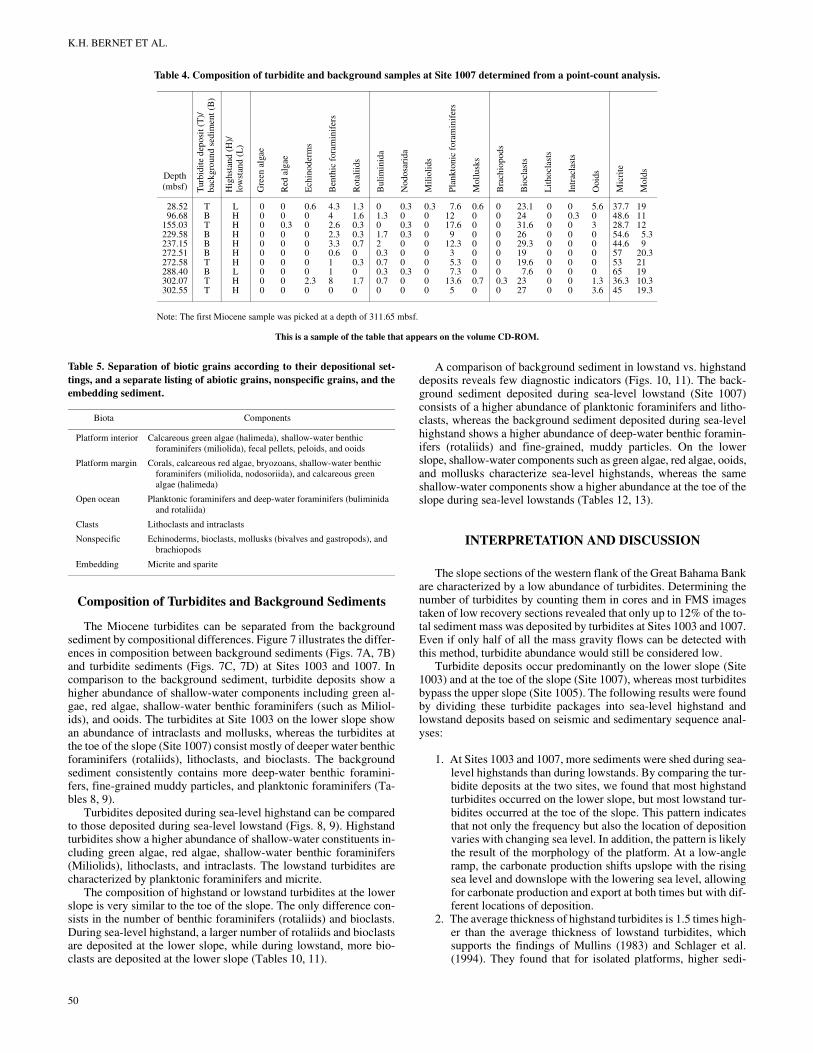
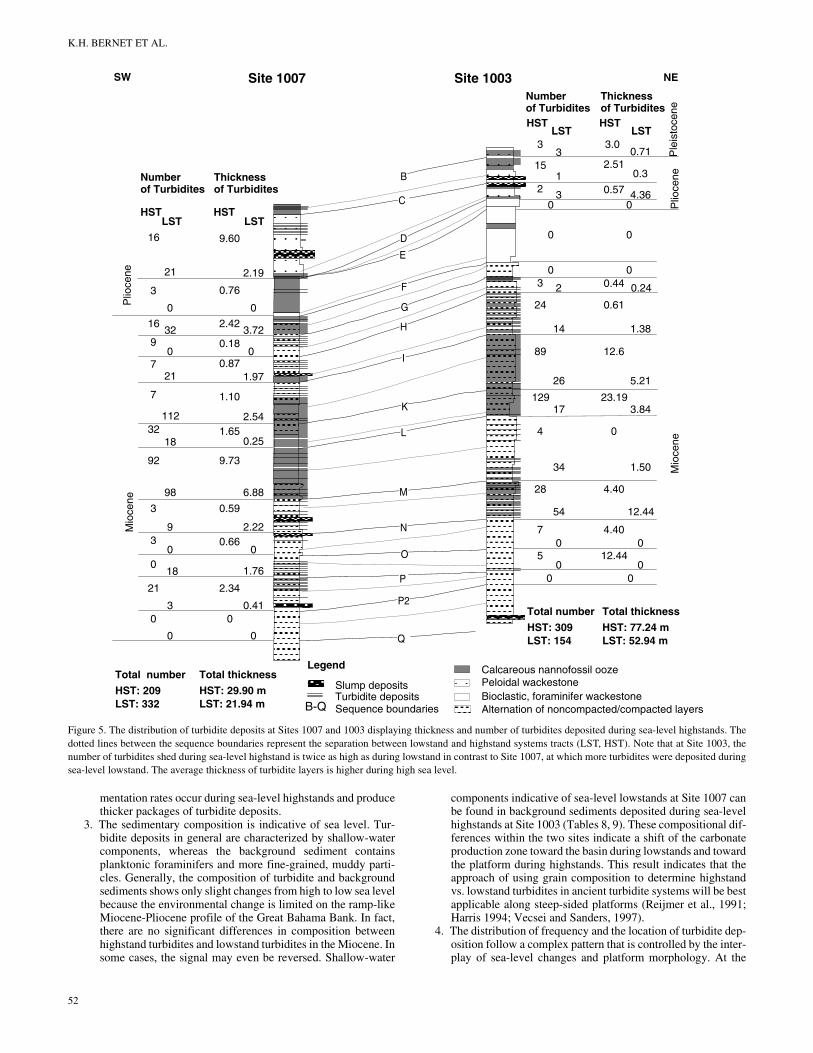
than the other sites; therefore, we concentrated our study on these twosites. Slump deposits have not been included here, although Betzleret al. (in press) showed that most slumps can be clearly related to theoccurrence of turbidite depositional systems. Within the 1104 m ofNeogene sediments at Site 1003 (Sequence Boundaries C to P2), 463turbidites have been counted with a total thickness of 130.18 m,which represents only 12% of the total sediment thickness. The aver-age turbidite thickness is 28 cm. The sedimentary sequence analysesallowed us to separate these sediments into 16 packages of lowstandand highstand systems tracts (Fig. 4). Sequence q is not included, be-cause the bottom of the Neogene was not reached at Site 1003. A totalof 309 turbidites (67%) were shed during high sea level covering athickness of 77.24 m (59% of the entire turbidite volume). Duringlow sea level, only 154 turbidites were shed (33%) with a total thick-ness of 52.94 m (41% of total volume) (Fig. 5).
The distribution of turbidite deposits varies greatly from one sed-imentary sequence to another (Table 6). Most turbidites were depos-ited during the late Langhian, Seravillian, and to some extent the ear-ly Tortonian (middle Miocene). In the Burgidalian, early Langhian,late Tortonian, Piacenzian, and Pleistocene, only a few turbiditeswere deposited, whereas during the Messinian and Zanclian, no tur-bidites were recorded in the cores of the studied sites.
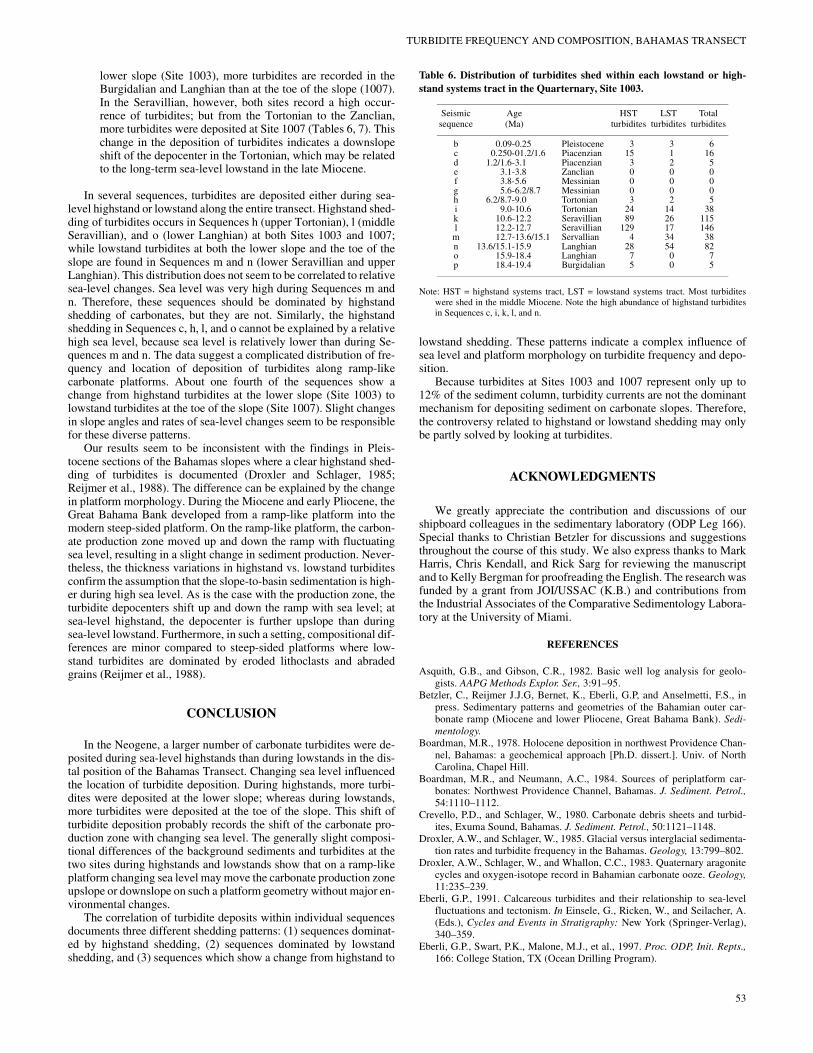
The sediments at the basinal Site 1007 were separated into only14 packages, because Sequence Boundaries A and B were not record-ed and Sequence Boundaries D and E merged (Fig. 6). Within the1155 m of Neogene sediments, 541 turbidites were counted (Se-quence Boundaries C through Q). These turbidites had a total thick-ness of 51.84 m, with an average turbidite thickness of 10 cm. Only39% of all turbidites at this site were deposited during sea-level high-stand, while 61% were shed during sea-level lowstand. The thicknessof the highstand turbidite deposits, however, is 29.90 m, which rep-resents 57% of the total volume (Fig. 5). As is the case with Site1003, most of the turbidites were shed in the Seravillian (middle Mi-ocene), followed by Burgidalian, late Langhian, early Tortonian, ear-ly Messinian, and early Pliocene. Only a few turbidites were recordedin the early Langhian, late Tortonian, and late Messinian. Comparedto Site 1003, overall the lowstand turbidites were more abundant ex-cept in the late Langhian (Table 7).
TURBIDITE FREQUENCY AND COMPOSITION, BAHAMAS TRANSECT
0 50
SGRCGR
gAPI Dark interval
Bioturbation
Bioclasts
Planktonic foraminifers
Benthic foraminifers
Laminations
Legend
Formation MicroScanner(micro resistivity)
Natural gamma-ray
(log) Lithology166-1003C-30R
W P/ G
736
732
734
738
740
738
736
734
732
Sequence Boundary L
Depth(mbsf)
Figure 3: Part of the Formation MicroScanner (FMS) image and the lithology log (Site 1003) across a seis-mic-sequence boundary. The rhythmic high-frequency sedimentary cycles are interrupted by highly resistive beds (white color in the FMS image). The laminations in the lithology log were interpreted as turbidite depos-its and were correlated to the resistive beds in the FMS. CGR = computed gamma ray, SGR = standard gamma ray. W = wackestone, P = packstone, G = grainstone.
Table 3. Composition of turbidite and background samples at Site 1003 determined from a point-count analysis.
Note: The first Miocene sample was picked at a depth of 331.3 mbsf.
This is a sample of the table that appears on the volume CD-ROM.
Depth (mbsf) T
urbi
dite
dep
osit
(T
)/ba
ckgr
ound
sed
imen
t (B
)
Hig
hsta
nd (
H)/
low
stan
d (L
)
Gre
en a
lgae
Red
alg
ae
Ech
inod
erm
s
Ben
thic
for
amin
ifer
s
Rot
aliid
s
Bul
imin
ids
Nod
osor
ids
Mil
iolid
s
Plan
kton
ic f
oram
inif
ers
Mol
lusk
s
Bra
chio
pods
Bio
clas
ts
Lit
hocl
asts
Intr
acla
sts
Ooi
ds
Mic
rite
Mol
ds
115.20 T H 0 0.5 6 6 1 0 0 0 28 7 0 25 0 0 4 28 0138.71 B L 0 1 0.3 5.6 0.5 0 0.1 0.2 18.6 0 0 4.4 0 0 0 38.6 26176.59 T H 0 0.6 0.3 18 0.5 0.5 0.1 0.1 20.3 1.1 1.2 14.3 0 0 0.3 21.7 19.3176.76 B H 0 0 1.6 9 8 1 0 0 18 0 1 3.3 0 0 0 25.3 34219.26 B H 0 0 0 6.6 4.6 1.3 0.3 0 11.6 0.3 0 3.7 0 0 0 40.6 18.3219.66 B H 0 0 0.3 6.3 5 0.7 0.7 0 7 0 0 2.3 0 0 0 32.6 31.3331.13 B L 0 0 0.3 4.3 1.7 1.7 0.3 0 5.3 0 0.6 8 0 0 0 44.3 27.3349.10 B L 0 0 2 3 0.7 2 0 0 4 0 0 6.3 0 0 0 38 30.3349.22 T L 0 0.6 3 3.3 2 1.3 0 0 2.3 0 0 7 0 0 0.6 48.6 21.6408.15 B H 0 0 0.5 8 0 0 0 0 7 10 0 22 0 0 2 47 0
49
K.H. BERNET ET AL.
Table 4. Composition of turbidite and background samples at Site 1007 determined from a point-count analysis.
Note: The first Miocene sample was picked at a depth of 311.65 mbsf.
This is a sample of the table that appears on the volume CD-ROM.
Depth (mbsf) T
urbi
dite
dep
osit
(T
)/ba
ckgr
ound
sed
imen
t (B
)
Hig
hsta
nd (
H)/
low
stan
d (L
)
Gre
en a
lgae
Red
alg
ae
Ech
inod
erm
s
Ben
thic
for
amin
ifer
s
Rot
aliid
s
Bul
imin
ida
Nod
osar
ida
Mili
olid
s
Plan
kton
ic f
oram
inif
ers
Mol
lusk
s
Bra
chio
pods
Bio
clas
ts
Lit
hocl
asts
Intr
acla
sts
Ooi
ds
Mic
rite
Mol
ds
28.52 T L 0 0 0.6 4.3 1.3 0 0.3 0.3 7.6 0.6 0 23.1 0 0 5.6 37.7 1996.68 B H 0 0 0 4 1.6 1.3 0 0 12 0 0 24 0 0.3 0 48.6 11
155.03 T H 0 0.3 0 2.6 0.3 0 0.3 0 17.6 0 0 31.6 0 0 3 28.7 12229.58 B H 0 0 0 2.3 0.3 1.7 0.3 0 9 0 0 26 0 0 0 54.6 5.3237.15 B H 0 0 0 3.3 0.7 2 0 0 12.3 0 0 29.3 0 0 0 44.6 9272.51 B H 0 0 0 0.6 0 0.3 0 0 3 0 0 19 0 0 0 57 20.3272.58 T H 0 0 0 1 0.3 0.7 0 0 5.3 0 0 19.6 0 0 0 53 21288.40 B L 0 0 0 1 0 0.3 0.3 0 7.3 0 0 7.6 0 0 0 65 19302.07 T H 0 0 2.3 8 1.7 0.7 0 0 13.6 0.7 0.3 23 0 0 1.3 36.3 10.3302.55 T H 0 0 0 0 0 0 0 0 5 0 0 27 0 0 3.6 45 19.3
Composition of Turbidites and Background Sediments
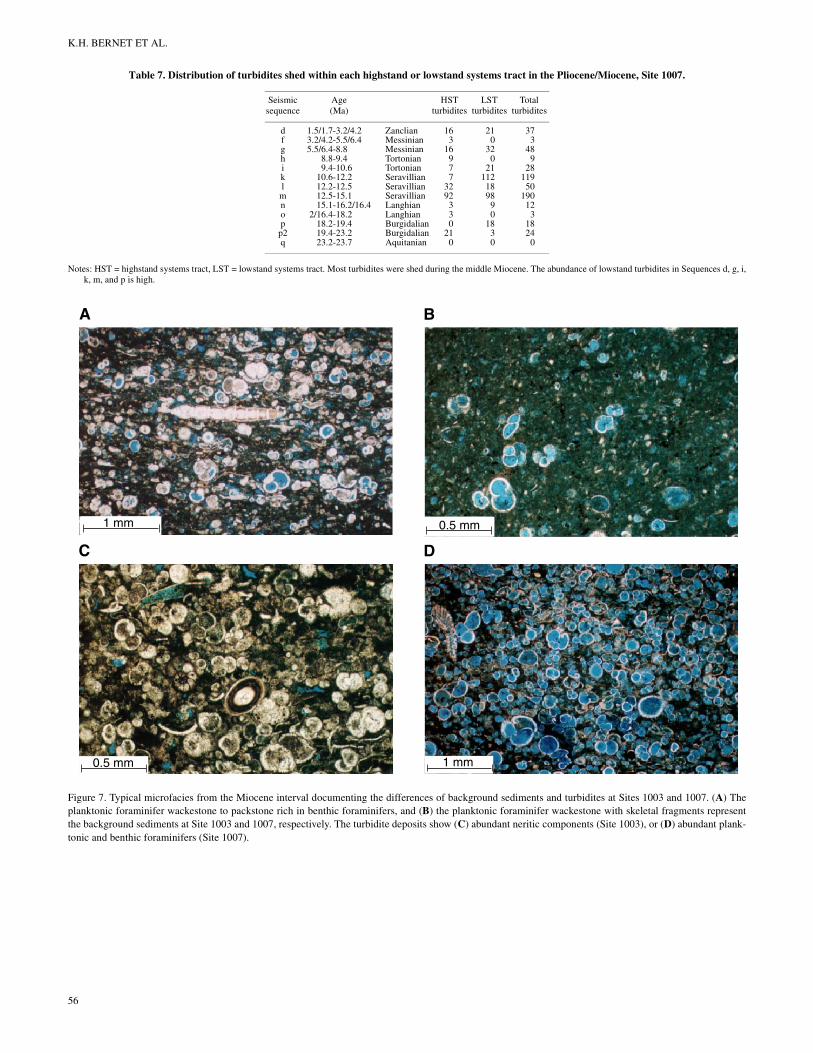
The Miocene turbidites can be separated from the backgroundsediment by compositional differences. Figure 7 illustrates the differ-ences in composition between background sediments (Figs. 7A, 7B)and turbidite sediments (Figs. 7C, 7D) at Sites 1003 and 1007. Incomparison to the background sediment, turbidite deposits show ahigher abundance of shallow-water components including green al-gae, red algae, shallow-water benthic foraminifers (such as Miliol-ids), and ooids. The turbidites at Site 1003 on the lower slope showan abundance of intraclasts and mollusks, whereas the turbidites atthe toe of the slope (Site 1007) consist mostly of deeper water benthicforaminifers (rotaliids), lithoclasts, and bioclasts. The backgroundsediment consistently contains more deep-water benthic foramini-fers, fine-grained muddy particles, and planktonic foraminifers (Ta-bles 8, 9).
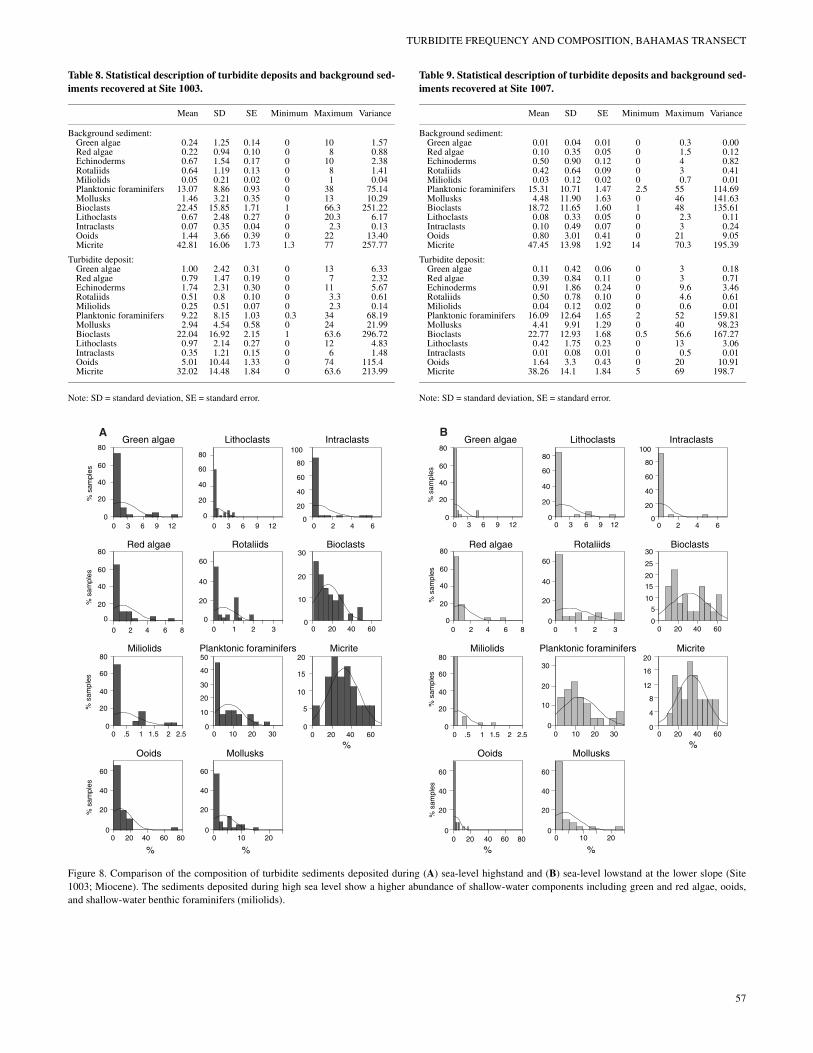
Turbidites deposited during sea-level highstand can be comparedto those deposited during sea-level lowstand (Figs. 8, 9). Highstandturbidites show a higher abundance of shallow-water constituents in-cluding green algae, red algae, shallow-water benthic foraminifers(Miliolids), lithoclasts, and intraclasts. The lowstand turbidites arecharacterized by planktonic foraminifers and micrite.
The composition of highstand or lowstand turbidites at the lowerslope is very similar to the toe of the slope. The only difference con-sists in the number of benthic foraminifers (rotaliids) and bioclasts.During sea-level highstand, a larger number of rotaliids and bioclastsare deposited at the lower slope, while during lowstand, more bio-clasts are deposited at the lower slope (Tables 10, 11).
Table 5. Separation of biotic grains according to their depositional set-tings, and a separate listing of abiotic grains, nonspecific grains, and theembedding sediment.
Biota Components
Platform interior Calcareous green algae (halimeda), shallow-water benthic foraminifers (miliolida), fecal pellets, peloids, and ooids
Platform margin Corals, calcareous red algae, bryozoans, shallow-water benthic foraminifers (miliolida, nodosoriida), and calcareous green algae (halimeda)
Open ocean Planktonic foraminifers and deep-water foraminifers (buliminida and rotaliida)
Clasts Lithoclasts and intraclasts
Nonspecific Echinoderms, bioclasts, mollusks (bivalves and gastropods), and brachiopods
Embedding Micrite and sparite
50
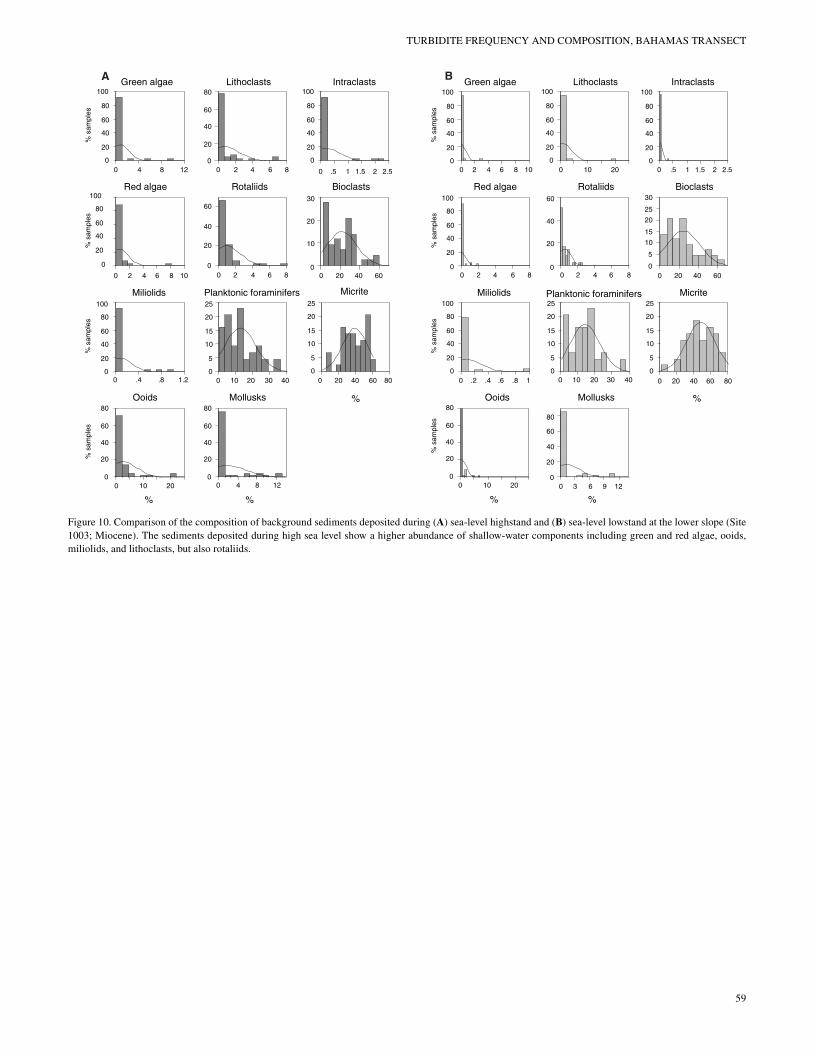
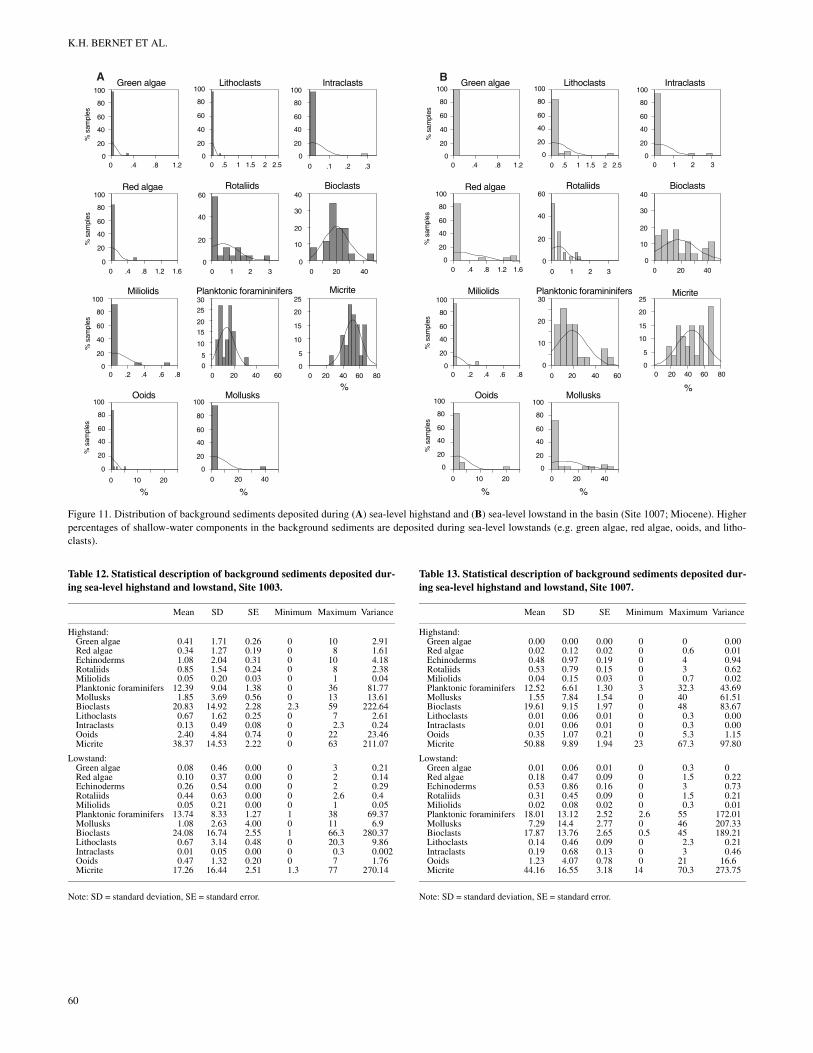
A comparison of background sediment in lowstand vs. highstanddeposits reveals few diagnostic indicators (Figs. 10, 11). The back-ground sediment deposited during sea-level lowstand (Site 1007)consists of a higher abundance of planktonic foraminifers and litho-clasts, whereas the background sediment deposited during sea-levelhighstand shows a higher abundance of deep-water benthic foramin-ifers (rotaliids) and fine-grained, muddy particles. On the lowerslope, shallow-water components such as green algae, red algae, ooids,and mollusks characterize sea-level highstands, whereas the sameshallow-water components show a higher abundance at the toe of theslope during sea-level lowstands (Tables 12, 13).
INTERPRETATION AND DISCUSSION
The slope sections of the western flank of the Great Bahama Bankare characterized by a low abundance of turbidites. Determining thenumber of turbidites by counting them in cores and in FMS imagestaken of low recovery sections revealed that only up to 12% of the to-tal sediment mass was deposited by turbidites at Sites 1003 and 1007.Even if only half of all the mass gravity flows can be detected withthis method, turbidite abundance would still be considered low.
Turbidite deposits occur predominantly on the lower slope (Site1003) and at the toe of the slope (Site 1007), whereas most turbiditesbypass the upper slope (Site 1005). The following results were foundby dividing these turbidite packages into sea-level highstand andlowstand deposits based on seismic and sedimentary sequence anal-yses:
1. At Sites 1003 and 1007, more sediments were shed during sea-level highstands than during lowstands. By comparing the tur-bidite deposits at the two sites, we found that most highstandturbidites occurred on the lower slope, but most lowstand tur-bidites occurred at the toe of the slope. This pattern indicatesthat not only the frequency but also the location of depositionvaries with changing sea level. In addition, the pattern is likelythe result of the morphology of the platform. At a low-angleramp, the carbonate production shifts upslope with the risingsea level and downslope with the lowering sea level, allowingfor carbonate production and export at both times but with dif-ferent locations of deposition.
2. The average thickness of highstand turbidites is 1.5 times high-er than the average thickness of lowstand turbidites, whichsupports the findings of Mullins (1983) and Schlager et al.(1994). They found that for isolated platforms, higher sedi-
TURBIDITE FREQUENCY AND COMPOSITION, BAHAMAS TRANSECT
D
E
H
G
F
C
B
A
350
400
300
250
200
150
100
50
0
Depth(mbsf)
850
900
800
750
700
650
600
550
500
450
1050
1100
1150
1200
1250
1300
1000
950
L
M
K
I
P2
P1
O
N
Q
Rud
st./
Flo
atst
.P
acks
t./ G
rain
st.
Wac
kest
one
Mud
ston
e
Alternation of light and dark intervals and alternationcompacted/noncompacted bioturbated intervals
TurbiditesSlumpFractures
Highstand system tractLowstand/transgressive system tractSequence boundariesA-Q
FirmgroundHardground
Ooze
LithoclastBioclasts
Planktonic foraminifersBenthic foraminifersPeloidsHalimeda
LEGEND
Sedimentary Sequences
Figure 4. Lithologic description of the lower slope sediments of the Bahamas Transect (Site 1003) separated into highstand and lowstand systems tracts depos-its. The lowstand systems tracts include the transgressive systems tracts. Seismic-sequence boundaries were used to separate the highstand systems tracts fromthe lowstand systems tracts. Within a sedimentary sequence, the number of turbidite events varies from 0 to over 100, and in general more turbidites were seenin highstand deposits.
51
K.H. BERNET ET AL.
SW NE
Numberof Turbidites
Thicknessof Turbidites
Numberof Turbidites
3
16
90
3218
92
98
3
9
32
16
21
0
721
7
112
30
0
21
30
0
HST: 209LST: 332
Total number
Thicknessof Turbidites
9.73
6.88
9.60
2.19
0.76
2.423.72
0.18
0.871.97
1.10
2.541.65
0.25
0.59
2.220.66
1.76
2.34
0.41
Total thickness
HST: 29.90 mLST: 21.94 m
3 2
24
89
26
12917
4
34
28
54
14
0.44 0.24
0.61
12.6
5.21
23.193.84
0
1.50
4.40
12.44
1.38
HST: 309LST: 154
HST: 77.24 mLST: 52.94 m
Total number Total thickness
70
4.40
12.44
2 3
151
33
N
K
E
M
H
I
L
O
P2
D
F
P
Q
C
G
B
0
0
0
3.00.71
2.510.3
0.57 4.36
50
0
0
0
Alternation of noncompacted/compacted layers
Peloidal wackestoneBioclastic, foraminifer wackestone
Calcareous nannofossil ooze
Turbidite depositsSlump deposits
Sequence boundariesB-Q
Legend
0
0
0
0
0
0
0
0
HSTLST
HSTLST
HSTLST
HSTLST
Plio
cene
Plio
cene
Mio
cene
Ple
isto
cene
18
0
Mio
cene
Site 1007 Site 1003
Figure 5. The distribution of turbidite deposits at Sites 1007 and 1003 displaying thickness and number of turbidites deposited during sea-level highstands. Thedotted lines between the sequence boundaries represent the separation between lowstand and highstand systems tracts (LST, HST). Note that at Site 1003, thenumber of turbidites shed during sea-level highstand is twice as high as during lowstand in contrast to Site 1007, at which more turbidites were deposited duringsea-level lowstand. The average thickness of turbidite layers is higher during high sea level.
mentation rates occur during sea-level highstands and producethicker packages of turbidite deposits.
3. The sedimentary composition is indicative of sea level. Tur-bidite deposits in general are characterized by shallow-watercomponents, whereas the background sediment containsplanktonic foraminifers and more fine-grained, muddy parti-cles. Generally, the composition of turbidite and backgroundsediments shows only slight changes from high to low sea levelbecause the environmental change is limited on the ramp-likeMiocene-Pliocene profile of the Great Bahama Bank. In fact,there are no significant differences in composition betweenhighstand turbidites and lowstand turbidites in the Miocene. Insome cases, the signal may even be reversed. Shallow-water
52
components indicative of sea-level lowstands at Site 1007 canbe found in background sediments deposited during sea-levelhighstands at Site 1003 (Tables 8, 9). These compositional dif-ferences within the two sites indicate a shift of the carbonateproduction zone toward the basin during lowstands and towardthe platform during highstands. This result indicates that theapproach of using grain composition to determine highstandvs. lowstand turbidites in ancient turbidite systems will be bestapplicable along steep-sided platforms (Reijmer et al., 1991;Harris 1994; Vecsei and Sanders, 1997).
4. The distribution of frequency and the location of turbidite dep-osition follow a complex pattern that is controlled by the inter-play of sea-level changes and platform morphology. At the
TURBIDITE FREQUENCY AND COMPOSITION, BAHAMAS TRANSECT
lower slope (Site 1003), more turbidites are recorded in theBurgidalian and Langhian than at the toe of the slope (1007).In the Seravillian, however, both sites record a high occur-rence of turbidites; but from the Tortonian to the Zanclian,more turbidites were deposited at Site 1007 (Tables 6, 7). Thischange in the deposition of turbidites indicates a downslopeshift of the depocenter in the Tortonian, which may be relatedto the long-term sea-level lowstand in the late Miocene.
In several sequences, turbidites are deposited either during sea-level highstand or lowstand along the entire transect. Highstand shed-ding of turbidites occurs in Sequences h (upper Tortonian), l (middleSeravillian), and o (lower Langhian) at both Sites 1003 and 1007;while lowstand turbidites at both the lower slope and the toe of theslope are found in Sequences m and n (lower Seravillian and upperLanghian). This distribution does not seem to be correlated to relativesea-level changes. Sea level was very high during Sequences m andn. Therefore, these sequences should be dominated by highstandshedding of carbonates, but they are not. Similarly, the highstandshedding in Sequences c, h, l, and o cannot be explained by a relativehigh sea level, because sea level is relatively lower than during Se-quences m and n. The data suggest a complicated distribution of fre-quency and location of deposition of turbidites along ramp-likecarbonate platforms. About one fourth of the sequences show achange from highstand turbidites at the lower slope (Site 1003) tolowstand turbidites at the toe of the slope (Site 1007). Slight changesin slope angles and rates of sea-level changes seem to be responsiblefor these diverse patterns.
Our results seem to be inconsistent with the findings in Pleis-tocene sections of the Bahamas slopes where a clear highstand shed-ding of turbidites is documented (Droxler and Schlager, 1985;Reijmer et al., 1988). The difference can be explained by the changein platform morphology. During the Miocene and early Pliocene, theGreat Bahama Bank developed from a ramp-like platform into themodern steep-sided platform. On the ramp-like platform, the carbon-ate production zone moved up and down the ramp with fluctuatingsea level, resulting in a slight change in sediment production. Never-theless, the thickness variations in highstand vs. lowstand turbiditesconfirm the assumption that the slope-to-basin sedimentation is high-er during high sea level. As is the case with the production zone, theturbidite depocenters shift up and down the ramp with sea level; atsea-level highstand, the depocenter is further upslope than duringsea-level lowstand. Furthermore, in such a setting, compositional dif-ferences are minor compared to steep-sided platforms where low-stand turbidites are dominated by eroded lithoclasts and abradedgrains (Reijmer et al., 1988).
CONCLUSION
In the Neogene, a larger number of carbonate turbidites were de-posited during sea-level highstands than during lowstands in the dis-tal position of the Bahamas Transect. Changing sea level influencedthe location of turbidite deposition. During highstands, more turbi-dites were deposited at the lower slope; whereas during lowstands,more turbidites were deposited at the toe of the slope. This shift ofturbidite deposition probably records the shift of the carbonate pro-duction zone with changing sea level. The generally slight composi-tional differences of the background sediments and turbidites at thetwo sites during highstands and lowstands show that on a ramp-likeplatform changing sea level may move the carbonate production zoneupslope or downslope on such a platform geometry without major en-vironmental changes.
The correlation of turbidite deposits within individual sequencesdocuments three different shedding patterns: (1) sequences dominat-ed by highstand shedding, (2) sequences dominated by lowstandshedding, and (3) sequences which show a change from highstand to
lowstand shedding. These patterns indicate a complex influence ofsea level and platform morphology on turbidite frequency and depo-sition.
Because turbidites at Sites 1003 and 1007 represent only up to12% of the sediment column, turbidity currents are not the dominantmechanism for depositing sediment on carbonate slopes. Therefore,the controversy related to highstand or lowstand shedding may onlybe partly solved by looking at turbidites.
ACKNOWLEDGMENTS
We greatly appreciate the contribution and discussions of ourshipboard colleagues in the sedimentary laboratory (ODP Leg 166).Special thanks to Christian Betzler for discussions and suggestionsthroughout the course of this study. We also express thanks to MarkHarris, Chris Kendall, and Rick Sarg for reviewing the manuscriptand to Kelly Bergman for proofreading the English. The research wasfunded by a grant from JOI/USSAC (K.B.) and contributions fromthe Industrial Associates of the Comparative Sedimentology Labora-tory at the University of Miami.
REFERENCES
Asquith, G.B., and Gibson, C.R., 1982. Basic well log analysis for geolo-gists. AAPG Methods Explor. Ser., 3:91–95.
Betzler, C., Reijmer J.J.G, Bernet, K., Eberli, G.P, and Anselmetti, F.S., inpress. Sedimentary patterns and geometries of the Bahamian outer car-bonate ramp (Miocene and lower Pliocene, Great Bahama Bank). Sedi-mentology.
Boardman, M.R., 1978. Holocene deposition in northwest Providence Chan-nel, Bahamas: a geochemical approach [Ph.D. dissert.]. Univ. of NorthCarolina, Chapel Hill.
Boardman, M.R., and Neumann, A.C., 1984. Sources of periplatform car-bonates: Northwest Providence Channel, Bahamas. J. Sediment. Petrol.,54:1110–1112.
Crevello, P.D., and Schlager, W., 1980. Carbonate debris sheets and turbid-ites, Exuma Sound, Bahamas. J. Sediment. Petrol., 50:1121–1148.
Droxler, A.W., and Schlager, W., 1985. Glacial versus interglacial sedimenta-tion rates and turbidite frequency in the Bahamas. Geology, 13:799–802.
Droxler, A.W., Schlager, W., and Whallon, C.C., 1983. Quaternary aragonitecycles and oxygen-isotope record in Bahamian carbonate ooze. Geology,11:235–239.
Eberli, G.P., 1991. Calcareous turbidites and their relationship to sea-levelfluctuations and tectonism. In Einsele, G., Ricken, W., and Seilacher, A.(Eds.), Cycles and Events in Stratigraphy: New York (Springer-Verlag),340–359.
Eberli, G.P., Swart, P.K., Malone, M.J., et al., 1997. Proc. ODP, Init. Repts.,166: College Station, TX (Ocean Drilling Program).
Table 6. Distribution of turbidites shed within each lowstand or high-stand systems tract in the Quarternary, Site 1003.
Note: HST = highstand systems tract, LST = lowstand systems tract. Most turbiditeswere shed in the middle Miocene. Note the high abundance of highstand turbiditesin Sequences c, i, k, l, and n.
Seismic sequence
Age (Ma)
HST turbidites
LST turbidites
Total turbidites
b 0.09-0.25 Pleistocene 3 3 6c 0.250-01.2/1.6 Piacenzian 15 1 16d 1.2/1.6-3.1 Piacenzian 3 2 5e 3.1-3.8 Zanclian 0 0 0f 3.8-5.6 Messinian 0 0 0g 5.6-6.2/8.7 Messinian 0 0 0h 6.2/8.7-9.0 Tortonian 3 2 5i 9.0-10.6 Tortonian 24 14 38k 10.6-12.2 Seravillian 89 26 115l 12.2-12.7 Seravillian 129 17 146
m 12.7-13.6/15.1 Servallian 4 34 38n 13.6/15.1-15.9 Langhian 28 54 82o 15.9-18.4 Langhian 7 0 7p 18.4-19.4 Burgidalian 5 0 5
53
K.H. BERNET ET AL.
Glaser, K.S., and Droxler, A.W., 1991. High production and highstand shed-ding from deeply submerged carbonate banks, northern Nicaragua Rise.J. Sediment. Petrol., 61:128–142.
Hana, J.C., and Moore, C.H., 1979. Quaternary temporal framework of reefto basin sedimentation, Grand Cayman, B.W.I. Geol. Soc. Am. Abstr.Progr., 11:438.
Harris, M.T., 1994. The foreslope and toe-of-slope facies of the middle Trias-sic Latemar buildup (Dolomites, Northern Italy). J. Sediment. Res.,B64:132–145.
Hine, A.C., Wilber, R.J., Bane, J.M., Neumann, A.C., and Lorenson, K.R.,1981. Offbank transport of carbonate sands along open, leeward bankmargins: northern Bahamas. Mar. Geol., 42:327–348.
Kenter, J.A.M., Ginsburg, R.N., and Troelstra, S.R., in press. The westernGreat Bahama Bank: sea level-driven sedimentation patterns on the slopeand margin. In Ginsburg, R.N. (Eds.), SEPM Contrib. Sedimentol.
Kier, J.S., and Pilkey, O.H., 1971. The influence of sea level changes on sed-iment carbonate mineralogy, Tongue of the Ocean, Bahamas. Mar. Geol.,11:189–200.
Lynts, G.W., Judd, J.B., and Stehman, C.F., 1973. Late Pleistocene history ofTongue of the Ocean, Bahama. Geol. Soc. Am. Bull., 84:2605–2684.
Middleton, M.F., and Hampton, 1976. Subaqueous sedimentary transport anddeposition by sediment gravity flows. In Stanley, D.J., and Swift, D.J.P(Eds.), Marine Sediment Transport and Environmental Management:New York (Wiley), 197–218.
Milliman, J.D., Mueller, G., and Foerstner, U., 1974. Marine Carbonates:New York (Springer-Verlag).
Mullins, H.T., 1983. Modern carbonate slopes and basins of the Bahamas. InCook, H.E. (Ed.), Platform Margin and Deep-Water Carbonates. Soc.Econ. Paleontol. Mineral., Short Course Notes, 12.
Reijmer, J.J.G., Schlager, W., and Droxler, A.W., 1988. ODP Site 632:Pliocene-Pleistocene sedimentation cycles in a Bahamian basin. In Aus-
54
tin, J.A., Jr., Schlager, W., et al., Proc. ODP, Sci. Results, 101: CollegeStation, TX (Ocean Drilling Program), 213–220.
Reijmer, J.J.G., Ten Kate, W.G.H., Sprenger, A., and Schlager, W., 1991.Calciturbidite composition related to exposure and flooding of a carbon-ate platform (Triassic, Eastern Alps). Sedimentology, 38:1059–1074.
Schlager, W., Reijmer, J., and Droxler, A.W., 1994. Highstand shedding ofcarbonate platforms, J. Sediment. Res., B64:270–281.
Scoffin, T.P., 1987. Introduction to Carbonate Sediments and Rocks: NewYork (Chapman and Hall).
Supko, P.R., 1963. A quantitative X-ray diffraction method for the mineral-ogical analysis of carbonate sediments from Tongue of the Ocean [M.S.thesis]. Univ. of Miami, Coral Gables, FL.
Vail, P.R., Mitchum, R.M., Jr., and Thompson, S., III, 1977. Seismic stratig-raphy and global changes of sea level, Part 2. The depositional sequenceas a basic unit for stratigraphic analysis. In Payton, C.E. (Ed.), SeismicStratigraphy: Applications to Hydrocarbon Exploration. AAPG Mem.,26:53–62.
Vecsei, A., and Sanders, D.G.K, 1997. Sea-level highstand and lowstandshedding related to shelf margin aggradation and emersion, UpperEocene-Oligocene of Maiella carbonate platform, Italy. Sediment. Geol.,112:219–234.
Williams, T., and Pirmez, C., in press. FMS images from carbonates of theBahama Bank Slope, ODP Leg 166: lithological identification and cyclo-stratigraphy. In Lovell, M., Williamson, G., and Harvey, P. (Eds.) Bore-hole Images: Case Histories. Geol. Soc. Spec. Publ. London.
Date of initial receipt: 10 August 1998Date of acceptance: 12 February 1999Ms 166SR-112
TURBIDITE FREQUENCY AND COMPOSITION, BAHAMAS TRANSECT
H
I
K
L
N
M
D, E
F
G
H
C
O
P
P2
Q
N
Gra
inst
./Rud
st.
Pac
kst./
Flo
atst
.W
acke
ston
e
Mud
st./O
oze/
Cha
lk/L
imes
tone
Depth(mbsf)
0
50
100
150
200
250
300
350
400
Sedimentary Sequences
450
500
550
600
650
700
750
800
850
900
900
950
1000
1050
1100
1150
1200
CH
CH
CH
Coral
CH
Echinoderm
Highstand system tractLowstand/transgressive system tract Sequence boundariesC-Q
FirmgroundHardground
OozeLithoclastBioclasts
Planktonic foraminifersBenthic foraminifersPeloidsHalimeda
LEGEND
SlumpsFractures
Turbidites
Alternation of light and dark intervals,and alternating compacted/ non-compacted bioturbated intervals
Clay layerChert
Figure 6. Lithologic description of the basinal sediments of the Bahamas Transect (Site 1007) separated into highstand and lowstand systems tracts deposits.The transgressive systems tracts are included in the lowstand systems tracts. Seismic-sequence boundaries were used to separate the highstand systems tractsfrom the lowstand systems tracts. Within a sedimentary sequence, the number of turbidite events varies from 0 to 60. At Site 1007, more turbidites occur withinthe lowstand deposits.
55
K.H. BERNET ET AL.
1 mm
A
1 mm
B
0.5 mm
DC
1 mm
0.5 mm
0.5 mm
Figure 7. Typical microfacies from the Miocene interval documenting the differences of background sediments and turbidites at Sites 1003 and 1007. (A) Theplanktonic foraminifer wackestone to packstone rich in benthic foraminifers, and (B) the planktonic foraminifer wackestone with skeletal fragments representthe background sediments at Site 1003 and 1007, respectively. The turbidite deposits show (C) abundant neritic components (Site 1003), or (D) abundant plank-tonic and benthic foraminifers (Site 1007).
Table 7. Distribution of turbidites shed within each highstand or lowstand systems tract in the Pliocene/Miocene, Site 1007.
Notes: HST = highstand systems tract, LST = lowstand systems tract. Most turbidites were shed during the middle Miocene. The abundance of lowstand turbidites in Sequences d, g, i,k, m, and p is high.
Seismic sequence
Age (Ma)
HST turbidites
LST turbidites
Total turbidites
d 1.5/1.7-3.2/4.2 Zanclian 16 21 37f 3.2/4.2-5.5/6.4 Messinian 3 0 3g 5.5/6.4-8.8 Messinian 16 32 48h 8.8-9.4 Tortonian 9 0 9i 9.4-10.6 Tortonian 7 21 28k 10.6-12.2 Seravillian 7 112 119l 12.2-12.5 Seravillian 32 18 50
m 12.5-15.1 Seravillian 92 98 190n 15.1-16.2/16.4 Langhian 3 9 12o 2/16.4-18.2 Langhian 3 0 3p 18.2-19.4 Burgidalian 0 18 18
p2 19.4-23.2 Burgidalian 21 3 24q 23.2-23.7 Aquitanian 0 0 0
56
TURBIDITE FREQUENCY AND COMPOSITION, BAHAMAS TRANSECT
Table 8. Statistical description of turbidite deposits and background sed-iments recovered at Site 1003.
Note: SD = standard deviation, SE = standard error.
Mean SD SE Minimum Maximum Variance
Background sediment:Green algae 0.24 1.25 0.14 0 10 1.57Red algae 0.22 0.94 0.10 0 8 0.88Echinoderms 0.67 1.54 0.17 0 10 2.38Rotaliids 0.64 1.19 0.13 0 8 1.41Miliolids 0.05 0.21 0.02 0 1 0.04Planktonic foraminifers 13.07 8.86 0.93 0 38 75.14Mollusks 1.46 3.21 0.35 0 13 10.29Bioclasts 22.45 15.85 1.71 1 66.3 251.22Lithoclasts 0.67 2.48 0.27 0 20.3 6.17Intraclasts 0.07 0.35 0.04 0 2.3 0.13Ooids 1.44 3.66 0.39 0 22 13.40Micrite 42.81 16.06 1.73 1.3 77 257.77
Turbidite deposit:Green algae 1.00 2.42 0.31 0 13 6.33Red algae 0.79 1.47 0.19 0 7 2.32Echinoderms 1.74 2.31 0.30 0 11 5.67Rotaliids 0.51 0.8 0.10 0 3.3 0.61Miliolids 0.25 0.51 0.07 0 2.3 0.14Planktonic foraminifers 9.22 8.15 1.03 0.3 34 68.19Mollusks 2.94 4.54 0.58 0 24 21.99Bioclasts 22.04 16.92 2.15 1 63.6 296.72Lithoclasts 0.97 2.14 0.27 0 12 4.83Intraclasts 0.35 1.21 0.15 0 6 1.48Ooids 5.01 10.44 1.33 0 74 115.4Micrite 32.02 14.48 1.84 0 63.6 213.99
and shallow-water benthic foraminifers (miliolids).
Table 9. Statistical description of turbidite deposits and background sed-iments recovered at Site 1007.
Note: SD = standard deviation, SE = standard error.
Mean SD SE Minimum Maximum Variance
Background sediment:Green algae 0.01 0.04 0.01 0 0.3 0.00Red algae 0.10 0.35 0.05 0 1.5 0.12Echinoderms 0.50 0.90 0.12 0 4 0.82Rotaliids 0.42 0.64 0.09 0 3 0.41Miliolids 0.03 0.12 0.02 0 0.7 0.01Planktonic foraminifers 15.31 10.71 1.47 2.5 55 114.69Mollusks 4.48 11.90 1.63 0 46 141.63Bioclasts 18.72 11.65 1.60 1 48 135.61Lithoclasts 0.08 0.33 0.05 0 2.3 0.11Intraclasts 0.10 0.49 0.07 0 3 0.24Ooids 0.80 3.01 0.41 0 21 9.05Micrite 47.45 13.98 1.92 14 70.3 195.39
Turbidite deposit:Green algae 0.11 0.42 0.06 0 3 0.18Red algae 0.39 0.84 0.11 0 3 0.71Echinoderms 0.91 1.86 0.24 0 9.6 3.46Rotaliids 0.50 0.78 0.10 0 4.6 0.61Miliolids 0.04 0.12 0.02 0 0.6 0.01Planktonic foraminifers 16.09 12.64 1.65 2 52 159.81Mollusks 4.41 9.91 1.29 0 40 98.23Bioclasts 22.77 12.93 1.68 0.5 56.6 167.27Lithoclasts 0.42 1.75 0.23 0 13 3.06Intraclasts 0.01 0.08 0.01 0 0.5 0.01Ooids 1.64 3.3 0.43 0 20 10.91Micrite 38.26 14.1 1.84 5 69 198.7
0
20
40
60
80
0 3 6 9 12
Green algae
% s
ampl
es
0
20
40
60
80
0 2 4 6 8
Red algae
% s
ampl
es
0
10
20
30
40
50
0 10 20 30
Planktonic foraminifers
0
20
40
60
0 1 2 3
Rotaliids
0
20
40
60
80
0 .5 1 1.5 2 2.5
Miliolids
% s
ampl
es
0
20
40
60
0 10 20
Mollusks
0
10
20
30
0 20 40 60
Bioclasts
0
20
40
60
80
0 3 6 9 12
Lithoclasts
0
20
40
60
80
100
0 2 4 6
Intraclasts
0
20
40
60
0 20 40 60 80
Ooids
% s
ampl
es
0
5
10
15
20
0 20 40 60
Micrite
0
20
40
60
80
% s
ampl
es
0 3 6 9 12
Green algae
Red algae
0
20
40
60
80
0 2 4 6 8
% s
ampl
es
Rotaliids
0
20
40
60
0 1 2 3
Miliolids
0
20
40
60
80
0 .5 1 1.5 2 2.5
% s
ampl
es
Planktonic foraminifers
0
10
20
30
0 10 20 30
Mollusks
0
20
40
60
0 10 20
Lithoclasts
0
20
40
60
80
0 3 6 9 12
Intraclasts
0
20
40
60
80
100
0 2 4 6
Ooids
0
20
40
60
0 20 40 60 80
% s
ampl
es
Micrite
0
4
8
12
16
20
0 20 40 60
0
5
10
15
20
25
30
0 20 40 60
Bioclasts
%%
%
%%
%
A B
Figure 8. Comparison of the composition of turbidite sediments deposited during (A) sea-level highstand and (B) sea-level lowstand at the lower slope (Site1003; Miocene). The sediments deposited during high sea level show a higher abundance of shallow-water components including green and red algae, ooids,
57
K.H. BERNET ET AL.
0
20
40
60
80
100%
sam
ples
0 1 2 3
Green algae
0
20
40
60
80
0 1 2 3
Red algae
% s
ampl
es
0
20
40
60
0 1 2 3
Rotaliids
0
20
40
60
80
100Miliolids
% s
ampl
es
0 .1 .2 .30
5
10
15
20
25
30
0 20 40 60
Planktonic foramininifers
20
40
60
80
0
0 20 40
Mollusks
0
10
20
30
0 20 40 60
Bioclasts
0
20
40
60
80
0 .5 1 1.5 2 2.5
Lithoclasts
0
20
40
60
80
100
0 1 2 3
Intraclasts
0
20
40
60
80
0 10 20
Ooids
% s
ampl
es
0
5
10
15
20
25
0 20 40 60 80
Micrite
0
20
40
60
80
100
% s
ampl
es
0 1 2 3
Green algae
0
20
40
60
80
Red algae
0 1 2 3
0
20
40
60
0 1 2 3
Rotaliids
0
20
40
60
80
100
0 .1 .2 .3
Miliolids
% s
ampl
es
0
10
20
30Planktonic foramininifers
Mollusks
0
20
40
60
80
0 3 126 9
0
10
20
30
0 20 40 60
Bioclasts
0
20
40
60
80
0 .5 1 1.5 2 2.5
Lithoclasts
0
20
40
60
80
100
0 1 2 3
Intraclasts
0
20
40
60
80
0 10 20
Ooids
% s
ampl
es
0
5
10
15
20
25
0 20 40 60 80
Micrite
% s
ampl
es
0 10 20 30 40
%%
%
%%
%
A B
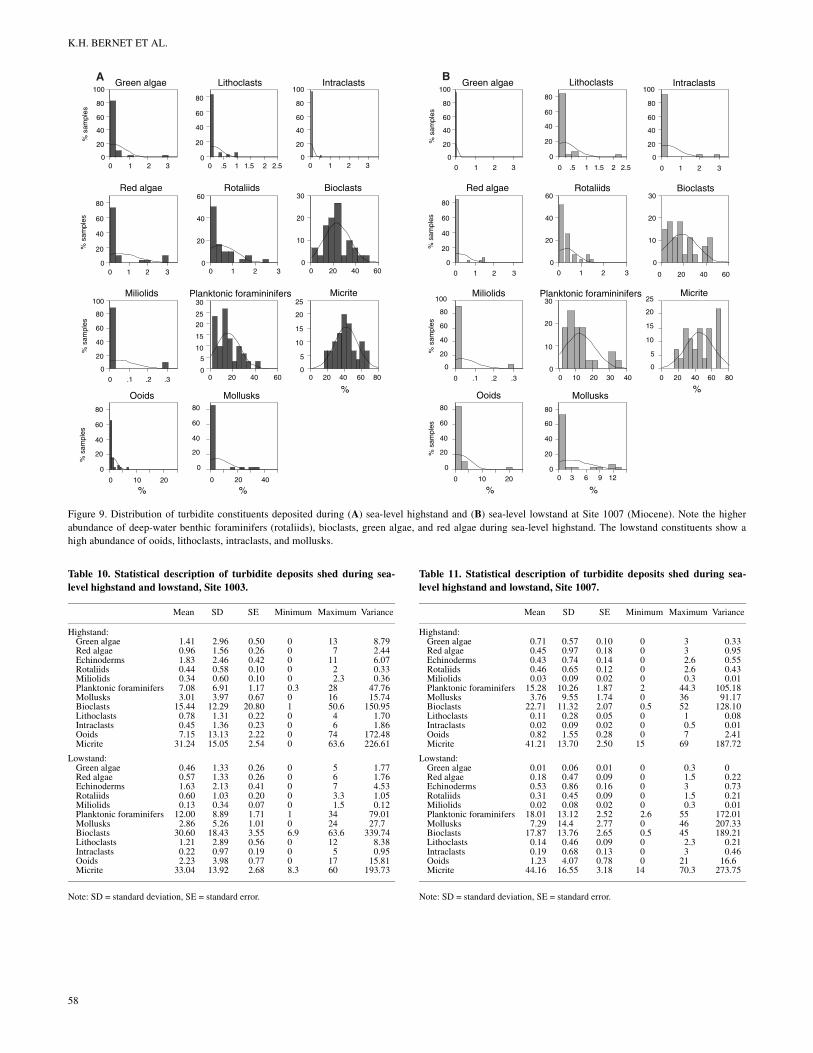
Figure 9. Distribution of turbidite constituents deposited during (A) sea-level highstand and (B) sea-level lowstand at Site 1007 (Miocene). Note the higherabundance of deep-water benthic foraminifers (rotaliids), bioclasts, green algae, and red algae during sea-level highstand. The lowstand constituents show ahigh abundance of ooids, lithoclasts, intraclasts, and mollusks.
Table 10. Statistical description of turbidite deposits shed during sea-level highstand and lowstand, Site 1003.
Note: SD = standard deviation, SE = standard error.
Mean SD SE Minimum Maximum Variance
Highstand:Green algae 1.41 2.96 0.50 0 13 8.79Red algae 0.96 1.56 0.26 0 7 2.44Echinoderms 1.83 2.46 0.42 0 11 6.07Rotaliids 0.44 0.58 0.10 0 2 0.33Miliolids 0.34 0.60 0.10 0 2.3 0.36Planktonic foraminifers 7.08 6.91 1.17 0.3 28 47.76Mollusks 3.01 3.97 0.67 0 16 15.74Bioclasts 15.44 12.29 20.80 1 50.6 150.95Lithoclasts 0.78 1.31 0.22 0 4 1.70Intraclasts 0.45 1.36 0.23 0 6 1.86Ooids 7.15 13.13 2.22 0 74 172.48Micrite 31.24 15.05 2.54 0 63.6 226.61
Lowstand:Green algae 0.46 1.33 0.26 0 5 1.77Red algae 0.57 1.33 0.26 0 6 1.76Echinoderms 1.63 2.13 0.41 0 7 4.53Rotaliids 0.60 1.03 0.20 0 3.3 1.05Miliolids 0.13 0.34 0.07 0 1.5 0.12Planktonic foraminifers 12.00 8.89 1.71 1 34 79.01Mollusks 2.86 5.26 1.01 0 24 27.7Bioclasts 30.60 18.43 3.55 6.9 63.6 339.74Lithoclasts 1.21 2.89 0.56 0 12 8.38Intraclasts 0.22 0.97 0.19 0 5 0.95Ooids 2.23 3.98 0.77 0 17 15.81Micrite 33.04 13.92 2.68 8.3 60 193.73
58
Table 11. Statistical description of turbidite deposits shed during sea-level highstand and lowstand, Site 1007.
Note: SD = standard deviation, SE = standard error.
Mean SD SE Minimum Maximum Variance
Highstand:Green algae 0.71 0.57 0.10 0 3 0.33Red algae 0.45 0.97 0.18 0 3 0.95Echinoderms 0.43 0.74 0.14 0 2.6 0.55Rotaliids 0.46 0.65 0.12 0 2.6 0.43Miliolids 0.03 0.09 0.02 0 0.3 0.01Planktonic foraminifers 15.28 10.26 1.87 2 44.3 105.18Mollusks 3.76 9.55 1.74 0 36 91.17Bioclasts 22.71 11.32 2.07 0.5 52 128.10Lithoclasts 0.11 0.28 0.05 0 1 0.08Intraclasts 0.02 0.09 0.02 0 0.5 0.01Ooids 0.82 1.55 0.28 0 7 2.41Micrite 41.21 13.70 2.50 15 69 187.72
Lowstand:Green algae 0.01 0.06 0.01 0 0.3 0Red algae 0.18 0.47 0.09 0 1.5 0.22Echinoderms 0.53 0.86 0.16 0 3 0.73Rotaliids 0.31 0.45 0.09 0 1.5 0.21Miliolids 0.02 0.08 0.02 0 0.3 0.01Planktonic foraminifers 18.01 13.12 2.52 2.6 55 172.01Mollusks 7.29 14.4 2.77 0 46 207.33Bioclasts 17.87 13.76 2.65 0.5 45 189.21Lithoclasts 0.14 0.46 0.09 0 2.3 0.21Intraclasts 0.19 0.68 0.13 0 3 0.46Ooids 1.23 4.07 0.78 0 21 16.6Micrite 44.16 16.55 3.18 14 70.3 273.75
TURBIDITE FREQUENCY AND COMPOSITION, BAHAMAS TRANSECT
0
20
40
60
80
0 10 20
Ooids
% s
ampl
es
0
20
40
60
80
100%
sam
ples
0 4 8 12
Green algae
0
20
40
60
80
100
0 2 4 6 8 10
Red algae
% s
ampl
es
0
20
40
60
0 2 4 6 8
Rotaliids
0
20
40
60
80
100
0 .4 .8 1.2
Miliolids
% s
ampl
es
0
5
10
15
20
25
0 10 20 30 40
Planktonic foraminifers
0
20
40
60
80
0 4 8 12
Mollusks
0
10
20
30
0 20 40 60
Bioclasts
0
20
40
60
80
0 2 4 6 8
Lithoclasts
0
20
40
60
80
100
0 .5 1 1.5 2 2.5
Intraclasts
0
20
40
60
80
0 10 20
Ooids
% s
ampl
es
0
5
10
15
20
25
0 20 40 60 80
Micrite
0
20
40
60
80
100
% s
ampl
es
0 2 4 6 8 10
Green algae
0
20
40
60
80
100
0 2 4 6 8
Red algae
% s
ampl
es
0
20
40
60
Rotaliids
0 2 4 6 8
0
20
40
60
80
100
0 .2 .4 .6 .8 1
Miliolids
% s
ampl
es
0
5
10
15
20
25
0 10 20 30 40
Planktonic foraminifers
0
20
40
60
80
0 3 6 9 12
Mollusks
0
5
10
15
20
25
30
0 20 40 60
Bioclasts
0
20
40
60
80
100
0 10 20
Lithoclasts
0
20
40
60
80
100
0 .5 1 1.5 2 2.5
Intraclasts
0
5
10
15
20
25
0 20 40 60 80
Micrite
%%
%
%%
%
A B
Figure 10. Comparison of the composition of background sediments deposited during (A) sea-level highstand and (B) sea-level lowstand at the lower slope (Site1003; Miocene). The sediments deposited during high sea level show a higher abundance of shallow-water components including green and red algae, ooids,miliolids, and lithoclasts, but also rotaliids.
59
K.H. BERNET ET AL.
0
20
40
60
80
100Green algae
% s
ampl
es
0 .4 .8 1.2
0
20
40
60
80
100
0 .4 .8 1.2 1.6
Red algae
% s
ampl
es
0
20
40
60
0 1 2 3
Rotaliids
0
20
40
60
80
100
0 .2 .4 .6 .8
Miliolids
% s
ampl
es
0
5
10
15
20
25
30
0 20 40 60
Planktonic foramininifers
0
20
40
60
80
100
0 20 40
Mollusks
0
10
20
30
40
0 20 40
Bioclasts
0
20
40
60
80
100
0 .5 1 1.5 2 2.5
Lithoclasts
0
20
40
60
80
100
0 .1 .2 .3
Intraclasts
0
20
40
60
80
100
0 10 20
Ooids
% s
ampl
es
0
5
10
15
20
25
0 20 40 60 80
Micrite
0
20
40
60
80
100
0 .4 .8 1.2
Green algae%
sam
ples
0
20
40
60
80
100
0 .4 .8 1.2 1.6
Red algae
% s
ampl
es
0
20
40
60
0 1 2 3
Rotaliids
0
20
40
60
80
100
0 .2 .4 .6 .8
Miliolids
% s
ampl
es
0
10
20
30
0 20 40 60
Planktonic foramininifers
0
20
40
60
80
100
0 20 40
Mollusks
0
10
20
30
40
0 20 40
Bioclasts
0
20
40
60
80
100
0 .5 1 1.5 2 2.5
Lithoclasts
0
20
40
60
80
100
0 1 2 3
Intraclasts
0
20
40
60
80
100
0 10 20
Ooids
% s
ampl
es
0
5
10
15
20
25
0 20 40 60 80
Micrite
%%
%
%%
%
A B
Figure 11. Distribution of background sediments deposited during (A) sea-level highstand and (B) sea-level lowstand in the basin (Site 1007; Miocene). Higherpercentages of shallow-water components in the background sediments are deposited during sea-level lowstands (e.g. green algae, red algae, ooids, and litho-clasts).
Table 12. Statistical description of background sediments deposited dur-ing sea-level highstand and lowstand, Site 1003.
Note: SD = standard deviation, SE = standard error.
Mean SD SE Minimum Maximum Variance
Highstand:Green algae 0.41 1.71 0.26 0 10 2.91Red algae 0.34 1.27 0.19 0 8 1.61Echinoderms 1.08 2.04 0.31 0 10 4.18Rotaliids 0.85 1.54 0.24 0 8 2.38Miliolids 0.05 0.20 0.03 0 1 0.04Planktonic foraminifers 12.39 9.04 1.38 0 36 81.77Mollusks 1.85 3.69 0.56 0 13 13.61Bioclasts 20.83 14.92 2.28 2.3 59 222.64Lithoclasts 0.67 1.62 0.25 0 7 2.61Intraclasts 0.13 0.49 0.08 0 2.3 0.24Ooids 2.40 4.84 0.74 0 22 23.46Micrite 38.37 14.53 2.22 0 63 211.07
Lowstand:Green algae 0.08 0.46 0.00 0 3 0.21Red algae 0.10 0.37 0.00 0 2 0.14Echinoderms 0.26 0.54 0.00 0 2 0.29Rotaliids 0.44 0.63 0.00 0 2.6 0.4Miliolids 0.05 0.21 0.00 0 1 0.05Planktonic foraminifers 13.74 8.33 1.27 1 38 69.37Mollusks 1.08 2.63 4.00 0 11 6.9Bioclasts 24.08 16.74 2.55 1 66.3 280.37Lithoclasts 0.67 3.14 0.48 0 20.3 9.86Intraclasts 0.01 0.05 0.00 0 0.3 0.002Ooids 0.47 1.32 0.20 0 7 1.76Micrite 17.26 16.44 2.51 1.3 77 270.14
60
Table 13. Statistical description of background sediments deposited dur-ing sea-level highstand and lowstand, Site 1007.
Note: SD = standard deviation, SE = standard error.
Mean SD SE Minimum Maximum Variance
Highstand:Green algae 0.00 0.00 0.00 0 0 0.00Red algae 0.02 0.12 0.02 0 0.6 0.01Echinoderms 0.48 0.97 0.19 0 4 0.94Rotaliids 0.53 0.79 0.15 0 3 0.62Miliolids 0.04 0.15 0.03 0 0.7 0.02Planktonic foraminifers 12.52 6.61 1.30 3 32.3 43.69Mollusks 1.55 7.84 1.54 0 40 61.51Bioclasts 19.61 9.15 1.97 0 48 83.67Lithoclasts 0.01 0.06 0.01 0 0.3 0.00Intraclasts 0.01 0.06 0.01 0 0.3 0.00Ooids 0.35 1.07 0.21 0 5.3 1.15Micrite 50.88 9.89 1.94 23 67.3 97.80
Lowstand:Green algae 0.01 0.06 0.01 0 0.3 0Red algae 0.18 0.47 0.09 0 1.5 0.22Echinoderms 0.53 0.86 0.16 0 3 0.73Rotaliids 0.31 0.45 0.09 0 1.5 0.21Miliolids 0.02 0.08 0.02 0 0.3 0.01Planktonic foraminifers 18.01 13.12 2.52 2.6 55 172.01Mollusks 7.29 14.4 2.77 0 46 207.33Bioclasts 17.87 13.76 2.65 0.5 45 189.21Lithoclasts 0.14 0.46 0.09 0 2.3 0.21Intraclasts 0.19 0.68 0.13 0 3 0.46Ooids 1.23 4.07 0.78 0 21 16.6Micrite 44.16 16.55 3.18 14 70.3 273.75


![49 years of the turbidite paradigm 0849s0889s#] …kyawlinnzaw.weebly.com/uploads/4/5/1/3/4513060/50_years...49 years of the turbidite paradigm "0849s0889s#] deep!water processes and](https://img.pdfslide.net/doc/110x75/5ec13d4db4bd2433133819d1/49-years-of-the-turbidite-paradigm-0849s0889s-49-years-of-the-turbidite-paradigm.jpg)