Embed Size (px)
Citation preview
8/7/2019 75 Business Outlook Survey
http://slidepdf.com/reader/full/75-business-outlook-survey 1/10
[ ]
75th CII BUSINESS OUTLOOK January– March 2010-11
75th
CII BUSINESS OUTLOOK January- March 2011
8/7/2019 75 Business Outlook Survey
http://slidepdf.com/reader/full/75-business-outlook-survey 2/10
[ 2 ]
75th CII BUSINESS OUTLOOK January– March 2010-11
• 75% of the respondents expect their sales to rise
while 59% of the respondents foresee an increase in
production and 67% expect increase in new orders in
January-March 2011 compared to the previous
quarter. Also, majority of the respondents (52%)
expect raw material prices to go up in the coming
quarter.
• 65% of the respondents do not expect their
inventory levels to decline.
• 44% of the respondents expect employment to
increase during the next three months
• The survey revealed that 52% of the respondents
do no expect availability of credit to increase, while
71% feel that the cost of credit will not fall in January-
March 2011.
• 37% of the respondents expect export volumes to
increase in January-March 2011.
• High Fiscal Deficit and Slackening Consumer
Demand are the top concerns.
• Business Confidence Index (CII-BCI) for
January-March 2011 stood almost flat at 66.7 as
compared to 66.2 in the 74th Business Outlook Survey
for October-December 2010 when the index had
increased by 1.4 points.
• Sectoral break-up shows that BCI for Primary
sector is highest followed by Services and then
Manufacturing as in the previous survey.
• A majority of respondents (68%) expect GDP
growth rate above 8.0%, of this, 41% expect the
growth rate to be in the range of 8.0 to 8.5% and 27%
expect it to be higher than 8.5% in 2010-11.
• 78% of the respondents expect inflation to be
above 6.0% in 2010. Of this, the majority (29%) expect
it to be in the range of 7.0 - 8.0%.
• 63% of the respondents would like to increase
their spending on capacity expansion during January-
March 2011 as compared to the previous quarter.
• 74% of respondents expect capacity utilization to
exceed 75% in the quarter ending March 2011.
HIGHLIGHTS
8/7/2019 75 Business Outlook Survey
http://slidepdf.com/reader/full/75-business-outlook-survey 3/10
[ 3 ]
75th CII BUSINESS OUTLOOK January– March 2010-11
I. CII Business Confidence Index
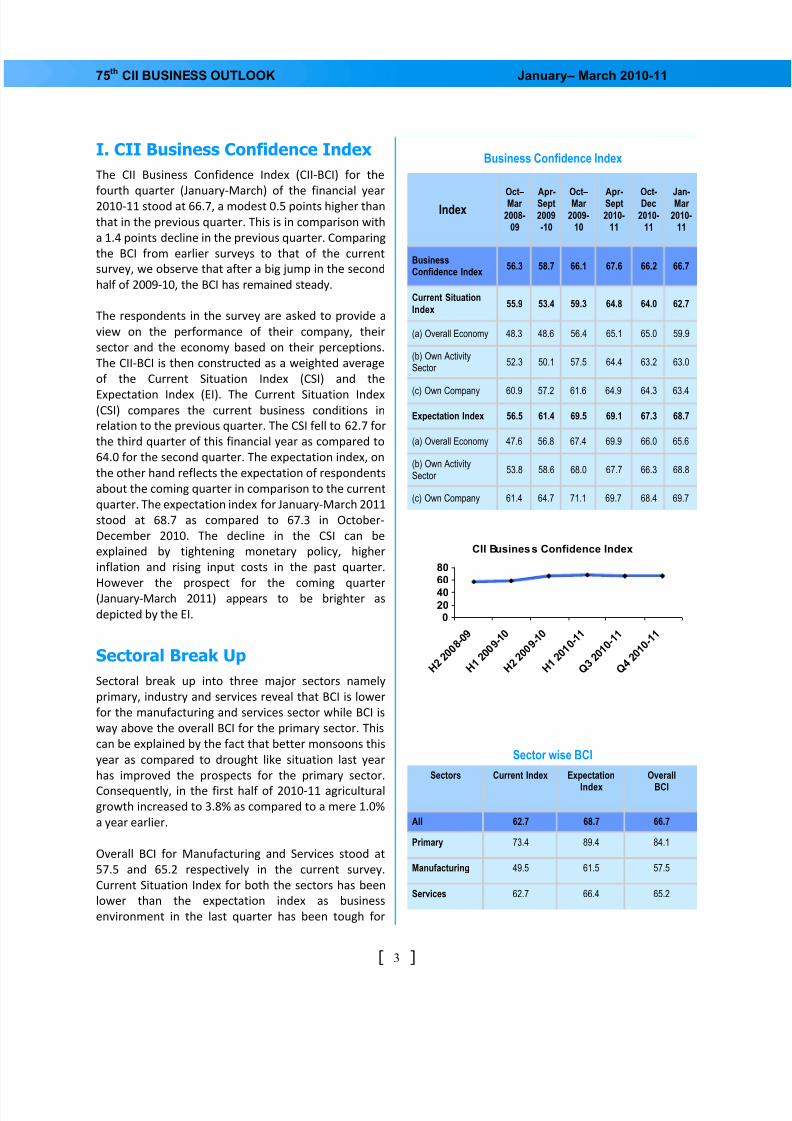
The CII Business Confidence Index (CII-BCI) for the
fourth quarter (January-March) of the financial year2010-11 stood at 66.7, a modest 0.5 points higher than
that in the previous quarter. This is in comparison with
a 1.4 points decline in the previous quarter. Comparing
the BCI from earlier surveys to that of the current
survey, we observe that after a big jump in the second
half of 2009-10, the BCI has remained steady.
The respondents in the survey are asked to provide a
view on the performance of their company, their
sector and the economy based on their perceptions.
The CII-BCI is then constructed as a weighted average
of the Current Situation Index (CSI) and the
Expectation Index (EI). The Current Situation Index(CSI) compares the current business conditions in
relation to the previous quarter. The CSI fell to 62.7 for
the third quarter of this financial year as compared to
64.0 for the second quarter. The expectation index, on
the other hand reflects the expectation of respondents
about the coming quarter in comparison to the current
quarter. The expectation index for January-March 2011
stood at 68.7 as compared to 67.3 in October-
December 2010. The decline in the CSI can be
explained by tightening monetary policy, higher
inflation and rising input costs in the past quarter.
However the prospect for the coming quarter
(January-March 2011) appears to be brighter as
depicted by the EI.
Sectoral Break Up
Sectoral break up into three major sectors namely
primary, industry and services reveal that BCI is lower
for the manufacturing and services sector while BCI is
way above the overall BCI for the primary sector. This
can be explained by the fact that better monsoons this
year as compared to drought like situation last year
has improved the prospects for the primary sector.
Consequently, in the first half of 2010-11 agriculturalgrowth increased to 3.8% as compared to a mere 1.0%
a year earlier.
Overall BCI for Manufacturing and Services stood at
57.5 and 65.2 respectively in the current survey.
Current Situation Index for both the sectors has been
lower than the expectation index as business
environment in the last quarter has been tough for
IndexOct–Mar
2008-09
Apr-Sept
2009-10
Oct–Mar
2009-10
Apr-Sept
2010-11
Jan-Mar
2010-11
BusinessConfidence Index
56.3 58.7 66.1 67.6 66.7
Current Situation
Index55.9 53.4 59.3 64.8 62.7
(a) Overall Economy 48.3 48.6 56.4 65.1 59.9
(b) Own ActivitySector
52.3 50.1 57.5 64.4 63.0
(c) Own Company 60.9 57.2 61.6 64.9 63.4
Expectation Index 56.5 61.4 69.5 69.1 68.7
(a) Overall Economy 47.6 56.8 67.4 69.9 65.6
(b) Own ActivitySector
53.8 58.6 68.0 67.7 68.8
(c) Own Company 61.4 64.7 71.1 69.7 69.7
Business Confidence Index
Oct-Dec
2010-11
66.2
64.0
65.0
63.2
64.3
67.3
66.0
66.3
68.4
Sectors Current Index Expectation
Index
Overall
BCI
All 62.7 68.7 66.7
Primary 73.4 89.4 84.1
Manufacturing 49.5 61.5 57.5
Services 62.7 66.4 65.2
Sector wise BCI
CII Business Confidence Index
02040
6080
H 2 2 0
0 8 - 0 9
H 1 2 0 0 9
- 1 0
H 2 2 0 0 9
- 1 0
H 1 2 0 1 0
- 1 1
Q 3 2 0 1 0
- 1 1
Q 4 2 0 1 0
- 1 1
8/7/2019 75 Business Outlook Survey
http://slidepdf.com/reader/full/75-business-outlook-survey 4/10
[ 4 ]
75th CII BUSINESS OUTLOOK January– March 2010-11
firms. The Manufacturing sector has been hit the worst
due to significant increase in raw material costs,
inflationary expectations in the economy and shortage
of liquidity, as a result the BCI for Manufacturingslowed down by 8.6 points to 57.5 in the current
survey as compared to the previous survey.
Outlook on the economy
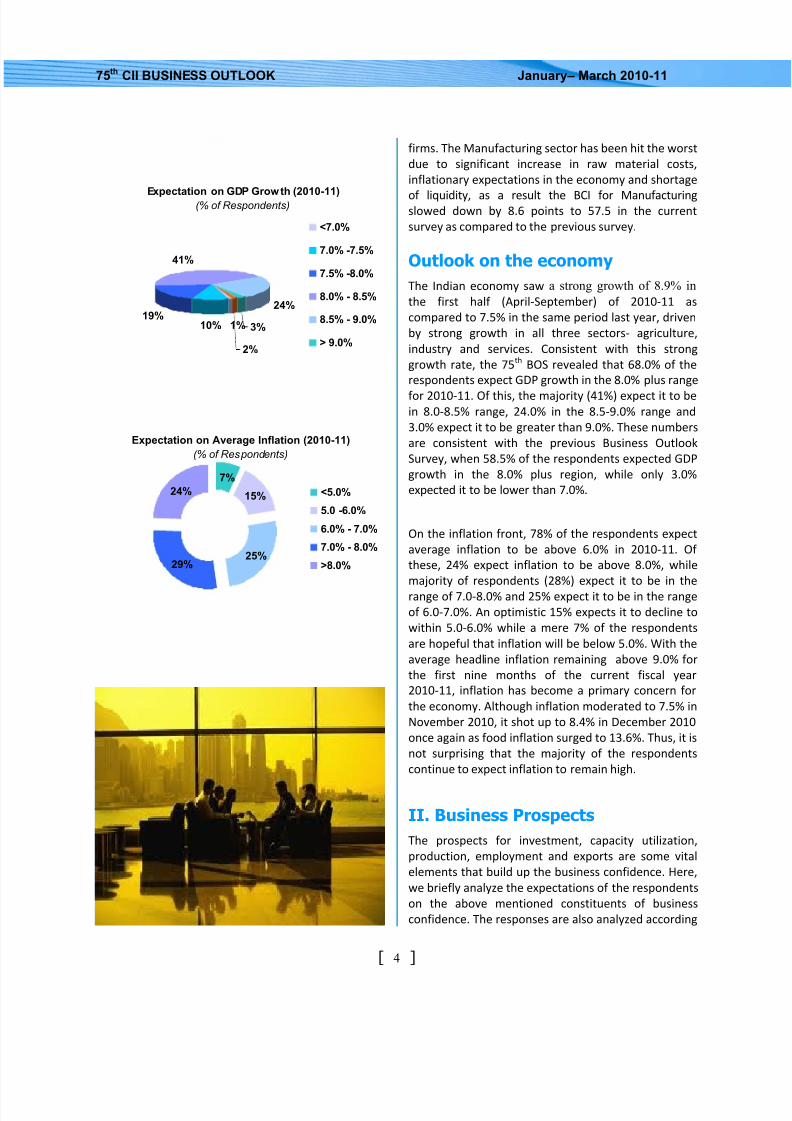
The Indian economy saw a strong growth of 8.9% in
the first half (April-September) of 2010-11 as
compared to 7.5% in the same period last year, driven
by strong growth in all three sectors- agriculture,
industry and services. Consistent with this strong
growth rate, the 75th BOS revealed that 68.0% of the
respondents expect GDP growth in the 8.0% plus range
for 2010-11. Of this, the majority (41%) expect it to bein 8.0-8.5% range, 24.0% in the 8.5-9.0% range and
3.0% expect it to be greater than 9.0%. These numbers
are consistent with the previous Business Outlook
Survey, when 58.5% of the respondents expected GDP
growth in the 8.0% plus region, while only 3.0%
expected it to be lower than 7.0%.
On the inflation front, 78% of the respondents expect
average inflation to be above 6.0% in 2010-11. Of
these, 24% expect inflation to be above 8.0%, while
majority of respondents (28%) expect it to be in the
range of 7.0-8.0% and 25% expect it to be in the range
of 6.0-7.0%. An optimistic 15% expects it to decline to
within 5.0-6.0% while a mere 7% of the respondents
are hopeful that inflation will be below 5.0%. With the
average headline inflation remaining above 9.0% for
the first nine months of the current fiscal year
2010-11, inflation has become a primary concern for
the economy. Although inflation moderated to 7.5% in
November 2010, it shot up to 8.4% in December 2010
once again as food inflation surged to 13.6%. Thus, it is
not surprising that the majority of the respondents
continue to expect inflation to remain high.
II. Business Prospects
The prospects for investment, capacity utilization,
production, employment and exports are some vital
elements that build up the business confidence. Here,
we briefly analyze the expectations of the respondents
on the above mentioned constituents of business
confidence. The responses are also analyzed according
Highlights Highlights HighlightsHighlights Highlights Highlights
Highlights Highlights Highlights
Highlights Highlights Highlights
Highlights
Expectation on GDP Growth (2010-11)(% of Respondents)
10%19%
41%
24%
3%
2%
1%
<7.0%
7.0% -7.5%
7.5% -8.0%
8.0% - 8.5%
8.5% - 9.0%
> 9.0%
Expectation on Average Inflation (2010-11)
(% of Respondents)
7%
15%
25%29%
24% <5.0%
5.0 -6.0%
6.0% - 7.0%
7.0% - 8.0%
>8.0%
8/7/2019 75 Business Outlook Survey
http://slidepdf.com/reader/full/75-business-outlook-survey 5/10
[ 5 ]
75th CII BUSINESS OUTLOOK January– March 2010-11
to the size classification of respondents. Amongst the
total respondents, 28.0% were small enterprises while
36.0% and 24.0% were medium and large enterprises
respectively.
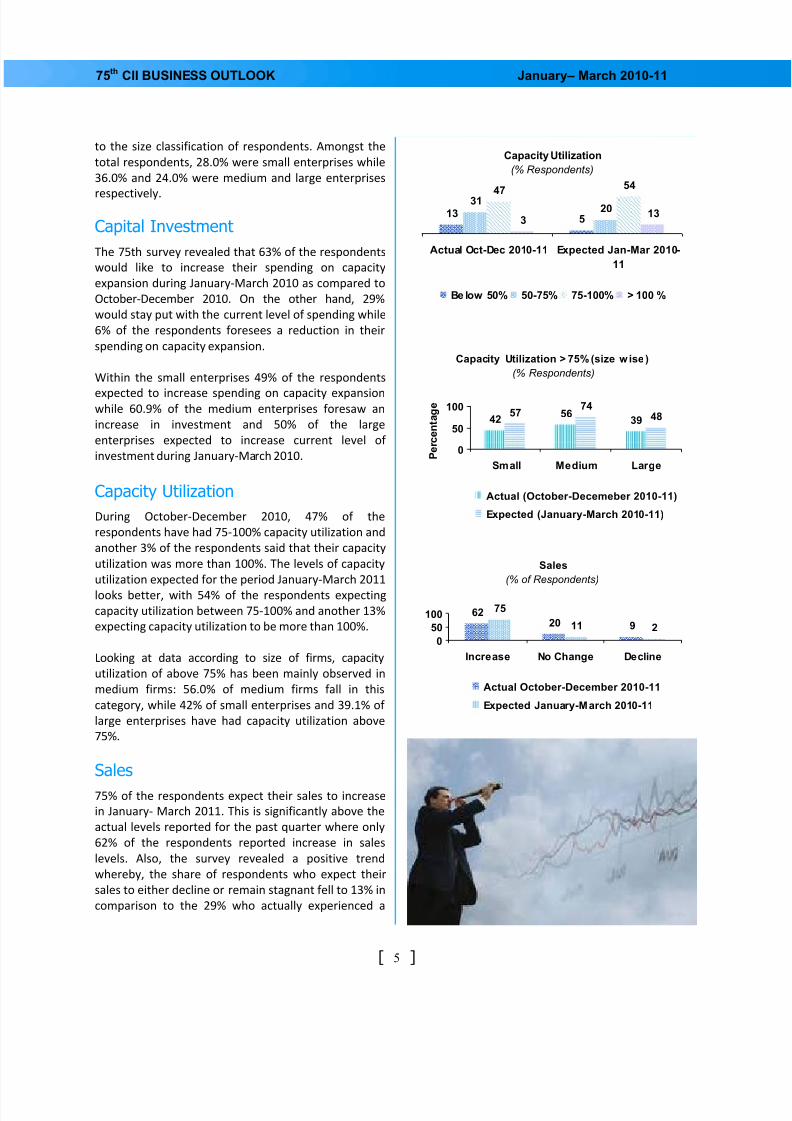
Capital Investment
The 75th survey revealed that 63% of the respondents
would like to increase their spending on capacity
expansion during January-March 2010 as compared to
October-December 2010. On the other hand, 29%
would stay put with the current level of spending while
6% of the respondents foresees a reduction in their
spending on capacity expansion.
Within the small enterprises 49% of the respondents
expected to increase spending on capacity expansionwhile 60.9% of the medium enterprises foresaw an
increase in investment and 50% of the large
enterprises expected to increase current level of
investment during January-March 2010.
Capacity Utilization
During October-December 2010, 47% of the
respondents have had 75-100% capacity utilization and
another 3% of the respondents said that their capacity
utilization was more than 100%. The levels of capacity
utilization expected for the period January-March 2011
looks better, with 54% of the respondents expecting
capacity utilization between 75-100% and another 13%
expecting capacity utilization to be more than 100%.
Looking at data according to size of firms, capacity
utilization of above 75% has been mainly observed in
medium firms: 56.0% of medium firms fall in this
category, while 42% of small enterprises and 39.1% of
large enterprises have had capacity utilization above
75%.
Sales
75% of the respondents expect their sales to increase
in January- March 2011. This is significantly above the
actual levels reported for the past quarter where only
62% of the respondents reported increase in sales
levels. Also, the survey revealed a positive trend
whereby, the share of respondents who expect their
sales to either decline or remain stagnant fell to 13% in
comparison to the 29% who actually experienced a
Capacity Utilization > 75% (size wise)
(% Respondents)
4256
3957
7448
0
50
100
Small Medium Large P e r c e n t a g e
Actual (October-Decemeber 2010-11)
Expected (January-March 2010-11)
Sales
(% of Respondents)
6220 9
75
11 2
0
50
100
Increase No Change Decline
Actual October-December 2010-11
Expected January-March 2010-11
Capacity Utilization
(% Respondents)
135
3120
4754
313
Actual Oct-Dec 2010-11 Expected Jan-Mar 2010-
11
Be low 50% 50-75% 75-100% > 100 %
8/7/2019 75 Business Outlook Survey
http://slidepdf.com/reader/full/75-business-outlook-survey 6/10
[ 6 ]
75th CII BUSINESS OUTLOOK January– March 2010-11
decline or stagnancy in sales in October-December
2010-11.
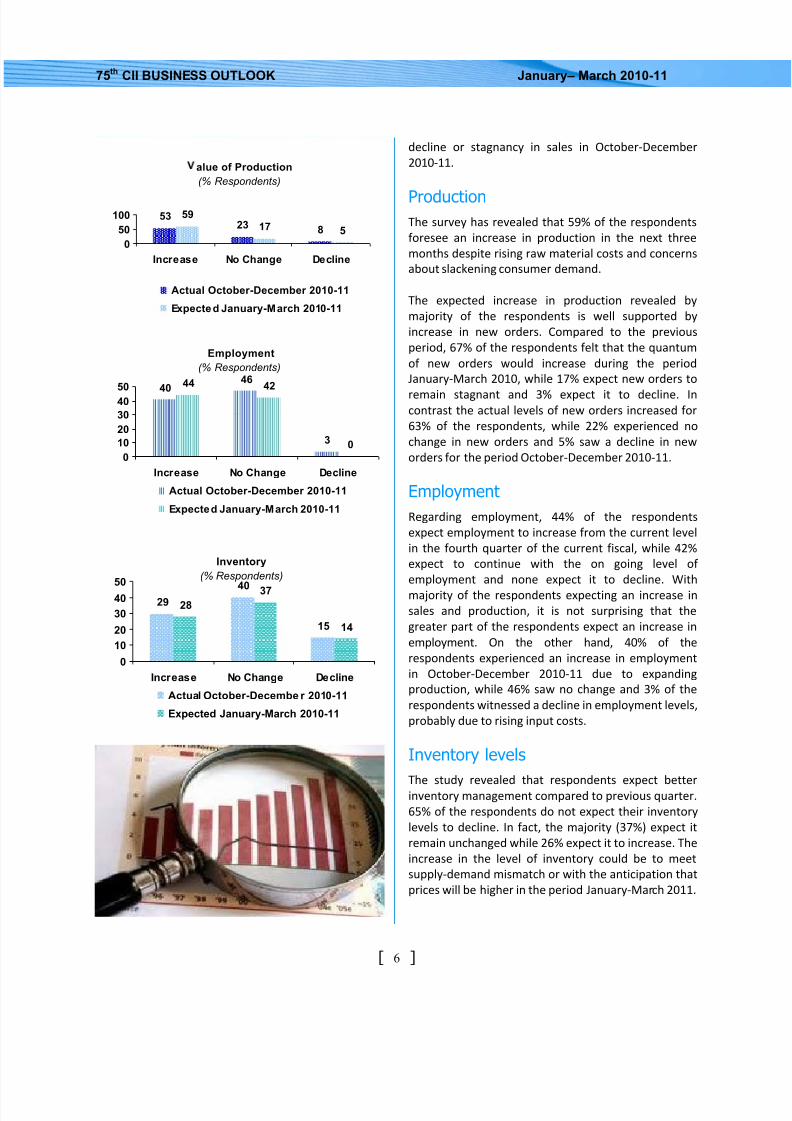
ProductionThe survey has revealed that 59% of the respondents
foresee an increase in production in the next three
months despite rising raw material costs and concerns
about slackening consumer demand.
The expected increase in production revealed by
majority of the respondents is well supported by
increase in new orders. Compared to the previous
period, 67% of the respondents felt that the quantum
of new orders would increase during the period
January-March 2010, while 17% expect new orders to
remain stagnant and 3% expect it to decline. Incontrast the actual levels of new orders increased for
63% of the respondents, while 22% experienced no
change in new orders and 5% saw a decline in new
orders for the period October-December 2010-11.
Employment
Regarding employment, 44% of the respondents
expect employment to increase from the current level
in the fourth quarter of the current fiscal, while 42%
expect to continue with the on going level of
employment and none expect it to decline. With
majority of the respondents expecting an increase in
sales and production, it is not surprising that the
greater part of the respondents expect an increase in
employment. On the other hand, 40% of the
respondents experienced an increase in employment
in October-December 2010-11 due to expanding
production, while 46% saw no change and 3% of the
respondents witnessed a decline in employment levels,
probably due to rising input costs.
Inventory levels
The study revealed that respondents expect betterinventory management compared to previous quarter.
65% of the respondents do not expect their inventory
levels to decline. In fact, the majority (37%) expect it
remain unchanged while 26% expect it to increase. The
increase in the level of inventory could be to meet
supply-demand mismatch or with the anticipation that
prices will be higher in the period January-March 2011.
Employment
(% Respondents)
40
46
3
44 42
0
0
10
20
30
40
50
Increase No Change Decline
Actual October-December 2010-11
Expected January-March 2010-11
Inventory
(% Respondents)
2940
15
2837
14
0
10
20
30
40
50
Increase No Change Decline
Actual October-Decembe r 2010-11
Expected January-March 2010-11
alue of Production
(% Respondents)
5323 8
5917 5
0
50
100
Increase No Change Decline
Actual October-December 2010-11
Expected January-March 2010-11
8/7/2019 75 Business Outlook Survey
http://slidepdf.com/reader/full/75-business-outlook-survey 7/10
[ 7 ]
75th CII BUSINESS OUTLOOK January– March 2010-11
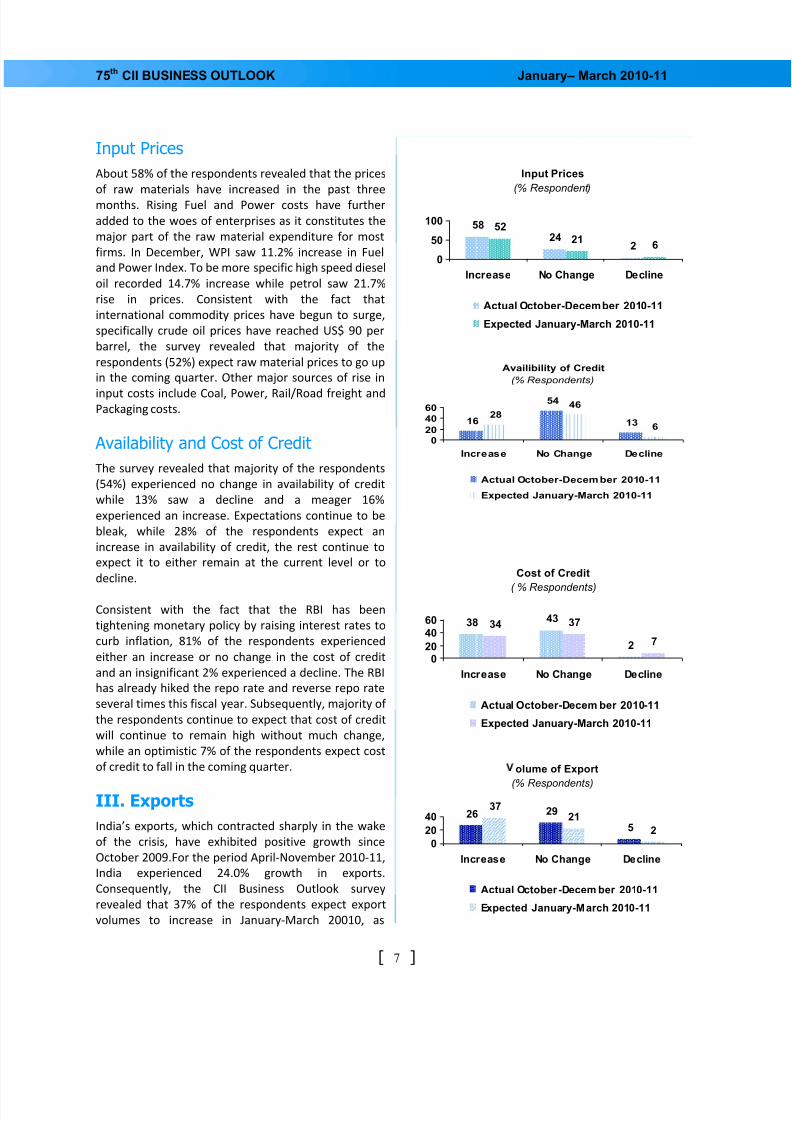
Input Prices
About 58% of the respondents revealed that the prices
of raw materials have increased in the past three
months. Rising Fuel and Power costs have further
added to the woes of enterprises as it constitutes the
major part of the raw material expenditure for most
firms. In December, WPI saw 11.2% increase in Fuel
and Power Index. To be more specific high speed diesel
oil recorded 14.7% increase while petrol saw 21.7%
rise in prices. Consistent with the fact that
international commodity prices have begun to surge,
specifically crude oil prices have reached US$ 90 per
barrel, the survey revealed that majority of the
respondents (52%) expect raw material prices to go up
in the coming quarter. Other major sources of rise in
input costs include Coal, Power, Rail/Road freight andPackaging costs.
Availability and Cost of Credit
The survey revealed that majority of the respondents
(54%) experienced no change in availability of credit
while 13% saw a decline and a meager 16%
experienced an increase. Expectations continue to be
bleak, while 28% of the respondents expect an
increase in availability of credit, the rest continue to
expect it to either remain at the current level or to
decline.
Consistent with the fact that the RBI has been
tightening monetary policy by raising interest rates to
curb inflation, 81% of the respondents experienced
either an increase or no change in the cost of credit
and an insignificant 2% experienced a decline. The RBI
has already hiked the repo rate and reverse repo rate
several times this fiscal year. Subsequently, majority of
the respondents continue to expect that cost of credit
will continue to remain high without much change,
while an optimistic 7% of the respondents expect cost
of credit to fall in the coming quarter.
III. Exports
India’s exports, which contracted sharply in the wake
of the crisis, have exhibited positive growth since
October 2009.For the period April-November 2010-11,
India experienced 24.0% growth in exports.
Consequently, the CII Business Outlook survey
revealed that 37% of the respondents expect export
volumes to increase in January-March 20010, as
Availibility of Credit
(% Respondents)
16
54
1328
46
6
020
40
60
Increase No Change Decline
Actual October-December 2010-11
Expected January-March 2010-11
Cost of Credit
( % Respondents)
38 43
2
34 37
7
020
40
60
Increase No Change Decline
Actual October-Decem ber 2010-11
Expected January-March 2010-11
olume of Export
(% Respondents)
26 29
5
3721
2
0
20
40
Increase No Change Decline
Actual October -Decem ber 2010-11
Expected January-March 2010-11
Input Prices
(% Respondent)
5824
2
52
216
0
50
100
Increase No Change Decline
Actual October-December 2010-11
Expected January-March 2010-11
8/7/2019 75 Business Outlook Survey
http://slidepdf.com/reader/full/75-business-outlook-survey 8/10
[ 8 ]
75th CII BUSINESS OUTLOOK January– March 2010-11
compared to the 26% respondents who actually
experienced an increase in volume of export in
October-December 2010. The better export scenario is
also visible from the increase in new ordersexperienced by many firms (47%) in October-
December 2010 .The survey also revealed that 29% of
the respondents experienced no change in export
volumes while 5% witnessed a decline in the volume of
exports. We also observed that the percent of
respondents that expect export volumes to decline has
fallen to 2%, while 21% of the respondents expect no
change in trade volumes in the coming three months.
Procedural Delays
The 75th Business Outlook Survey revealed that
procedural delays remained as the major problemfaced by exporters and a major consequence of this is
the increase in transaction costs. In fact, 53% of the
respondents felt that there was no decline in
procedural delays for the period October-December
2010. By transaction cost we mean increase in cost of
exports beside the cost associated with the production
process, such as procedural complexities associated
with the gambit of export procedures starting from
Import-Export licenses to the realization of the export
receivables. The procedural complexities in the export
process in a country may also lead to a change in
preference of an importer to an alternative country
with less procedural complexities. Thus, a very high
transaction cost, if it exists, may encumber the export
growth even if other policy related measures are in
place. Despite various measures taken by the
government to reduce bureaucratic delays, it still
remains a major impediment. However, on thebrighter side 11% of the respondent are positive that
procedural delays will decline in January-March 2011
as compared to 5% who actually experienced a decline
in procedural delay in October-December 2010.
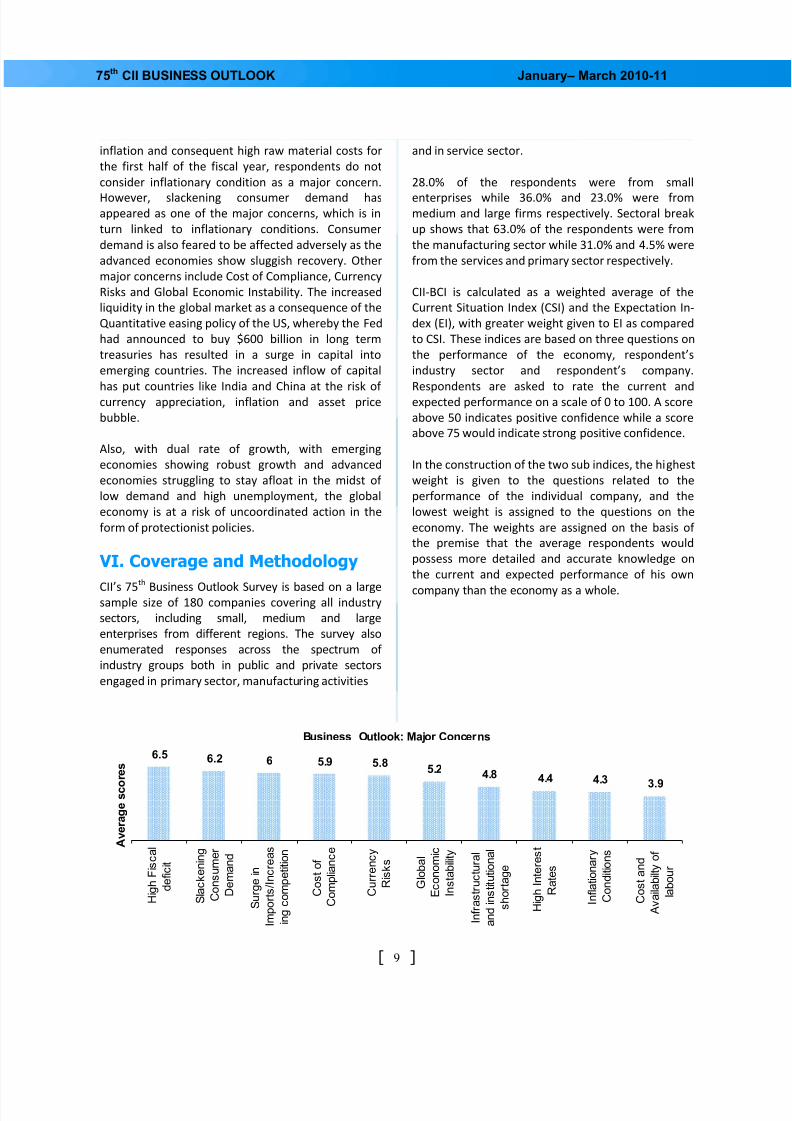
IV. Business Outlook: Concerns
The 75th CII Business Outlook Survey also revealed
certain major concerns of the respondents. The
respondents were asked to rank the following issues:
Slackening Consumer Demand, Cost of Compliance,
Currency risks, global Economic Instability, High
Interest Rates, Surge in Imports/IncreasingCompetition, infrastructural and Institutional shortage,
cost and availability of labor, Inflationary Conditions
and High Fiscal deficit. The average score of responses
identifies high fiscal deficit as the top concern followed
by slackening consumer demand and surge in imports/
increased competition respectively.
High fiscal deficit has appeared as a major concern in
the 75th Business Outlook Survey, unlike the previous
survey when it was ranked 10th. This is probably
because respondents feel that if the Government does
not moderate its fiscal deficit then there would
pressure on interest rates to increase. The surprising
finding of the survey is that despite consistent high
8/7/2019 75 Business Outlook Survey
http://slidepdf.com/reader/full/75-business-outlook-survey 9/10
[ 9 ]
75th CII BUSINESS OUTLOOK January– March 2010-11
inflation and consequent high raw material costs for
the first half of the fiscal year, respondents do not
consider inflationary condition as a major concern.
However, slackening consumer demand hasappeared as one of the major concerns, which is in
turn linked to inflationary conditions. Consumer
demand is also feared to be affected adversely as the
advanced economies show sluggish recovery. Other
major concerns include Cost of Compliance, Currency
Risks and Global Economic Instability. The increased
liquidity in the global market as a consequence of the
Quantitative easing policy of the US, whereby the Fed
had announced to buy $600 billion in long term
treasuries has resulted in a surge in capital into
emerging countries. The increased inflow of capital
has put countries like India and China at the risk of
currency appreciation, inflation and asset price
bubble.
Also, with dual rate of growth, with emerging
economies showing robust growth and advanced
economies struggling to stay afloat in the midst of
low demand and high unemployment, the global
economy is at a risk of uncoordinated action in the
form of protectionist policies.
VI. Coverage and Methodology
CII’s 75th
Business Outlook Survey is based on a largesample size of 180 companies covering all industry
sectors, including small, medium and large
enterprises from different regions. The survey also
enumerated responses across the spectrum of
industry groups both in public and private sectors
engaged in primary sector, manufacturing activities
Business Outlook: Major Concerns
6.5 6.2 6 5.9 5.85.2 4.8 4.4 4.3
3.9
H i g h F i s c a l
d e f i c i t
S l a c k e n i n g
C o n s u m e r
D e m a n d
S u r g e i n
I m p o r t s / I n c r e a s
i n g c o m p e t i t i o n
C o s t o f
C o m p l i a n c e
C u r r e n c y
R i s k s
G l o b a l
E c o n o m i c
I n s t a b i l i t y
I n f r a s t r u c t u r a l
a n d i n s t i t u t i o n a l
s h o r t a g e
H i g h I n t e r e s t
R a t e s
I n f l a t i o n a r y
C o n d i t i o n s
C o s t a n d
A v a i l a b i l t y o f
l a b o u r
A v e r a g e s c o
r e s
and in service sector.
28.0% of the respondents were from small
enterprises while 36.0% and 23.0% were frommedium and large firms respectively. Sectoral break
up shows that 63.0% of the respondents were from
the manufacturing sector while 31.0% and 4.5% were
from the services and primary sector respectively.
CII-BCI is calculated as a weighted average of the
Current Situation Index (CSI) and the Expectation In-
dex (EI), with greater weight given to EI as compared
to CSI. These indices are based on three questions on
the performance of the economy, respondent’s
industry sector and respondent’s company.
Respondents are asked to rate the current and
expected performance on a scale of 0 to 100. A score
above 50 indicates positive confidence while a score
above 75 would indicate strong positive confidence.
In the construction of the two sub indices, the highest
weight is given to the questions related to the
performance of the individual company, and the
lowest weight is assigned to the questions on the
economy. The weights are assigned on the basis of
the premise that the average respondents would
possess more detailed and accurate knowledge on
the current and expected performance of his own
company than the economy as a whole.
8/7/2019 75 Business Outlook Survey
http://slidepdf.com/reader/full/75-business-outlook-survey 10/10
[ 10 ]
75th CII BUSINESS OUTLOOK January– March 2010-11
Notes: figures may not add up to the total due to rounding off
Business Outlook Survey is a quarterly report prepared by the CII Economic Research Group.
Reach us at: [email protected]
249-F, Sector 18, Udyog Vihar, Phase IV, Gurgaon- 122015, Haryana, INDIA
Tel: +91-124-4014060-67 • Fax: +91-124-4014080 • Email: [email protected] • Website: www..cii.in
Reach us via our unique Membership Helpline: 00-91-11-435 46244 / 00-91-99104 46244