Embed Size (px)
Citation preview

8th Fiscal Period (ended April 2017)
Presentation Materials June 19, 2017
http://www.hoshinoresorts-reit.net/
Securities Code: 3287
Asset Management Company: Hoshino Resort Asset Management Co., Ltd.

IV. Appendix
Operational results for each property (1) – (8) 34
Balance sheet for the fiscal period ended April 2017 42
Statement of income for the fiscal period ended April 2017
43
Real estate appraisal value for continuously owned properties as of the end of the fiscal period ended April 2017 (1) – (3)
44
Information on unitholders as of the end of the fiscal period ended April 2017
47
Overview of HRR 48
Overview of Asset Management Company 49 II. Operational Results for Each Property
Operational results for each property (1) – (4) 16
Forecasts for 9th fiscal period ending October 2017 and 10th fiscal period ending April 2018 (1) – (2)
20
Rent type (1) – (2) 22
I. Management Results for the Fiscal Period Ended April 2017
Highlights 3
Overview of public offering 4
Improvement in unitholder value by expansion of asset size 5
Overview of new property acquisition (9th fiscal period) 6
Overview of new property acquisition (8th fiscal period) 7
Status of portfolio (1) – (2) 8
Internal growth (1) – (3) 10
Finances (1) – (2) 13
III. Future Management Policy
Management policy 25
Realization of stable distribution 26
Market trend and strategy for differentiation 27
External growth 28
Facilities (planned to be) operated by the Hoshino Resorts Group (1) – (2)
29
Internal growth 31
Measures for internal growth and their effect 32
1
Table of contents
I. Management Results for the Fiscal Period Ended April 2017
3
Highlights
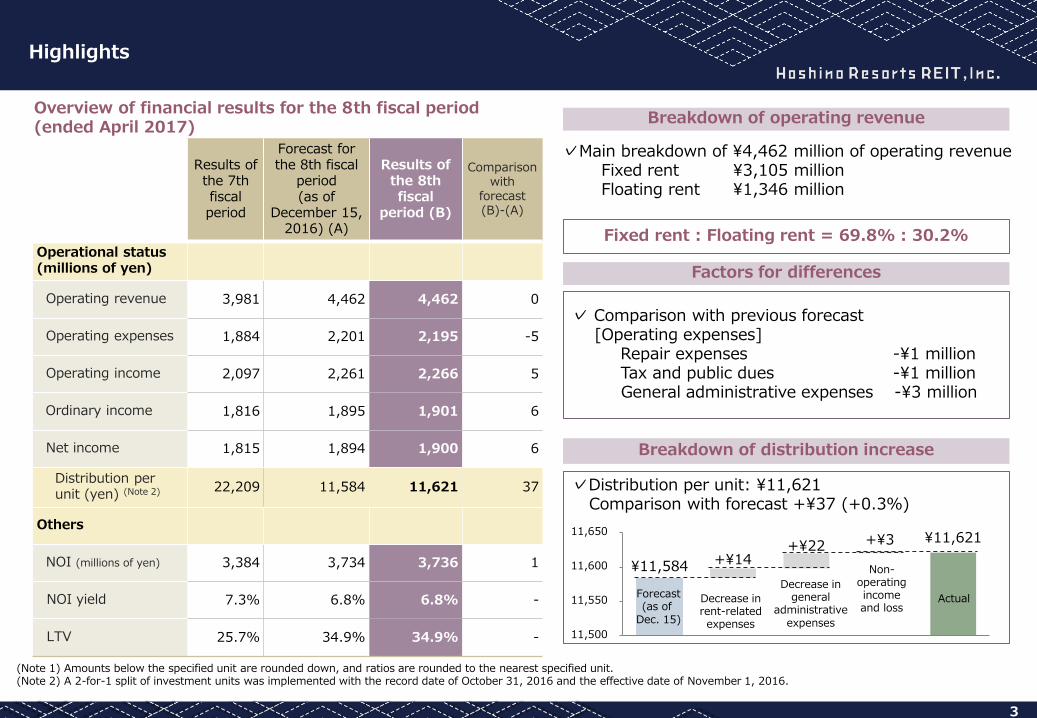
Overview of financial results for the 8th fiscal period (ended April 2017)
Results of the 7th fiscal period
Forecast for the 8th fiscal
period (as of
December 15, 2016) (A)
Results of the 8th fiscal
period (B)
Comparison with
forecast (B)-(A)
Operational status (millions of yen)
Operating revenue 3,981 4,462 4,462 0
Operating expenses 1,884 2,201 2,195 -5
Operating income 2,097 2,261 2,266 5
Ordinary income 1,816 1,895 1,901 6
Net income 1,815 1,894 1,900 6
Distribution per unit (yen) (Note 2) 22,209 11,584 11,621 37
Others
NOI (millions of yen) 3,384 3,734 3,736 1
NOI yield 7.3% 6.8% 6.8% -
LTV 25.7% 34.9% 34.9% -
Breakdown of distribution increase
¥11,584
¥11,621
+¥14 +¥22 +¥3
11,500
11,550
11,600
11,650
✓Main breakdown of ¥4,462 million of operating revenue Fixed rent ¥3,105 million Floating rent ¥1,346 million
Breakdown of operating revenue
Factors for differences
✓ Comparison with previous forecast [Operating expenses] Repair expenses -¥1 million Tax and public dues -¥1 million General administrative expenses -¥3 million
Fixed rent : Floating rent = 69.8% : 30.2%
✓Distribution per unit: ¥11,621 Comparison with forecast +¥37 (+0.3%)
Non-operating income and loss
Decrease in general
administrative expenses
Forecast (as of
Dec. 15)
Decrease in rent-related expenses
Actual
(Note 1) Amounts below the specified unit are rounded down, and ratios are rounded to the nearest specified unit. (Note 2) A 2-for-1 split of investment units was implemented with the record date of October 31, 2016 and the effective date of November 1, 2016.
0
20,000
40,000
60,000
80,000
100,000
120,000
50.00
100.00
150.00
200.00
250.00
300.00
Jul. 2013 Nov. 2013 Mar. 2014 Jul. 2014 Nov. 2014 Mar. 2015 Jul. 2015 Nov. 2015 Mar. 2016 Jul. 2016 Nov. 2016 Mar. 2017Market value (unit: millions of yen) (right axis) Investment unit price (left axis) REIT index (left axis)
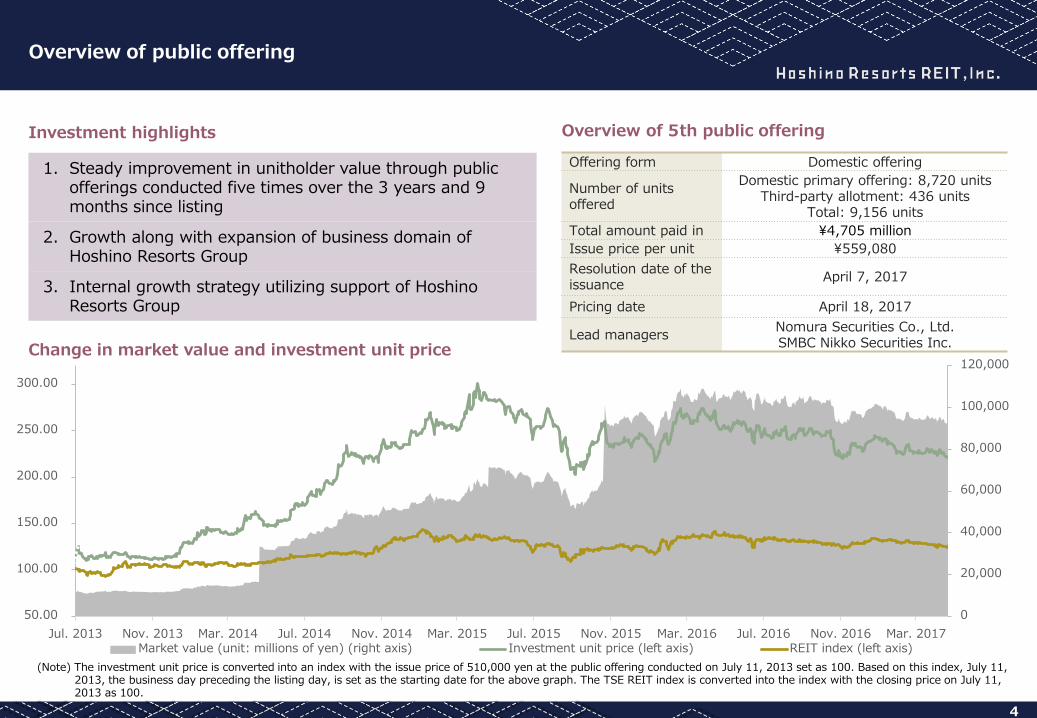
Investment highlights
Offering form Domestic offering
Number of units offered
Domestic primary offering: 8,720 units Third-party allotment: 436 units
Total: 9,156 units
Total amount paid in ¥4,705 million
Issue price per unit ¥559,080
Resolution date of the issuance
April 7, 2017
Pricing date April 18, 2017
Lead managers Nomura Securities Co., Ltd. SMBC Nikko Securities Inc.
1. Steady improvement in unitholder value through public offerings conducted five times over the 3 years and 9 months since listing
2. Growth along with expansion of business domain of Hoshino Resorts Group
3. Internal growth strategy utilizing support of Hoshino Resorts Group
Overview of 5th public offering
4
Overview of public offering
Change in market value and investment unit price
(Note) The investment unit price is converted into an index with the issue price of 510,000 yen at the public offering conducted on July 11, 2013 set as 100. Based on this index, July 11, 2013, the business day preceding the listing day, is set as the starting date for the above graph. The TSE REIT index is converted into the index with the closing price on July 11, 2013 as 100.
0
20
40
60
80
0
20
40
60
80
100
120
As of listing As of the end of 3rd FP As of the end of 5th FP As of the end of 7th FP As of June 19, 2017
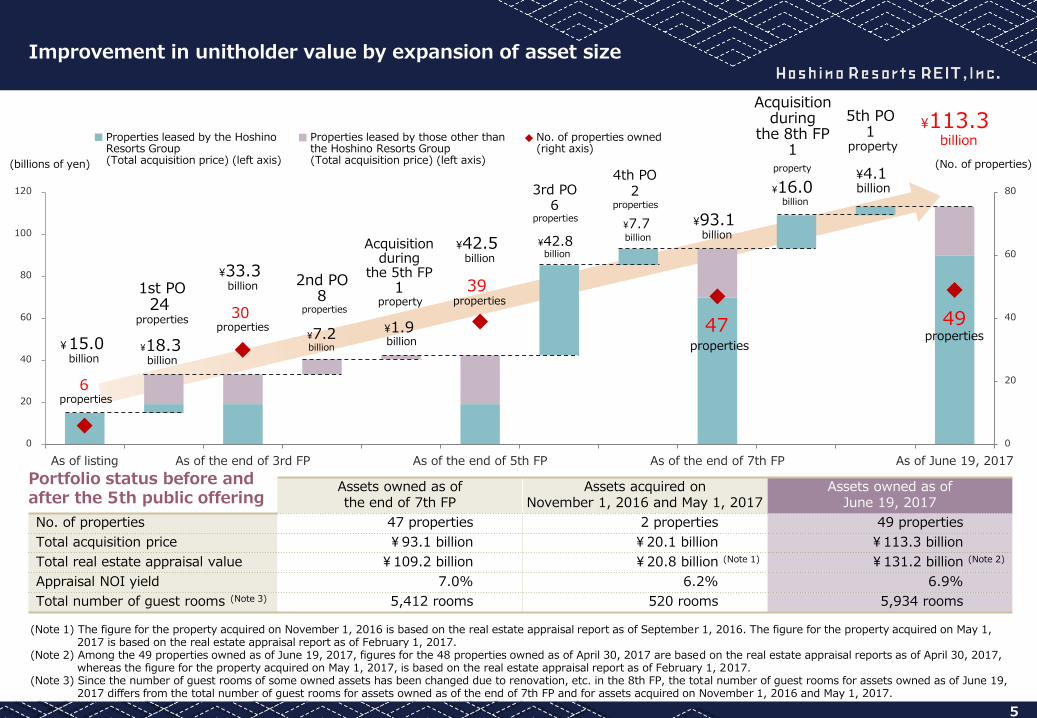
6 properties
Assets owned as of the end of 7th FP
Assets acquired on November 1, 2016 and May 1, 2017
Assets owned as of June 19, 2017
No. of properties 47 properties 2 properties 49 properties
Total acquisition price ¥93.1 billion ¥20.1 billion ¥113.3 billion
Total real estate appraisal value ¥109.2 billion ¥20.8 billion (Note 1) ¥131.2 billion (Note 2)
Appraisal NOI yield 7.0% 6.2% 6.9%
Total number of guest rooms (Note 3) 5,412 rooms 520 rooms 5,934 rooms
5
Improvement in unitholder value by expansion of asset size
(billions of yen) (No. of properties)
¥15.0 billion
¥33.3 billion
¥42.5 billion
1st PO 24
properties
2nd PO 8
properties
3rd PO 6
properties
30 properties
Acquisition during
the 5th FP 1
property
39 properties
47 properties
4th PO 2
properties
¥93.1 billion
No. of properties owned (right axis)
Properties leased by the Hoshino Resorts Group (Total acquisition price) (left axis)
Properties leased by those other than the Hoshino Resorts Group (Total acquisition price) (left axis)
¥16.0 billion
¥113.3 billion
49 properties
Portfolio status before and after the 5th public offering
(Note 1) The figure for the property acquired on November 1, 2016 is based on the real estate appraisal report as of September 1, 2016. The figure for the property acquired on May 1, 2017 is based on the real estate appraisal report as of February 1, 2017.
(Note 2) Among the 49 properties owned as of June 19, 2017, figures for the 48 properties owned as of April 30, 2017 are based on the real estate appraisal reports as of April 30, 2017, whereas the figure for the property acquired on May 1, 2017, is based on the real estate appraisal report as of February 1, 2017.
(Note 3) Since the number of guest rooms of some owned assets has been changed due to renovation, etc. in the 8th FP, the total number of guest rooms for assets owned as of June 19, 2017 differs from the total number of guest rooms for assets owned as of the end of 7th FP and for assets acquired on November 1, 2016 and May 1, 2017.
5th PO 1
property
¥42.8 billion
¥7.7 billion
¥7.2 billion ¥18.3
billion
Acquisition during
the 8th FP 1
property ¥4.1 billion
¥1.9 billion
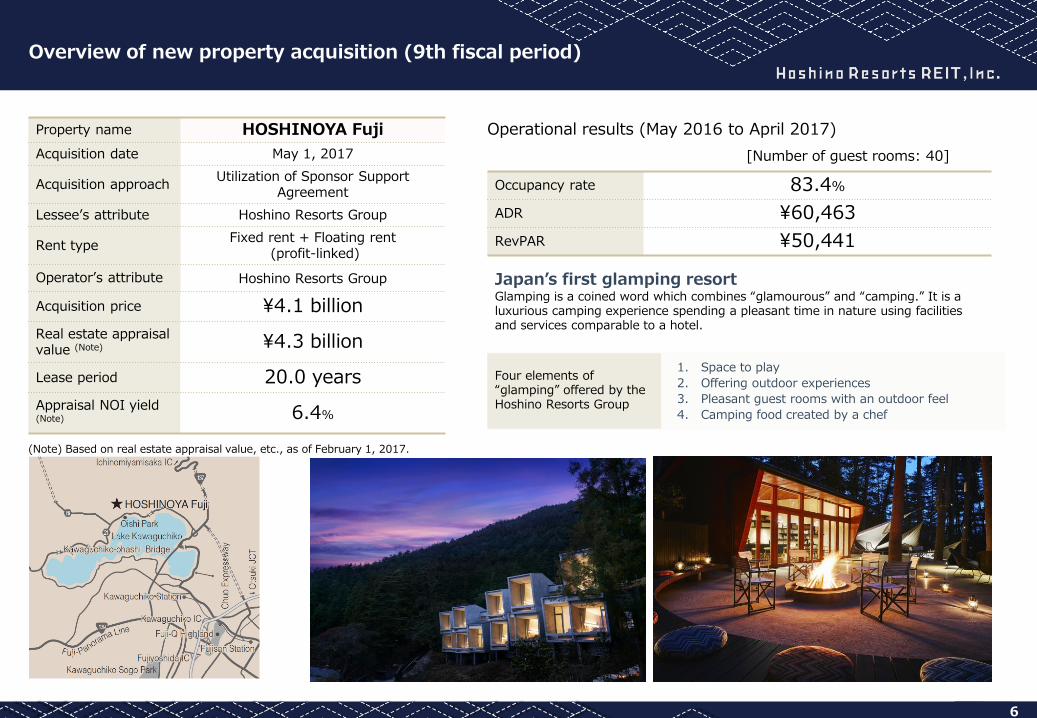
Four elements of “glamping” offered by the Hoshino Resorts Group
Japan’s first glamping resort Glamping is a coined word which combines “glamourous” and “camping.” It is a luxurious camping experience spending a pleasant time in nature using facilities and services comparable to a hotel.
6
Overview of new property acquisition (9th fiscal period)
Property name HOSHINOYA Fuji
Acquisition date May 1, 2017
Acquisition approach Utilization of Sponsor Support
Agreement
Lessee’s attribute Hoshino Resorts Group
Rent type Fixed rent + Floating rent
(profit-linked)
Operator’s attribute Hoshino Resorts Group
Acquisition price ¥4.1 billion
Real estate appraisal value (Note) ¥4.3 billion
Lease period 20.0 years
Appraisal NOI yield (Note)
6.4%
(Note) Based on real estate appraisal value, etc., as of February 1, 2017.
Occupancy rate 83.4%
ADR ¥60,463
RevPAR ¥50,441
1. Space to play
2. Offering outdoor experiences
3. Pleasant guest rooms with an outdoor feel
4. Camping food created by a chef
Operational results (May 2016 to April 2017)
[Number of guest rooms: 40]
7
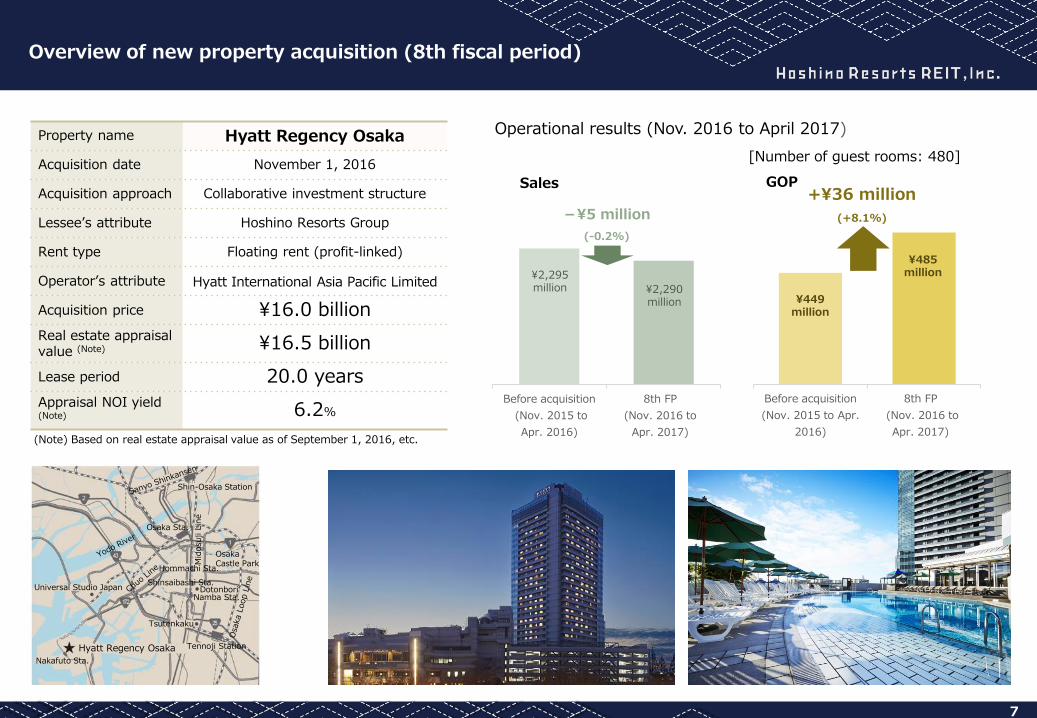
Overview of new property acquisition (8th fiscal period)
Property name Hyatt Regency Osaka
Acquisition date November 1, 2016
Acquisition approach Collaborative investment structure
Lessee’s attribute Hoshino Resorts Group
Rent type Floating rent (profit-linked)
Operator’s attribute Hyatt International Asia Pacific Limited
Acquisition price ¥16.0 billion
Real estate appraisal value (Note) ¥16.5 billion
Lease period 20.0 years
Appraisal NOI yield (Note)
6.2%
Operational results (Nov. 2016 to April 2017)
(Note) Based on real estate appraisal value as of September 1, 2016, etc.
Before acquisition
(Nov. 2015 to Apr.
2016)
8th FP
(Nov. 2016 to
Apr. 2017)
¥449 million
¥485 million
Before acquisition
(Nov. 2015 to
Apr. 2016)
8th FP
(Nov. 2016 to
Apr. 2017)
¥2,295 million ¥2,290
million
-¥5 million
(-0.2%)
+¥36 million
(+8.1%)
Sales GOP
Shin-Osaka Station
Osaka Sta.
Universal Studio Japan
Nakafuto Sta.
Hyatt Regency Osaka
Hommachi Sta.
Shinsaibashi Sta.
Mid
osu
ji L
ine
Namba Sta. Dotonbori
Tsutenkaku
Osaka Castle Park
Tennoji Station
[Number of guest rooms: 480]
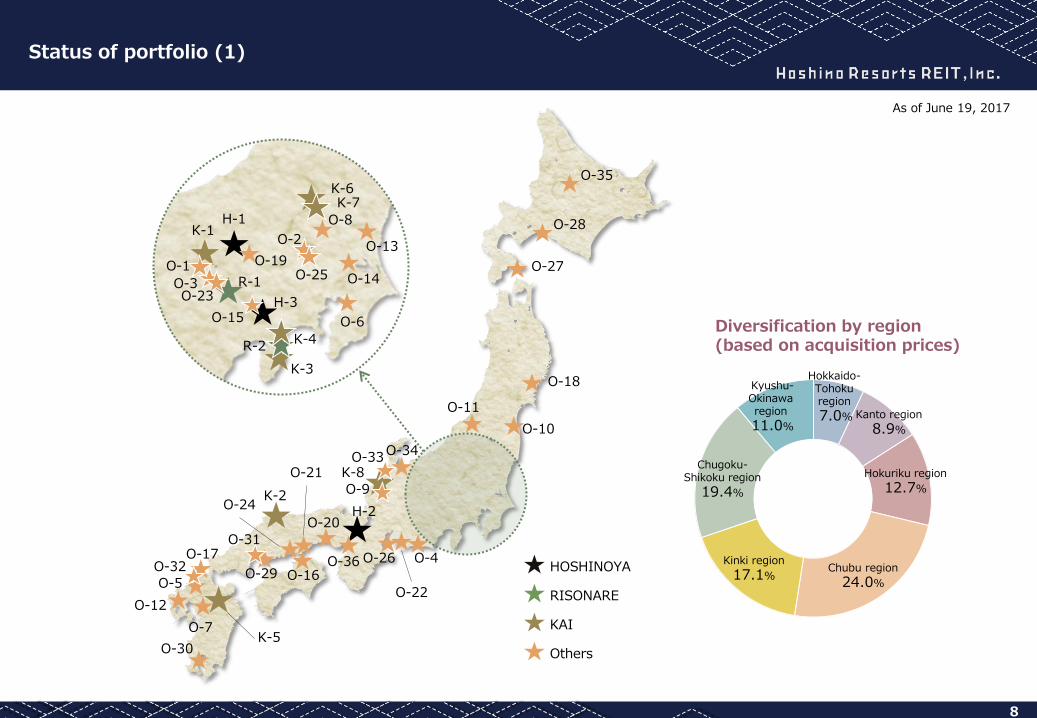
Diversification by region (based on acquisition prices)
8
Status of portfolio (1)
Hokkaido- Tohoku region
7.0% Kanto region
8.9%
Chubu region
24.0%
Kinki region
17.1%
Kyushu- Okinawa region
11.0%
Hokuriku region
12.7%
HOSHINOYA
RISONARE
KAI
Others
O-28
O-27
O-18
O-10
O-11
O-4 O-26
H-2
O-9
O-22
O-20
O-16 O-29
K-2
O-21
O-24
O-17
O-5
O-12
O-7 K-5
K-6
O-13
O-14
O-6
O-25
O-2
H-1 K-1
O-1
O-3
O-15
O-23 R-1
O-8
O-34 O-33
O-31
O-32
O-30
K-7
R-2 K-4
K-3
O-19
O-35
K-8 Chugoku-
Shikoku region
19.4%
As of June 19, 2017
H-3
O-36
Urban tourism
50.0%
9
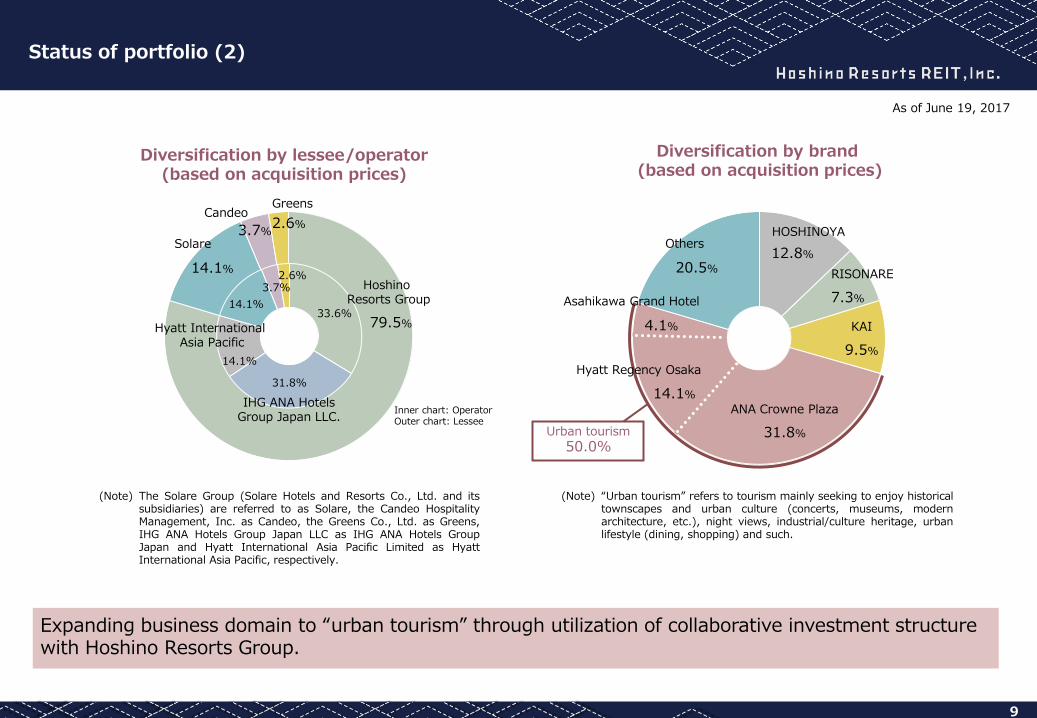
Status of portfolio (2)
Diversification by brand (based on acquisition prices)
Diversification by lessee/operator (based on acquisition prices)
Inner chart: Operator Outer chart: Lessee
2.6%
33.6%
Solare 3.7%
31.8%
79.5%
Hoshino Resorts Group
IHG ANA Hotels Group Japan LLC.
14.1%
Greens Candeo
14.1%
3.7% 2.6%
Hyatt International Asia Pacific
14.1%
(Note) The Solare Group (Solare Hotels and Resorts Co., Ltd. and its subsidiaries) are referred to as Solare, the Candeo Hospitality Management, Inc. as Candeo, the Greens Co., Ltd. as Greens, IHG ANA Hotels Group Japan LLC as IHG ANA Hotels Group Japan and Hyatt International Asia Pacific Limited as Hyatt International Asia Pacific, respectively.
Expanding business domain to “urban tourism” through utilization of collaborative investment structure with Hoshino Resorts Group.
(Note) “Urban tourism” refers to tourism mainly seeking to enjoy historical townscapes and urban culture (concerts, museums, modern architecture, etc.), night views, industrial/culture heritage, urban lifestyle (dining, shopping) and such.
As of June 19, 2017
Asahikawa Grand Hotel
31.8%
12.8%
HOSHINOYA
ANA Crowne Plaza
4.1%
Hyatt Regency Osaka
14.1%
7.3%
RISONARE
9.5%
KAI
Others
20.5%
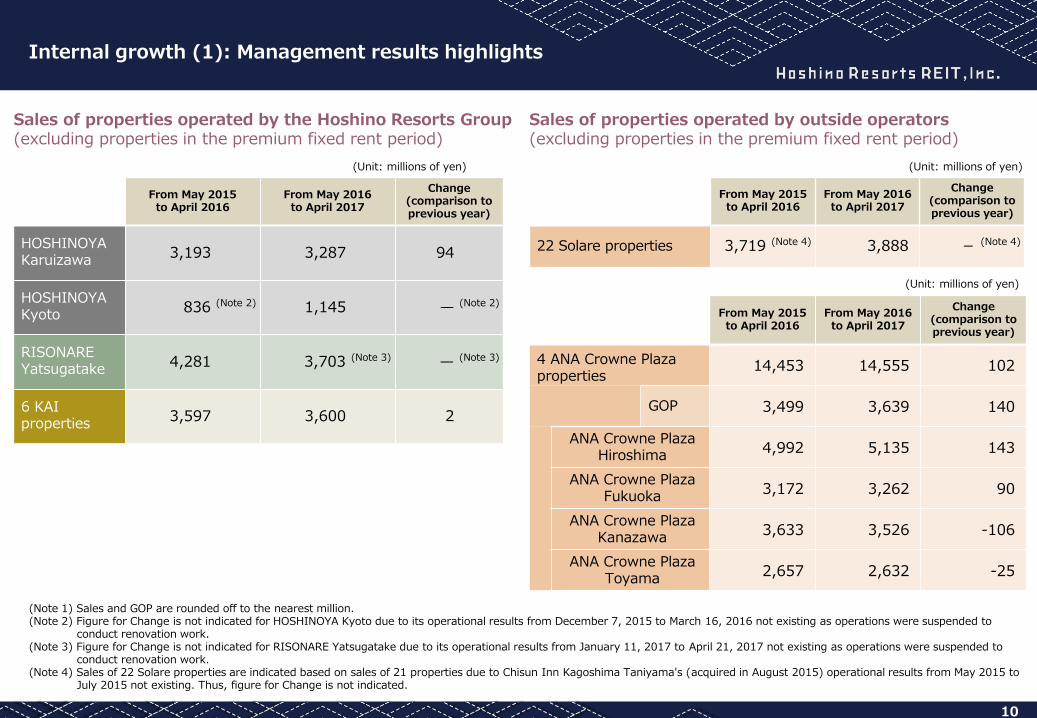
(Note 1) Sales and GOP are rounded off to the nearest million. (Note 2) Figure for Change is not indicated for HOSHINOYA Kyoto due to its operational results from December 7, 2015 to March 16, 2016 not existing as operations were suspended to
conduct renovation work. (Note 3) Figure for Change is not indicated for RISONARE Yatsugatake due to its operational results from January 11, 2017 to April 21, 2017 not existing as operations were suspended to
conduct renovation work. (Note 4) Sales of 22 Solare properties are indicated based on sales of 21 properties due to Chisun Inn Kagoshima Taniyama's (acquired in August 2015) operational results from May 2015 to
July 2015 not existing. Thus, figure for Change is not indicated.
10
Internal growth (1): Management results highlights
From May 2015 to April 2016
From May 2016 to April 2017
Change (comparison to previous year)
HOSHINOYA Karuizawa
3,193 3,287 94
HOSHINOYA Kyoto 836 (Note 2) 1,145 — (Note 2)
RISONARE Yatsugatake
4,281 3,703 (Note 3) — (Note 3)
6 KAI properties
3,597 3,600 2
From May 2015 to April 2016
From May 2016 to April 2017
Change (comparison to previous year)
22 Solare properties 3,719 (Note 4) 3,888 - (Note 4)
From May 2015 to April 2016
From May 2016 to April 2017
Change (comparison to previous year)
4 ANA Crowne Plaza properties
14,453 14,555 102
GOP 3,499 3,639 140
ANA Crowne Plaza Hiroshima
4,992 5,135 143
ANA Crowne Plaza Fukuoka
3,172 3,262 90
ANA Crowne Plaza Kanazawa
3,633 3,526 -106
ANA Crowne Plaza Toyama
2,657 2,632 -25
Sales of properties operated by the Hoshino Resorts Group (excluding properties in the premium fixed rent period)
Sales of properties operated by outside operators (excluding properties in the premium fixed rent period)
(Unit: millions of yen) (Unit: millions of yen)
(Unit: millions of yen)
3,795 4,124 4,281 3,703
78.5% 78.5% 76.3%
81.3%
60.0%
65.0%
70.0%
75.0%
80.0%
85.0%
90.0%
0
1,000
2,000
3,000
4,000
5,000
6,000
May 2013-Apr. 2014 May 2014-Apr. 2015 May 2015-Apr. 2016 May 2016-Apr. 2017
ADR (right axis) Sales (left axis) Guest room occupancy rate
11
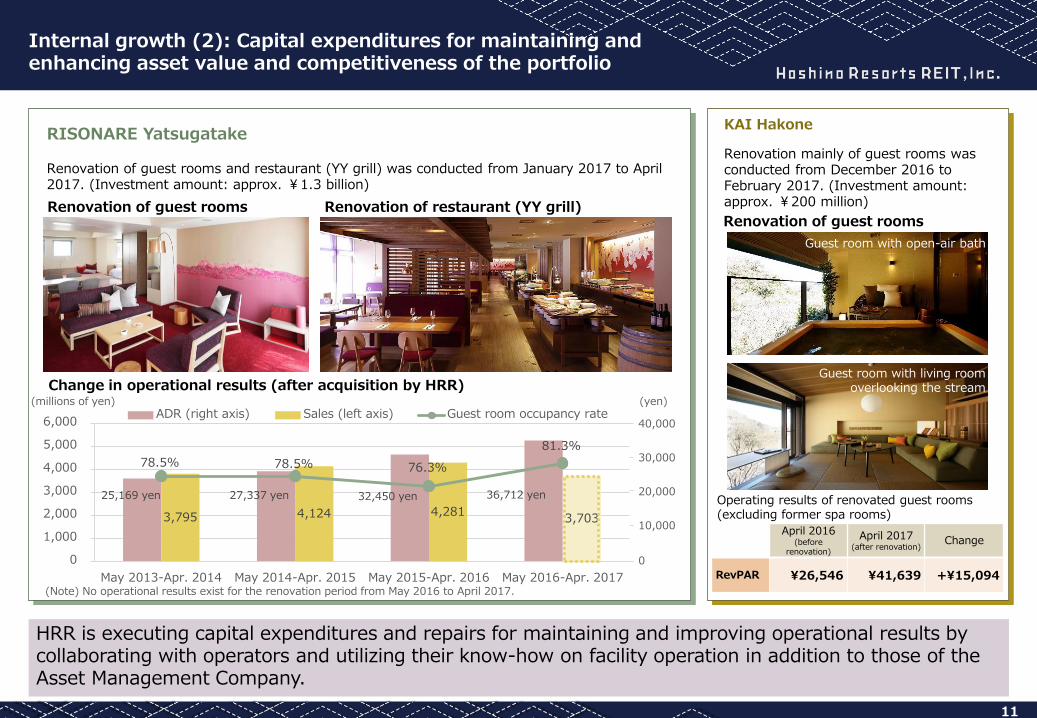
Internal growth (2): Capital expenditures for maintaining and enhancing asset value and competitiveness of the portfolio
HRR is executing capital expenditures and repairs for maintaining and improving operational results by collaborating with operators and utilizing their know-how on facility operation in addition to those of the Asset Management Company.
RISONARE Yatsugatake Renovation of guest rooms and restaurant (YY grill) was conducted from January 2017 to April 2017. (Investment amount: approx. ¥1.3 billion)
KAI Hakone
Renovation mainly of guest rooms was conducted from December 2016 to February 2017. (Investment amount: approx. ¥200 million)
Renovation of restaurant (YY grill) Renovation of guest rooms Renovation of guest rooms
Change in operational results (after acquisition by HRR)
April 2016 (before
renovation)
April 2017 (after renovation)
Change
RevPAR ¥26,546 ¥41,639 +¥15,094
Operating results of renovated guest rooms (excluding former spa rooms)
Guest room with open-air bath
Guest room with living room overlooking the stream
(millions of yen) (yen)
(Note) No operational results exist for the renovation period from May 2016 to April 2017.
25,169 yen 27,337 yen 32,450 yen 36,712 yen
0
20,000
10,000
30,000
40,000
12
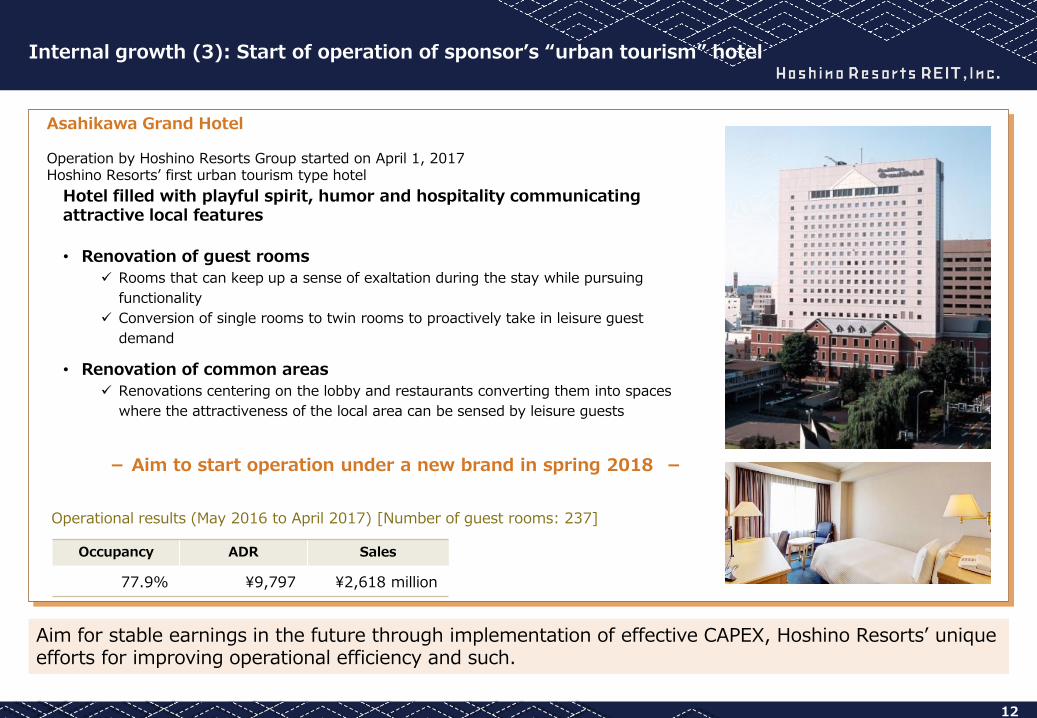
Internal growth (3): Start of operation of sponsor’s “urban tourism” hotel
Aim for stable earnings in the future through implementation of effective CAPEX, Hoshino Resorts’ unique efforts for improving operational efficiency and such.
Asahikawa Grand Hotel Operation by Hoshino Resorts Group started on April 1, 2017 Hoshino Resorts’ first urban tourism type hotel Hotel filled with playful spirit, humor and hospitality communicating
attractive local features
• Renovation of guest rooms
Rooms that can keep up a sense of exaltation during the stay while pursuing
functionality
Conversion of single rooms to twin rooms to proactively take in leisure guest
demand
• Renovation of common areas
Renovations centering on the lobby and restaurants converting them into spaces
where the attractiveness of the local area can be sensed by leisure guests
- Aim to start operation under a new brand in spring 2018 -
Operational results (May 2016 to April 2017) [Number of guest rooms: 237]
Occupancy ADR Sales
77.9% ¥9,797 ¥2,618 million
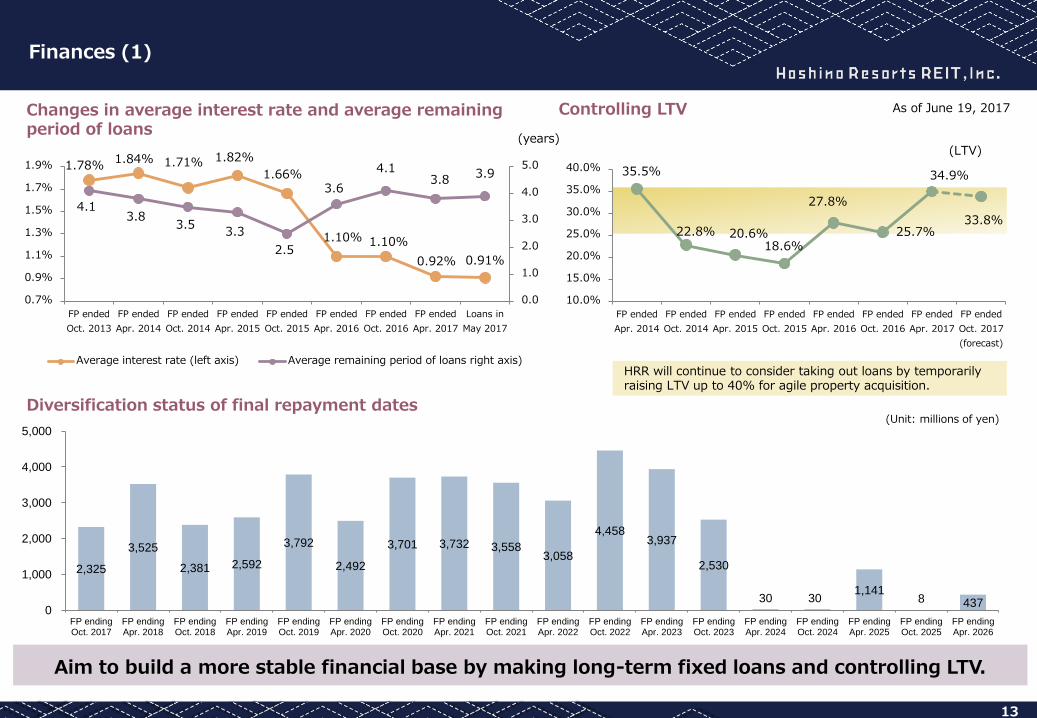
2,325
3,525
2,381 2,592
3,792
2,492
3,701 3,732 3,558 3,058
4,458 3,937
2,530
30 30 1,141
8 437 0
1,000
2,000
3,000
4,000
5,000
FP endingOct. 2017
FP endingApr. 2018
FP endingOct. 2018
FP endingApr. 2019
FP endingOct. 2019
FP endingApr. 2020
FP endingOct. 2020
FP endingApr. 2021
FP endingOct. 2021
FP endingApr. 2022
FP endingOct. 2022
FP endingApr. 2023
FP endingOct. 2023
FP endingApr. 2024
FP endingOct. 2024
FP endingApr. 2025
FP endingOct. 2025
FP endingApr. 2026
1.78% 1.84% 1.71% 1.82%
1.66%
1.10% 1.10%
0.92% 0.91%
4.1 3.8
3.5 3.3
2.5
3.6
4.1 3.8
3.9
0.0
1.0
2.0
3.0
4.0
5.0
0.7%
0.9%
1.1%
1.3%
1.5%
1.7%
1.9%
FP ended
Oct. 2013
FP ended
Apr. 2014
FP ended
Oct. 2014
FP ended
Apr. 2015
FP ended
Oct. 2015
FP ended
Apr. 2016
FP ended
Oct. 2016
FP ended
Apr. 2017
Loans in
May 2017
Average interest rate (left axis) Average remaining period of loans right axis)
35.5%
22.8% 20.6% 18.6%
27.8%
25.7%
34.9%
33.8%
10.0%
15.0%
20.0%
25.0%
30.0%
35.0%
40.0%
FP ended
Apr. 2014
FP ended
Oct. 2014
FP ended
Apr. 2015
FP ended
Oct. 2015
FP ended
Apr. 2016
FP ended
Oct. 2016
FP ended
Apr. 2017
FP ended
Oct. 2017
(forecast)
13
Finances (1)
As of June 19, 2017 Controlling LTV
Diversification status of final repayment dates
(LTV)
Aim to build a more stable financial base by making long-term fixed loans and controlling LTV.
Changes in average interest rate and average remaining period of loans
(years)
(Unit: millions of yen)
HRR will continue to consider taking out loans by temporarily raising LTV up to 40% for agile property acquisition.
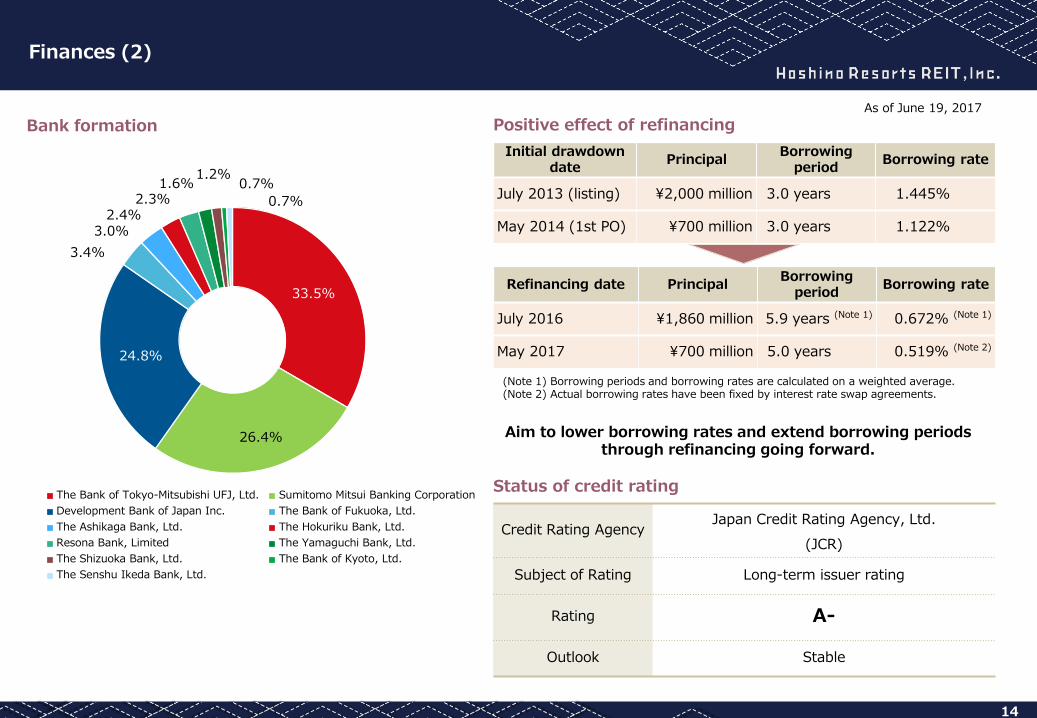
Credit Rating Agency Japan Credit Rating Agency, Ltd.
(JCR)
Subject of Rating Long-term issuer rating
Rating A-
Outlook Stable
14
Finances (2)
Status of credit rating
33.5%
26.4%
24.8%
3.4%
3.0% 2.4%
2.3% 1.6%
1.2% 0.7%
0.7%
The Bank of Tokyo-Mitsubishi UFJ, Ltd. Sumitomo Mitsui Banking Corporation
Development Bank of Japan Inc. The Bank of Fukuoka, Ltd.
The Ashikaga Bank, Ltd. The Hokuriku Bank, Ltd.
Resona Bank, Limited The Yamaguchi Bank, Ltd.
The Shizuoka Bank, Ltd. The Bank of Kyoto, Ltd.
The Senshu Ikeda Bank, Ltd.
Positive effect of refinancing Bank formation As of June 19, 2017
(Note 1) Borrowing periods and borrowing rates are calculated on a weighted average. (Note 2) Actual borrowing rates have been fixed by interest rate swap agreements.
Aim to lower borrowing rates and extend borrowing periods through refinancing going forward.
Initial drawdown date
Principal Borrowing
period Borrowing rate
July 2013 (listing) ¥2,000 million 3.0 years 1.445%
May 2014 (1st PO) ¥700 million 3.0 years 1.122%
Refinancing date Principal Borrowing
period Borrowing rate
July 2016 ¥1,860 million 5.9 years (Note 1) 0.672% (Note 1)
May 2017 ¥700 million 5.0 years 0.519% (Note 2)
II. Operational Results for Each Property
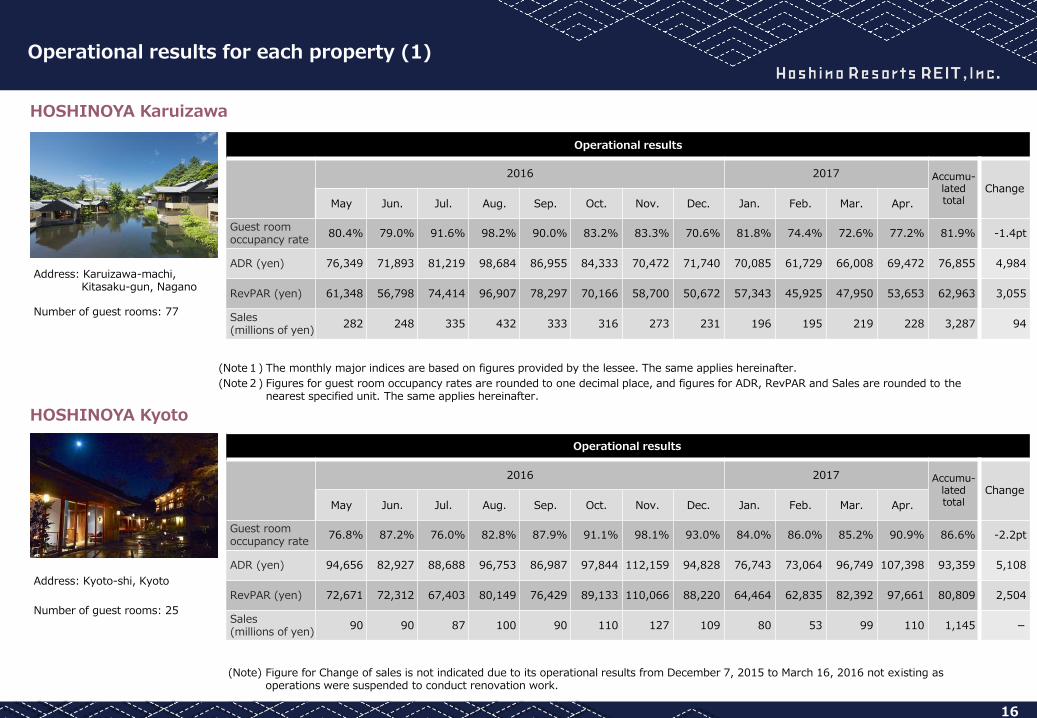
HOSHINOYA Karuizawa
Operational results
2016 2017 Accumu-lated total
Change
May Jun. Jul. Aug. Sep. Oct. Nov. Dec. Jan. Feb. Mar. Apr.
Guest room occupancy rate
80.4% 79.0% 91.6% 98.2% 90.0% 83.2% 83.3% 70.6% 81.8% 74.4% 72.6% 77.2% 81.9% -1.4pt
ADR (yen) 76,349 71,893 81,219 98,684 86,955 84,333 70,472 71,740 70,085 61,729 66,008 69,472 76,855 4,984
RevPAR (yen) 61,348 56,798 74,414 96,907 78,297 70,166 58,700 50,672 57,343 45,925 47,950 53,653 62,963 3,055
Sales (millions of yen)
282 248 335 432 333 316 273 231 196 195 219 228 3,287 94
16
Operational results for each property (1)
(Note1) The monthly major indices are based on figures provided by the lessee. The same applies hereinafter.
(Note2) Figures for guest room occupancy rates are rounded to one decimal place, and figures for ADR, RevPAR and Sales are rounded to the nearest specified unit. The same applies hereinafter.
HOSHINOYA Kyoto
Operational results
2016 2017 Accumu-lated total
Change
May Jun. Jul. Aug. Sep. Oct. Nov. Dec. Jan. Feb. Mar. Apr.
Guest room occupancy rate
76.8% 87.2% 76.0% 82.8% 87.9% 91.1% 98.1% 93.0% 84.0% 86.0% 85.2% 90.9% 86.6% -2.2pt
ADR (yen) 94,656 82,927 88,688 96,753 86,987 97,844 112,159 94,828 76,743 73,064 96,749 107,398 93,359 5,108
RevPAR (yen) 72,671 72,312 67,403 80,149 76,429 89,133 110,066 88,220 64,464 62,835 82,392 97,661 80,809 2,504
Sales (millions of yen)
90 90 87 100 90 110 127 109 80 53 99 110 1,145 -
Address: Karuizawa-machi, Kitasaku-gun, Nagano
Number of guest rooms: 77
Address: Kyoto-shi, Kyoto
Number of guest rooms: 25
(Note) Figure for Change of sales is not indicated due to its operational results from December 7, 2015 to March 16, 2016 not existing as operations were suspended to conduct renovation work.
17
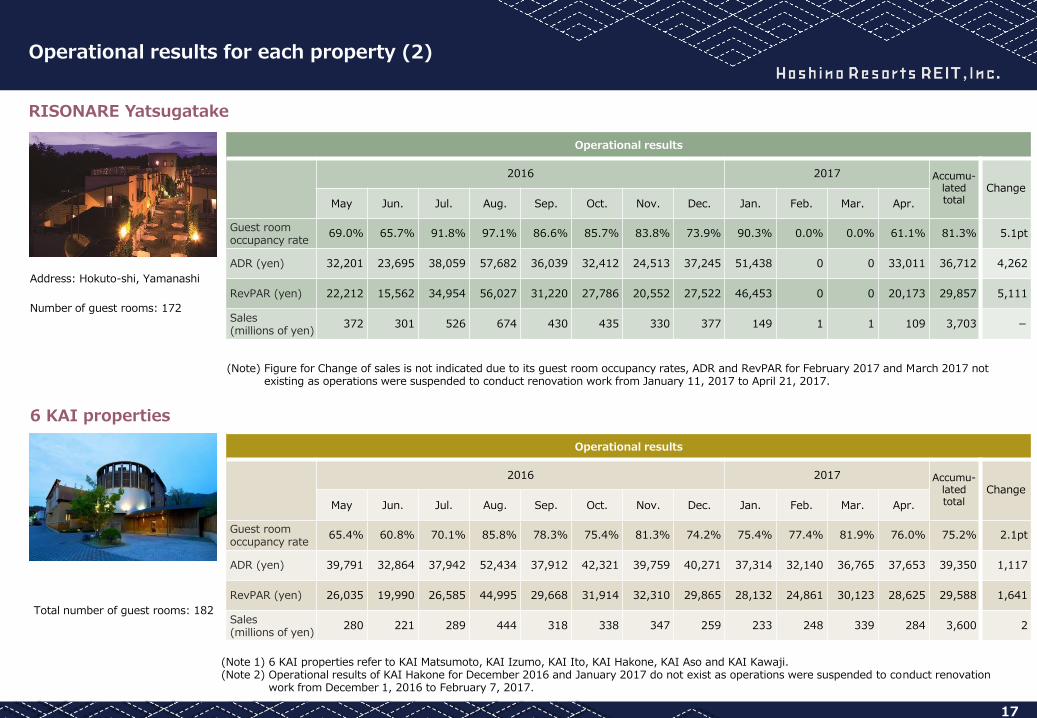
Operational results for each property (2)
Operational results
2016 2017 Accumu-lated total
Change
May Jun. Jul. Aug. Sep. Oct. Nov. Dec. Jan. Feb. Mar. Apr.
Guest room occupancy rate
69.0% 65.7% 91.8% 97.1% 86.6% 85.7% 83.8% 73.9% 90.3% 0.0% 0.0% 61.1% 81.3% 5.1pt
ADR (yen) 32,201 23,695 38,059 57,682 36,039 32,412 24,513 37,245 51,438 0 0 33,011 36,712 4,262
RevPAR (yen) 22,212 15,562 34,954 56,027 31,220 27,786 20,552 27,522 46,453 0 0 20,173 29,857 5,111
Sales (millions of yen)
372 301 526 674 430 435 330 377 149 1 1 109 3,703 -
RISONARE Yatsugatake
6 KAI properties
Operational results
2016 2017 Accumu-lated total
Change
May Jun. Jul. Aug. Sep. Oct. Nov. Dec. Jan. Feb. Mar. Apr.
Guest room occupancy rate
65.4% 60.8% 70.1% 85.8% 78.3% 75.4% 81.3% 74.2% 75.4% 77.4% 81.9% 76.0% 75.2% 2.1pt
ADR (yen) 39,791 32,864 37,942 52,434 37,912 42,321 39,759 40,271 37,314 32,140 36,765 37,653 39,350 1,117
RevPAR (yen) 26,035 19,990 26,585 44,995 29,668 31,914 32,310 29,865 28,132 24,861 30,123 28,625 29,588 1,641
Sales (millions of yen)
280 221 289 444 318 338 347 259 233 248 339 284 3,600 2
(Note 1) 6 KAI properties refer to KAI Matsumoto, KAI Izumo, KAI Ito, KAI Hakone, KAI Aso and KAI Kawaji. (Note 2) Operational results of KAI Hakone for December 2016 and January 2017 do not exist as operations were suspended to conduct renovation
work from December 1, 2016 to February 7, 2017.
(Note) Figure for Change of sales is not indicated due to its guest room occupancy rates, ADR and RevPAR for February 2017 and March 2017 not existing as operations were suspended to conduct renovation work from January 11, 2017 to April 21, 2017.
Address: Hokuto-shi, Yamanashi
Number of guest rooms: 172
Total number of guest rooms: 182

18
Operational results for each property (3)
22 Solare properties
Operational results
2016 2017 Accumu-lated total
Change
May Jun. Jul. Aug. Sep. Oct. Nov. Dec. Jan. Feb. Mar. Apr.
Guest room occupancy rate
77.4% 77.6% 80.6% 85.4% 77.8% 82.7% 81.1% 75.2% 71.7% 80.8% 82.5% 79.1% 79.3% 0.5pt
ADR (yen) 5,948 5,454 5,859 6,845 5,761 5,761 5,537 5,623 5,465 5,410 5,731 5,621 5,766 128
RevPAR (yen) 4,602 4,232 4,720 5,846 4,479 4,763 4,489 4,229 3,919 4,369 4,727 4,448 4,573 129
Sales (millions of yen)
335 293 339 424 313 343 313 307 281 284 344 313 3,888 -
(Note) Sales of 22 Solare properties are indicated based on sales of 21 properties due to Chisun Inn Kagoshima Taniyama's (acquired in August 2015) operational results from May 2015 to July 2015 not existing. Thus, Figure for Change of sales is not indicated.
Operational results
2016 2017 Accumu-lated total
Change
May Jun. Jul. Aug. Sep. Oct. Nov. Dec. Jan. Feb. Mar. Apr.
Guest room occupancy rate
82.3% 81.6% 81.2% 87.1% 86.0% 86.3% 89.1% 75.8% 66.6% 78.5% 85.4% 86.8% 82.2% -1.0pt
ADR (yen) 14,471 12,411 13,131 15,342 13,504 14,971 14,255 12,346 11,581 11,659 12,723 14,554 13,493 729
RevPAR (yen) 11,907 10,132 10,658 13,366 11,620 12,919 12,696 9,359 7,716 9,150 10,863 12,640 11,094 468
Sales (millions of yen)
1,299 1,260 1,193 1,137 1,144 1,342 1,338 1,327 1,012 944 1,304 1,256 14,555 102
4 ANA Crowne Plaza properties
Total number of guest rooms: 2,205
Total number of guest rooms: 1,229
19
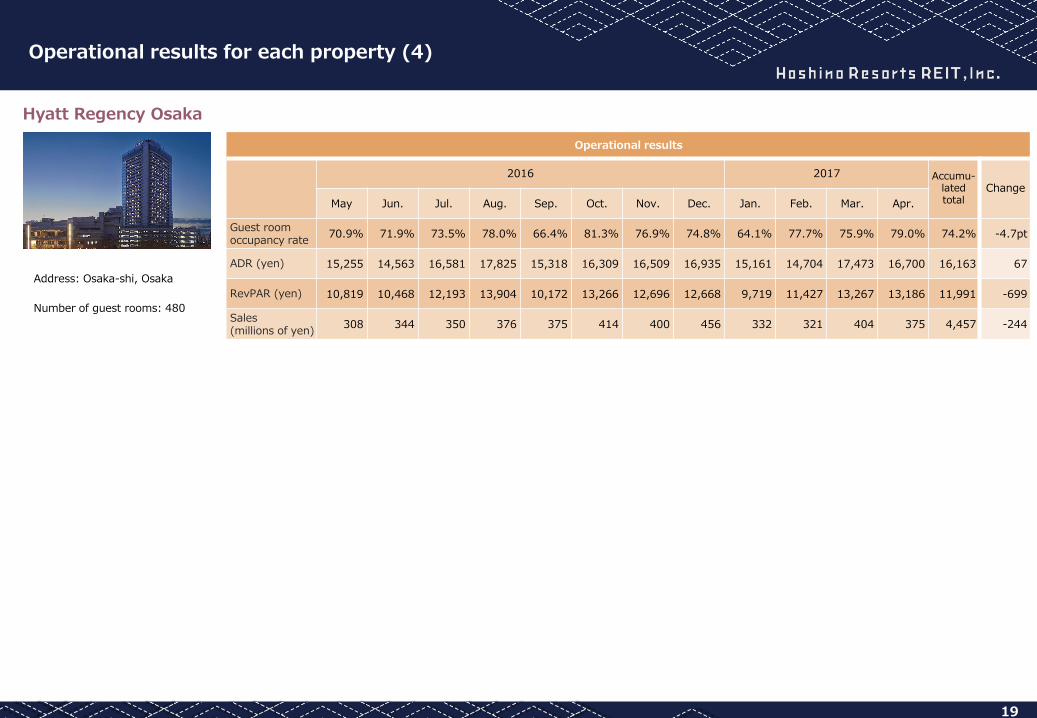
Operational results for each property (4)
Hyatt Regency Osaka
Operational results
2016 2017 Accumu-lated total
Change
May Jun. Jul. Aug. Sep. Oct. Nov. Dec. Jan. Feb. Mar. Apr.
Guest room occupancy rate
70.9% 71.9% 73.5% 78.0% 66.4% 81.3% 76.9% 74.8% 64.1% 77.7% 75.9% 79.0% 74.2% -4.7pt
ADR (yen) 15,255 14,563 16,581 17,825 15,318 16,309 16,509 16,935 15,161 14,704 17,473 16,700 16,163 67
RevPAR (yen) 10,819 10,468 12,193 13,904 10,172 13,266 12,696 12,668 9,719 11,427 13,267 13,186 11,991 -699
Sales (millions of yen)
308 344 350 376 375 414 400 456 332 321 404 375 4,457 -244
Address: Osaka-shi, Osaka
Number of guest rooms: 480
20
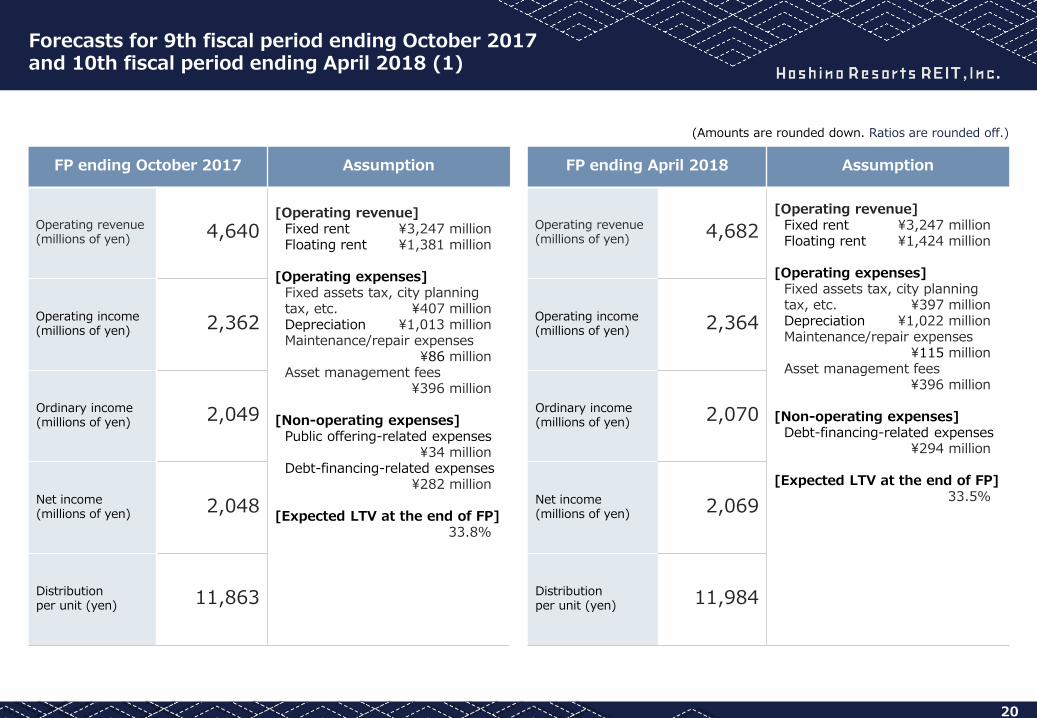
Forecasts for 9th fiscal period ending October 2017 and 10th fiscal period ending April 2018 (1)
(Amounts are rounded down. Ratios are rounded off.)
FP ending October 2017 Assumption FP ending April 2018 Assumption
Operating revenue (millions of yen) 4,640
[Operating revenue] Fixed rent ¥3,247 million Floating rent ¥1,381 million
[Operating expenses]
Fixed assets tax, city planning tax, etc. ¥407 million Depreciation ¥1,013 million Maintenance/repair expenses ¥86 million Asset management fees ¥396 million
[Non-operating expenses]
Public offering-related expenses ¥34 million Debt-financing-related expenses ¥282 million
[Expected LTV at the end of FP] 33.8%
Operating revenue (millions of yen) 4,682
[Operating revenue] Fixed rent ¥3,247 million Floating rent ¥1,424 million
[Operating expenses]
Fixed assets tax, city planning tax, etc. ¥397 million Depreciation ¥1,022 million Maintenance/repair expenses ¥115 million Asset management fees ¥396 million
[Non-operating expenses]
Debt-financing-related expenses ¥294 million
[Expected LTV at the end of FP] 33.5%
Operating income (millions of yen) 2,362 Operating income
(millions of yen) 2,364
Ordinary income (millions of yen) 2,049 Ordinary income
(millions of yen) 2,070
Net income (millions of yen) 2,048 Net income
(millions of yen) 2,069
Distribution per unit (yen) 11,863 Distribution
per unit (yen) 11,984
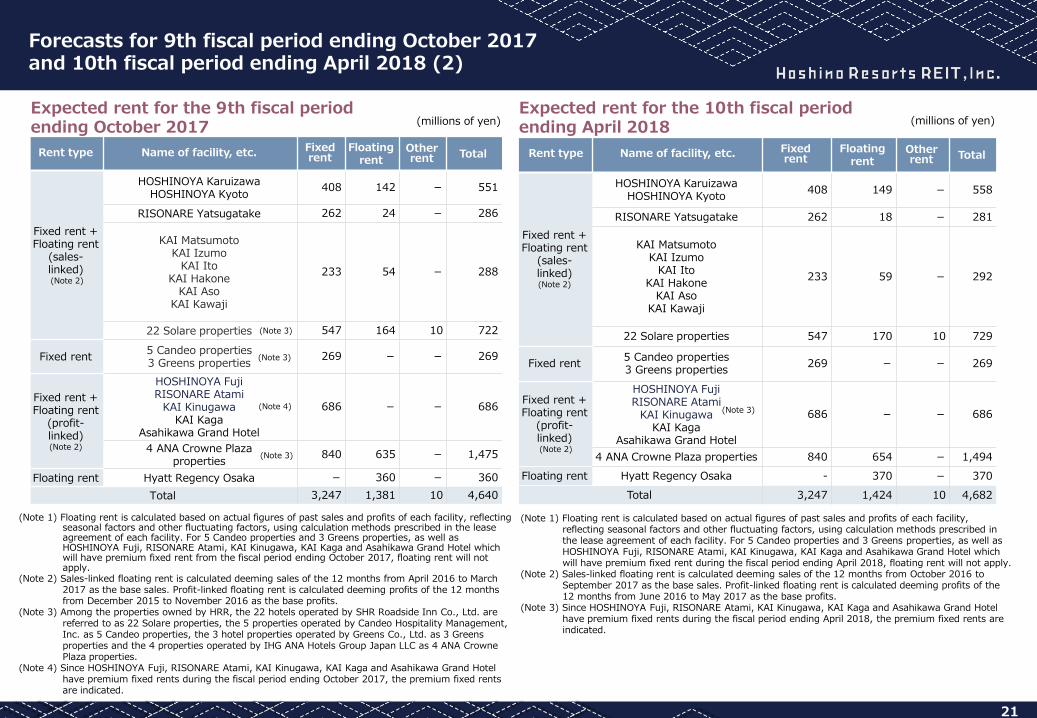
Rent type Name of facility, etc. Fixed rent
Floating rent
Other rent Total
Fixed rent + Floating rent
(sales-linked) (Note 2)
HOSHINOYA Karuizawa HOSHINOYA Kyoto
408 149 - 558
RISONARE Yatsugatake 262 18 - 281
KAI Matsumoto KAI Izumo
KAI Ito KAI Hakone
KAI Aso KAI Kawaji
233 59 - 292
22 Solare properties 547 170 10 729
Fixed rent 5 Candeo properties 3 Greens properties
269 - - 269
Fixed rent + Floating rent
(profit-linked) (Note 2)
HOSHINOYA Fuji RISONARE Atami
KAI Kinugawa KAI Kaga
Asahikawa Grand Hotel
686 - - 686
4 ANA Crowne Plaza properties 840 654 - 1,494
Floating rent Hyatt Regency Osaka - 370 - 370
Total 3,247 1,424 10 4,682
Rent type Name of facility, etc. Fixed rent
Floating rent
Other rent Total
Fixed rent + Floating rent
(sales-linked) (Note 2)
HOSHINOYA Karuizawa HOSHINOYA Kyoto
408 142 - 551
RISONARE Yatsugatake 262 24 - 286
KAI Matsumoto KAI Izumo
KAI Ito KAI Hakone
KAI Aso KAI Kawaji
233 54 - 288
22 Solare properties 547 164 10 722
Fixed rent 5 Candeo properties 3 Greens properties
269 - - 269
Fixed rent + Floating rent
(profit-linked)
(Note 2)
HOSHINOYA Fuji RISONARE Atami
KAI Kinugawa KAI Kaga
Asahikawa Grand Hotel
686 - - 686
4 ANA Crowne Plaza properties
840 635 - 1,475
Floating rent Hyatt Regency Osaka - 360 - 360
Total 3,247 1,381 10 4,640
21
Forecasts for 9th fiscal period ending October 2017 and 10th fiscal period ending April 2018 (2)
Expected rent for the 9th fiscal period ending October 2017
Expected rent for the 10th fiscal period ending April 2018
(millions of yen) (millions of yen)
(Note 1) Floating rent is calculated based on actual figures of past sales and profits of each facility, reflecting seasonal factors and other fluctuating factors, using calculation methods prescribed in the lease agreement of each facility. For 5 Candeo properties and 3 Greens properties, as well as HOSHINOYA Fuji, RISONARE Atami, KAI Kinugawa, KAI Kaga and Asahikawa Grand Hotel which will have premium fixed rent from the fiscal period ending October 2017, floating rent will not apply.
(Note 2) Sales-linked floating rent is calculated deeming sales of the 12 months from April 2016 to March 2017 as the base sales. Profit-linked floating rent is calculated deeming profits of the 12 months from December 2015 to November 2016 as the base profits.
(Note 3) Among the properties owned by HRR, the 22 hotels operated by SHR Roadside Inn Co., Ltd. are referred to as 22 Solare properties, the 5 properties operated by Candeo Hospitality Management, Inc. as 5 Candeo properties, the 3 hotel properties operated by Greens Co., Ltd. as 3 Greens properties and the 4 properties operated by IHG ANA Hotels Group Japan LLC as 4 ANA Crowne Plaza properties.
(Note 4) Since HOSHINOYA Fuji, RISONARE Atami, KAI Kinugawa, KAI Kaga and Asahikawa Grand Hotel have premium fixed rents during the fiscal period ending October 2017, the premium fixed rents are indicated.
(Note 1) Floating rent is calculated based on actual figures of past sales and profits of each facility, reflecting seasonal factors and other fluctuating factors, using calculation methods prescribed in the lease agreement of each facility. For 5 Candeo properties and 3 Greens properties, as well as HOSHINOYA Fuji, RISONARE Atami, KAI Kinugawa, KAI Kaga and Asahikawa Grand Hotel which will have premium fixed rent during the fiscal period ending April 2018, floating rent will not apply.
(Note 2) Sales-linked floating rent is calculated deeming sales of the 12 months from October 2016 to September 2017 as the base sales. Profit-linked floating rent is calculated deeming profits of the 12 months from June 2016 to May 2017 as the base profits.
(Note 3) Since HOSHINOYA Fuji, RISONARE Atami, KAI Kinugawa, KAI Kaga and Asahikawa Grand Hotel have premium fixed rents during the fiscal period ending April 2018, the premium fixed rents are indicated.
(Note 3)
(Note 3)
(Note 3)
(Note 3)
(Note 4)
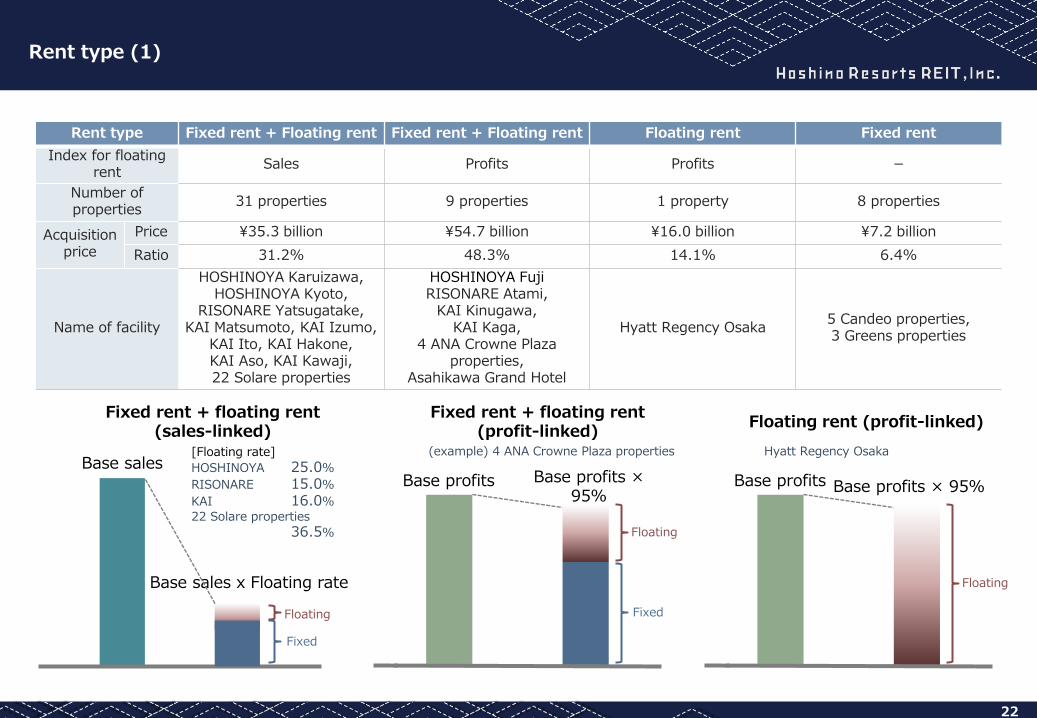
Rent type Fixed rent + Floating rent Fixed rent + Floating rent Floating rent Fixed rent
Index for floating rent
Sales Profits Profits -
Number of properties
31 properties 9 properties 1 property 8 properties
Acquisition price
Price ¥35.3 billion ¥54.7 billion ¥16.0 billion ¥7.2 billion
Ratio 31.2% 48.3% 14.1% 6.4%
Name of facility
HOSHINOYA Karuizawa, HOSHINOYA Kyoto,
RISONARE Yatsugatake, KAI Matsumoto, KAI Izumo,
KAI Ito, KAI Hakone, KAI Aso, KAI Kawaji, 22 Solare properties
HOSHINOYA Fuji RISONARE Atami,
KAI Kinugawa, KAI Kaga,
4 ANA Crowne Plaza properties,
Asahikawa Grand Hotel
Hyatt Regency Osaka 5 Candeo properties, 3 Greens properties
Fixed rent + floating rent (sales-linked)
Fixed rent + floating rent (profit-linked)
Floating
Fixed
Base profits × 95%
Base profits Base sales
Base sales x Floating rate
Floating
Fixed
[Floating rate]
HOSHINOYA 25.0%
RISONARE 15.0%
KAI 16.0%
22 Solare properties
36.5%
(example) 4 ANA Crowne Plaza properties
22
Rent type (1)
Floating rent (profit-linked)
Floating
Base profits × 95% Base profits
Hyatt Regency Osaka
2015 2016 2017 2018
May
Jun.
Jul.
Aug.
Sep.
Oct.
Nov.
Dec.
Jan.
Feb.
Mar.
Apr.
May
Jun.
Jul.
Aug.
Sep.
Oct.
Nov.
Dec.
Jan.
Feb.
Mar.
Apr.
May
Jun.
Jul.
Aug.
Sep.
Oct.
Nov.
Dec.
Jan.
Feb.
Mar.
Apr.
May
Jun.
Jul.
Aug.
Sep.
Oct.
5th FP 6th FP 7th FP 8th FP 9th FP 10th FP 11th FP
12th FP base sales
23
Rent type (2)
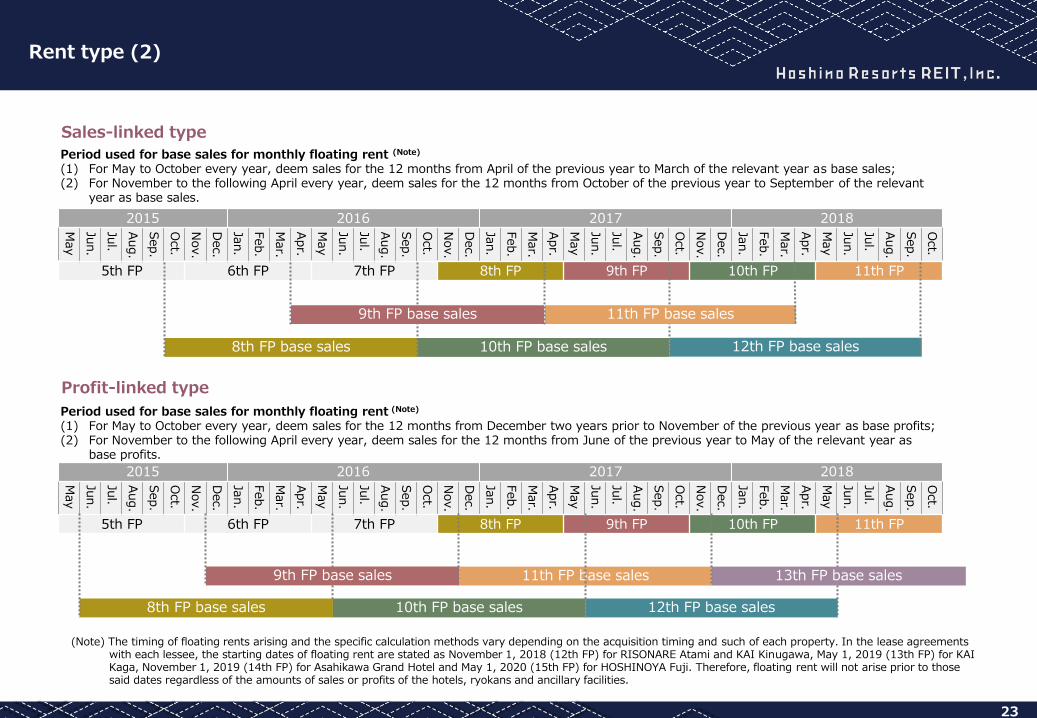
Period used for base sales for monthly floating rent (Note)
(1) For May to October every year, deem sales for the 12 months from April of the previous year to March of the relevant year as base sales; (2) For November to the following April every year, deem sales for the 12 months from October of the previous year to September of the relevant
year as base sales.
2015 2016 2017 2018
May
Jun.
Jul.
Aug.
Sep.
Oct.
Nov.
Dec.
Jan.
Feb.
Mar.
Apr.
May
Jun.
Jul.
Aug.
Sep.
Oct.
Nov.
Dec.
Jan.
Feb.
Mar.
Apr.
May
Jun.
Jul.
Aug.
Sep.
Oct.
Nov.
Dec.
Jan.
Feb.
Mar.
Apr.
May
Jun.
Jul.
Aug.
Sep.
Oct.
5th FP 6th FP 7th FP 8th FP 9th FP 10th FP 11th FP
Sales-linked type
Profit-linked type
Period used for base sales for monthly floating rent (Note)
(1) For May to October every year, deem sales for the 12 months from December two years prior to November of the previous year as base profits; (2) For November to the following April every year, deem sales for the 12 months from June of the previous year to May of the relevant year as
base profits.
(Note) The timing of floating rents arising and the specific calculation methods vary depending on the acquisition timing and such of each property. In the lease agreements with each lessee, the starting dates of floating rent are stated as November 1, 2018 (12th FP) for RISONARE Atami and KAI Kinugawa, May 1, 2019 (13th FP) for KAI Kaga, November 1, 2019 (14th FP) for Asahikawa Grand Hotel and May 1, 2020 (15th FP) for HOSHINOYA Fuji. Therefore, floating rent will not arise prior to those said dates regardless of the amounts of sales or profits of the hotels, ryokans and ancillary facilities.
8th FP base sales 10th FP base sales
9th FP base sales
12th FP base sales 8th FP base sales 10th FP base sales
13th FP base sales 9th FP base sales 11th FP base sales
11th FP base sales

III. Future Management Policy
25
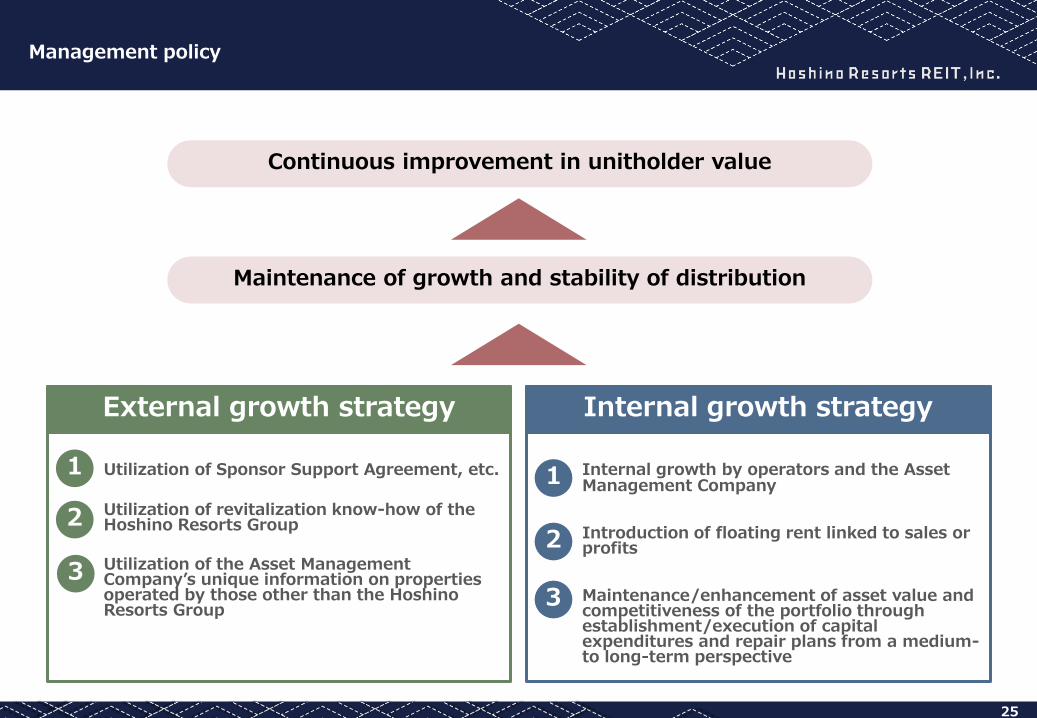
Management policy
Utilization of Sponsor Support Agreement, etc.
Utilization of revitalization know-how of the Hoshino Resorts Group
Utilization of the Asset Management Company’s unique information on properties operated by those other than the Hoshino Resorts Group
External growth strategy
1
2
3
Maintenance of growth and stability of distribution
Continuous improvement in unitholder value
Internal growth by operators and the Asset Management Company
Introduction of floating rent linked to sales or profits
Maintenance/enhancement of asset value and competitiveness of the portfolio through establishment/execution of capital expenditures and repair plans from a medium- to long-term perspective
Internal growth strategy
1
2
3
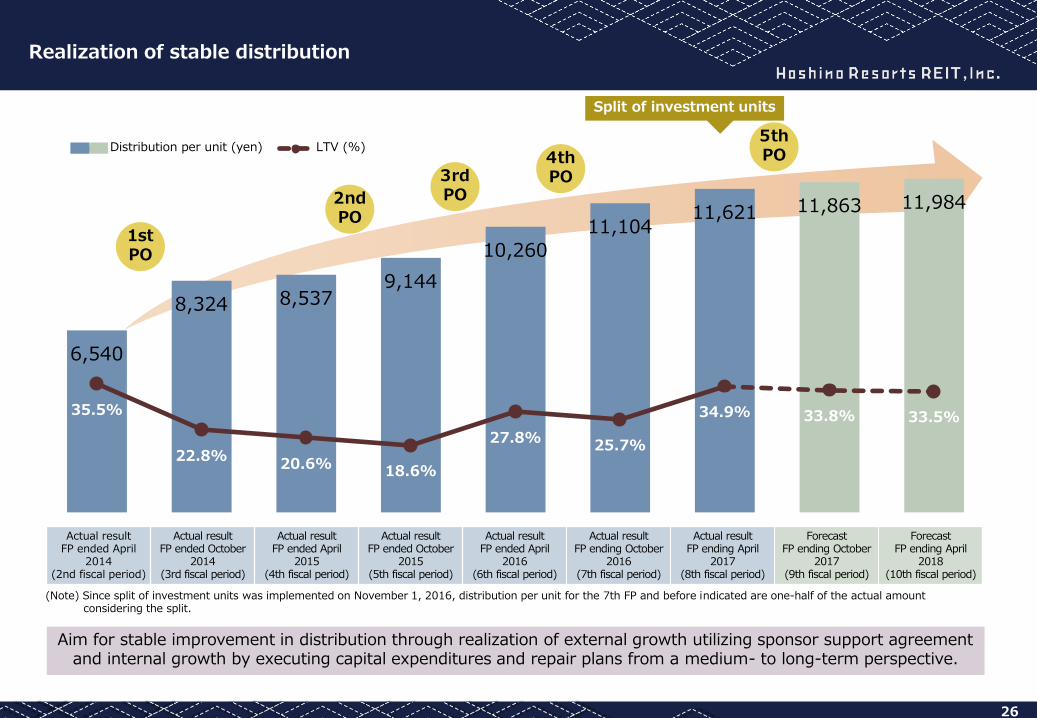
6,540
8,324 8,537 9,144
10,260
11,104 11,621 11,863 11,984
35.5%
22.8% 20.6% 18.6%
27.8% 25.7%
34.9% 33.8% 33.5%
0
0.1
0.2
0.3
0.4
0.5
0.6
0.7
0.8
0.9
1
0
2,000
4,000
6,000
8,000
10,000
12,000
Distribution per unit (yen) LTV (%)
Actual result FP ended April
2014 (2nd fiscal period)
Actual result FP ended October
2014 (3rd fiscal period)
Actual result FP ended April
2015 (4th fiscal period)
Actual result FP ended October
2015 (5th fiscal period)
Actual result FP ended April
2016 (6th fiscal period)
Actual result FP ending October
2016 (7th fiscal period)
Actual result FP ending April
2017 (8th fiscal period)
Forecast FP ending October
2017 (9th fiscal period)
Forecast FP ending April
2018 (10th fiscal period)
Aim for stable improvement in distribution through realization of external growth utilizing sponsor support agreement and internal growth by executing capital expenditures and repair plans from a medium- to long-term perspective.
2nd PO
3rd PO
1st PO
26
Realization of stable distribution
4th PO
Split of investment units
(Note) Since split of investment units was implemented on November 1, 2016, distribution per unit for the 7th FP and before indicated are one-half of the actual amount considering the split.
5thPO
27
Market trend and strategy for differentiation
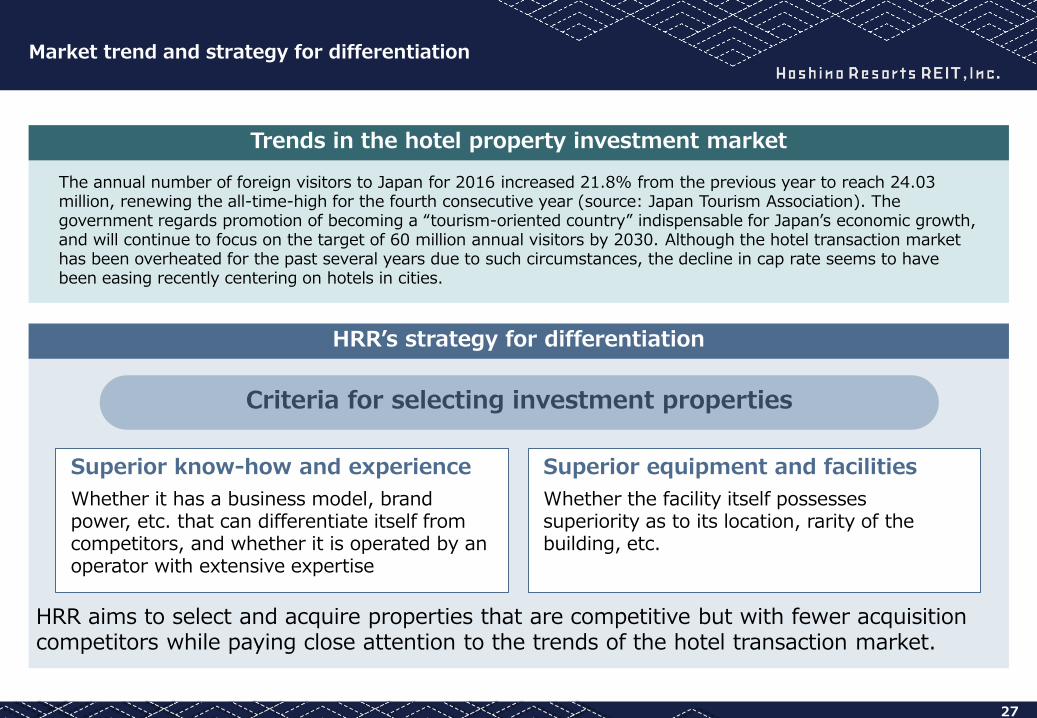
The annual number of foreign visitors to Japan for 2016 increased 21.8% from the previous year to reach 24.03 million, renewing the all-time-high for the fourth consecutive year (source: Japan Tourism Association). The government regards promotion of becoming a “tourism-oriented country” indispensable for Japan’s economic growth, and will continue to focus on the target of 60 million annual visitors by 2030. Although the hotel transaction market has been overheated for the past several years due to such circumstances, the decline in cap rate seems to have been easing recently centering on hotels in cities.
HRR aims to select and acquire properties that are competitive but with fewer acquisition competitors while paying close attention to the trends of the hotel transaction market.
Trends in the hotel property investment market
HRR’s strategy for differentiation
Superior know-how and experience
Whether it has a business model, brand power, etc. that can differentiate itself from competitors, and whether it is operated by an operator with extensive expertise
Superior equipment and facilities
Whether the facility itself possesses superiority as to its location, rarity of the building, etc.
Criteria for selecting investment properties
28
External growth
[Measures for realization of external growth]
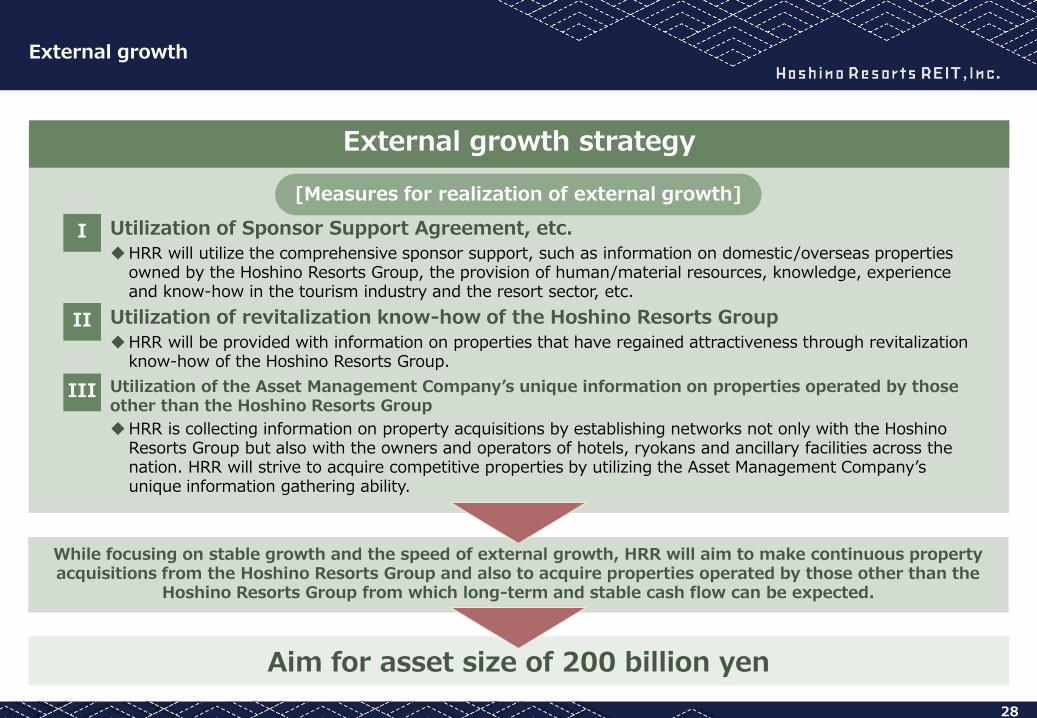
External growth strategy
I Utilization of Sponsor Support Agreement, etc.
HRR will utilize the comprehensive sponsor support, such as information on domestic/overseas properties owned by the Hoshino Resorts Group, the provision of human/material resources, knowledge, experience and know-how in the tourism industry and the resort sector, etc.
II Utilization of revitalization know-how of the Hoshino Resorts Group
HRR will be provided with information on properties that have regained attractiveness through revitalization know-how of the Hoshino Resorts Group.
III Utilization of the Asset Management Company’s unique information on properties operated by those other than the Hoshino Resorts Group
HRR is collecting information on property acquisitions by establishing networks not only with the Hoshino Resorts Group but also with the owners and operators of hotels, ryokans and ancillary facilities across the nation. HRR will strive to acquire competitive properties by utilizing the Asset Management Company’s unique information gathering ability.
Aim for asset size of 200 billion yen
While focusing on stable growth and the speed of external growth, HRR will aim to make continuous property acquisitions from the Hoshino Resorts Group and also to acquire properties operated by those other than the
Hoshino Resorts Group from which long-term and stable cash flow can be expected.
29
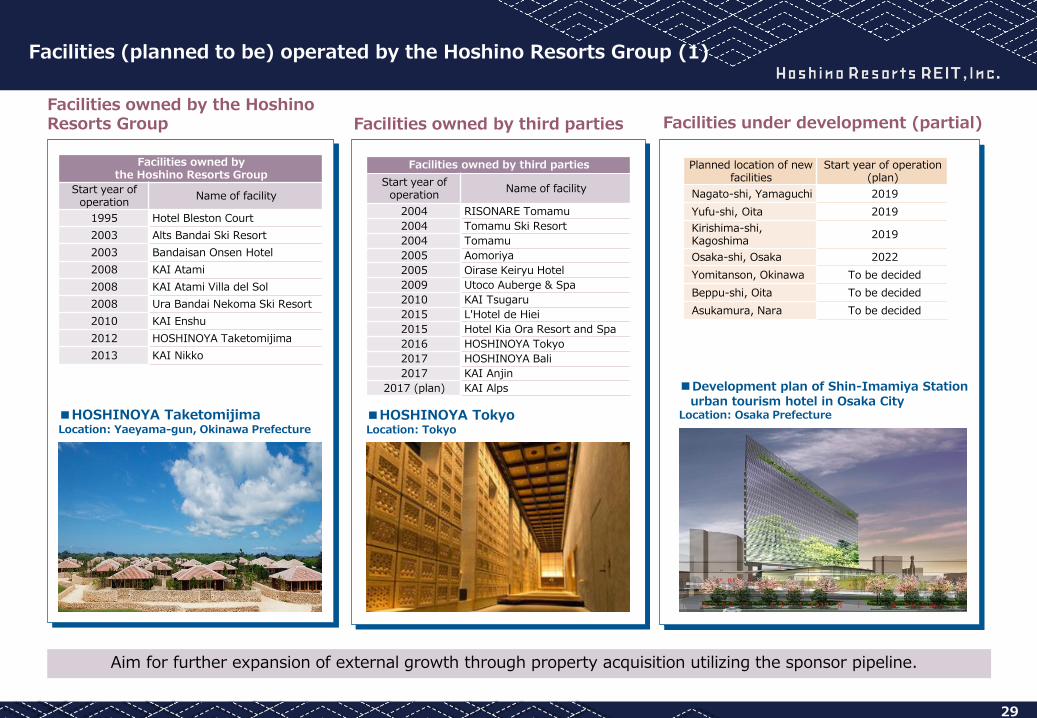
Facilities (planned to be) operated by the Hoshino Resorts Group (1)
Facilities under development (partial) Facilities owned by the Hoshino Resorts Group
Aim for further expansion of external growth through property acquisition utilizing the sponsor pipeline.
Facilities owned by third parties
■HOSHINOYA Taketomijima Location: Yaeyama-gun, Okinawa Prefecture
Facilities owned by the Hoshino Resorts Group
Start year of operation
Name of facility
1995 Hotel Bleston Court
2003 Alts Bandai Ski Resort
2003 Bandaisan Onsen Hotel
2008 KAI Atami
2008 KAI Atami Villa del Sol
2008 Ura Bandai Nekoma Ski Resort
2010 KAI Enshu
2012 HOSHINOYA Taketomijima
2013 KAI Nikko
Facilities owned by third parties
Start year of operation
Name of facility
2004 RISONARE Tomamu
2004 Tomamu Ski Resort
2004 Tomamu
2005 Aomoriya
2005 Oirase Keiryu Hotel
2009 Utoco Auberge & Spa
2010 KAI Tsugaru
2015 L'Hotel de Hiei
2015 Hotel Kia Ora Resort and Spa
2016 HOSHINOYA Tokyo
2017 HOSHINOYA Bali
2017 KAI Anjin
2017 (plan) KAI Alps
■HOSHINOYA Tokyo Location: Tokyo
■Development plan of Shin-Imamiya Station urban tourism hotel in Osaka City
Location: Osaka Prefecture
Planned location of new facilities
Start year of operation (plan)
Nagato-shi, Yamaguchi 2019
Yufu-shi, Oita 2019
Kirishima-shi, Kagoshima
2019
Osaka-shi, Osaka 2022
Yomitanson, Okinawa To be decided
Beppu-shi, Oita To be decided
Asukamura, Nara To be decided
30
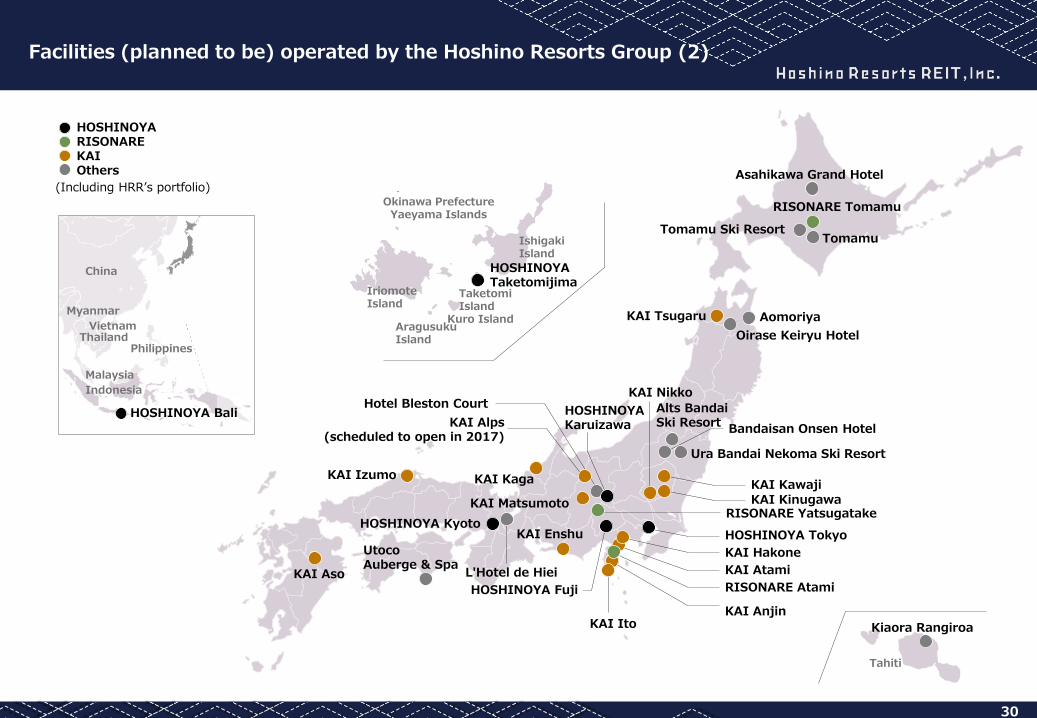
Facilities (planned to be) operated by the Hoshino Resorts Group (2)
RISONARE Tomamu
Tomamu Ski Resort Tomamu
Aomoriya
Oirase Keiryu Hotel
KAI Tsugaru
Alts Bandai Ski Resort
Ura Bandai Nekoma Ski Resort
Bandaisan Onsen Hotel
KAI Kawaji KAI Kinugawa
RISONARE Yatsugatake
HOSHINOYA Tokyo
KAI Hakone
KAI Atami
RISONARE Atami
KAI Anjin KAI Ito
HOSHINOYA Kyoto KAI Enshu
L'Hotel de Hiei
Utoco Auberge & Spa
KAI Aso
KAI Izumo
HOSHINOYA Fuji
KAI Matsumoto
KAI Kaga
KAI Nikko
HOSHINOYA Karuizawa KAI Alps
(scheduled to open in 2017)
Hotel Bleston Court
Kiaora Rangiroa
Tahiti
HOSHINOYA Taketomijima
Taketomi Island
Ishigaki Island
Kuro Island Aragusuku Island
Iriomote Island
Okinawa Prefecture Yaeyama Islands
China
Myanmar
Thailand Vietnam
Malaysia
Indonesia
HOSHINOYA Bali
Philippines
HOSHINOYA RISONARE KAI Others
(Including HRR’s portfolio) Asahikawa Grand Hotel
31
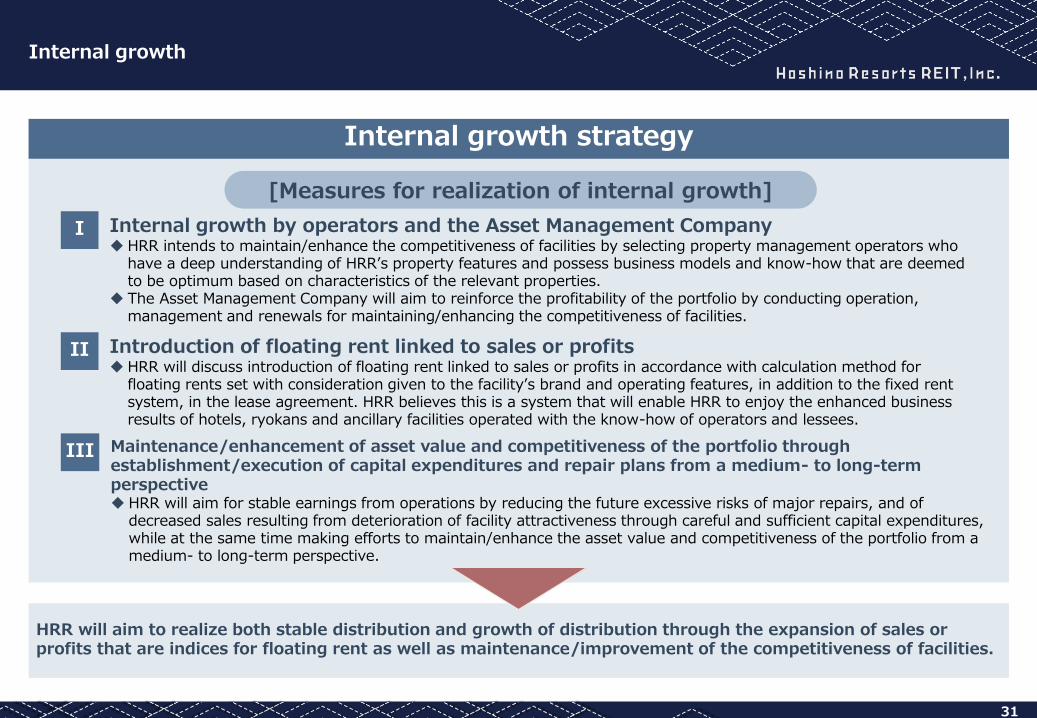
Internal growth
HRR will aim to realize both stable distribution and growth of distribution through the expansion of sales or profits that are indices for floating rent as well as maintenance/improvement of the competitiveness of facilities.
Internal growth strategy
[Measures for realization of internal growth]
I Internal growth by operators and the Asset Management Company HRR intends to maintain/enhance the competitiveness of facilities by selecting property management operators who
have a deep understanding of HRR’s property features and possess business models and know-how that are deemed to be optimum based on characteristics of the relevant properties.
The Asset Management Company will aim to reinforce the profitability of the portfolio by conducting operation, management and renewals for maintaining/enhancing the competitiveness of facilities.
II Introduction of floating rent linked to sales or profits HRR will discuss introduction of floating rent linked to sales or profits in accordance with calculation method for
floating rents set with consideration given to the facility’s brand and operating features, in addition to the fixed rent system, in the lease agreement. HRR believes this is a system that will enable HRR to enjoy the enhanced business results of hotels, ryokans and ancillary facilities operated with the know-how of operators and lessees.
III Maintenance/enhancement of asset value and competitiveness of the portfolio through establishment/execution of capital expenditures and repair plans from a medium- to long-term perspective HRR will aim for stable earnings from operations by reducing the future excessive risks of major repairs, and of
decreased sales resulting from deterioration of facility attractiveness through careful and sufficient capital expenditures, while at the same time making efforts to maintain/enhance the asset value and competitiveness of the portfolio from a medium- to long-term perspective.
Measures for internal growth and their effect
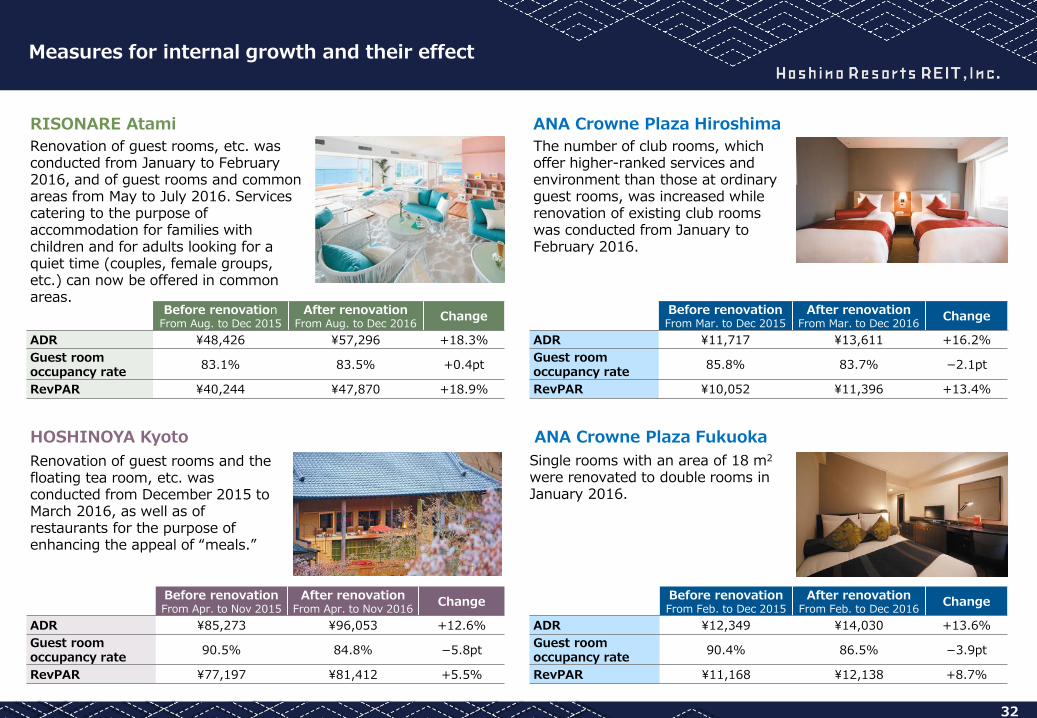
RISONARE Atami
Renovation of guest rooms, etc. was conducted from January to February 2016, and of guest rooms and common areas from May to July 2016. Services catering to the purpose of accommodation for families with children and for adults looking for a quiet time (couples, female groups, etc.) can now be offered in common areas.
Before renovation From Aug. to Dec 2015
After renovation From Aug. to Dec 2016
Change
ADR ¥48,426 ¥57,296 +18.3%
Guest room occupancy rate
83.1% 83.5% +0.4pt
RevPAR ¥40,244 ¥47,870 +18.9%
HOSHINOYA Kyoto
Renovation of guest rooms and the floating tea room, etc. was conducted from December 2015 to March 2016, as well as of restaurants for the purpose of enhancing the appeal of “meals.”
Before renovation From Apr. to Nov 2015
After renovation From Apr. to Nov 2016
Change
ADR ¥85,273 ¥96,053 +12.6%
Guest room occupancy rate
90.5% 84.8% −5.8pt
RevPAR ¥77,197 ¥81,412 +5.5%
ANA Crowne Plaza Hiroshima
The number of club rooms, which offer higher-ranked services and environment than those at ordinary guest rooms, was increased while renovation of existing club rooms was conducted from January to February 2016.
Single rooms with an area of 18 m2
were renovated to double rooms in January 2016.
Before renovation From Mar. to Dec 2015
After renovation From Mar. to Dec 2016
Change
ADR ¥11,717 ¥13,611 +16.2%
Guest room occupancy rate
85.8% 83.7% −2.1pt
RevPAR ¥10,052 ¥11,396 +13.4%
Before renovation From Feb. to Dec 2015
After renovation From Feb. to Dec 2016
Change
ADR ¥12,349 ¥14,030 +13.6%
Guest room occupancy rate
90.4% 86.5% −3.9pt
RevPAR ¥11,168 ¥12,138 +8.7%
ANA Crowne Plaza Fukuoka
32

IV. Appendix
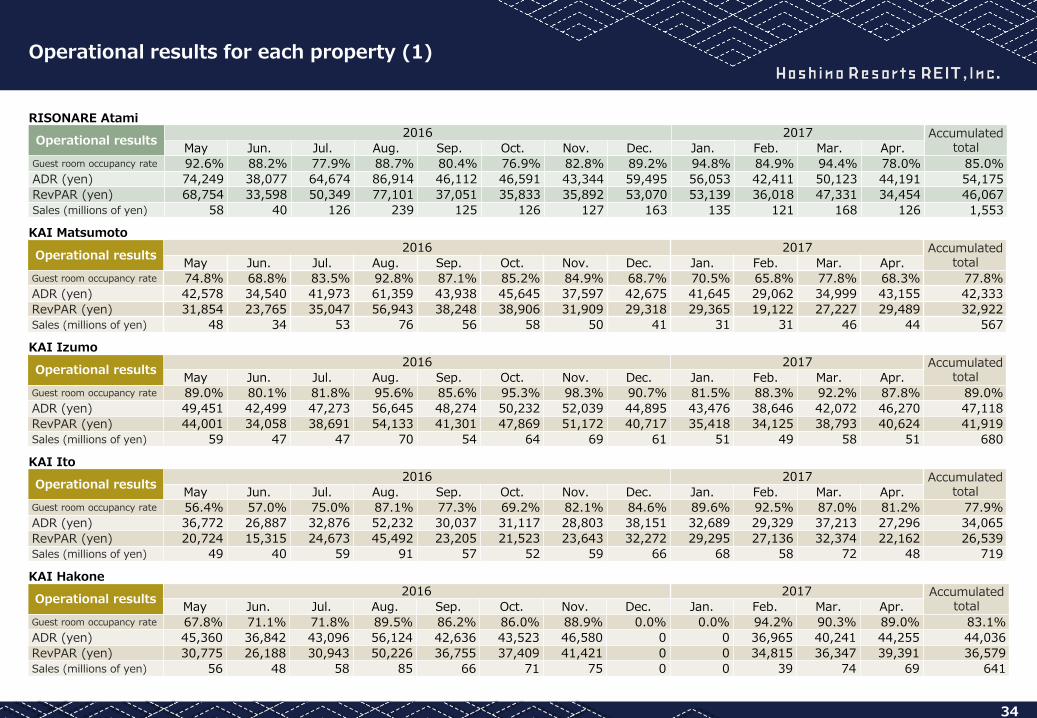
Operational results 2016 2017 Accumulated
total May Jun. Jul. Aug. Sep. Oct. Nov. Dec. Jan. Feb. Mar. Apr. Guest room occupancy rate 92.6% 88.2% 77.9% 88.7% 80.4% 76.9% 82.8% 89.2% 94.8% 84.9% 94.4% 78.0% 85.0%
ADR (yen) 74,249 38,077 64,674 86,914 46,112 46,591 43,344 59,495 56,053 42,411 50,123 44,191 54,175
RevPAR (yen) 68,754 33,598 50,349 77,101 37,051 35,833 35,892 53,070 53,139 36,018 47,331 34,454 46,067
Sales (millions of yen) 58 40 126 239 125 126 127 163 135 121 168 126 1,553
RISONARE Atami
34
Operational results for each property (1)
Operational results 2016 2017 Accumulated
total May Jun. Jul. Aug. Sep. Oct. Nov. Dec. Jan. Feb. Mar. Apr. Guest room occupancy rate 74.8% 68.8% 83.5% 92.8% 87.1% 85.2% 84.9% 68.7% 70.5% 65.8% 77.8% 68.3% 77.8%
ADR (yen) 42,578 34,540 41,973 61,359 43,938 45,645 37,597 42,675 41,645 29,062 34,999 43,155 42,333
RevPAR (yen) 31,854 23,765 35,047 56,943 38,248 38,906 31,909 29,318 29,365 19,122 27,227 29,489 32,922
Sales (millions of yen) 48 34 53 76 56 58 50 41 31 31 46 44 567
Operational results 2016 2017 Accumulated
total May Jun. Jul. Aug. Sep. Oct. Nov. Dec. Jan. Feb. Mar. Apr. Guest room occupancy rate 89.0% 80.1% 81.8% 95.6% 85.6% 95.3% 98.3% 90.7% 81.5% 88.3% 92.2% 87.8% 89.0%
ADR (yen) 49,451 42,499 47,273 56,645 48,274 50,232 52,039 44,895 43,476 38,646 42,072 46,270 47,118
RevPAR (yen) 44,001 34,058 38,691 54,133 41,301 47,869 51,172 40,717 35,418 34,125 38,793 40,624 41,919
Sales (millions of yen) 59 47 47 70 54 64 69 61 51 49 58 51 680
Operational results 2016 2017 Accumulated
total May Jun. Jul. Aug. Sep. Oct. Nov. Dec. Jan. Feb. Mar. Apr. Guest room occupancy rate 56.4% 57.0% 75.0% 87.1% 77.3% 69.2% 82.1% 84.6% 89.6% 92.5% 87.0% 81.2% 77.9%
ADR (yen) 36,772 26,887 32,876 52,232 30,037 31,117 28,803 38,151 32,689 29,329 37,213 27,296 34,065
RevPAR (yen) 20,724 15,315 24,673 45,492 23,205 21,523 23,643 32,272 29,295 27,136 32,374 22,162 26,539
Sales (millions of yen) 49 40 59 91 57 52 59 66 68 58 72 48 719
Operational results 2016 2017 Accumulated
total May Jun. Jul. Aug. Sep. Oct. Nov. Dec. Jan. Feb. Mar. Apr. Guest room occupancy rate 67.8% 71.1% 71.8% 89.5% 86.2% 86.0% 88.9% 0.0% 0.0% 94.2% 90.3% 89.0% 83.1%
ADR (yen) 45,360 36,842 43,096 56,124 42,636 43,523 46,580 0 0 36,965 40,241 44,255 44,036
RevPAR (yen) 30,775 26,188 30,943 50,226 36,755 37,409 41,421 0 0 34,815 36,347 39,391 36,579
Sales (millions of yen) 56 48 58 85 66 71 75 0 0 39 74 69 641
KAI Matsumoto
KAI Izumo
KAI Ito
KAI Hakone
Operational results 2016 2017 Accumulated
total May Jun. Jul. Aug. Sep. Oct. Nov. Dec. Jan. Feb. Mar. Apr. Guest room occupancy rate 55.3% 53.0% 60.1% 76.1% 70.6% 75.1% 72.4% 69.2% 65.9% 59.5% 66.1% 60.1% 65.4%
ADR (yen) 40,490 32,315 33,505 44,324 32,421 37,203 36,758 40,084 38,532 32,347 35,801 38,364 37,078
RevPAR (yen) 22,394 17,119 20,152 33,749 22,875 27,954 26,624 27,752 25,377 19,254 23,668 23,068 24,249
Sales (millions of yen) 64 48 62 93 70 79 79 75 74 55 68 62 829
KAI Kinugawa
35
Operational results for each property (2)
Operational results 2016 2017 Accumulated
total May Jun. Jul. Aug. Sep. Oct. Nov. Dec. Jan. Feb. Mar. Apr. Guest room occupancy rate 62.7% 51.7% 60.0% 82.3% 70.9% 63.7% 72.4% 64.9% 66.8% 63.5% 72.4% 66.7% 66.6%
ADR (yen) 28,347 23,195 26,907 39,471 25,775 35,372 30,975 31,135 29,217 24,102 26,074 23,715 29,141
RevPAR (yen) 17,763 11,997 16,138 32,468 18,265 22,546 22,428 20,217 19,515 15,303 18,880 15,827 19,395
Sales (millions of yen) 60 42 56 97 63 70 71 66 61 50 64 48 748
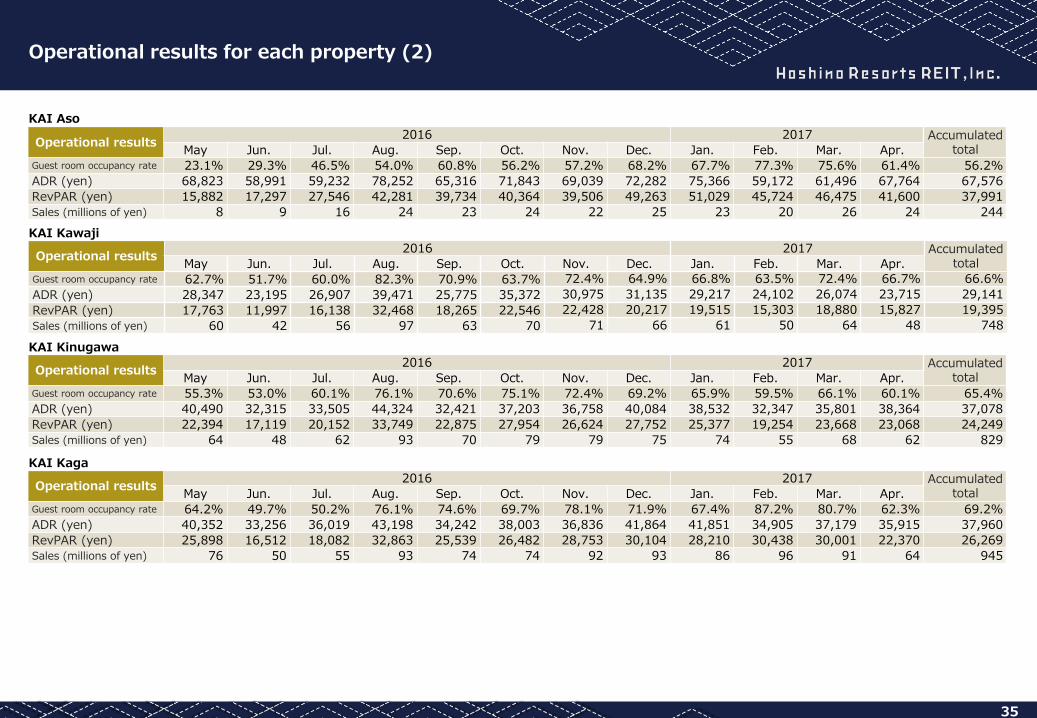
KAI Kawaji
Operational results 2016 2017 Accumulated
total May Jun. Jul. Aug. Sep. Oct. Nov. Dec. Jan. Feb. Mar. Apr. Guest room occupancy rate 23.1% 29.3% 46.5% 54.0% 60.8% 56.2% 57.2% 68.2% 67.7% 77.3% 75.6% 61.4% 56.2%
ADR (yen) 68,823 58,991 59,232 78,252 65,316 71,843 69,039 72,282 75,366 59,172 61,496 67,764 67,576
RevPAR (yen) 15,882 17,297 27,546 42,281 39,734 40,364 39,506 49,263 51,029 45,724 46,475 41,600 37,991
Sales (millions of yen) 8 9 16 24 23 24 22 25 23 20 26 24 244
KAI Aso
Operational results 2016 2017 Accumulated
total May Jun. Jul. Aug. Sep. Oct. Nov. Dec. Jan. Feb. Mar. Apr. Guest room occupancy rate 64.2% 49.7% 50.2% 76.1% 74.6% 69.7% 78.1% 71.9% 67.4% 87.2% 80.7% 62.3% 69.2%
ADR (yen) 40,352 33,256 36,019 43,198 34,242 38,003 36,836 41,864 41,851 34,905 37,179 35,915 37,960
RevPAR (yen) 25,898 16,512 18,082 32,863 25,539 26,482 28,753 30,104 28,210 30,438 30,001 22,370 26,269
Sales (millions of yen) 76 50 55 93 74 74 92 93 86 96 91 64 945
KAI Kaga
36
Operational results for each property (3)
Operational results 2016 2017 Accumulated
total May Jun. Jul. Aug. Sep. Oct. Nov. Dec. Jan. Feb. Mar. Apr. Guest room occupancy rate 78.9% 63.8% 76.6% 80.2% 62.5% 69.9% 76.1% 64.0% 61.6% 74.9% 71.8% 80.0% 71.7%
ADR (yen) 5,765 5,067 5,389 6,011 5,273 5,336 5,203 5,601 5,489 4,952 5,411 5,316 5,417
RevPAR (yen) 4,550 3,231 4,129 4,820 3,297 3,733 3,961 3,586 3,382 3,710 3,884 4,253 3,882
Sales (millions of yen) 14 9 13 15 10 10 10 11 10 10 12 12 136
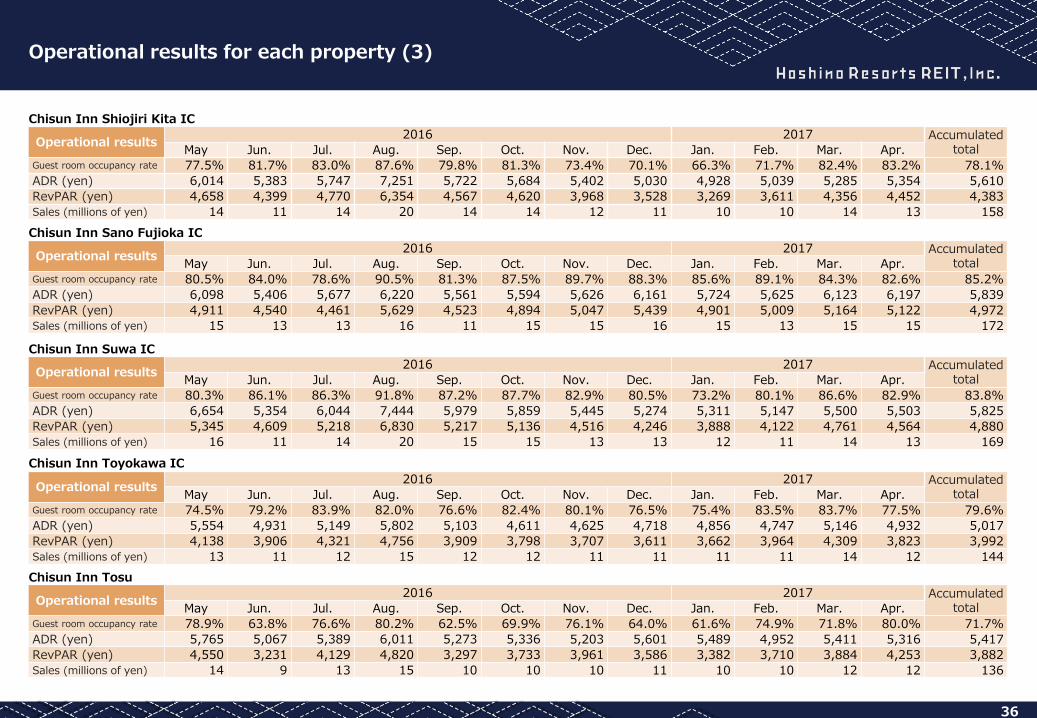
Chisun Inn Tosu
Operational results 2016 2017 Accumulated
total May Jun. Jul. Aug. Sep. Oct. Nov. Dec. Jan. Feb. Mar. Apr. Guest room occupancy rate 80.3% 86.1% 86.3% 91.8% 87.2% 87.7% 82.9% 80.5% 73.2% 80.1% 86.6% 82.9% 83.8%
ADR (yen) 6,654 5,354 6,044 7,444 5,979 5,859 5,445 5,274 5,311 5,147 5,500 5,503 5,825
RevPAR (yen) 5,345 4,609 5,218 6,830 5,217 5,136 4,516 4,246 3,888 4,122 4,761 4,564 4,880
Sales (millions of yen) 16 11 14 20 15 15 13 13 12 11 14 13 169
Operational results 2016 2017 Accumulated
total May Jun. Jul. Aug. Sep. Oct. Nov. Dec. Jan. Feb. Mar. Apr. Guest room occupancy rate 74.5% 79.2% 83.9% 82.0% 76.6% 82.4% 80.1% 76.5% 75.4% 83.5% 83.7% 77.5% 79.6%
ADR (yen) 5,554 4,931 5,149 5,802 5,103 4,611 4,625 4,718 4,856 4,747 5,146 4,932 5,017
RevPAR (yen) 4,138 3,906 4,321 4,756 3,909 3,798 3,707 3,611 3,662 3,964 4,309 3,823 3,992
Sales (millions of yen) 13 11 12 15 12 12 11 11 11 11 14 12 144
Chisun Inn Suwa IC
Chisun Inn Toyokawa IC
Operational results 2016 2017 Accumulated
total May Jun. Jul. Aug. Sep. Oct. Nov. Dec. Jan. Feb. Mar. Apr. Guest room occupancy rate 77.5% 81.7% 83.0% 87.6% 79.8% 81.3% 73.4% 70.1% 66.3% 71.7% 82.4% 83.2% 78.1%
ADR (yen) 6,014 5,383 5,747 7,251 5,722 5,684 5,402 5,030 4,928 5,039 5,285 5,354 5,610
RevPAR (yen) 4,658 4,399 4,770 6,354 4,567 4,620 3,968 3,528 3,269 3,611 4,356 4,452 4,383
Sales (millions of yen) 14 11 14 20 14 14 12 11 10 10 14 13 158
Operational results 2016 2017 Accumulated
total May Jun. Jul. Aug. Sep. Oct. Nov. Dec. Jan. Feb. Mar. Apr. Guest room occupancy rate 80.5% 84.0% 78.6% 90.5% 81.3% 87.5% 89.7% 88.3% 85.6% 89.1% 84.3% 82.6% 85.2%
ADR (yen) 6,098 5,406 5,677 6,220 5,561 5,594 5,626 6,161 5,724 5,625 6,123 6,197 5,839
RevPAR (yen) 4,911 4,540 4,461 5,629 4,523 4,894 5,047 5,439 4,901 5,009 5,164 5,122 4,972
Sales (millions of yen) 15 13 13 16 11 15 15 16 15 13 15 15 172
Chisun Inn Shiojiri Kita IC
Chisun Inn Sano Fujioka IC
Operational results 2016 2017 Accumulated
total May Jun. Jul. Aug. Sep. Oct. Nov. Dec. Jan. Feb. Mar. Apr. Guest room occupancy rate 82.2% 80.3% 86.1% 88.1% 84.5% 90.1% 90.4% 84.1% 77.9% 82.6% 88.9% 86.7% 85.2%
ADR (yen) 5,987 5,597 5,715 6,105 5,623 5,563 5,495 5,326 5,293 5,403 5,247 5,318 5,559
RevPAR (yen) 4,921 4,497 4,919 5,375 4,751 5,012 4,968 4,481 4,124 4,464 4,665 4,613 4,735
Sales (millions of yen) 16 14 16 17 15 16 15 14 13 13 15 14 178
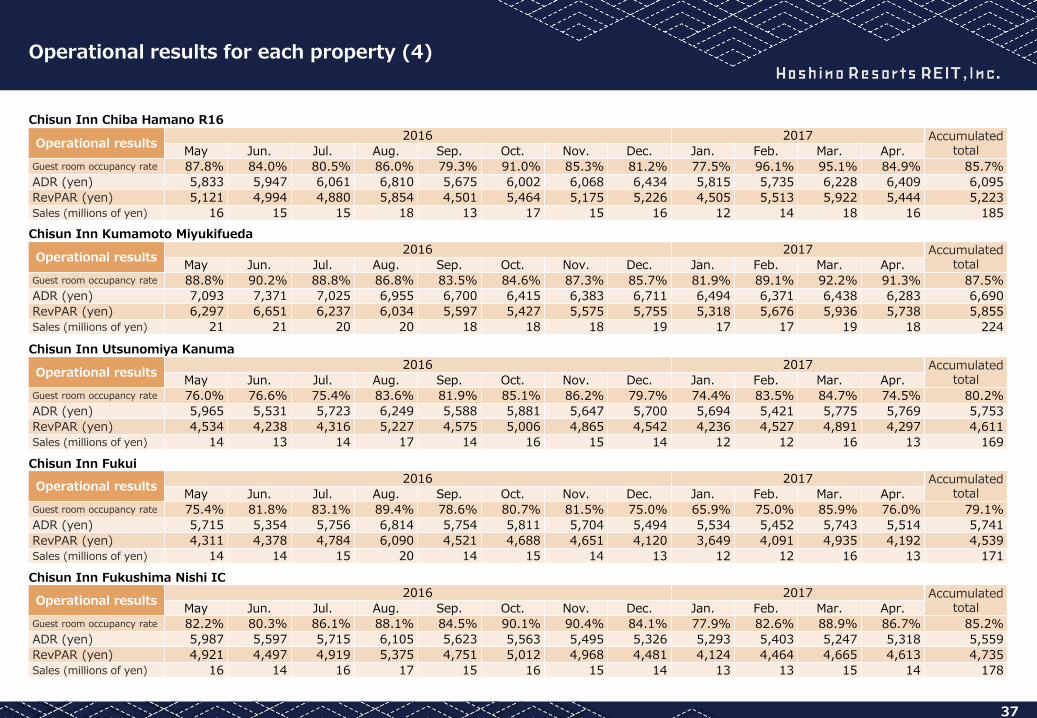
Chisun Inn Fukushima Nishi IC
37
Operational results for each property (4)
Operational results 2016 2017 Accumulated
total May Jun. Jul. Aug. Sep. Oct. Nov. Dec. Jan. Feb. Mar. Apr. Guest room occupancy rate 76.0% 76.6% 75.4% 83.6% 81.9% 85.1% 86.2% 79.7% 74.4% 83.5% 84.7% 74.5% 80.2%
ADR (yen) 5,965 5,531 5,723 6,249 5,588 5,881 5,647 5,700 5,694 5,421 5,775 5,769 5,753
RevPAR (yen) 4,534 4,238 4,316 5,227 4,575 5,006 4,865 4,542 4,236 4,527 4,891 4,297 4,611
Sales (millions of yen) 14 13 14 17 14 16 15 14 12 12 16 13 169
Operational results 2016 2017 Accumulated
total May Jun. Jul. Aug. Sep. Oct. Nov. Dec. Jan. Feb. Mar. Apr. Guest room occupancy rate 75.4% 81.8% 83.1% 89.4% 78.6% 80.7% 81.5% 75.0% 65.9% 75.0% 85.9% 76.0% 79.1%
ADR (yen) 5,715 5,354 5,756 6,814 5,754 5,811 5,704 5,494 5,534 5,452 5,743 5,514 5,741
RevPAR (yen) 4,311 4,378 4,784 6,090 4,521 4,688 4,651 4,120 3,649 4,091 4,935 4,192 4,539
Sales (millions of yen) 14 14 15 20 14 15 14 13 12 12 16 13 171
Chisun Inn Utsunomiya Kanuma
Chisun Inn Fukui
Operational results 2016 2017 Accumulated
total May Jun. Jul. Aug. Sep. Oct. Nov. Dec. Jan. Feb. Mar. Apr. Guest room occupancy rate 87.8% 84.0% 80.5% 86.0% 79.3% 91.0% 85.3% 81.2% 77.5% 96.1% 95.1% 84.9% 85.7%
ADR (yen) 5,833 5,947 6,061 6,810 5,675 6,002 6,068 6,434 5,815 5,735 6,228 6,409 6,095
RevPAR (yen) 5,121 4,994 4,880 5,854 4,501 5,464 5,175 5,226 4,505 5,513 5,922 5,444 5,223
Sales (millions of yen) 16 15 15 18 13 17 15 16 12 14 18 16 185
Operational results 2016 2017 Accumulated
total May Jun. Jul. Aug. Sep. Oct. Nov. Dec. Jan. Feb. Mar. Apr. Guest room occupancy rate 88.8% 90.2% 88.8% 86.8% 83.5% 84.6% 87.3% 85.7% 81.9% 89.1% 92.2% 91.3% 87.5%
ADR (yen) 7,093 7,371 7,025 6,955 6,700 6,415 6,383 6,711 6,494 6,371 6,438 6,283 6,690
RevPAR (yen) 6,297 6,651 6,237 6,034 5,597 5,427 5,575 5,755 5,318 5,676 5,936 5,738 5,855
Sales (millions of yen) 21 21 20 20 18 18 18 19 17 17 19 18 224
Chisun Inn Chiba Hamano R16
Chisun Inn Kumamoto Miyukifueda
Operational results 2016 2017 Accumulated
total May Jun. Jul. Aug. Sep. Oct. Nov. Dec. Jan. Feb. Mar. Apr. Guest room occupancy rate 83.6% 81.7% 83.2% 88.5% 79.4% 79.7% 76.5% 79.9% 68.7% 75.0% 75.6% 73.5% 78.8%
ADR (yen) 5,855 5,277 5,836 6,947 5,723 5,666 5,548 5,483 5,315 5,112 5,762 5,659 5,708
RevPAR (yen) 4,894 4,313 4,858 6,151 4,545 4,518 4,244 4,381 3,652 3,836 4,358 4,158 4,500
Sales (millions of yen) 15 12 15 18 13 14 12 13 11 11 13 12 160
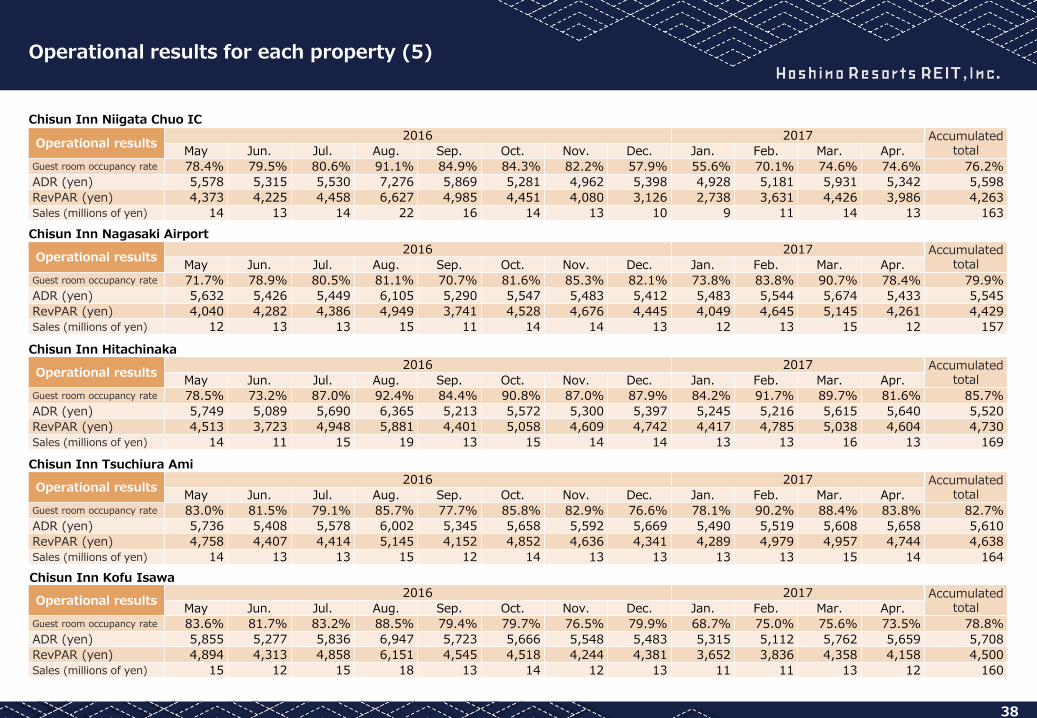
Chisun Inn Kofu Isawa
38
Operational results for each property (5)
Operational results 2016 2017 Accumulated
total May Jun. Jul. Aug. Sep. Oct. Nov. Dec. Jan. Feb. Mar. Apr. Guest room occupancy rate 78.5% 73.2% 87.0% 92.4% 84.4% 90.8% 87.0% 87.9% 84.2% 91.7% 89.7% 81.6% 85.7%
ADR (yen) 5,749 5,089 5,690 6,365 5,213 5,572 5,300 5,397 5,245 5,216 5,615 5,640 5,520
RevPAR (yen) 4,513 3,723 4,948 5,881 4,401 5,058 4,609 4,742 4,417 4,785 5,038 4,604 4,730
Sales (millions of yen) 14 11 15 19 13 15 14 14 13 13 16 13 169
Operational results 2016 2017 Accumulated
total May Jun. Jul. Aug. Sep. Oct. Nov. Dec. Jan. Feb. Mar. Apr. Guest room occupancy rate 83.0% 81.5% 79.1% 85.7% 77.7% 85.8% 82.9% 76.6% 78.1% 90.2% 88.4% 83.8% 82.7%
ADR (yen) 5,736 5,408 5,578 6,002 5,345 5,658 5,592 5,669 5,490 5,519 5,608 5,658 5,610
RevPAR (yen) 4,758 4,407 4,414 5,145 4,152 4,852 4,636 4,341 4,289 4,979 4,957 4,744 4,638
Sales (millions of yen) 14 13 13 15 12 14 13 13 13 13 15 14 164
Chisun Inn Hitachinaka
Chisun Inn Tsuchiura Ami
Operational results 2016 2017 Accumulated
total May Jun. Jul. Aug. Sep. Oct. Nov. Dec. Jan. Feb. Mar. Apr. Guest room occupancy rate 78.4% 79.5% 80.6% 91.1% 84.9% 84.3% 82.2% 57.9% 55.6% 70.1% 74.6% 74.6% 76.2%
ADR (yen) 5,578 5,315 5,530 7,276 5,869 5,281 4,962 5,398 4,928 5,181 5,931 5,342 5,598
RevPAR (yen) 4,373 4,225 4,458 6,627 4,985 4,451 4,080 3,126 2,738 3,631 4,426 3,986 4,263
Sales (millions of yen) 14 13 14 22 16 14 13 10 9 11 14 13 163
Operational results 2016 2017 Accumulated
total May Jun. Jul. Aug. Sep. Oct. Nov. Dec. Jan. Feb. Mar. Apr. Guest room occupancy rate 71.7% 78.9% 80.5% 81.1% 70.7% 81.6% 85.3% 82.1% 73.8% 83.8% 90.7% 78.4% 79.9%
ADR (yen) 5,632 5,426 5,449 6,105 5,290 5,547 5,483 5,412 5,483 5,544 5,674 5,433 5,545
RevPAR (yen) 4,040 4,282 4,386 4,949 3,741 4,528 4,676 4,445 4,049 4,645 5,145 4,261 4,429
Sales (millions of yen) 12 13 13 15 11 14 14 13 12 13 15 12 157
Chisun Inn Niigata Chuo IC
Chisun Inn Nagasaki Airport
Operational results 2016 2017 Accumulated
total May Jun. Jul. Aug. Sep. Oct. Nov. Dec. Jan. Feb. Mar. Apr. Guest room occupancy rate 78.1% 79.1% 72.1% 80.9% 75.6% 78.7% 78.3% 77.6% 71.0% 78.0% 79.8% 83.6% 77.7%
ADR (yen) 5,447 5,026 5,600 6,526 5,291 5,442 5,372 5,520 5,036 4,981 5,464 5,325 5,429
RevPAR (yen) 4,257 3,976 4,037 5,283 4,001 4,285 4,205 4,284 3,577 3,885 4,361 4,454 4,220
Sales (millions of yen) 14 12 13 17 12 14 13 13 11 11 14 14 159
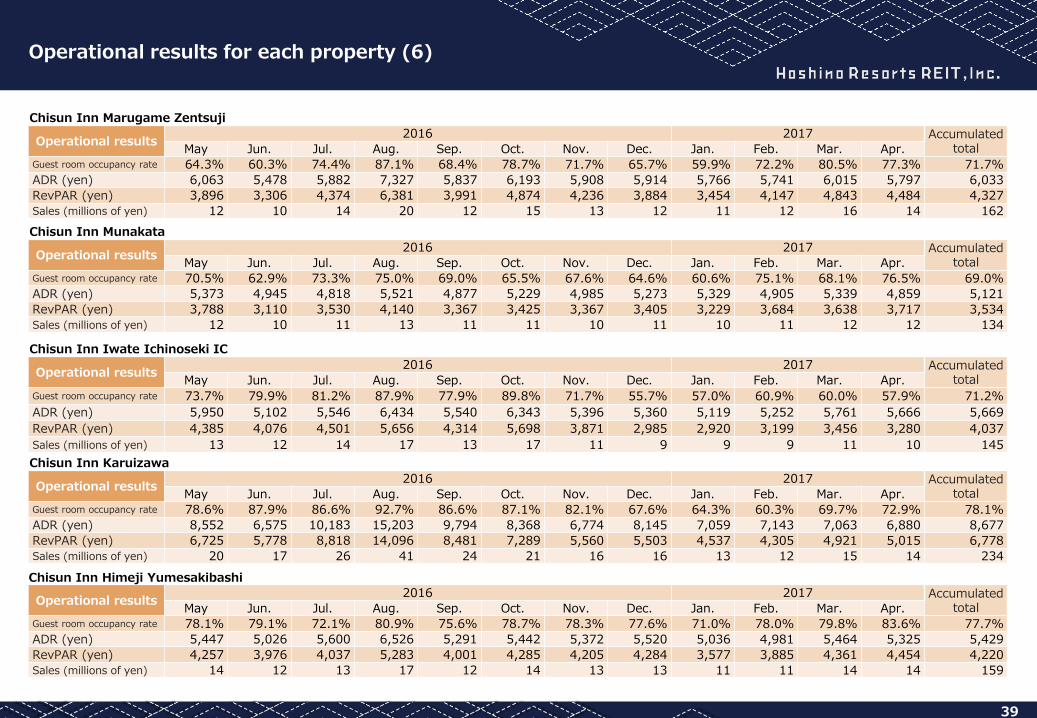
Chisun Inn Himeji Yumesakibashi
39
Operational results for each property (6)
Operational results 2016 2017 Accumulated
total May Jun. Jul. Aug. Sep. Oct. Nov. Dec. Jan. Feb. Mar. Apr. Guest room occupancy rate 73.7% 79.9% 81.2% 87.9% 77.9% 89.8% 71.7% 55.7% 57.0% 60.9% 60.0% 57.9% 71.2%
ADR (yen) 5,950 5,102 5,546 6,434 5,540 6,343 5,396 5,360 5,119 5,252 5,761 5,666 5,669
RevPAR (yen) 4,385 4,076 4,501 5,656 4,314 5,698 3,871 2,985 2,920 3,199 3,456 3,280 4,037
Sales (millions of yen) 13 12 14 17 13 17 11 9 9 9 11 10 145
Operational results 2016 2017 Accumulated
total May Jun. Jul. Aug. Sep. Oct. Nov. Dec. Jan. Feb. Mar. Apr. Guest room occupancy rate 78.6% 87.9% 86.6% 92.7% 86.6% 87.1% 82.1% 67.6% 64.3% 60.3% 69.7% 72.9% 78.1%
ADR (yen) 8,552 6,575 10,183 15,203 9,794 8,368 6,774 8,145 7,059 7,143 7,063 6,880 8,677
RevPAR (yen) 6,725 5,778 8,818 14,096 8,481 7,289 5,560 5,503 4,537 4,305 4,921 5,015 6,778
Sales (millions of yen) 20 17 26 41 24 21 16 16 13 12 15 14 234
Chisun Inn Iwate Ichinoseki IC
Chisun Inn Karuizawa
Operational results 2016 2017 Accumulated
total May Jun. Jul. Aug. Sep. Oct. Nov. Dec. Jan. Feb. Mar. Apr. Guest room occupancy rate 64.3% 60.3% 74.4% 87.1% 68.4% 78.7% 71.7% 65.7% 59.9% 72.2% 80.5% 77.3% 71.7%
ADR (yen) 6,063 5,478 5,882 7,327 5,837 6,193 5,908 5,914 5,766 5,741 6,015 5,797 6,033
RevPAR (yen) 3,896 3,306 4,374 6,381 3,991 4,874 4,236 3,884 3,454 4,147 4,843 4,484 4,327
Sales (millions of yen) 12 10 14 20 12 15 13 12 11 12 16 14 162
Operational results 2016 2017 Accumulated
total May Jun. Jul. Aug. Sep. Oct. Nov. Dec. Jan. Feb. Mar. Apr. Guest room occupancy rate 70.5% 62.9% 73.3% 75.0% 69.0% 65.5% 67.6% 64.6% 60.6% 75.1% 68.1% 76.5% 69.0%
ADR (yen) 5,373 4,945 4,818 5,521 4,877 5,229 4,985 5,273 5,329 4,905 5,339 4,859 5,121
RevPAR (yen) 3,788 3,110 3,530 4,140 3,367 3,425 3,367 3,405 3,229 3,684 3,638 3,717 3,534
Sales (millions of yen) 12 10 11 13 11 11 10 11 10 11 12 12 134
Chisun Inn Marugame Zentsuji
Chisun Inn Munakata
40
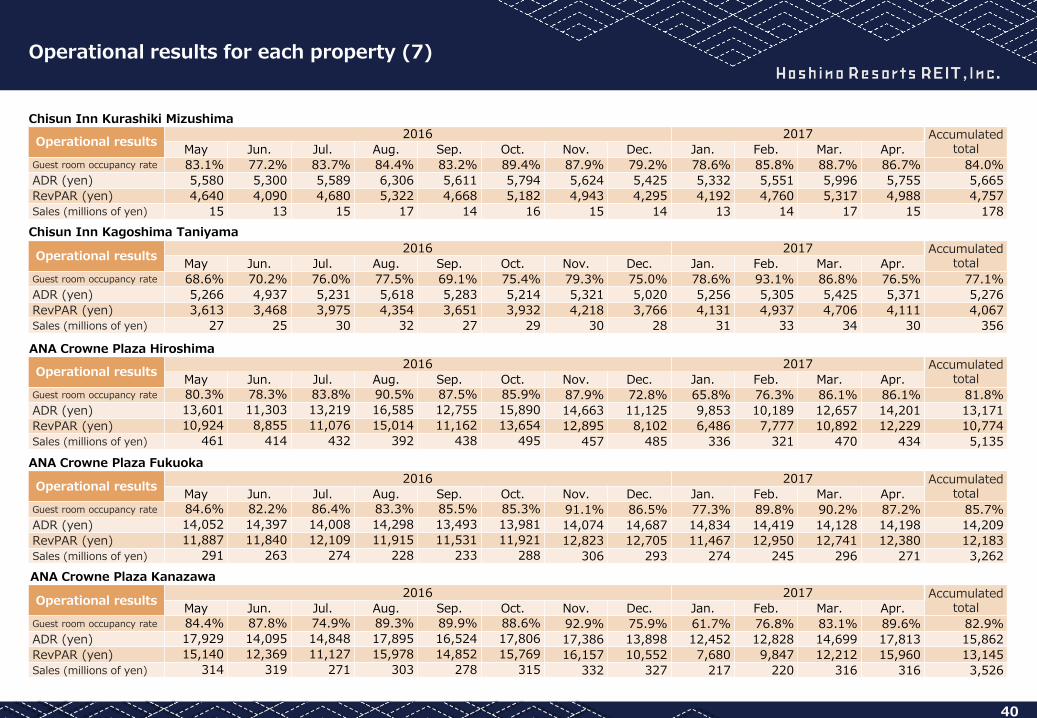
Operational results for each property (7)
Operational results 2016 2017 Accumulated
total May Jun. Jul. Aug. Sep. Oct. Nov. Dec. Jan. Feb. Mar. Apr. Guest room occupancy rate 80.3% 78.3% 83.8% 90.5% 87.5% 85.9% 87.9% 72.8% 65.8% 76.3% 86.1% 86.1% 81.8%
ADR (yen) 13,601 11,303 13,219 16,585 12,755 15,890 14,663 11,125 9,853 10,189 12,657 14,201 13,171
RevPAR (yen) 10,924 8,855 11,076 15,014 11,162 13,654 12,895 8,102 6,486 7,777 10,892 12,229 10,774
Sales (millions of yen) 461 414 432 392 438 495 457 485 336 321 470 434 5,135
ANA Crowne Plaza Hiroshima
Operational results 2016 2017 Accumulated
total May Jun. Jul. Aug. Sep. Oct. Nov. Dec. Jan. Feb. Mar. Apr. Guest room occupancy rate 84.4% 87.8% 74.9% 89.3% 89.9% 88.6% 92.9% 75.9% 61.7% 76.8% 83.1% 89.6% 82.9%
ADR (yen) 17,929 14,095 14,848 17,895 16,524 17,806 17,386 13,898 12,452 12,828 14,699 17,813 15,862
RevPAR (yen) 15,140 12,369 11,127 15,978 14,852 15,769 16,157 10,552 7,680 9,847 12,212 15,960 13,145
Sales (millions of yen) 314 319 271 303 278 315 332 327 217 220 316 316 3,526
ANA Crowne Plaza Kanazawa
Operational results 2016 2017 Accumulated
total May Jun. Jul. Aug. Sep. Oct. Nov. Dec. Jan. Feb. Mar. Apr. Guest room occupancy rate 84.6% 82.2% 86.4% 83.3% 85.5% 85.3% 91.1% 86.5% 77.3% 89.8% 90.2% 87.2% 85.7%
ADR (yen) 14,052 14,397 14,008 14,298 13,493 13,981 14,074 14,687 14,834 14,419 14,128 14,198 14,209
RevPAR (yen) 11,887 11,840 12,109 11,915 11,531 11,921 12,823 12,705 11,467 12,950 12,741 12,380 12,183
Sales (millions of yen) 291 263 274 228 233 288 306 293 274 245 296 271 3,262
ANA Crowne Plaza Fukuoka
Operational results 2016 2017 Accumulated
total May Jun. Jul. Aug. Sep. Oct. Nov. Dec. Jan. Feb. Mar. Apr. Guest room occupancy rate 68.6% 70.2% 76.0% 77.5% 69.1% 75.4% 79.3% 75.0% 78.6% 93.1% 86.8% 76.5% 77.1%
ADR (yen) 5,266 4,937 5,231 5,618 5,283 5,214 5,321 5,020 5,256 5,305 5,425 5,371 5,276
RevPAR (yen) 3,613 3,468 3,975 4,354 3,651 3,932 4,218 3,766 4,131 4,937 4,706 4,111 4,067
Sales (millions of yen) 27 25 30 32 27 29 30 28 31 33 34 30 356
Chisun Inn Kagoshima Taniyama
Operational results 2016 2017 Accumulated
total May Jun. Jul. Aug. Sep. Oct. Nov. Dec. Jan. Feb. Mar. Apr. Guest room occupancy rate 83.1% 77.2% 83.7% 84.4% 83.2% 89.4% 87.9% 79.2% 78.6% 85.8% 88.7% 86.7% 84.0%
ADR (yen) 5,580 5,300 5,589 6,306 5,611 5,794 5,624 5,425 5,332 5,551 5,996 5,755 5,665
RevPAR (yen) 4,640 4,090 4,680 5,322 4,668 5,182 4,943 4,295 4,192 4,760 5,317 4,988 4,757
Sales (millions of yen) 15 13 15 17 14 16 15 14 13 14 17 15 178
Chisun Inn Kurashiki Mizushima
41
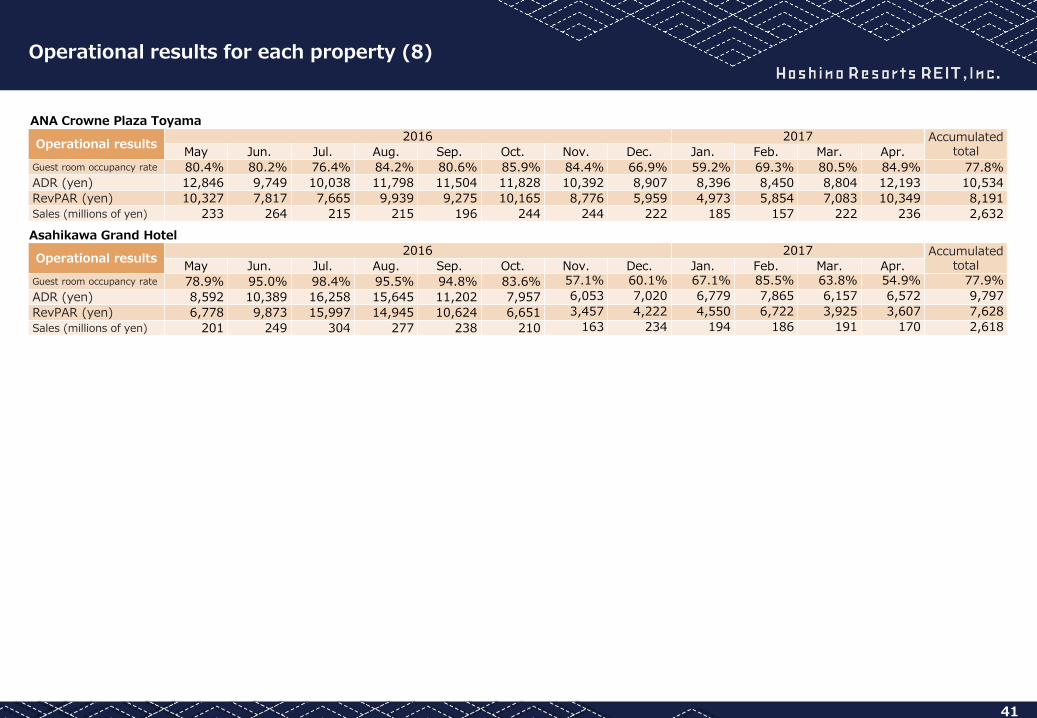
Operational results for each property (8)
Operational results 2016 2017 Accumulated
total May Jun. Jul. Aug. Sep. Oct. Nov. Dec. Jan. Feb. Mar. Apr. Guest room occupancy rate 80.4% 80.2% 76.4% 84.2% 80.6% 85.9% 84.4% 66.9% 59.2% 69.3% 80.5% 84.9% 77.8%
ADR (yen) 12,846 9,749 10,038 11,798 11,504 11,828 10,392 8,907 8,396 8,450 8,804 12,193 10,534
RevPAR (yen) 10,327 7,817 7,665 9,939 9,275 10,165 8,776 5,959 4,973 5,854 7,083 10,349 8,191
Sales (millions of yen) 233 264 215 215 196 244 244 222 185 157 222 236 2,632
ANA Crowne Plaza Toyama
Operational results 2016 2017 Accumulated
total May Jun. Jul. Aug. Sep. Oct. Nov. Dec. Jan. Feb. Mar. Apr. Guest room occupancy rate 78.9% 95.0% 98.4% 95.5% 94.8% 83.6% 57.1% 60.1% 67.1% 85.5% 63.8% 54.9% 77.9%
ADR (yen) 8,592 10,389 16,258 15,645 11,202 7,957 6,053 7,020 6,779 7,865 6,157 6,572 9,797
RevPAR (yen) 6,778 9,873 15,997 14,945 10,624 6,651 3,457 4,222 4,550 6,722 3,925 3,607 7,628
Sales (millions of yen) 201 249 304 277 238 210 163 234 194 186 191 170 2,618
Asahikawa Grand Hotel
42
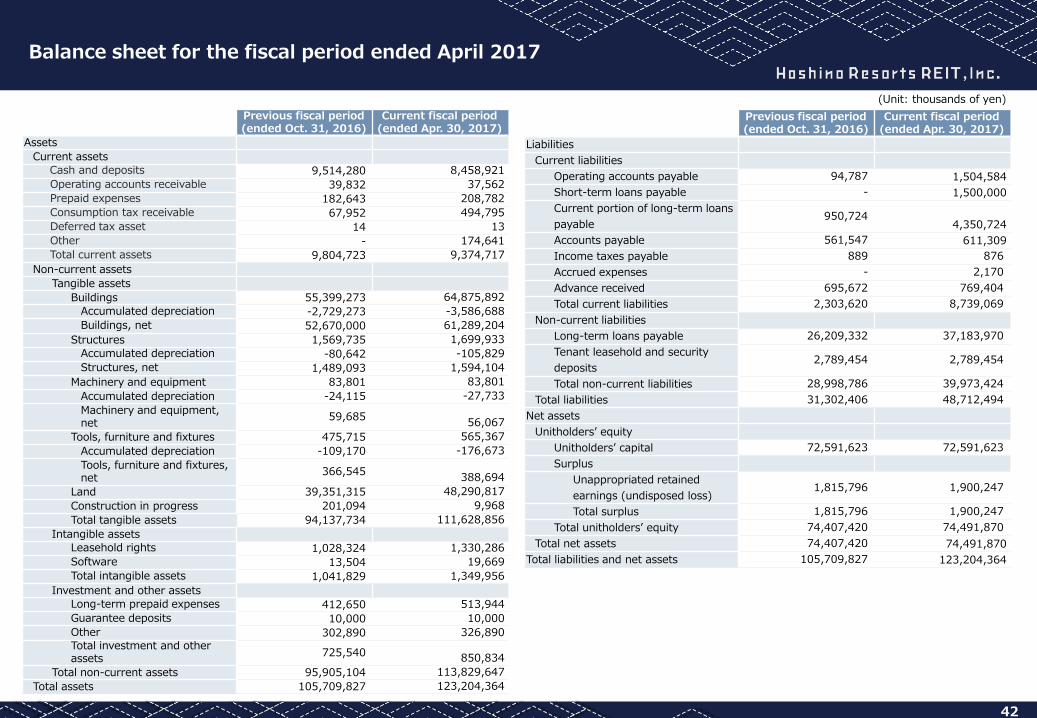
Balance sheet for the fiscal period ended April 2017
(Unit: thousands of yen)
Previous fiscal period (ended Oct. 31, 2016)
Current fiscal period (ended Apr. 30, 2017)
Liabilities
Current liabilities
Operating accounts payable 94,787 1,504,584
Short-term loans payable - 1,500,000
Current portion of long-term loans
payable 950,724
4,350,724
Accounts payable 561,547 611,309
Income taxes payable 889 876
Accrued expenses - 2,170
Advance received 695,672 769,404
Total current liabilities 2,303,620 8,739,069
Non-current liabilities
Long-term loans payable 26,209,332 37,183,970
Tenant leasehold and security
deposits 2,789,454 2,789,454
Total non-current liabilities 28,998,786 39,973,424
Total liabilities 31,302,406 48,712,494
Net assets
Unitholders’ equity
Unitholders’ capital 72,591,623 72,591,623
Surplus
Unappropriated retained
earnings (undisposed loss) 1,815,796 1,900,247
Total surplus 1,815,796 1,900,247
Total unitholders’ equity 74,407,420 74,491,870
Total net assets 74,407,420 74,491,870
Total liabilities and net assets 105,709,827 123,204,364
Previous fiscal period (ended Oct. 31, 2016)
Current fiscal period (ended Apr. 30, 2017)
Assets
Current assets
Cash and deposits 9,514,280 8,458,921
Operating accounts receivable 39,832 37,562
Prepaid expenses 182,643 208,782
Consumption tax receivable 67,952 494,795
Deferred tax asset 14 13
Other - 174,641
Total current assets 9,804,723 9,374,717
Non-current assets
Tangible assets
Buildings 55,399,273 64,875,892
Accumulated depreciation -2,729,273 -3,586,688
Buildings, net 52,670,000 61,289,204
Structures 1,569,735 1,699,933
Accumulated depreciation -80,642 -105,829
Structures, net 1,489,093 1,594,104
Machinery and equipment 83,801 83,801
Accumulated depreciation -24,115 -27,733
Machinery and equipment, net
59,685 56,067
Tools, furniture and fixtures 475,715 565,367
Accumulated depreciation -109,170 -176,673
Tools, furniture and fixtures, net
366,545 388,694
Land 39,351,315 48,290,817
Construction in progress 201,094 9,968
Total tangible assets 94,137,734 111,628,856
Intangible assets
Leasehold rights 1,028,324 1,330,286
Software 13,504 19,669
Total intangible assets 1,041,829 1,349,956
Investment and other assets
Long-term prepaid expenses 412,650 513,944
Guarantee deposits 10,000 10,000
Other 302,890 326,890 Total investment and other assets
725,540 850,834
Total non-current assets 95,905,104 113,829,647
Total assets 105,709,827 123,204,364
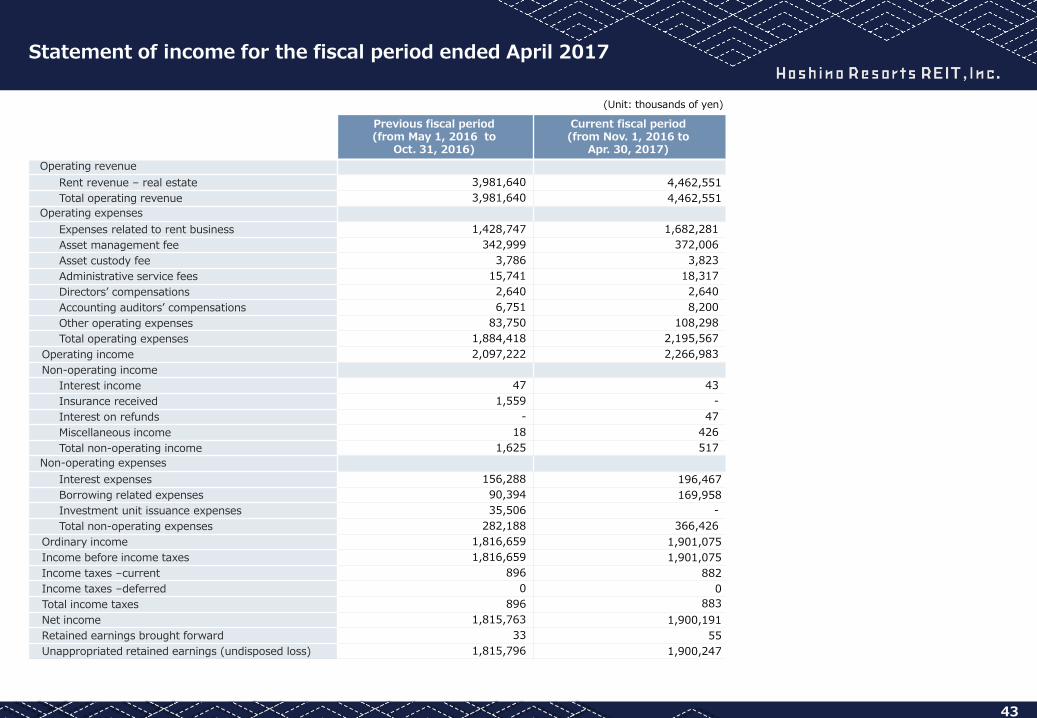
Previous fiscal period (from May 1, 2016 to
Oct. 31, 2016)
Current fiscal period (from Nov. 1, 2016 to
Apr. 30, 2017)
Operating revenue
Rent revenue – real estate 3,981,640 4,462,551
Total operating revenue 3,981,640 4,462,551
Operating expenses
Expenses related to rent business 1,428,747 1,682,281
Asset management fee 342,999 372,006
Asset custody fee 3,786 3,823
Administrative service fees 15,741 18,317
Directors’ compensations 2,640 2,640
Accounting auditors’ compensations 6,751 8,200
Other operating expenses 83,750 108,298
Total operating expenses 1,884,418 2,195,567
Operating income 2,097,222 2,266,983
Non-operating income
Interest income 47 43
Insurance received 1,559 -
Interest on refunds - 47
Miscellaneous income 18 426
Total non-operating income 1,625 517
Non-operating expenses
Interest expenses 156,288 196,467
Borrowing related expenses 90,394 169,958
Investment unit issuance expenses 35,506 -
Total non-operating expenses 282,188 366,426
Ordinary income 1,816,659 1,901,075
Income before income taxes 1,816,659 1,901,075
Income taxes –current 896 882
Income taxes –deferred 0 0
Total income taxes 896 883
Net income 1,815,763 1,900,191
Retained earnings brought forward 33 55
Unappropriated retained earnings (undisposed loss) 1,815,796 1,900,247
43
Statement of income for the fiscal period ended April 2017
(Unit: thousands of yen)
44
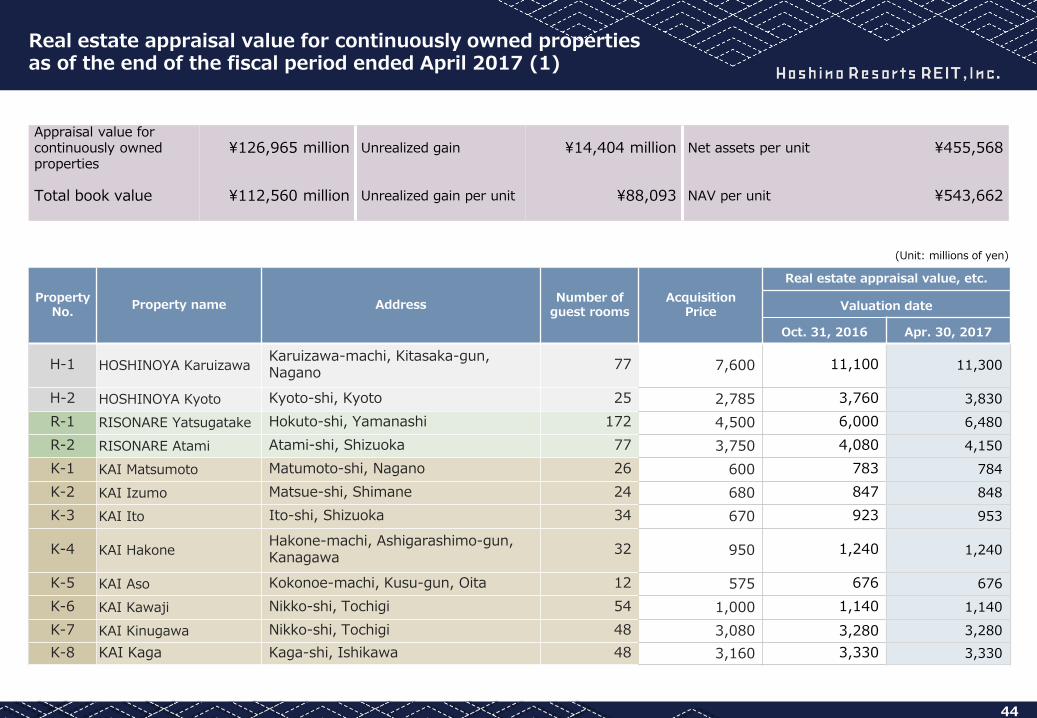
Real estate appraisal value for continuously owned properties as of the end of the fiscal period ended April 2017 (1)
Appraisal value for continuously owned properties
¥126,965 million Unrealized gain ¥14,404 million Net assets per unit ¥455,568
Total book value ¥112,560 million Unrealized gain per unit ¥88,093 NAV per unit ¥543,662
(Unit: millions of yen)
Property No.
Property name Address Number of
guest rooms Acquisition
Price
Real estate appraisal value, etc.
Valuation date
Oct. 31, 2016 Apr. 30, 2017
H-1 HOSHINOYA Karuizawa Karuizawa-machi, Kitasaka-gun, Nagano
77 7,600 11,100 11,300
H-2 HOSHINOYA Kyoto Kyoto-shi, Kyoto 25 2,785 3,760 3,830
R-1 RISONARE Yatsugatake Hokuto-shi, Yamanashi 172 4,500 6,000 6,480
R-2 RISONARE Atami Atami-shi, Shizuoka 77 3,750 4,080 4,150
K-1 KAI Matsumoto Matumoto-shi, Nagano 26 600 783 784
K-2 KAI Izumo Matsue-shi, Shimane 24 680 847 848
K-3 KAI Ito Ito-shi, Shizuoka 34 670 923 953
K-4 KAI Hakone Hakone-machi, Ashigarashimo-gun, Kanagawa
32 950 1,240 1,240
K-5 KAI Aso Kokonoe-machi, Kusu-gun, Oita 12 575 676 676
K-6 KAI Kawaji Nikko-shi, Tochigi 54 1,000 1,140 1,140
K-7 KAI Kinugawa Nikko-shi, Tochigi 48 3,080 3,280 3,280
K-8 KAI Kaga Kaga-shi, Ishikawa 48 3,160 3,330 3,330
Property No.
Property name Address Number of
guest rooms Acquisition Price
Real estate appraisal value, etc.
Valuation date
Oct. 31, 2016 Apr. 30, 2017
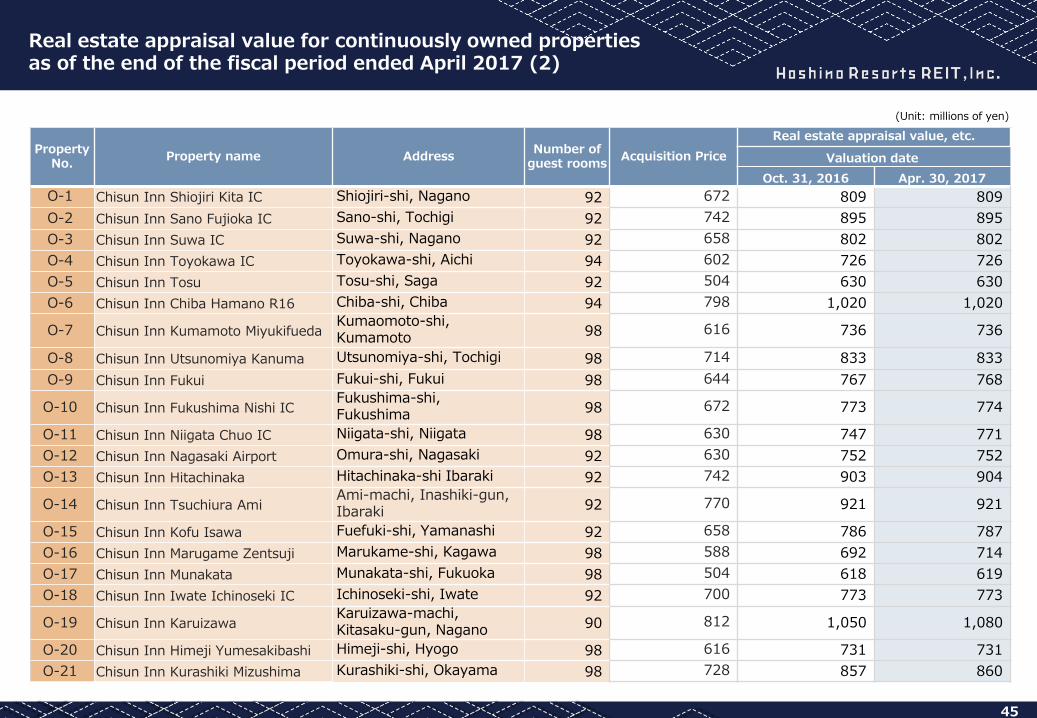
O-1 Chisun Inn Shiojiri Kita IC Shiojiri-shi, Nagano 92 672 809 809
O-2 Chisun Inn Sano Fujioka IC Sano-shi, Tochigi 92 742 895 895
O-3 Chisun Inn Suwa IC Suwa-shi, Nagano 92 658 802 802
O-4 Chisun Inn Toyokawa IC Toyokawa-shi, Aichi 94 602 726 726
O-5 Chisun Inn Tosu Tosu-shi, Saga 92 504 630 630
O-6 Chisun Inn Chiba Hamano R16 Chiba-shi, Chiba 94 798 1,020 1,020
O-7 Chisun Inn Kumamoto Miyukifueda Kumaomoto-shi, Kumamoto 98 616 736 736
O-8 Chisun Inn Utsunomiya Kanuma Utsunomiya-shi, Tochigi 98 714 833 833
O-9 Chisun Inn Fukui Fukui-shi, Fukui 98 644 767 768
O-10 Chisun Inn Fukushima Nishi IC Fukushima-shi, Fukushima 98 672 773 774
O-11 Chisun Inn Niigata Chuo IC Niigata-shi, Niigata 98 630 747 771
O-12 Chisun Inn Nagasaki Airport Omura-shi, Nagasaki 92 630 752 752
O-13 Chisun Inn Hitachinaka Hitachinaka-shi Ibaraki 92 742 903 904
O-14 Chisun Inn Tsuchiura Ami Ami-machi, Inashiki-gun, Ibaraki 92 770 921 921
O-15 Chisun Inn Kofu Isawa Fuefuki-shi, Yamanashi 92 658 786 787
O-16 Chisun Inn Marugame Zentsuji Marukame-shi, Kagawa 98 588 692 714
O-17 Chisun Inn Munakata Munakata-shi, Fukuoka 98 504 618 619
O-18 Chisun Inn Iwate Ichinoseki IC Ichinoseki-shi, Iwate 92 700 773 773
O-19 Chisun Inn Karuizawa Karuizawa-machi, Kitasaku-gun, Nagano 90 812 1,050 1,080
O-20 Chisun Inn Himeji Yumesakibashi Himeji-shi, Hyogo 98 616 731 731
O-21 Chisun Inn Kurashiki Mizushima Kurashiki-shi, Okayama 98 728 857 860
45
Real estate appraisal value for continuously owned properties as of the end of the fiscal period ended April 2017 (2)
(Unit: millions of yen)
Property No.
Property name Address Number of
guest rooms Acquisition Price
Real estate appraisal value, etc.
Valuation date
Oct. 31, 2016 Apr. 30, 2017
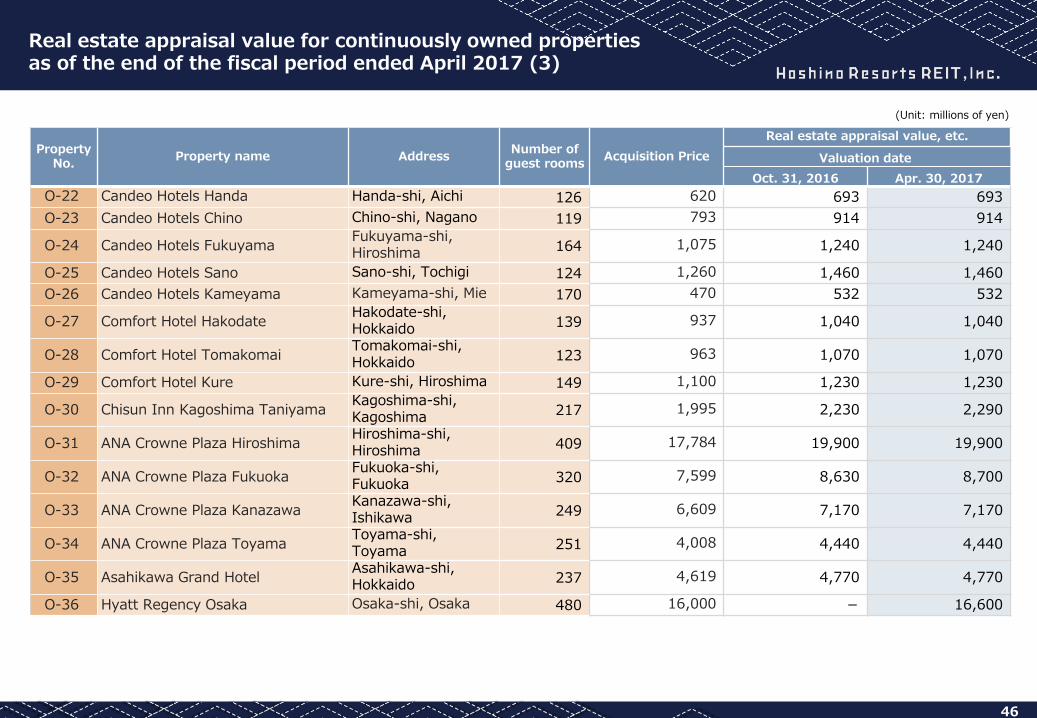
O-22 Candeo Hotels Handa Handa-shi, Aichi 126 620 693 693
O-23 Candeo Hotels Chino Chino-shi, Nagano 119 793 914 914
O-24 Candeo Hotels Fukuyama Fukuyama-shi, Hiroshima 164 1,075 1,240 1,240
O-25 Candeo Hotels Sano Sano-shi, Tochigi 124 1,260 1,460 1,460
O-26 Candeo Hotels Kameyama Kameyama-shi, Mie 170 470 532 532
O-27 Comfort Hotel Hakodate Hakodate-shi, Hokkaido 139 937 1,040 1,040
O-28 Comfort Hotel Tomakomai Tomakomai-shi, Hokkaido 123 963 1,070 1,070
O-29 Comfort Hotel Kure Kure-shi, Hiroshima 149 1,100 1,230 1,230
O-30 Chisun Inn Kagoshima Taniyama Kagoshima-shi, Kagoshima 217 1,995 2,230 2,290
O-31 ANA Crowne Plaza Hiroshima Hiroshima-shi, Hiroshima 409 17,784 19,900 19,900
O-32 ANA Crowne Plaza Fukuoka Fukuoka-shi, Fukuoka 320 7,599 8,630 8,700
O-33 ANA Crowne Plaza Kanazawa Kanazawa-shi, Ishikawa 249 6,609 7,170 7,170
O-34 ANA Crowne Plaza Toyama Toyama-shi, Toyama 251 4,008 4,440 4,440
O-35 Asahikawa Grand Hotel Asahikawa-shi, Hokkaido 237 4,619 4,770 4,770
O-36 Hyatt Regency Osaka Osaka-shi, Osaka 480 16,000 - 16,600
46
Real estate appraisal value for continuously owned properties as of the end of the fiscal period ended April 2017 (3)
(Unit: millions of yen)
47
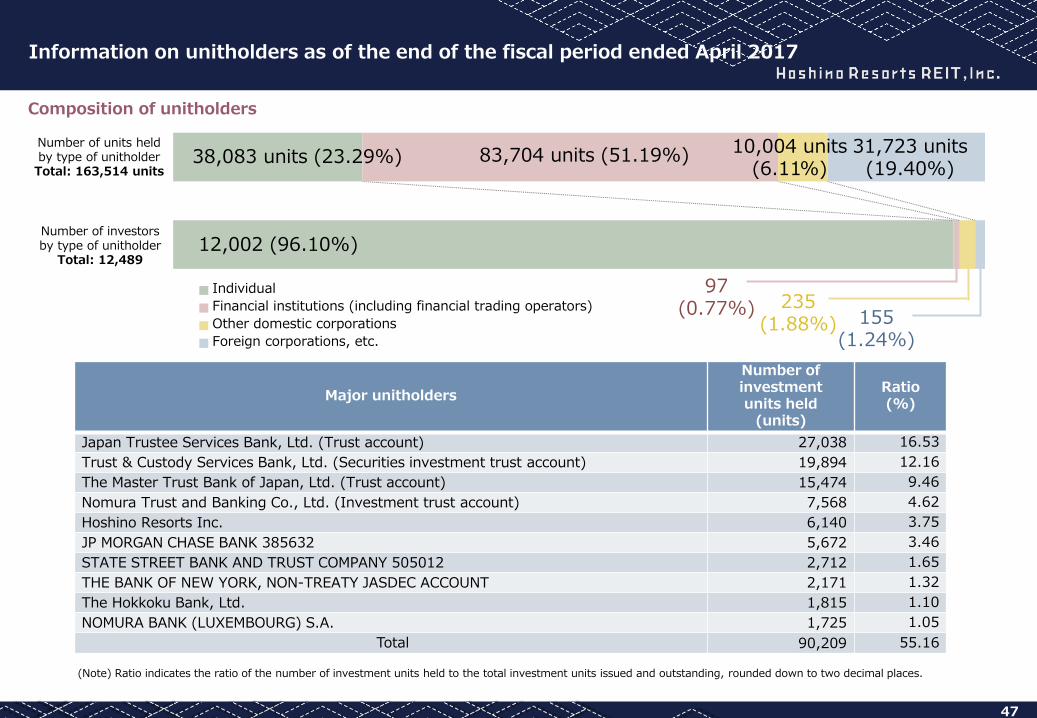
Information on unitholders as of the end of the fiscal period ended April 2017
(Note) Ratio indicates the ratio of the number of investment units held to the total investment units issued and outstanding, rounded down to two decimal places.
Composition of unitholders
Major unitholders
Number of investment units held
(units)
Ratio (%)
Japan Trustee Services Bank, Ltd. (Trust account) 27,038 16.53
Trust & Custody Services Bank, Ltd. (Securities investment trust account) 19,894 12.16
The Master Trust Bank of Japan, Ltd. (Trust account) 15,474 9.46
Nomura Trust and Banking Co., Ltd. (Investment trust account) 7,568 4.62
Hoshino Resorts Inc. 6,140 3.75
JP MORGAN CHASE BANK 385632 5,672 3.46
STATE STREET BANK AND TRUST COMPANY 505012 2,712 1.65
THE BANK OF NEW YORK, NON-TREATY JASDEC ACCOUNT 2,171 1.32
The Hokkoku Bank, Ltd. 1,815 1.10
NOMURA BANK (LUXEMBOURG) S.A. 1,725 1.05
Total 90,209 55.16
Individual
Financial institutions (including financial trading operators)
Other domestic corporations
Foreign corporations, etc.
Number of units held by type of unitholder
Total: 163,514 units
Number of investors by type of unitholder
Total: 12,489
38,083 units (23.29%) 83,704 units (51.19%) 10,004 units (6.11%)
31,723 units (19.40%)
12,002 (96.10%)
97 (0.77%) 235
(1.88%) 155 (1.24%)
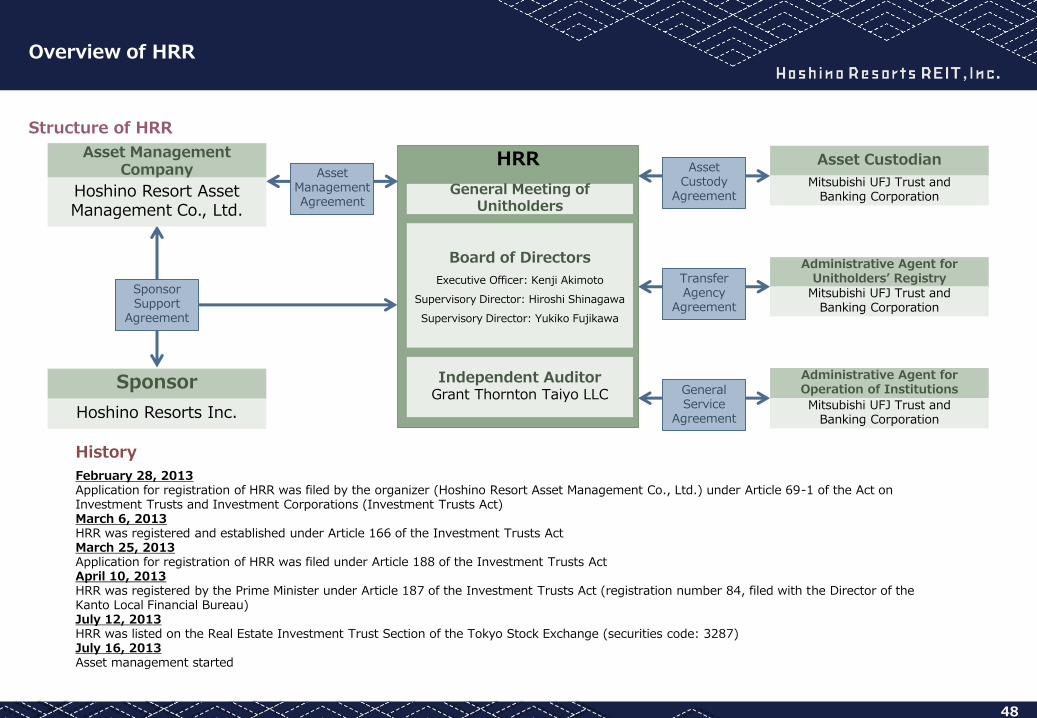
48
Overview of HRR
February 28, 2013 Application for registration of HRR was filed by the organizer (Hoshino Resort Asset Management Co., Ltd.) under Article 69-1 of the Act on Investment Trusts and Investment Corporations (Investment Trusts Act) March 6, 2013 HRR was registered and established under Article 166 of the Investment Trusts Act March 25, 2013 Application for registration of HRR was filed under Article 188 of the Investment Trusts Act April 10, 2013 HRR was registered by the Prime Minister under Article 187 of the Investment Trusts Act (registration number 84, filed with the Director of the Kanto Local Financial Bureau) July 12, 2013 HRR was listed on the Real Estate Investment Trust Section of the Tokyo Stock Exchange (securities code: 3287) July 16, 2013 Asset management started
Structure of HRR
History
HRR
General Meeting of Unitholders
Board of Directors
Executive Officer: Kenji Akimoto
Supervisory Director: Hiroshi Shinagawa
Supervisory Director: Yukiko Fujikawa
Independent Auditor Grant Thornton Taiyo LLC
Sponsor Support
Agreement
Sponsor
Hoshino Resorts Inc.
Asset Management Company
Hoshino Resort Asset Management Co., Ltd.
Asset Management Agreement
Asset Custodian
Mitsubishi UFJ Trust and Banking Corporation
Asset Custody
Agreement
Administrative Agent for Unitholders’ Registry
Mitsubishi UFJ Trust and Banking Corporation
Transfer Agency
Agreement
Administrative Agent for Operation of Institutions
Mitsubishi UFJ Trust and Banking Corporation
General Service
Agreement
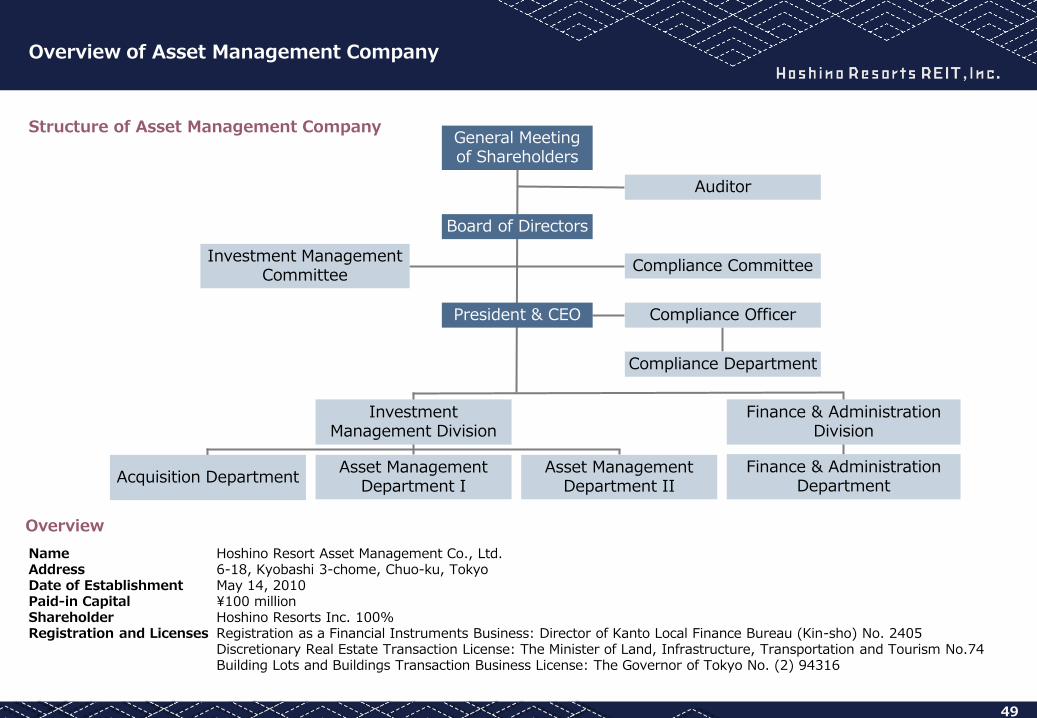
49
Overview of Asset Management Company
Name Hoshino Resort Asset Management Co., Ltd. Address 6-18, Kyobashi 3-chome, Chuo-ku, Tokyo Date of Establishment May 14, 2010 Paid-in Capital ¥100 million Shareholder Hoshino Resorts Inc. 100% Registration and Licenses Registration as a Financial Instruments Business: Director of Kanto Local Finance Bureau (Kin-sho) No. 2405
Discretionary Real Estate Transaction License: The Minister of Land, Infrastructure, Transportation and Tourism No.74 Building Lots and Buildings Transaction Business License: The Governor of Tokyo No. (2) 94316
Structure of Asset Management Company
Overview
General Meeting of Shareholders
Board of Directors
President & CEO Compliance Officer
Compliance Department
Auditor
Investment Management Committee
Compliance Committee
Asset Management Department II
Acquisition Department Asset Management
Department I Finance & Administration
Department
Investment Management Division
Finance & Administration Division
Contact
TEL: +81-3-5159-6338
50
Disclaimer
This document is provided for information purposes only and is not a solicitation for investment, nor recommendation or invitation to make specific transactions. We caution readers to undertake investment decisions at their own discretion and responsibility.
This document is not a disclosure document or report based upon the Financial Instruments and Exchange Act, the Act on Investment Trusts and Investment Corporations, public listing regulations of the Tokyo Stock Exchange or other related laws and regulations.
This document includes charts, data and other materials prepared by Hoshino Resort Asset Management Co., Ltd. (the “Asset Management Company”) based on data, indices, etc. disclosed by third parties, in addition to statements related to Hoshino Resorts REIT, Inc. (“HRR”). Statements on analysis, judgments and other opinions of the Asset Management Company as of the date of the document are also included.
The contents of this document have not been audited and their accuracy and completeness are not guaranteed. Analysis, judgments and other opinions of the Asset Management Company that are not actual instance are only reflecting the views of the Asset Management Company as of the date of the document. Therefore, other views and opinions exist and the Asset Management Company may change its views in the future.
The figures under the same item of other disclosed materials may differ from figures presented in this document due to different rounding of fractions and such.
While HRR has taken due care in the preparation of this document, the possibility of errors exists. Readers are also cautioned that the contents of this document are subject to correction or change without prior notice.
HRR or the Asset Management Company will not be responsible for any inaccuracy in data, indices and such disclosed by third parties.
Although this documents include statements regarding HRR’s future policies, etc., these statements do not guarantee such future policies, etc.
For the convenience of preparing graphs, the dates indicated may differ from actual business dates.
Registration as a Financial Instruments Business: Director of Kanto Local Finance Bureau (Kin-sho) No. 2405 Member of the Investment Trusts Association, Japan