Embed Size (px)
DESCRIPTION
9. Interaction Devices. Keyboards and Keypads Keyboard layouts QWERTY layout (Christopher Latham Sholes), Dvorak layout , ABCDE style number pads – telephone* layout and calculator layout wrist and hand placement awkward – separated keyboards – visual scanning disruption Keys - PowerPoint PPT Presentation
Citation preview
고려대학교 산업공학과
ISIE 401 UI
9. Interaction Devices2. Keyboards and Keypads
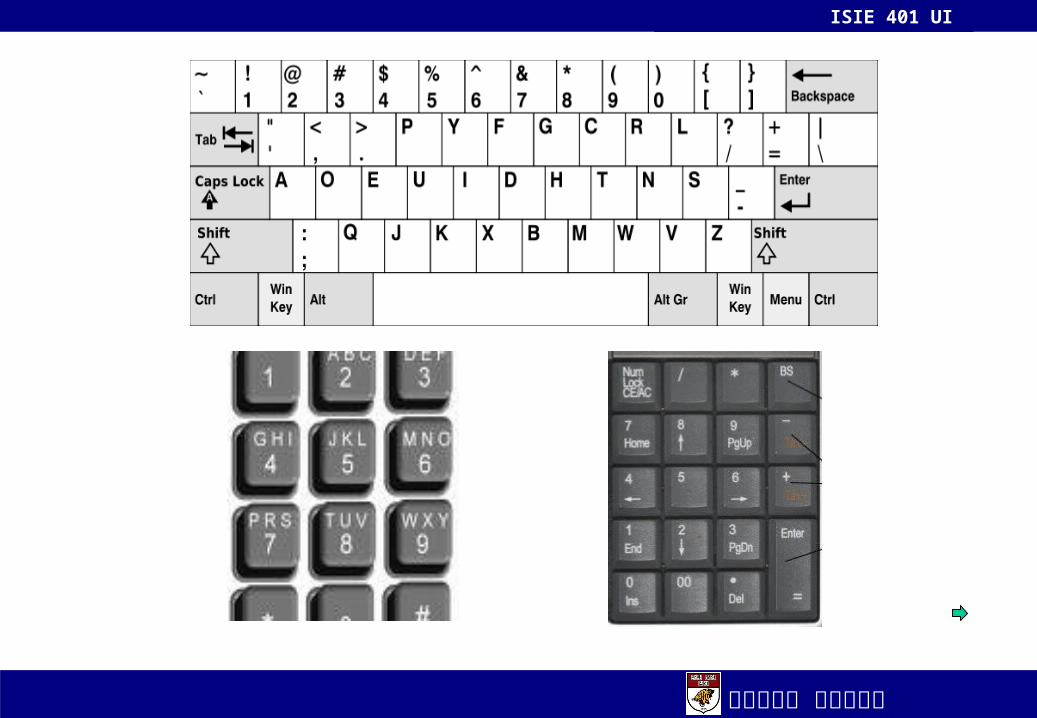
1. Keyboard layouts QWERTY layout (Christopher Latham Sholes), Dvorak layout, ABCDE style number pads – telephone* layout and calculator layout wrist and hand placement awkward – separated keyboards – visual scanning disruption
2. Keys ½-inch-square keys (12 mm square), concave surface with a matte finish 40- to 125-gram force and a displacement of 3 to 5 mm, tactile and audible feedback larger for reliable access, locking by embedded light, labels, home keys (F and J) Function keys, Cursor movement keys -- inverted T arrangement, auto-repeat feature
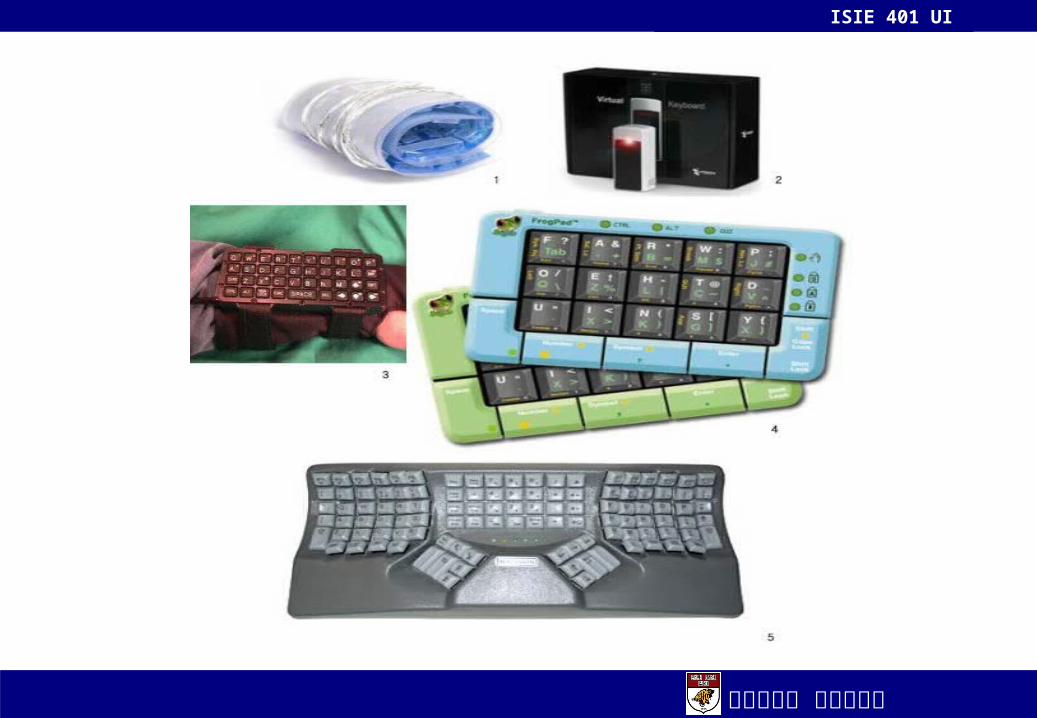
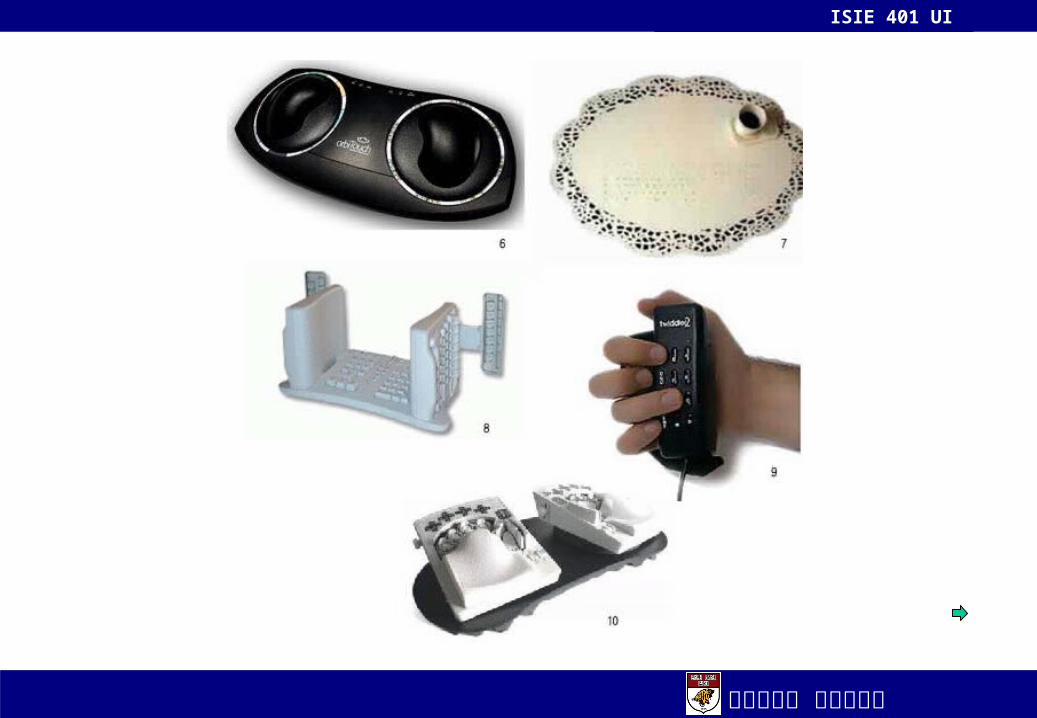
3. Keyboards and keypads for small devices reduced, wireless, foldable, virtual keyboards, softkeys tap on virtual keyboards, handwrite on a touch sensitive surface (Graffiti)
3. Pointing Devices1. Pointing tasks
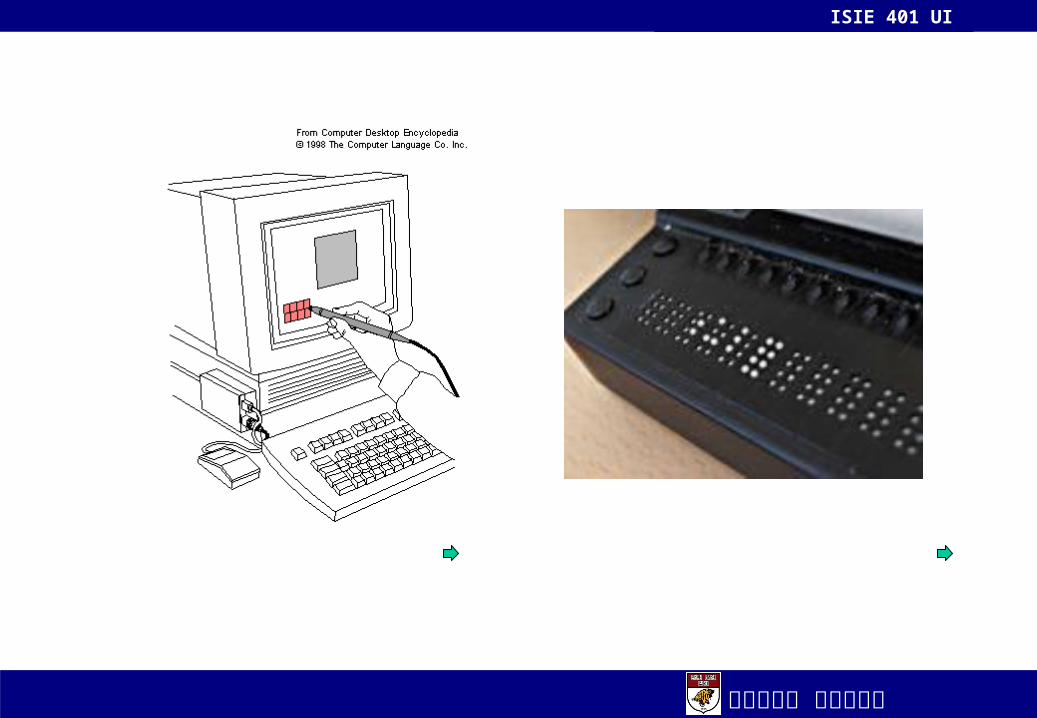
6 types of interaction tasks -- Select, Position, Orient, Path, Quantify, Text direct control (light pen, touchscreen, stylus) vs. indirect control (mouse, trackball, joystick, etc)
2. Direct-control pointing devices lightpen – incorporate a button – arm fatigue, hands obscuring part of the screen, users
removing hands from the keyboard, picking up the lightpen
고려대학교 산업공학과
ISIE 401 UI
touchscreen (fatigue, obscuring the screen, hand off keyboard, imprecise pointing, smudging of the display) – land-on strategy, lift-off strategy
pointing on the LCD surface – handwriting recognition, stylus2. Indirect-control pointing devices
more cognitive processing and hand-eye coordination mouse, trackball, joystick, trackpoint, touchpad, graphics tablet
4. Comparison of pointing devices direct pointing devices – fastest but the least accurate devices mouse for speed and accuracy, mouse was found to be faster than the trackpoint users’ tasks matter – browsing, precision pointing
5. Fitts’ Law the pointing time is a function of the distance and the width well established for adults users
6. Novel devices foot controls, eye-tracking (Midas touch problem), DataGlove ubiquitous computing and tangible user interfaces handheld devices
4. Speech and Auditory Interfaces1. Discrete-word recognition
recognize individual words spoken by a specific person – 90-98% reliability for 100- to 10,000-word or larger vocabularies
고려대학교 산업공학과
ISIE 401 UI
speaker dependent training, speaker independent system hands are busy: mobility required; eyes occupied:harsh or cramped conditions recognition rate – background sounds change, user is ill or under stress, similar vocabulary more demanding of working memory than the hand/eye coordination
2. Continuous-speech recognition difficulty in recognizing the boundaries between spoken words
3. Voice information systems4. Speech generation
synthesis – in some cases, removal of speech generation5. Non-speech auditory interfaces
audio tones – confirmation for most users, vital for the impaired; after 2 hrs, distraction auditory icons (familiar sounds), earcons
5. Displays – Small and Large1. Display technology
CRT, LCDs, Plasma panel, LEDs, Electronic ink, Braille displays2. Large displays
information wall displays (situation awareness), interactive wall displays, multiple desktop displays
3. Heads-up and helmet-mounted displays4. Mobile device displays
poor readability
고려대학교 산업공학과
ISIE 401 UI
5. Animation, image, and video digital photography, optical character recognition, videodisks, CD-ROMs, digital
versatile disks (DVDs), motion picture experts group (MPEG), MP3
6. Printers thermal printers, dot-matrix printers, inkjet printers, impact-line printers, laser printers plotters, photographic printers braille embossers three-dimensional printers
고려대학교 산업공학과
ISIE 401 UI
고려대학교 산업공학과
ISIE 401 UI
고려대학교 산업공학과
ISIE 401 UI
고려대학교 산업공학과
ISIE 401 UI
고려대학교 산업공학과
ISIE 401 UI
10. Collaboration2. Goals of Collaboration
collaboration by the goals and tasks of the participants: Focused partnership – collaboration between two or three people; email, chat, instant messages,
voice mail, telephone, video conferencing, SMS, photo exchanging Lecture or demo – one person sharing info with many users at remote sites; the start time and
duration is the same for all; no history keeping Conferences – groups communicate at the same time or spread out over time, but with
participants distributed in space; a record of previous conversation, blogs, wikis Structured work processes – let people with distinct organization roles collaborate on some task Electronic Commerce – negotiations can be distributed in time and space Meeting and decision support – face-to-face meeting with simultaneous contributions; anonymity Electronic commerce – customers browsing and comparing prices, accurate recording and rapid
dissemination of results Teledemocracy – produce consensus through online conferences, debates, and votes online communities – communities of interest (Cols), communities of practice (CoPs), networked
communities collaboratories telepresence – immersive SD VR
time-space matrix (Ellis et al., 1991)
고려대학교 산업공학과
ISIE 401 UI
3. Asynchronous Distributed Interfaces: Different Place, Different Time1. Electronic Mail
2. Newsgroups, listservers, discussion boards, conferences, blogs, and wikis newsgroups – organized into hierarchies to help users to find topics of interest listserv –individuals must subscribe to receive email notices online conference discussion board – evolved from bulletin board web-logs (blogs) wikis – collaborative web pages that are open for anyone to add or revise content online magazines, newsletters, journals
3. Online and networked communities topically focused and geographically dispersed shared goal, identity, or common interest and participate on a continuing basis
4. Synchronous Distributed Interfaces: Different Place, Same Time1. Chat, instant messaging, and texting
2. Audio and video conferencing video conferencing, DTVC (desktop videoconferencing) – slow response time, background
noise, inappropriate lighting, eye contact difficulty, small image size, privacy invasion, jerky motion
고려대학교 산업공학과
ISIE 401 UI
5. Face to Face Interfaces: Same Place, Same Time1. Electronic meeting rooms, control rooms, and public spaces
brainstorming, voting, and ranking parallel communication, anonymity, group memory, process structure, task support and
structure2. Electronic classrooms
고려대학교 산업공학과
ISIE 401 UI
11. Quality of Service
1. Introduction quality of service – time is precious; harmful mistakes should be avoided; reduce user
frustration focus on the decisions to be made by network designers and operators
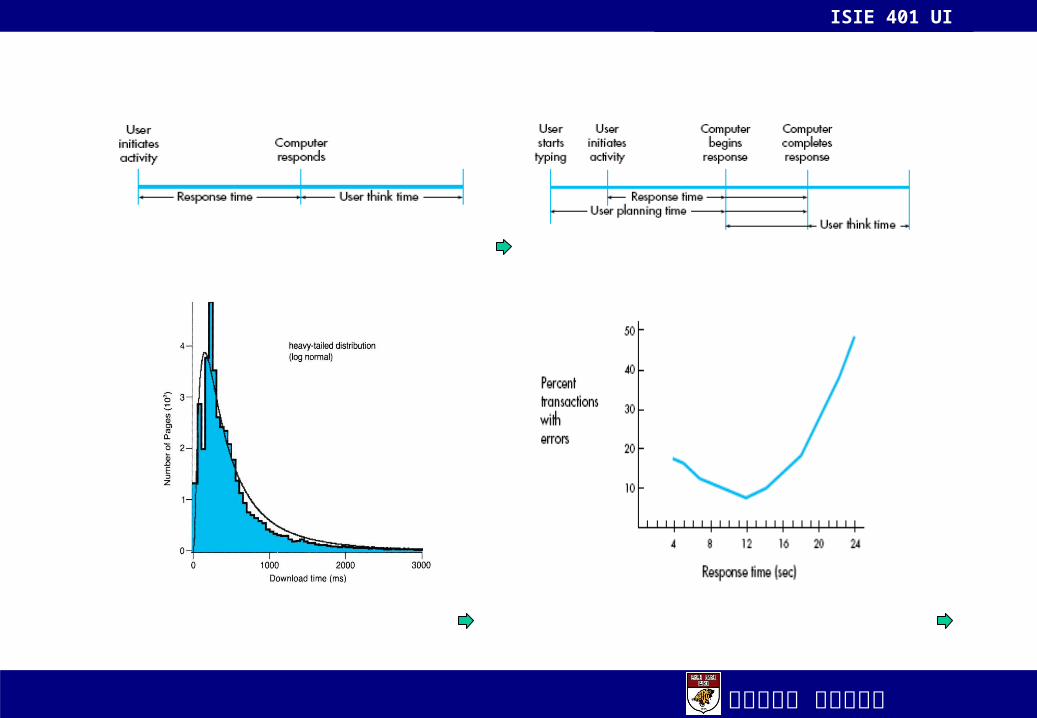
2. Models of Response-Time Impacts response time – the number of seconds it takes from the moment users initiate an activity
until the computer begins to present results o the display or printer lengthy (> 15 sec) response time – ↓ productivity,↑error rate, ↓satisfaction more rapid (< 1 sec) – ↑ productivity, ↑ error rate for complex tasks
display rate – the speed, in characters per second (cps), at which characters appear for the user to read – graphics in bytes per seconds
cognitive model of human performance in response time useful in making predictions, designing interfaces, formulating management policies
Robert B. Miller’s review (1968) – 17 situations where response time differ but the principle of closure, short-term memory limitations, and chunking still apply
1. Limitations of short-term and working memory George Miller (1956) – “the magical number seven – plus or minus two” seven
chunks of info. in working memory for 15 to 30 seconds – familiarity
고려대학교 산업공학과
ISIE 401 UI
STM processes perceptual input, whereas WM is used to generate and implement solutions
Highly volatile, disruptions cause loss in info, delays can require that the memory be refreshed
2. Sources of errors interference, delay – preferred response time long response time leads to wasted effort and more errors because a solution plan is
reviewed repeatedly short response times may generate a faster pace in which solution plans are prepared
hastily and incompletely3. Conditions for optimum problem solving
Wickelgren (1977) -- speed-accuracy tradeoffs feedback -- graphical dynamic progress indicators
3. Expectations and Attitudes acceptable response time – 2-second limit
1. previous experience2. individual’s tolerance for delays3. task complexity and the user’s familiarity with the task
longer response time – web-page content less interesting, lower in quality, negative user perception of the companies
three conjectures
고려대학교 산업공학과
ISIE 401 UI
4. User Productivity The nature of the task influence on changes in response time alter user productivity
With shorter system response times – works more quickly but decisions less than optimal with a data-entry task, three strategies on the response time
1. RT<1 sec, worked automatically without checking for the next data value2. RT>2, monitored the display carefully3. In between, users paced themselves
users will adapt their work style to the response time 5. Variability in Response Time
Extreme variation in response time is unsettling and should be prevented or acknowledged The effect of modest variations in response time
people detect 8-percent changes in a 2 or 4 sec response time a fixed short response time not for all actions but for classes of actions
modest variations in response time do not severely affect performance (adapting) but extreme variation should be prevented or acknowledged by the interface
With shorter RT, hasty decision; with longer RT, frustration of waiting burdened STM physiological effect of response time higher error rates, higher systolic blood pressure, more
pronounced pain symptoms with shorter response time6. Frustrating Experiences
major sources of problems – web browsing, e-mail, word processing interface redesign, software quality improvement, network reliability increases increased learning, careful use of services, self-control of their attitudes spam, viruses
고려대학교 산업공학과
ISIE 401 UI
고려대학교 산업공학과
ISIE 401 UI
12. Balancing Function and Fashion2. Error Messages
lack of knowledge, incorrect understanding, inadvertent slips1. Specificity2. Constructive guidance and positive tone
what uses need to do to set things right3. User-centered phrasing4. Appropriate physical format
mixed uppercase and lowercase messages optimal placement – proximity, consistent place (the bottom line), dialog box not obscuring
the problem alarm – users control
5. Development of effective messages upgrade performance and greater job satisfaction
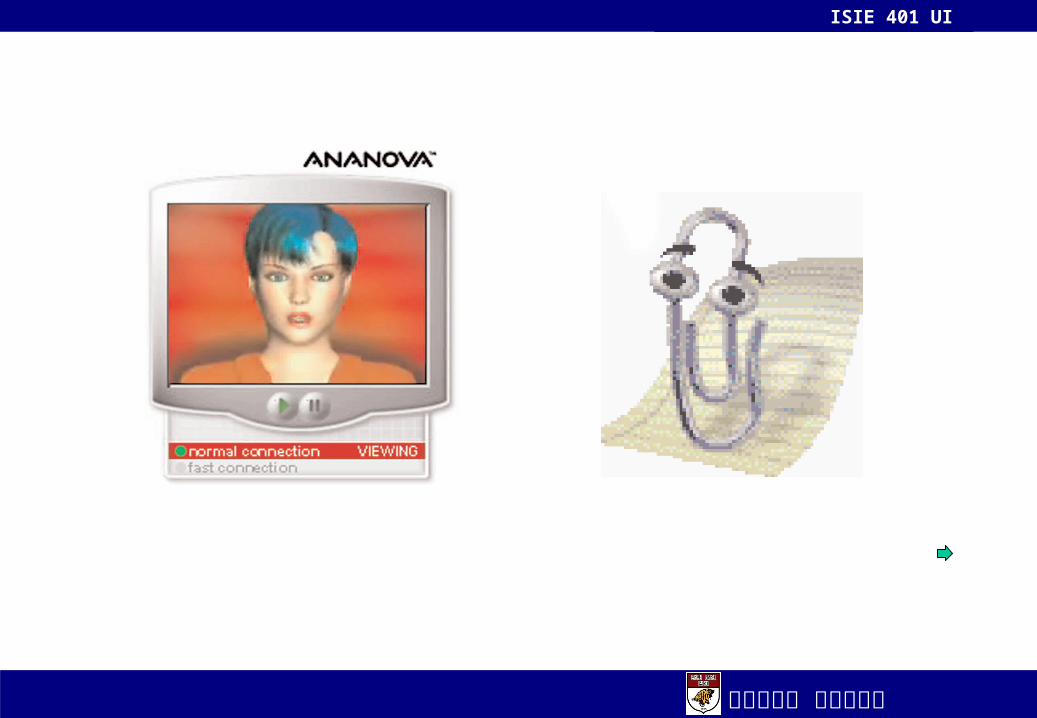
3. Nonanthropomorphic Design may give users an erroneous model of how computers work and the machine’s capacities to clarify the differences between people and computers an anthropomorphic interface can be distracting or produce anxiety for others Walker, Sproull, & Subramani (1994) – “incautiously adding human characteristics like face,
voice, and facial expressions could make the experience for users worse than better” external locus of control by animated characters – increase anxiety and reduce performance use of first-person pronouns – deceive, mislead, confuse users Interfaces should neither compliment nor condemn users, just comprehensible feedback
고려대학교 산업공학과
ISIE 401 UI
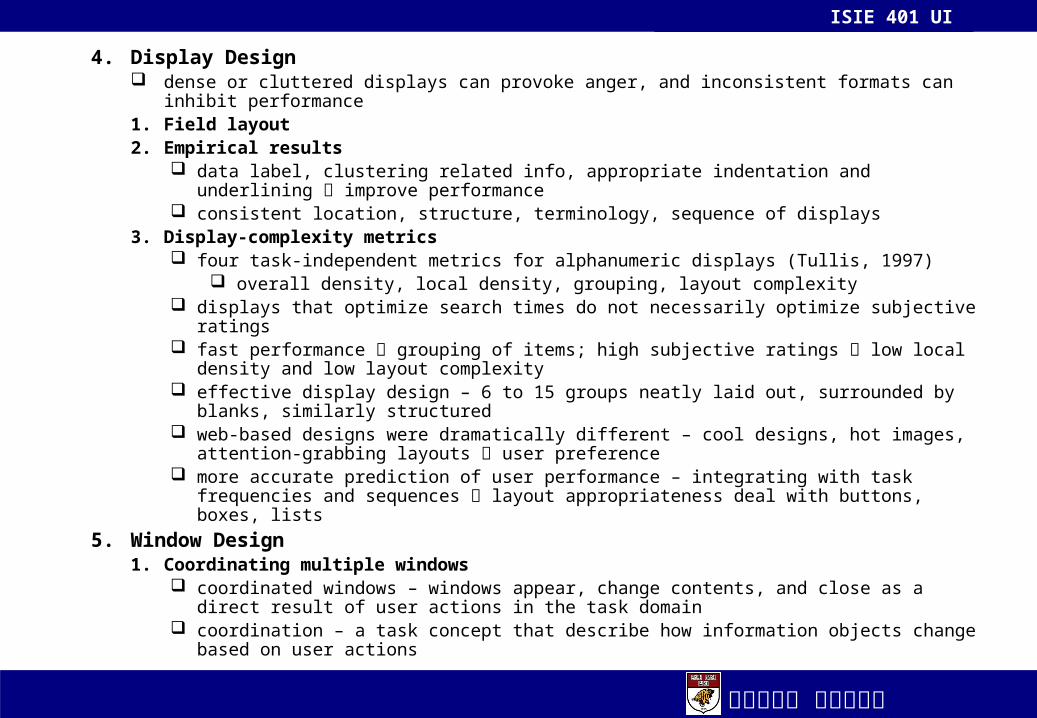
4. Display Design dense or cluttered displays can provoke anger, and inconsistent formats can inhibit performance1. Field layout2. Empirical results
data label, clustering related info, appropriate indentation and underlining improve performance consistent location, structure, terminology, sequence of displays
3. Display-complexity metrics four task-independent metrics for alphanumeric displays (Tullis, 1997)
overall density, local density, grouping, layout complexity displays that optimize search times do not necessarily optimize subjective ratings fast performance grouping of items; high subjective ratings low local density and low layout
complexity effective display design – 6 to 15 groups neatly laid out, surrounded by blanks, similarly structured web-based designs were dramatically different – cool designs, hot images, attention-grabbing
layouts user preference more accurate prediction of user performance – integrating with task frequencies and sequences
layout appropriateness deal with buttons, boxes, lists5. Window Design
1. Coordinating multiple windows coordinated windows – windows appear, change contents, and close as a direct result of user
actions in the task domain coordination – a task concept that describe how information objects change based on user actions
고려대학교 산업공학과
ISIE 401 UI
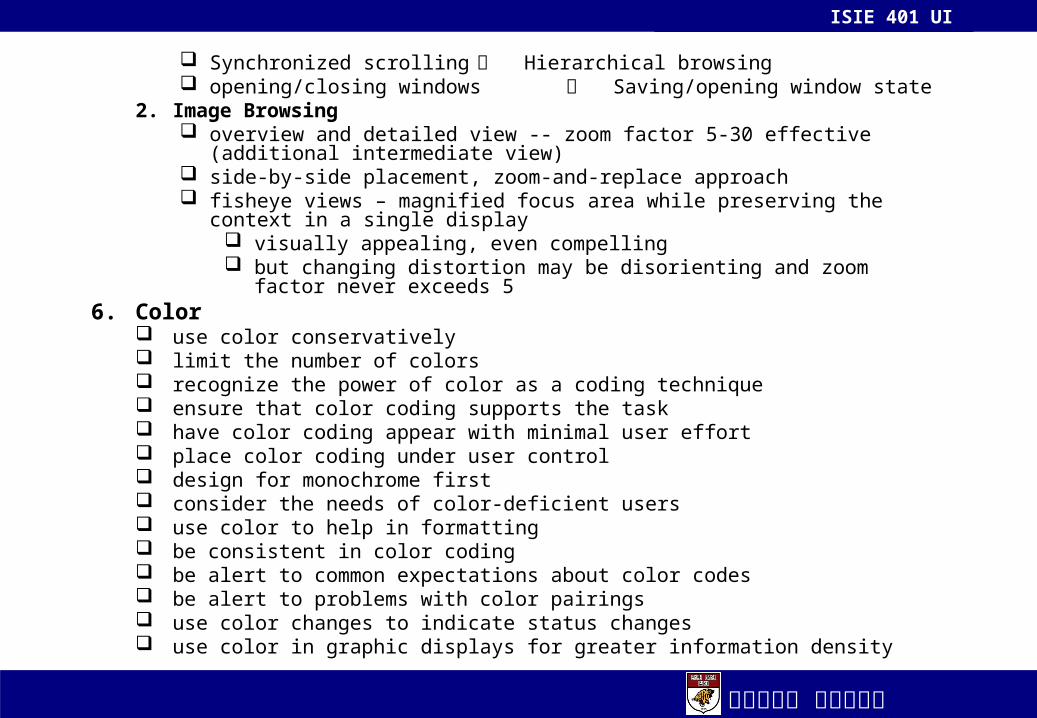
Synchronized scrolling Hierarchical browsing opening/closing windows Saving/opening window state
2. Image Browsing overview and detailed view -- zoom factor 5-30 effective (additional intermediate view) side-by-side placement, zoom-and-replace approach fisheye views – magnified focus area while preserving the context in a single display
visually appealing, even compelling but changing distortion may be disorienting and zoom factor never exceeds 5
6. Color use color conservatively limit the number of colors recognize the power of color as a coding technique ensure that color coding supports the task have color coding appear with minimal user effort place color coding under user control design for monochrome first consider the needs of color-deficient users use color to help in formatting be consistent in color coding be alert to common expectations about color codes be alert to problems with color pairings use color changes to indicate status changes use color in graphic displays for greater information density
고려대학교 산업공학과
ISIE 401 UI
고려대학교 산업공학과
ISIE 401 UI
14. Information Search and Visualization
1. Introduction information retrieval information gathering, seeking, filtering, or visualization database management data mining from data warehouses and data marts knowledge
networks or semantic webs information search using traditional UI – hurdle for novice users and an inadequate for experts task objects are represented by interface objects in structured relational databases, textual
document libraries, or multimedia document libraries task actions (browsing or searching) represented by interface actions (scrolling, zooming, joining,
or linking Tasks – specific/extended fact finding, exploration of availability, open-ended browsing and
problem analysis2. Searching in Textual Documents and Database Querying
SQL – requires training, and even then users make frequent errors natural-language queries – appealing but limited computer processing capacity form-fillin queries and query-by-example five-phase framework1. Formulation: expressing the search source, fields, phrases, variants2. Initiation of action: launching the search explicit, implicit initiation, dynamic query 3. Review of results: reading messages and outcomes sequence and cluster4. Refinement: formulating the next step error messages, history buffer5. Use: compiling or disseminating insight
고려대학교 산업공학과
ISIE 401 UI
3. Multimedia Document Searches image search -- query by image content (QBIC) search for distinctive features or search for
distinctive colors Map search – search by features Design or diagram search Sound search Video search Animation search
4. Advanced Filtering and Search Interfaces filtering with complex Boolean queries automatic filtering dynamic queries faceted metadata search collaborative filtering multilingual searches visual searches
5. Information Visualization the use of interactive visual representations of abstract data to amplify cognition visual-information-seeking mantra – overview first, zoom and filter, then details on demand Data type by task taxonomy (TTT) and seven tasks (Box 14.2)
고려대학교 산업공학과
ISIE 401 UI
1. 1-D 1inear data in a sequential manner – textual documents, dictionaries, alphabetical list of names interface-design issues include what fonts, color, size to use, and what overview,
scrolling, or selection methods to provide for users2. 2-D map data
maps, floor plans, newspaper layouts interface-domain features (size, color, opacity) user tasks – to find adjacent items, regions containing items, paths between items and to
perform the seven basic tasks3. 3-D world data
molecules, the human body, and buildings users’ tasks typically deal with continuous variables such as temperature or density cope with the position and orientation when viewing the objects potential problems of
occlusion and navigation overviews, landmarks, teleoperation, multiple views and TUI4. Multidimensional data
n attributes in a n-dimensional space (dynamic two-dimensional scattergram) tasks include finding patterns, clusters, correlations, gaps and outliers three-dimensional scattergram (disorientation and occlusion)
5. Temporal data items have a start and finish time, and that items may overlap finding all events before, after, or during time period and the seven basic tasks
고려대학교 산업공학과
ISIE 401 UI
6. Tree data7. Network data
shortest or least costly paths connecting two items or traversing the entire network8. Overview task
movable field-of-view box (zoom factors of 3 to 30), fisheye strategy9. Zoom task10. Filter task11. Details-on-demand task
simply click on an item to get a pop-up window with values of each of the attributes12. Relate task
proximity, containment, connection, color coding; highlighting13. History task
history of actions to support undo, replay, and progressive refinement14. Extract task15. Challenges for information visualization