Embed Size (px)
Citation preview
A Financial Social Accounting Matrix for the Integrated Macroeconomic Model for Poverty Analysis
Application to Cameroon with a Fixed-Price Multiplier Analysis1
By
Christian A. Emini* and Hippolyte Fofack**
Abstract: Cameroon is engaged in the Poverty Reduction Strategy Paper (PRSP) process, which emphasizes increased focus on poverty reduction in the design and implementation of growth and adjustment strategies. The Integrated Macroeconomic Model for Poverty Analysis (IMMPA) framework recently developed at the World Bank provides an analytical structure for supporting the PRSP process and quantifying poverty reduction strategies. Drawing on that framework, this paper provides a detailed financial social accounting matrix for the Cameroonian economy to serve as input into the construction of an IMMPA model for Cameroon. An analysis of this financial SAM shows that the dramatic fall in investment during the crisis period persisted in the post-devaluation growth period in the late 1990s. Continued low investment has implications for ongoing high unemployment rates and poor welfare indicators. This is illustrated by simulations based on fixed-price multiplier analysis, which highlight the potential growth and welfare benefits of increased public investment, following hypothetical debt relief and reduction of external debt servicing within the framework of the Highly Indebted Poor Countries Initiative.
JEL classification: C68, D31, D57, O11 Keywords: Backward and forward linkages, financial social accounting matrix, fixed-price multipliers, poverty reduction strategy papers, integrated macroeconomic model for poverty analysis (IMMPA) World Bank Policy Research Working Paper 3219, February 2004 The Policy Research Working Paper Series disseminates the findings of work in progress to encourage the exchange of ideas about development issues. An objective of the series is to get the findings out quickly, even if the presentations are less than fully polished. The papers carry the names of the authors and should be cited accordingly. The findings, interpretations, and conclusions expressed in this paper are entirely those of the authors. They do not necessarily represent the view of the World Bank, its Executive Directors, or the countries they represent. Policy Research Working Papers are available online at http://econ.worldbank.org. 1 *CEREG - University of Yaoundé II, formerly Université Laval (Quebec, Canada), and ** World Bank. This paper has benefited from discussions with Pierre-Richard Agénor and the authors would like to thank him for his assistance on various aspects of this research. We are grateful to Cadman Atta Mills, Chukwuma Obidegwu, Henning Jensen, Eduardo Haddad and Ernest Bamou for helpful comments on an earlier version of this paper, and Issouf Samaké and Raju Kalidindi for research assistance. The authors gratefully acknowledge the support provided by the World Bank Research Committee.
Pub
lic D
iscl
osur
e A
utho
rized
Pub
lic D
iscl
osur
e A
utho
rized
Pub
lic D
iscl
osur
e A
utho
rized
Pub
lic D
iscl
osur
e A
utho
rized
Pub
lic D
iscl
osur
e A
utho
rized
Pub
lic D
iscl
osur
e A
utho
rized
Pub
lic D
iscl
osur
e A
utho
rized
Pub
lic D
iscl
osur
e A
utho
rized
2
I. Introduction The persistence of poverty in a large number of developing countries that have been recipients of development assistance from the international community over the course of years has led to increased emphasis on poverty reduction by the international community, beginning in the late 1990s. The increased focus on poverty reduction was further motivated by the depth and widespread nature of poverty, especially in Sub-Saharan Africa, where a large number of countries, including those that embraced the path of economic reforms and stabilization programs, continued to face declining living standards (De Maio, Stewart and Van Hoeven [1999], Easterly [2001], Hillman [2002], Fofack [2002]).2 These efforts by the international community to increase the focus on poverty call for a better understanding of the constraints on poverty reduction in a relatively stable growth context, the transmission channels through which adjustment policies may affect the poor, and the possible trade-offs that poverty reduction may entail regarding the allocation of scarce resources and sequencing of policy reforms in the elaboration of poverty-reducing economic growth strategies. The Integrated Macroeconomic Model for Poverty Analysis (IMMPA) recently developed by the World Bank provides an analytical framework for assessing ex-ante and a priori the expected welfare effects of macroeconomic reforms and policies in the design of growth and poverty reduction strategies (Agénor, Izquierdo and Fofack [2003]). That analytical framework is dynamic in its approach and draws on the architecture of financial computable general equilibrium (FCGE) models. It emphasizes a number of issues, including the role of labor markets, informal employment, the transmission of policy and exogenous shocks to the poor, the urban-rural bias to capture the geographical dimension of poverty, the composition of government expenditure and credit market imperfection.3 It was specifically developed to enhance poverty reduction efforts in developing countries engaged in the PRSP process.4 The IMMPA framework also emphasizes the linkage between macroeconomic and household surveys. Its implementation requires comprehensive data and information at the household and individual level, household survey data, and at the aggregate level, national accounts. During its implementation, national accounts data are summarized in a financial social accounting matrix following the classification of households and institutional agents into six broad income categories.5 The financial social accounting matrix (financial SAM) provides an accounting record for the whole economy during a given period, and serves as a useful
2 For instance, despite the robust growth rates observed in Burkina Faso, notably in the post-devaluation growth period of the mid-1990s, poverty remains widespread, with headcount indices exceeding 45 percent in most geographical regions (Fofack, Monga and Tuluy [2001]). Similarly, De Maio et al. [1999] concluded that the welfare of the poor deteriorated during adjustment in Tanzania and Madagascar in the late 1980s, a period characterized by the implementation of comprehensive adjustment policies in these countries. 3 For further details on the analytical framework and detailed structure of the IMMPA model, see Agénor, Izquierdo, and Fofack [2003]. Note that this paper has been circulated in draft form since 2001. 4 PRSP stands for “Poverty Reduction Strategy Paper”; and countries engaged in the PRSP process include a large number of low-income countries with poor welfare and social indicators, unsustainable levels of external debt and good prospects for eligibility to debt relief under the enhanced HIPC Initiative. For further details on the background and progress on the implementation of the PRSP process, see Jeni Klugman [2002]. 5 These income categories include rural traded sector, rural non-traded sector, urban unskilled informal sector, urban unskilled formal sector, urban skilled formal sector, and capitalists. For further details on their selection see Agénor, Izquierdo and Fofack [2003], Chen et al. [2001].
3
guide to model building, welfare inference, and assessing the distribution of growth under certain restrictive conditions. Within the framework of the Highly Indebted Poor Countries (HIPC) Initiative, Cameroon reached the decision point in October 2000, and is engaged in the design and implementation of an IMMPA model to inform the PRSP process, which underpins its future growth strategies.6 This paper provides an integrated financial SAM of the Cameroonian economy and serves as input into the model-building process. The latest SAM of the Cameroonian economy focused on real sector activities and transactions, and was produced in 1998 using 1989 data. Since then, it has not been updated, despite the significant changes in the structure of the economy, which has witnessed growing informal sector activities and declining industrial production after a long and protracted economic crisis spanning the 1980s and 1990s. The integrated financial SAM proposed here is based on more recent data capturing the post-devaluation period in 1996, and provides an up-to-date coherent picture of the complexity of the economy. It focuses on both the real and the financial components of the economy, with special emphasis on the growing importance of informal sector activities. Drawing on the IMMPA analytical framework, it also provides an assessment of income and distributional effects of growth under fixed-prices multipliers assumption, and further insights on the functional and institutional distribution of income and flows of funds across the different institutional agents and sectors in the years following the devaluation of the CFA Franc.7 The results show a Cameroonian economy characterized by a relatively large concentration of resources and flows in urban areas, formal and informal sectors. Together, urban formal and informal economy account for over 80 percent of total gross value added; of which formal production account for 42 percent of total aggregate value added at the national level, and about 54 percent of total urban production. This leaves a sizable share, about 46 percent, to urban informal sector’s production. Moreover, investment continues to be dramatically low, significantly below the pre-crisis levels, as a result of extremely high levels of final consumption, and costs of external debt servicing. The significant fall in investment is believed to be partly responsible for the persistence of high unemployment rates and poverty recorded in most of the 1990s and beyond, a period also characterized by a dramatic fall in income. Additionally, under fixed-prices multipliers specification, a simulation of policy experiments highlights the potential benefits of increased public investments. Indeed, under the assumption of a reduction of external debt servicing consistent with the HIPC initiative, with the relief reallocated to public investment, a significantly higher economic growth rate is estimated, with the benefits of growth reflected in the rapid increase in household income and financial assets, and especially for the “capitalist households”. The remainder of the paper is organized as follows. Section II provides an overview of some of the key characteristic features of the Cameroonian economy, in light of the structure of the prototype IMMPA model. The Cameroonian economy shows a relatively large share of informal sector activities, an unsustainable level of external debt and a relatively high poverty 6 At accession to the HIPC Decision Point in the first phase of observed track record, the staff of the IMF and the World Bank jointly recommends targets for the completion point (the second phase) for the net present value of the ratio of debt to export and the debt-service ratio based on the debt sustainability analysis. Provided that the performance criteria are satisfactory during the second phase, the country will then receive support under the initiative. For further details, see Iqbal and Kanbur [1997]. 7 CFA stands for “Communauté Financière Africaine. ”
4
incidence. It also exhibits a number of structural rigidities, including credit rationing. Section III provides a detailed discussion of the architecture of the Cameroonian financial SAM, following the IMMPA analytical framework and structure. Section IV gives an overview of a financial SAM-based methodology for inference under fixed-prices multipliers assumptions. Section V focuses on intra- and inter-sectoral linkages analysis using fixed-prices multipliers, and simulations of policy experiments assessing the income and growth effects of increased public investment. Section VI provides some concluding remarks. II. Some Key Features and Characteristics of the Cameroonian Economy In addition to its PRSP status and the scope of its external debt, which provided the basis for its eligibility to relief under the Enhanced HIPC initiative, the Cameroonian economy exhibited a number of structural features and distortions in the 1980s and most of the 1990s. These features, most of which are of special interest to macroeconomist modelers and development economists, include: labor market segmentation and growing size of informal sector employment, chronic fiscal deficits, unsustainable external debt and accumulation of arrears, and persistence of urban-rural bias in the scope of poverty.8 The accumulation of sizable amount of arrears to private suppliers by the government is believed to have compounded and exacerbated the massive accumulation of nonperforming loans in the banking sector. Though a wide range of economic reforms were initiated in the late 1990s, notably in the area of banking and finance, public expenditure management and debt, macroeconomic stability remains at the core of the government’s policy agenda, and will continue to be so in the post-HIPC era. In the past, some of these structural features were singled out to partly explain the relatively poor performance of the Cameroonian economy in the decade preceding the 1994 devaluation. That decade was characterized as a lost one, as Cameroon recorded negative growth rates over most of the period, and witnessed a significant deterioration of living standards and general increase of poverty. The cycle of negative growth rates and falling output, including in the coffee, cocoa and oil sub-sectors, the key export products and sources of foreign exchange, resulted in a major deterioration of Cameroon’s balance of payments and a large accumulation of external debt and domestic arrears during most of the 1980s period and after. The GDP declined by over 6% per annum between 1986 and 1993, producing a 50% fall in per capita income (World Bank [1996]). With a rapidly falling per capita income, increased rates of poverty and deterioration of living standards followed. The headcount index increased from 40 to over 50.5% between 1984 and 1996. Poverty, which was already profound, continues to be widespread in rural areas, where the headcount index averaged over 68% in 1996 (World Bank [1998], Fambon et al. [2001]). Across socioeconomic groups, the deterioration of living standards observed at the national level has persisted. The increase of poverty was more rapid among informal sector workers (essentially self-employed independent workers) in the 1990s, despite the persistence of
8 Indeed, despite rapid increase of the headcount index in urban areas in the late 1980s and early 1990s, following economic contraction and record of successive negative growth rates, poverty remains largely a rural phenomenon, with rural areas accounting for over 75 percent of national poverty.
5
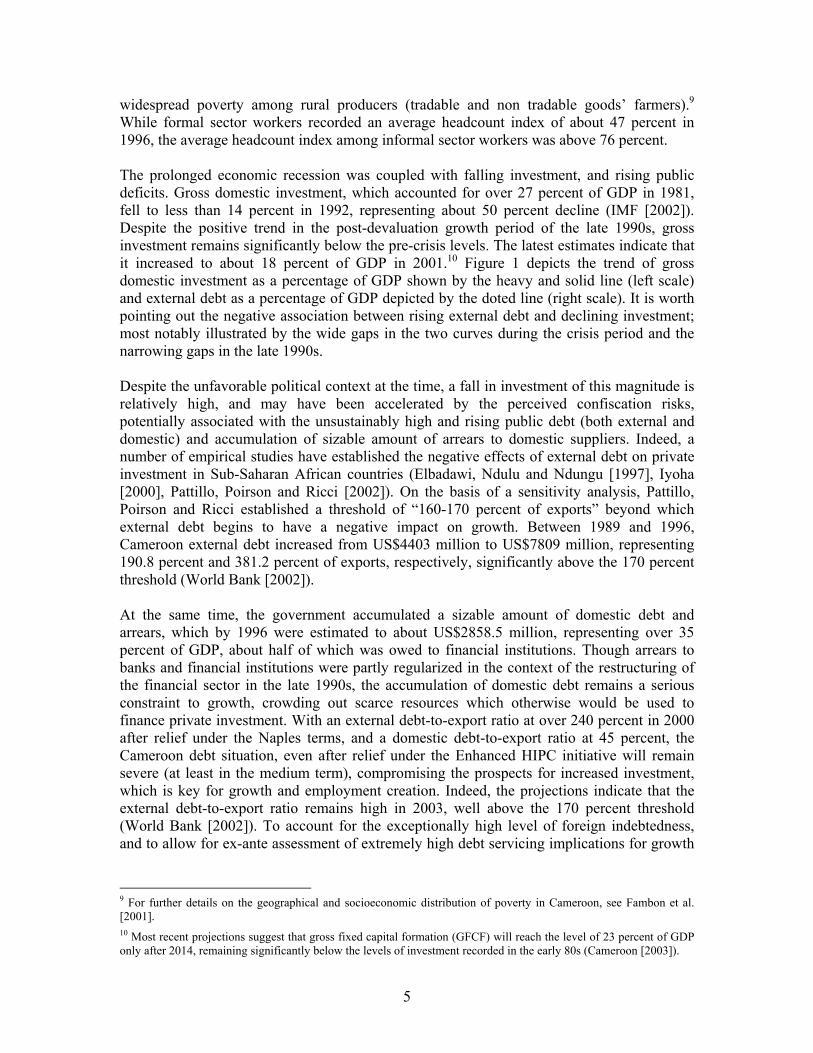
widespread poverty among rural producers (tradable and non tradable goods’ farmers).9 While formal sector workers recorded an average headcount index of about 47 percent in 1996, the average headcount index among informal sector workers was above 76 percent. The prolonged economic recession was coupled with falling investment, and rising public deficits. Gross domestic investment, which accounted for over 27 percent of GDP in 1981, fell to less than 14 percent in 1992, representing about 50 percent decline (IMF [2002]). Despite the positive trend in the post-devaluation growth period of the late 1990s, gross investment remains significantly below the pre-crisis levels. The latest estimates indicate that it increased to about 18 percent of GDP in 2001.10 Figure 1 depicts the trend of gross domestic investment as a percentage of GDP shown by the heavy and solid line (left scale) and external debt as a percentage of GDP depicted by the doted line (right scale). It is worth pointing out the negative association between rising external debt and declining investment; most notably illustrated by the wide gaps in the two curves during the crisis period and the narrowing gaps in the late 1990s. Despite the unfavorable political context at the time, a fall in investment of this magnitude is relatively high, and may have been accelerated by the perceived confiscation risks, potentially associated with the unsustainably high and rising public debt (both external and domestic) and accumulation of sizable amount of arrears to domestic suppliers. Indeed, a number of empirical studies have established the negative effects of external debt on private investment in Sub-Saharan African countries (Elbadawi, Ndulu and Ndungu [1997], Iyoha [2000], Pattillo, Poirson and Ricci [2002]). On the basis of a sensitivity analysis, Pattillo, Poirson and Ricci established a threshold of “160-170 percent of exports” beyond which external debt begins to have a negative impact on growth. Between 1989 and 1996, Cameroon external debt increased from US$4403 million to US$7809 million, representing 190.8 percent and 381.2 percent of exports, respectively, significantly above the 170 percent threshold (World Bank [2002]). At the same time, the government accumulated a sizable amount of domestic debt and arrears, which by 1996 were estimated to about US$2858.5 million, representing over 35 percent of GDP, about half of which was owed to financial institutions. Though arrears to banks and financial institutions were partly regularized in the context of the restructuring of the financial sector in the late 1990s, the accumulation of domestic debt remains a serious constraint to growth, crowding out scarce resources which otherwise would be used to finance private investment. With an external debt-to-export ratio at over 240 percent in 2000 after relief under the Naples terms, and a domestic debt-to-export ratio at 45 percent, the Cameroon debt situation, even after relief under the Enhanced HIPC initiative will remain severe (at least in the medium term), compromising the prospects for increased investment, which is key for growth and employment creation. Indeed, the projections indicate that the external debt-to-export ratio remains high in 2003, well above the 170 percent threshold (World Bank [2002]). To account for the exceptionally high level of foreign indebtedness, and to allow for ex-ante assessment of extremely high debt servicing implications for growth
9 For further details on the geographical and socioeconomic distribution of poverty in Cameroon, see Fambon et al. [2001]. 10 Most recent projections suggest that gross fixed capital formation (GFCF) will reach the level of 23 percent of GDP only after 2014, remaining significantly below the levels of investment recorded in the early 80s (Cameroon [2003]).
6
and poverty reduction in the elaboration of the Cameroon’s IMMPA model, we emphasize the external sector in the real and financial components of the updated financial SAM.
Figure 1: External Debt and Gross Domestic Investment 1980 – 2001
Source: World Economic Outlook (IMF [2002]). The sequence of negative growth rates and falling investment reduced the government’s prospects for resource mobilization and contributed to accumulation of fiscal deficits between 1985 and 1995. Expressed as percentage of GDP, the scope of public deficit (including grants) increased from 1.6 to 13%, which is quite high (Beckerman [2000]). The Government responded to the growing deficit by adopting policies to reduce public expenditures, particularly the size of public service wage bill through a number of measures, including direct cuts in civil servants’ salaries, a hiring freeze and public sector downsizing, privatization of public enterprises, and cuts in public expenditures allocated to social services.11 In the face of the hiring freeze in the public sector and falling aggregate investment, unemployment increased rapidly, contributing to the aggravation of poverty, especially in the absence of effective social safety net programs and the government’s inability to ensure the delivery of essential social services to the poor and vulnerable groups. Urban unemployment rose sharply to reach 8% in 1996. More recent statistics suggest that unemployment increased to about 17% in 2001, and in the two largest cities, Yaoundé and Douala, it increased to 31% and 24%, respectively (Cameroon [2002], Bamou [2002]).
11 Real public sector wages suffered a 70 percent cut in 1993; and nominal public sector wages remained frozen in most of the 1990s, despite the impact of the devaluation.
0
5
10
15
20
25
30
1980 1982 1984 1986 1988 1990 1992 1994 1996 1998 2000
Gro
ss d
omes
tic in
vest
men
t to
GD
P (%
)
0
20
40
60
80
100
120
Tota
l ext
erna
l deb
t to
GD
P (%
)Gross dom. Inv. In % of GDP(left scale )
External debt to GDP ratio ( %)(right scale )
7
Much has been written on the possible causes of the relative poor performance of the Cameroonian economy over the decade preceding the devaluation of the CFA franc: an unfavorable international context characterized by an average 60% deterioration in the external terms of trade following a sharp decline of coffee, cocoa and oil prices, the key export products; accumulation of domestic arrears, which seriously squeezed liquidity for private suppliers and banks; loss of competitiveness of the Cameroonian economy and more generally of a number of CFA franc countries of the sub-region, partly due to overvalued CFA Franc; the emergence of the Dutch disease, with a dramatic fall in agricultural and industrial production and increased reliance on oil revenues (Blandford et al. [1995], World Bank [1996, 1998], Njinkeu and Bamou [2000], Amin [2002]).12 In addition, the downward adjustment of real wages in the formal public sector, which resulted in a 70% decline in civil servants’ salaries in 1993 may partly explain the rapid acceleration of urban poverty in the 1990s; to the extent that fiscal contraction (cuts in public spending and a hiring freeze) was at the heart of the stabilization program in a recessionary context of falling public and private investment. These policies led to over 12% reduction in the size of the civil service between 1995 and 1999, and were partly successful in reducing the fiscal pressure on public finance.13 Even though the fiscal balance remained negative in the second half of the 1990s, it was relatively small, and since 2000, surpluses have been recorded, with the highest of 2.4% of GDP attained in 2001. However, in a context of continued low gross fixed capital formation, especially in the primary and secondary sector, the welfare and social costs of some of the policies embedded in the stabilization program of the 1990s continues to be felt. In particular, unemployment rates continued to rise, and in the absence of an effective unemployment benefits system, the deterioration of welfare, especially among poor households with no safety nets, has been a source of concern. In urban areas where most households derive their income from wages, the short-term effect of some of these policies were even more direct, with a number of welfare and behavioral consequences translated through the labor market (World Bank [1996]).14 In a highly segmented labor market, informal sector activities grew rapidly to account for over 51% of GDP in 2000, from 41% in 1990 (Cameroon DSCN [2000]). To account for this characteristic feature of the Cameroonian economy, labor market segmentation, whether imposed by geographical factors, sector of employment, or efficiency wages considerations, is an important aspect of the Cameroon’s financial SAM. This financial SAM also emphasizes among other things, urban informal sector employment, rural tradable and non-
12 By 1985 oil revenues and production accounted for over 65 percent of GDP in a country which up to the early 1980s derived over 90 percent of its GDP from agriculture; Benjamin and Devarajan [1985] emphasize the Dutch disease as a possible cause of the poor performance of the Cameroonian economy from the early 1980s and onward. 13 There may be other reasons to explain the rapid increase of poverty: in the 1998 World Bank Country Assistance Strategy to Cameroon, it is stated that “the post-devaluation growth rates were not high enough to absorb new entrants to the labor market or those loosing public sector jobs; no special employment generating program was started in either urban or rural areas, and there were no effective social safety nets.” 14 It has long been documented that labor markets play an important role in the transmission process of macroeconomic policy shocks and structural adjustment policies (Agénor [2001], Horton et al. [1994]); and the role of labor market in alleviating poverty, especially in urban areas, is crucial.
8
tradable sector employment in the production and demand sides, and in the classification of economic agents.15 Indeed significant changes did occur in the labor market and distribution of labor force across the different income groups during the implementation of the stabilization program. These changes were marked by growing informal sector activities and employment (both skilled and unskilled), compensating the declining level of public sector employment.16 Public sector employment (essentially public administration and excluding public enterprises), which accounted for over 6.1% of total labor force, and over 41% of formal sector employment in 1992 declined to less than 4.5% of total labor force by 1997, accounting for about 36% of total formal sector employment. At the same time, informal sector employment, which was already high, increased even further, from 85.2 to about 88%. However, given the skill mix of the labor force engaged in informal sector activities, the extremely high rate of informal sector employment may be viewed as a disguised form of unemployment, especially in the absence of alternative employment opportunities in the formal sector. In any case, informal sector employment is quite high, even by developing countries standards. In Latin American countries where informal sector employment also grew in importance during the 1980s and 1990s, it accounted for 50% of total employment at its peak in 1992. Similarly in Kenya and Ghana where informal sector employment followed a similar path in the 1990s, it accounted for about 60% and 45% of total labor force, respectively (Horton et al. [1994], Agénor [1996]).17 Informal sector employment in Cameroon has a number of other characteristic features, including self-employment, limited proportion of hired labor, heterogeneity of labor force, and ease of entry. The relative ease of entry partly reflects ongoing wage flexibility and low employment security. This has a number of consequences on the structure and composition of labor force in that sector. Indeed, with the hiring freeze in effect in the formal public sector, and given the limited opportunities and alternative for formal employment, especially in a context of declining investment in the formal private sector, graduating students, skilled workers entering the labor market, and rural-to-urban migrant workers were primarily absorbed by the informal sector, which became even more heterogeneous. However, the apparent heterogeneity of labor in the informal sector, which has both skilled and unskilled workers, is not reflected in the wage structure. Hence we do not make a distinction between the different sub-categories of labor in the informal sector (on the basis of workers’ skills) in the construction of the financial SAM. The persistence of informal-formal wage differentials, illustrated by a large bias in the headcount index between these two income groups, and despite the large cut in public sector wages and growing size of skilled labor engaged in informal sector activities is worth noting.
15Labor market segmentation may also be induced by government’s intervention in the form of minimum wages and trade unions, which may prevent equalizing wages across sectors (Agénor [2000]). However, wages are highly flexible in Cameroon, despite the minimum wage legislation and trade unions have limited impact in wage-setting decisions, as their influence has declined significantly over time. 16 Informal sector workers refer to self-employed who are engaged in small-scale labor-intensive activities such as tailoring, trading, food preparation, and trading. These workers are often regarded as unemployed as they cannot be included in national employment statistics, but they are often highly productive and make a significant contribution to national income. 17 With informal sector employment accounting for about 90 percent of total labor force, Bangladesh is one of the countries which comes close to Cameroon, for further details see Devarajan, Ghanem and Thierfelder [1999].
9
As mentioned earlier, while the headcount index in the informal sector group is over 76%, a significantly lower rate, about 47%, is recorded in the formal sector. In the absence of minimum wage legislation in effect, and persistent wage differentials between formal and informal sector employment, the growing size of the latter may be largely driven by a decline of labor demand in the formal public sector, following the hiring freeze imposed in 1993 in response to the fiscal crisis and declining private investment, particularly in the secondary sector.18 The growing size of informal sector employment in urban areas may also be partly attributed to the excess supply of labor, especially in urban areas, fuelled by rural-urban migration driven by relative wages. Labor market segmentation, which is common to most developing countries, also has a geographical and inter-sectoral dimension where the urban-rural and socioeconomic gaps in the measurement of welfare are driven by systematic income and wage differentials across sectors of employment and geographical regions.19 Cameroon is not an exception to this, and even within a given geographical region, wage differences imposed by sector of employment exist and can be important, irrespective of skills. This is illustrated by the highly confined nature of primary sector activities, largely dominated by agricultural production in rural areas, where per capita income and wages are lower than the urban and national averages, though production falling within the realm of primary sector may be found in urban areas (generally in the form of industrialized agricultural production mainly by capitalists for exports). Also, despite the relatively low contribution of agricultural production and primary sector production to the aggregate GDP, an overwhelmingly large proportion of active labor force continues to reside in rural areas; and the relatively low contribution of primary sector production to aggregate output (averaging 22% over the 1990s) may be a reflection of low value added and productivity of the sector. In the next section, we draw on the financial SAM analysis to shed more light on the geographical and sectoral contribution to aggregate gross value added. Also, while the labor force in urban areas is largely heterogeneous (unskilled and skilled workers, with the latter mainly employed in the formal public and private sector, and capitalist group), it is more homogeneous in Cameroon’s rural areas. However, despite the relative homogeneity of rural labor force, differences in wage setting mechanisms exist. Unskilled workers can have significantly large disparities in wages and income depending on the nature of their employment (tradable versus non tradable agricultural production).20 Though smaller in size, the tradable group has a higher per capita income and a relatively large contribution to aggregate output, a reflection of higher wages and value added.21 By contrast, the relatively low contribution of non tradable agricultural production to overall aggregate output is reflected in the group’s overall income, which is about the lowest and not commensurate with its size, about the largest income group in Cameroon. We fully take into account the segmented nature of the labor market in the construction of Cameroon’s financial SAM. In particular, we make a clear distinction between urban and rural production in the 18 Prior to the imposition of hiring freeze, public sector employment accounted for over 75 percent of total formal employment in Cameroon. 19 Indeed, most studies of labor markets in developing countries indicate much segmentation, rigidity and unemployment (Ndulu [1991]). 20 Non tradable rural agricultural sectors are essentially engaged in subsistence agricultural production, and a large share of their income (wages) is derived as imputed values of home consumption of own production. 21 This group is engaged in the production of a number of products for exports, including coffee, cocoa, timber, banana, and cotton.
10
construction of current and capital accounts of economic agents, along the lines of the prototype IMMPA framework (Agénor, Izquierdo and Fofack [2003]). Cameroon reversed the trend of negative growth rates in 1995 when, at about 3%, GDP growth was positive for the first time in over 10 years (World Bank [1996]). The growth process continued in most of the second half of the 1990s. Between 1995 and 2001, Cameroon achieved average growth rates of about 4.7% (IMF [2002]). Annex I provides a summary of key economic and social indicators between 1981 and 2001. These indicators emphasize most notably national income growth, fiscal and external accounts. Despite the resumption of positive growth rates, Cameroon continues to face difficulties in its attempts to curb rising unemployment and poverty. Poverty remains widespread and unemployment has been growing with a rising trend: the latest estimates from government officials indicate an average unemployment rate of 17% by end-2001, representing a 13% increase since 1993 (Bamou [2002]). Under this unfavorable trend in welfare, attaining the government’s objective of halving unemployment by 2010 may appear as a serious challenge, especially given the structure of the economy, which during the post-devaluation growth period has been skewed. Indeed, the post-devaluation growth period of the second half of the 1990s was largely driven by agricultural production and services. These sectors have low prospects for employment creation in the Cameroonian context, where subsistence agriculture, characterized by sizable home consumption of own production and an extremely low forward linkages index, continues to account for most of the rural production. This apparent trend in the growth process, with a shift toward primary and tertiary sector production and a decline in the secondary sector’s contribution is not consistent with the government’s poverty reduction strategy, which emphasizes industrial production as the engine of growth and employment creation (Cameroon [2003] and World Bank [2000a]).22 The vulnerability of the Cameroonian economy, and particularly its external position, is further exacerbated by the fact that exports have remained concentrated in few commodities. Since 1995, timber, coffee, cocoa and oil exports have consistently accounted for over 73% of total export revenues, on average. In the absence of further diversification, negative terms of trade shocks from declines in commodity prices and/or falling volume of production could have devastating effects on growth and poverty, even with Cameroon’s access to relief under the HIPC initiative. Under these conditions, and in light of the consistently declining trade surplus observed during most of the post-devaluation growth period, it is highly likely that Cameroon will continue to rely on external financing.23 In particular, the projections indicate that the net present value of total debt after assistance under the enhanced HIPC Initiative will remain high, with debt service-to-government-revenue ratio falling below 100 percent only after the year 2007, notwithstanding the declining trend (World Bank [2000b]).24 The architecture of the proposed financial SAM emphasizes the external sector and real and 22 Between 1990 and 2000, the contribution of the secondary sector to aggregate output and GDP declined by 34%; it now represent about 21% of GDP, from 32% 10 years ago. At the same time, the contribution of the tertiary sector increased by 21.1%, from 46.9 to over 56.8%, owing mainly to the growing share of informal sector activities. 23 Since 1995, the trade surplus recorded in the post-devaluation export boom has been declining, and between 1995 and 2000, it fell to US$161.7 million from over US$667.2 million (Cameroon, DSCN [2000]). 24 The projections indicate that the net present value of total debt after assistance under the enhanced HIPC will decrease from about US$3.5 billion to US$2.7 billion between 2003 and 2008. During the same period, debt service-to-government-revenue ratio will decrease from about 147% to 80%.
11
financial flows between Cameroon and the rest of the world. It also emphasizes inter- and intra-sectoral flows of funds and the accumulation process to shed more light on the structure of the Cameroonian economy and to allow for ex-ante simulations of growth and income effects of increased public investment and recurrent expenditures. III. An IMMPA-Based Financial SAM for the Cameroonian Economy Cameroon’s financial SAM draws on the prototype IMMPA framework and can be viewed as a combination of the flow-of-funds (FOF) and social accounting matrix (SAM) approaches to macroeconomics.25 It is comprehensive and provides details of the real-financial transactions and flows that occurred between economic agents during 1995/1996 fiscal year.26 These transactions and flows are in current prices. They are underpinned by 59 accounts summarized into nine key macroeconomic aggregate accounts: changes in assets and liabilities, capital accounts of economic agents, exports and imports, offers and demands for composite goods, production for domestic markets, sectors of production, current accounts of economic agents, and production factors. This structure of accounts draws on the IMMPA’s scheme, particularly the production sectors and household groups. Annex II provides the details of the Financial Social Accounting Matrix. Cameroon’s financial SAM departs from past tradition where social accounting matrices focused exclusively on the real side of the economy (Pyatt and Round [1990], Easterly [1989]). It covers the real and financial variables of the economy. Its upper left corner (accounts 1-36) concerns real variables, while its lower left and right corner (accounts 37-59) concern the financial variables and flows between agents. The linkages between the real and financial aspects of the economy are provided by public and private savings shown as a diagonal matrix in the lower left-hand part of the financial SAM. The savings are presented in the form of flows in the capital accounts and changes in assets and liabilities accounts of economic agents. Savings may be viewed as equivalent to changes in net worth, where net worth includes both physical capital and net financial assets. The rows of this financial SAM account for the income (resources), and the columns account for expenditures (uses) by economic agents. Reading across the row of the current accounts of the public sector (row 14), we get public value added, indirect taxes (consumption and production taxes, imports and exports) minus subsidies, and direct taxes from the private sector, transfers from the rest of the world, and other transfers from the Central Bank to the Government. Altogether, the sum across row 14 provides the aggregate current account of the public sector or the total resources that accrued to the public accounts during 1995-1996. These resources are estimated at US$1.67 billion, representing about 18% of GDP. Taxes (direct and indirect) account for over 65% of the total, of which direct taxes raised from individual income represent about 10%. These resources from direct taxes are lower than taxes levied on imports and exports, which altogether accounts for over 15% of aggregate revenues. Though relatively low, this contribution of direct taxes to fiscal revenues in the
25 The FOF methodology emphasizes the equality of sources and uses of funds distinguished between current and capital accounts. 26 The real part of the SAM was constructed using Supply and Use Table, Integrated Economic Accounts and other miscellaneous data from the Cameroon’s Department of Statistics and National Account (DSCN [1997, 1998, 1999]); while financial data were mainly obtained from documents published by the Central Bank of Central Africa’s countries (BEAC [1997], COBAC [1995, 1996]).
12
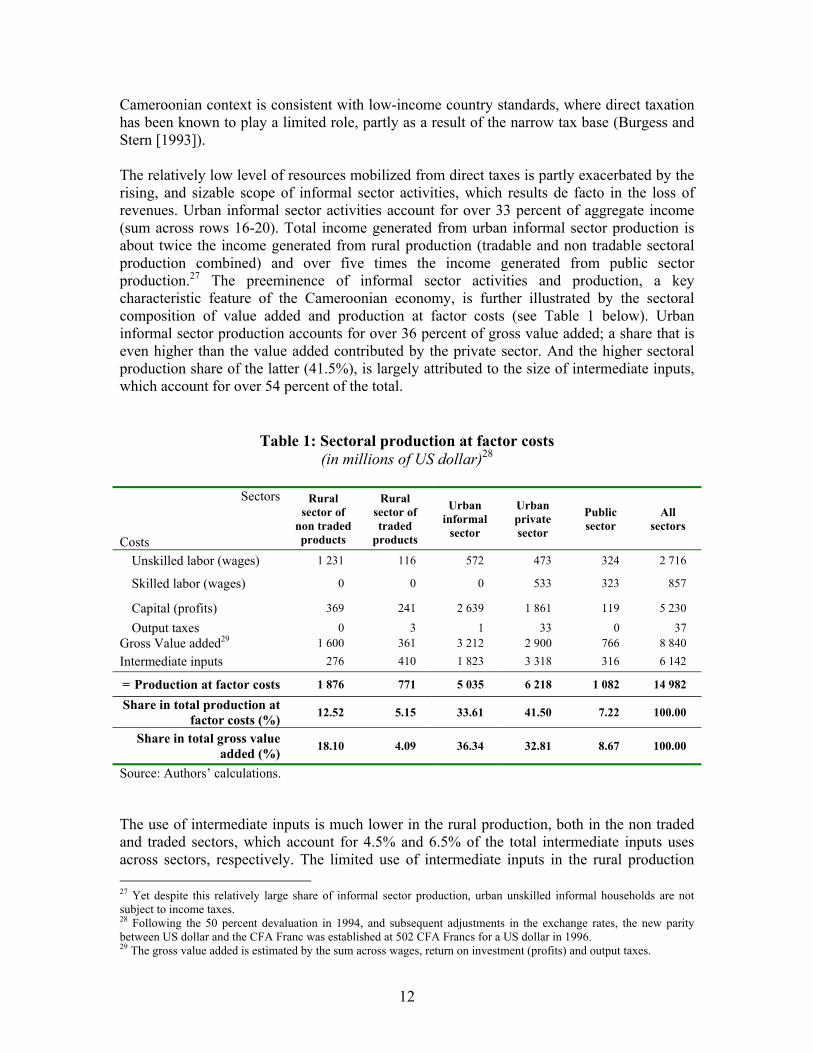
Cameroonian context is consistent with low-income country standards, where direct taxation has been known to play a limited role, partly as a result of the narrow tax base (Burgess and Stern [1993]). The relatively low level of resources mobilized from direct taxes is partly exacerbated by the rising, and sizable scope of informal sector activities, which results de facto in the loss of revenues. Urban informal sector activities account for over 33 percent of aggregate income (sum across rows 16-20). Total income generated from urban informal sector production is about twice the income generated from rural production (tradable and non tradable sectoral production combined) and over five times the income generated from public sector production.27 The preeminence of informal sector activities and production, a key characteristic feature of the Cameroonian economy, is further illustrated by the sectoral composition of value added and production at factor costs (see Table 1 below). Urban informal sector production accounts for over 36 percent of gross value added; a share that is even higher than the value added contributed by the private sector. And the higher sectoral production share of the latter (41.5%), is largely attributed to the size of intermediate inputs, which account for over 54 percent of the total.
Table 1: Sectoral production at factor costs (in millions of US dollar)28
Sectors
Costs
Rural sector of
non traded products
Rural sector of traded
products
Urban informal
sector
Urban private sector
Public sector
All sectors
Unskilled labor (wages) 1 231 116 572 473 324 2 716
Skilled labor (wages) 0 0 0 533 323 857
Capital (profits) 369 241 2 639 1 861 119 5 230
Output taxes 0 3 1 33 0 37 Gross Value added29 1 600 361 3 212 2 900 766 8 840 Intermediate inputs 276 410 1 823 3 318 316 6 142
= Production at factor costs 1 876 771 5 035 6 218 1 082 14 982
Share in total production at factor costs (%) 12.52 5.15 33.61 41.50 7.22 100.00
Share in total gross value added (%) 18.10 4.09 36.34 32.81 8.67 100.00
Source: Authors’ calculations. The use of intermediate inputs is much lower in the rural production, both in the non traded and traded sectors, which account for 4.5% and 6.5% of the total intermediate inputs uses across sectors, respectively. The limited use of intermediate inputs in the rural production 27 Yet despite this relatively large share of informal sector production, urban unskilled informal households are not subject to income taxes. 28 Following the 50 percent devaluation in 1994, and subsequent adjustments in the exchange rates, the new parity between US dollar and the CFA Franc was established at 502 CFA Francs for a US dollar in 1996. 29 The gross value added is estimated by the sum across wages, return on investment (profits) and output taxes.
13
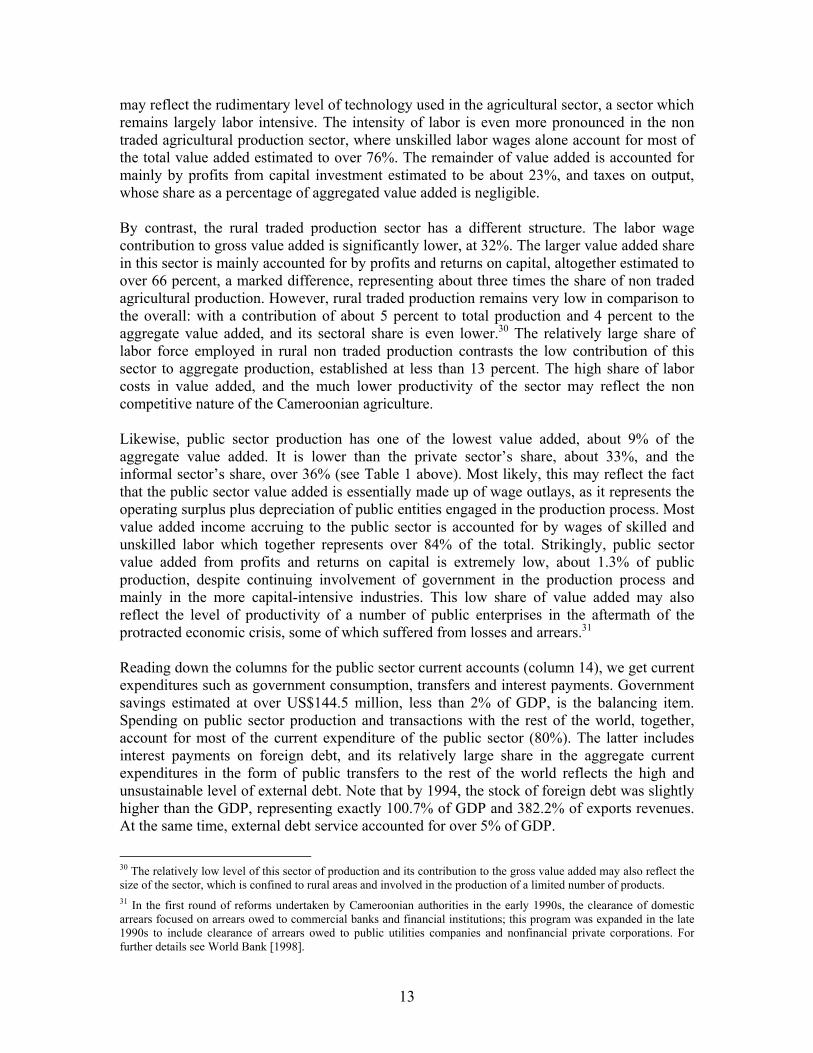
may reflect the rudimentary level of technology used in the agricultural sector, a sector which remains largely labor intensive. The intensity of labor is even more pronounced in the non traded agricultural production sector, where unskilled labor wages alone account for most of the total value added estimated to over 76%. The remainder of value added is accounted for mainly by profits from capital investment estimated to be about 23%, and taxes on output, whose share as a percentage of aggregated value added is negligible. By contrast, the rural traded production sector has a different structure. The labor wage contribution to gross value added is significantly lower, at 32%. The larger value added share in this sector is mainly accounted for by profits and returns on capital, altogether estimated to over 66 percent, a marked difference, representing about three times the share of non traded agricultural production. However, rural traded production remains very low in comparison to the overall: with a contribution of about 5 percent to total production and 4 percent to the aggregate value added, and its sectoral share is even lower.30 The relatively large share of labor force employed in rural non traded production contrasts the low contribution of this sector to aggregate production, established at less than 13 percent. The high share of labor costs in value added, and the much lower productivity of the sector may reflect the non competitive nature of the Cameroonian agriculture. Likewise, public sector production has one of the lowest value added, about 9% of the aggregate value added. It is lower than the private sector’s share, about 33%, and the informal sector’s share, over 36% (see Table 1 above). Most likely, this may reflect the fact that the public sector value added is essentially made up of wage outlays, as it represents the operating surplus plus depreciation of public entities engaged in the production process. Most value added income accruing to the public sector is accounted for by wages of skilled and unskilled labor which together represents over 84% of the total. Strikingly, public sector value added from profits and returns on capital is extremely low, about 1.3% of public production, despite continuing involvement of government in the production process and mainly in the more capital-intensive industries. This low share of value added may also reflect the level of productivity of a number of public enterprises in the aftermath of the protracted economic crisis, some of which suffered from losses and arrears.31 Reading down the columns for the public sector current accounts (column 14), we get current expenditures such as government consumption, transfers and interest payments. Government savings estimated at over US$144.5 million, less than 2% of GDP, is the balancing item. Spending on public sector production and transactions with the rest of the world, together, account for most of the current expenditure of the public sector (80%). The latter includes interest payments on foreign debt, and its relatively large share in the aggregate current expenditures in the form of public transfers to the rest of the world reflects the high and unsustainable level of external debt. Note that by 1994, the stock of foreign debt was slightly higher than the GDP, representing exactly 100.7% of GDP and 382.2% of exports revenues. At the same time, external debt service accounted for over 5% of GDP.
30 The relatively low level of this sector of production and its contribution to the gross value added may also reflect the size of the sector, which is confined to rural areas and involved in the production of a limited number of products. 31 In the first round of reforms undertaken by Cameroonian authorities in the early 1990s, the clearance of domestic arrears focused on arrears owed to commercial banks and financial institutions; this program was expanded in the late 1990s to include clearance of arrears owed to public utilities companies and nonfinancial private corporations. For further details see World Bank [1998].
14
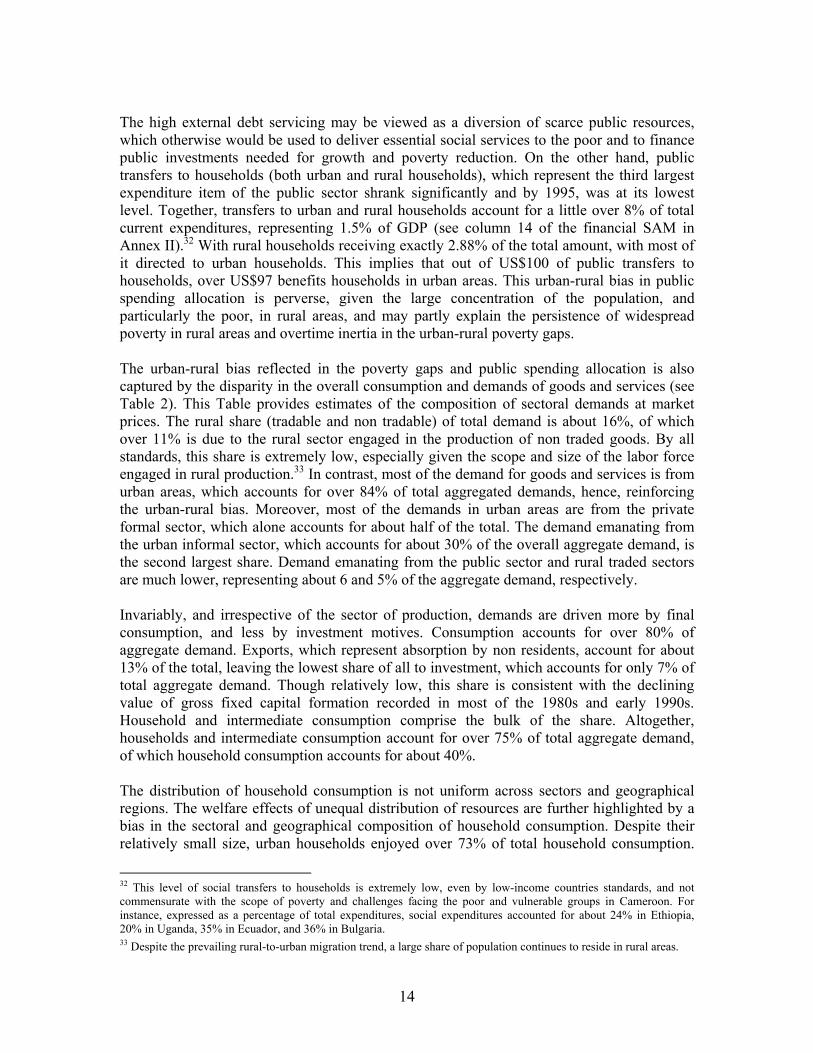
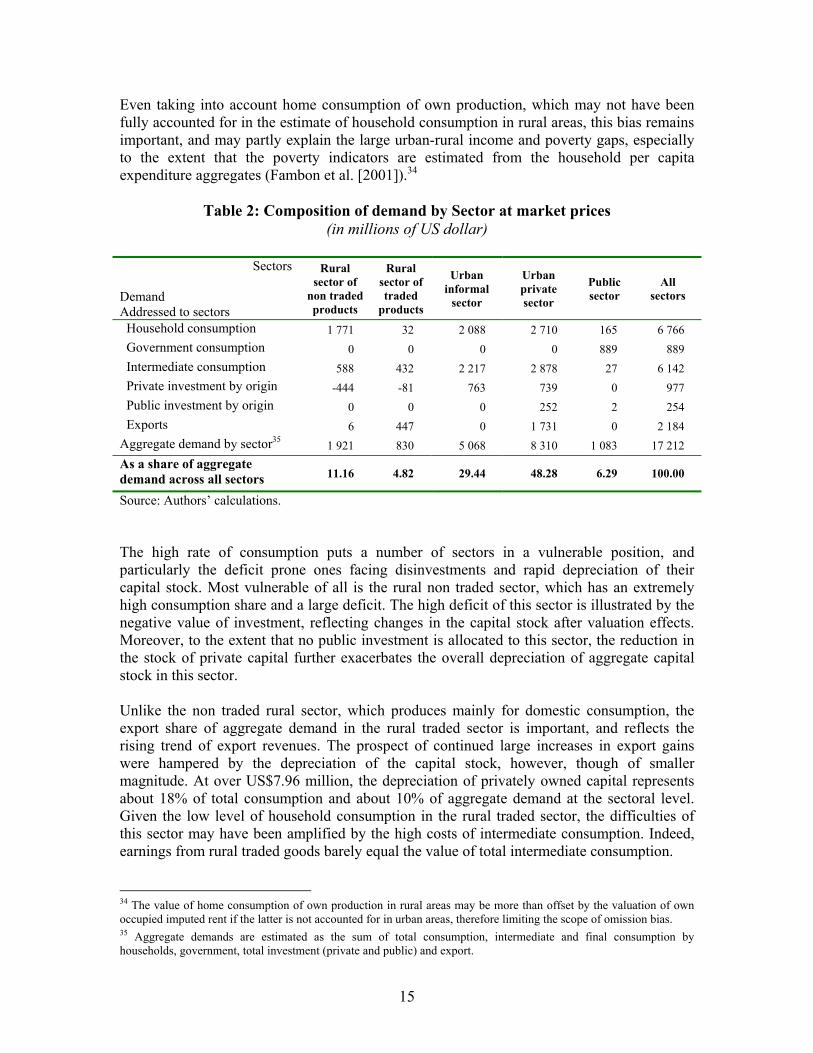
The high external debt servicing may be viewed as a diversion of scarce public resources, which otherwise would be used to deliver essential social services to the poor and to finance public investments needed for growth and poverty reduction. On the other hand, public transfers to households (both urban and rural households), which represent the third largest expenditure item of the public sector shrank significantly and by 1995, was at its lowest level. Together, transfers to urban and rural households account for a little over 8% of total current expenditures, representing 1.5% of GDP (see column 14 of the financial SAM in Annex II).32 With rural households receiving exactly 2.88% of the total amount, with most of it directed to urban households. This implies that out of US$100 of public transfers to households, over US$97 benefits households in urban areas. This urban-rural bias in public spending allocation is perverse, given the large concentration of the population, and particularly the poor, in rural areas, and may partly explain the persistence of widespread poverty in rural areas and overtime inertia in the urban-rural poverty gaps. The urban-rural bias reflected in the poverty gaps and public spending allocation is also captured by the disparity in the overall consumption and demands of goods and services (see Table 2). This Table provides estimates of the composition of sectoral demands at market prices. The rural share (tradable and non tradable) of total demand is about 16%, of which over 11% is due to the rural sector engaged in the production of non traded goods. By all standards, this share is extremely low, especially given the scope and size of the labor force engaged in rural production.33 In contrast, most of the demand for goods and services is from urban areas, which accounts for over 84% of total aggregated demands, hence, reinforcing the urban-rural bias. Moreover, most of the demands in urban areas are from the private formal sector, which alone accounts for about half of the total. The demand emanating from the urban informal sector, which accounts for about 30% of the overall aggregate demand, is the second largest share. Demand emanating from the public sector and rural traded sectors are much lower, representing about 6 and 5% of the aggregate demand, respectively. Invariably, and irrespective of the sector of production, demands are driven more by final consumption, and less by investment motives. Consumption accounts for over 80% of aggregate demand. Exports, which represent absorption by non residents, account for about 13% of the total, leaving the lowest share of all to investment, which accounts for only 7% of total aggregate demand. Though relatively low, this share is consistent with the declining value of gross fixed capital formation recorded in most of the 1980s and early 1990s. Household and intermediate consumption comprise the bulk of the share. Altogether, households and intermediate consumption account for over 75% of total aggregate demand, of which household consumption accounts for about 40%. The distribution of household consumption is not uniform across sectors and geographical regions. The welfare effects of unequal distribution of resources are further highlighted by a bias in the sectoral and geographical composition of household consumption. Despite their relatively small size, urban households enjoyed over 73% of total household consumption.
32 This level of social transfers to households is extremely low, even by low-income countries standards, and not commensurate with the scope of poverty and challenges facing the poor and vulnerable groups in Cameroon. For instance, expressed as a percentage of total expenditures, social expenditures accounted for about 24% in Ethiopia, 20% in Uganda, 35% in Ecuador, and 36% in Bulgaria. 33 Despite the prevailing rural-to-urban migration trend, a large share of population continues to reside in rural areas.
15
Even taking into account home consumption of own production, which may not have been fully accounted for in the estimate of household consumption in rural areas, this bias remains important, and may partly explain the large urban-rural income and poverty gaps, especially to the extent that the poverty indicators are estimated from the household per capita expenditure aggregates (Fambon et al. [2001]).34
Table 2: Composition of demand by Sector at market prices (in millions of US dollar)
Sectors
Demand Addressed to sectors
Rural sector of
non traded products
Rural sector of traded
products
Urban informal
sector
Urban private sector
Public sector
All
sectors
Household consumption 1 771 32 2 088 2 710 165 6 766 Government consumption 0 0 0 0 889 889 Intermediate consumption 588 432 2 217 2 878 27 6 142 Private investment by origin -444 -81 763 739 0 977 Public investment by origin 0 0 0 252 2 254 Exports 6 447 0 1 731 0 2 184 Aggregate demand by sector35 1 921 830 5 068 8 310 1 083 17 212 As a share of aggregate demand across all sectors 11.16 4.82 29.44 48.28 6.29 100.00
Source: Authors’ calculations. The high rate of consumption puts a number of sectors in a vulnerable position, and particularly the deficit prone ones facing disinvestments and rapid depreciation of their capital stock. Most vulnerable of all is the rural non traded sector, which has an extremely high consumption share and a large deficit. The high deficit of this sector is illustrated by the negative value of investment, reflecting changes in the capital stock after valuation effects. Moreover, to the extent that no public investment is allocated to this sector, the reduction in the stock of private capital further exacerbates the overall depreciation of aggregate capital stock in this sector. Unlike the non traded rural sector, which produces mainly for domestic consumption, the export share of aggregate demand in the rural traded sector is important, and reflects the rising trend of export revenues. The prospect of continued large increases in export gains were hampered by the depreciation of the capital stock, however, though of smaller magnitude. At over US$7.96 million, the depreciation of privately owned capital represents about 18% of total consumption and about 10% of aggregate demand at the sectoral level. Given the low level of household consumption in the rural traded sector, the difficulties of this sector may have been amplified by the high costs of intermediate consumption. Indeed, earnings from rural traded goods barely equal the value of total intermediate consumption. 34 The value of home consumption of own production in rural areas may be more than offset by the valuation of own occupied imputed rent if the latter is not accounted for in urban areas, therefore limiting the scope of omission bias. 35 Aggregate demands are estimated as the sum of total consumption, intermediate and final consumption by households, government, total investment (private and public) and export.
16
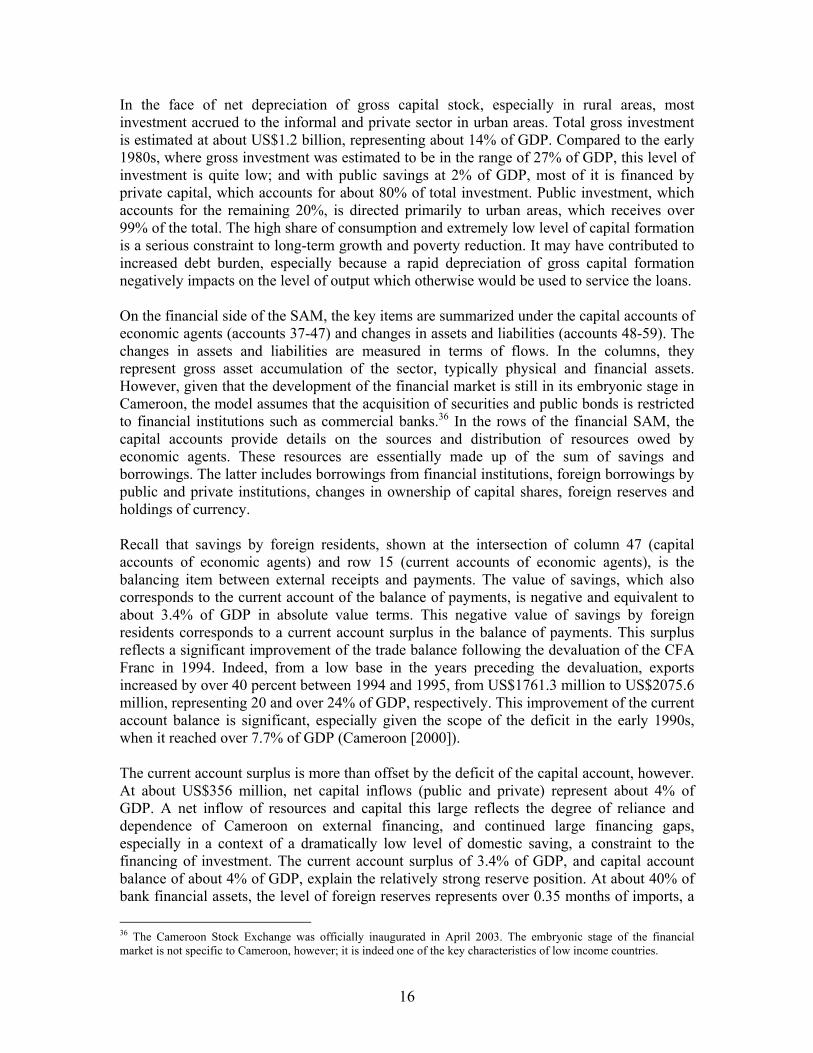
In the face of net depreciation of gross capital stock, especially in rural areas, most investment accrued to the informal and private sector in urban areas. Total gross investment is estimated at about US$1.2 billion, representing about 14% of GDP. Compared to the early 1980s, where gross investment was estimated to be in the range of 27% of GDP, this level of investment is quite low; and with public savings at 2% of GDP, most of it is financed by private capital, which accounts for about 80% of total investment. Public investment, which accounts for the remaining 20%, is directed primarily to urban areas, which receives over 99% of the total. The high share of consumption and extremely low level of capital formation is a serious constraint to long-term growth and poverty reduction. It may have contributed to increased debt burden, especially because a rapid depreciation of gross capital formation negatively impacts on the level of output which otherwise would be used to service the loans. On the financial side of the SAM, the key items are summarized under the capital accounts of economic agents (accounts 37-47) and changes in assets and liabilities (accounts 48-59). The changes in assets and liabilities are measured in terms of flows. In the columns, they represent gross asset accumulation of the sector, typically physical and financial assets. However, given that the development of the financial market is still in its embryonic stage in Cameroon, the model assumes that the acquisition of securities and public bonds is restricted to financial institutions such as commercial banks.36 In the rows of the financial SAM, the capital accounts provide details on the sources and distribution of resources owed by economic agents. These resources are essentially made up of the sum of savings and borrowings. The latter includes borrowings from financial institutions, foreign borrowings by public and private institutions, changes in ownership of capital shares, foreign reserves and holdings of currency. Recall that savings by foreign residents, shown at the intersection of column 47 (capital accounts of economic agents) and row 15 (current accounts of economic agents), is the balancing item between external receipts and payments. The value of savings, which also corresponds to the current account of the balance of payments, is negative and equivalent to about 3.4% of GDP in absolute value terms. This negative value of savings by foreign residents corresponds to a current account surplus in the balance of payments. This surplus reflects a significant improvement of the trade balance following the devaluation of the CFA Franc in 1994. Indeed, from a low base in the years preceding the devaluation, exports increased by over 40 percent between 1994 and 1995, from US$1761.3 million to US$2075.6 million, representing 20 and over 24% of GDP, respectively. This improvement of the current account balance is significant, especially given the scope of the deficit in the early 1990s, when it reached over 7.7% of GDP (Cameroon [2000]). The current account surplus is more than offset by the deficit of the capital account, however. At about US$356 million, net capital inflows (public and private) represent about 4% of GDP. A net inflow of resources and capital this large reflects the degree of reliance and dependence of Cameroon on external financing, and continued large financing gaps, especially in a context of a dramatically low level of domestic saving, a constraint to the financing of investment. The current account surplus of 3.4% of GDP, and capital account balance of about 4% of GDP, explain the relatively strong reserve position. At about 40% of bank financial assets, the level of foreign reserves represents over 0.35 months of imports, a 36 The Cameroon Stock Exchange was officially inaugurated in April 2003. The embryonic stage of the financial market is not specific to Cameroon, however; it is indeed one of the key characteristics of low income countries.
17
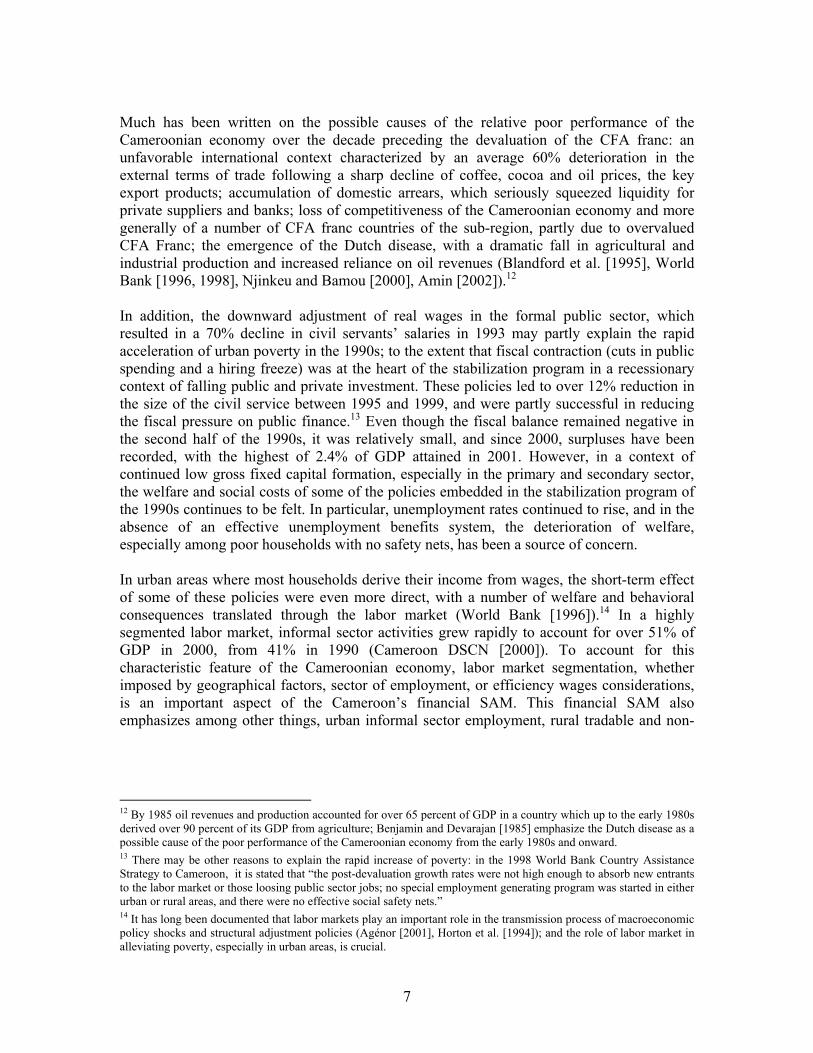
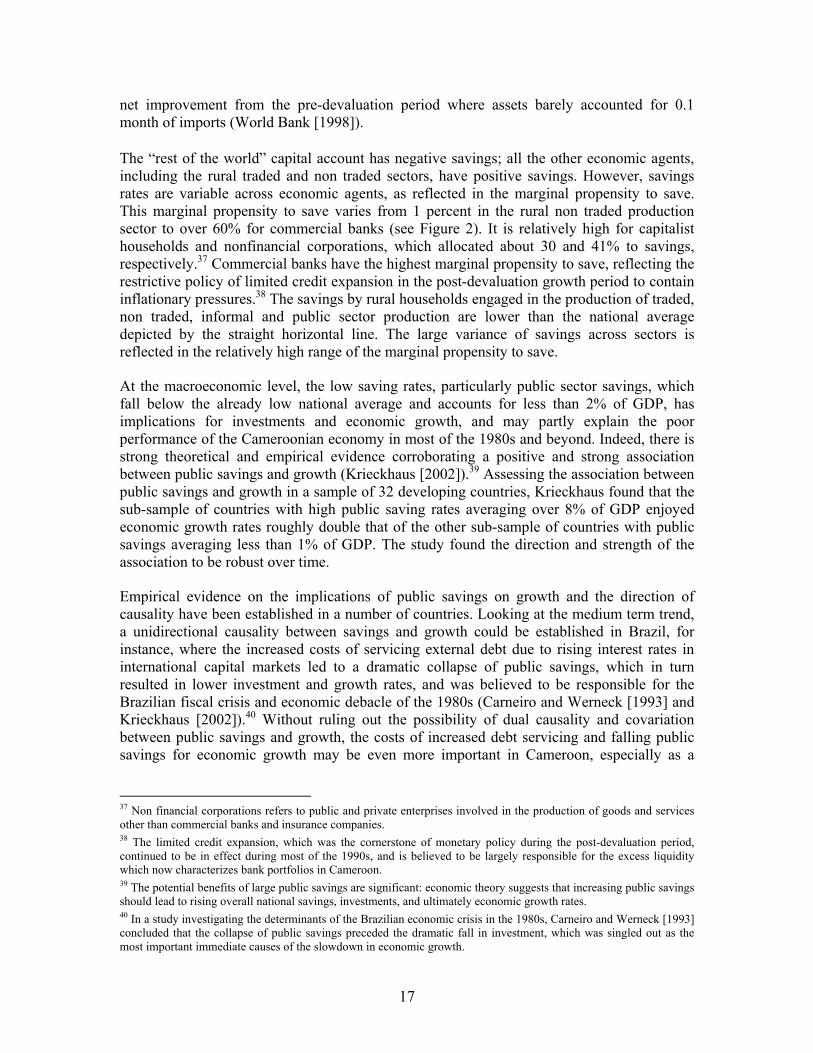
net improvement from the pre-devaluation period where assets barely accounted for 0.1 month of imports (World Bank [1998]). The “rest of the world” capital account has negative savings; all the other economic agents, including the rural traded and non traded sectors, have positive savings. However, savings rates are variable across economic agents, as reflected in the marginal propensity to save. This marginal propensity to save varies from 1 percent in the rural non traded production sector to over 60% for commercial banks (see Figure 2). It is relatively high for capitalist households and nonfinancial corporations, which allocated about 30 and 41% to savings, respectively.37 Commercial banks have the highest marginal propensity to save, reflecting the restrictive policy of limited credit expansion in the post-devaluation growth period to contain inflationary pressures.38 The savings by rural households engaged in the production of traded, non traded, informal and public sector production are lower than the national average depicted by the straight horizontal line. The large variance of savings across sectors is reflected in the relatively high range of the marginal propensity to save. At the macroeconomic level, the low saving rates, particularly public sector savings, which fall below the already low national average and accounts for less than 2% of GDP, has implications for investments and economic growth, and may partly explain the poor performance of the Cameroonian economy in most of the 1980s and beyond. Indeed, there is strong theoretical and empirical evidence corroborating a positive and strong association between public savings and growth (Krieckhaus [2002]).39 Assessing the association between public savings and growth in a sample of 32 developing countries, Krieckhaus found that the sub-sample of countries with high public saving rates averaging over 8% of GDP enjoyed economic growth rates roughly double that of the other sub-sample of countries with public savings averaging less than 1% of GDP. The study found the direction and strength of the association to be robust over time. Empirical evidence on the implications of public savings on growth and the direction of causality have been established in a number of countries. Looking at the medium term trend, a unidirectional causality between savings and growth could be established in Brazil, for instance, where the increased costs of servicing external debt due to rising interest rates in international capital markets led to a dramatic collapse of public savings, which in turn resulted in lower investment and growth rates, and was believed to be responsible for the Brazilian fiscal crisis and economic debacle of the 1980s (Carneiro and Werneck [1993] and Krieckhaus [2002]).40 Without ruling out the possibility of dual causality and covariation between public savings and growth, the costs of increased debt servicing and falling public savings for economic growth may be even more important in Cameroon, especially as a
37 Non financial corporations refers to public and private enterprises involved in the production of goods and services other than commercial banks and insurance companies. 38 The limited credit expansion, which was the cornerstone of monetary policy during the post-devaluation period, continued to be in effect during most of the 1990s, and is believed to be largely responsible for the excess liquidity which now characterizes bank portfolios in Cameroon. 39 The potential benefits of large public savings are significant: economic theory suggests that increasing public savings should lead to rising overall national savings, investments, and ultimately economic growth rates. 40 In a study investigating the determinants of the Brazilian economic crisis in the 1980s, Carneiro and Werneck [1993] concluded that the collapse of public savings preceded the dramatic fall in investment, which was singled out as the most important immediate causes of the slowdown in economic growth.
18
significant deterioration of the poor state of infrastructure was also observed during the crisis period (World Bank [1996]).41
Figure 2: Distribution of marginal propensity to save across economic agents42
0
10
20
30
40
50
60
70
Rural nonTraded
Rural Traded Urban Info rmal CentralGovernment
Urban fo rmalUnskilled
Urban skilled Cap italis ts NonfinancialCompanies
CommercialBanks
Mar
gina
l pro
pens
ity to
save
(%) Saving
National Average
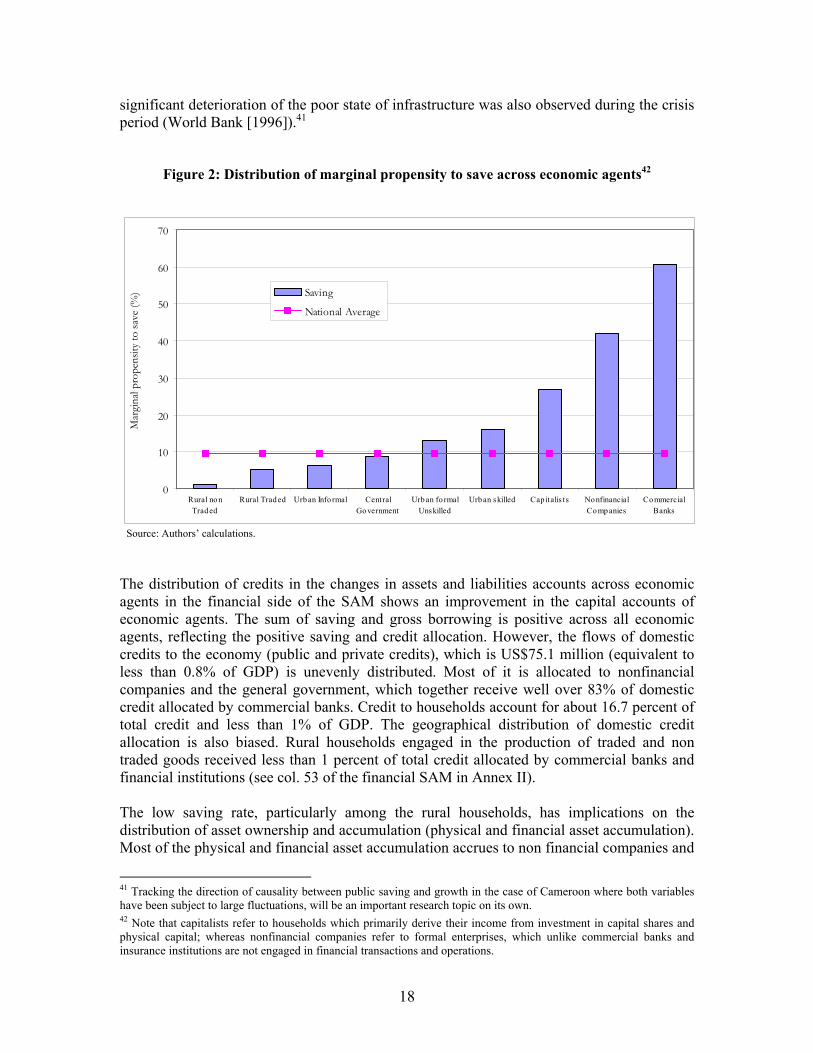
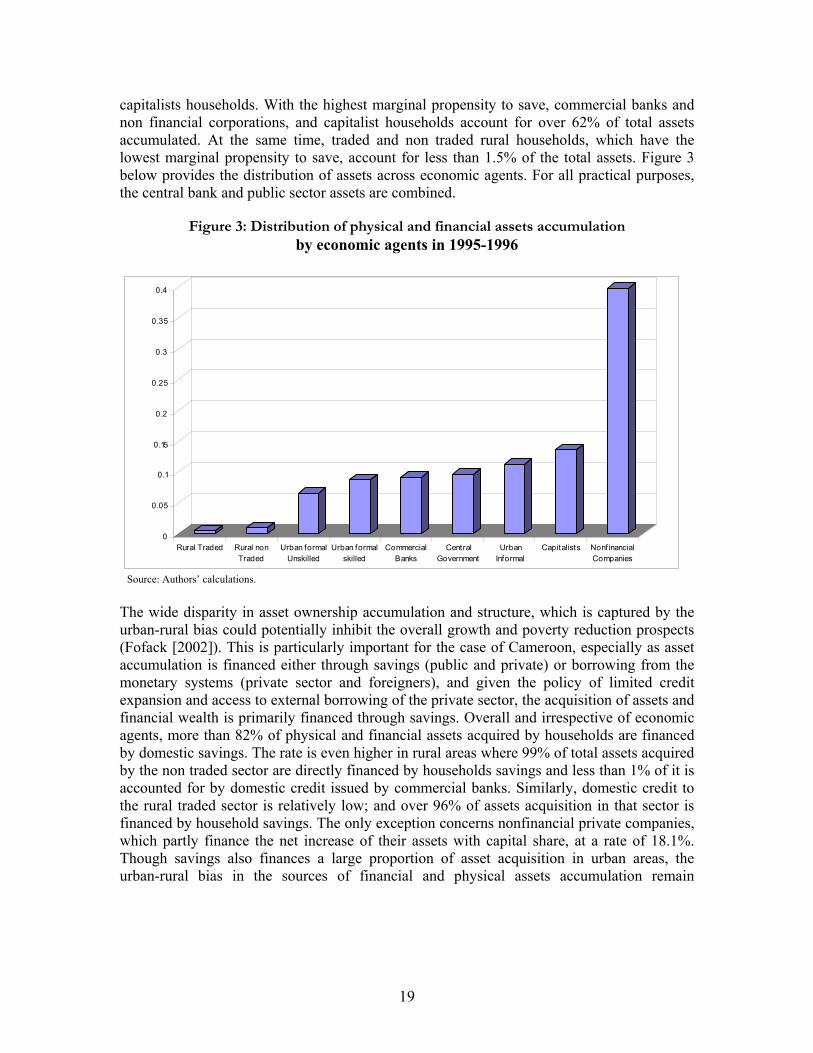
Source: Authors’ calculations. The distribution of credits in the changes in assets and liabilities accounts across economic agents in the financial side of the SAM shows an improvement in the capital accounts of economic agents. The sum of saving and gross borrowing is positive across all economic agents, reflecting the positive saving and credit allocation. However, the flows of domestic credits to the economy (public and private credits), which is US$75.1 million (equivalent to less than 0.8% of GDP) is unevenly distributed. Most of it is allocated to nonfinancial companies and the general government, which together receive well over 83% of domestic credit allocated by commercial banks. Credit to households account for about 16.7 percent of total credit and less than 1% of GDP. The geographical distribution of domestic credit allocation is also biased. Rural households engaged in the production of traded and non traded goods received less than 1 percent of total credit allocated by commercial banks and financial institutions (see col. 53 of the financial SAM in Annex II). The low saving rate, particularly among the rural households, has implications on the distribution of asset ownership and accumulation (physical and financial asset accumulation). Most of the physical and financial asset accumulation accrues to non financial companies and
41 Tracking the direction of causality between public saving and growth in the case of Cameroon where both variables have been subject to large fluctuations, will be an important research topic on its own. 42 Note that capitalists refer to households which primarily derive their income from investment in capital shares and physical capital; whereas nonfinancial companies refer to formal enterprises, which unlike commercial banks and insurance institutions are not engaged in financial transactions and operations.
19
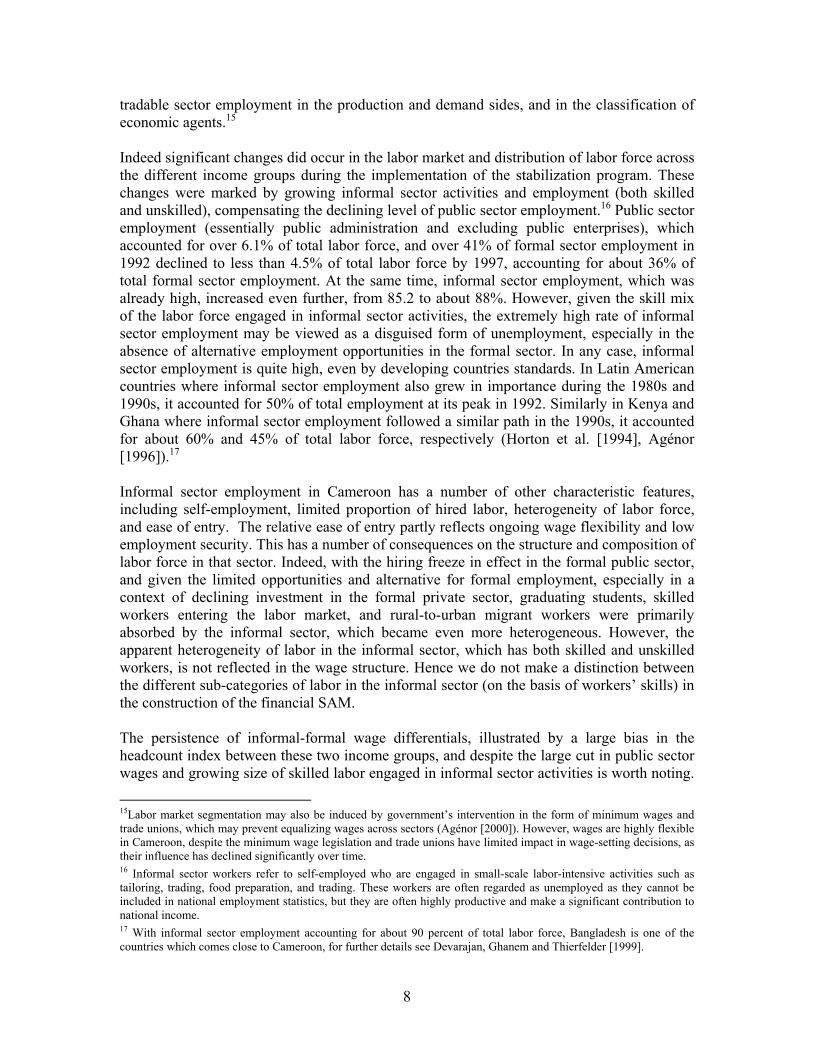
capitalists households. With the highest marginal propensity to save, commercial banks and non financial corporations, and capitalist households account for over 62% of total assets accumulated. At the same time, traded and non traded rural households, which have the lowest marginal propensity to save, account for less than 1.5% of the total assets. Figure 3 below provides the distribution of assets across economic agents. For all practical purposes, the central bank and public sector assets are combined.
Figure 3: Distribution of physical and financial assets accumulation by economic agents in 1995-1996
0
0.05
0.1
0.15
0.2
0.25
0.3
0.35
0.4
Rural Traded Rural nonTraded
Urban formalUnskilled
Urban formalskilled
CommercialBanks
CentralGovernment
UrbanInformal
Capitalists NonfinancialCompanies
Source: Authors’ calculations. The wide disparity in asset ownership accumulation and structure, which is captured by the urban-rural bias could potentially inhibit the overall growth and poverty reduction prospects (Fofack [2002]). This is particularly important for the case of Cameroon, especially as asset accumulation is financed either through savings (public and private) or borrowing from the monetary systems (private sector and foreigners), and given the policy of limited credit expansion and access to external borrowing of the private sector, the acquisition of assets and financial wealth is primarily financed through savings. Overall and irrespective of economic agents, more than 82% of physical and financial assets acquired by households are financed by domestic savings. The rate is even higher in rural areas where 99% of total assets acquired by the non traded sector are directly financed by households savings and less than 1% of it is accounted for by domestic credit issued by commercial banks. Similarly, domestic credit to the rural traded sector is relatively low; and over 96% of assets acquisition in that sector is financed by household savings. The only exception concerns nonfinancial private companies, which partly finance the net increase of their assets with capital share, at a rate of 18.1%. Though savings also finances a large proportion of asset acquisition in urban areas, the urban-rural bias in the sources of financial and physical assets accumulation remain
20
important. The more stringent access to domestic credit in rural areas may be partly due to low degree of monetization of rural economy.43 Except in a few cases (urban formal unskilled households, urban skilled and capitalist households, and commercial banks), the changing structure of assets is mainly characterized by a net increase and accumulation of capital goods. Capital goods acquisitions accounts for over 81% of total aggregated household assets acquisition across all economic agents (see Annex IV). Surprisingly, the acquisition of capital goods valued at market prices is high in a number of sectors, especially the ones which reduced their holding of fiduciary currencies and deposits to commercial banks. This is especially the case for rural traded and non traded households, urban informal sector and non financial companies. The largest accumulation of capital goods is accounted for by two sectors: non financial companies which account for more than 60% of the total, and the central government, which accounts for over 20% (see Annex IV). The urban private sector benefited most from the accumulation of capital goods and public investment, receiving over 99% of total investment. The concomitant reduction of currency holding and deposits to commercial banks on one hand and increase accumulation of capital goods on the other hand may also be viewed as a strategy for portfolio diversification in an environment of limited credit expansion and money growth. In the urban formal sector (skilled and unskilled households, capitalist households, and commercial banks), the changing structure of assets is dominated by acquisition of capital shares. Capitalist households have large capital shares, about twice the aggregate value of capital across all economic agents. The low value of the aggregated capital share across all other economic agents is due to the large reduction in the holding of capital shares and equities by the central government. In absolute value terms, the reduction of capital share owed by the government represents more than 32% of national aggregated capital resources accumulated over the reference period. Though relatively high, this reduction of capital share owed by the public sector may be inscribed in a much broader framework of divestiture of public enterprises.44 The monetary system has the most diversified financial asset structure. Commercial banks accumulated credit to the public and private sectors, accounting for over 45% of their total resources. They also increased their ownership of capital share to about 53.5% of the total; and short-term foreign assets in the form of international reserves to about 40% of the total. Note that the increase of financial assets in the form of capital shares, credit and reserves accruing to commercial banks was partly facilitated by a drastic reduction in the scope of government bond holdings and access to external financial resources. IV. An IMMPA-Based Financial SAM Model for Inference under Fixed-Price
Multiplier This section provides a framework for inferring the functional distribution of income, and the growth and accumulation process from the Cameroon financial SAM using fixed-price multiplier analysis. Fixed-price multiplier analyses are static models for short-term inference. 43 More recently, a number of local institutions in the form of formal and informal cooperative have been providing access to financing in rural areas through development of micro-credit schemes, as alternative or substitute to low coverage of rural areas by traditional commercial banks and financial institutions. 44 For instance, in the years following the devaluation of the CFA Franc, the two largest transport entities and agro-businesses were privatized; and the privatization program was designed to be expanded to cover public utilities, commercial banks and other non financial corporations. For further details, see World Bank [1998].
21
They are based on a number of hypotheses; in particular, they assume that transactions occur at non-equilibrium prices, and prices remain fixed, owing to excess capacity; functional relationships are taken to be linear in the financial SAM column; and the models are essentially demand-driven, as supply-side is not a constraint on economic activities. Naturally, the first assumption implies that prices and wages do not move immediately and automatically to clear the market, and inferences are based on quantities; only activity levels may vary. The second assumption implies that the substitution between imports and domestic production in the commodity columns may not be possible, especially given that the production function follows Leontief specifications. Despite these restrictions, fixed-price multiplier analyses have been used extensively to study the distribution of income (Roland-Holst and Sancho [1992]), and the short-term effects of fiscal policies (Whalley and Hillaire [1987]). More recently, they were used to assess the sources of growth and sectoral distribution of resources (Arndt, Jensen and Tarp [2000]). In this Section, we draw on these models to assess the functional and institutional distribution of income and growth, the effects on saving and production, financial assets and accumulation processes, following shocks on exogenous accounts.45 We focus particularly on the growth and income effects of increased public investment and capital expenditures. The growth and income effects following the shocks are measured on endogenous accounts and variables (see Annex V-A for endogenous accounts) considered as response. The variation in the income, and activities levels of these variables are explained by changes in the exogenous accounts, through multipliers. A practical use of these models in policy analysis requires a prior subdivision of all the real and financial sectors accounts of the SAM into two mutually exclusive classes of exogenous and endogenous accounts. In our attempt to infer on the functional and institutional distribution of income, saving, growth and the accumulation process, from the prototype financial SAM of the IMMPA framework, we identify 15 exogenous accounts subdivided into 3 exogenous current accounts, 3 exogenous capital accounts, and 9 exogenous changes in assets and liabilities accounts (see Annex V-B). These exogenous variables emphasize the government and rest-of-the world accounts. This reflects the nature of the shock, which simulates the short-run growth and income effects of increased public investment and capital expenditures following hypothetical reduction in the stock of debt and external debt services within the framework of the HIPC initiative. The choice of this scenario reflects the fact that Cameroon’s external debt is extremely high and it is believed that interest payments might have hampered its growth prospects. The simulated growth and income effects of shocks on exogenous accounts are measured on the response of endogenous accounts. These endogenous accounts include the remuneration of factors (in the IMMPA classification, this includes unskilled rural labor, skilled and unskilled urban labor), production of economic agents, household income and income accruing to non financial companies, and changes in financial assets. Annex V provides the details of the multipliers matrix (Annex V-A focuses on the sub-set of endogenous accounts, and Annex V-B focuses on exogenous accounts). The linkage between exogenous and endogenous accounts is provided by a fixed-prices multipliers model in a functional form specified by the set of equations below.
45 Functional distribution of income records the division of income between production factors (wage and property income) and institutional distribution of income focuses on the spatial distribution of income, particularly urban/rural dimension, but also along a number of other institutional classifications.
22
),(),(),(),( * fr
nfr
nfr
nfr
n xyAy += (1) where ),( fr
ny represents the vector of combined real and financial ( )fr, endogenous account
totals and ),( frnx the matrix of combined real and financial ( )fr, exogenous account totals.46
),( frnA defines the matrix of average expenditure propensities. This last matrix can be
obtained by dividing a particular element in any of the endogenous accounts by the total for the column account in which the element occurs. After some algebraic rearrangements, equation (1) can be rewritten as:
),(1),(),( )( frn
frn
frn xAIy ∗−= − (2)
where ),(1),( )( fr
afr
n MAI =− − is the multiplier matrix also known as the Leontief inverse.47 Equation (2) can also be expressed in compact form. Hence, using the reduced form of the Leontief inverse, it is represented by equation (3) below.
),(),(),( * fr
nfr
afr
n xMy = 48 (3) Column i of the multipliers matrix aM shows the global effects of all endogenous activity levels induced by an exogenous unit inflow accruing to i , after allowing for all interdependent feedbacks to run their course. The changes in the Leontief inverse following the shocks on exogenous accounts are the basis for inferring on growth and income distribution captured by inherent adjustment of endogenous accounts. Negative terms of trade shocks, rising costs of external debt servicing, and accumulation of arrears to domestic suppliers are believed to have negatively impacted on the growth process in the late 1980s and most of the 1990s in Cameroon. By way of illustration, we run a scenario to simulate the growth and income effects of a 55% debt reduction, with the hypothetical relief mainly reallocated to public investment. Note that the hypothetical 55% reduction of Cameroon external debt would bring its stock of debt to about 170% of exports, the sustainable threshold. The results of the simulation are discussed in the following section. V. Growth and Welfare Inference under Fixed-Price Multipliers To further analyze the structural and inter-sectoral linkages of the Cameroonian economy, we generate the matrix multipliers from the flows of resources into each of the endogenous 46 The above reduced form of the SAM Multipliers is adapted from Roland-Host and Sancho [1995]. 47 It is assumed that the multipliers matrix or “Leontief Inverse” has only non negative entries, for negative entries will be difficult to interpret, implying for instance that some final demands have negative impact on gross output. The general restrictions on the cells of the “Leontief Inverse” matrix are provided by the Hawkins-Simmon conditions (Hawkins [1949]). According to these conditions, the diagonal elements of the multipliers matrix should be strictly positive (i.e. 01 >− jja ), and all its principal minor must be positive. 48 In addition to the foregoing assumptions, production technology, resource endowment and expenditure propensities of endogenous accounts remain constant. For further details on fixed-prices multipliers models, see Roland-Holst and Sancho [1995], Erik Thorbecke [1990], Defourny and Thorbecke [1984], and Decaluwé et al. [1999].
23
elements of the financial SAM. The results of this multipliers matrix are derived by inverting the sub-matrix of endogenous accounts from the intersecting original financial SAM matrix. These results are provided in Annex IV-A. On the production side, each entry or cell value
),( jir in the multipliers matrix can be interpreted as an additional output generated in the row sector due to one US dollar increase in final demand for production. It measures the total stimulus to the ith sector gross output when the jth sector final demand changes by unity. When summed across the rows, ∑
ijir ),( measures the total (direct and indirect) impact of
gross output when final demand for the jth sector changes by unity, and all other final demands are set at zero. The term is also known as output multipliers. We focus on offer of composite goods accounts (column 29-33). Looking down the column (non traded rural production in column 29 – public sector production in column 33 and corresponding rows 29-33), the multiplier matrix indicates that an injection of one unit of resource in the non traded rural production generates about 1.9 units in additional production for this sector, ceteris paribus.49 The multipliers effects of such an injection are lower for other sectors; and especially for the rural traded and public sector production, which have multipliers of about 0.1 and 0.07, respectively. The relatively low multipliers values illustrate the weak linkage between these sectors and the rural economy, particularly the non traded and traded rural production. However, the linkages between non traded rural production and informal sector production, and urban corporate production are stronger, as reflected by the size of the multipliers which are larger than unity. This implies that an injection of one unit of additional resources in the rural non traded production would generate about 1.7 units of additional production in the urban informal production, and 1.8 additional units to the corporate production, respectively. From the previous sections, remember that the non tradable informal sector production is entirely devoted to domestic consumption, largely relying on domestically produced inputs. Hence the relatively strong linkage between rural non traded and informal production sectors. By contrast, the extremely low linkages to the rural traded production reflects the rural traded and non traded dichotomy characteristic of most developing countries and captured by the IMMPA framework (Agénor, Izquierdo and Fofack [2003]). Similarly, the agricultural linkages to public sector production are also extremely low (less than 0.1). This probably reflects the nature of public sector output and production, which is essentially service oriented with large concentration in urban areas, but also the consumption stream. Most public sector goods are consumed by the government, here set as exogenous accounts. The relatively low linkages with the public production sector are not specific to the rural non traded production, however. The multipliers linkages with public sector production are consistently low across all other sectors; and the lowest score refers to the interaction with the rural traded production, which has a multiplier less than 0.1. The marginal propensities to consume government goods are very small in the endogenous accounts. The consistently low linkages probably reflect the relative weight of public sector production which accounts for less than 10 percent of overall value added. Low multipliers effects to public sectors are not 49 Although static in its approach, multipliers analysis provides some insights on expected growth and welfare effects of for instance increased public consumption from a cross-sectoral comparisons standpoint. A knowledge of policy impact ex-ante could be particularly useful and provide valuable input to the design of growth and poverty reduction strategies. For further details, see Bulmer-Thomas [1982].
24
uncommon, however. In a study based on one region of Ireland, Fannin [2000] found that a pound increase in final demand for production activities results only in 0.04 increase in government revenue. Nonetheless, the multipliers matrix is not symmetrical along the diagonal line; and the relatively low leakage to public sector production does not necessarily imply that an injection of additional resources to the public sector will have limited spillover effects and leakages to other sectors. In fact, looking at the intersection between column 33 and rows 29-33, the multipliers matrix indicates that an injection of one unit of resources in the public sector production will generate 1.4 and 1.7 of additional production for the urban informal and corporate production, respectively. The relatively strong linkages between public sector production on one hand and informal and corporate production on the other hand further corroborates the geographical bias, where public sector production is highly concentrated in urban areas. The effects of increased resources to the public sectors on other sectors are significantly lower. In particular, these effects on the traded rural sectors are almost insignificant, with a multipliers smaller than 0.1. Although non traded rural production has the largest linkages to total production factors multipliers (3.3) and total production multipliers (4.9), the linkages between other sectors of production and the latter are generally high, irrespective of the geographical location and the formal-informal nature of employment.50 The lowest total factor multiplier is 1.75, and corresponds to the additional increase in total factors that would follow an injection of one unit of resources into the urban private production. The much larger linkages of rural non traded sector are not specific to Cameroon; it is common in most Sub-Saharan African countries where agriculture is the mainstay of rural economy. For instance, agriculture was found to exhibit significantly larger linkages to domestic production, total supply, value added, and household income in Mozambique (Arndt et al. [2000]). However, despite the relatively large linkage to total factors, the ratio of capital to total factors multipliers is generally low. As expected, the lowest ratio is recorded in the non traded rural production sector (1.636/3.2812= 0.498). This probably reflects the low level of capital and the labor intensive nature of non tradable agricultural production, which is characteristic of low-income countries in Sub-Saharan Africa (Arndt et al. [2000]). Public sector production is also highly labor intensive, as reflected in the low ratio of capital to total factor multipliers, which is of the same order of magnitude. By contrast, the traded rural production (0.634) and urban private (0.6297) have slightly higher ratio, an indication of higher capital-intensity. The non traded rural production own-sector multiplier is relatively large, compared to that of other sectors, and given the strong linkages with the informal sector production, which accounts for a sizable share of aggregate value added and active labor force, one would imply that the welfare effects of rural development-led growth are likely to be widespread and positive in Cameroon. Yet this may be only one aspect of the problem. Also important is the productivity of factors across sectors. Indeed, in this dimension, the non traded rural production has the lowest ratio of total sectoral production multipliers to total factors multipliers of 1.49 (4.90/3.286=1.49). The relatively low factor productivity raises the issue of efficiency in the use of production factors. The relatively low productivity of the non traded agricultural sector is not new. In a study carried out in the late 1990s, Blanford and
50 Total factor multipliers are defined as the sum across individual factors multipliers, mainly rural unskilled labor, urban unskilled labor, skilled labor and capital. The total production multipliers and demand for composite goods multipliers, as well as multipliers associated with other accounts are likewise defined.
25
Lynch [1990] found that the poorest 40% of farms account for only 3% of total agriculture sales, with many rural poor appearing as net food purchasers in Cameroon. The public sector has a relatively high ratio of total sectoral production over total factor multipliers in the magnitude of about 1.6. Higher total factor productivities are recorded in other sectors, and particularly rural traded agricultural sectors (1.74) and urban private production (1.75). The productivity gap across sectors reflects the variance in total factor multipliers and total sectoral production multipliers. Indeed total factor multipliers vary between 3.3 (the highest associated with non traded agricultural sector of production) and 1.75 (the lowest associated with urban private production) when measured on the stream of composite goods. The large variance across sectors implies that a unit increase in the demand for composite goods will have a different employment effect across various sectors. Similarly, on the sectoral production multipliers scale, the total production multipliers vary between 4.9 and about 3.1; and the ranking across sectors is not consistent on both scales. The non traded rural production also has the largest multipliers on current expenditures of economic and institutional agents. The total multipliers associated with the current expenditure of economic agents is about 3.3 for the non traded rural production, suggesting that an injection of one unit of resources in the latter will increase current expenditures of about 3.3. However, the relatively large size of these multipliers is largely due to non capitalist households, especially given the extremely low multipliers of “capitalist households” on their current accounts (0.27). More generally, the linkages between the other four sectors of production and the current account of capitalist households are low in Cameroon. Conversely, the relatively high multipliers with other accounts suggest low leakages, hence, small profits, small imports and savings in the recipient households. The urban informal sector and corporate production have the largest own-sector multipliers, about 2.5 for the urban informal production and 2.3 for the corporate production, representing about 50% of total sectoral multipliers. The non traded rural production has an own-sector multiplier of about 1.9; and the other two sectors, traded rural production and public sector production have much lower values, about 1. Surprisingly, the last two sectors which exhibit the lowest own-sector multipliers have higher linkages to other sectors, reflecting the fact that most demand lies in exogenous accounts. This is especially the case for the rural traded production sector; although, it has own-sector multipliers of 1.1, its linkages with informal sector production and corporate production are 1.6 and 1.3, respectively. Looking at the financial side of the multipliers matrix (intersection of columns 29-33 and rows 37-51), the estimated multiplier values are relatively low for most accounts, except one: non financial companies. For instance, conditioned upon non agricultural traded sectors, the multipliers value ranges from 0.001 for the deposits in the changes in household assets and liabilities to 0.173 for the non financial companies. This implies that an injection of one unit of extra resources in the rural non traded production in the offer of composite goods accounts would generate about 0.17 units of additional production in the non financial sector accounts, and even less significant, about 0.001 additional units in the households deposits, a component of the changes in assets and liabilities accounts. In fact the multipliers effects associated with the changes in assets and liabilities accounts are generally very low, reflecting the level of savings by economic agents. Indeed the only exception concerns non financial companies which consistently has the largest multipliers. Non financial companies also enjoy the largest financial assets accumulation and saving rates, further supporting the
26
fact that income feedback flows affect financial accounts through the savings of economic agents. Indeed, over 40% of total financial assets accumulation accrues to non financial companies, which also have marginal propensity to save exceeding 40%. We also estimate the forward and backward linkages indices for the different production sectors from the multipliers matrix, following a normalization of the Leontief inverse using Rasmussen (1957). In the multipliers analysis, the linkages between sectors of production are the underlying hypothesis. Each new investment or injection of resources in one given sector or industry offers opportunities for other suppliers (backward linkages) and provides inputs for utilization by other users (forward linkages).51 Naturally, forward and backward linkages have implications for growth and welfare. For instance, it has been argued that sustained growth and increased industrial production could be achieved more rapidly by concentrating resources on sectors with high forward and backward linkages (Bulmer-Thomas [1982]).52 Not surprising, of all the sectors, rural production (traded and non traded) yields above-average backward linkages, with backward linkage index slightly above unity. The indices associated with these sectors are above the estimates derived for the urban private production, which is less than 0.8. A high backward linkage in rural production sectors implies that increased agricultural and rural production results into rising demands for agricultural inputs in the form of goods and factors. Hence, the multipliers and growth effects for the rural economy, and Cameroonian economy as a whole, are likely to be important. However, these effects will most likely depend on the nature and sources of agricultural inputs. At the same time, the production sectors, and especially rural traded sector, have low forward linkages. The low forward linkage index for this sector (0.35) reflects the fact that most of the production is exported. In contrast, urban corporate production and informal sector production have higher forward linkages of 1.6 and 1.9, respectively, reflecting the fact that their output is probably used as inputs and final goods for absorption by many other sectors of the economy. Hence, by expanding the capacity in these sectors, inducements are provided to using industries which now have an incentive to expand output and take advantage of the increased availability of inputs and to households by expanding income. However, informal sector activities are already widespread in Cameroon, where they account for over 50% of GDP. The widespread nature of informal sector activities already had implications for domestic resource mobilization across Sub-Saharan African countries, where it is believed to be partly responsible of the decreased tax effort in the early 1980s (Ndulu [1991]). Its expansion is likely to contribute to further deterioration of the government fiscal stance. We also use the derived multipliers matrix and results to simulate two policy experiments. These experiments assess the growth and income effects of increased public investment and capital expenditures, following hypothetical reduction in the stock of foreign debt and external debt servicing, highly likely within the framework of the HIPC relief to which Cameroon qualifies. Under the present scenario, the savings from reduced interest payments associated with a hypothetical HIPC relief are entirely reallocated to finance public
51 Note that the backward and forward linkages are not reflected in market prices and therefore represent an externality, which could cause the social benefits of an investment to diverge from the private benefits. 52 The backward linkages is estimated by taking the ratio of the average stimulus imparted to other sectors by a unit’s worth of demand for sectors j over the average stimulus for the whole economy when all final demands are increased by unity. For further details, see Bulmer-Thomas [1982].
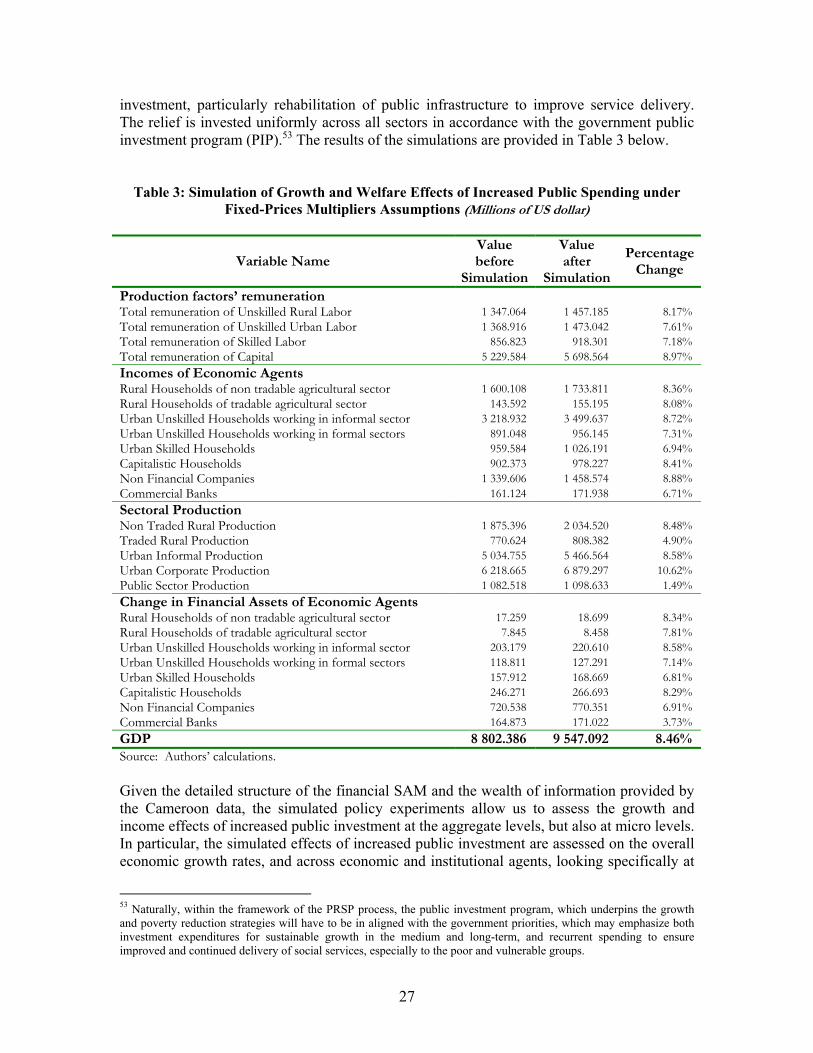
27
investment, particularly rehabilitation of public infrastructure to improve service delivery. The relief is invested uniformly across all sectors in accordance with the government public investment program (PIP).53 The results of the simulations are provided in Table 3 below.
Table 3: Simulation of Growth and Welfare Effects of Increased Public Spending under Fixed-Prices Multipliers Assumptions (Millions of US dollar)
Variable Name Value before
Simulation
Value after
Simulation
Percentage Change
Production factors’ remuneration Total remuneration of Unskilled Rural Labor 1 347.064 1 457.185 8.17% Total remuneration of Unskilled Urban Labor 1 368.916 1 473.042 7.61% Total remuneration of Skilled Labor 856.823 918.301 7.18% Total remuneration of Capital 5 229.584 5 698.564 8.97% Incomes of Economic Agents Rural Households of non tradable agricultural sector 1 600.108 1 733.811 8.36% Rural Households of tradable agricultural sector 143.592 155.195 8.08% Urban Unskilled Households working in informal sector 3 218.932 3 499.637 8.72% Urban Unskilled Households working in formal sectors 891.048 956.145 7.31% Urban Skilled Households 959.584 1 026.191 6.94% Capitalistic Households 902.373 978.227 8.41% Non Financial Companies 1 339.606 1 458.574 8.88% Commercial Banks 161.124 171.938 6.71% Sectoral Production Non Traded Rural Production 1 875.396 2 034.520 8.48% Traded Rural Production 770.624 808.382 4.90% Urban Informal Production 5 034.755 5 466.564 8.58% Urban Corporate Production 6 218.665 6 879.297 10.62% Public Sector Production 1 082.518 1 098.633 1.49% Change in Financial Assets of Economic Agents Rural Households of non tradable agricultural sector 17.259 18.699 8.34% Rural Households of tradable agricultural sector 7.845 8.458 7.81% Urban Unskilled Households working in informal sector 203.179 220.610 8.58% Urban Unskilled Households working in formal sectors 118.811 127.291 7.14% Urban Skilled Households 157.912 168.669 6.81% Capitalistic Households 246.271 266.693 8.29% Non Financial Companies 720.538 770.351 6.91% Commercial Banks 164.873 171.022 3.73% GDP 8 802.386 9 547.092 8.46%Source: Authors’ calculations. Given the detailed structure of the financial SAM and the wealth of information provided by the Cameroon data, the simulated policy experiments allow us to assess the growth and income effects of increased public investment at the aggregate levels, but also at micro levels. In particular, the simulated effects of increased public investment are assessed on the overall economic growth rates, and across economic and institutional agents, looking specifically at
53 Naturally, within the framework of the PRSP process, the public investment program, which underpins the growth and poverty reduction strategies will have to be in aligned with the government priorities, which may emphasize both investment expenditures for sustainable growth in the medium and long-term, and recurrent spending to ensure improved and continued delivery of social services, especially to the poor and vulnerable groups.
28
inherent changes on the remuneration of production factors, changes in urban and rural household income, changes in the level of production across the traditional IMMPA income groups, and changes in financial assets of economic agents and financial institutions. The results show a robust increase in the level of GDP. The simulated growth rate is about 8.5%, significantly above the growth rate of 5% recorded during the same period (Cameroon DSNA [2000], World Bank [2000]). The positive effects of simulations reflects the fact that increased investment results in rising demand for goods, and hence production. Except in few cases, and particularly on the production side, the growth process is uniform. Its benefits are evenly distributed across sectors and economic agents. A comparison between the base case and the simulated results shows that the total remuneration of rural unskilled labor increases by over 8%, slightly above the remuneration of urban unskilled and skilled labor. Similarly, the remuneration of capital is higher under the simulated scenario, with a growth rate of about 9%. The more rapid increase of total remuneration of capital under the current scenario is reflected in the structure of production. The urban corporate production, which is one of the most capital intensive sectors increases by over 10.6%, higher than the aggregate economic growth rates. The non traded agricultural production also increases significantly as well, with a hypothesized growth rate of 8.5%, above that of the traded sector, which is less than 5%. By contrast, public sector production, which exhibits the lowest own-sector multipliers, forward and backward linkage indices, increases by only 1.5%, an illustration of the highly variable growth rates across the different sectors in urban areas. The robust growth rate for the capitalist and corporate production in urban areas is also reflected in the distribution of income growth at the household levels. Capitalist households and non financial companies show the strongest growth in income under the simulated policy experiment. The income accruing to these two groups increases by about 8.5 and 9 %, respectively, above the income earned by rural households deriving their income from traded and non traded agricultural production. However, the income growth of capitalist and non financial companies falls within the range of urban unskilled households working in the informal sector. This is also reflected in the changes in financial assets. Capitalist households and households engaged in informal sectors activities have the largest increase in financial assets. The increase is general across all the other income groups, although of a much lower magnitude. For instance, the changes in commercial banks’ financial assets are relatively low, reflecting the initially low level and particularly the degree of monetization of the economy. VI. Concluding Remarks This paper describes a financial social accounting matrix for the Cameroonian economy based on the most recent data sets. In particular, it presents a detailed structure of the economy of the post-devaluation growth period. The aftermath of the 1994 CFA Franc devaluation was characterized by the implementation of a number of structural reforms, most notably changes in the composition of public expenditures illustrated by cuts in wages and salaries and hiring a freeze in the public sector. These reforms were accompanied by the implementation of stabilization policies with implications for labor markets and employment, growth and investment, household income, consumption and poverty. The analysis of the financial SAM shows that the post-devaluation growth period is also characterized by robust
29
informal sector production, which accounts for a sizable share of total production at factor costs and gross value added. Though rural-to-urban migration remains important and may have contributed to increased supply of urban labor, the rapidly rising scope of informal sector activities, one of the key characteristics of the Cameroonian economy, and the nature of the growth process in the post-devaluation period may also have played a critical role in the structure of the economy of the late 1990s. That period is characterized by continued low investment and rapid depreciation of capital stock, particularly in rural areas, and rising unemployment. Under these conditions, the informal sector need not be viewed as an engine for long-term growth; instead, it should be viewed as a disguised form of unemployment and short-term alternative to a shortage of formal employment, especially given the skill mix of its labor force and its implication for domestic resource mobilization in the short run, and investment in the medium to long-term. The detailed structure of the financial SAM also allows a further analysis of the structural characteristics of the Cameroonian economy, and particularly intra and inter-sectoral linkages and flows of funds and resources across sectors. While own-sector multipliers appear to be generally high across all the IMMPA-based production sectors, implying that increased investment or additional resources in a given sector are likely to have a greater impact within the sector, inter-sectoral multipliers are highly variable. For instance, while the effects of an injection of additional resources in the public sector are insignificant on the rural traded sector, they tend to be relatively high on informal and urban corporate production. A similar contrast is observed on the other key production sectors, where the relatively strong linkages between informal sector production and rural production (traded and non traded) is worth pointing out. However, factor productivity appears to be very low in rural areas, notwithstanding the relatively high total multiplier linkages. Moreover, in terms of future prospects for growth and industrial production, rural sectors have low forward linkages, while urban corporate production enjoys one of the highest forward linkage indexes. The simulations highlight the income and growth effects of increased public investment, following hypothetical debt relief and reduction of external debt servicing within the framework of the HIPC initiative, and under fixed-price multipliers. Increased public investment results in a higher level of GDP and household income, almost across all sectors and income groups. However, the financial SAM-based multipliers are based on a number of restrictive assumptions. The most noticeable ones include the hypothesis of excess capacity, which is essential for prices to remain constant. A relaxation of the fixed-prices assumption is likely to impact on the distribution of income and growth across sectors and geographical regions. The simulations consider an extreme case where the hypothetical relief from the HIPC is entirely reallocated to finance public investment and capital expenditures. In practice and in support of the PRSP process, a mix of recurrent and capital expenditures is a likely feature of growth and poverty reduction strategies. The proposed financial SAM provides the data framework for constructing the IMMPA model for Cameroon. The IMMPA model has a financial CGE-type architecture, with a dynamic and a more flexible structure, and should provide the basis for assessing the growth and income distribution and welfare effects of macroeconomic reforms and increased public spending under differing composition of investment and recurrent expenses. Moving beyond the functional distribution of income, and
30
drawing on the financial SAM, the IMMPA model could also provide the framework for investigating effects of alternative macroeconomic policies on income and poverty at the household and individual levels, exploiting the linkages between national accounts and household surveys. These will be considered in future research. References: Agénor Pierre-Richard, A. Izquierdo and H. Fofack (2003). “A Quantitative Macroeconomic Framework for the Analysis of Poverty Reduction Strategies.” Forthcoming the World Bank Policy Research Working Paper.
Agénor Pierre-Richard (2002). “Macroeconomic Adjustment and the Poor: Analytical Issues and Cross-Country Evidence”. Forthcoming Journal of Economic Survey.
Agénor Pierre-Richard (2000). “The Economics of Adjustment and Growth” Academic Press (San Diego, California).
Agénor Pierre-Richard (1996). “The Labor Market and Economic Adjustment.” IMF Staff Papers, No. 43, 261-335.
Amin Aloysius Ajab (2002). “An Examination of the Sources of Economic Growth in Cameroon.” AERC Research Paper 116. African Economic Research Consortium, Nairobi, March 2002.
Arndt Channing, Henning Tarp Jensen and Finn Tarp. (2000). “Structural Characteristics of the Economy of Mozambique: A SAM-Based Analysis”. Review of Development Economics, Vol. 4(3).
Bamou Ernest (2002). “Bref aperçu de l’économie Camerounaise.” Unpublished, the University of Yaounde.
BEAC (1997). "Etudes & Statistiques". n° 240 – Octobre. Yaoundé, Cameroun.
Beckerman Paul (2000). “How should an economy’s fiscal deficit be? A monetary-programming approach. World Bank Policy Research Working Paper, No. 2308.
Benjamin Nancy and S. Devarajan (1985). “Oil Revenues and Economic Policy in Cameroon: Results from a Computable General Equilibrium Model.” Working Paper No. 745, The World Bank, Washington DC.
Blanford David and S Lynch (1990). “Structural Adjustment and the Poor in Cameroon.” Cornell Food and Nutrition Policy program, Cornell University, Ithaca, New York.
Blandford David, D. Friedman, S. Lynch, N. Mukherjee, and D. Sahn (1995). “Oil Boom and Bust: The Harsh Realities of Adjustment in Cameroon”. In David Sahn ed., Adjusting to Policy Failure in African Economies, Ithica, New York: Cornell University Press.
Bulmer-Thomas v. (1982). “Input-Output Analysis in Developing Countries: Sources, Methods and Applications”. John Wiley and Sons Ltd.
Burgess Robin and Nicholas Stern (1993). “Taxation and Development” Journal of Economics Literature, Vol. 31, 762-830.
31
Cameroon (2000). Department of Statistics and national Accounts, Ministry of Finance. “Statistical Yearbook for Cameroon 1999”. The Republic of Cameroon.
Cameroon (2003). Poverty Reduction Strategy Paper. The Ministry of Finance and Development Planning, Republic of Cameroon.
Cameroon (2002). Ministère de l’Emploi, du Travail et de la Prévoyance Sociale. Republic of Cameroon.
Carneiro D. D. and R. L. F. Werneck (1993). Obstacles to Investment Resumption in Brazil. In E. Bacha (Ed.) “Savings and Investment Requirements for the Resumption of Growth in Latin America.” Washington D. C. Inter American Development Bank.
Chalk Nigel and Richard Hemming (2000). “Assessing Fiscal Sustainability in Theory and Practice”. IMF Working Paper WP/00/81.
COBAC (1995). "Rapport d'activité – Exercice 1994-1995". Commission Bancaire de l’Afrique Centrale, Yaoundé, Cameroun.
COBAC (1996). "Rapport d'activité – Exercice 1995-1996". Commission Bancaire de l’Afrique Centrale, Yaoundé, Cameroun.
De Maio Lorenzo, Frances Stewart and Rolph Van Der Hoeven (1999). “Computable General Equilibrium Models, Adjustment and the Poor in Africa.” World Development Vol. 27, No. 3, pp. 453-470.
Decaluwé B., A. Patry, L. Savard, and E. Thorbecke (1999). "Poverty Analysis Within a General Equilibrium Framework." Working paper No. 9909, CREFA 99-06, Université Laval, Québec.
Defourny Jacques, and Erik Thorbecke (1984). "Structural Path Analysis and Multiplier Decomposition within a Social Accounting Matrix Framework." The Economic Journal, No. 94, pp. 111-136. Devarajan Shantayanan, Hafez Ghanem, and Karen Thierfelder (1999). “Labor Market Regulations, Trade Liberalization and Distribution of Income in Bangladesh.” Journal of Policy Reforms, 3 (- 1999), 1-28.
DSCN (1998). "L'industrie camerounaise en 1995/1996". Cameroon’s Department of Statistics and National Accounts (DSNA). Ministry of Economy and Finance, Yaoundé, Cameroon.
DSCN (1999). "Les comptes nationaux du Cameroun selon le SCN93", Volume 2: Présentation chiffrée. Cameroon’s Department of Statistics and National Accounts (DSNA). Ministry of Economy and Finance, Yaoundé, Cameroon.
DSCN (1997). "Enquête camerounaise auprès des ménages (ECAM)". Volume 2: "Résultats". Tome 2: Distribution des revenus et consommation des ménages au Cameroun en 1996".
Easterly William (2001). “The Elusive Quest for Growth: Economists’ Adventures and Misadventures in the Tropics.” MIT Press.
Easterly William (1989). “A Consistency Framework for Macroeconomic Analysis” Working Paper Series no. 234. The World Bank.
Elbadawi, Ibrahim A., Benno J. Ndulu, and Njuguna Ndungu (1997). “Debt Overhang and Economic Growth in Sub-Saharan Africa.” In External Finance for Low-Income Countries, ed. By Zubair Iqbal and Ravi Kanbur, International Monetary Fund (Washington DC.)
32
Fambon Samuel, A. Ajab Amin, F. Menjo Baye, I. Noumba, I. Tamba, and R. Tawah (2001). “Pauvreté et Répartition des Revenus au Cameroun Durant les Années 1990.” Cahier de Recherche No. 01-06 du CREFA, Département d’économie, Université Laval, Canada.
Fannin Matthew (2000). “Construction of a Social Accounting Matrix for County Fermanagh, Northern Ireland. Department of Agricultural Economics, University of Missouri-Columbia.
Fofack Hippolyte, Celestin Monga and Hasan Tuluy (2001). “Household Welfare and Poverty Dynamics in Burkina Faso: Empirical Evidences from Household Surveys.” World Bank Policy Research Working Paper No. 2590.
Fofack Hippolyte (2002). “The Nature and Dynamics of Poverty Determinants in Burkina Faso in the 1990s.” World Bank Policy Research Working Paper No. 2847.
Glewwe Paul (1991). “Investigating the Determinants of Household Welfare in Cote d’Ivoire.” Journal of Development Economics, Vol. 35(2): 307-337.
Hillman Arye (2002). “The World Bank and the Persistence of Poverty in Poor Countries.” European Journal of Political Economy, Vol. 18 (2002) 783-795.
Horton Susan, R. Kanbur, and D. Mazumdar (1994). “Labor Markets in an Era of Adjustment”. EDI Development Studies, The World Bank.
International Monetary Fund (2002). “IMF World Economic Outlook” The International Monetary Fund. Washington DC.
Iqbal Zubair and Ravi Kanbur (1997). External Finance for Low-Income Countries. International Monetary Fund. Washington DC.
Iyoha Milton A. (2000). “An Econometric Analysis of External Debt and Economic Growth in Sub-Saharan African Countries,” in External Debt and Capital Flight in Sub-Saharan Africa, ed. By S. Ibi Ajayi and Mohsin Khan, International Monetary Fund, Washington DC.
Klugman Jeni (2002). Overview in “A Source Book for Poverty Reduction Strategies.” Volume I: Core Techniques and Cross-Cutting Issues. The World Bank, Washington D.C.
Krieckhaus Jonathan (2002). “Reconceptualizing the Development State: Public Saving and Economic Growth.” World Development Vol. 30, No. 10 pp. 1697-1712.
Ndulu Benno (1991). “Growth and Adjustment in Sub-Saharan Africa. In Economic Reform in Sub-Saharan Africa: A Symposium, ed. A. Chhibber and S. Fischer. The World Bank.
Njinkeu Dominique and Ernest Bamou (2000). “Trade and Exchange Rate Policy Options for the CFA Countries: Simulations with a CGE Model for Cameroon”. African Economic Research Consortium Working Paper No. 96. AERC Nairobi.
Pattillo Catherine, Hélène Poirson, and Luca Ricci (2002). “External Debt and Growth”. Working Paper No. 02/69, International Monetary Fund.
Pyatt Graham, and Jeffery I. Round (1990). “Social Accounting Matrices. A Basis for Planning.” A World Bank Symposium, The World Bank, Washington, D.C.
Rasmussen P. (1957). Studies in Intersectoral Relations. Amsterdam: North-Holland.
Ravallion Martin (2001). “Growth, Inequality and Poverty: Looking Beyond Averages.” World Development, Vol. 27, No. 11, pp. 1803-1815.
Roland-Holst David and Ferran Sancho. (1992). “Relative Income Determination in the USA: A Social Accounting Perspective”. Review of Income and Wealth. 38 (2), 311-327.
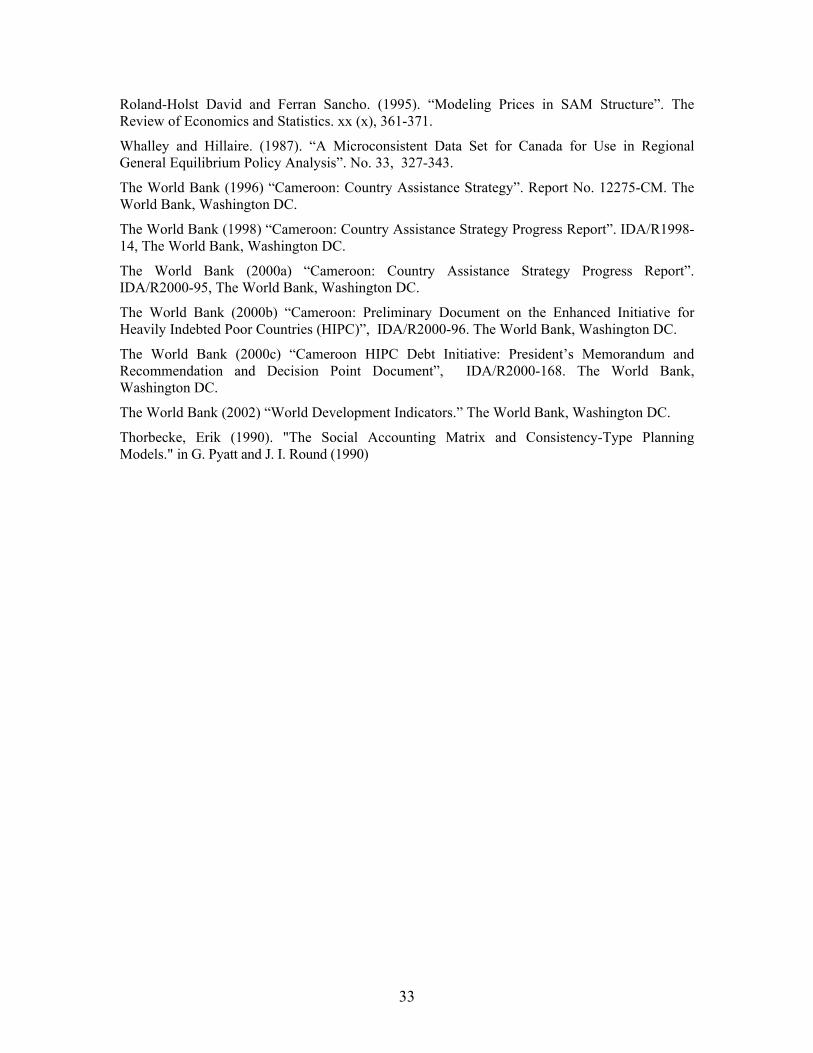
33
Roland-Holst David and Ferran Sancho. (1995). “Modeling Prices in SAM Structure”. The Review of Economics and Statistics. xx (x), 361-371.
Whalley and Hillaire. (1987). “A Microconsistent Data Set for Canada for Use in Regional General Equilibrium Policy Analysis”. No. 33, 327-343.
The World Bank (1996) “Cameroon: Country Assistance Strategy”. Report No. 12275-CM. The World Bank, Washington DC.
The World Bank (1998) “Cameroon: Country Assistance Strategy Progress Report”. IDA/R1998-14, The World Bank, Washington DC.
The World Bank (2000a) “Cameroon: Country Assistance Strategy Progress Report”. IDA/R2000-95, The World Bank, Washington DC.
The World Bank (2000b) “Cameroon: Preliminary Document on the Enhanced Initiative for Heavily Indebted Poor Countries (HIPC)”, IDA/R2000-96. The World Bank, Washington DC.
The World Bank (2000c) “Cameroon HIPC Debt Initiative: President’s Memorandum and Recommendation and Decision Point Document”, IDA/R2000-168. The World Bank, Washington DC.
The World Bank (2002) “World Development Indicators.” The World Bank, Washington DC.
Thorbecke, Erik (1990). "The Social Accounting Matrix and Consistency-Type Planning Models." in G. Pyatt and J. I. Round (1990)
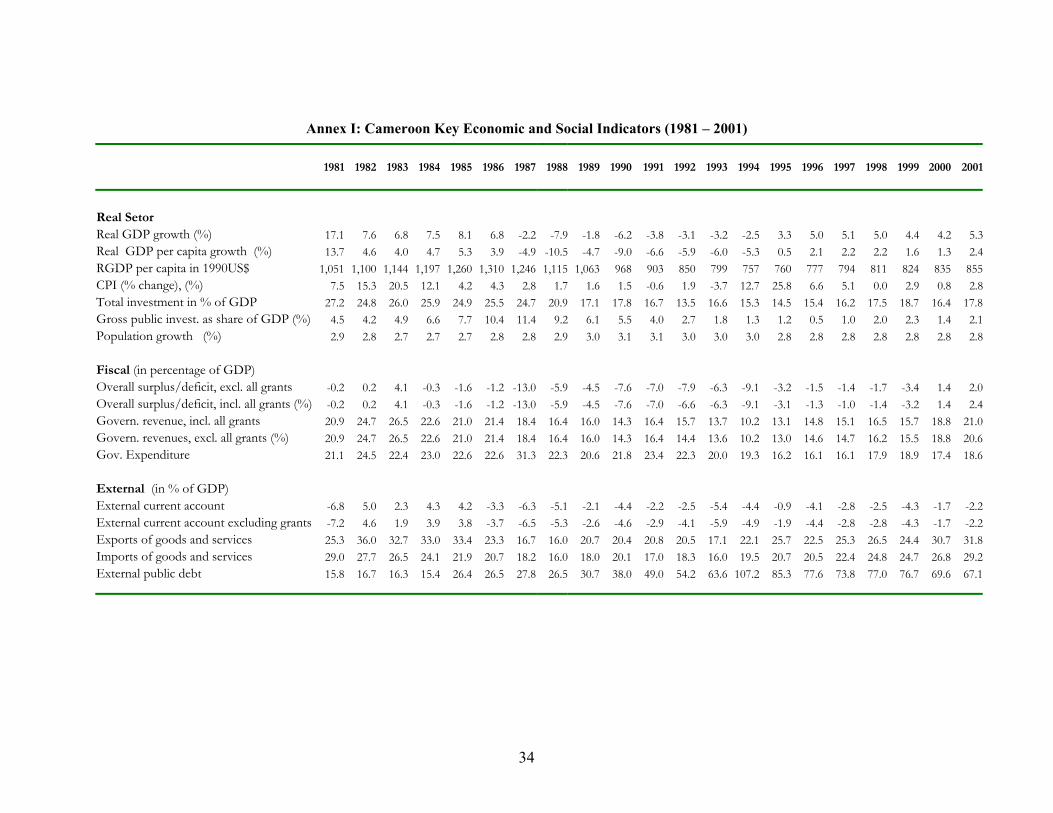
34
Annex I: Cameroon Key Economic and Social Indicators (1981 – 2001) 1981 1982 1983 1984 1985 1986 1987 1988 1989 1990 1991 1992 1993 1994 1995 1996 1997 1998 1999 2000 2001 Real Setor Real GDP growth (%) 17.1 7.6 6.8 7.5 8.1 6.8 -2.2 -7.9 -1.8 -6.2 -3.8 -3.1 -3.2 -2.5 3.3 5.0 5.1 5.0 4.4 4.2 5.3Real GDP per capita growth (%) 13.7 4.6 4.0 4.7 5.3 3.9 -4.9 -10.5 -4.7 -9.0 -6.6 -5.9 -6.0 -5.3 0.5 2.1 2.2 2.2 1.6 1.3 2.4RGDP per capita in 1990US$ 1,051 1,100 1,144 1,197 1,260 1,310 1,246 1,115 1,063 968 903 850 799 757 760 777 794 811 824 835 855CPI (% change), (%) 7.5 15.3 20.5 12.1 4.2 4.3 2.8 1.7 1.6 1.5 -0.6 1.9 -3.7 12.7 25.8 6.6 5.1 0.0 2.9 0.8 2.8Total investment in % of GDP 27.2 24.8 26.0 25.9 24.9 25.5 24.7 20.9 17.1 17.8 16.7 13.5 16.6 15.3 14.5 15.4 16.2 17.5 18.7 16.4 17.8Gross public invest. as share of GDP (%) 4.5 4.2 4.9 6.6 7.7 10.4 11.4 9.2 6.1 5.5 4.0 2.7 1.8 1.3 1.2 0.5 1.0 2.0 2.3 1.4 2.1Population growth (%) 2.9 2.8 2.7 2.7 2.7 2.8 2.8 2.9 3.0 3.1 3.1 3.0 3.0 3.0 2.8 2.8 2.8 2.8 2.8 2.8 2.8 Fiscal (in percentage of GDP) Overall surplus/deficit, excl. all grants -0.2 0.2 4.1 -0.3 -1.6 -1.2 -13.0 -5.9 -4.5 -7.6 -7.0 -7.9 -6.3 -9.1 -3.2 -1.5 -1.4 -1.7 -3.4 1.4 2.0Overall surplus/deficit, incl. all grants (%) -0.2 0.2 4.1 -0.3 -1.6 -1.2 -13.0 -5.9 -4.5 -7.6 -7.0 -6.6 -6.3 -9.1 -3.1 -1.3 -1.0 -1.4 -3.2 1.4 2.4Govern. revenue, incl. all grants 20.9 24.7 26.5 22.6 21.0 21.4 18.4 16.4 16.0 14.3 16.4 15.7 13.7 10.2 13.1 14.8 15.1 16.5 15.7 18.8 21.0Govern. revenues, excl. all grants (%) 20.9 24.7 26.5 22.6 21.0 21.4 18.4 16.4 16.0 14.3 16.4 14.4 13.6 10.2 13.0 14.6 14.7 16.2 15.5 18.8 20.6Gov. Expenditure 21.1 24.5 22.4 23.0 22.6 22.6 31.3 22.3 20.6 21.8 23.4 22.3 20.0 19.3 16.2 16.1 16.1 17.9 18.9 17.4 18.6 External (in % of GDP) External current account -6.8 5.0 2.3 4.3 4.2 -3.3 -6.3 -5.1 -2.1 -4.4 -2.2 -2.5 -5.4 -4.4 -0.9 -4.1 -2.8 -2.5 -4.3 -1.7 -2.2External current account excluding grants -7.2 4.6 1.9 3.9 3.8 -3.7 -6.5 -5.3 -2.6 -4.6 -2.9 -4.1 -5.9 -4.9 -1.9 -4.4 -2.8 -2.8 -4.3 -1.7 -2.2Exports of goods and services 25.3 36.0 32.7 33.0 33.4 23.3 16.7 16.0 20.7 20.4 20.8 20.5 17.1 22.1 25.7 22.5 25.3 26.5 24.4 30.7 31.8Imports of goods and services 29.0 27.7 26.5 24.1 21.9 20.7 18.2 16.0 18.0 20.1 17.0 18.3 16.0 19.5 20.7 20.5 22.4 24.8 24.7 26.8 29.2External public debt 15.8 16.7 16.3 15.4 26.4 26.5 27.8 26.5 30.7 38.0 49.0 54.2 63.6 107.2 85.3 77.6 73.8 77.0 76.7 69.6 67.1
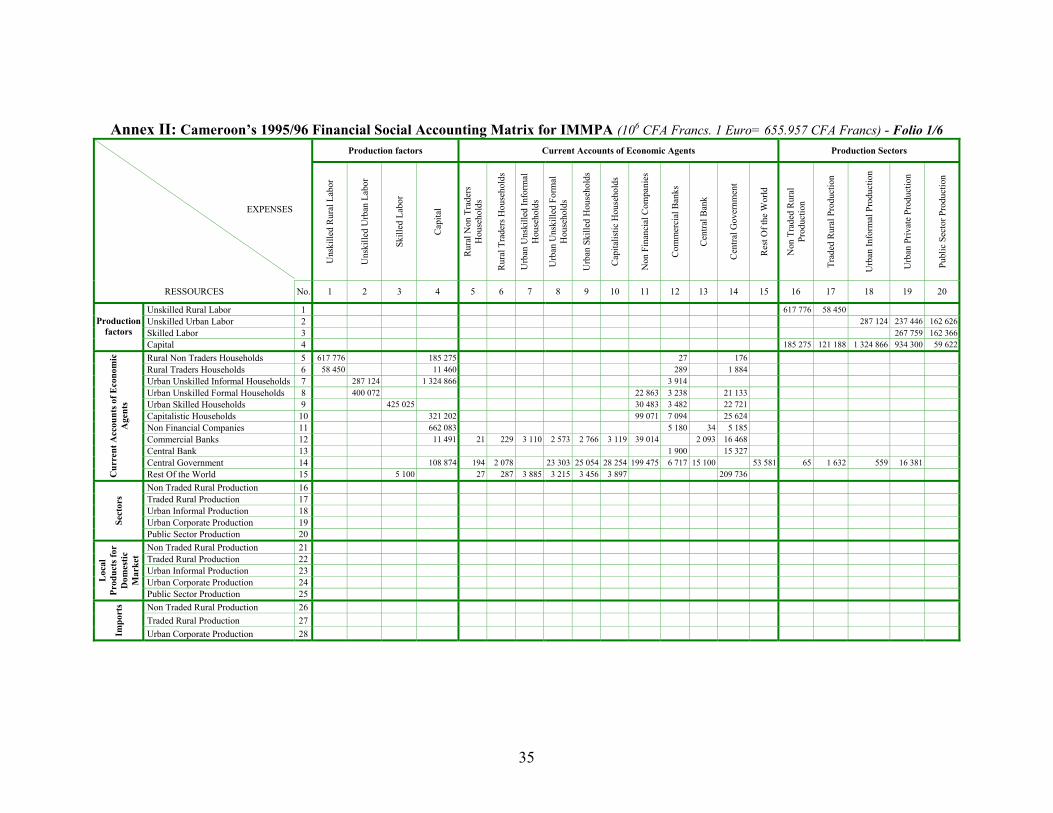
35
Annex II: Cameroon’s 1995/96 Financial Social Accounting Matrix for IMMPA (106 CFA Francs. 1 Euro= 655.957 CFA Francs) - Folio 1/6 Production factors Current Accounts of Economic Agents Production Sectors
EXPENSES
Uns
kille
d R
ural
Lab
or
Uns
kille
d U
rban
Lab
or
Skill
ed L
abor
Cap
ital
Rur
al N
on T
rade
rs
Hou
seho
lds
Rur
al T
rade
rs H
ouse
hold
s
Urb
an U
nski
lled
Info
rmal
H
ouse
hold
s
Urb
an U
nski
lled
Form
al
Hou
seho
lds
Urb
an S
kille
d H
ouse
hold
s
Cap
italis
tic H
ouse
hold
s
Non
Fin
anci
al C
ompa
nies
Com
mer
cial
Ban
ks
Cen
tral B
ank
Cen
tral G
over
nmen
t
Res
t Of t
he W
orld
Non
Tra
ded
Rur
al
Prod
uctio
n
Trad
ed R
ural
Pro
duct
ion
Urb
an In
form
al P
rodu
ctio
n
Urb
an P
rivat
e Pr
oduc
tion
Publ
ic S
ecto
r Pro
duct
ion
RESSOURCES No. 1 2 3 4 5 6 7 8 9 10 11 12 13 14 15 16 17 18 19 20
Unskilled Rural Labor 1 617 776 58 450 Unskilled Urban Labor 2 287 124 237 446 162 626Skilled Labor 3 267 759 162 366
Production factors
Capital 4 185 275 121 188 1 324 866 934 300 59 622Rural Non Traders Households 5 617 776 185 275 27 176 Rural Traders Households 6 58 450 11 460 289 1 884 Urban Unskilled Informal Households 7 287 124 1 324 866 3 914 Urban Unskilled Formal Households 8 400 072 22 863 3 238 21 133 Urban Skilled Households 9 425 025 30 483 3 482 22 721 Capitalistic Households 10 321 202 99 071 7 094 25 624 Non Financial Companies 11 662 083 5 180 34 5 185 Commercial Banks 12 11 491 21 229 3 110 2 573 2 766 3 119 39 014 2 093 16 468 Central Bank 13 1 900 15 327 Central Government 14 108 874 194 2 078 23 303 25 054 28 254 199 475 6 717 15 100 53 581 65 1 632 559 16 381
Cur
rent
Acc
ount
s of E
cono
mic
A
gent
s
Rest Of the World 15 5 100 27 287 3 885 3 215 3 456 3 897 209 736 Non Traded Rural Production 16 Traded Rural Production 17 Urban Informal Production 18 Urban Corporate Production 19 Se
ctor
s
Public Sector Production 20 Non Traded Rural Production 21 Traded Rural Production 22 Urban Informal Production 23 Urban Corporate Production 24 L
ocal
Pr
oduc
ts fo
r D
omes
tic
Mar
ket
Public Sector Production 25 Non Traded Rural Production 26 Traded Rural Production 27
Impo
rts
Urban Corporate Production 28
36
Annex II: Cameroon’s 1995/96 Financial Social Accounting Matrix for IMMPA (106 CFA Francs. 1 Euro= 655.957 CFA Francs) - Folio 2/6 Production factors Current Accounts of Economic Agents Production Sectors
EXPENSES
Uns
kille
d R
ural
La
bor
Uns
kille
d U
rban
La
bor
Skill
ed L
abor
Cap
ital
Rur
al N
on T
rade
rs
Hou
seho
lds
Rur
al T
rade
rs
Hou
seho
lds
Urb
an U
nski
lled
Info
rmal
H
ouse
hold
s
Urb
an U
nski
lled
Form
al H
ouse
hold
s
Urb
an S
kille
d H
ouse
hold
s
Cap
italis
tic
Hou
seho
lds
Non
Fin
anci
al
Com
pani
es
Com
mer
cial
Ban
ks
Cen
tral B
ank
Cen
tral G
over
nmen
t
Res
t Of t
he W
orld
Non
Tra
ded
Rur
al
Prod
uctio
n
Trad
ed R
ural
Pr
oduc
tion
Urb
an In
form
al
Prod
uctio
n
Urb
an P
rivat
e Pr
oduc
tion
Publ
ic S
ecto
r Pr
oduc
tion
RESSOURCES No. 1 2 3 4 5 6 7 8 9 10 11 12 13 14 15 16 17 18 19 20 Non Traded Rural Production 29 234 062 19 351 409 503 97 708 73 201 55 257 64 523 204 459 25 482 656Traded Rural Production 30 4 246 351 7 427 1 773 1 328 1 002 2 930 97 577 116 306 131Urban Informal Production 31 333 631 27 583 439 103 104 771 81 981 61 151 31 705 88 023 265 188 659 526 68 680Urban Corporate Production 32 209 650 17 334 615 080 146 757 203 724 168 110 41 156 114 259 344 231 856 107 89 150
Dem
and
for
Com
posi
te
Goo
ds
Public Sector Production 33 12 770 1 055 37 462 8 938 12 408 10 240 446 097 949 371 3 443 8 463 193Non Traded Rural Production 34 3 192 Traded Rural Production 35 224 156
Exp
orts
Urban Corporate Production 36 869 001 Rural Non Traders Households 37 8 653 Rural Traders Households 38 3 815 Urban Unsk. Informal Households 39 100 334 Urban Unsk. Formal Households 40 58 268 Urban Skilled Households 41 77 793 Capitalistic Households 42 121 961 Non Financial Companies 43 281 576 Commercial Banks 44 49 043 Central Bank 45 Central Government 46 72 556
Cap
ital A
ccou
nts o
f Eco
nom
ic
Age
nts
Rest Of the World 47 -156 299 Fiduciary Currencies 48 Deposits 49 Special Deposits to Central Bank 50 Bank Reserves 51 Capital Shares 52 Credits 53 Bills issued by Government 54 Advances to Treasury 55 State Consolidated Credits 56 Refinancing 57 External Engagements 58 C
hang
es in
Ass
ets a
nd L
iabi
litie
s
External Financial Resources 59
Summation 676 226 687 196 430 125 2 625 251 803 254 72 083 1 615 904 447 306 481 711 452 991 672 482 80 884 17 227 836 907 993 631 941 449 386 853 2 527 447 3 121 770 543 424
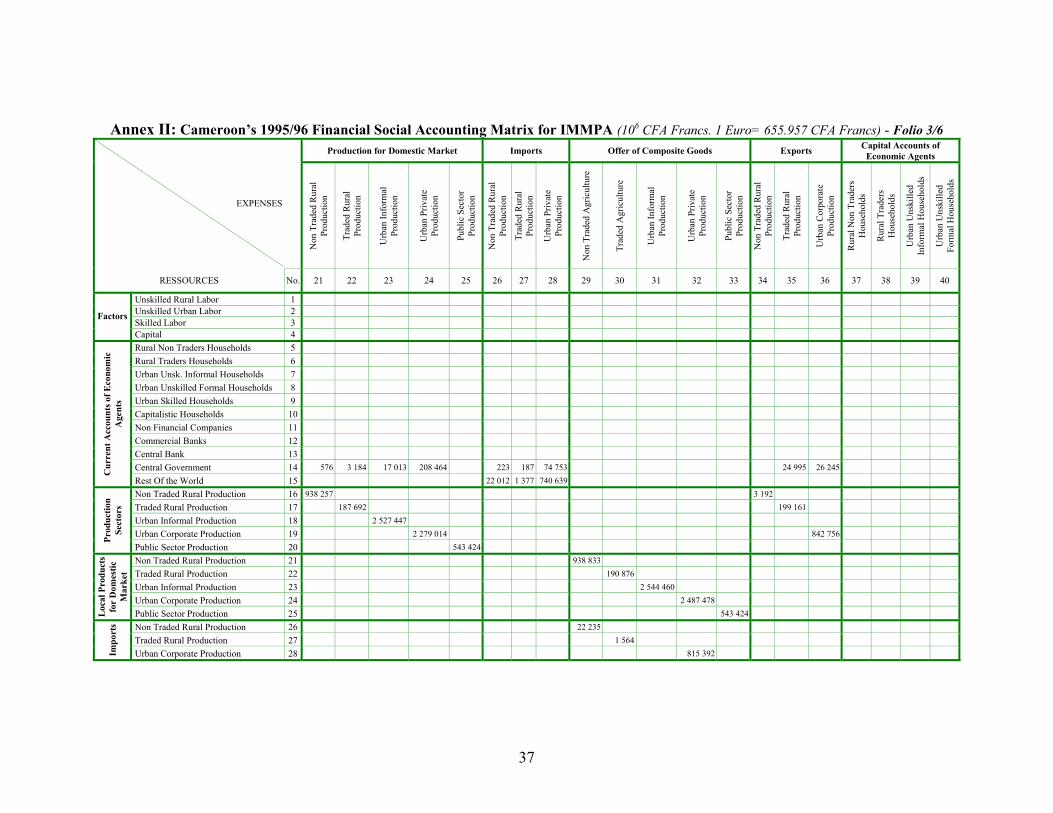
37
Annex II: Cameroon’s 1995/96 Financial Social Accounting Matrix for IMMPA (106 CFA Francs. 1 Euro= 655.957 CFA Francs) - Folio 3/6 Production for Domestic Market Imports Offer of Composite Goods Exports Capital Accounts of
Economic Agents
EXPENSES
Non
Tra
ded
Rur
al
Prod
uctio
n
Trad
ed R
ural
Pr
oduc
tion
Urb
an In
form
al
Prod
uctio
n
Urb
an P
rivat
e Pr
oduc
tion
Publ
ic S
ecto
r Pr
oduc
tion
Non
Tra
ded
Rur
al
Prod
uctio
n
Trad
ed R
ural
Pr
oduc
tion
Urb
an P
rivat
e Pr
oduc
tion
Non
Tra
ded
Agr
icul
ture
Trad
ed A
gric
ultu
re
Urb
an In
form
al
Prod
uctio
n
Urb
an P
rivat
e Pr
oduc
tion
Publ
ic S
ecto
r Pr
oduc
tion
Non
Tra
ded
Rur
al
Prod
uctio
n
Trad
ed R
ural
Pr
oduc
tion
Urb
an C
orpo
rate
Pr
oduc
tion
Rur
al N
on T
rade
rs
Hou
seho
lds
Rur
al T
rade
rs
Hou
seho
lds
Urb
an U
nski
lled
Info
rmal
Hou
seho
lds
Urb
an U
nski
lled
Form
al H
ouse
hold
s
RESSOURCES No. 21 22 23 24 25 26 27 28 29 30 31 32 33 34 35 36 37 38 39 40
Unskilled Rural Labor 1 Unskilled Urban Labor 2 Skilled Labor 3
Factors
Capital 4 Rural Non Traders Households 5 Rural Traders Households 6 Urban Unsk. Informal Households 7 Urban Unskilled Formal Households 8 Urban Skilled Households 9 Capitalistic Households 10 Non Financial Companies 11 Commercial Banks 12 Central Bank 13 Central Government 14 576 3 184 17 013 208 464 223 187 74 753 24 995 26 245 C
urre
nt A
ccou
nts o
f Eco
nom
ic
Age
nts
Rest Of the World 15 22 012 1 377 740 639 Non Traded Rural Production 16 938 257 3 192 Traded Rural Production 17 187 692 199 161 Urban Informal Production 18 2 527 447 Urban Corporate Production 19 2 279 014 842 756 Pr
oduc
tion
Sect
ors
Public Sector Production 20 543 424 Non Traded Rural Production 21 938 833 Traded Rural Production 22 190 876 Urban Informal Production 23 2 544 460 Urban Corporate Production 24 2 487 478
Loc
al P
rodu
cts
for
Dom
estic
M
arke
t
Public Sector Production 25 543 424 Non Traded Rural Production 26 22 235 Traded Rural Production 27 1 564
Impo
rts
Urban Corporate Production 28 815 392
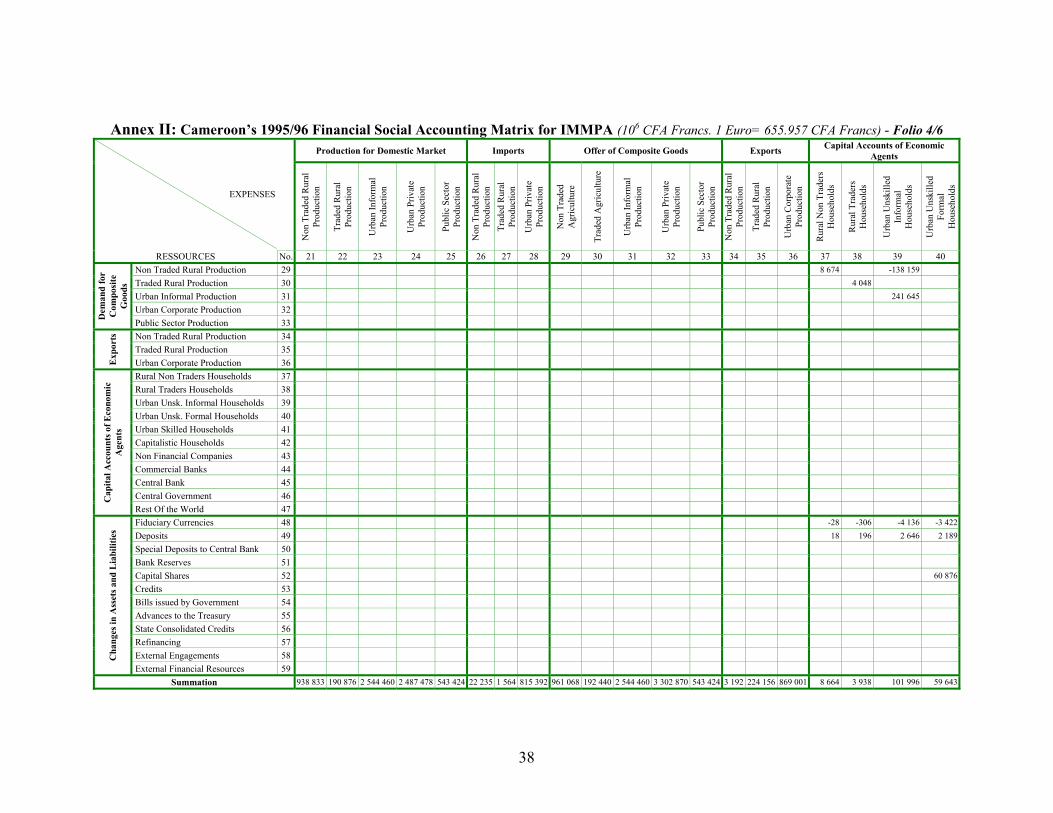
38
Annex II: Cameroon’s 1995/96 Financial Social Accounting Matrix for IMMPA (106 CFA Francs. 1 Euro= 655.957 CFA Francs) - Folio 4/6 Production for Domestic Market Imports Offer of Composite Goods Exports Capital Accounts of Economic
Agents
EXPENSES
Non
Tra
ded
Rur
al
Prod
uctio
n
Trad
ed R
ural
Pr
oduc
tion
Urb
an In
form
al
Prod
uctio
n
Urb
an P
rivat
e Pr
oduc
tion
Publ
ic S
ecto
r Pr
oduc
tion
Non
Tra
ded
Rur
al
Prod
uctio
n Tr
aded
Rur
al
Prod
uctio
n
Urb
an P
rivat
e Pr
oduc
tion
Non
Tra
ded
Agr
icul
ture
Trad
ed A
gric
ultu
re
Urb
an In
form
al
Prod
uctio
n
Urb
an P
rivat
e Pr
oduc
tion
Publ
ic S
ecto
r Pr
oduc
tion
Non
Tra
ded
Rur
al
Prod
uctio
n
Trad
ed R
ural
Pr
oduc
tion
Urb
an C
orpo
rate
Pr
oduc
tion
Rur
al N
on T
rade
rs
Hou
seho
lds
Rur
al T
rade
rs
Hou
seho
lds
Urb
an U
nski
lled
Info
rmal
H
ouse
hold
s
Urb
an U
nski
lled
Form
al
Hou
seho
lds
RESSOURCES No. 21 22 23 24 25 26 27 28 29 30 31 32 33 34 35 36 37 38 39 40 Non Traded Rural Production 29 8 674 -138 159 Traded Rural Production 30 4 048 Urban Informal Production 31 241 645 Urban Corporate Production 32
Dem
and
for
Com
posi
te
Goo
ds
Public Sector Production 33 Non Traded Rural Production 34 Traded Rural Production 35
Exp
orts
Urban Corporate Production 36 Rural Non Traders Households 37 Rural Traders Households 38 Urban Unsk. Informal Households 39 Urban Unsk. Formal Households 40 Urban Skilled Households 41 Capitalistic Households 42 Non Financial Companies 43 Commercial Banks 44 Central Bank 45 Central Government 46 C
apita
l Acc
ount
s of E
cono
mic
A
gent
s
Rest Of the World 47 Fiduciary Currencies 48 -28 -306 -4 136 -3 422Deposits 49 18 196 2 646 2 189Special Deposits to Central Bank 50 Bank Reserves 51 Capital Shares 52 60 876Credits 53 Bills issued by Government 54 Advances to the Treasury 55 State Consolidated Credits 56 Refinancing 57 External Engagements 58 C
hang
es in
Ass
ets a
nd L
iabi
litie
s
External Financial Resources 59 Summation 938 833 190 876 2 544 460 2 487 478 543 424 22 235 1 564 815 392 961 068 192 440 2 544 460 3 302 870 543 424 3 192 224 156 869 001 8 664 3 938 101 996 59 643
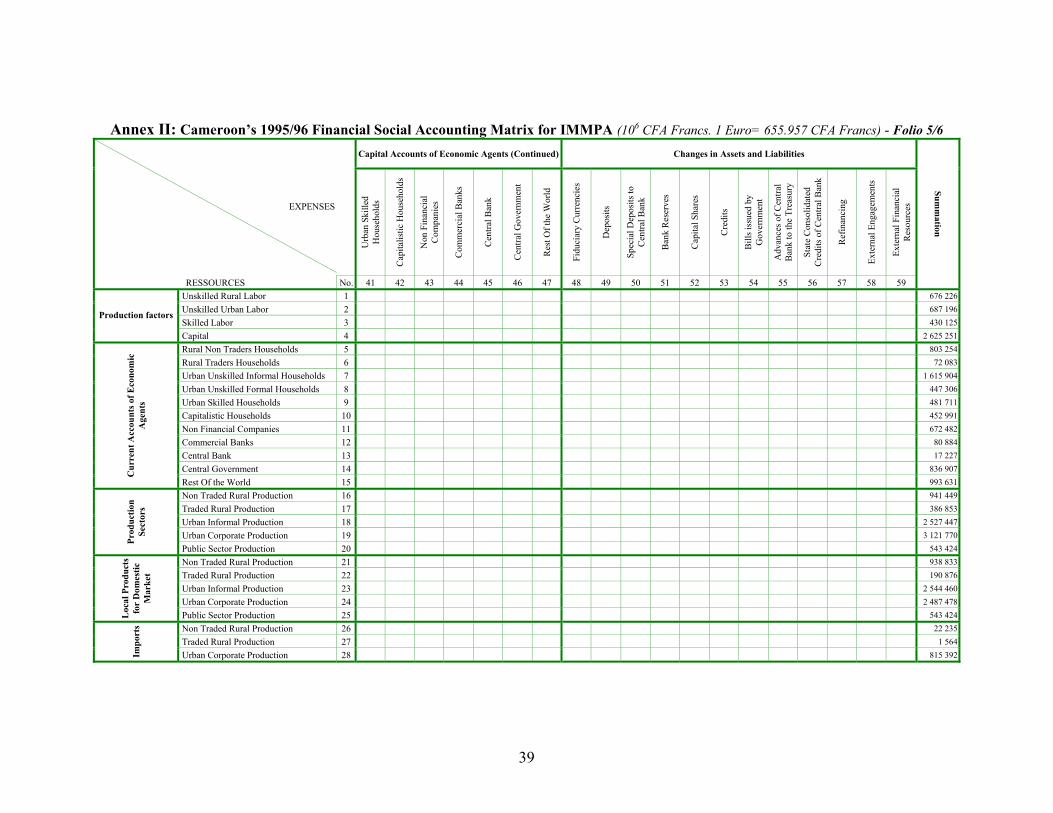
39
Annex II: Cameroon’s 1995/96 Financial Social Accounting Matrix for IMMPA (106 CFA Francs. 1 Euro= 655.957 CFA Francs) - Folio 5/6 Capital Accounts of Economic Agents (Continued) Changes in Assets and Liabilities
EXPENSES
Urb
an S
kille
d H
ouse
hold
s
Cap
italis
tic H
ouse
hold
s
Non
Fin
anci
al
Com
pani
es
Com
mer
cial
Ban
ks
Cen
tral B
ank
Cen
tral G
over
nmen
t
Res
t Of t
he W
orld
Fidu
ciar
y C
urre
ncie
s
Dep
osits
Spec
ial D
epos
its to
C
entra
l Ban
k
Ban
k R
eser
ves
Cap
ital S
hare
s
Cre
dits
Bill
s iss
ued
by
Gov
ernm
ent
Adv
ance
s of C
entra
l B
ank
to th
e Tr
easu
ry
Stat
e C
onso
lidat
ed
Cre
dits
of C
entra
l Ban
k
Ref
inan
cing
Exte
rnal
Eng
agem
ents
Exte
rnal
Fin
anci
al
Res
ourc
es
RESSOURCES No. 41 42 43 44 45 46 47 48 49 50 51 52 53 54 55 56 57 58 59
Summ
ation
Unskilled Rural Labor 1 676 226Unskilled Urban Labor 2 687 196Skilled Labor 3 430 125
Production factors
Capital 4 2 625 251Rural Non Traders Households 5 803 254Rural Traders Households 6 72 083Urban Unskilled Informal Households 7 1 615 904Urban Unskilled Formal Households 8 447 306Urban Skilled Households 9 481 711Capitalistic Households 10 452 991Non Financial Companies 11 672 482Commercial Banks 12 80 884Central Bank 13 17 227Central Government 14 836 907C
urre
nt A
ccou
nts o
f Eco
nom
ic
Age
nts
Rest Of the World 15 993 631Non Traded Rural Production 16 941 449Traded Rural Production 17 386 853Urban Informal Production 18 2 527 447Urban Corporate Production 19 3 121 770Pr
oduc
tion
Sect
ors
Public Sector Production 20 543 424Non Traded Rural Production 21 938 833Traded Rural Production 22 190 876Urban Informal Production 23 2 544 460Urban Corporate Production 24 2 487 478
Loc
al P
rodu
cts
for
Dom
estic
M
arke
t
Public Sector Production 25 543 424Non Traded Rural Production 26 22 235Traded Rural Production 27 1 564
Impo
rts
Urban Corporate Production 28 815 392
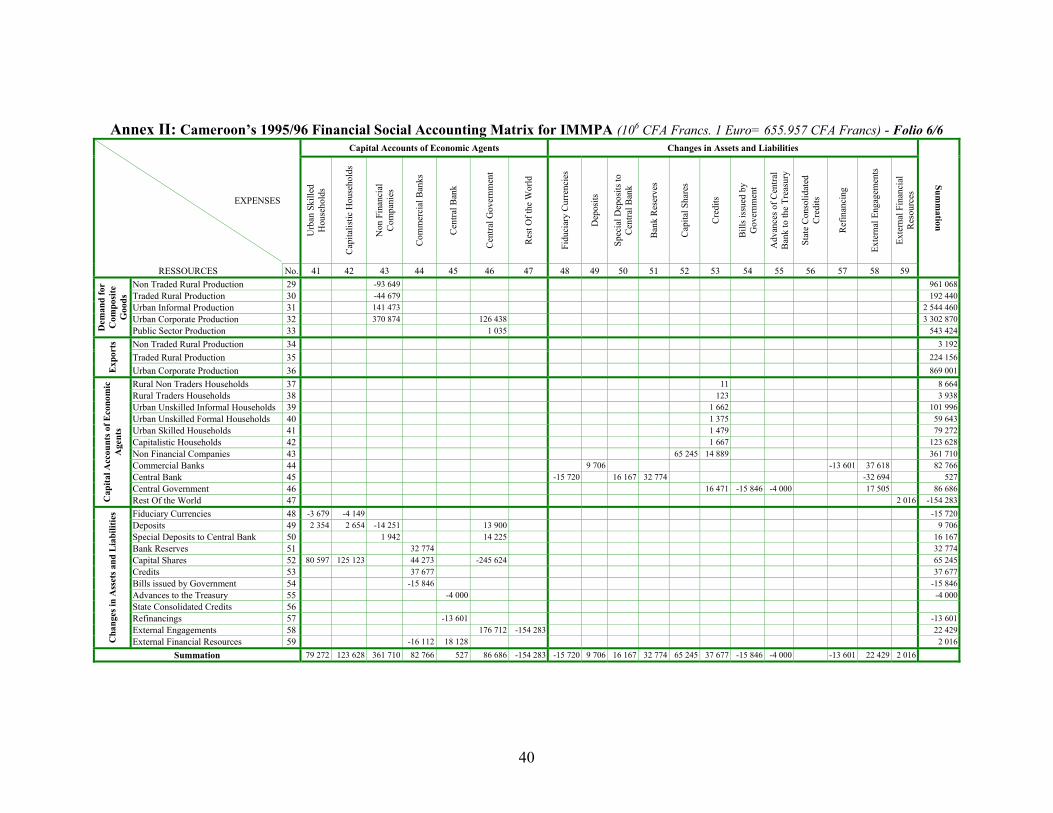
40
Annex II: Cameroon’s 1995/96 Financial Social Accounting Matrix for IMMPA (106 CFA Francs. 1 Euro= 655.957 CFA Francs) - Folio 6/6 Capital Accounts of Economic Agents Changes in Assets and Liabilities
EXPENSES
Urb
an S
kille
d H
ouse
hold
s
Cap
italis
tic H
ouse
hold
s
Non
Fin
anci
al
Com
pani
es
Com
mer
cial
Ban
ks
Cen
tral B
ank
Cen
tral G
over
nmen
t
Res
t Of t
he W
orld
Fidu
ciar
y C
urre
ncie
s
Dep
osits
Spec
ial D
epos
its to
C
entra
l Ban
k
Ban
k R
eser
ves
Cap
ital S
hare
s
Cre
dits
Bill
s iss
ued
by
Gov
ernm
ent
Adv
ance
s of C
entra
l B
ank
to th
e Tr
easu
ry
Stat
e C
onso
lidat
ed
Cre
dits
Ref
inan
cing
Exte
rnal
Eng
agem
ents
Exte
rnal
Fin
anci
al
Res
ourc
es
RESSOURCES No. 41 42 43 44 45 46 47 48 49 50 51 52 53 54 55 56 57 58 59
Summ
ation
Non Traded Rural Production 29 -93 649 961 068Traded Rural Production 30 -44 679 192 440Urban Informal Production 31 141 473 2 544 460Urban Corporate Production 32 370 874 126 438 3 302 870
Dem
and
for
Com
posi
te
Goo
ds
Public Sector Production 33 1 035 543 424Non Traded Rural Production 34 3 192Traded Rural Production 35 224 156
Exp
orts
Urban Corporate Production 36 869 001Rural Non Traders Households 37 11 8 664Rural Traders Households 38 123 3 938Urban Unskilled Informal Households 39 1 662 101 996Urban Unskilled Formal Households 40 1 375 59 643Urban Skilled Households 41 1 479 79 272Capitalistic Households 42 1 667 123 628Non Financial Companies 43 65 245 14 889 361 710Commercial Banks 44 9 706 -13 601 37 618 82 766Central Bank 45 -15 720 16 167 32 774 -32 694 527Central Government 46 16 471 -15 846 -4 000 17 505 86 686
Cap
ital A
ccou
nts o
f Eco
nom
ic
Age
nts
Rest Of the World 47 2 016 -154 283Fiduciary Currencies 48 -3 679 -4 149 -15 720Deposits 49 2 354 2 654 -14 251 13 900 9 706Special Deposits to Central Bank 50 1 942 14 225 16 167Bank Reserves 51 32 774 32 774Capital Shares 52 80 597 125 123 44 273 -245 624 65 245Credits 53 37 677 37 677Bills issued by Government 54 -15 846 -15 846Advances to the Treasury 55 -4 000 -4 000State Consolidated Credits 56 Refinancings 57 -13 601 -13 601External Engagements 58 176 712 -154 283 22 429
Cha
nges
in A
sset
s and
Lia
bilit
ies
External Financial Resources 59 -16 112 18 128 2 016Summation 79 272 123 628 361 710 82 766 527 86 686 -154 283 -15 720 9 706 16 167 32 774 65 245 37 677 -15 846 -4 000 -13 601 22 429 2 016
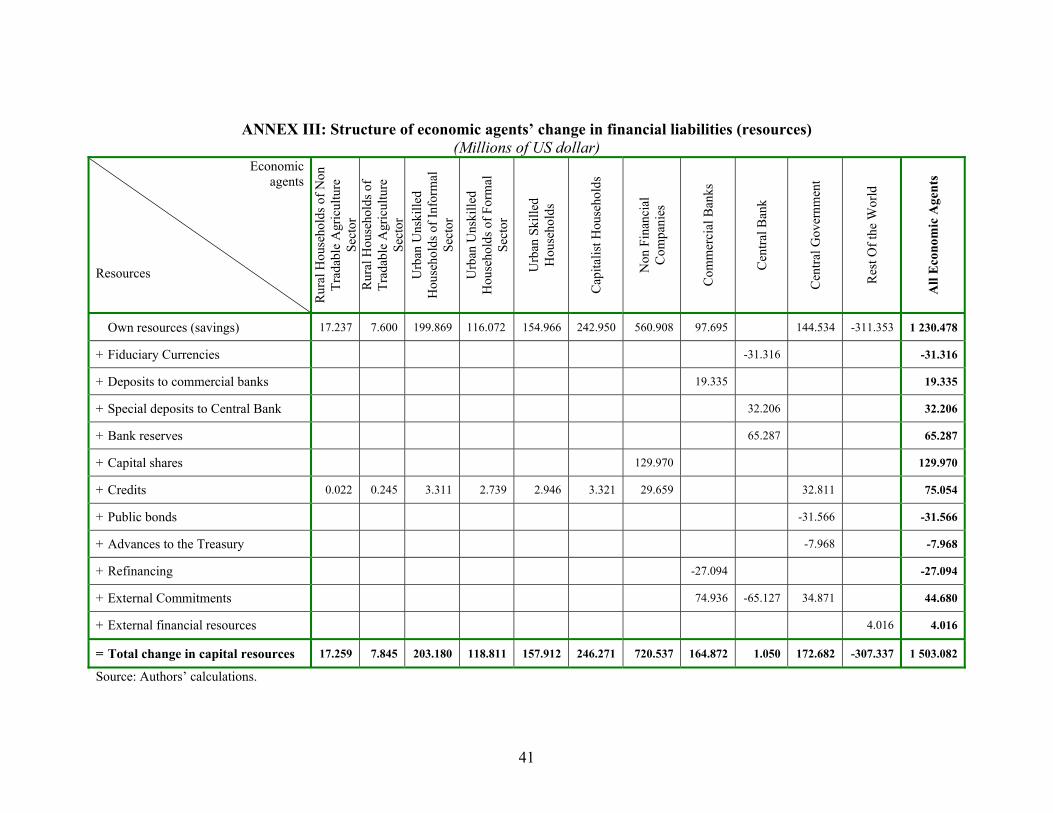
41
ANNEX III: Structure of economic agents’ change in financial liabilities (resources) (Millions of US dollar)
Economic agents
Resources
Rur
al H
ouse
hold
s of N
on
Trad
able
Agr
icul
ture
Se
ctor
R
ural
Hou
seho
lds o
f Tr
adab
le A
gric
ultu
re
Sect
o r
Urb
an U
nski
lled
Hou
seho
lds o
f Inf
orm
al
Sect
or
Urb
an U
nski
lled
Hou
seho
lds o
f For
mal
Se
ctor
Urb
an S
kille
d H
ouse
hold
s
Cap
italis
t Hou
seho
lds
Non
Fin
anci
al
Com
pani
es
Com
mer
cial
Ban
ks
Cen
tral B
ank
Cen
tral G
over
nmen
t
Res
t Of t
he W
orld
All
Eco
nom
ic A
gent
s
Own resources (savings) 17.237 7.600 199.869 116.072 154.966 242.950 560.908 97.695 144.534 -311.353 1 230.478
+ Fiduciary Currencies -31.316 -31.316
+ Deposits to commercial banks 19.335 19.335
+ Special deposits to Central Bank 32.206 32.206
+ Bank reserves 65.287 65.287
+ Capital shares 129.970 129.970
+ Credits 0.022 0.245 3.311 2.739 2.946 3.321 29.659 32.811 75.054
+ Public bonds -31.566 -31.566
+ Advances to the Treasury -7.968 -7.968
+ Refinancing -27.094 -27.094
+ External Commitments 74.936 -65.127 34.871 44.680
+ External financial resources 4.016 4.016
= Total change in capital resources 17.259 7.845 203.180 118.811 157.912 246.271 720.537 164.872 1.050 172.682 -307.337 1 503.082
Source: Authors’ calculations.
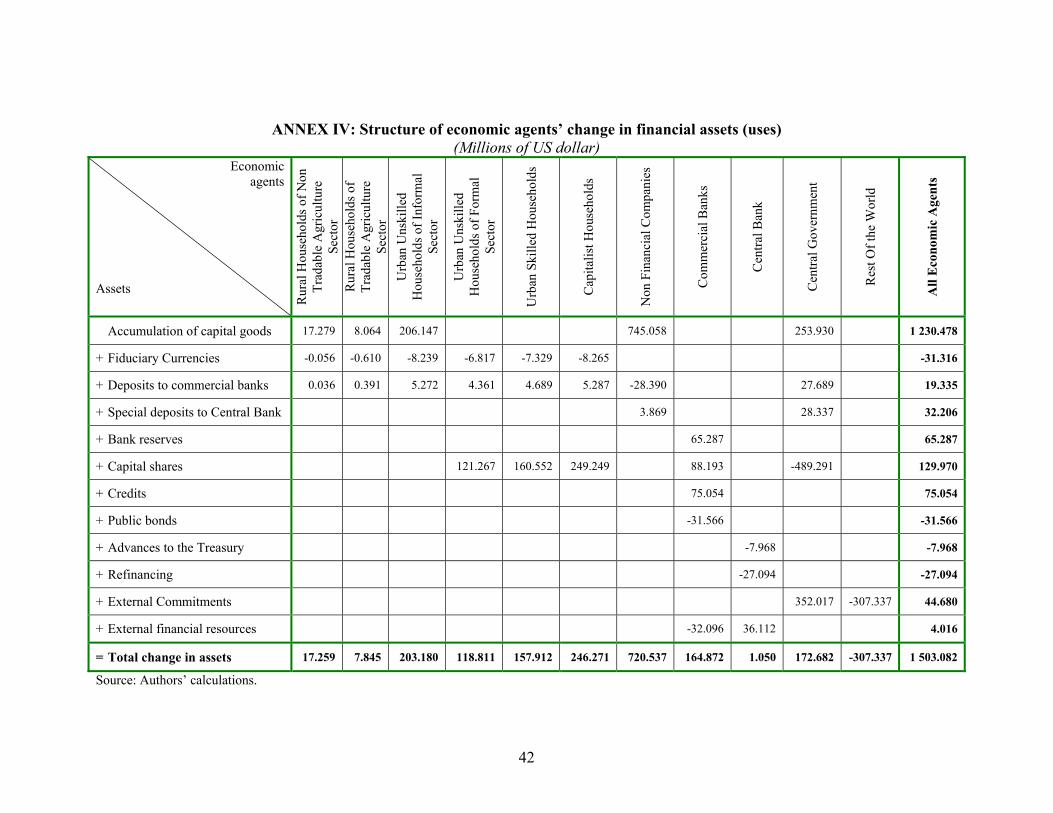
42
ANNEX IV: Structure of economic agents’ change in financial assets (uses) (Millions of US dollar)
Economic agents
Assets
Rur
al H
ouse
hold
s of N
on
Trad
able
Agr
icul
ture
Se
ctor
R
ural
Hou
seho
lds o
f Tr
adab
le A
gric
ultu
re
Sect
o r
Urb
an U
nski
lled
Hou
seho
lds o
f Inf
orm
al
Sect
or
Urb
an U
nski
lled
Hou
seho
lds o
f For
mal
Se
ctor
Urb
an S
kille
d H
ouse
hold
s
Cap
italis
t Hou
seho
lds
Non
Fin
anci
al C
ompa
nies
Com
mer
cial
Ban
ks
Cen
tral B
ank
Cen
tral G
over
nmen
t
Res
t Of t
he W
orld
All
Eco
nom
ic A
gent
s
Accumulation of capital goods 17.279 8.064 206.147 745.058 253.930 1 230.478
+ Fiduciary Currencies -0.056 -0.610 -8.239 -6.817 -7.329 -8.265 -31.316
+ Deposits to commercial banks 0.036 0.391 5.272 4.361 4.689 5.287 -28.390 27.689 19.335
+ Special deposits to Central Bank 3.869 28.337 32.206
+ Bank reserves 65.287 65.287
+ Capital shares 121.267 160.552 249.249 88.193 -489.291 129.970
+ Credits 75.054 75.054
+ Public bonds -31.566 -31.566
+ Advances to the Treasury -7.968 -7.968
+ Refinancing -27.094 -27.094
+ External Commitments 352.017 -307.337 44.680
+ External financial resources -32.096 36.112 4.016
= Total change in assets 17.259 7.845 203.180 118.811 157.912 246.271 720.537 164.872 1.050 172.682 -307.337 1 503.082
Source: Authors’ calculations.
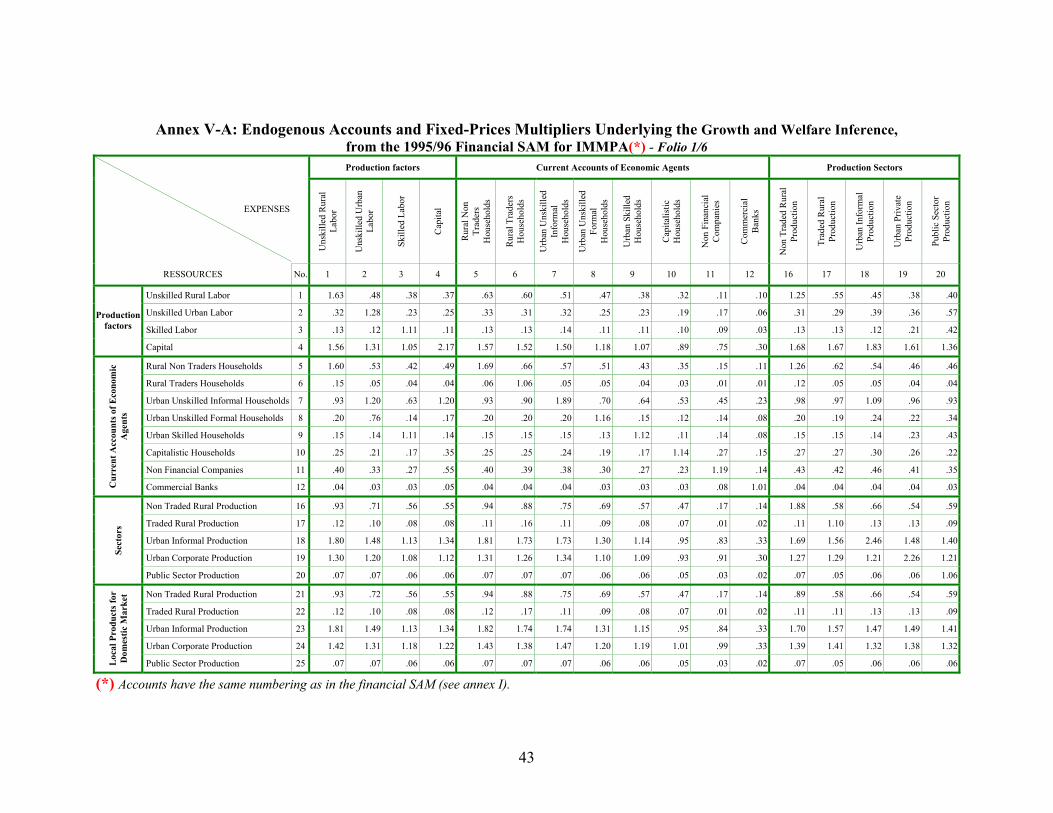
43
Annex V-A: Endogenous Accounts and Fixed-Prices Multipliers Underlying the Growth and Welfare Inference, from the 1995/96 Financial SAM for IMMPA(*) - Folio 1/6 Production factors Current Accounts of Economic Agents Production Sectors
EXPENSES
Uns
kille
d R
ural
La
bor
Uns
kille
d U
rban
La
bor
Skill
ed L
abor
Cap
ital
Rur
al N
on
Trad
ers
Hou
seho
lds
Rur
al T
rade
rs
Hou
seho
lds
Urb
an U
nski
lled
Info
rmal
H
ouse
hold
s
Urb
an U
nski
lled
Form
al
Hou
seho
lds
Urb
an S
kille
d H
ouse
hold
s
Cap
italis
tic
Hou
seho
lds
Non
Fin
anci
al
Com
pani
es
Com
mer
cial
B
anks
Non
Tra
ded
Rur
al
Prod
uctio
n
Trad
ed R
ural
Pr
oduc
tion
Urb
an In
form
al
Prod
uctio
n
Urb
an P
rivat
e Pr
oduc
tion
Publ
ic S
ecto
r Pr
oduc
tion
RESSOURCES No. 1 2 3 4 5 6 7 8 9 10 11 12 16 17 18 19 20
Unskilled Rural Labor 1 1.63 .48 .38 .37 .63 .60 .51 .47 .38 .32 .11 .10 1.25 .55 .45 .38 .40
Unskilled Urban Labor 2 .32 1.28 .23 .25 .33 .31 .32 .25 .23 .19 .17 .06 .31 .29 .39 .36 .57
Skilled Labor 3 .13 .12 1.11 .11 .13 .13 .14 .11 .11 .10 .09 .03 .13 .13 .12 .21 .42Production
factors
Capital 4 1.56 1.31 1.05 2.17 1.57 1.52 1.50 1.18 1.07 .89 .75 .30 1.68 1.67 1.83 1.61 1.36
Rural Non Traders Households 5 1.60 .53 .42 .49 1.69 .66 .57 .51 .43 .35 .15 .11 1.26 .62 .54 .46 .46
Rural Traders Households 6 .15 .05 .04 .04 .06 1.06 .05 .05 .04 .03 .01 .01 .12 .05 .05 .04 .04
Urban Unskilled Informal Households 7 .93 1.20 .63 1.20 .93 .90 1.89 .70 .64 .53 .45 .23 .98 .97 1.09 .96 .93
Urban Unskilled Formal Households 8 .20 .76 .14 .17 .20 .20 .20 1.16 .15 .12 .14 .08 .20 .19 .24 .22 .34
Urban Skilled Households 9 .15 .14 1.11 .14 .15 .15 .15 .13 1.12 .11 .14 .08 .15 .15 .14 .23 .43
Capitalistic Households 10 .25 .21 .17 .35 .25 .25 .24 .19 .17 1.14 .27 .15 .27 .27 .30 .26 .22
Non Financial Companies 11 .40 .33 .27 .55 .40 .39 .38 .30 .27 .23 1.19 .14 .43 .42 .46 .41 .35
Cur
rent
Acc
ount
s of E
cono
mic
A
gent
s
Commercial Banks 12 .04 .03 .03 .05 .04 .04 .04 .03 .03 .03 .08 1.01 .04 .04 .04 .04 .03
Non Traded Rural Production 16 .93 .71 .56 .55 .94 .88 .75 .69 .57 .47 .17 .14 1.88 .58 .66 .54 .59
Traded Rural Production 17 .12 .10 .08 .08 .11 .16 .11 .09 .08 .07 .01 .02 .11 1.10 .13 .13 .09
Urban Informal Production 18 1.80 1.48 1.13 1.34 1.81 1.73 1.73 1.30 1.14 .95 .83 .33 1.69 1.56 2.46 1.48 1.40
Urban Corporate Production 19 1.30 1.20 1.08 1.12 1.31 1.26 1.34 1.10 1.09 .93 .91 .30 1.27 1.29 1.21 2.26 1.21Sect
ors
Public Sector Production 20 .07 .07 .06 .06 .07 .07 .07 .06 .06 .05 .03 .02 .07 .05 .06 .06 1.06
Non Traded Rural Production 21 .93 .72 .56 .55 .94 .88 .75 .69 .57 .47 .17 .14 .89 .58 .66 .54 .59
Traded Rural Production 22 .12 .10 .08 .08 .12 .17 .11 .09 .08 .07 .01 .02 .11 .11 .13 .13 .09
Urban Informal Production 23 1.81 1.49 1.13 1.34 1.82 1.74 1.74 1.31 1.15 .95 .84 .33 1.70 1.57 1.47 1.49 1.41
Urban Corporate Production 24 1.42 1.31 1.18 1.22 1.43 1.38 1.47 1.20 1.19 1.01 .99 .33 1.39 1.41 1.32 1.38 1.32
Loc
al P
rodu
cts f
or
Dom
estic
Mar
ket
Public Sector Production 25 .07 .07 .06 .06 .07 .07 .07 .06 .06 .05 .03 .02 .07 .05 .06 .06 .06
(*) Accounts have the same numbering as in the financial SAM (see annex I).
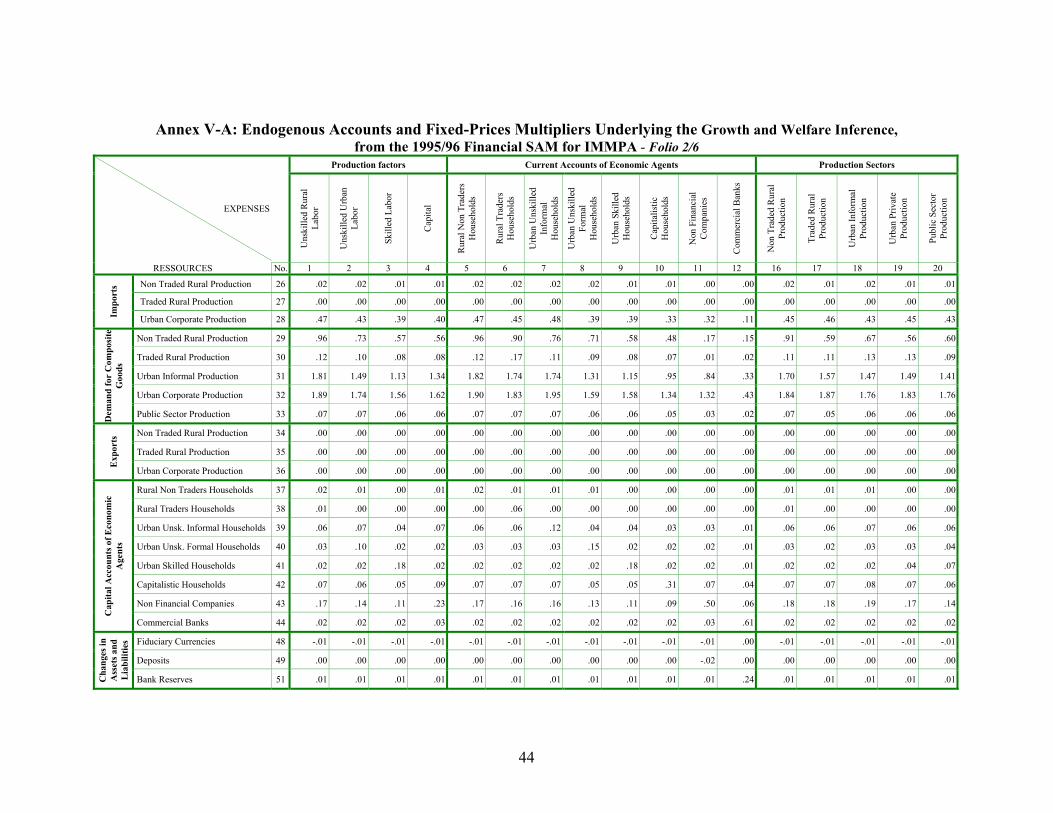
44
Annex V-A: Endogenous Accounts and Fixed-Prices Multipliers Underlying the Growth and Welfare Inference, from the 1995/96 Financial SAM for IMMPA - Folio 2/6
Production factors Current Accounts of Economic Agents Production Sectors
EXPENSES
Uns
kille
d R
ural
La
bor
Uns
kille
d U
rban
La
bor
Skill
ed L
abor
Cap
ital
Rur
al N
on T
rade
rs
Hou
seho
lds
Rur
al T
rade
rs
Hou
seho
lds
Urb
an U
nski
lled
Info
rmal
H
ouse
hold
s
Urb
an U
nski
lled
Form
al
Hou
seho
lds
Urb
an S
kille
d H
ouse
hold
s
Cap
italis
tic
Hou
seho
lds
Non
Fin
anci
al
Com
pani
es
Com
mer
cial
Ban
ks
Non
Tra
ded
Rur
al
Prod
uctio
n
Trad
ed R
ural
Pr
oduc
tion
Urb
an In
form
al
Prod
uctio
n
Urb
an P
rivat
e Pr
oduc
tion
Publ
ic S
ecto
r Pr
oduc
tion
RESSOURCES No. 1 2 3 4 5 6 7 8 9 10 11 12 16 17 18 19 20
Non Traded Rural Production 26 .02 .02 .01 .01 .02 .02 .02 .02 .01 .01 .00 .00 .02 .01 .02 .01 .01
Traded Rural Production 27 .00 .00 .00 .00 .00 .00 .00 .00 .00 .00 .00 .00 .00 .00 .00 .00 .00
Impo
rts
Urban Corporate Production 28 .47 .43 .39 .40 .47 .45 .48 .39 .39 .33 .32 .11 .45 .46 .43 .45 .43
Non Traded Rural Production 29 .96 .73 .57 .56 .96 .90 .76 .71 .58 .48 .17 .15 .91 .59 .67 .56 .60
Traded Rural Production 30 .12 .10 .08 .08 .12 .17 .11 .09 .08 .07 .01 .02 .11 .11 .13 .13 .09
Urban Informal Production 31 1.81 1.49 1.13 1.34 1.82 1.74 1.74 1.31 1.15 .95 .84 .33 1.70 1.57 1.47 1.49 1.41
Urban Corporate Production 32 1.89 1.74 1.56 1.62 1.90 1.83 1.95 1.59 1.58 1.34 1.32 .43 1.84 1.87 1.76 1.83 1.76
Dem
and
for
Com
posi
te
Goo
ds
Public Sector Production 33 .07 .07 .06 .06 .07 .07 .07 .06 .06 .05 .03 .02 .07 .05 .06 .06 .06
Non Traded Rural Production 34 .00 .00 .00 .00 .00 .00 .00 .00 .00 .00 .00 .00 .00 .00 .00 .00 .00
Traded Rural Production 35 .00 .00 .00 .00 .00 .00 .00 .00 .00 .00 .00 .00 .00 .00 .00 .00 .00
Exp
orts
Urban Corporate Production 36 .00 .00 .00 .00 .00 .00 .00 .00 .00 .00 .00 .00 .00 .00 .00 .00 .00
Rural Non Traders Households 37 .02 .01 .00 .01 .02 .01 .01 .01 .00 .00 .00 .00 .01 .01 .01 .00 .00
Rural Traders Households 38 .01 .00 .00 .00 .00 .06 .00 .00 .00 .00 .00 .00 .01 .00 .00 .00 .00
Urban Unsk. Informal Households 39 .06 .07 .04 .07 .06 .06 .12 .04 .04 .03 .03 .01 .06 .06 .07 .06 .06
Urban Unsk. Formal Households 40 .03 .10 .02 .02 .03 .03 .03 .15 .02 .02 .02 .01 .03 .02 .03 .03 .04
Urban Skilled Households 41 .02 .02 .18 .02 .02 .02 .02 .02 .18 .02 .02 .01 .02 .02 .02 .04 .07
Capitalistic Households 42 .07 .06 .05 .09 .07 .07 .07 .05 .05 .31 .07 .04 .07 .07 .08 .07 .06
Non Financial Companies 43 .17 .14 .11 .23 .17 .16 .16 .13 .11 .09 .50 .06 .18 .18 .19 .17 .14
Cap
ital A
ccou
nts o
f Eco
nom
ic
Age
nts
Commercial Banks 44 .02 .02 .02 .03 .02 .02 .02 .02 .02 .02 .03 .61 .02 .02 .02 .02 .02
Fiduciary Currencies 48 -.01 -.01 -.01 -.01 -.01 -.01 -.01 -.01 -.01 -.01 -.01 .00 -.01 -.01 -.01 -.01 -.01
Deposits 49 .00 .00 .00 .00 .00 .00 .00 .00 .00 .00 -.02 .00 .00 .00 .00 .00 .00
Cha
nges
in
Ass
ets a
nd
Lia
bilit
ies
Bank Reserves 51 .01 .01 .01 .01 .01 .01 .01 .01 .01 .01 .01 .24 .01 .01 .01 .01 .01
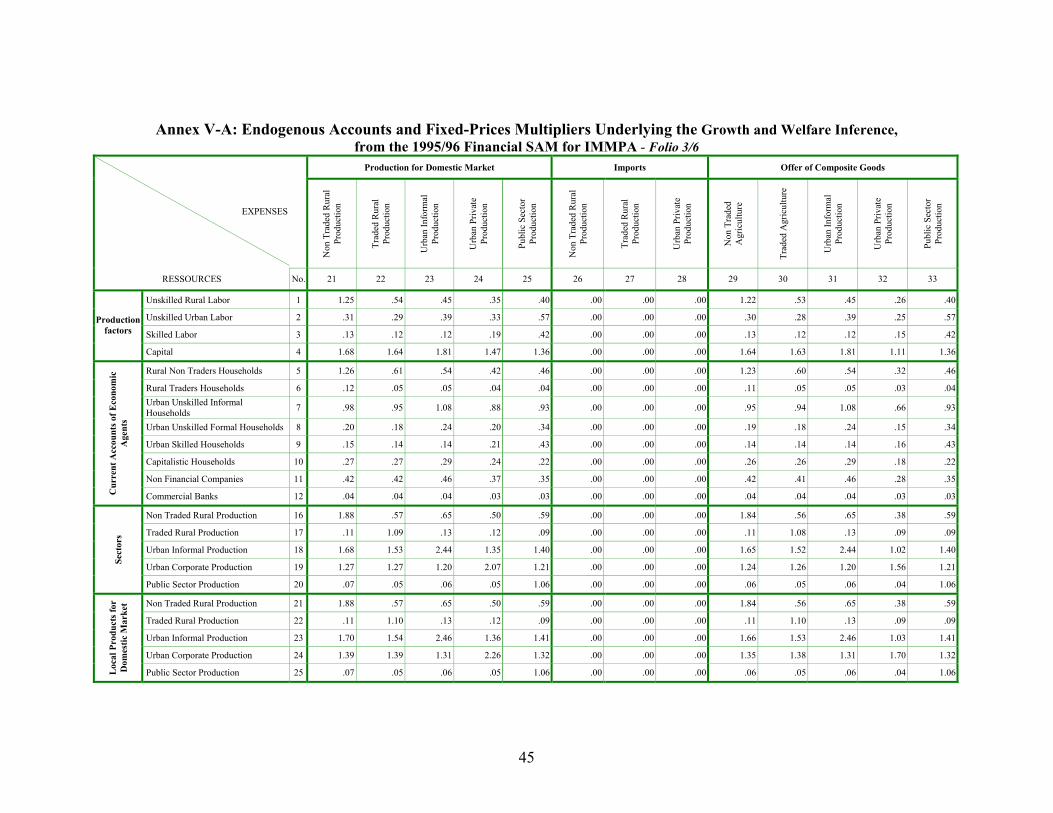
45
Annex V-A: Endogenous Accounts and Fixed-Prices Multipliers Underlying the Growth and Welfare Inference, from the 1995/96 Financial SAM for IMMPA - Folio 3/6
Production for Domestic Market Imports Offer of Composite Goods
EXPENSES
Non
Tra
ded
Rur
al
Prod
uctio
n
Trad
ed R
ural
Pr
oduc
tion
Urb
an In
form
al
Prod
uctio
n
Urb
an P
rivat
e Pr
oduc
tion
Publ
ic S
ecto
r Pr
oduc
tion
Non
Tra
ded
Rur
al
Prod
uctio
n
Trad
ed R
ural
Pr
oduc
tion
Urb
an P
rivat
e Pr
oduc
tion
Non
Tra
ded
Agr
icul
ture
Trad
ed A
gric
ultu
re
Urb
an In
form
al
Prod
uctio
n
Urb
an P
rivat
e Pr
oduc
tion
Publ
ic S
ecto
r Pr
oduc
tion
RESSOURCES No. 21 22 23 24 25 26 27 28 29 30 31 32 33
Unskilled Rural Labor 1 1.25 .54 .45 .35 .40 .00 .00 .00 1.22 .53 .45 .26 .40
Unskilled Urban Labor 2 .31 .29 .39 .33 .57 .00 .00 .00 .30 .28 .39 .25 .57
Skilled Labor 3 .13 .12 .12 .19 .42 .00 .00 .00 .13 .12 .12 .15 .42Production
factors
Capital 4 1.68 1.64 1.81 1.47 1.36 .00 .00 .00 1.64 1.63 1.81 1.11 1.36
Rural Non Traders Households 5 1.26 .61 .54 .42 .46 .00 .00 .00 1.23 .60 .54 .32 .46
Rural Traders Households 6 .12 .05 .05 .04 .04 .00 .00 .00 .11 .05 .05 .03 .04Urban Unskilled Informal Households 7 .98 .95 1.08 .88 .93 .00 .00 .00 .95 .94 1.08 .66 .93
Urban Unskilled Formal Households 8 .20 .18 .24 .20 .34 .00 .00 .00 .19 .18 .24 .15 .34
Urban Skilled Households 9 .15 .14 .14 .21 .43 .00 .00 .00 .14 .14 .14 .16 .43
Capitalistic Households 10 .27 .27 .29 .24 .22 .00 .00 .00 .26 .26 .29 .18 .22
Non Financial Companies 11 .42 .42 .46 .37 .35 .00 .00 .00 .42 .41 .46 .28 .35
Cur
rent
Acc
ount
s of E
cono
mic
A
gent
s
Commercial Banks 12 .04 .04 .04 .03 .03 .00 .00 .00 .04 .04 .04 .03 .03
Non Traded Rural Production 16 1.88 .57 .65 .50 .59 .00 .00 .00 1.84 .56 .65 .38 .59
Traded Rural Production 17 .11 1.09 .13 .12 .09 .00 .00 .00 .11 1.08 .13 .09 .09
Urban Informal Production 18 1.68 1.53 2.44 1.35 1.40 .00 .00 .00 1.65 1.52 2.44 1.02 1.40
Urban Corporate Production 19 1.27 1.27 1.20 2.07 1.21 .00 .00 .00 1.24 1.26 1.20 1.56 1.21Sect
ors
Public Sector Production 20 .07 .05 .06 .05 1.06 .00 .00 .00 .06 .05 .06 .04 1.06
Non Traded Rural Production 21 1.88 .57 .65 .50 .59 .00 .00 .00 1.84 .56 .65 .38 .59
Traded Rural Production 22 .11 1.10 .13 .12 .09 .00 .00 .00 .11 1.10 .13 .09 .09
Urban Informal Production 23 1.70 1.54 2.46 1.36 1.41 .00 .00 .00 1.66 1.53 2.46 1.03 1.41
Urban Corporate Production 24 1.39 1.39 1.31 2.26 1.32 .00 .00 .00 1.35 1.38 1.31 1.70 1.32
Loc
al P
rodu
cts f
or
Dom
estic
Mar
ket
Public Sector Production 25 .07 .05 .06 .05 1.06 .00 .00 .00 .06 .05 .06 .04 1.06
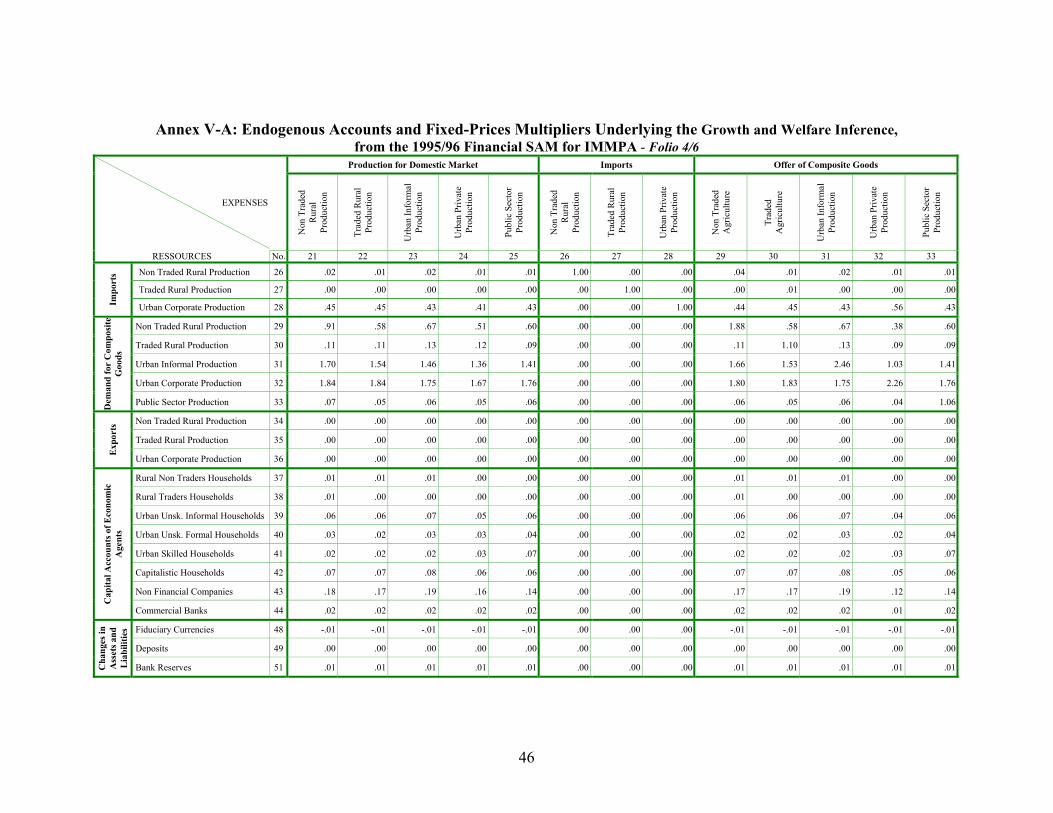
46
Annex V-A: Endogenous Accounts and Fixed-Prices Multipliers Underlying the Growth and Welfare Inference, from the 1995/96 Financial SAM for IMMPA - Folio 4/6
Production for Domestic Market Imports Offer of Composite Goods
EXPENSES
Non
Tra
ded
Rur
al
Prod
uctio
n
Trad
ed R
ural
Pr
oduc
tion
Urb
an In
form
al
Prod
uctio
n
Urb
an P
rivat
e Pr
oduc
tion
Publ
ic S
ecto
r Pr
oduc
tion
Non
Tra
ded
Rur
al
Prod
uctio
n
Trad
ed R
ural
Pr
oduc
tion
Urb
an P
rivat
e Pr
oduc
tion
Non
Tra
ded
Agr
icul
ture
Trad
ed
Agr
icul
ture
Urb
an In
form
al
Prod
uctio
n
Urb
an P
rivat
e Pr
oduc
tion
Publ
ic S
ecto
r Pr
oduc
tion
RESSOURCES No. 21 22 23 24 25 26 27 28 29 30 31 32 33
Non Traded Rural Production 26 .02 .01 .02 .01 .01 1.00 .00 .00 .04 .01 .02 .01 .01
Traded Rural Production 27 .00 .00 .00 .00 .00 .00 1.00 .00 .00 .01 .00 .00 .00
Impo
rts
Urban Corporate Production 28 .45 .45 .43 .41 .43 .00 .00 1.00 .44 .45 .43 .56 .43
Non Traded Rural Production 29 .91 .58 .67 .51 .60 .00 .00 .00 1.88 .58 .67 .38 .60
Traded Rural Production 30 .11 .11 .13 .12 .09 .00 .00 .00 .11 1.10 .13 .09 .09
Urban Informal Production 31 1.70 1.54 1.46 1.36 1.41 .00 .00 .00 1.66 1.53 2.46 1.03 1.41
Urban Corporate Production 32 1.84 1.84 1.75 1.67 1.76 .00 .00 .00 1.80 1.83 1.75 2.26 1.76
Dem
and
for
Com
posi
te
Goo
ds
Public Sector Production 33 .07 .05 .06 .05 .06 .00 .00 .00 .06 .05 .06 .04 1.06
Non Traded Rural Production 34 .00 .00 .00 .00 .00 .00 .00 .00 .00 .00 .00 .00 .00
Traded Rural Production 35 .00 .00 .00 .00 .00 .00 .00 .00 .00 .00 .00 .00 .00
Exp
orts
Urban Corporate Production 36 .00 .00 .00 .00 .00 .00 .00 .00 .00 .00 .00 .00 .00
Rural Non Traders Households 37 .01 .01 .01 .00 .00 .00 .00 .00 .01 .01 .01 .00 .00
Rural Traders Households 38 .01 .00 .00 .00 .00 .00 .00 .00 .01 .00 .00 .00 .00
Urban Unsk. Informal Households 39 .06 .06 .07 .05 .06 .00 .00 .00 .06 .06 .07 .04 .06
Urban Unsk. Formal Households 40 .03 .02 .03 .03 .04 .00 .00 .00 .02 .02 .03 .02 .04
Urban Skilled Households 41 .02 .02 .02 .03 .07 .00 .00 .00 .02 .02 .02 .03 .07
Capitalistic Households 42 .07 .07 .08 .06 .06 .00 .00 .00 .07 .07 .08 .05 .06
Non Financial Companies 43 .18 .17 .19 .16 .14 .00 .00 .00 .17 .17 .19 .12 .14
Cap
ital A
ccou
nts o
f Eco
nom
ic
Age
nts
Commercial Banks 44 .02 .02 .02 .02 .02 .00 .00 .00 .02 .02 .02 .01 .02
Fiduciary Currencies 48 -.01 -.01 -.01 -.01 -.01 .00 .00 .00 -.01 -.01 -.01 -.01 -.01
Deposits 49 .00 .00 .00 .00 .00 .00 .00 .00 .00 .00 .00 .00 .00
Cha
nges
in
Ass
ets a
nd
Lia
bilit
ies
Bank Reserves 51 .01 .01 .01 .01 .01 .00 .00 .00 .01 .01 .01 .01 .01
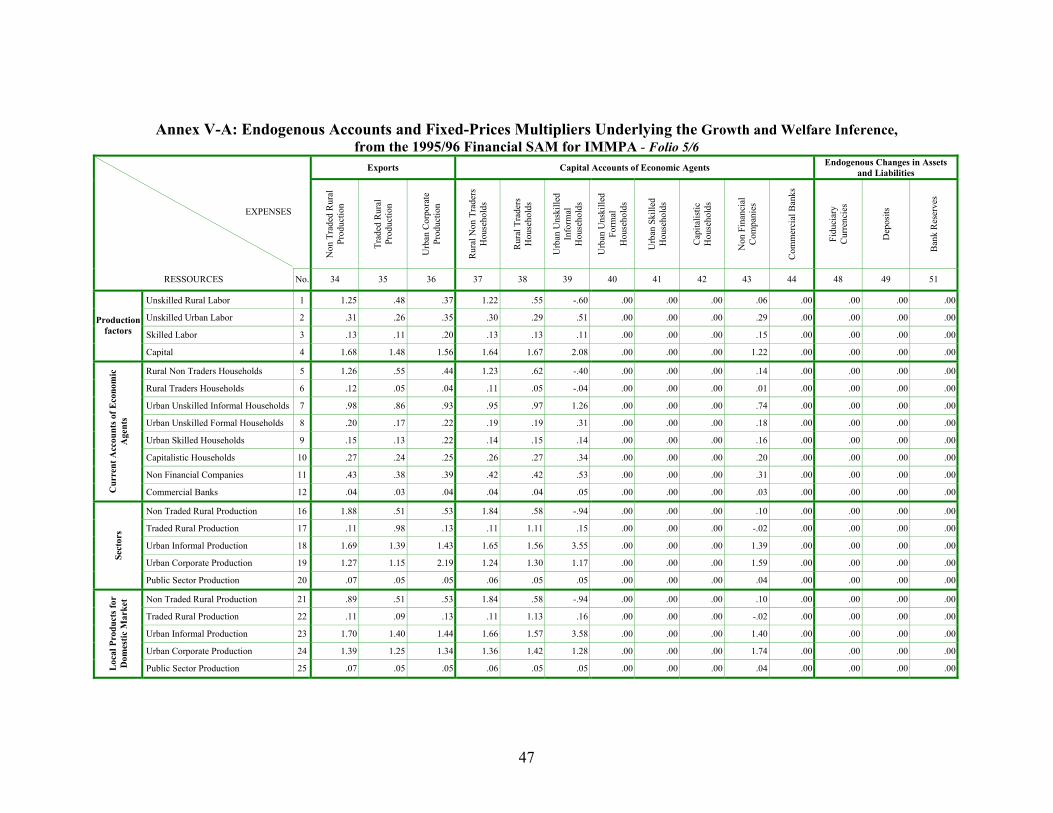
47
Annex V-A: Endogenous Accounts and Fixed-Prices Multipliers Underlying the Growth and Welfare Inference, from the 1995/96 Financial SAM for IMMPA - Folio 5/6
Exports Capital Accounts of Economic Agents Endogenous Changes in Assets and Liabilities
EXPENSES
Non
Tra
ded
Rur
al
Prod
uctio
n
Trad
ed R
ural
Pr
oduc
tion
Urb
an C
orpo
rate
Pr
oduc
tion
Rur
al N
on T
rade
rs
Hou
seho
lds
Rur
al T
rade
rs
Hou
seho
lds
Urb
an U
nski
lled
Info
rmal
H
ouse
hold
s
Urb
an U
nski
lled
Form
al
Hou
seho
lds
Urb
an S
kille
d H
ouse
hold
s
Cap
italis
tic
Hou
seho
lds
Non
Fin
anci
al
Com
pani
es
Com
mer
cial
Ban
ks
Fidu
ciar
y C
urre
ncie
s
Dep
osits
Ban
k R
eser
ves
RESSOURCES No. 34 35 36 37 38 39 40 41 42 43 44 48 49 51
Unskilled Rural Labor 1 1.25 .48 .37 1.22 .55 -.60 .00 .00 .00 .06 .00 .00 .00 .00
Unskilled Urban Labor 2 .31 .26 .35 .30 .29 .51 .00 .00 .00 .29 .00 .00 .00 .00
Skilled Labor 3 .13 .11 .20 .13 .13 .11 .00 .00 .00 .15 .00 .00 .00 .00Production
factors
Capital 4 1.68 1.48 1.56 1.64 1.67 2.08 .00 .00 .00 1.22 .00 .00 .00 .00
Rural Non Traders Households 5 1.26 .55 .44 1.23 .62 -.40 .00 .00 .00 .14 .00 .00 .00 .00
Rural Traders Households 6 .12 .05 .04 .11 .05 -.04 .00 .00 .00 .01 .00 .00 .00 .00
Urban Unskilled Informal Households 7 .98 .86 .93 .95 .97 1.26 .00 .00 .00 .74 .00 .00 .00 .00
Urban Unskilled Formal Households 8 .20 .17 .22 .19 .19 .31 .00 .00 .00 .18 .00 .00 .00 .00
Urban Skilled Households 9 .15 .13 .22 .14 .15 .14 .00 .00 .00 .16 .00 .00 .00 .00
Capitalistic Households 10 .27 .24 .25 .26 .27 .34 .00 .00 .00 .20 .00 .00 .00 .00
Non Financial Companies 11 .43 .38 .39 .42 .42 .53 .00 .00 .00 .31 .00 .00 .00 .00
Cur
rent
Acc
ount
s of E
cono
mic
A
gent
s
Commercial Banks 12 .04 .03 .04 .04 .04 .05 .00 .00 .00 .03 .00 .00 .00 .00
Non Traded Rural Production 16 1.88 .51 .53 1.84 .58 -.94 .00 .00 .00 .10 .00 .00 .00 .00
Traded Rural Production 17 .11 .98 .13 .11 1.11 .15 .00 .00 .00 -.02 .00 .00 .00 .00
Urban Informal Production 18 1.69 1.39 1.43 1.65 1.56 3.55 .00 .00 .00 1.39 .00 .00 .00 .00
Urban Corporate Production 19 1.27 1.15 2.19 1.24 1.30 1.17 .00 .00 .00 1.59 .00 .00 .00 .00Sect
ors
Public Sector Production 20 .07 .05 .05 .06 .05 .05 .00 .00 .00 .04 .00 .00 .00 .00
Non Traded Rural Production 21 .89 .51 .53 1.84 .58 -.94 .00 .00 .00 .10 .00 .00 .00 .00
Traded Rural Production 22 .11 .09 .13 .11 1.13 .16 .00 .00 .00 -.02 .00 .00 .00 .00
Urban Informal Production 23 1.70 1.40 1.44 1.66 1.57 3.58 .00 .00 .00 1.40 .00 .00 .00 .00
Urban Corporate Production 24 1.39 1.25 1.34 1.36 1.42 1.28 .00 .00 .00 1.74 .00 .00 .00 .00
Loc
al P
rodu
cts f
or
Dom
estic
Mar
ket
Public Sector Production 25 .07 .05 .05 .06 .05 .05 .00 .00 .00 .04 .00 .00 .00 .00
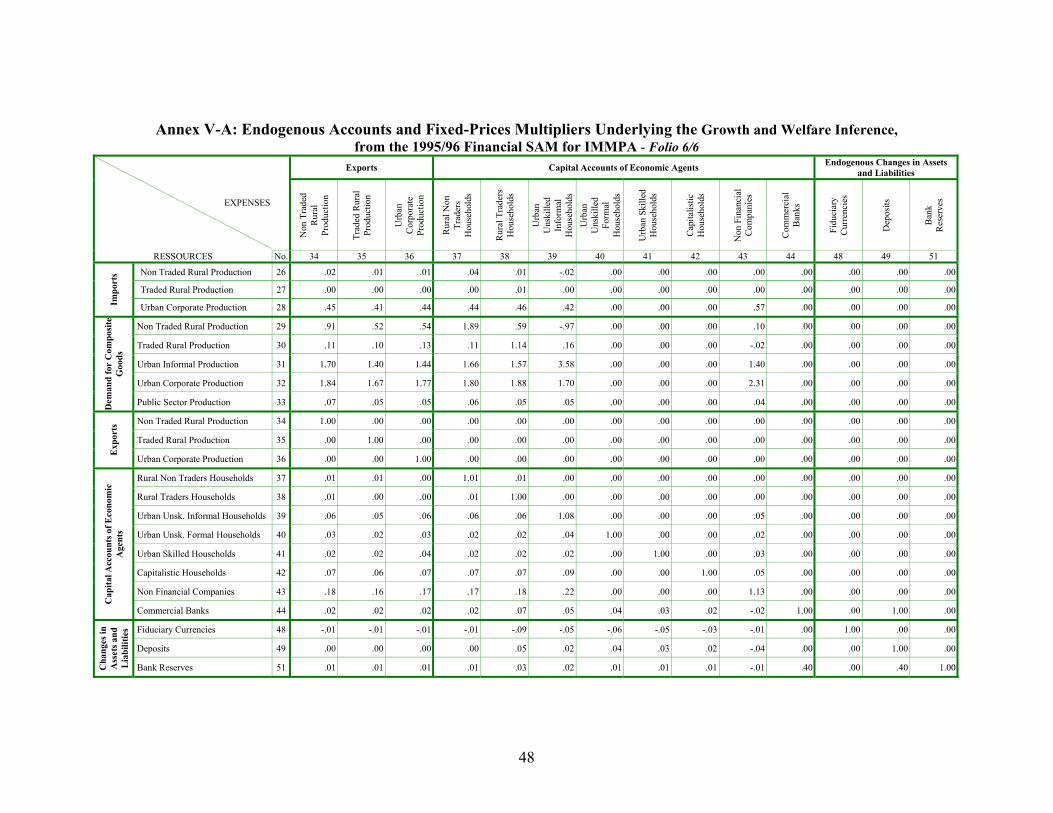
48
Annex V-A: Endogenous Accounts and Fixed-Prices Multipliers Underlying the Growth and Welfare Inference, from the 1995/96 Financial SAM for IMMPA - Folio 6/6
Exports Capital Accounts of Economic Agents Endogenous Changes in Assets and Liabilities
EXPENSES
Non
Tra
ded
Rur
al
Prod
uctio
n
Trad
ed R
ural
Pr
oduc
tion
Urb
an
Cor
pora
te
Prod
uctio
n
Rur
al N
on
Trad
ers
Hou
seho
lds
Rur
al T
rade
rs
Hou
seho
lds
Urb
an
Uns
kille
d In
form
al
Hou
seho
lds
Urb
an
Uns
kille
d Fo
rmal
H
ouse
hold
s
Urb
an S
kille
d H
ouse
hold
s
Cap
italis
tic
Hou
seho
lds
Non
Fin
anci
al
Com
pani
es
Com
mer
cial
B
anks
Fidu
ciar
y C
urre
ncie
s
Dep
osits
Ban
k R
eser
ves
RESSOURCES No. 34 35 36 37 38 39 40 41 42 43 44 48 49 51
Non Traded Rural Production 26 .02 .01 .01 .04 .01 -.02 .00 .00 .00 .00 .00 .00 .00 .00
Traded Rural Production 27 .00 .00 .00 .00 .01 .00 .00 .00 .00 .00 .00 .00 .00 .00
Impo
rts
Urban Corporate Production 28 .45 .41 .44 .44 .46 .42 .00 .00 .00 .57 .00 .00 .00 .00
Non Traded Rural Production 29 .91 .52 .54 1.89 .59 -.97 .00 .00 .00 .10 .00 .00 .00 .00
Traded Rural Production 30 .11 .10 .13 .11 1.14 .16 .00 .00 .00 -.02 .00 .00 .00 .00
Urban Informal Production 31 1.70 1.40 1.44 1.66 1.57 3.58 .00 .00 .00 1.40 .00 .00 .00 .00
Urban Corporate Production 32 1.84 1.67 1.77 1.80 1.88 1.70 .00 .00 .00 2.31 .00 .00 .00 .00
Dem
and
for
Com
posi
te
Goo
ds
Public Sector Production 33 .07 .05 .05 .06 .05 .05 .00 .00 .00 .04 .00 .00 .00 .00
Non Traded Rural Production 34 1.00 .00 .00 .00 .00 .00 .00 .00 .00 .00 .00 .00 .00 .00
Traded Rural Production 35 .00 1.00 .00 .00 .00 .00 .00 .00 .00 .00 .00 .00 .00 .00
Exp
orts
Urban Corporate Production 36 .00 .00 1.00 .00 .00 .00 .00 .00 .00 .00 .00 .00 .00 .00
Rural Non Traders Households 37 .01 .01 .00 1.01 .01 .00 .00 .00 .00 .00 .00 .00 .00 .00
Rural Traders Households 38 .01 .00 .00 .01 1.00 .00 .00 .00 .00 .00 .00 .00 .00 .00
Urban Unsk. Informal Households 39 .06 .05 .06 .06 .06 1.08 .00 .00 .00 .05 .00 .00 .00 .00
Urban Unsk. Formal Households 40 .03 .02 .03 .02 .02 .04 1.00 .00 .00 .02 .00 .00 .00 .00
Urban Skilled Households 41 .02 .02 .04 .02 .02 .02 .00 1.00 .00 .03 .00 .00 .00 .00
Capitalistic Households 42 .07 .06 .07 .07 .07 .09 .00 .00 1.00 .05 .00 .00 .00 .00
Non Financial Companies 43 .18 .16 .17 .17 .18 .22 .00 .00 .00 1.13 .00 .00 .00 .00
Cap
ital A
ccou
nts o
f Eco
nom
ic
Age
nts
Commercial Banks 44 .02 .02 .02 .02 .07 .05 .04 .03 .02 -.02 1.00 .00 1.00 .00
Fiduciary Currencies 48 -.01 -.01 -.01 -.01 -.09 -.05 -.06 -.05 -.03 -.01 .00 1.00 .00 .00
Deposits 49 .00 .00 .00 .00 .05 .02 .04 .03 .02 -.04 .00 .00 1.00 .00
Cha
nges
in
Ass
ets a
nd
Lia
bilit
ies
Bank Reserves 51 .01 .01 .01 .01 .03 .02 .01 .01 .01 -.01 .40 .00 .40 1.00
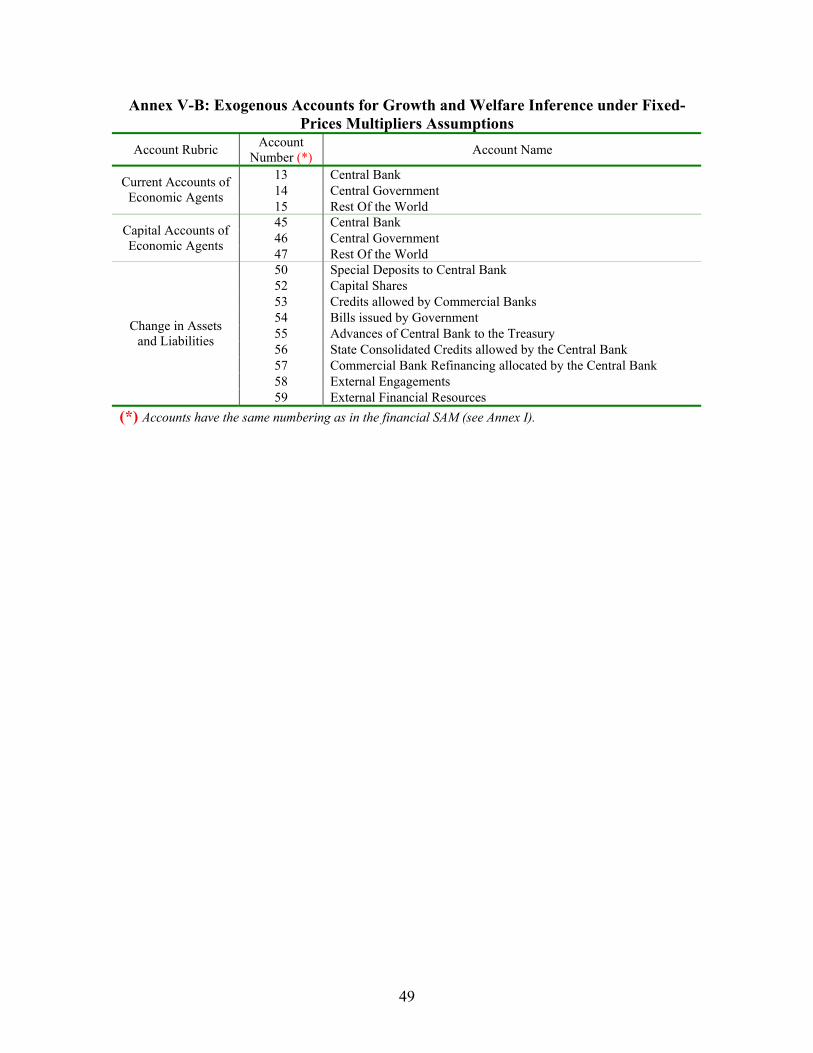
49
Annex V-B: Exogenous Accounts for Growth and Welfare Inference under Fixed-Prices Multipliers Assumptions
Account Rubric Account Number (*) Account Name
13 Central Bank 14 Central Government Current Accounts of
Economic Agents 15 Rest Of the World 45 Central Bank 46 Central Government Capital Accounts of
Economic Agents 47 Rest Of the World 50 Special Deposits to Central Bank 52 Capital Shares 53 Credits allowed by Commercial Banks 54 Bills issued by Government 55 Advances of Central Bank to the Treasury 56 State Consolidated Credits allowed by the Central Bank 57 Commercial Bank Refinancing allocated by the Central Bank 58 External Engagements
Change in Assets and Liabilities
59 External Financial Resources (*) Accounts have the same numbering as in the financial SAM (see Annex I).