Embed Size (px)
Citation preview
A N E W G L O B A L I N V E S T M E N T L A N D S C A P E ,
A N E W G E N E R AT I O N O F I N V E S T M E N T
P O L I C I E S
Presentation on UNCTAD's Investment Policy Framework for
Sustainable Development and the World Investment Report
2015: Reforming International Investment Governance
JAMES ZHAN Director
Investment and Enterprise Division
Team Leader, World Investment Report
New York, 12 November 2015
The new global investment landscape
Outline
Trends in investment flows: tectonic changes
Trends in investment policies
UNCTAD Investment Policy Framework for Sustainable Development
UNCTAD Roadmap for International Investment Governance Reform
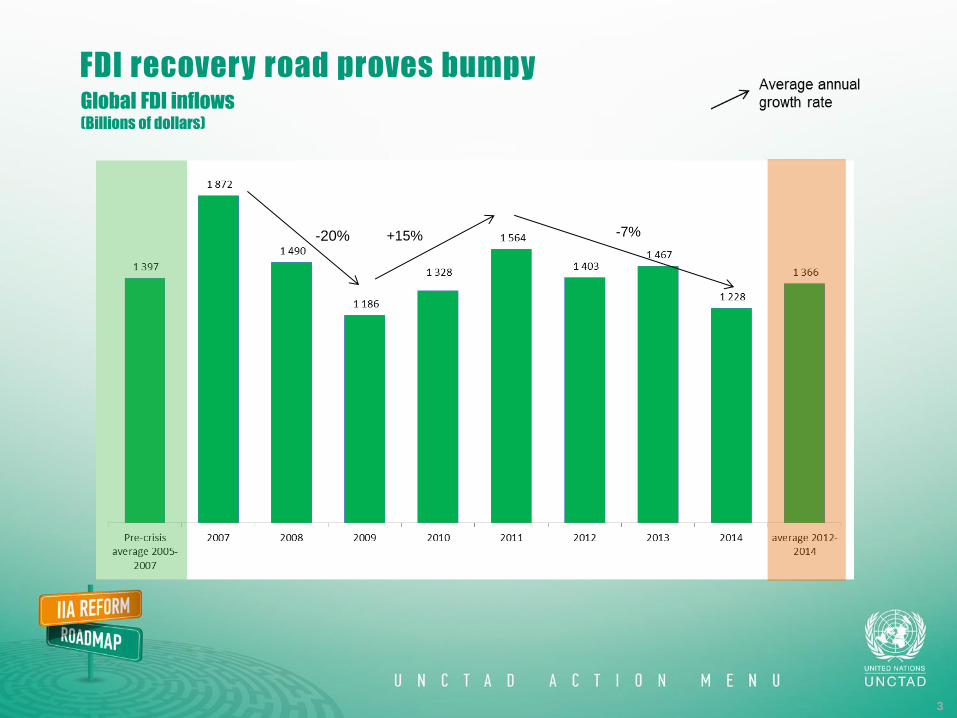
FDI recovery road proves bumpy Global FDI inflows (Billions of dollars)
3
-20%% +15%% -7%%
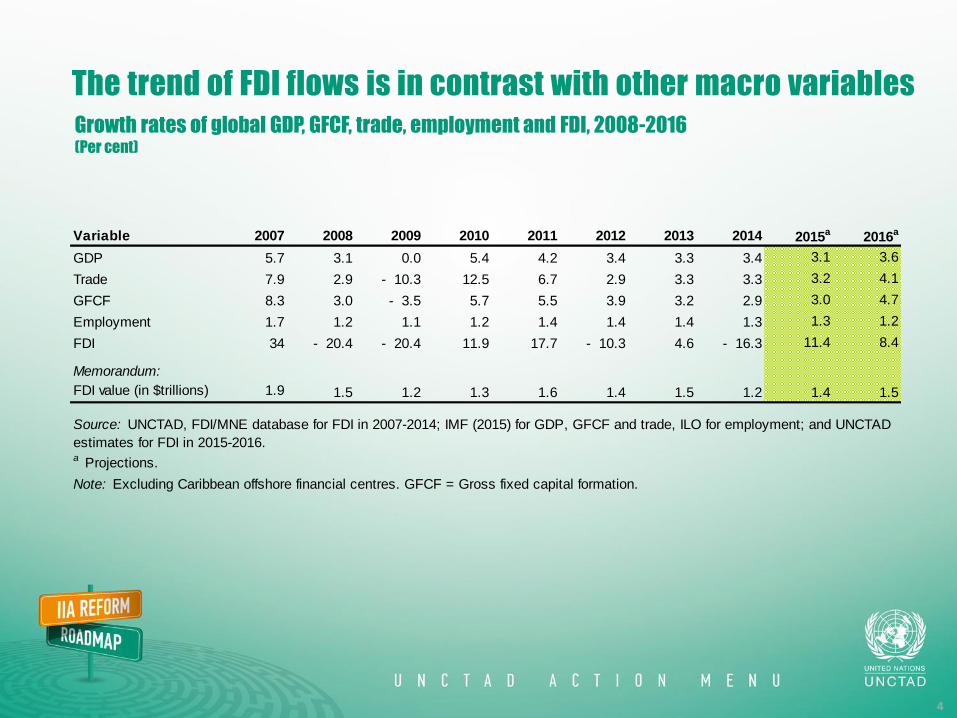
The trend of FDI flows is in contrast with other macro variables
Growth rates of global GDP, GFCF, trade, employment and FDI, 2008-2016 (Per cent)
4
Variable 2007 2008 2009 2010 2011 2012 2013 2014 2015a 2016a
GDP 5.7 3.1 0.0 5.4 4.2 3.4 3.3 3.4 3.1 3.6
Trade 7.9 2.9 - 10.3 12.5 6.7 2.9 3.3 3.3 3.2 4.1
GFCF 8.3 3.0 - 3.5 5.7 5.5 3.9 3.2 2.9 3.0 4.7
Employment 1.7 1.2 1.1 1.2 1.4 1.4 1.4 1.3 1.3 1.2
FDI 34 - 20.4 - 20.4 11.9 17.7 - 10.3 4.6 - 16.3 11.4 8.4
Memorandum:
FDI value (in $trillions) 1.9 1.5 1.2 1.3 1.6 1.4 1.5 1.2 1.4 1.5
a Projections.
Note: Excluding Caribbean offshore financial centres. GFCF = Gross fixed capital formation.
Source: UNCTAD, FDI/MNE database for FDI in 2007-2014; IMF (2015) for GDP, GFCF and trade, ILO for employment; and UNCTAD
estimates for FDI in 2015-2016.
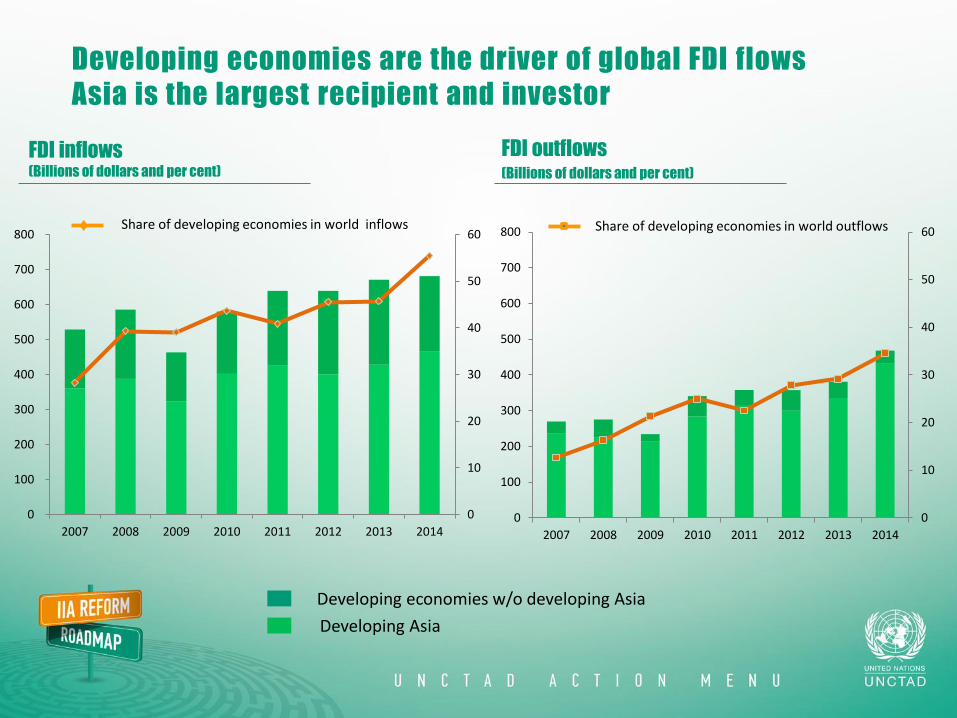
Developing economies are the driver of global FDI flows
Asia is the largest recipient and investor
0
10
20
30
40
50
60
0
100
200
300
400
500
600
700
800
2007 2008 2009 2010 2011 2012 2013 2014
Share of developing economies in world inflows
0
10
20
30
40
50
60
0
100
200
300
400
500
600
700
800
2007 2008 2009 2010 2011 2012 2013 2014
Share of developing economies in world outflows
Developing economies w/o developing Asia
Developing Asia
FDI inflows (Billions of dollars and per cent)
FDI outflows (Billions of dollars and per cent)
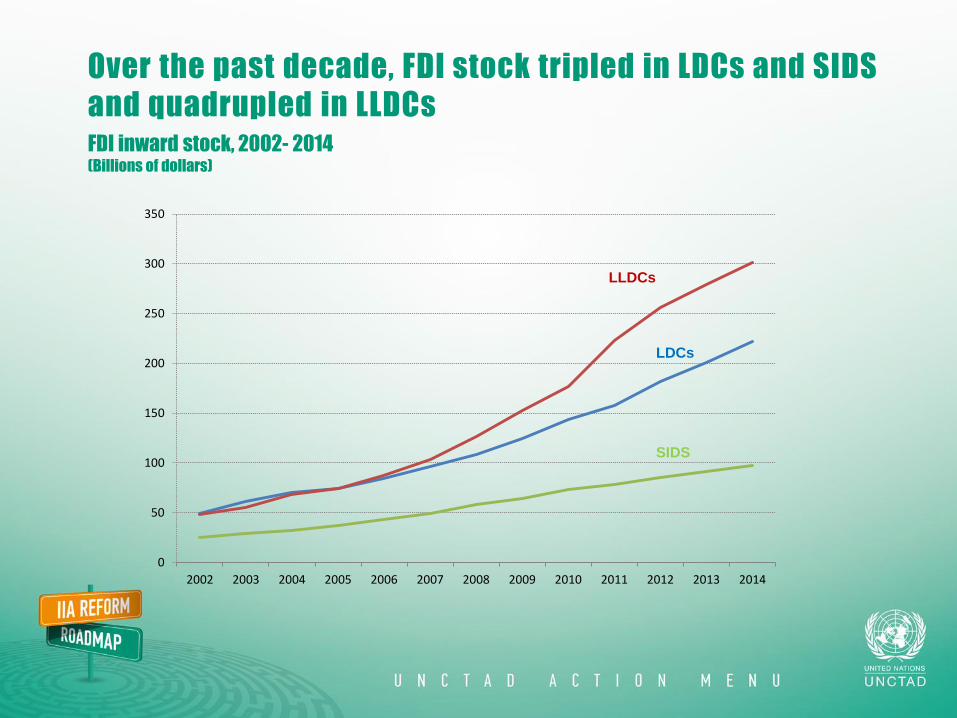
Over the past decade, FDI stock tripled in LDCs and SIDS
and quadrupled in LLDCs
0
50
100
150
200
250
300
350
2002 2003 2004 2005 2006 2007 2008 2009 2010 2011 2012 2013 2014
LLDCs
LDCs
SIDS
FDI inward stock, 2002- 2014 (Billions of dollars)
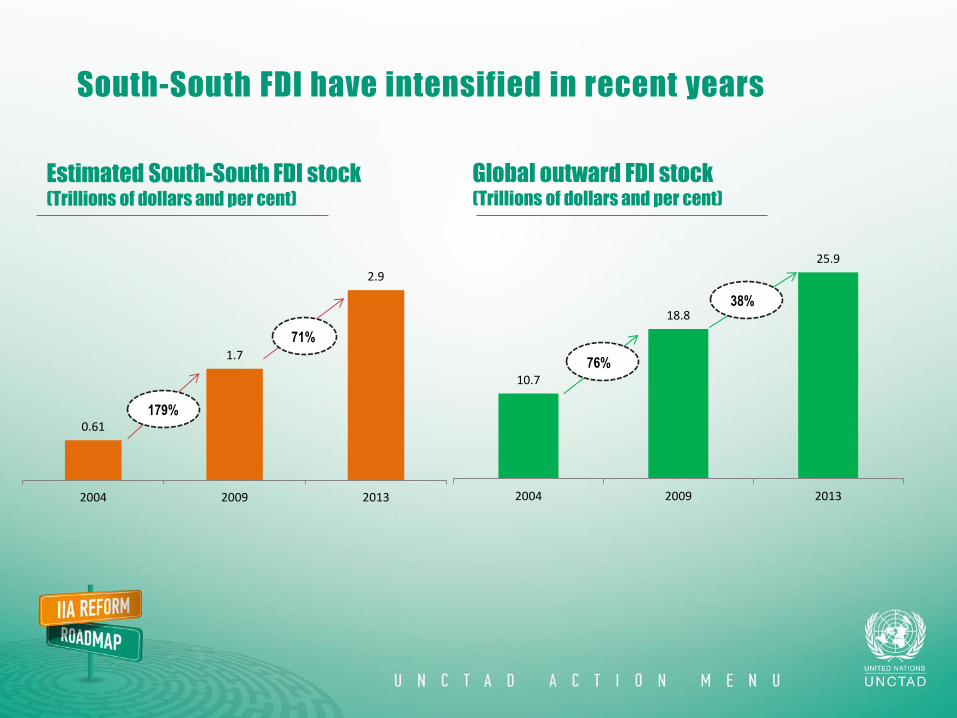
Estimated South-South FDI stock (Trillions of dollars and per cent)
Global outward FDI stock (Trillions of dollars and per cent)
South-South FDI have intensified in recent years
0.61
1.7
2.9
2004 2009 2013
71%
179%
10.7
18.8
25.9
2004 2009 2013
38%
76%
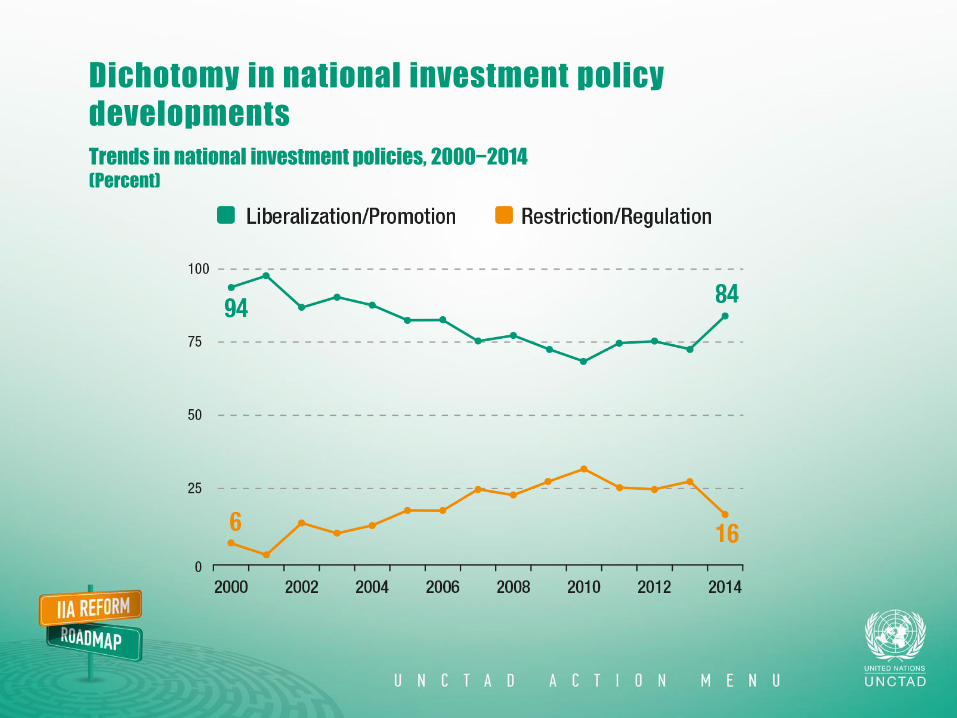
Dichotomy in national investment policy
developments
Trends in national investment policies, 2000−2014 (Percent)
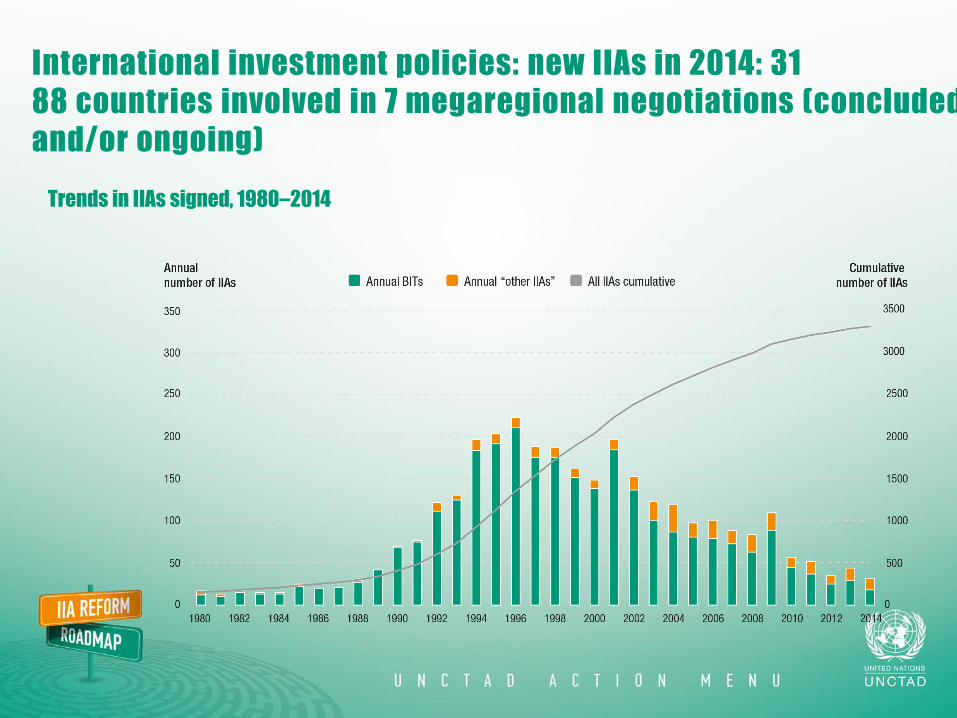
International investment policies: new IIAs in 2014: 31
88 countries involved in 7 megaregional negotiations (concluded
and/or ongoing)
Trends in IIAs signed, 1980–2014
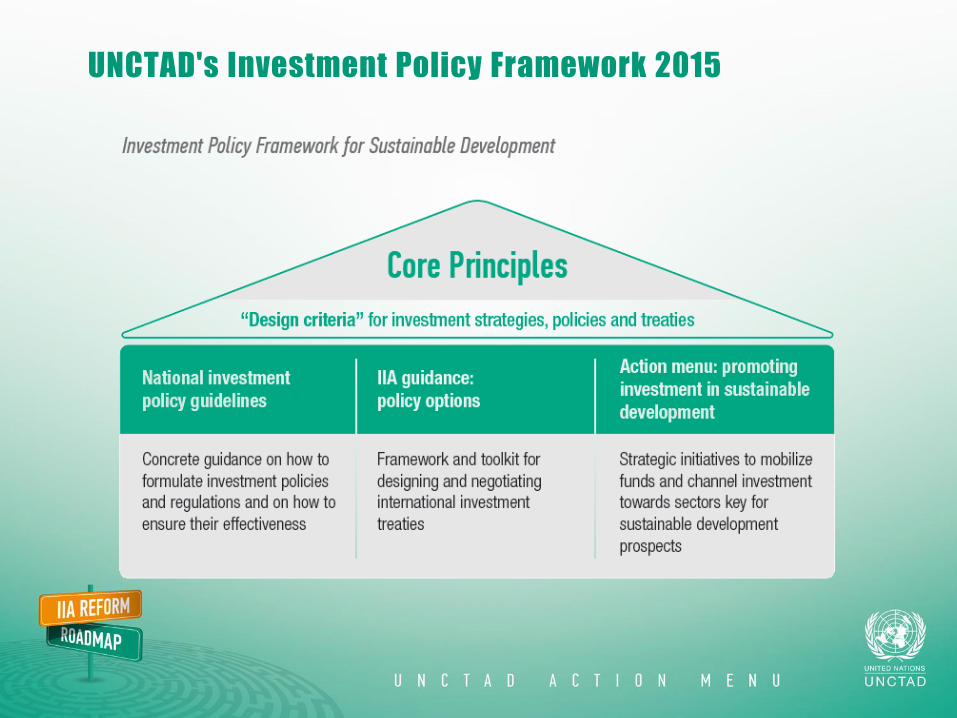
UNCTAD's Investment Policy Framework 2015
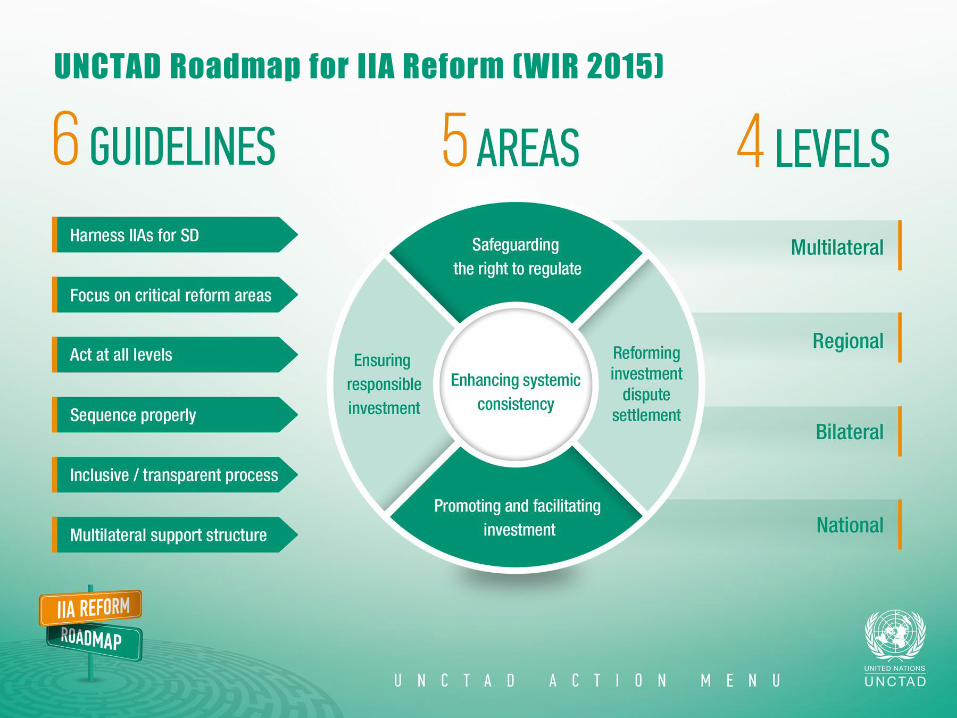
UNCTAD Roadmap for IIA Reform (WIR 2015)
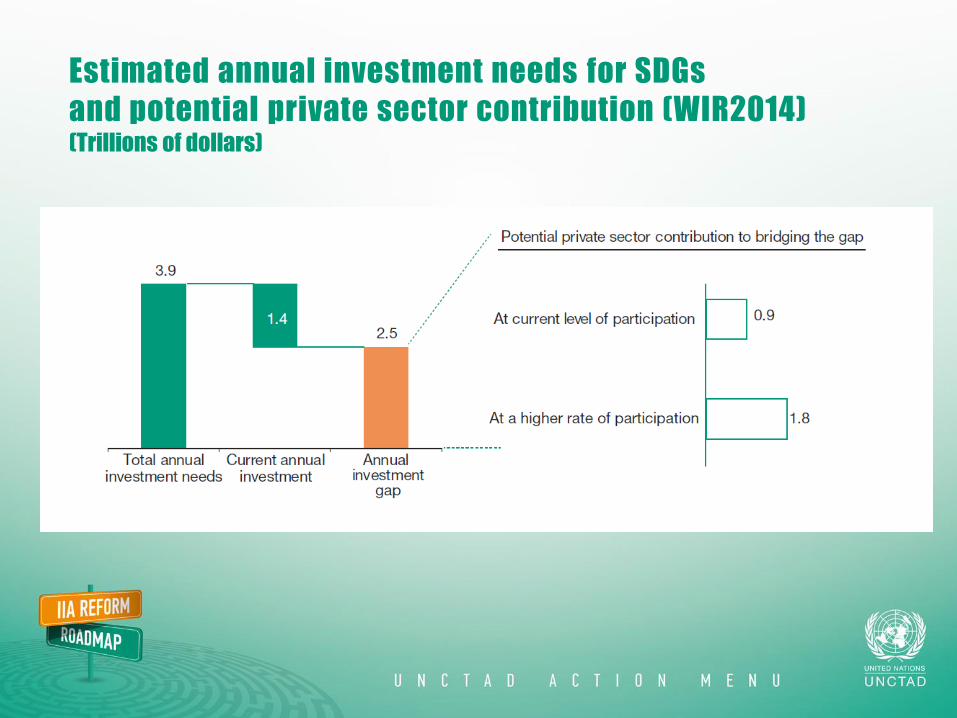
Estimated annual investment needs for SDGs
and potential private sector contribution (WIR2014) (Trillions of dollars)
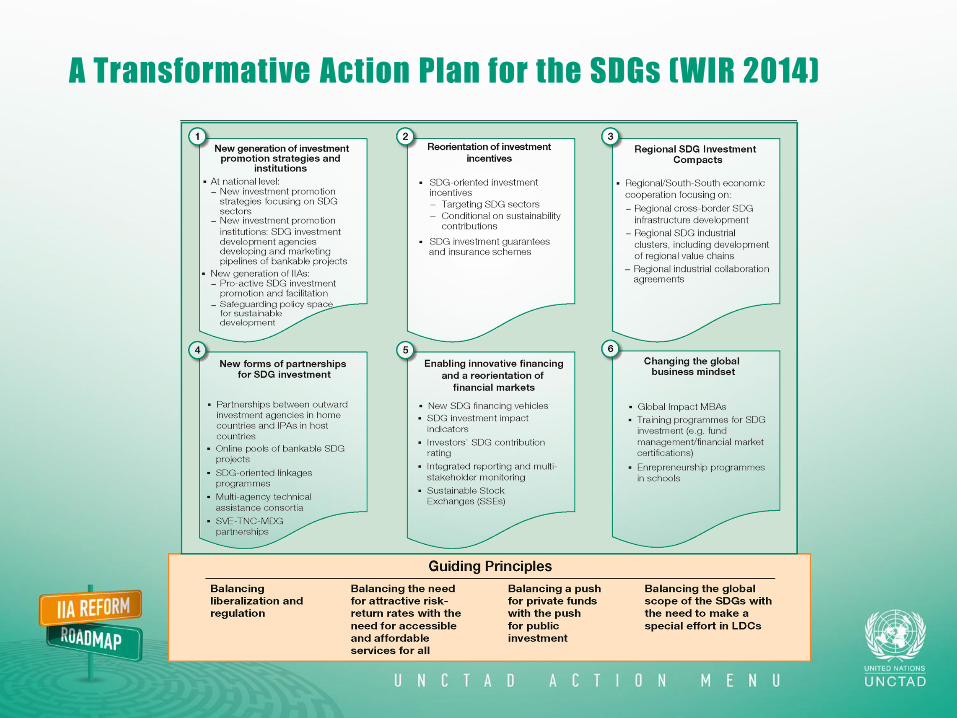
A Transformative Action Plan for the SDGs (WIR 2014)
THANK YOU!