Embed Size (px)
Citation preview
Caving 2010 — Y. Potvin (ed) © 2010 Australian Centre for Geomechanics, Perth, ISBN 978-0-9806154-1-8
Caving 2010, Perth, Australia 237
A new mine planning tool for sublevel caving mines
D. Villa Gemcom Software International Inc., Canada
T. Diering Gemcom Software International Inc., Canada
Abstract This paper presents an overview of a new application specifically developed for the planning and scheduling of sublevel caving (SLC) projects and operations. Conventional mine planning software tools are not well suited to the evaluation of this type of deposit due to their inability to model the dilution behaviour.
The overall purpose of this application is to enable a user to schedule a deposit effectively and efficiently for the feasibility of mining using the SLC method. Much of the logic in the module is similar in concept to that used in Gemcom’s PCBC software (Diering, 2000) for block cave operations. Tools for layout generation of tunnels and rings provide a basis for the subsequent generation of production schedules. Ore recovery and dilution modelling are included, but rely strongly on reasonable calibration against historic mining or other models such as REBOP (Itasca Consulting Group, 2000) (REBOP is a code for rapid simulation of the flow of fragmented rock in cave mining operations based on PFC, Particle Flow).
Some examples are provided showing either small test cases of a few rings or larger problems of several thousand rings.
1 Introduction The SLC mining method is a mass mining method in which all material to be mined needs to be blasted. In this sense, it differs from the block cave mining method which relies on gravity and stresses to fragment most of the rock to be mined. Because of the need to blast the rock, the orebody has to be divided into a regular network of tunnels. A good overall description of the method is given by Bull and Page (2000).
A significant challenge in the design and modelling of any SLC project is the estimation, management and control of dilution. This is strongly affected by tunnel spacing, draw strategy and rock mass characteristics.
The SLC method functions on the principle that the ore is fragmented by blasting, while the overlying host rock fractures and caves in under the action of mining induced stresses and gravity. It is a ‘top down’ method, with ore being extracted level by level working downwards through the orebody. The caved waste rock from the overlying rock mass fills the void created by ore extraction. Figure 1 shows a schematic view through a SLC mine. The orebody is divided into sublevels at regular vertical spacing. A network of production drifts are developed across the full width of the orebody footprint at predetermined horizontal spacing. The volume of ore immediately above each sublevel production drift is drilled with long holes in a fan or ring pattern. The drilling is undertaken as a separate operation, and completed well before blasting and loading commence (Bull and Page, 2000).
A significant part of planning and scheduling a SLC project revolves around the estimation of mineable grades resulting from the mixing and diluting processes. In this paper, we describe how this mixing can be simulated using a technique known as template mixing (TM) (Diering, 2007). However, the mine planning process is much more than simply simulating the mixing process. We also have to consider the process of setting up the problem (tunnels, rings, orientation, spacing, etc.) and the scheduling logistics of ring development rate and sequence, tie in with development scheduling, tunnelling and other mining constraints. This new mine planning tool is called PCSLC (Module specially designed for Sublevel Caving mine and project) and it aims to provide a rich set of tools to assist with the whole planning process, not just the material flow.
https://papers.acg.uwa.edu.au/p/1002_15_Villa/

A new mine planning tool for sublevel caving mines D. Villa and T. Diering
238 Caving 2010, Perth, Australia
2 Principles of PCSLC The PCSLC development tool is being done in conjunction with SRK Consulting enabling Gemcom to take advantage of the considerable SLC experience gained by SRK over the years. This experience is proving invaluable during the calibration, testing and evaluation of this new tool. In essence, the overall process is as follows:
• identifying the ore zone to be modelled as a sublevel cave
• generation of a set of tunnels based on the tunnel spacing and orientation required
• generation of rings from tunnels; this will use one (or more) ring geometries, based on the distribution of the levels or specific requirements for example slot tunnels
• generation of cells from rings; these are the lowest building blocks for the TM flow modelling
• insertion of grades and other attributes from block models into cells
• reconciliation of sum of cells against independent ring volumetrics
• reporting of ring and cell tonnes and grades (this should be an in situ report of reserves contained in the layout)
• preparation of dilution modelling strategy, which can be based on different sources, quality and amount of dilution tonnage
• set up of production scheduling information for development rates, sequence, extraction percentages, etc.
• the production scheduler has some specific input as follow:
○ classification of tunnels into levels and rings into tunnels
○ maximum mining rate per tunnel
○ maximum % extraction from each ring
○ flow fractions (e.g. the ‘template’ for the TM algorithm)
○ basis for closing each ring – grade based or tonnage based.
2.1 Getting started Basically this tool will enable users to create a realistic model to assess a SLC project dividing the ore zone into a set of tunnels and rings using a specific geometry for each level and assigning the information to each ring directly from the block model. The basic information necessary to start work with PCSLC is the shape of the ore zone. This leads into setup of tunnels and block model data, which is the main source of information of grades (e.g. copper (Cu), gold (Au), silver (Ag)), density (in situ) and rock types (used to distinguish ore material from dilution material and in some cases, previously caved material).
PCSLC is fully integrated into Geology and Mine Planning Software Gemcom GEMSTM (Gemcom, 2009) so that it can effectively use all the information available for a project such as drill holes, surfaces, geological models, tunnels, etc.).
2.2 Tunnel layout construction The tunnel layout construction process is a very simple yet flexible step allowing the creation of several alternatives in a few minutes. The main input for this step is the geometric definition of the area to be modelled; basically it requires the following definitions:
• tunnel cross section
• layout definition (vertical distance between levels and tunnel spacing)
• orientation of the tunnels
Planning and Design
Caving 2010, Perth, Australia 239
• number of the tunnels and levels to be created
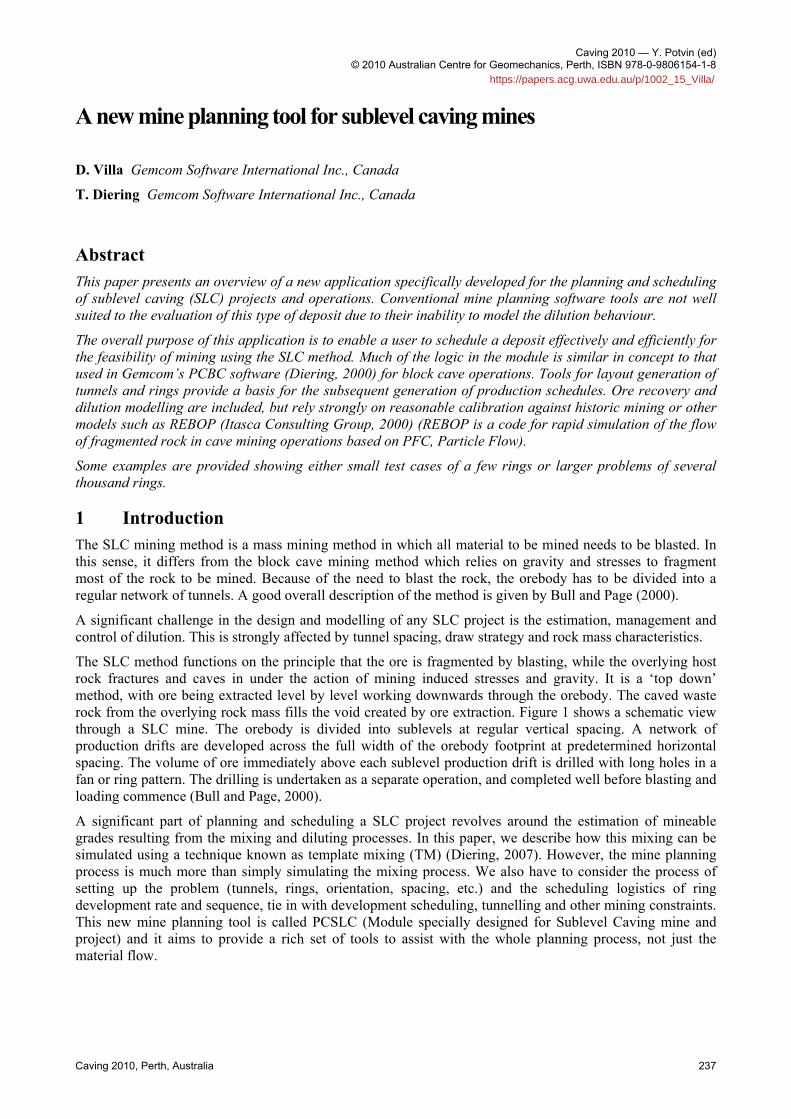
• the length of the tunnel could be the same for all of them or each tunnel could be trimmed automatically following the shape of the orebody after the creation. This option allows quick approximation of the real length of the tunnels. Figure 1 shows an example of the creation of the tunnel layout and the trimming results after. This example has two areas each with different geometry and orientation.
Figure 1 Tunnel creation and trimming example
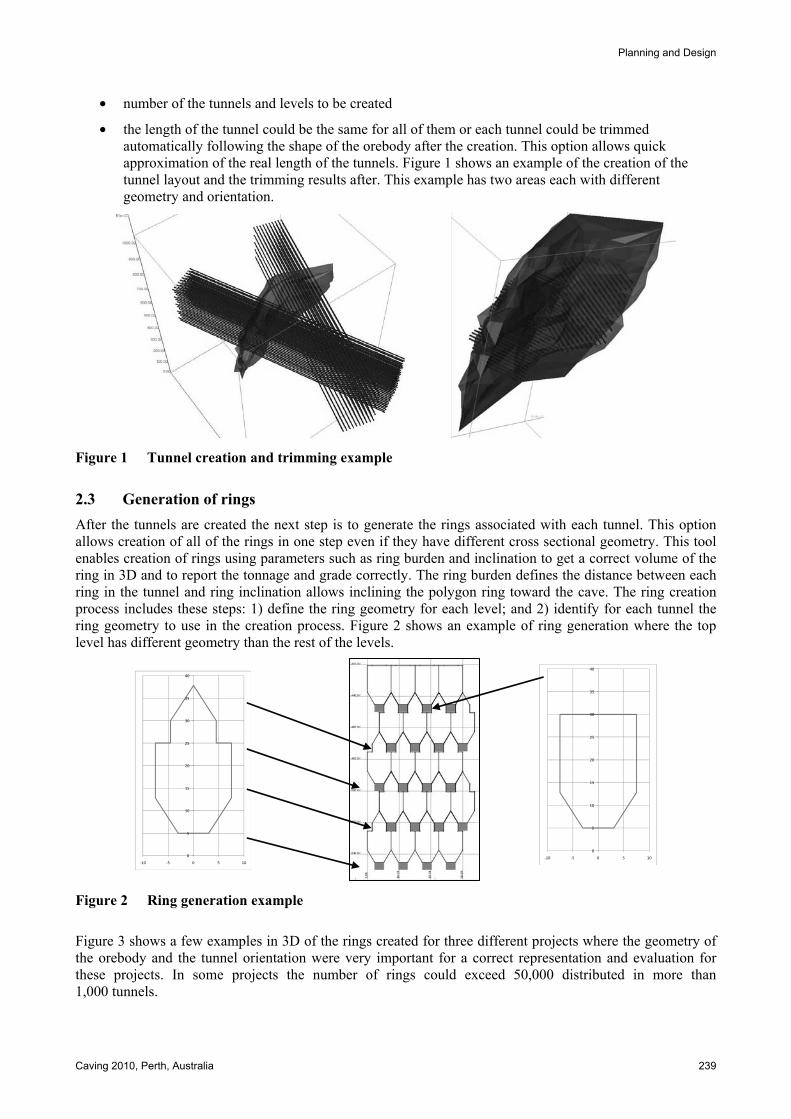
2.3 Generation of rings After the tunnels are created the next step is to generate the rings associated with each tunnel. This option allows creation of all of the rings in one step even if they have different cross sectional geometry. This tool enables creation of rings using parameters such as ring burden and inclination to get a correct volume of the ring in 3D and to report the tonnage and grade correctly. The ring burden defines the distance between each ring in the tunnel and ring inclination allows inclining the polygon ring toward the cave. The ring creation process includes these steps: 1) define the ring geometry for each level; and 2) identify for each tunnel the ring geometry to use in the creation process. Figure 2 shows an example of ring generation where the top level has different geometry than the rest of the levels.
Figure 2 Ring generation example
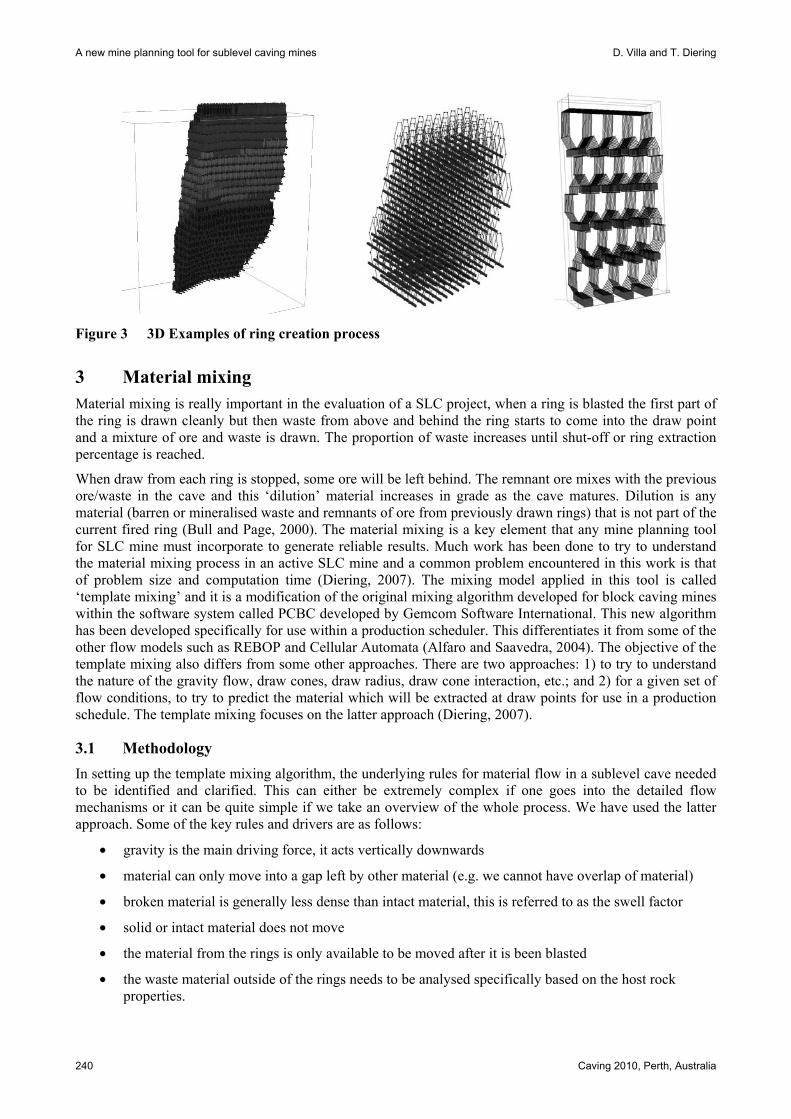
Figure 3 shows a few examples in 3D of the rings created for three different projects where the geometry of the orebody and the tunnel orientation were very important for a correct representation and evaluation for these projects. In some projects the number of rings could exceed 50,000 distributed in more than 1,000 tunnels.
0
5
10
15
20
25
30
35
40
-10 -5 0 5 100
5
10
15
20
25
30
35
40
-10 -5 0 5 10
A new mine planning tool for sublevel caving mines D. Villa and T. Diering
240 Caving 2010, Perth, Australia
Figure 3 3D Examples of ring creation process
3 Material mixing Material mixing is really important in the evaluation of a SLC project, when a ring is blasted the first part of the ring is drawn cleanly but then waste from above and behind the ring starts to come into the draw point and a mixture of ore and waste is drawn. The proportion of waste increases until shut-off or ring extraction percentage is reached.
When draw from each ring is stopped, some ore will be left behind. The remnant ore mixes with the previous ore/waste in the cave and this ‘dilution’ material increases in grade as the cave matures. Dilution is any material (barren or mineralised waste and remnants of ore from previously drawn rings) that is not part of the current fired ring (Bull and Page, 2000). The material mixing is a key element that any mine planning tool for SLC mine must incorporate to generate reliable results. Much work has been done to try to understand the material mixing process in an active SLC mine and a common problem encountered in this work is that of problem size and computation time (Diering, 2007). The mixing model applied in this tool is called ‘template mixing’ and it is a modification of the original mixing algorithm developed for block caving mines within the software system called PCBC developed by Gemcom Software International. This new algorithm has been developed specifically for use within a production scheduler. This differentiates it from some of the other flow models such as REBOP and Cellular Automata (Alfaro and Saavedra, 2004). The objective of the template mixing also differs from some other approaches. There are two approaches: 1) to try to understand the nature of the gravity flow, draw cones, draw radius, draw cone interaction, etc.; and 2) for a given set of flow conditions, to try to predict the material which will be extracted at draw points for use in a production schedule. The template mixing focuses on the latter approach (Diering, 2007).
3.1 Methodology In setting up the template mixing algorithm, the underlying rules for material flow in a sublevel cave needed to be identified and clarified. This can either be extremely complex if one goes into the detailed flow mechanisms or it can be quite simple if we take an overview of the whole process. We have used the latter approach. Some of the key rules and drivers are as follows:
• gravity is the main driving force, it acts vertically downwards
• material can only move into a gap left by other material (e.g. we cannot have overlap of material)
• broken material is generally less dense than intact material, this is referred to as the swell factor
• solid or intact material does not move
• the material from the rings is only available to be moved after it is been blasted
• the waste material outside of the rings needs to be analysed specifically based on the host rock properties.
Planning and Design
Caving 2010, Perth, Australia 241
The hard part is to decide how the material ‘moves into the gap’. The template mixing routine defines a number of rules in the form of a template linking each material element with its neighbours. Each element can be depleted and when sufficiently depleted, it needs to be replenished. The template is used for this process combining spatial, geotechnical and some randomisation considerations. The algorithm is applied in a recursive manner throughout the whole model (Diering, 2007).
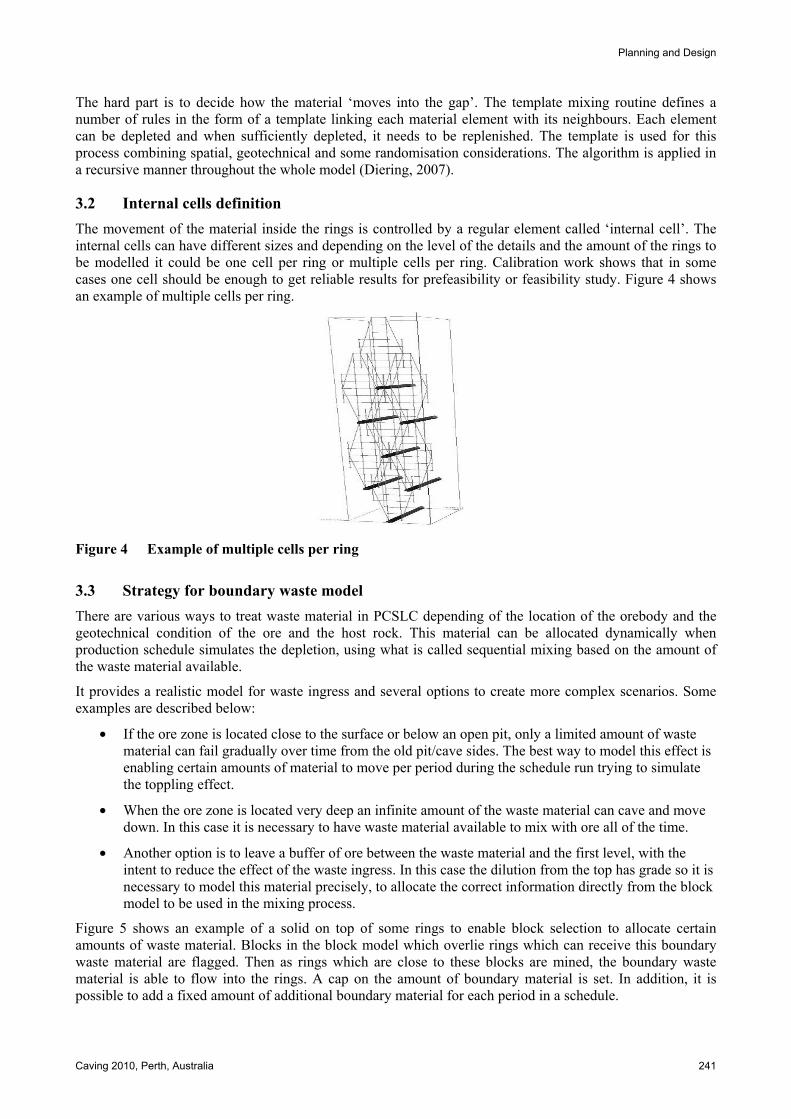
3.2 Internal cells definition The movement of the material inside the rings is controlled by a regular element called ‘internal cell’. The internal cells can have different sizes and depending on the level of the details and the amount of the rings to be modelled it could be one cell per ring or multiple cells per ring. Calibration work shows that in some cases one cell should be enough to get reliable results for prefeasibility or feasibility study. Figure 4 shows an example of multiple cells per ring.
Figure 4 Example of multiple cells per ring
3.3 Strategy for boundary waste model There are various ways to treat waste material in PCSLC depending of the location of the orebody and the geotechnical condition of the ore and the host rock. This material can be allocated dynamically when production schedule simulates the depletion, using what is called sequential mixing based on the amount of the waste material available.
It provides a realistic model for waste ingress and several options to create more complex scenarios. Some examples are described below:
• If the ore zone is located close to the surface or below an open pit, only a limited amount of waste material can fail gradually over time from the old pit/cave sides. The best way to model this effect is enabling certain amounts of material to move per period during the schedule run trying to simulate the toppling effect.
• When the ore zone is located very deep an infinite amount of the waste material can cave and move down. In this case it is necessary to have waste material available to mix with ore all of the time.
• Another option is to leave a buffer of ore between the waste material and the first level, with the intent to reduce the effect of the waste ingress. In this case the dilution from the top has grade so it is necessary to model this material precisely, to allocate the correct information directly from the block model to be used in the mixing process.
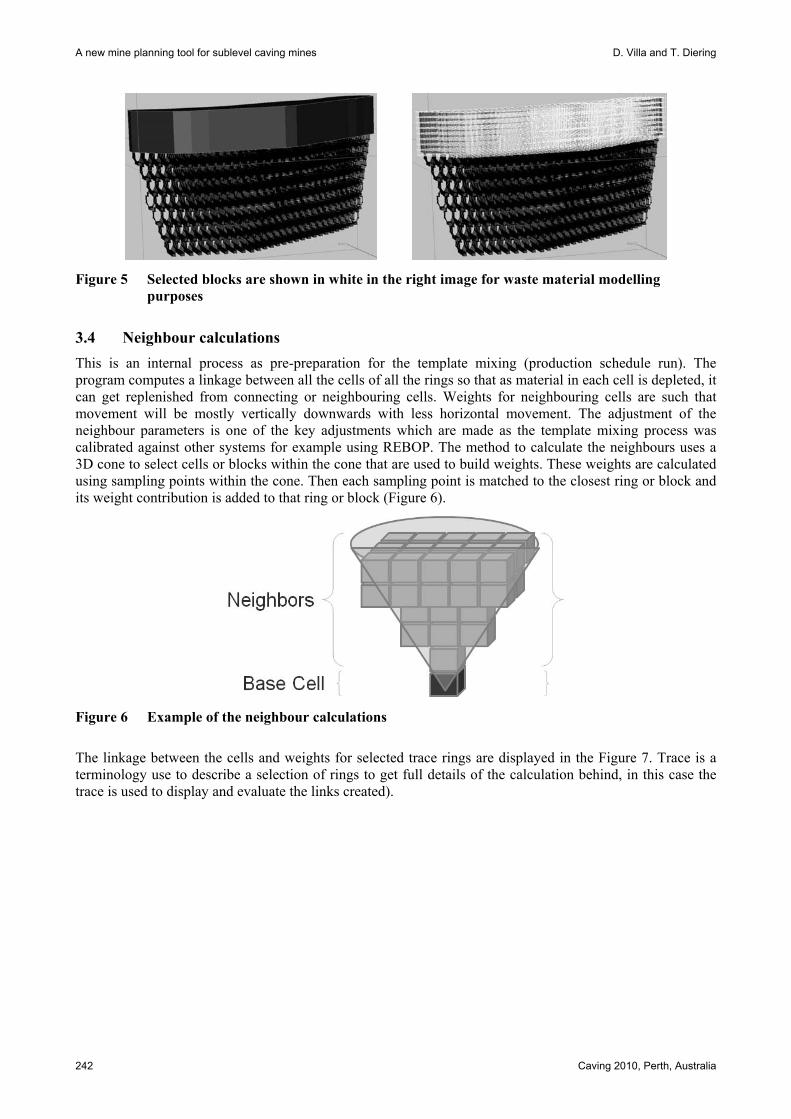
Figure 5 shows an example of a solid on top of some rings to enable block selection to allocate certain amounts of waste material. Blocks in the block model which overlie rings which can receive this boundary waste material are flagged. Then as rings which are close to these blocks are mined, the boundary waste material is able to flow into the rings. A cap on the amount of boundary material is set. In addition, it is possible to add a fixed amount of additional boundary material for each period in a schedule.
A new mine planning tool for sublevel caving mines D. Villa and T. Diering
242 Caving 2010, Perth, Australia
Figure 5 Selected blocks are shown in white in the right image for waste material modelling purposes
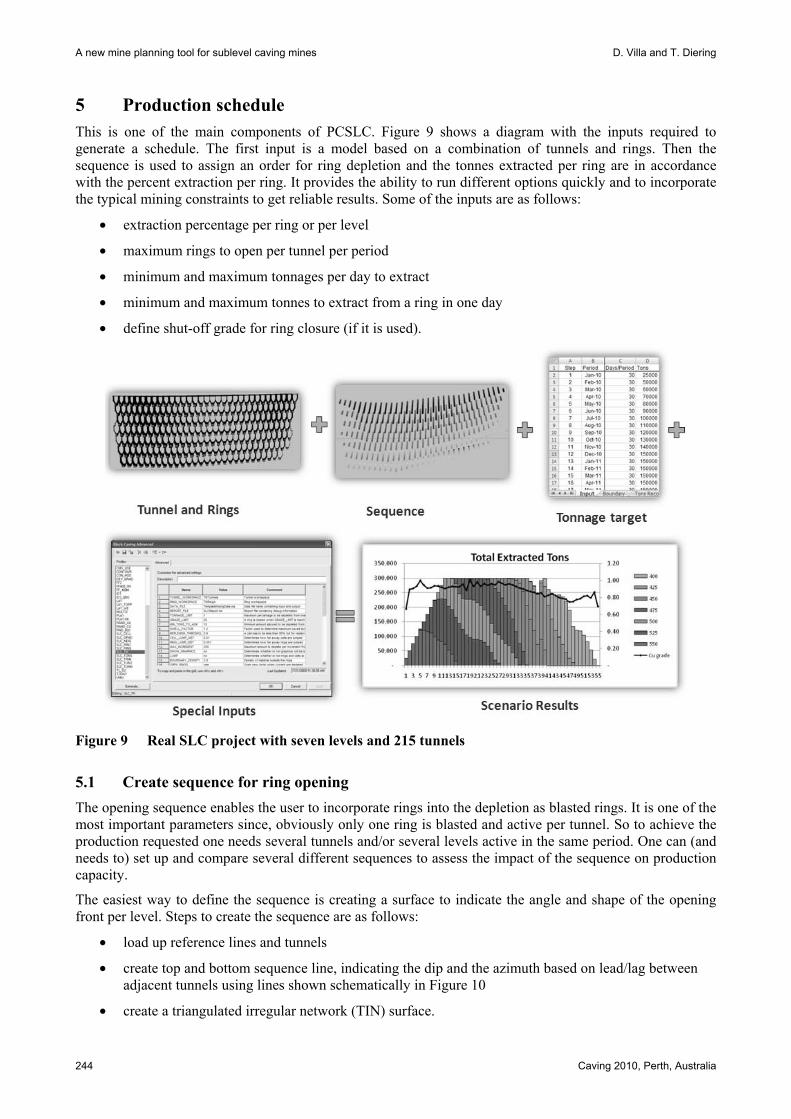
3.4 Neighbour calculations This is an internal process as pre-preparation for the template mixing (production schedule run). The program computes a linkage between all the cells of all the rings so that as material in each cell is depleted, it can get replenished from connecting or neighbouring cells. Weights for neighbouring cells are such that movement will be mostly vertically downwards with less horizontal movement. The adjustment of the neighbour parameters is one of the key adjustments which are made as the template mixing process was calibrated against other systems for example using REBOP. The method to calculate the neighbours uses a 3D cone to select cells or blocks within the cone that are used to build weights. These weights are calculated using sampling points within the cone. Then each sampling point is matched to the closest ring or block and its weight contribution is added to that ring or block (Figure 6).
Figure 6 Example of the neighbour calculations
The linkage between the cells and weights for selected trace rings are displayed in the Figure 7. Trace is a terminology use to describe a selection of rings to get full details of the calculation behind, in this case the trace is used to display and evaluate the links created).

Planning and Design
Caving 2010, Perth, Australia 243
Figure 7 Example of linkage between the cells and weights
4 Computing in situ ring reserves Once cells have been generated, it is possible to assign tonnage and grade to each of the rings and then generate an in situ ring. Figure 8 shows an example with 215 tunnels and more than 5,000 rings over seven levels.
Figure 8 SLC example with seven levels and 215 tunnels
Table 1 shows an example of the in situ SLC report showing rings, tonnage and grade per level. These numbers are useful to compare against the recovery and the dilution reported from the production scheduler.
Table 1 In situ SLC report by level
Level # Rings Tonnage Average (t/ring) CU (%) AU (g/t)
550 987 1,825,640 1,850 1.356 0.372
525 907 2,182,570 2,406 1.314 0.343
500 825 1,985,262 2,406 1.342 0.336
475 677 1,630,125 2,408 1.366 0.337
450 530 1,275,397 2,406 1.312 0.329
425 513 1,230,538 2,399 1.180 0.295
400 457 1,096,551 2,399 1.115 0.292
Grand Total 4,896 11,226,082 2,293 1.299 0.334
Lv550
Lv525
Lv500
Lv475
Lv450
Lv425 Lv400
A new mine planning tool for sublevel caving mines D. Villa and T. Diering
244 Caving 2010, Perth, Australia
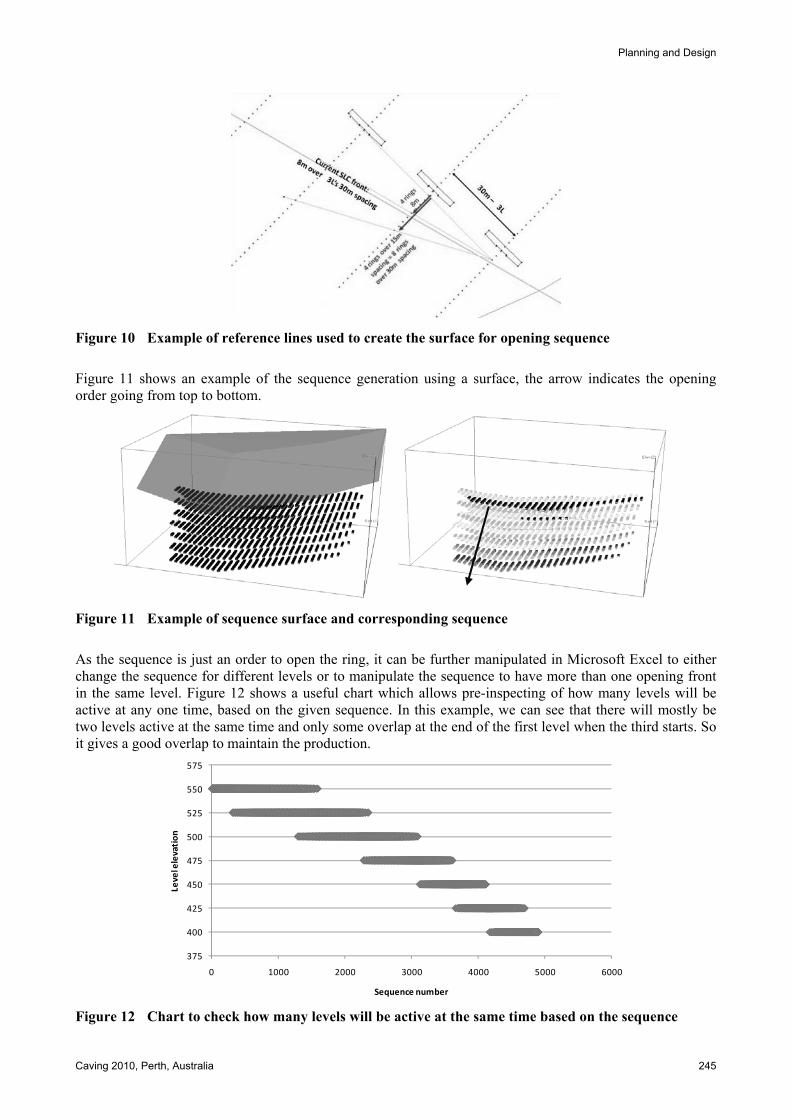
5 Production schedule This is one of the main components of PCSLC. Figure 9 shows a diagram with the inputs required to generate a schedule. The first input is a model based on a combination of tunnels and rings. Then the sequence is used to assign an order for ring depletion and the tonnes extracted per ring are in accordance with the percent extraction per ring. It provides the ability to run different options quickly and to incorporate the typical mining constraints to get reliable results. Some of the inputs are as follows:
• extraction percentage per ring or per level
• maximum rings to open per tunnel per period
• minimum and maximum tonnages per day to extract
• minimum and maximum tonnes to extract from a ring in one day
• define shut-off grade for ring closure (if it is used).
Figure 9 Real SLC project with seven levels and 215 tunnels
5.1 Create sequence for ring opening The opening sequence enables the user to incorporate rings into the depletion as blasted rings. It is one of the most important parameters since, obviously only one ring is blasted and active per tunnel. So to achieve the production requested one needs several tunnels and/or several levels active in the same period. One can (and needs to) set up and compare several different sequences to assess the impact of the sequence on production capacity.
The easiest way to define the sequence is creating a surface to indicate the angle and shape of the opening front per level. Steps to create the sequence are as follows:
• load up reference lines and tunnels
• create top and bottom sequence line, indicating the dip and the azimuth based on lead/lag between adjacent tunnels using lines shown schematically in Figure 10
• create a triangulated irregular network (TIN) surface.
Planning and Design
Caving 2010, Perth, Australia 245
Figure 10 Example of reference lines used to create the surface for opening sequence
Figure 11 shows an example of the sequence generation using a surface, the arrow indicates the opening order going from top to bottom.
Figure 11 Example of sequence surface and corresponding sequence
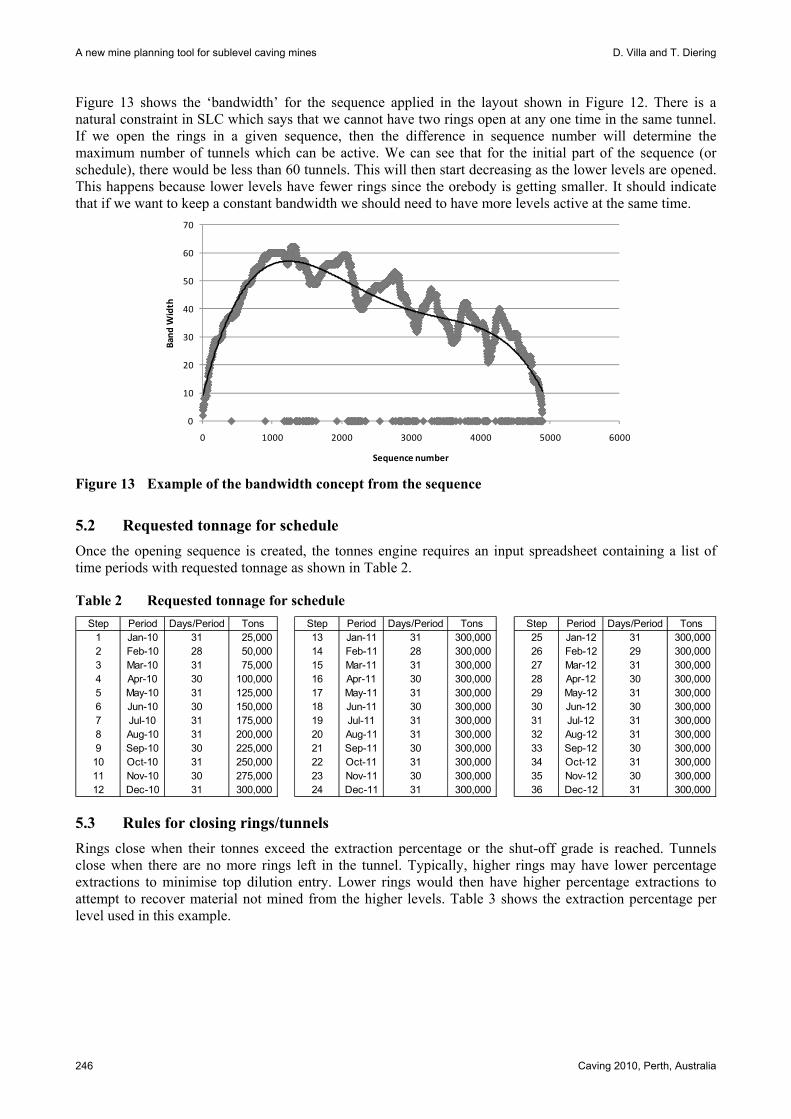
As the sequence is just an order to open the ring, it can be further manipulated in Microsoft Excel to either change the sequence for different levels or to manipulate the sequence to have more than one opening front in the same level. Figure 12 shows a useful chart which allows pre-inspecting of how many levels will be active at any one time, based on the given sequence. In this example, we can see that there will mostly be two levels active at the same time and only some overlap at the end of the first level when the third starts. So it gives a good overlap to maintain the production.
375
400
425
450
475
500
525
550
575
0 1000 2000 3000 4000 5000 6000
Leve
l ele
vati
on
Sequence number
Figure 12 Chart to check how many levels will be active at the same time based on the sequence
A new mine planning tool for sublevel caving mines D. Villa and T. Diering
246 Caving 2010, Perth, Australia
Figure 13 shows the ‘bandwidth’ for the sequence applied in the layout shown in Figure 12. There is a natural constraint in SLC which says that we cannot have two rings open at any one time in the same tunnel. If we open the rings in a given sequence, then the difference in sequence number will determine the maximum number of tunnels which can be active. We can see that for the initial part of the sequence (or schedule), there would be less than 60 tunnels. This will then start decreasing as the lower levels are opened. This happens because lower levels have fewer rings since the orebody is getting smaller. It should indicate that if we want to keep a constant bandwidth we should need to have more levels active at the same time.
0
10
20
30
40
50
60
70
0 1000 2000 3000 4000 5000 6000
Band
Wid
th
Sequence number
Figure 13 Example of the bandwidth concept from the sequence
5.2 Requested tonnage for schedule Once the opening sequence is created, the tonnes engine requires an input spreadsheet containing a list of time periods with requested tonnage as shown in Table 2.
Table 2 Requested tonnage for schedule Step Period Days/Period Tons Step Period Days/Period Tons Step Period Days/Period Tons
1 Jan-10 31 25,000 13 Jan-11 31 300,000 25 Jan-12 31 300,000 2 Feb-10 28 50,000 14 Feb-11 28 300,000 26 Feb-12 29 300,000 3 Mar-10 31 75,000 15 Mar-11 31 300,000 27 Mar-12 31 300,000 4 Apr-10 30 100,000 16 Apr-11 30 300,000 28 Apr-12 30 300,000 5 May-10 31 125,000 17 May-11 31 300,000 29 May-12 31 300,000 6 Jun-10 30 150,000 18 Jun-11 30 300,000 30 Jun-12 30 300,000 7 Jul-10 31 175,000 19 Jul-11 31 300,000 31 Jul-12 31 300,000 8 Aug-10 31 200,000 20 Aug-11 31 300,000 32 Aug-12 31 300,000 9 Sep-10 30 225,000 21 Sep-11 30 300,000 33 Sep-12 30 300,000 10 Oct-10 31 250,000 22 Oct-11 31 300,000 34 Oct-12 31 300,000 11 Nov-10 30 275,000 23 Nov-11 30 300,000 35 Nov-12 30 300,000 12 Dec-10 31 300,000 24 Dec-11 31 300,000 36 Dec-12 31 300,000
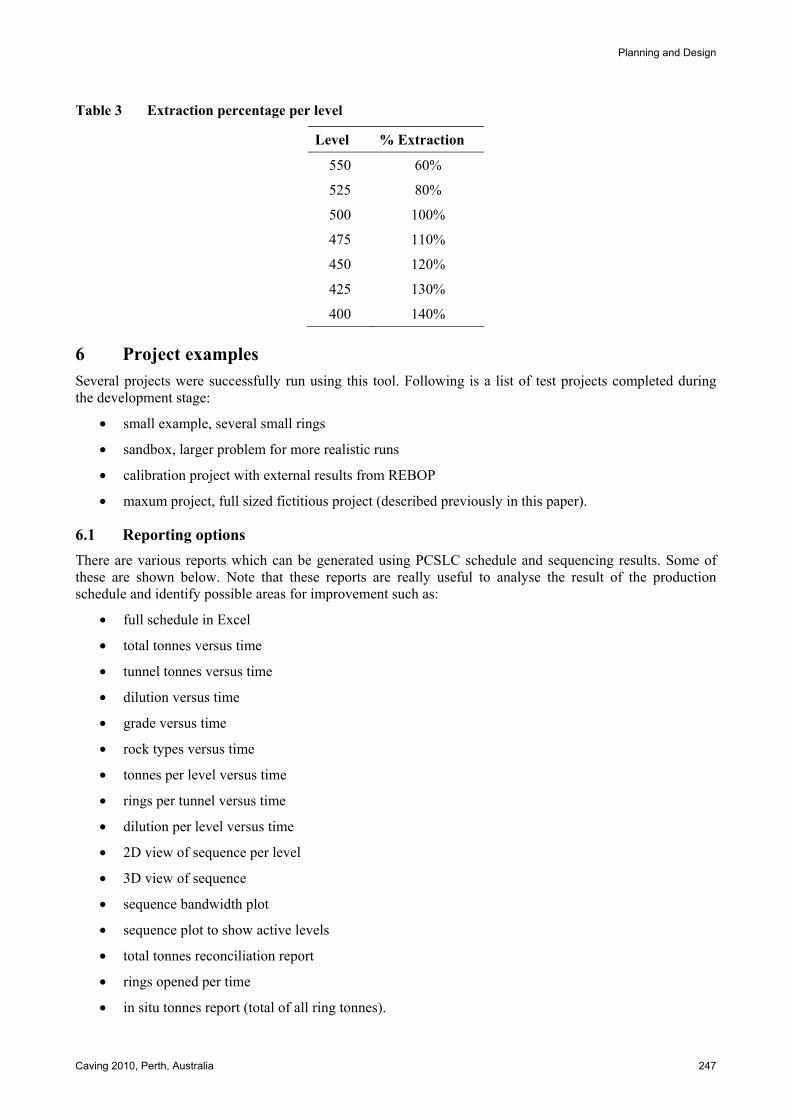
5.3 Rules for closing rings/tunnels Rings close when their tonnes exceed the extraction percentage or the shut-off grade is reached. Tunnels close when there are no more rings left in the tunnel. Typically, higher rings may have lower percentage extractions to minimise top dilution entry. Lower rings would then have higher percentage extractions to attempt to recover material not mined from the higher levels. Table 3 shows the extraction percentage per level used in this example.
Planning and Design
Caving 2010, Perth, Australia 247
Table 3 Extraction percentage per level
Level % Extraction
550 60%
525 80%
500 100%
475 110%
450 120%
425 130%
400 140%
6 Project examples Several projects were successfully run using this tool. Following is a list of test projects completed during the development stage:
• small example, several small rings
• sandbox, larger problem for more realistic runs
• calibration project with external results from REBOP
• maxum project, full sized fictitious project (described previously in this paper).
6.1 Reporting options There are various reports which can be generated using PCSLC schedule and sequencing results. Some of these are shown below. Note that these reports are really useful to analyse the result of the production schedule and identify possible areas for improvement such as:
• full schedule in Excel
• total tonnes versus time
• tunnel tonnes versus time
• dilution versus time
• grade versus time
• rock types versus time
• tonnes per level versus time
• rings per tunnel versus time
• dilution per level versus time
• 2D view of sequence per level
• 3D view of sequence
• sequence bandwidth plot
• sequence plot to show active levels
• total tonnes reconciliation report
• rings opened per time
• in situ tonnes report (total of all ring tonnes).
A new mine planning tool for sublevel caving mines D. Villa and T. Diering
248 Caving 2010, Perth, Australia
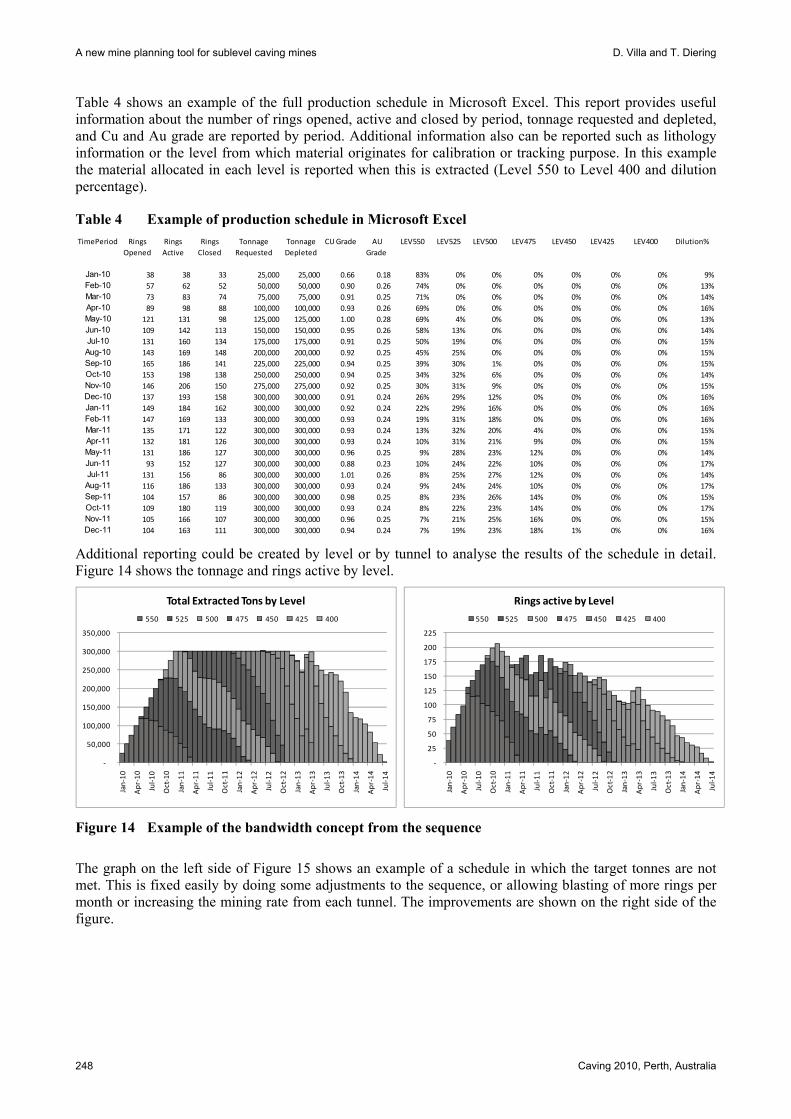
Table 4 shows an example of the full production schedule in Microsoft Excel. This report provides useful information about the number of rings opened, active and closed by period, tonnage requested and depleted, and Cu and Au grade are reported by period. Additional information also can be reported such as lithology information or the level from which material originates for calibration or tracking purpose. In this example the material allocated in each level is reported when this is extracted (Level 550 to Level 400 and dilution percentage).
Table 4 Example of production schedule in Microsoft Excel TimePeriod Rings
OpenedRings Active
Rings Closed
Tonnage Requested
Tonnage Depleted
CU Grade AU Grade
LEV550 LEV525 LEV500 LEV475 LEV450 LEV425 LEV400 Dilution%
Jan-10 38 38 33 25,000 25,000 0.66 0.18 83% 0% 0% 0% 0% 0% 0% 9%Feb-10 57 62 52 50,000 50,000 0.90 0.26 74% 0% 0% 0% 0% 0% 0% 13%Mar-10 73 83 74 75,000 75,000 0.91 0.25 71% 0% 0% 0% 0% 0% 0% 14%Apr-10 89 98 88 100,000 100,000 0.93 0.26 69% 0% 0% 0% 0% 0% 0% 16%May-10 121 131 98 125,000 125,000 1.00 0.28 69% 4% 0% 0% 0% 0% 0% 13%Jun-10 109 142 113 150,000 150,000 0.95 0.26 58% 13% 0% 0% 0% 0% 0% 14%Jul-10 131 160 134 175,000 175,000 0.91 0.25 50% 19% 0% 0% 0% 0% 0% 15%Aug-10 143 169 148 200,000 200,000 0.92 0.25 45% 25% 0% 0% 0% 0% 0% 15%Sep-10 165 186 141 225,000 225,000 0.94 0.25 39% 30% 1% 0% 0% 0% 0% 15%Oct-10 153 198 138 250,000 250,000 0.94 0.25 34% 32% 6% 0% 0% 0% 0% 14%Nov-10 146 206 150 275,000 275,000 0.92 0.25 30% 31% 9% 0% 0% 0% 0% 15%Dec-10 137 193 158 300,000 300,000 0.91 0.24 26% 29% 12% 0% 0% 0% 0% 16%Jan-11 149 184 162 300,000 300,000 0.92 0.24 22% 29% 16% 0% 0% 0% 0% 16%Feb-11 147 169 133 300,000 300,000 0.93 0.24 19% 31% 18% 0% 0% 0% 0% 16%Mar-11 135 171 122 300,000 300,000 0.93 0.24 13% 32% 20% 4% 0% 0% 0% 15%Apr-11 132 181 126 300,000 300,000 0.93 0.24 10% 31% 21% 9% 0% 0% 0% 15%May-11 131 186 127 300,000 300,000 0.96 0.25 9% 28% 23% 12% 0% 0% 0% 14%Jun-11 93 152 127 300,000 300,000 0.88 0.23 10% 24% 22% 10% 0% 0% 0% 17%Jul-11 131 156 86 300,000 300,000 1.01 0.26 8% 25% 27% 12% 0% 0% 0% 14%Aug-11 116 186 133 300,000 300,000 0.93 0.24 9% 24% 24% 10% 0% 0% 0% 17%Sep-11 104 157 86 300,000 300,000 0.98 0.25 8% 23% 26% 14% 0% 0% 0% 15%Oct-11 109 180 119 300,000 300,000 0.93 0.24 8% 22% 23% 14% 0% 0% 0% 17%Nov-11 105 166 107 300,000 300,000 0.96 0.25 7% 21% 25% 16% 0% 0% 0% 15%Dec-11 104 163 111 300,000 300,000 0.94 0.24 7% 19% 23% 18% 1% 0% 0% 16%
Additional reporting could be created by level or by tunnel to analyse the results of the schedule in detail. Figure 14 shows the tonnage and rings active by level.
-
50,000
100,000
150,000
200,000
250,000
300,000
350,000
Jan-
10
Apr
-10
Jul-1
0
Oct
-10
Jan-
11
Apr
-11
Jul-1
1
Oct
-11
Jan-
12
Apr
-12
Jul-1
2
Oct
-12
Jan-
13
Apr
-13
Jul-1
3
Oct
-13
Jan-
14
Apr
-14
Jul-1
4
Total Extracted Tons by Level
550 525 500 475 450 425 400
-
25
50
75
100
125
150
175
200
225
Jan-
10
Apr
-10
Jul-1
0
Oct
-10
Jan-
11
Apr
-11
Jul-1
1
Oct
-11
Jan-
12
Apr
-12
Jul-1
2
Oct
-12
Jan-
13
Apr
-13
Jul-1
3
Oct
-13
Jan-
14
Apr
-14
Jul-1
4
Rings active by Level
550 525 500 475 450 425 400
Figure 14 Example of the bandwidth concept from the sequence
The graph on the left side of Figure 15 shows an example of a schedule in which the target tonnes are not met. This is fixed easily by doing some adjustments to the sequence, or allowing blasting of more rings per month or increasing the mining rate from each tunnel. The improvements are shown on the right side of the figure.
Planning and Design
Caving 2010, Perth, Australia 249
Schedule (tonnage by period) Schedule (tonnage by period)
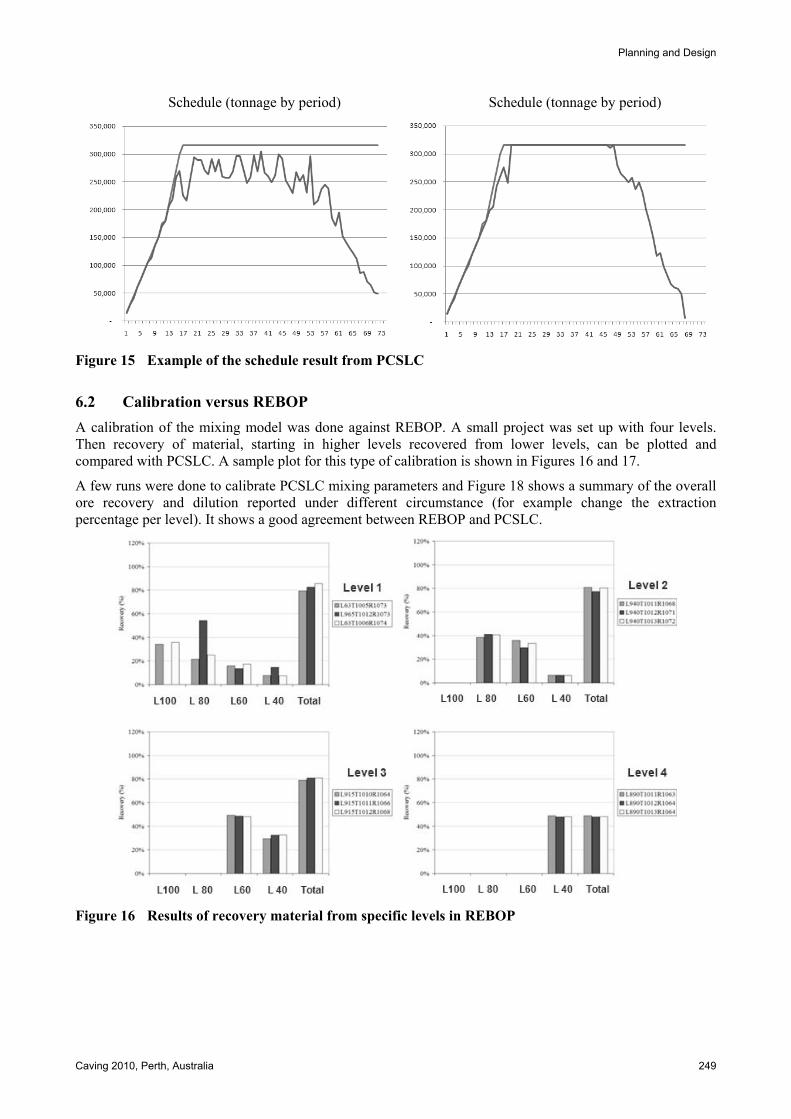
Figure 15 Example of the schedule result from PCSLC
6.2 Calibration versus REBOP A calibration of the mixing model was done against REBOP. A small project was set up with four levels. Then recovery of material, starting in higher levels recovered from lower levels, can be plotted and compared with PCSLC. A sample plot for this type of calibration is shown in Figures 16 and 17.
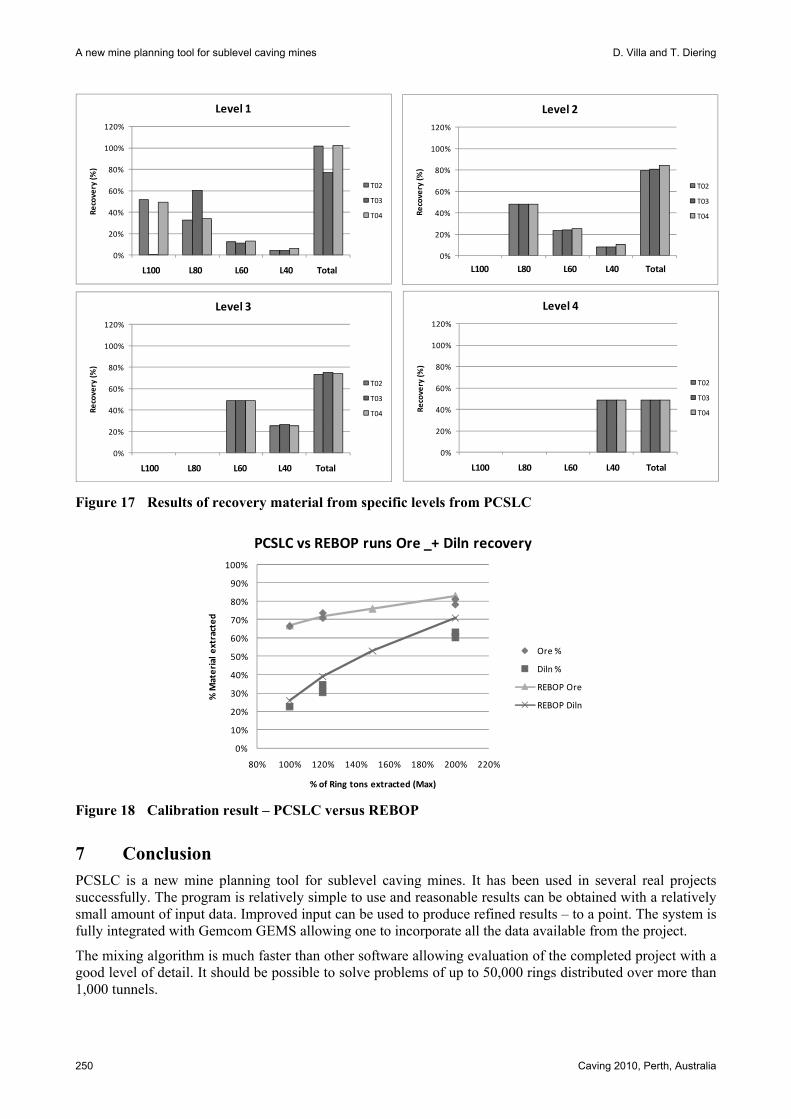
A few runs were done to calibrate PCSLC mixing parameters and Figure 18 shows a summary of the overall ore recovery and dilution reported under different circumstance (for example change the extraction percentage per level). It shows a good agreement between REBOP and PCSLC.
Figure 16 Results of recovery material from specific levels in REBOP
A new mine planning tool for sublevel caving mines D. Villa and T. Diering
250 Caving 2010, Perth, Australia
0%
20%
40%
60%
80%
100%
120%
L63 940L 915L 890L Total
Reco
very
(%)
Level 1
T02
T03
T04
0%
20%
40%
60%
80%
100%
120%
L63 940L 915L 890L Total
Reco
very
(%)
Level 2
T02
T03
T04
0%
20%
40%
60%
80%
100%
120%
L63 940L 915L 890L Total
Reco
very
(%)
Level 3
T02
T03
T04
0%
20%
40%
60%
80%
100%
120%
L63 940L 915L 890L Total
Reco
very
(%)
Level 4
T02
T03
T04
L100 L80 L60 L40 Total
L100 L80 L60 L40 Total
L100 L80 L60 L40 Total
L100 L80 L60 L40 Total
Figure 17 Results of recovery material from specific levels from PCSLC
0%
10%
20%
30%
40%
50%
60%
70%
80%
90%
100%
80% 100% 120% 140% 160% 180% 200% 220%
% M
ater
ial e
xtra
cted
% of Ring tons extracted (Max)
PCSLC vs REBOP runs Ore _+ Diln recovery
Ore %
Diln %
REBOP Ore
REBOP Diln
Figure 18 Calibration result – PCSLC versus REBOP
7 Conclusion PCSLC is a new mine planning tool for sublevel caving mines. It has been used in several real projects successfully. The program is relatively simple to use and reasonable results can be obtained with a relatively small amount of input data. Improved input can be used to produce refined results – to a point. The system is fully integrated with Gemcom GEMS allowing one to incorporate all the data available from the project.
The mixing algorithm is much faster than other software allowing evaluation of the completed project with a good level of detail. It should be possible to solve problems of up to 50,000 rings distributed over more than 1,000 tunnels.
Planning and Design
Caving 2010, Perth, Australia 251
PCSLC has been developed as a joint venture initiative between Gemcom Software International Inc. and SRK Consulting in Vancouver and this assistance is gratefully acknowledged. The development process for PCSLC has also been significantly enhanced by collaborative projects with key clients. This has allowed us to incorporate the experience and knowledge to create a better tool.
The next phase of the development of PCSLC will look at the actual drill/blast/load logic in a typical SLC project. If we track the time for drilling and loading separately, then we should be better suited to check the effect on tunnel performance due to parameters such as the percentage extraction of rings.
Acknowledgements The authors would like to thank to SRK Consulting for their assistance with the development of this software and Gemcom Software International Inc. for providing time and resources to complete this paper.
References Alfaro, M. and Saavedra, J. (2004) Predictive models for gravitational flow, in Proceedings MassMin 2004,
A. Karzulovic and M. Alvaro (eds), 22–25 August, Santiago, Chile, Instituto de Ingenieros de Chile, Santiago, pp. 179–184.
Bull, G. and Page, C.H. (2000) Sublevel Caving – Today’s Dependable Low-Cost ‘Ore Factory’, in Proceedings MassMin 2000, G. Chitombo (ed), 29 October to 2 November 2000, Brisbane, Queensland, AusIMM, Carlton, pp. 537–556.
Diering, T. (2000) PC-BC: A block cave design and draw control system, in Proceedings Massmin 2000, G. Chitombo (ed), 29 October to 2 November 2000, Brisbane, Queensland, AusIMM, Carlton, pp. 469–484.
Diering, T. (2007) Template Mixing: A Depletion Engine for Block Cave Scheduling, APCOM 2007 – 33rd International Symposium on Application of Computers and Operations Research in the Mineral Industry, E.J. Magri (ed), 24–27 April, 2007, Santiago, Chile, Gecamin Ltd., Chile, pp. 313–320.
Itasca Consulting Group (2000) REBOP (Rapid Emulator Based On PFC3D) Formulation and User’s Guide, Version 1.0, Minneapolis: Itasca Consulting Group.
Gemcom. (2009). Gemcom Software International Inc. Retrieved from http://www.gemcomsoftware.com

A new mine planning tool for sublevel caving mines D. Villa and T. Diering
252 Caving 2010, Perth, Australia