Embed Size (px)
Citation preview
Stormwater BMP Guidance Tool A Stormwater Best Management Practices Guide for Orleans and Jefferson Parishes

Stormwater BMP Guidance Tool
A Stormwater Best Management Practices Guide for Orleans and Jefferson Parishes
October, 2010
Prepared for:
Prepared by:
Acknowledgements
This project was funded by a federal grant administered by the Louisiana Department of Environmental Quality (LDEQ) as authorized by Section 604(b) of the Federal Clean Water Act (CWA), as well as in‐kind contributions provided by Geosyntec Consultants, the City of New Orleans, and the Bayou Land Resource Conservation and Development Council (Bayou Land). Bayou Land prepared the grant application that secured the funding. Bayou Land contracted Geosyntec Consultants to develop the guidance manual. Additional technical support was provided by Jennifer Ruley, PE of the Louisiana Public Health Institute through a grant from Entergy Corporation. The preparation of this manual would not have been possible without significant contributions from the many individuals who were involved. The key individuals included:
Project Direction, Oversight, and Review
Bayou Land RC&D: Alton James USDA‐NRCS (RC&D Project Coordinator) Jennifer Roberts (Project Director)
Louisiana Public Health Institute: Jennifer Ruley, P.E. (Lead Technical Advisor in residence at City of New Orleans Department of Public Works)
Manual Preparation
Geosyntec Consultants: Eric Strecker, P.E. (Principal‐in‐Charge) Alex Sheffield, P.E. (Project Manager) Chad Cristina, Ph.D., P.E. (Technical Development Lead) Marc Leisenring, P.E. (Technical Development Lead)
Cover Art Courtesy of
Susan Norris‐Davis
Bayou Land RC&D iv October 2010
Table of Contents
1 INTRODUCTION....................................................................................................... 1-1 1.1 Purpose and Scope ............................................................................................... 1-2
1.2 Stormwater Management Background and Benefits ........................................... 1-2
2 PROJECT OBJECTIVES AND CONSTRAINTS .................................................. 2-1 2.1 Project Objectives ................................................................................................ 2-1
2.1.1 Hydrology and Hydraulics ....................................................................... 2-2
2.1.2 Pollutants of Concern ............................................................................... 2-3
2.2 Physical Constraints ............................................................................................. 2-7
2.2.1 Space Availability .................................................................................... 2-7
2.2.2 Soils.......................................................................................................... 2-7
2.2.3 Groundwater ............................................................................................ 2-9
2.2.4 Existing Infrastructure ............................................................................. 2-9
2.2.5 Surface Slopes and Vertical Relief ........................................................ 2-11
2.3 Cost Constraints ................................................................................................. 2-11
2.3.1 Capital Cost (Construction and Permitting) ........................................... 2-12
2.3.2 Operation and Maintenance ................................................................... 2-13
2.3.3 Whole Life Cycle Costs ......................................................................... 2-14
2.4 Public Acceptance Constraints .......................................................................... 2-14
2.5 Regulatory Constraints....................................................................................... 2-14
2.5.1 Federal Regulations ............................................................................... 2-15
2.5.2 State Regulations ................................................................................... 2-15
2.5.3 Local Regulations .................................................................................. 2-17
3 STORMWATER BMP OPTIONS ............................................................................ 3-1 3.1 Site Design BMPs ................................................................................................ 3-1
3.1.1 Integrate Natural Drainage Patterns into Site Plan .................................. 3-1
3.1.2 Protect Existing Vegetation and Sensitive Areas ..................................... 3-1
3.1.3 Minimize Impervious Area ...................................................................... 3-1
3.1.4 Disconnect Impervious Areas .................................................................. 3-2
3.1.5 Minimize Construction Footprint ............................................................ 3-2
Bayou Land RC&D v October 2010
3.1.6 Re-vegetate Disturbed Areas ................................................................... 3-3
3.2 Biofiltration BMPs ............................................................................................... 3-4
3.2.1 Rain Gardens/Bioretention Areas ............................................................ 3-4
3.2.2 Vegetated Swale Filter ............................................................................. 3-9
3.2.3 Vegetated Filter Strip ............................................................................. 3-14
3.3 Permeable Pavement and Media Filtration BMPs ............................................. 3-18
3.3.1 Porous Asphalt, Concrete, and Pavers ................................................... 3-18
3.3.2 Gravel Trenches ..................................................................................... 3-24
3.3.3 Sand Filters ............................................................................................ 3-29
3.4 Building BMPs................................................................................................... 3-33
3.4.1 Cistern/Rain Barrel ................................................................................ 3-33
3.4.2 Planter Box............................................................................................. 3-37
3.4.3 Green Roof ............................................................................................. 3-42
3.5 Retention and Detention BMPs ......................................................................... 3-46
3.5.1 Constructed Treatment Wetland ............................................................ 3-46
3.5.2 Wet Retention Basin .............................................................................. 3-51
3.5.3 Dry Extended Detention Basin .............................................................. 3-55
4 STORMWATER BMP EVALUATION METHODS ............................................. 4-1 4.1 Hydrologic Performance Evaluation .................................................................... 4-1
4.1.1 BMP Hydrologic Classification ............................................................... 4-2
4.1.2 Role of Modeling ..................................................................................... 4-8
4.1.3 Estimating Percent Volume Capture ........................................................ 4-9
4.2 Water Quality Performance Evaluation ............................................................. 4-18
4.2.1 Effluent Quality ..................................................................................... 4-19
4.2.2 Load Reductions .................................................................................... 4-19
5 CONCEPTUAL MODEL APPLICATIONS ........................................................... 5-1 5.1 BMP Alternative Comparison Tool ..................................................................... 5-1
5.2 Conceptual Design Examples .............................................................................. 5-6
5.2.1 Single-Family Residential ........................................................................ 5-6
5.2.2 Multi-Family Residential ......................................................................... 5-8

Bayou Land RC&D vi October 2010
5.2.3 Commercial Developments .................................................................... 5-10
5.2.4 Office Buildings ..................................................................................... 5-12
5.2.5 Streets ..................................................................................................... 5-15
6 REFERENCES ............................................................................................................ 6-1
LIST OF TABLES
Table 2-1: Expected Pollutant Loading by Land Use ........................................................... 2-6
Table 2-2: Base Capital Costs (Excluding Land Costs) for Commonly Used BMPs ......... 2-13
Table 2-3: List of Required MS4 Monitoring Parameters ................................................... 2-17
Table 3-1: Site Suitability Considerations for Rain Gardens ................................................ 3-5
Table 3-2: Quick Reference Guide for Rain Gardens ........................................................... 3-5
Table 3-3: Site Suitability Considerations for Vegetated Swale Filters .............................. 3-10
Table 3-4: Quick Reference Guide for Vegetated Swale Filters ......................................... 3-11
Table 3-5: Site Suitability Considerations for Vegetated Filter Strips ................................ 3-15
Table 3-6: Quick Reference Guide for Vegetated Filter Strips ........................................... 3-15
Table 3-7: Site Suitability Considerations for Permeable Pavement .................................. 3-19
Table 3-8: Quick Reference Guide for Porous Asphalt....................................................... 3-19
Table 3-9: Site Suitability Considerations for Gravel Trenches ......................................... 3-25
Table 3-10: Quick Reference Guide for Gravel Trenches ..................................................... 3-25
Table 3-11: Site Suitability Considerations for Sand Filters ................................................. 3-30
Table 3-12: Quick Reference Guide for Sand Filters ............................................................ 3-30
Table 3-13: Site Suitability Considerations for Cisterns/Rain Barrels .................................. 3-34
Table 3-14: Quick Reference Guide for Cisterns/Rain Barrels ............................................. 3-34
Table 3-15: Site Suitability Considerations for Planter Boxes .............................................. 3-38
Table 3-16: Quick Reference Guide for Planter Boxes ......................................................... 3-38
Table 3-17: Site Suitability Considerations for Green Roofs ................................................ 3-43
Table 3-18: Quick Reference Guide for Green Roofs ........................................................... 3-43
Table 3-19: Site Suitability Considerations for Constructed Treatment Wetlands ............... 3-47
Table 3-20: Quick Reference Guide for Constructed Treatment Wetlands .......................... 3-48
Table 3-21: Site Suitability Considerations for Wet Retention Basins ................................. 3-52
Bayou Land RC&D vii October 2010
Table 3-22: Quick Reference Guide for Wet Retention Basins ............................................ 3-52
Table 3-23: Site Suitability Considerations for Dry Extended Detention Basins ................. 3-56
Table 3-24: Quick Reference Guide for Dry Extended Detention Basins ............................ 3-56
Table 5-1: Proposed BMP or Treatment Train Alternative Comparison Tool ...................... 5-3
Table 5-2: Example comparison between Bioretention (Alt. A) and Filter Strip (Alt. B) .... 5-4
Table 5-3: Suggested BMP rating values for use in Table 5-1.............................................. 5-5
LIST OF FIGURES
Figure 1-1: Increased peak runoff rates and increased runoff volumes resulting from increased watershed imperviousness. Note that this is an illustrative example and does not represent any particular watershed in Orleans/Jefferson Parish. ..............................1-4
Figure 3-1: Illustration of a Typical Rain Garden .......................................................................3-6
Figure 3-2: Illustration of a Vegetated Swale Filter ..................................................................3-11
Figure 3-3: Illustration of a Vegetated Filter Strip ....................................................................3-16
Figure 3-4: Illustration of permeable pavement. .......................................................................3-20
Figure 3-5: Illustration of a Gravel Trench ................................................................................3-26
Figure 3-6: Illustration of a Sand Filter .....................................................................................3-31
Figure 3-7: Illustration of a Cistern Rainwater Harvest System ................................................3-35
Figure 3-8: Illustration of a Planter Box ....................................................................................3-39
Figure 3-9: Illustration of a Green Roof ....................................................................................3-43
Figure 3-10: Illustration of a Constructed Treatment Wetland....................................................3-48
Figure 3-11: Illustration of a Wet Retention Basin ......................................................................3-53
Figure 3-12: Illustration of a Dry Extended Detention Basin ......................................................3-57
Figure 4-1: Treatment and Retention Storage Volume Definitions .............................................4-3
Figure 4-2: Volume-Based BMP Cross-Section with Potential Storage Components. ...............4-4
Figure 4-3: Conceptual Cross-Section of an Online Vegetated Swale ........................................4-7

Bayou Land RC&D viii October 2010
Figure 4-4: Percent Capture for Volume-Based BMPs with Drainable Storage. ......................4-11
Figure 4-5: Graphical Operations Supporting Example 4.1 ......................................................4-13
Figure 4-6: Graphical Operations Supporting Example 5.2 ......................................................4-16
Figure 4-7: Percent Treated Nomograph for the Permanent Pool of Retention Ponds ..............4-17
Figure 4-8: Percent Capture Nomograph for Flow-Based BMPs ..............................................4-18
Figure 5-1: Single-Family Site Design Example .........................................................................5-7
Figure 5-2: Multi-Family Residential Site Design Example .......................................................5-9
Figure 5-3: Commercial Site Design Example ..........................................................................5-11
Figure 5-4: Permeable pavers at the Lakeside Mall (Jefferson Parish) .....................................5-12
Figure 5-5: Office Building Site Design Example .....................................................................5-14
Figure 5-6: Conceptual diagram of a green street (modified from City of Portland 2008) .......5-15
Figure 5-7: Curb extensions retrofitted into a residential street (San Mateo 2009) ..................5-16
Figure 5-8: West Metairie Parkway BMP Opportunity. ............................................................5-16
Figure 5-9: BMPs incorporated into a wide sidewalk (modified from San Mateo 2009) .........5-17
Figure 5-10: Oak Street BMP Opportunity .....................................................................................5-17
Figure 5-11: Arterial roadway with vegetated swale and porous pavement sidewalk (modified from San Mateo 2009) ...........................................................................5-18
Figure 5-12: Grass filter strip along Veterans Highway north of Causeway Boulevard .............5-18
EXHIBITS
Exhibit 1: Hydrography, Orleans and Jefferson Parishes
Exhibit 2: Map of Hydrologic Soil Groups, Orleans and Jefferson Parishes
Exhibit 3: Depth to Water Table, Orleans and Jefferson Parishes
Bayou Land RC&D ix October 2010
LIST OF APPENDICES
Appendix A: Stakeholder Survey Response Summary
Table A-1: Stormwater Management Objectives ........................................................... A-2
Table A-2: BMP Types .................................................................................................. A-4
Table A-3: Potential Constraints for Stormwater BMP Implementation ....................... A-5
Figure A-1: Classification of Survey Respondents ......................................................... A-1
Figure A-2: Rankings of Stormwater Management Objectives ...................................... A-3
Figure A-3: Familiarity Rankings for BMP types ........................................................... A-4
Figure A-4: BMP Constraint Rankings ........................................................................... A-6
Figure A-5: BMP Constraint Frequency in New Developments ..................................... A-6
Figure A-6: BMP Constraint Frequency for Retrofitting BMPs ..................................... A-7
Figure A-7: BMP Constraint Frequency for BMPs Near Buildings................................ A-8
Figure A-8: Stakeholder Rating of Stormwater Pollutant Importance ............................ A-8
Bayou Land RC&D 1-1 October 2010
1 INTRODUCTION
The U.S. Environmental Protection Agency (EPA) has determined that pollution transported in precipitation and runoff from urban and agricultural lands is the primary cause of water quality impairment in the United States (EPA 2000). Urban stormwater runoff collects pollutants as it traverses roofs, sidewalks, driveways, and streets. These pollutants include sediment, nutrients, bacteria, hydrocarbons, metals, pesticides, and trash. The ultimate destination of the contaminated runoff from Orleans and Jefferson Parishes is primarily the Lake Pontchartrain Basin and coastal marshes that are adjacent to much of the urban areas of the Parishes via a system of gutters, storm drains, and canals. Water quality impairments are still occurring in Orleans and Jefferson Parishes even though there has been extensive public education to inform residents and decision-makers about the link between watershed activities and water quality.
Stormwater infrastructure Best Management Practices (BMPs) provide a means by which the watersheds of the Orleans and Jefferson Parishes could be enhanced to improve water quality, reduce runoff volumes and sediment/debris that can impair flood conveyance, and improve water quality. Stormwater infrastructure BMPs include such techniques as biofilters, vegetated detention basins, urban greenways, street trees, modular marshes, rain gardens, porous concrete, bioswales and cisterns for harvest and use of stormwater which can be integrated into publicly-owned land and public street rights-of-way. At an individual site, the positive impact of BMPs on water quality/quantity may be small relative to a watershed, but the impacts can be significant when many of them are aggregated across neighborhoods and watersheds. Quantitatively, they can reduce runoff volumes and rates, depending on underlying soils for infiltration and the amount of evapotranspiration that can be achieved, which in turn can reduce downstream pumping and/or treatment costs. They also can reduce pollutant loads and concentrations to receiving waters in separated systems. This includes reducing sediments and debris that can either reduce conveyance or hamper pumping operations. Qualitative benefits can include passive and active recreation opportunities, improved resiliency to flooding and climate change, and overall improved quality of life. In fact, many United States Cities such as Austin, Texas, Washington, D.C., Portland, Oregon, and Seattle, Washington recognize the value of BMPs as a community enhancer and now have “Green Streets” programs that direct public investment to green infrastructure on public streets as well as encouraging them on privately built streets.
Orleans and Jefferson Parishes have some attributes that differ significantly from the above cities, including consistently high groundwater tables, an extensive stormwater collection system that relies on pumping systems, and relatively challenging soils for infiltration throughout the two parishes. The ongoing reconstruction process in these parishes provides an opportunity to not only integrate BMPs into the major reconstruction of damaged neighborhoods, but also to retrofit existing stormwater conveyance systems with improved treatment and volume control functions.

Bayou Land RC&D 1-2 October 2010
1.1 Purpose and Scope
In the absence of a guidance tool that adequately addresses the application and effectiveness of stormwater BMPs in our unique watersheds, Orleans and Jefferson Parishes must instead rely on ad hoc approaches. A standardized and strategic approach to BMP selection and design can improve stormwater quality, reduce runoff, reduce the urban heat island effect, and improve air quality. Stormwater BMPs provide a means by which public monies can strategically target stormwater runoff within the urban watershed and closer to the source than conventional stormwater treatment techniques. However, BMP approaches are often rejected or avoided by local public agencies and design professionals because of the limited track record and performance data for these techniques in southern Louisiana as well as the fact that these techniques require more sophisticated tools for assessing their performance than do the traditional stormwater conveyance methods. Furthermore, little technical guidance is available at the local level to assist Louisiana communities in adopting, developing, and building effective BMP programs, especially in urbanized watersheds. A stormwater infrastructure BMP guidance tool will allow Orleans and Jefferson Parishes to better capitalize on opportunities to improve the watersheds through current and future public-realm capital improvement projects.
The goal of this manual is to provide a technically-based tool that can support the systematic implementation of BMPs in Orleans and Jefferson Parishes and in other urbanized watersheds. Supporting objectives include:
1. To propose a standardized process by which BMPs design approaches are integrated into public right-of-way projects.
2. To establish a strategic rationale for applying BMPs in urbanized and redeveloping Orleans and Jefferson Parish watersheds.
1.2 Stormwater Management Background and Benefits
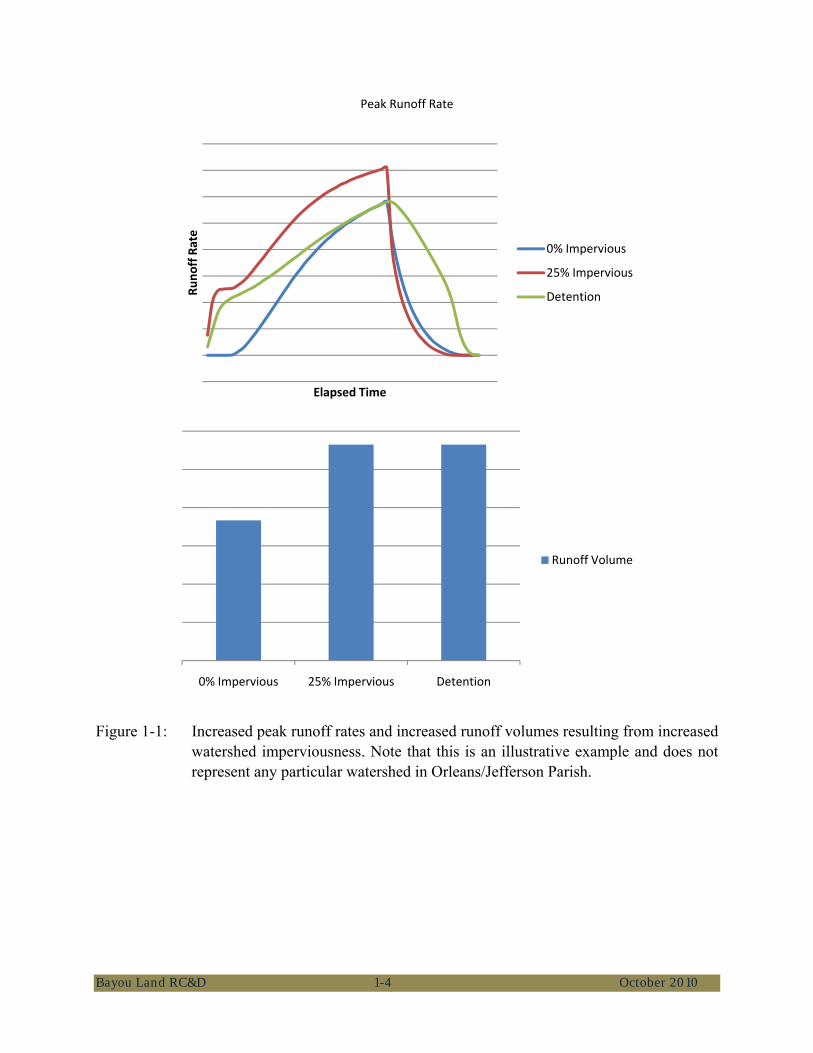
The historical approach to stormwater management primarily consisted of trying to convey stormwater away from populated areas as quickly as possible. The goal was not to prevent runoff, but rather to encourage the rapid transfer of runoff from populated areas to receiving streams. As more of the watershed gets paved over, less rainfall can infiltrate into the ground resulting in increased runoff rates and runoff volumes as shown in Figure 1-1.
In Figure 1-1 the line labeled “0% Impervious” represents the runoff in an undeveloped condition (0% impervious areas). As development increases, so does the fraction of the watershed that is impervious. The line labeled “25% impervious” represents a developed condition where the impervious areas are a combination of roofs, streets, parking lots, and sidewalks. The increase in impervious areas between the undeveloped and developed conditions results in an increased peak flow (in this case the peak flow was increased by 20%). The increase in impervious areas also increases the volume of runoff (in this case the runoff volume was
Bayou Land RC&D 1-3 October 2010
increased by 35%). While the curves presented in Figure 1-1 are generic and do not represent any specific watershed, the relationship between increased runoff rates and volumes as a function of increasing watershed imperviousness is well established.
The increases in peak runoff rate result in larger and more expensive infrastructure to convey the water away from developed areas and peak runoff rates result in stream bank erosion in receiving streams. Detention basins are often used to reduce peak flow to pre-development rates. The line labeled “detention” in Figure 1-1 shows that a properly sized detention basin can limit runoff rates to pre-development values. However, the outflow from most detention basins remains higher than the undeveloped rate for a long time. The longer duration of high flow can still cause stream bank erosion. The problem of stream bank erosion has historically been addressed by lining natural ditches and canals with concrete. The concrete channels prevent erosion, but do little to limit flooding as the receiving streams back up with increased runoff volumes.
While the use of detention basins and concrete-lined channels was an attempt to address the hydraulic impacts of urbanization and increased imperviousness, the environmental impacts of increased imperviousness remain. Increased stormwater runoff rates and volumes result in the following:
• Increased sediment, nutrient, bacteria, and other toxic contaminant concentrations in receiving waters (i.e., local canals, Lake Pontchartrain, coastal watersheds, and the Gulf of Mexico);
• Decreased wet season groundwater recharge into streams (i.e., baseflows) due to decreased infiltration; and
• Increased receiving body temperature due to runoff warmed by impervious surfaces decreases the dissolved oxygen concentration in receiving bodies and makes the receiving bodies inhospitable to some aquatic life.
Stormwater is not typically intentionally treated in a wastewater treatment plant. All stormwater runoff that drains into streets and enters storm drains directly contributes to nonpoint sources of water pollution. However, designing a site to utilize its natural hydrologic features to reduce the generation of runoff volume, discharge rate, and pollutants and to decentralize the hydrologic controls and treatment systems that handle the runoff can greatly improve water quality and reduce flooding. Combining site design techniques that mimic natural hydrology with smaller systems distributed throughout an area allows for maximum treatment, infiltration, storage, and evapotranspiration of runoff.
It is important to note that the BMPs discussed in this manual cannot prevent flooding during major storm events and will not eliminate the need for the existing canal structures. However, the proper BMP design, location, selection and maintenance can greatly reduce the frequency of street flooding during routine storm events while simultaneously improving water quality in the receiving water bodies of Orleans and Jefferson Parishes.
Bayou Land RC&D 1-4 October 2010
Peak Runoff Rate
Figure 1-1: Increased peak runoff rates and increased runoff volumes resulting from increased watershed imperviousness. Note that this is an illustrative example and does not represent any particular watershed in Orleans/Jefferson Parish.
Runo
ff Rate
Elapsed Time
0% Impervious
25% Impervious
Detention
0% Impervious 25% Impervious Detention
Runoff Volume

Bayou Land RC&D 2-1 October 2010
2 PROJECT OBJECTIVES AND CONSTRAINTS
This section discusses the potential objectives of stormwater management in terms of hydrology and hydraulics. Constraints in terms of physical, cost, public acceptance, and regulatory constraints are then discussed. Both the objectives and constraints should be identified early in the design process to eliminate BMPs that cannot, or should not, be used to meet the project objectives. Section 5 contains a decision support tool based on the objectives and constraints presented here as well as on the strengths and weaknesses of the BMPs discussed in Section 3.
2.1 Project Objectives
Three general project goals should guide efforts to reduce the potential impacts of stormwater runoff. More specific techniques will be discussed in subsequent chapters though a combinations of site-design and structural BMP implementations that are tailored to:
• Manage stormwater at the source and on the surface. As soon as rainfall lands on a street, roof, or parking lot, direct it to a nearby location where it can be stored or infiltrated into the ground, such as roadside right-of-ways, lawns, or building landscaping;
• Use plants and soil to absorb, slow, filter, and cleanse runoff. Let nature do its work; and
• Design stormwater facilities that are simple, cost-effective and enhance community aesthetics.
With these goals in mind, specific project objectives can be developed that focus on the following elements:
• Hydrology and hydraulics;
• Pollutants of concern;
• Site design considerations or physical constraints;
• Cost constraints;
• Public acceptance constraints; and
• Regulatory constraints.
Bayou Land RC&D 2-2 October 2010
2.1.1 Hydrology and Hydraulics
A healthy, undisturbed landscape acts like a sponge by capturing, absorbing, and slowing the flow of water from the moment a raindrop lands on the ground. Urban development has dramatically impacted natural hydrologic systems by reducing the landscape’s absorptive capacity and introducing pollutants.
When the natural landscape is urbanized, impervious surfaces are created that prevent water from being absorbed at the source. Sediments and pollutants from streets, parking lots, homes, yards, and other sources are washed into pipes and water bodies. Stormwater runoff increases as more and more impervious surfaces are created. The high volume and velocity of stormwater runoff emptying into creeks and streams may cause flooding and erosion, destroying natural habitat.
Infrastructure can be designed to minimize its impact on natural drainage systems. Infrastructure can be designed to minimize the impact of development on natural drainage systems by capturing, slowing, and absorbing stormwater, as well as filtering the pollutants that urban development introduces.
Flow Reduction Objective
Stormwater facilities should slow the velocity of runoff by detaining stormwater in the landscape. Flow rate reduction can often be achieved by integrating distributed and/or regional detention facilities (such as stormwater ponds, pervious paving, planter boxes, cisterns, swales, and rain gardens) into a site’s stormwater conveyance system. Most stormwater BMPs provide some flow attenuation, but these facilities typically cannot completely replace flood control infrastructure that is designed to attenuate infrequent large storms (e.g., > 25 year return periods). Stormwater BMPs designed for water quality and flow duration control can often be designed to match pre-development flow rates for return periods less than 10-years.
By detaining and delaying runoff, peak flow rates are attenuated thereby reducing downstream flooding and erosion. Conveying runoff through a system of BMPs mimics the natural hydrologic cycle and minimizes the need for underground drainage infrastructure.
The BMP quick reference guides in Section 3 describe the ability of various BMPs to meet the above hydrologic goals. If these goals are part of the stormwater management goals at the site, then the BMPs that have a “high” rating in the quick reference guide should be retained for further evaluation.

Bayou Land RC&D 2-3 October 2010
Volume Reduction Objective
Whenever possible, facilities should collect and absorb stormwater to reduce the overall volume of runoff to the maximum extent practicable. A number of cities in the United States require the collection of a specific volume of runoff such as the first inch of rainfall. Other cities require that the volume of runoff following construction should not exceed the volume of runoff in the pre-construction state. While these rules are appropriate for new developments, such specific criteria are difficult, and sometimes impossible, to implement in the redevelopment of a highly urbanized area such as Orleans and Jefferson Parishes. There is simply not enough space that can be devoted to BMP installation. A reasonable minimum goal for volume reduction would be to match the average annual predevelopment evapotranspiration volume for the site.
By integrating low impact development (LID) site design principles and localized stormwater management techniques into redevelopment projects, it is possible to minimize the contribution of site runoff to flooding while protecting receiving waters. Limited natural drainage and open spaces may be present within urban areas though they likely are not completely absent. Effectively applying site runoff design planning techniques where opportunities present themselves during retrofit or large scale redevelopment will help generate a more hydrologically functional site.
Several of the BMPs presented in Chapter 3 can be used to meet volume reduction goals. Additionally, plants and trees contribute to retention capacity by intercepting rainfall, taking up water from the soil and transpiring it, and assisting with infiltration by maintaining soil porosity and preferential flow paths along stalks and roots. Volume reduction does not require stormwater facilities to be extremely deep. In fact, it is usually best to employ a highly integrated and interconnected system of shallow stormwater BMPs.
2.1.2 Pollutants of Concern
Urban runoff has the potential to contribute pollutants, including suspended solids/sediment, nutrients, metals, microbial pathogens, oil and grease, toxic organic compounds, and trash and debris to receiving waters. In the following sections, pollutants are grouped into seven general categories for the purposes of identifying receiving water pollutants of concern and selecting appropriate structural and source control BMPs for new development and reconstruction projects.
Suspended Solids/Sediment
Suspended solids/sediment consists of soils or other surficial materials that are eroded and deposited by the action of wind, water, or gravity. Excessive sediment can increase turbidity, clog fish gills, reduce spawning habitat, lower survival rates, smother bottom dwelling organisms, and suppress aquatic vegetation growth. The sediments can also settle out in conveyance systems decreasing the capacity of the conveyance, damaging pump facilities,

Bayou Land RC&D 2-4 October 2010
and increasing maintenance requirement frequencies. The largest source of suspended solids/sediment is typically erosion from disturbed soils. However, for urban storm sewer systems the majority of the sediment load may be decaying trash and leaf debris, as well as atmospheric and automotive dust. Consequently, sediment in urban runoff often contains a variety of pollutants that are solid particulates or have a high affinity for binding to organic materials.
Nutrients
This category includes the macro-nutrients nitrogen and phosphorus. Macronutrients commonly exist in the form of mineral salts dissolved or suspended in water and as particulate organic matter transported by stormwater. Excessive discharge of nutrients to water bodies and streams can cause eutrophication, including excessive aquatic algae and plant growth, loss of dissolved oxygen, release of toxins in sediment, and significant swings in pH. Primary sources of nutrients in urban runoff are fertilizers, trash and debris, and eroded soils. Urban areas with improperly managed landscapes can be substantial sources.
Metals
Certain metals are toxic to aquatic life. Metals of concern include cadmium, chromium, copper, lead, mercury, and zinc. Lead and chromium have been used as corrosion inhibitors in primer coatings and are also raw material components in non-metal products such as fuels, adhesives, paints, and other coatings. Copper and zinc are typically associated with galvanized metal, ornamental copper, and automotive products including tires and brake pads. Environmental concerns regarding the potential for the release of metals to the environment have already led to restricted metal usage in certain applications. The primary source of metals in urban stormwater is typically commercially available metal products and automobiles.
Microbial Pathogens (Bacteria and Viruses)
Bacteria and viruses are ubiquitous microorganisms that thrive under a range of environmental conditions. Water containing excessive pathogenic bacteria and viruses can create a harmful environment for humans and aquatic life. The source of pathogenic bacteria and viruses in urban runoff is typically associated with the transport of animal or human fecal wastes from the watershed and particularly from sanitary sewer overflows, but pathogenic organisms do occur in the natural environment.
Oil and Grease
Oil and grease are characterized as high-molecular weight organic compounds. Elevated oil and grease content can decrease the aesthetic value of the water body, as well as the water quality. Primary sources of oil and grease are leaky automotive fluids and illicit storm drain discharges of esters, oils, fats, waxes, and high molecular-weight fatty acids.
Bayou Land RC&D 2-5 October 2010
Toxic Organic Compounds
Organic compounds (pesticides, solvents, hydrocarbons) at toxic concentrations constitute a hazard to humans and aquatic organisms. Sources of organic compounds include landscape maintenance areas, vehicle maintenance areas, waste handling areas, and potentially many other urban and industrial areas.
Trash and Debris
Trash (such as paper, plastic, and various waste materials) is a general waste product that can be found throughout the urban landscape. Debris includes waste products of natural origin which are not naturally discharged to water bodies (such as landscaping waste, woody debris, etc.) The presence of trash and debris may have a significant impact on the recreational value of a water body and upon the health of the aquatic environment.
Expected Pollutants from Project Components
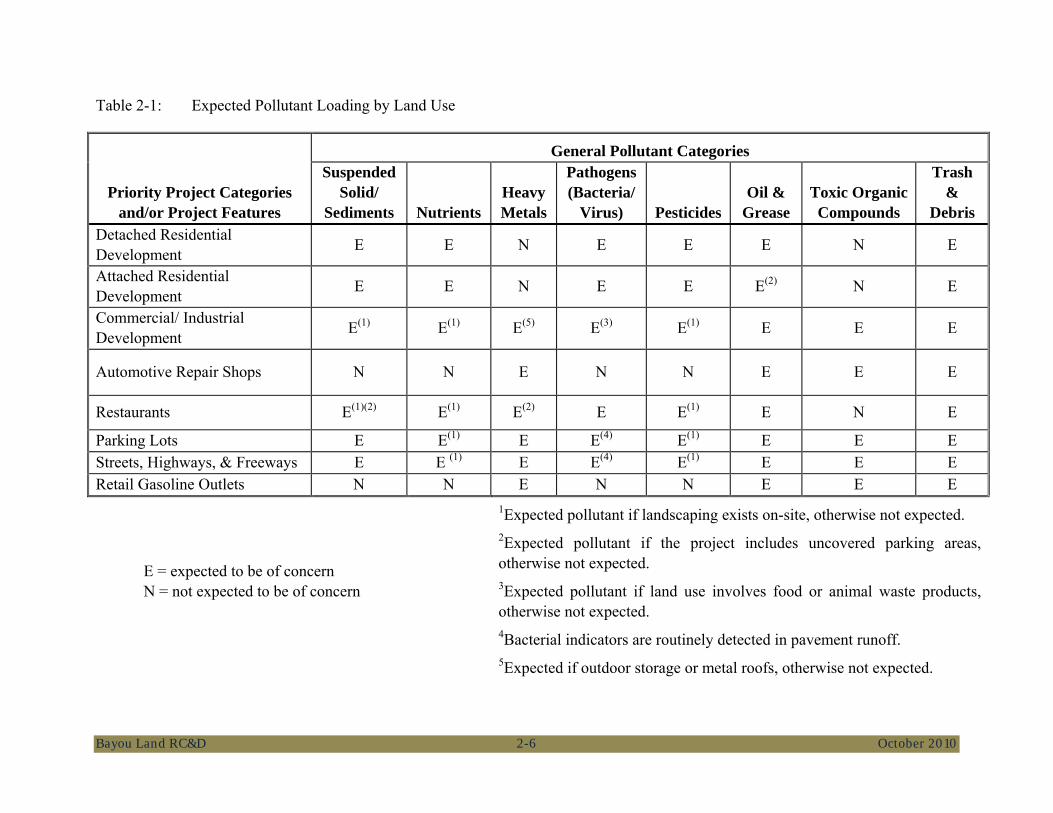
Pollutants that are expected to be generated or have a potential to be generated from a project may be identified using Table 2-1. Site-specific conditions should also be considered for potential pollutant sources, such as legacy pesticides or nutrients in site soils as a result of past agricultural practices, or hazardous materials in site soils from industrial uses. Hazardous materials that have been remediated and do not pose a current or future threat to stormwater quality are not considered a pollutant of concern.
Primary Pollutants of Concern (POC) are any pollutants anticipated to be generated by the project using Table 2-1. Regionally specific determination of POC should also include determining whether a project’s receiving water body has been included on LDEQ Section 303(d) list - a list of impaired water bodies.
Bayou Land RC&D 2-6 October 2010
Table 2-1: Expected Pollutant Loading by Land Use
Priority Project Categories and/or Project Features
General Pollutant Categories Suspended
Solid/ Sediments Nutrients
Heavy Metals
Pathogens (Bacteria/
Virus) Pesticides Oil &
Grease Toxic OrganicCompounds
Trash &
Debris Detached Residential Development E E N E E E N E
Attached Residential Development E E N E E E(2) N E
Commercial/ Industrial Development E(1) E(1) E(5) E(3) E(1) E E E
Automotive Repair Shops N N E N N E E E
Restaurants E(1)(2) E(1) E(2) E E(1) E N E
Parking Lots E E(1) E E(4) E(1) E E E Streets, Highways, & Freeways E E (1) E E(4) E(1) E E E Retail Gasoline Outlets N N E N N E E E
E = expected to be of concern N = not expected to be of concern
1Expected pollutant if landscaping exists on-site, otherwise not expected. 2Expected pollutant if the project includes uncovered parking areas, otherwise not expected. 3Expected pollutant if land use involves food or animal waste products, otherwise not expected. 4Bacterial indicators are routinely detected in pavement runoff. 5Expected if outdoor storage or metal roofs, otherwise not expected.
Bayou Land RC&D 2-7 October 2010
2.2 Physical Constraints
Primary factors to consider when evaluating the feasibility of site design and stormwater BMPs include space, existing infrastructure, groundwater and soils, and slopes. These factors assist in the “fatal flaw” analysis of various project alternatives given a particular urban environment. For example, a surface retention BMP option may be rejected if insufficient space is available to cost-effectively implement the practice. Similarly, an infiltration-based BMP may be rejected if the soil or groundwater conditions are not conducive to infiltration.
2.2.1 Space Availability
Most LID controls and site design practices are either physically located on a piece of land or influence the way a piece of land is used. In both cases, space is required to varying degrees depending on the application in question.
Space requirements are based on the amount of surface or subsurface area required to treat or control runoff with a BMP and the ability of that practice to be incorporated into existing structures or infrastructure. For instance, practices that detain without significantly infiltrating or evapotranspiring runoff (e.g., constructed wetlands) are on the high end of space requirements and practices that pass without significantly detaining runoff (e.g., filter strips) are on the low end of space requirements. Practices that combine detention, infiltration, and/or evapotranspiration and can be incorporated into existing landscaped areas are on the medium end of space requirements. Space constraints cannot be avoided all together, however treatment trains with upstream components that reduce peak flows and volumes may reduce the overall space requirements of a system if they “meter” flow to the downstream practice. An additional consideration related to space availability is buildable area. A porous pavement parking lot takes up no more room than a parking lot made from traditional concrete. Similarly, a vegetated swale takes up minimal buildable space if it replaces necessary surface or subsurface drainage features.
2.2.2 Soils
Soil is an integral part of the hydrologic cycle, as it regulates the processes of surface runoff, infiltration and percolation, and is a major controlling factor in evapotranspiration through the capacity of the soil to store and release water. The characteristics of soils at any particular site should be carefully considered during the development of stormwater management strategies for the following reasons:
• Runoff volumes and flow rates can be reduced through infiltration and storage in the pore space of the soil substrata; and
• Pollutants can be removed from the water column via sorption to soil particles.
Bayou Land RC&D 2-8 October 2010
The ability of surface soil layers to infiltrate and their capacity to store stormwater are important modeling and design parameters that are usually represented by the two respective soil properties: the hydraulic conductivity and the storage capacity. A map of hydrologic soil groups with an associated table of typical hydraulic conductivities and porosities can be found in Exhibit 1. Most of the soils in the Orleans/Jefferson Parish area are classified as Hydrologic Soil Group C or D. Unfortunately, these soils have limited ability to infiltrate stormwater. As such, BMPs in these areas will likely require alternative outlets, such as underdrains, to prevent the BMP from remaining saturated with water. Although the use of underdrains limits the volume reduction of these BMPs, it does alter the timing and rate of stormwater discharge to the storm sewer system and will help reduce the occurrences of flooding resulting from large volumes of water simultaneously reaching the storm sewer system.
The hydraulic conductivity (a.k.a coefficient of permeability) is the rate at which water flows through the soil pore structure, given as a velocity (e.g., in./hr, mm/day, gal/ft2-day). It is a function of the porosity (volume of voids to total volume of soil), the connectivity of the pore spaces, the degree of saturation, the chemistry and temperature of the pore fluids, and the hydraulic gradient in unsaturated soils.
One measure of water storage capacity is the field capacity, the maximum fraction of soil water (volume of water to volume of soil) that can be held in the pore spaces under the action of gravity. It is primarily a function of the porosity, temperature, and organic content of the soil. A lower bound on water storage is the wilting point, the soil water fraction at which plants can no longer extract water for transpiration. The hydraulic conductivity, porosity, and field capacity, as well as the antecedent moisture condition (degree of saturation) at the onset of a rainfall-runoff event, are the most commonly needed factors for continuous simulation and mass-balance modeling. However depending on project objectives and the treatment system type, some of these factors may not have a direct impact on design. It is important to note that soil characteristics may limit the effectiveness or preclude the implementation of infiltration BMPs due to low hydraulic conductivity or shallow groundwater table, as described below.
A local map of NRCS hydrologic soil groups with an associated table of typical hydraulic conductivities and porosities is provided as Exhibit 2. As shown on the map, the soils in the New Orleans area have very low hydraulic conductivities (primarily hydrologic soil Groups C and D). However, this map should only serve as a general guide because soils can be highly heterogeneous. A site specific soils investigation should be conducted to fully evaluate the feasibility of infiltration at a site. In most cases, small scale infiltration facilities (e.g., rain gardens, stormwater planters, infiltration trenches, etc.) can still be effective at reducing runoff volumes even when native soils have low permeabilities. Local soils may be amended and/or subsurface pore storage may be provided within a gravel layer beneath an underdrain.
Bayou Land RC&D 2-9 October 2010
2.2.3 Groundwater
Groundwater is an important element in the hydrologic cycle. For many areas, the majority of groundwater originates from the infiltration of precipitation after the water has passed through the vadose (unsaturated) zone, while in other areas the groundwater is also transported laterally from adjacent lands. As the infiltrated water moves downward, losses may occur due to evaporation, plant transpiration, soil storage, and interflow. During long periods of dry weather, groundwater is generally responsible for baseflow in rivers, canals, sewer systems, and stormwater drainage systems especially in shallow groundwater regions like New Orleans. A map of seasonal high groundwater depths for Orleans and Jefferson Parishes is provided in Exhibit 3.
The depth to groundwater is an important factor when considering water quality, as well as soil properties that govern infiltration of surface water. Information such as distance between the ground surface and the groundwater table, depth and direction of groundwater flow, seasonal groundwater variation, regional geology, and the slope of the water table are important factors to consider when evaluating a potential stormwater infiltration site. The groundwater properties can be coupled with other information such as location of production wells and the use of pumped water to determine the water quality impact potential. Infiltration parameters such as hydraulic conductivity and porosity are a function of regional geology and soil conditions, which can vary greatly from location to location. When stormwater is infiltrated as a means of disposal, there is always a potential for groundwater contamination, especially if the water table is near the ground surface. The soil infiltration properties, groundwater use, and groundwater flow characteristics must all be considered when infiltrating stormwater to ensure that the water quality of the groundwater resource is not negatively impacted.
2.2.4 Existing Infrastructure
Existing infrastructure plays a significant role in determining BMP’s feasibility given proximity to storm drain systems, available pervious area, proximity to existing structures, and proximity to existing utilities. Each of these constraints is further described below.
Proximity to Storm Drainage System
Stormwater management controls with concentrated influent and effluent streams should ideally be located close to the drainage system as to minimize piping costs, reduce chances for utility conflicts, minimize disturbed areas and cut construction times. Facilities that require conveyance of flows to and from the site (e.g., swales, wet ponds, etc.) are considered highly susceptible to this constraint, facilities that only require conveyance in one direction (e.g., bioretention, infiltration practices, cisterns, etc) are considered to have a moderate level of susceptibility to this constraint, and facilities that require no conveyance to or from the site are considered to have a low level of susceptibility (e.g., porous pavement).
Bayou Land RC&D 2-10 October 2010
Available Pervious Area
There are several types of pervious areas in the urban environment that may be used for stormwater treatment. Several stormwater BMPs largely depend on infiltration and therefore require permeable sites in order to function properly. Controls that depend primarily on infiltration (porous pavement) are considered highly vulnerable to this constraint while controls that do not infiltrate or can function in low infiltration areas (bioswales for example) are considered to have a low level of susceptibility to this constraint. For sites with low impervious area fractions, new pervious areas may be created by removing impervious surfaces. For sites with compacted soils or soils with naturally poor permeability, over-excavating and backfilling with a more permeable substrate can increase the capacity of the system by increasing subsurface storage available and the overall permeability of the system.
Proximity to Existing Structures/Infrastructure
One of the primary drivers for selecting and sizing a BMP for a site is the existing infrastructure. Concern over the structural integrity of building foundations, roadways, bridge abutments, and retaining walls may discourage the use of certain stormwater practices, particularly those that depend exclusively on infiltration. However, any practice that holds water next to a structure may impact its integrity. High moisture levels can adversely affect building foundations in a number of ways. Retaining walls are often designed with weep holes to prevent water buildup and avert failure due to high hydrostatic pressures.
Aside from structural damage, stormwater BMPs may impact the functionality of existing structures. For instance, tall trees may obscure traffic signs and obstruct road visibility in corners; or wetlands sited near airports may increase bird populations, which may be undesirable for the safe operation of flights. BMPs that impact the functionality of existing structures or infrastructure directly or indirectly are considered to have a medium impact with respect to this constraint, while BMPs with no perceivable impacts are considered as low impact controls.
Utility Conflicts
Utilities such as gas lines, water lines, electricity, telephone, and optical cables are often located underground. In some areas telecommunication and electricity lines are located overhead. Construction activities that involve excavation and/or the use of large construction of the equipment must be carefully planned and executed to avoid costly damage to overhead or underground utilities. Damage to overhead utilities can occur irrespective of the stormwater control being implemented. However, damage to underground utilities during excavation is the highest risk.
Bayou Land RC&D 2-11 October 2010
2.2.5 Surface Slopes and Vertical Relief
BMPs that depend on the transportation of the effluent and/or the influent flows from a different location through pipes or open channels can be restricted by the prevailing slope and elevation differences between the source, the BMP and the receiving water body. A slope that is too mild may cause ponding and backwater effects, which in turn may cause premature sedimentation and clogging of inlet pipes or other conveyances to the BMP. A slope that is too large may cause scour at the inlets and outlets of a facility. Typically, given adequate vertical relief most designs may be modified to compensate for less than perfect site slopes through grading and excavation or by utilizing modifications such as check dams and energy dissipaters. Stormwater drainage systems typically rely on gravity rather than pumps to convey water to and from the various components of a system.
2.3 Cost Constraints
Cost is an important constraint for the implementation of stormwater BMPs. Cost estimation is often difficult because of a number of factors including:
• Lack of accurate current construction data;
• Site variability makes construction cost data less applicable across different sites;
• Unforeseen site constraints, particularly during retrofit situations, including subsurface conflicts, space constraints, site accessibility, obstructions, safety and security;
• Regional and local variations in design, price of materials and labor rates;
• Differences and quality and competency of planners, designers and contractors;
• Changes in inflation and macro economic conditions at the time of construction;
• High cost of engineering, permitting and construction management; and
• Construction related issues such as change orders, accelerated construction schedules, unsuitable designs, and the use of non-standard components.
There are several categories of costs related to BMP design, implementation and operation including the capital cost (which includes construction and permitting costs), operating cost, minor routine maintenance cost, and major maintenance cost. Capital, operating and maintenance costs go into the calculation of whole life cycle cost which is an estimate of the cost of treatment for a fixed number of years. Whole life cycle costs are useful for performing cost benefit analysis for the purposes of selecting economical BMPs.
Bayou Land RC&D 2-12 October 2010
2.3.1 Capital Cost (Construction and Permitting)
Capital costs are the expenses incurred in the initial implementation of a BMP such as land, labor, equipment, materials, construction, landscaping, etc. Capital costs also include the professional and technical services that are needed for the design, permitting and construction of the BMP. Capital costs do not include any of the expenses related to the operation and maintenance of a BMP.
Land acquisition and construction costs are highly variable and depend on a host of factors including site conditions and the size and complexity of the facility being constructed. Design/engineering and permitting costs are typically more predictable and are often orders of magnitude lower than construction costs.
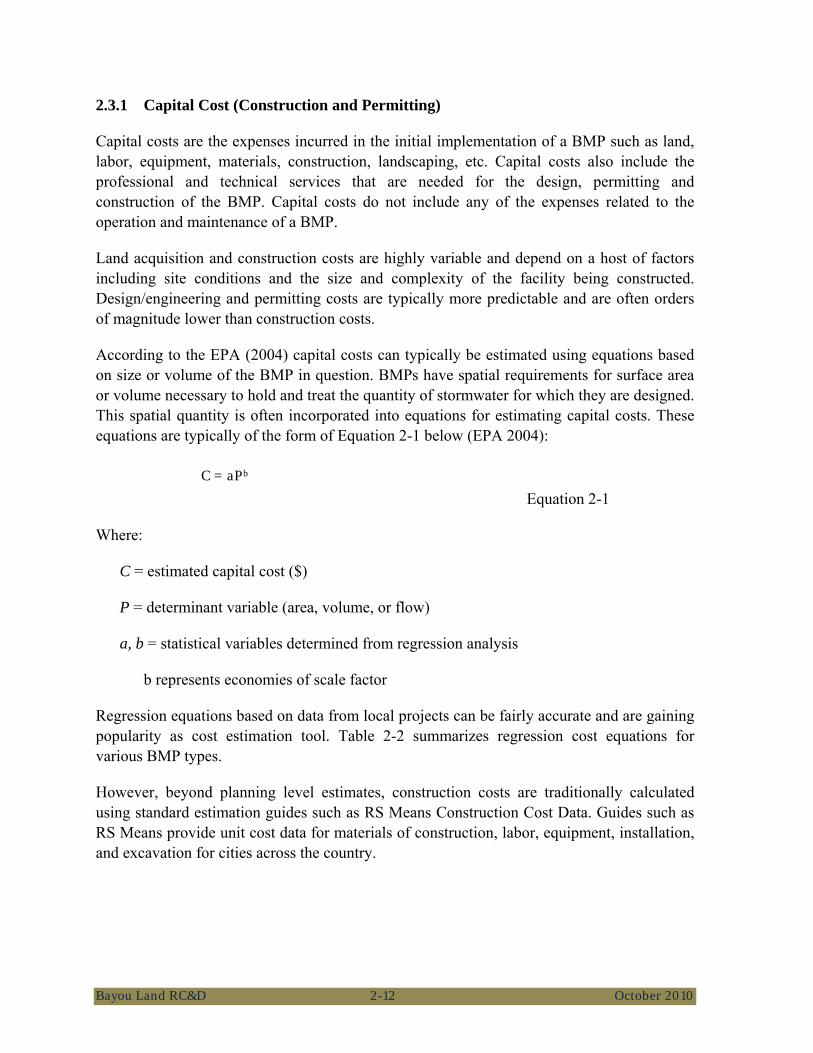
According to the EPA (2004) capital costs can typically be estimated using equations based on size or volume of the BMP in question. BMPs have spatial requirements for surface area or volume necessary to hold and treat the quantity of stormwater for which they are designed. This spatial quantity is often incorporated into equations for estimating capital costs. These equations are typically of the form of Equation 2-1 below (EPA 2004):
Equation 2-1
Where:
C = estimated capital cost ($)
P = determinant variable (area, volume, or flow)
a, b = statistical variables determined from regression analysis
b represents economies of scale factor
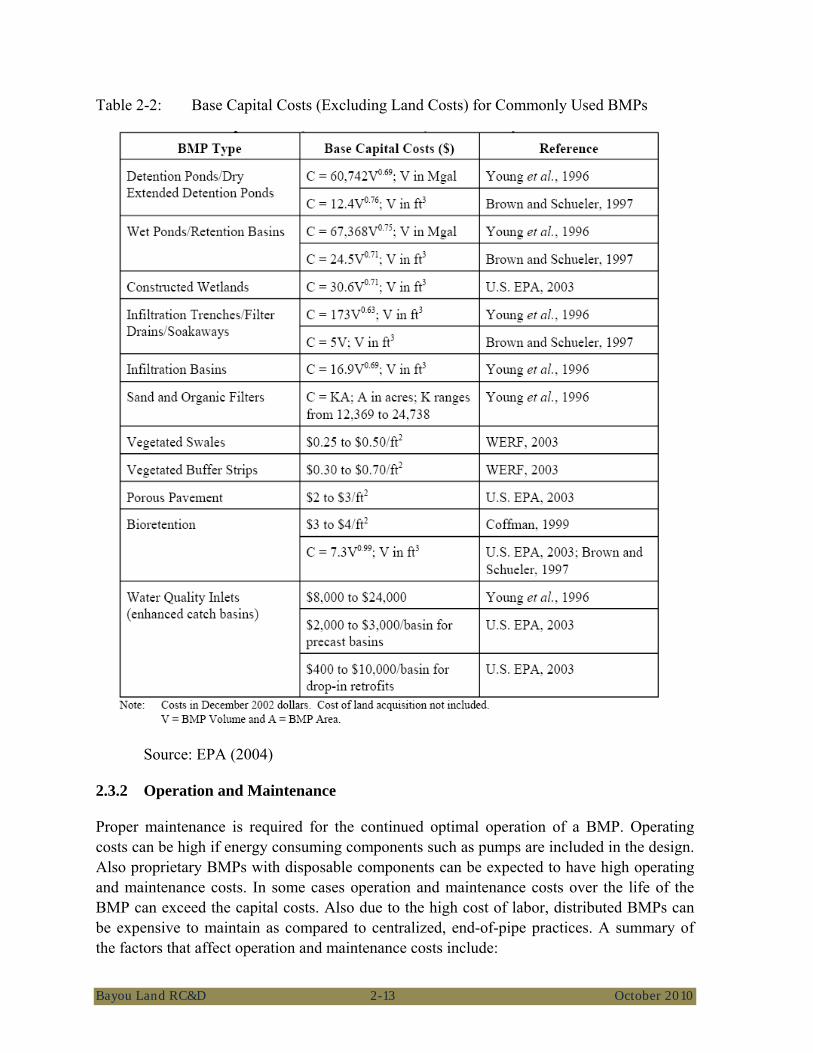
Regression equations based on data from local projects can be fairly accurate and are gaining popularity as cost estimation tool. Table 2-2 summarizes regression cost equations for various BMP types.
However, beyond planning level estimates, construction costs are traditionally calculated using standard estimation guides such as RS Means Construction Cost Data. Guides such as RS Means provide unit cost data for materials of construction, labor, equipment, installation, and excavation for cities across the country.
C = aPb
Bayou Land RC&D 2-13 October 2010
Table 2-2: Base Capital Costs (Excluding Land Costs) for Commonly Used BMPs
Source: EPA (2004)
2.3.2 Operation and Maintenance
Proper maintenance is required for the continued optimal operation of a BMP. Operating costs can be high if energy consuming components such as pumps are included in the design. Also proprietary BMPs with disposable components can be expected to have high operating and maintenance costs. In some cases operation and maintenance costs over the life of the BMP can exceed the capital costs. Also due to the high cost of labor, distributed BMPs can be expensive to maintain as compared to centralized, end-of-pipe practices. A summary of the factors that affect operation and maintenance costs include:
Bayou Land RC&D 2-14 October 2010
• Use of energy consuming components such as pumps;
• Use of disposable components such as cartridges and sorbent pads;
• Locality of BMPs and level of distribution of treatment system components; and
• Overlap of BMP maintenance and other site maintenance practices such as landscaping.
2.3.3 Whole Life Cycle Costs
Whole life cycle costs can be used as selection criteria for evaluating BMP alternatives. Representing a combination of the capital and O&M cost over the long term, whole life cycle cost provides a better indication of the true cost of implementing a BMP and is therefore suited to comparing BMPs on the basis of cost. Standard economic tools can be used to calculate the net present value from projected capital and O&M costs.
2.4 Public Acceptance Constraints
Well designed and maintained BMPs can enhance the aesthetics of the neighborhoods where they are installed. The aesthetic appeal of open water areas or nicely vegetated areas is a well known fact. However, poorly designed and maintained ponds can develop unpleasant odors, breed vectors and/or lower neighboring property values. Public acceptance is a performance metric for BMPs depends on the following:
• Aesthetics including visual appeal and the absence of odors;
• Public safety related to the potential of the BMP becoming a drowning hazards, becoming a breeding ground for vectors or promoting noxious weeds/vegetation;
• Recreation value (e.g., multiple use facilities); and
• Educational value.
2.5 Regulatory Constraints
A number of federal, state and local regulations may govern pollutants of concern and may one day dictate the process of BMP implementation and permitting. The following sections provide a brief description of some of these regulations that apply to the Orleans and Jefferson Parish areas. In addition to the regulations described below, local zoning and construction ordinances may also apply to a particular site.
Bayou Land RC&D 2-15 October 2010
2.5.1 Federal Regulations
In 1972, the Federal Water Pollution Control Act [later referred to as the Clean Water Act (CWA)] was amended to require National Pollutant Discharge Elimination System (NPDES) permits for the discharge of pollutants to waters of the United States from any point source. In 1987, the CWA was amended to require that the EPA establish regulations for permitting of municipal and industrial stormwater discharges under the NPDES permit program. The EPA published final regulations regarding stormwater discharges on November 16, 1990. The regulations require that municipal separate storm sewer system (MS4) discharges to surface waters be regulated by a NPDES permit.
In addition, the CWA requires the States to adopt water quality standards for receiving water bodies and to have those standards approved by the EPA. Water quality standards consist of designated beneficial uses for a particular receiving water body (e.g., wildlife habitat, agricultural supply, fishing etc.), along with water quality criteria necessary to support those uses. Water quality criteria are prescribed concentrations of constituents - such as lead, suspended sediment, and fecal coliform bacteria - or narrative statements which represent the quality of water that support a particular use.
When designated beneficial uses of a particular receiving water body are being compromised by water quality, Section 303(d) of the CWA requires identifying and listing that water body as “impaired”. Once a water body has been deemed impaired, a Total Maximum Daily Load (TMDL) must be developed for the impairing pollutant(s). A TMDL is an estimate of the total load of pollutants from point, non-point, and natural sources that a water body may receive without exceeding applicable water quality standards (with a “factor of safety” included). Once established, the TMDL allocates the loads among current and future pollutant sources to the water body.
Section 319 of the Clean Water Act (CWA) required that the states develop a Non-Point Source Management Plan to reduce and control nonpoint sources of pollution from the various types of land-uses that contribute to water quality problems across the United States. Some of these categories can also be defined as point source discharges and may require an MS4 permit.
2.5.2 State Regulations
The Louisiana Department of Environmental Quality (LDEQ) has been delegated the authority to enforce clean water act regulations by the EPA. The LDEQ has determined that agriculture, forestry, urban runoff, home sewage systems, sand and gravel mining, construction and hydromodification all contribute to nonpoint source pollution problems across the state. Stormwater regulations that are enforceable by LDEQ are codified in Title 33 Part IX, Section 2511 of the Louisiana Administrative Code (LAC). The regulations discussed herein focus on municipal and construction stormwater.
Bayou Land RC&D 2-16 October 2010
The LDEQ regulates stormwater runoff associated with construction activities under two different general permits. General Permit numbers LAR100000 and LAR200000 cover construction activities that disturb greater than 5 acres, and that disturb between 1 and 5 acres, respectively. Construction activities that disturb less than 1 acre and are not part of a larger development do not require a stormwater permit in Louisiana.
The main focus of Construction Stormwater General Permit is pollution prevention through sediment control. Each permit must be accompanied by a Stormwater Pollution Prevention Plan (SWPPP). The SWPPP includes a description of the construction activity, an estimate of the total impacted land area, an estimate of pre- and post-construction runoff, the names of water bodies that will receive construction runoff, and any potential to impact threatened or endangered species, historical sites, and wetlands, along with a detailed description of BMPs that will be used to control runoff from the impacted area.
The BMP section of the SWPPP is the most critical to protecting receiving bodies from degradation due to construction activity. A map of BMP locations is required to show how sediment controls will be placed on the site and the sequence in which they will be implemented. A maintenance and inspection program is also required to ensure proper functioning of the BMPs throughout the construction process. Finally, a stabilization plan must be provided to show how the site will be vegetated following construction prior to the removal of the BMPs.
Municipal stormwater is also regulated by the LDEQ through Municipal Separate Storm Sewer System (MS4) permits. The Sewerage and Water Board of New Orleans, The Louisiana Department of Transportation and Development, The City of New Orleans, the Port of New Orleans, Jefferson Parish, and the Orleans Levee District all share responsibility for the joint MS4 permit in Orleans Parish. Jefferson Parish maintains a separate MS4 permit for drainage that is not commingled with Orleans Parish discharges. The MS4 permit, like the Construction Stormwater General Permit, focuses on stormwater pollution prevention to prevent receiving body degradation and also requires pollutant monitoring at various location throughout the MS4.
Each permittee must contribute to the development and implementation of a comprehensive Stormwater Management Program (SWMP). The SWMP must describe structural controls and operate those controls to prevent pollution. It must describe areas of new development and/or redevelopment and a plan to minimize the impacts of increased water volume and stormwater pollution resulting from that development. It must describe roadway pollution control, the impacts of flood control projects, non-stormwater discharges to the MS4, spill prevention and response plans geared toward minimizing the effects of a chemical spill entering the MS4, public education, and an ongoing monitoring plan.
Bayou Land RC&D 2-17 October 2010
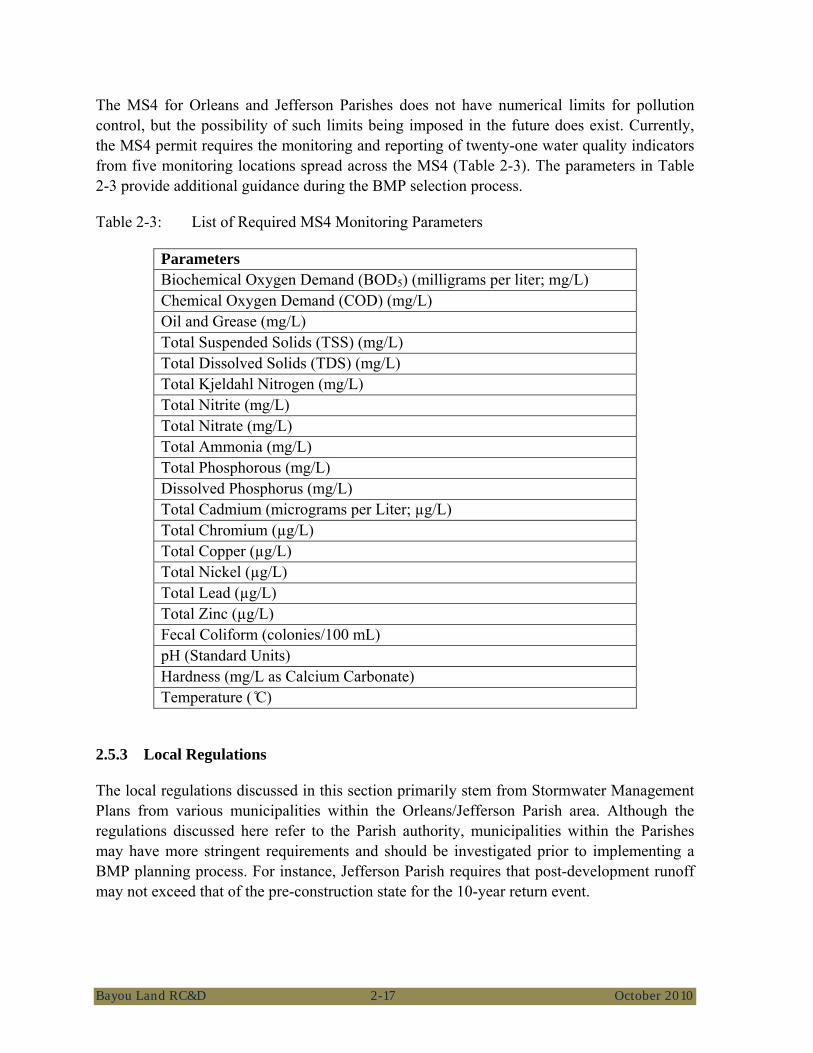
The MS4 for Orleans and Jefferson Parishes does not have numerical limits for pollution control, but the possibility of such limits being imposed in the future does exist. Currently, the MS4 permit requires the monitoring and reporting of twenty-one water quality indicators from five monitoring locations spread across the MS4 (Table 2-3). The parameters in Table 2-3 provide additional guidance during the BMP selection process.
Table 2-3: List of Required MS4 Monitoring Parameters
Parameters Biochemical Oxygen Demand (BOD5) (milligrams per liter; mg/L) Chemical Oxygen Demand (COD) (mg/L) Oil and Grease (mg/L) Total Suspended Solids (TSS) (mg/L) Total Dissolved Solids (TDS) (mg/L) Total Kjeldahl Nitrogen (mg/L) Total Nitrite (mg/L) Total Nitrate (mg/L) Total Ammonia (mg/L) Total Phosphorous (mg/L) Dissolved Phosphorus (mg/L) Total Cadmium (micrograms per Liter; µg/L) Total Chromium (µg/L) Total Copper (µg/L) Total Nickel (µg/L) Total Lead (µg/L) Total Zinc (µg/L) Fecal Coliform (colonies/100 mL) pH (Standard Units) Hardness (mg/L as Calcium Carbonate) Temperature ( ̊C)
2.5.3 Local Regulations
The local regulations discussed in this section primarily stem from Stormwater Management Plans from various municipalities within the Orleans/Jefferson Parish area. Although the regulations discussed here refer to the Parish authority, municipalities within the Parishes may have more stringent requirements and should be investigated prior to implementing a BMP planning process. For instance, Jefferson Parish requires that post-development runoff may not exceed that of the pre-construction state for the 10-year return event.

Bayou Land RC&D 2-18 October 2010
Land use controls via city/parish zoning ordinances are another means of controlling stormwater discharges. Land-use controls involve adoption of a comprehensive and integrated set of environmental restrictions to govern the development process. Typically, a development ordinance is adopted by a community and administered by a planning authority, such as Jefferson Parish or Orleans Parish. This type of ordinance will often mandate a minimum level of environmental site planning during development.
The Jefferson Parish SWMP promotes the following source control methods:
• Identification of possible post-construction outdoor activities that may use or generate concentrated or high-risk pollutants at the site;
• Prohibition of these outdoor activities, where practical;
• Designation of specific areas for activities that must be performed outdoors;
• Installation of structural source controls in designated areas (i.e. covers, enclosures, containment systems, or connections to sanitary sewers); and
• Placement of conditions on the development project for maintaining any of the above areas included. Outdoor activities may include material storage, waste handling, material loading or unloading, vehicle and equipment maintenance, and various specific work tasks typically conducted outdoors.
Both Parishes’ SWMPs advocate treatment controls to address non-point sources of pollutants throughout the drainage area that impact beneficial uses but cannot be effectively controlled at the source (i.e. automobile leaks and air deposition). The SWMPs support integrating treatment controls into the landscaping, drainage and flood control system and other open spaces of development projects and acknowledges that, when properly designed, they can become amenities rather than interferences to development projects. The Jefferson Parish SWMP specifically identifies grass-lined channels (vegetated swales), detention ponds, and baffles to prevent the discharge of floatables.
Finally, the Jefferson Parish SWMP identifies a number of areas where improvement in the urban drainage infrastructure is possible. These areas include modifying zoning ordinances to require greater impervious area on any development/redevelopment site, investigating the use of alternative street paving materials in low-traffic areas to reduce runoff, and modifying the Jefferson Parish Storm Drainage Design Manual to promote the use of detention facilities for redeveloping areas.
Bayou Land RC&D 3-1 October 2010
3 STORMWATER BMP OPTIONS
Each of the following sections describes a stormwater BMP. Section 3.1 contains a description of what are often described as site design BMPs. The remaining sections contain fact sheets for a non-exhaustive list of stormwater BMPs that are capable of meeting urban stormwater management objectives in the Orleans/Jefferson Parish area. These fact sheets contain information regarding typical construction, target pollutants, unit operations and processes, and enhancements that will assist the user in the conceptual model design phase of stormwater planning.
3.1 Site Design BMPs
Site design BMPs are primarily focused on protecting as many natural features of a landscape as possible during the construction phase. The six most common site design BMPs are described in further detail below.
3.1.1 Integrate Natural Drainage Patterns into Site Plan
Most of Orleans and Jefferson Parishes are drained via forced drainage. However, limited natural drainage exists in the outlying areas of these Parishes. Integrating natural drainage patterns into the site plan will help maintain a site’s predevelopment hydrologic function. Restoring and preserving natural drainage paths and depressions will help maintain the site’s pre-development rainfall-runoff response thereby decreasing peak flows and human-generated pollutant loadings. Analysis of the pre-existing site drainage patterns during the project planning phase can help to identify the best locations for buildings, roadways, and vegetated stormwater conveyances.
3.1.2 Protect Existing Vegetation and Sensitive Areas
When planning a site for redevelopment, minimize disturbance of areas containing dense vegetation or well-established trees. Soils with thick, undisturbed vegetation have a much higher capacity to store and infiltrate runoff than do disturbed soils. Reestablishment of a mature vegetative community can take decades. Sensitive areas, such as wetlands, streams, and floodplains should also be avoided.
Vegetative cover can also provide additional volume storage of rainfall by retaining water on the surfaces of leaves, branches, and trunks of trees during and after storm events. On sites with a dense tree canopy this storage can provide additional volume mitigation.
3.1.3 Minimize Impervious Area
One of the principal causes of hydrologic and water quality impacts due to development and redevelopment is the creation of impervious surfaces. Impervious cover can be minimized through identification of the smallest possible land area that requires roofing and pavement
Bayou Land RC&D 3-2 October 2010
as opposed to landscaping. Local laws and ordinances may dictate minimum requirements for road widths or building setbacks that cannot be reduced due to public health and safety concerns.
3.1.4 Disconnect Impervious Areas
Runoff from connected impervious surfaces flows directly to a stormwater collection system with no opportunity for infiltration into the soil. For example, roofs and sidewalks commonly drain onto parking lots, and the runoff is conveyed by the curb and gutter to the nearest storm inlet. Runoff from numerous impervious drainage areas may converge, combining their volumes, peak runoff rates, and pollutant loads. By incorporating small depressions into site grading and routing impervious surface runoff to these locations where permissible, small storm volumes can be retained and the site’s rainfall-runoff response time and peak flows can be reduced.
Disconnecting impervious areas from conventional stormwater conveyance systems allows runoff to be collected and managed at the source or redirected onto pervious surfaces such as vegetated areas. Disconnection practices may be applied in almost any location, but impervious surfaces must discharge into a suitable receiving area for the practices to be effective. Information gathered during the site assessment will help inform the determination of appropriate receiving areas.
Typical receiving areas for disconnected impervious runoff include landscaped areas and/or other BMPs (i.e., filter strips or bioretention). Runoff must not flow toward building foundations or be redirected onto adjacent private properties. Setbacks from buildings or other structures may be required to ensure soil stability.
3.1.5 Minimize Construction Footprint
Minimizing the amount of site clearing and grading can dramatically reduce the overall hydrologic impacts of site development. This applies primarily to new construction but the principles can be adapted to retrofit and infill projects as well. Soil compaction resulting from the movement of heavy construction equipment can reduce soil infiltration rates by 70-99 percent (Gregory et al, 2006). Even low levels of compaction caused by light construction equipment can significantly reduce infiltration rates. In addition, compaction can destroy the complex network of biota in the soil profile that support the soil's ability to capture and mitigate pollutants. Soil compaction severely limits the establishment of healthy root systems of plants that may be used to revegetate the area. For these reasons, it is very important to avoid unnecessary damage to healthy soils during the construction process. The use of clearly defined protection areas will help to preserve the existing capacity of the site to store, treat and infiltrate stormwater runoff.

Bayou Land RC&D 3-3 October 2010
3.1.6 Re-vegetate Disturbed Areas
Maximizing plant cover protects the soil and improves ability of the site to retain stormwater, minimize runoff, and help to prevent erosion. Plants have multiple positive impacts on downstream water quality. First, the presence of a plant canopy (plus associated leaf litter and other organic matter that accumulates below the plants) can intercept rainfall, which reduces the erosive potential of precipitation. With less eroded material going to receiving waters, turbidity, chemical pollution, and sedimentation are reduced. Second, a healthy plant and soil community can help to trap and remediate chemical pollutants and filter particulate matter as water percolates into the soil.
Bayou Land RC&D 3-4 October 2010
3.2 Biofiltration BMPs
3.2.1 Rain Gardens/Bioretention Areas
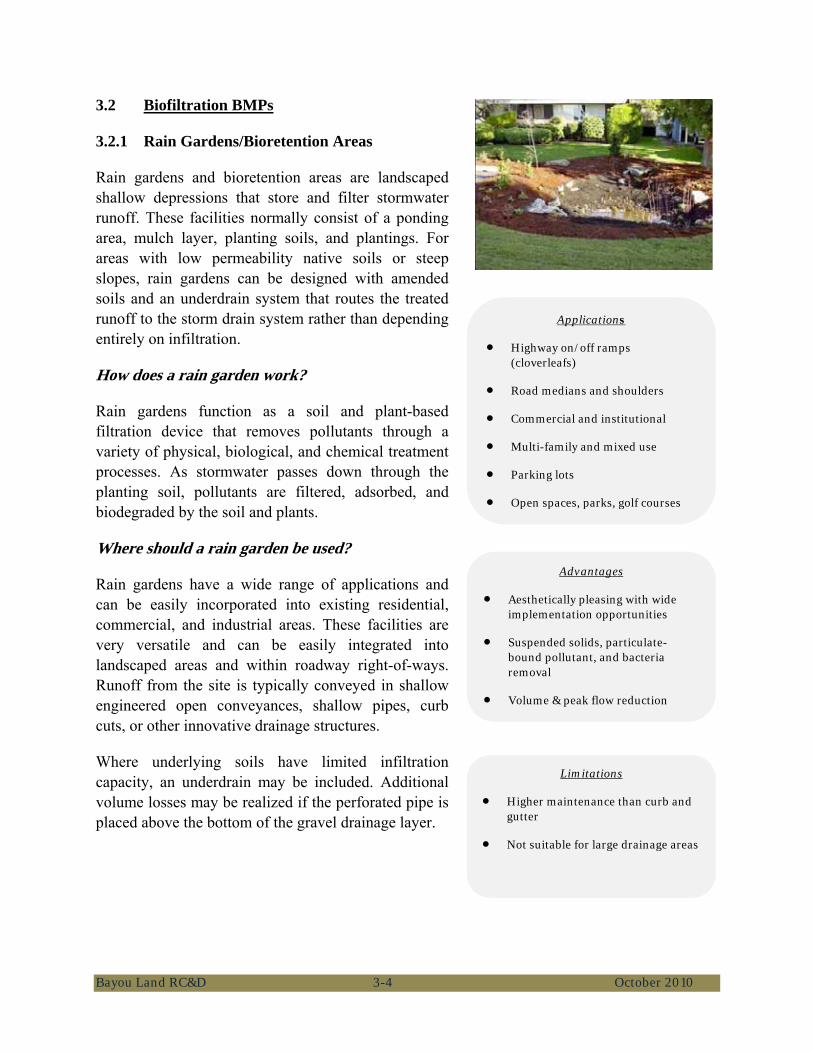
Rain gardens and bioretention areas are landscaped shallow depressions that store and filter stormwater runoff. These facilities normally consist of a ponding area, mulch layer, planting soils, and plantings. For areas with low permeability native soils or steep slopes, rain gardens can be designed with amended soils and an underdrain system that routes the treated runoff to the storm drain system rather than depending entirely on infiltration.
How does a rain garden work?
Rain gardens function as a soil and plant-based filtration device that removes pollutants through a variety of physical, biological, and chemical treatment processes. As stormwater passes down through the planting soil, pollutants are filtered, adsorbed, and biodegraded by the soil and plants.
Where should a rain garden be used?
Rain gardens have a wide range of applications and can be easily incorporated into existing residential, commercial, and industrial areas. These facilities are very versatile and can be easily integrated into landscaped areas and within roadway right-of-ways. Runoff from the site is typically conveyed in shallow engineered open conveyances, shallow pipes, curb cuts, or other innovative drainage structures.
Where underlying soils have limited infiltration capacity, an underdrain may be included. Additional volume losses may be realized if the perforated pipe is placed above the bottom of the gravel drainage layer.
Limitations
• Higher maintenance than curb and gutter
• Not suitable for large drainage areas
Advantages
• Aesthetically pleasing with wide implementation opportunities
• Suspended solids, particulate-bound pollutant, and bacteria removal
• Volume & peak flow reduction
Applications
• Highway on/off ramps (cloverleafs)
• Road medians and shoulders
• Commercial and institutional
• Multi-family and mixed use
• Parking lots
• Open spaces, parks, golf courses

Bayou Land RC&D 3-5 October 2010
Table 3-1: Site Suitability Considerations for Rain Gardens
Tributary Area < 5 acres; 217,800 square feet (sq. ft.) 1 BMP Area Typically Required as Percentage of Tributary Area (%) 5 to 15 percent
Site Slope (%) < 10 percent 2,3 Depth to Seasonally High Groundwater Table
< 5 feet (ft) use underdrains > 5 ft underdrain not required
Hydrologic Soil Group Any 3
1 Tributary area is the area of the site draining to the BMP. Tributary areas provided here should be used as a general guideline only. Tributary areas can be larger or smaller in some instances.
2 If the longitudinal slope of the rain garden exceeds 6%, check dams should be provided.
3 If the rain garden is located within 10 feet from a structure, has a longitudinal slope less than 1.5%, or has poorly drained soils (hydrologic soil groups “C” or “D”), underdrains should be incorporated. If underdrains are provided, site must have adequate relief between land surface and the stormwater conveyance system to permit vertical percolation through the gravel drainage layer (open-graded base/sub-base) and underdrain to the stormwater conveyance system.
Table 3-2: Quick Reference Guide for Rain Gardens
UNIT PROCESSES TARGET
CONSTITUENTS COST H Volume reduction H Sediment M Capital Cost M Peak flow reduction H Metals M Minor Maintenance Cost M Sedimentation H Oil and grease L Minor Maintenance Freq. H Filtration & sorption M Nutrients H Major Maintenance Cost H Biological processes H Bacteria L Major Maintenance Freq. H Trash and debris LEGEND H = High M = Medium L = Low
NOTES These designations are relative to other BMPs in this manual. Design variations and enhancements may change the designations. Relative costs are based on the costs per unit volume treated. Costs may vary significantly based on site specific constraints, such as utility conflicts, traffic interruptions, etc.
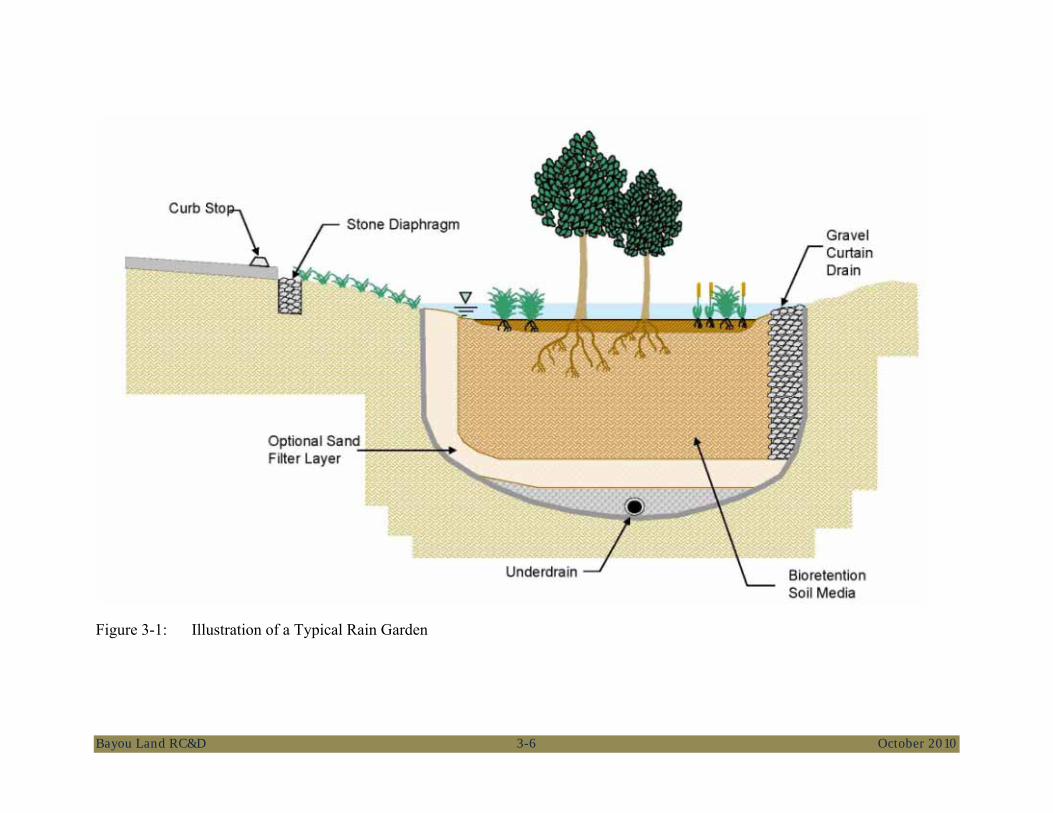
Bayou Land RC&D 3-6 October 2010
Figure 3-1: Illustration of a Typical Rain Garden
Bayou Land RC&D 3-7 October 2010
Variations and Enhancements
Enhancements that maximize contact time, aid in trapping and securing of pollutants or assist with volume reduction are the main categories of enhancements for rain gardens. Structural and operational enhancements that can increase performance in rain garden facilities are presented as follows.
• Check dams or drop structures are recommended where slopes exceed 6%. Shallower slopes enhance sediment removal by causing stormwater to pond allowing coarse sediment to settle out.
• Amended soils provide sorption sites for the removal of dissolved and suspended pollutants and can also be used to increase or decrease infiltration and provide additional support for plant growth. Soil amendments can also help to increase evapotranspiration and infiltration losses and can increase infiltration by increasing storage within the soils thereby allowing the underlying native soils time for deeper infiltration.
• Underdrains are often added to rain gardens to ensure proper drainage. A layer of amended soils is added on top of the underdrain which is embedded in a gravel trench. Placing the perforated pipe >6 inches above the bottom of the gravel trench is recommended to provide additional storage and volume losses. Underdrains can improve the health of the vegetation and prevent the bottom of the rain gardens from becoming soggy. Underdrains are recommended to mitigate vector concerns related to the formation of stagnant pools of water in poorly drained soils.
Sizing and Design Considerations
• Drawdown time of planting soil should be less than a few hours.
• Recommended maximum ponding depth of 12 inches.
• Recommended minimum soil depth of 2 feet with 3 feet preferred.
• Soil composition 60 to 70% sand, 15 to 25% compost, and 10 to 20% clean topsoil; organic content 8 to 12%; pH 5.5 to 7.5.
• Overflow devices are required.
• If underdrains are provided, they should be made of slotted, polyvinyl chloride (PVC) pipe conforming to ASTM D 3034 or equivalent or corrugated high density polyethylene (HDPE) pipe conforming to AASHTO 252M or equivalent. Intent: As compared to round-hole perforated pipe, slotted underdrains provide greater intake capacity, clog resistant drainage, and reduced entrance velocity into the pipe, thereby reducing the chances of solids migration.

Bayou Land RC&D 3-8 October 2010
Construction Considerations
• Provide energy dissipation and a flow spreader at each concentrated inlet point. Sheet flow inputs into the rain garden do not require energy dissipation.
• If infiltration is considered desirable do not operate heavy machinery along the bottom of the rain garden. If compaction occurs, till the bottom of the rain garden, re-grade and vegetate.
• If site soils are impermeable amend the rain garden soils to facilitate infiltration and promote plant growth.
• The use of treated wood or galvanized metal anywhere inside a rain garden should be avoided.
Inspection and Maintenance
Rou
tine
Mai
nten
ance
• Maintain vegetation as frequently as needed to preserve aesthetics in urban areas • Remove trash and debris and visible floatables such as oil and grease • Remove minor sediment accumulations near inlet/outlet structures • Stabilize and repair eroded banks • Perform minor structural repairs to inlet/outlet structures • Eliminate vectors and conditions that promote vectors
Maj
or
Mai
nten
ance
• Re-grade rain garden to restore design longitudinal bottom slope • Aerate compacted areas to restore infiltration capacity
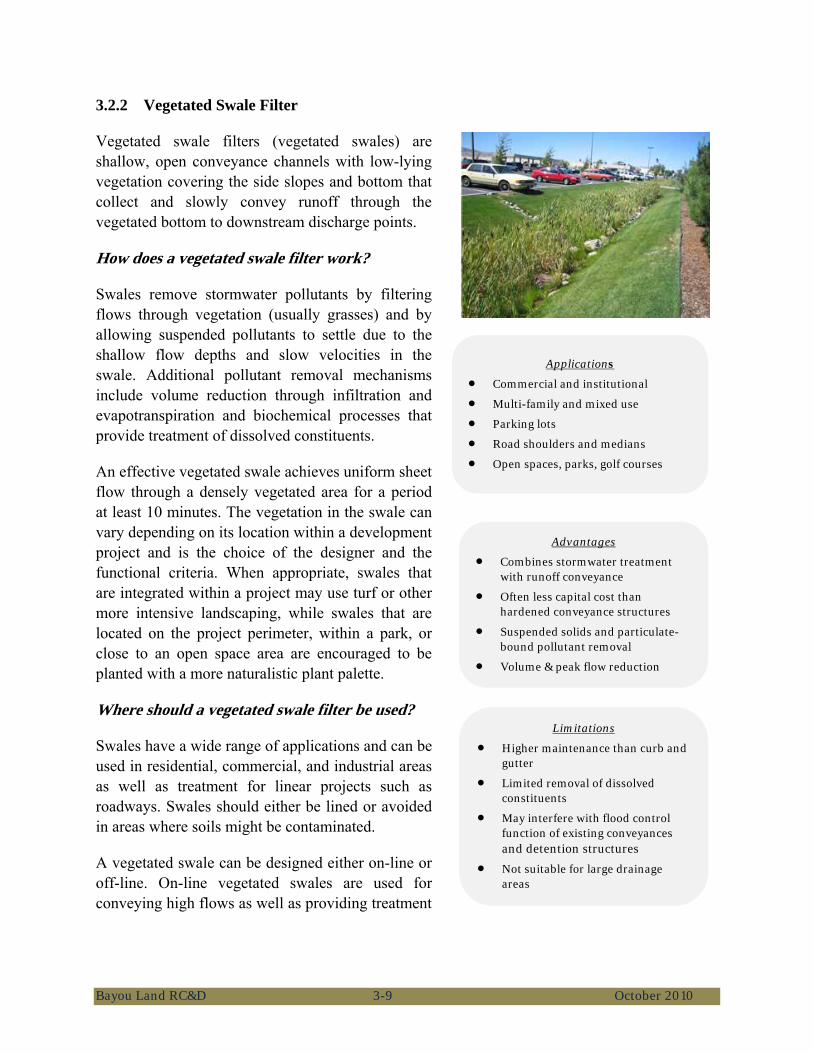
Bayou Land RC&D 3-9 October 2010
3.2.2 Vegetated Swale Filter
Vegetated swale filters (vegetated swales) are shallow, open conveyance channels with low-lying vegetation covering the side slopes and bottom that collect and slowly convey runoff through the vegetated bottom to downstream discharge points.
How does a vegetated swale filter work?
Swales remove stormwater pollutants by filtering flows through vegetation (usually grasses) and by allowing suspended pollutants to settle due to the shallow flow depths and slow velocities in the swale. Additional pollutant removal mechanisms include volume reduction through infiltration and evapotranspiration and biochemical processes that provide treatment of dissolved constituents.
An effective vegetated swale achieves uniform sheet flow through a densely vegetated area for a period at least 10 minutes. The vegetation in the swale can vary depending on its location within a development project and is the choice of the designer and the functional criteria. When appropriate, swales that are integrated within a project may use turf or other more intensive landscaping, while swales that are located on the project perimeter, within a park, or close to an open space area are encouraged to be planted with a more naturalistic plant palette.
Where should a vegetated swale filter be used?
Swales have a wide range of applications and can be used in residential, commercial, and industrial areas as well as treatment for linear projects such as roadways. Swales should either be lined or avoided in areas where soils might be contaminated.
A vegetated swale can be designed either on-line or off-line. On-line vegetated swales are used for conveying high flows as well as providing treatment
Limitations
• Higher maintenance than curb and gutter
• Limited removal of dissolved constituents
• May interfere with flood control function of existing conveyances and detention structures
• Not suitable for large drainage areas
Advantages
• Combines stormwater treatment with runoff conveyance
• Often less capital cost than hardened conveyance structures
• Suspended solids and particulate-bound pollutant removal
• Volume & peak flow reduction
Applications
• Commercial and institutional
• Multi-family and mixed use
• Parking lots
• Road shoulders and medians
• Open spaces, parks, golf courses
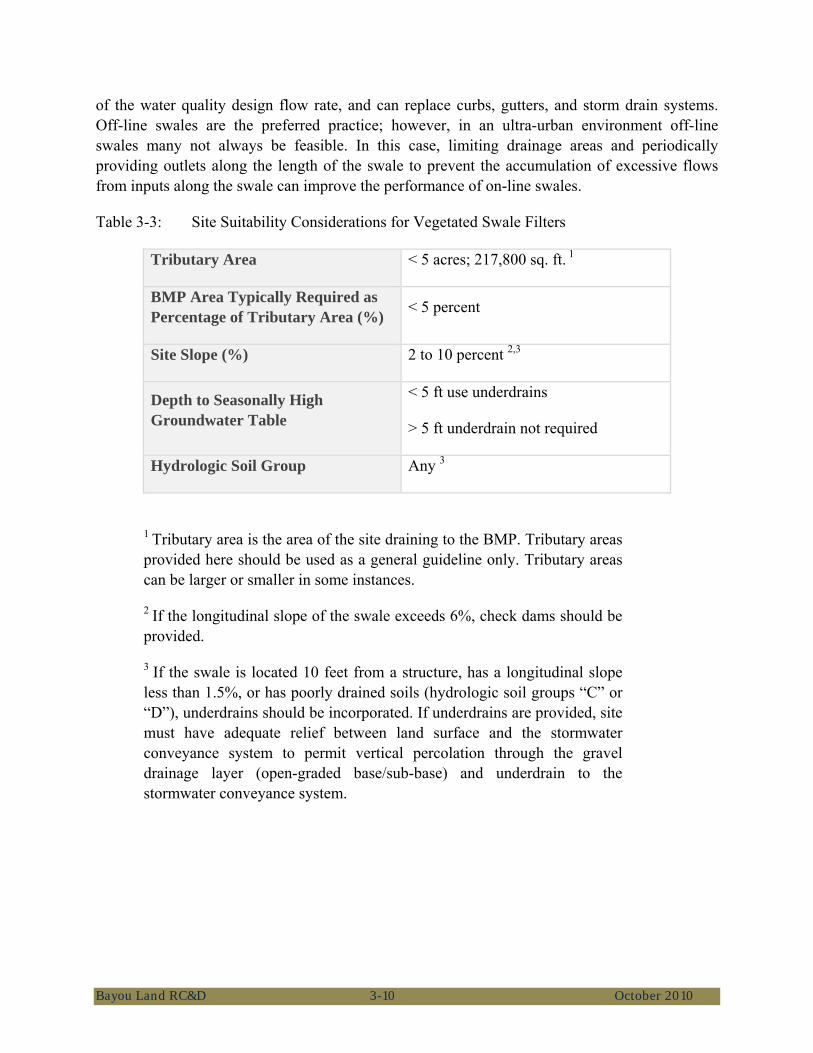
Bayou Land RC&D 3-10 October 2010
of the water quality design flow rate, and can replace curbs, gutters, and storm drain systems. Off-line swales are the preferred practice; however, in an ultra-urban environment off-line swales many not always be feasible. In this case, limiting drainage areas and periodically providing outlets along the length of the swale to prevent the accumulation of excessive flows from inputs along the swale can improve the performance of on-line swales.
Table 3-3: Site Suitability Considerations for Vegetated Swale Filters
Tributary Area < 5 acres; 217,800 sq. ft. 1
BMP Area Typically Required as Percentage of Tributary Area (%) < 5 percent
Site Slope (%) 2 to 10 percent 2,3
Depth to Seasonally High Groundwater Table
< 5 ft use underdrains
> 5 ft underdrain not required
Hydrologic Soil Group Any 3
1 Tributary area is the area of the site draining to the BMP. Tributary areas provided here should be used as a general guideline only. Tributary areas can be larger or smaller in some instances.
2 If the longitudinal slope of the swale exceeds 6%, check dams should be provided.
3 If the swale is located 10 feet from a structure, has a longitudinal slope less than 1.5%, or has poorly drained soils (hydrologic soil groups “C” or “D”), underdrains should be incorporated. If underdrains are provided, site must have adequate relief between land surface and the stormwater conveyance system to permit vertical percolation through the gravel drainage layer (open-graded base/sub-base) and underdrain to the stormwater conveyance system.
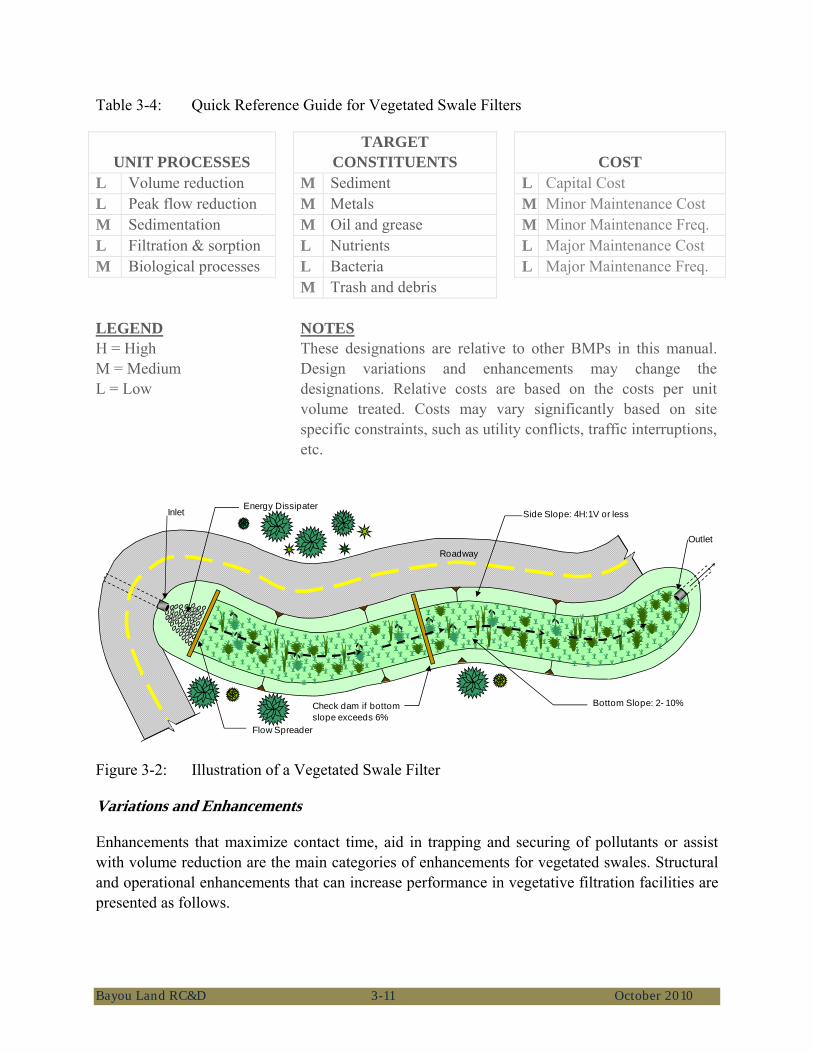
Bayou Land RC&D 3-11 October 2010
Table 3-4: Quick Reference Guide for Vegetated Swale Filters
UNIT PROCESSES TARGET
CONSTITUENTS COST L Volume reduction M Sediment L Capital Cost L Peak flow reduction M Metals M Minor Maintenance Cost M Sedimentation M Oil and grease M Minor Maintenance Freq. L Filtration & sorption L Nutrients L Major Maintenance Cost M Biological processes L Bacteria L Major Maintenance Freq. M Trash and debris LEGEND H = High M = Medium L = Low
NOTES These designations are relative to other BMPs in this manual. Design variations and enhancements may change the designations. Relative costs are based on the costs per unit volume treated. Costs may vary significantly based on site specific constraints, such as utility conflicts, traffic interruptions, etc.
Figure 3-2: Illustration of a Vegetated Swale Filter
Variations and Enhancements
Enhancements that maximize contact time, aid in trapping and securing of pollutants or assist with volume reduction are the main categories of enhancements for vegetated swales. Structural and operational enhancements that can increase performance in vegetative filtration facilities are presented as follows.
Check dam if bottom slope exceeds 6%
Outlet
Inlet
Flow Spreader
Roadway
Energy Dissipater
Bottom Slope: 2- 10%
Side Slope: 4H:1V or less
Bayou Land RC&D 3-12 October 2010
• Check dams are recommended where longitudinal slopes exceed 6%. Check dams enhance sediment removal by causing stormwater to pond allowing coarse sediment to settle out.
• Amended soils provide sorption sites for the removal of dissolved and suspended pollutants and can also be used to increase or decrease infiltration and provide additional support for plant growth. Soil amendments can also help to increase evapotranspiration and infiltration losses and can increase infiltration by increasing storage within the soils thereby allowing the underlying native soils time for deeper infiltration.
• Flow spreaders distribute flows evenly across the width of a vegetated filtration BMP. Vegetated filtration BMPs function best under conditions of even shallow sheet flows.
• Flow dividers are recommended for vegetated swales when the bottom width exceeds 10 feet. Flow dividers facilitate sheet flow and limit channelization along the bottom of the swale.
• Under drains are typically added to vegetated swales to ensure that the bottoms of the swales are properly drained. A layer of amended soils is typically added on top of the under drain which is typically embedded in a gravel trench. Under drains can improve the health of the vegetation at the bottom of the swale and prevent the bottom of the swale from becoming soggy. Under drains are recommended to mitigate vector concerns related to the formation of stagnant pools of water in poorly drained soils.
Sizing and Design Considerations
• Design flow velocity through the swale should not exceed 1ft/s to keep the vegetation in the swale upright.
• Size bottom width, longitudinal slope and side slopes to handle the design flow rate such that flow depths in the swale do not exceed 4 inches or two-thirds of the height of the grass in the swale.
• Recommended minimum bottom width is 2 feet and maximum bottom width is 10 feet.
• Recommended swale length is the length required to achieve a minimum hydraulic residence time of 10 minutes. Minimum swale length is 100 feet.
• Recommended lateral slopes along the bottom of the swale are flat with 4:1 side slopes.
• May need to consider wetland vegetation if designed to be persistently wet.

Bayou Land RC&D 3-13 October 2010
• If underdrains are provided, they should be made of slotted, polyvinyl chloride (PVC) pipe conforming to ASTM D 3034 or equivalent or corrugated high density polyethylene (HDPE) pipe conforming to AASHTO 252M or equivalent. Intent: As compared to round-hole perforated pipe, slotted underdrains provide greater intake capacity, clog resistant drainage, and reduced entrance velocity into the pipe, thereby reducing the chances of solids migration.
Construction Considerations
• Provide energy dissipation and a flow spreader at each concentrated inlet point. Sheet flow inputs along the length of the swale do not require energy dissipation.
• If infiltration is considered desirable do not operate heavy machinery along the bottom of the swale. If compaction occurs, till the bottom of the swale, re-grade and vegetate.
• If site soils are impermeable amend the soils at the bottom of the swale to facilitate infiltration and promote plant growth.
• Avoid using treated wood or galvanized metal anywhere inside a vegetated swale.
Inspection and Maintenance
Rou
tine
Mai
nten
ance
• Maintain vegetation as frequently as needed to preserve aesthetics in urban areas • Remove trash and debris and visible floatables such as oil and grease • Remove minor sediment accumulations near inlet/outlet structures • Stabilize and repair eroded banks • Perform minor structural repairs to inlet/outlet structures • Eliminate vectors and conditions that promote vectors
Maj
or
Mai
nten
ance
• Re-construct/repair side slopes/berms if needed. • Re-grade swale bottom to restore design longitudinal bottom slope • Aerate compacted areas to restore infiltration capacity
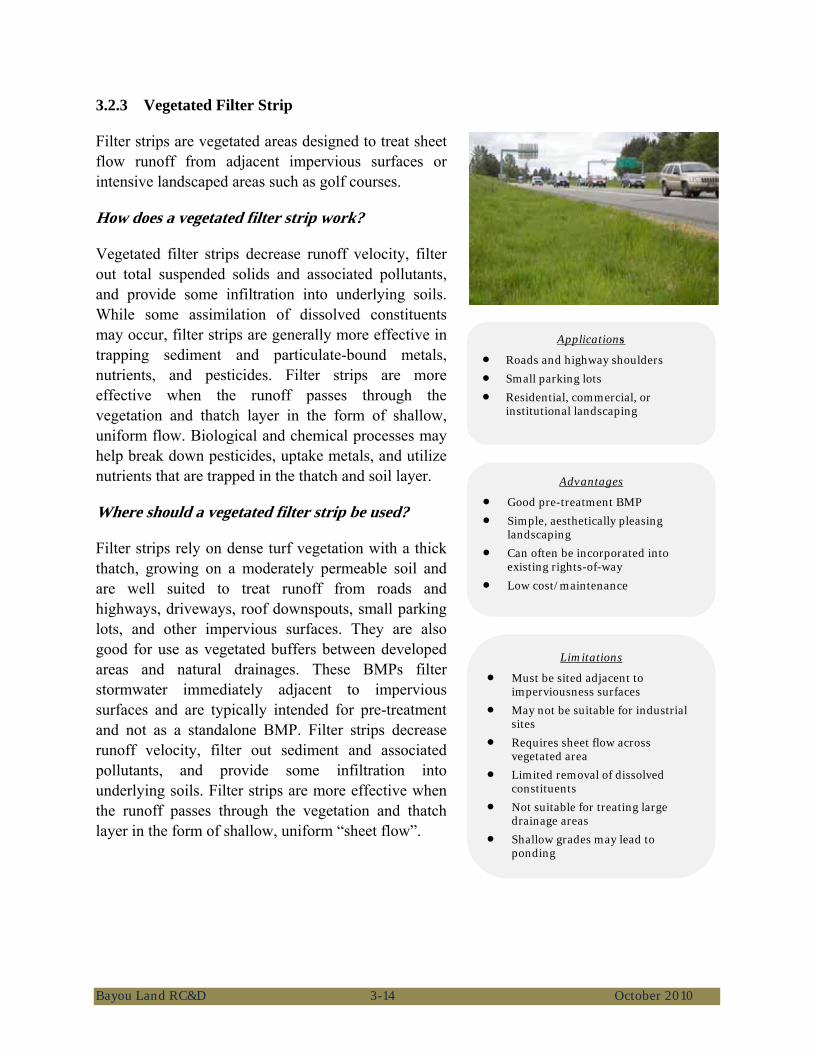
Bayou Land RC&D 3-14 October 2010
3.2.3 Vegetated Filter Strip
Filter strips are vegetated areas designed to treat sheet flow runoff from adjacent impervious surfaces or intensive landscaped areas such as golf courses.
How does a vegetated filter strip work?
Vegetated filter strips decrease runoff velocity, filter out total suspended solids and associated pollutants, and provide some infiltration into underlying soils. While some assimilation of dissolved constituents may occur, filter strips are generally more effective in trapping sediment and particulate-bound metals, nutrients, and pesticides. Filter strips are more effective when the runoff passes through the vegetation and thatch layer in the form of shallow, uniform flow. Biological and chemical processes may help break down pesticides, uptake metals, and utilize nutrients that are trapped in the thatch and soil layer.
Where should a vegetated filter strip be used?
Filter strips rely on dense turf vegetation with a thick thatch, growing on a moderately permeable soil and are well suited to treat runoff from roads and highways, driveways, roof downspouts, small parking lots, and other impervious surfaces. They are also good for use as vegetated buffers between developed areas and natural drainages. These BMPs filter stormwater immediately adjacent to impervious surfaces and are typically intended for pre-treatment and not as a standalone BMP. Filter strips decrease runoff velocity, filter out sediment and associated pollutants, and provide some infiltration into underlying soils. Filter strips are more effective when the runoff passes through the vegetation and thatch layer in the form of shallow, uniform “sheet flow”.
Limitations
• Must be sited adjacent to imperviousness surfaces
• May not be suitable for industrial sites
• Requires sheet flow across vegetated area
• Limited removal of dissolved constituents
• Not suitable for treating large drainage areas
• Shallow grades may lead to ponding
Advantages
• Good pre-treatment BMP • Simple, aesthetically pleasing
landscaping • Can often be incorporated into
existing rights-of-way
• Low cost/maintenance
Applications
• Roads and highway shoulders • Small parking lots • Residential, commercial, or
institutional landscaping

Bayou Land RC&D 3-15 October 2010
Table 3-5: Site Suitability Considerations for Vegetated Filter Strips
Tributary Area < 1 acre; 43,560 sq. ft. 1 BMP Area Typically Required as Percentage of Tributary Area (%) < 5 percent
Site Slope (%) < 5 percent 2 Depth to Seasonally High Groundwater Table > 2 ft below lowest point of filter strip
Hydrologic Soil Group Any
1 Tributary area is the area of the site draining to the BMP. Tributary areas provided here should be used as a general guideline only. Tributary areas can be larger or smaller in some instances.
2 Flows may become concentrated if site slope exceeds this value.
Table 3-6: Quick Reference Guide for Vegetated Filter Strips
UNIT PROCESSES TARGET
CONSTITUENTS COST M Volume reduction M Sediment L Capital Cost L Peak flow reduction M Metals M Minor Maintenance Cost M Sedimentation M Oil and grease M Minor Maintenance Freq. M Filtration & sorption L Nutrients L Major Maintenance Cost M Biological processes L Bacteria L Major Maintenance Freq. M Trash and debris
LEGEND H = High M = Medium L = Low
NOTES These designations are relative to other BMPs in this manual. Design variations and enhancements may change the designations. Relative costs are based on the costs per unit volume treated. Costs may vary significantly based on site specific constraints, such as utility conflicts,traffic interruptions, etc.
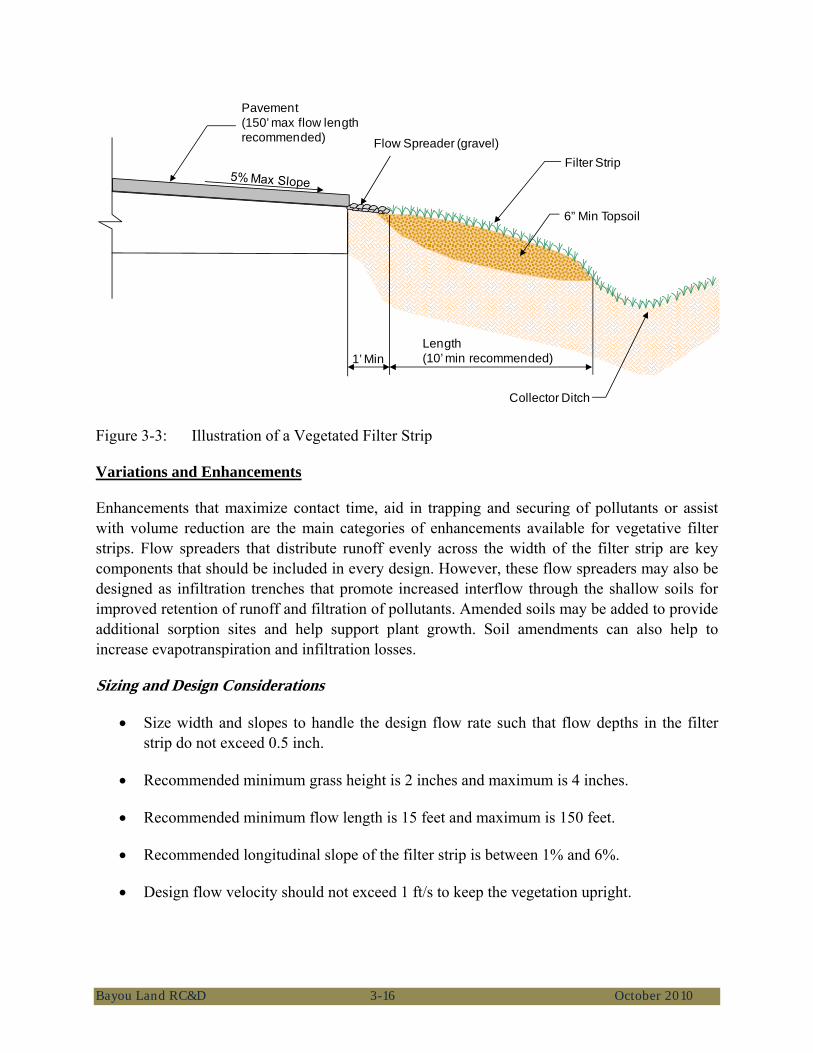
Bayou Land RC&D 3-16 October 2010
Figure 3-3: Illustration of a Vegetated Filter Strip
Variations and Enhancements
Enhancements that maximize contact time, aid in trapping and securing of pollutants or assist with volume reduction are the main categories of enhancements available for vegetative filter strips. Flow spreaders that distribute runoff evenly across the width of the filter strip are key components that should be included in every design. However, these flow spreaders may also be designed as infiltration trenches that promote increased interflow through the shallow soils for improved retention of runoff and filtration of pollutants. Amended soils may be added to provide additional sorption sites and help support plant growth. Soil amendments can also help to increase evapotranspiration and infiltration losses.
Sizing and Design Considerations
• Size width and slopes to handle the design flow rate such that flow depths in the filter strip do not exceed 0.5 inch.
• Recommended minimum grass height is 2 inches and maximum is 4 inches.
• Recommended minimum flow length is 15 feet and maximum is 150 feet.
• Recommended longitudinal slope of the filter strip is between 1% and 6%.
• Design flow velocity should not exceed 1 ft/s to keep the vegetation upright.
Pavement(150’ max flow length recommended) Flow Spreader (gravel)
Filter Strip
6” Min Topsoil
Length(10’ min recommended)1’ Min
Collector Ditch
Bayou Land RC&D 3-17 October 2010
Construction Considerations
• Provide energy dissipation and a flow spreader at each concentrated inlet point (e.g., curb cuts). Sheet flow inputs along the length of the filter strip do not require energy dissipation.
• If infiltration is considered desirable minimize the use of heavy machinery on the filter strip area. If compaction occurs, re-grade and vegetate.
• Low permeability soils should be amended to facilitate infiltration and promote plant growth.
• Avoid using treated wood or galvanized metals.
Inspection and Maintenance
Rou
tine
Mai
nten
ance
• Maintain vegetation as frequently as needed to preserve aesthetics and safety • Remove trash and deris • Remove visible floatables such as oil and grease • Remove minor sediment accumulations
Maj
or
Mai
nten
ance
• Re-grade filter strip to restore design longitudinal bottom slope • Aerate compacted areas to restore infiltration capacity
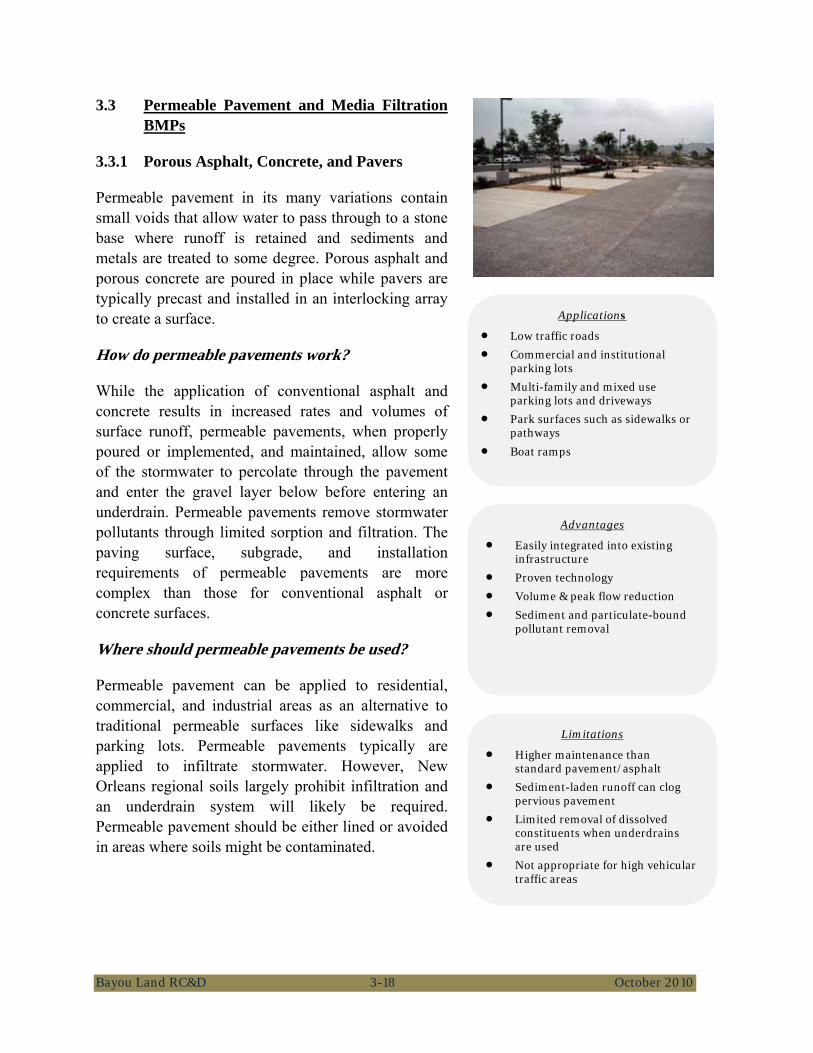
Bayou Land RC&D 3-18 October 2010
3.3 Permeable Pavement and Media Filtration BMPs
3.3.1 Porous Asphalt, Concrete, and Pavers
Permeable pavement in its many variations contain small voids that allow water to pass through to a stone base where runoff is retained and sediments and metals are treated to some degree. Porous asphalt and porous concrete are poured in place while pavers are typically precast and installed in an interlocking array to create a surface.
How do permeable pavements work?
While the application of conventional asphalt and concrete results in increased rates and volumes of surface runoff, permeable pavements, when properly poured or implemented, and maintained, allow some of the stormwater to percolate through the pavement and enter the gravel layer below before entering an underdrain. Permeable pavements remove stormwater pollutants through limited sorption and filtration. The paving surface, subgrade, and installation requirements of permeable pavements are more complex than those for conventional asphalt or concrete surfaces.
Where should permeable pavements be used?
Permeable pavement can be applied to residential, commercial, and industrial areas as an alternative to traditional permeable surfaces like sidewalks and parking lots. Permeable pavements typically are applied to infiltrate stormwater. However, New Orleans regional soils largely prohibit infiltration and an underdrain system will likely be required. Permeable pavement should be either lined or avoided in areas where soils might be contaminated.
Limitations
• Higher maintenance than standard pavement/asphalt
• Sediment-laden runoff can clog pervious pavement
• Limited removal of dissolved constituents when underdrains are used
• Not appropriate for high vehicular traffic areas
Advantages
• Easily integrated into existing infrastructure
• Proven technology • Volume & peak flow reduction • Sediment and particulate-bound
pollutant removal
Applications
• Low traffic roads • Commercial and institutional
parking lots • Multi-family and mixed use
parking lots and driveways • Park surfaces such as sidewalks or
pathways • Boat ramps
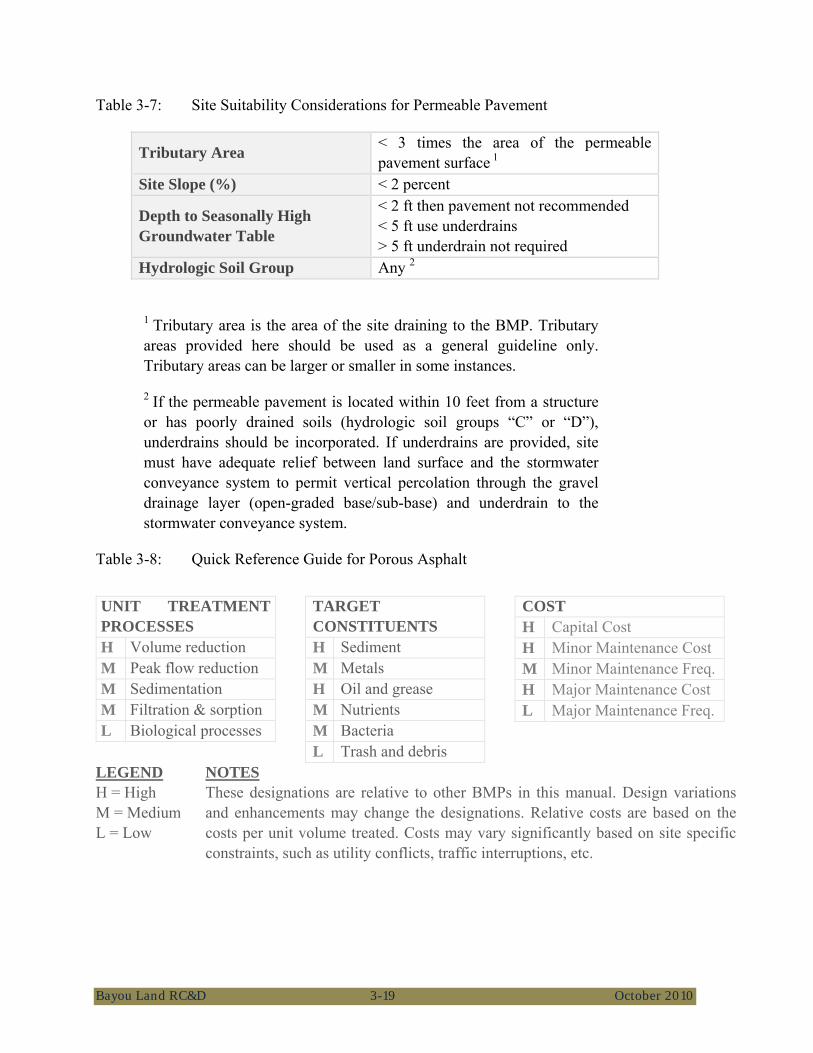
Bayou Land RC&D 3-19 October 2010
Table 3-7: Site Suitability Considerations for Permeable Pavement
Tributary Area < 3 times the area of the permeable pavement surface 1
Site Slope (%) < 2 percent
Depth to Seasonally High Groundwater Table
< 2 ft then pavement not recommended < 5 ft use underdrains > 5 ft underdrain not required
Hydrologic Soil Group Any 2
1 Tributary area is the area of the site draining to the BMP. Tributary areas provided here should be used as a general guideline only. Tributary areas can be larger or smaller in some instances.
2 If the permeable pavement is located within 10 feet from a structure or has poorly drained soils (hydrologic soil groups “C” or “D”), underdrains should be incorporated. If underdrains are provided, site must have adequate relief between land surface and the stormwater conveyance system to permit vertical percolation through the gravel drainage layer (open-graded base/sub-base) and underdrain to the stormwater conveyance system.
Table 3-8: Quick Reference Guide for Porous Asphalt
UNIT TREATMENT PROCESSES H Volume reduction M Peak flow reduction M Sedimentation M Filtration & sorption L Biological processes
TARGET CONSTITUENTS H Sediment M Metals H Oil and grease M Nutrients M Bacteria L Trash and debris
COST H Capital Cost H Minor Maintenance Cost M Minor Maintenance Freq. H Major Maintenance Cost L Major Maintenance Freq.
LEGEND H = High M = Medium L = Low
NOTES These designations are relative to other BMPs in this manual. Design variations and enhancements may change the designations. Relative costs are based on thecosts per unit volume treated. Costs may vary significantly based on site specific constraints, such as utility conflicts, traffic interruptions, etc.

Bayou Land RC&D 3-20 October 2010
Figure 3-4: Illustration of permeable pavement. Variations and Enhancements
There are several modifications to the standard permeable pavement design that can be used to increase storage capacity or pass larger flows, including using deeper gravel layers, amending native subgrade, and installing perforated riser underdrains. In many cases, roof downspouts may be routed to permeable pavement to reduce runoff rates and increase volume losses.
There are several styles of permeable pavement available, including those that are poured in place (i.e., porous concrete and porous asphalt), and modular paving systems (i.e., interlocking concrete, grass and gravel pavers).
Pour in Place Permeable Pavements
Pour in place permeable pavements are poured where they will ultimately be used and allowed to setup (cure) in place. Typically, the surface pores in the pavement make up about 10% of the total surface area. Porous asphalt and porous concrete are similar to each other in that the porosity is created by removing the small aggregate or fine particles from the conventional recipe, which leaves stable air pockets (gaps through the material) for water to drain through into the subsurface. Porous concrete is rougher than its conventional counterpart, and unlike oil-based asphalt will not release harmful chemicals into the environment. These types of permeable pavements should only be used in areas of slow and low traffic (e.g., parking lots, low traffic streets, pedestrian areas, etc.).
Permeable pavement
Gravel beddingGeotextile filter
High void content aggregate / storage layer
Subgrade / native soil
Optional underdrain
Bayou Land RC&D 3-21 October 2010
Modular Paving Systems
There are several varieties of pavers that allow for infiltration, including (but not limited to) interlocking concrete pavers, grass pavers, and gravel pavers. Typically, the pore spaces in the pavement make up about 10% of the total surface area. Interlocking concrete pavers are not porous themselves, rather the mechanism that allows them to interlock creates voids and gaps between the pavers that are filled with a pervious material and can withstand heavy loads. Grass and gravel pavers are nearly identical to each other in structure (rigid grid of concrete or durable plastic) but differ in their load bearing support capacities. The grids are embedded in the soil to support the loads that are applied, thereby preventing compaction, reducing rutting and erosion. Grass pavers are generally filled with a mix of sand, gravel, and soil to support vegetation growth (e.g., grass, low-growing groundcovers, etc.), which provides habitat, pollutant removal, and reduces stormwater runoff volumes and rates. Grass pavers are good for low-traffic areas, while gravel pavers are good for high-frequency, low speed traffic areas. Gravel pavers differ from grass pavers in that they are filled with gravel (often underlain with a geotextile fabric to prevent the migration of the gravel into the subbase) which support greater loads and higher traffic volumes.
Sizing and Design Considerations
• Depending on how and where permeable pavement will be used, pretreatment of the runoff entering the pavement may be necessary.
• Depth of each layer should be determined by a licensed civil engineer based on analyses of not only the hydrology and hydraulics, but also the structural requirements of the site.
• The thickness of the permeable pavement layer, consisting of either poured in place materials (i.e., porous concrete and porous asphalt) or modular paving materials (i.e., interlocking concrete, grass and gravel pavers), will vary depending on structural and functional design. Concrete pavers should have a minimum thickness of 3 1/8” to ensure adequate structural integrity.
• The gravel bedding should consist of small sized aggregate (e.g., No. 8) just under the permeable pavement to provide a level surface and also acts as a filter to trap particles and help prevent the reservoir layer from clogging. This layer is typically about 1.5” to 3” inches deep and may be underlain by a geotextile fabric or choking stone (preferred) to prevent migration of the smaller sized aggregate.

Bayou Land RC&D 3-22 October 2010
• The gravel storage layer must be designed to function as a support layer as well as a reservoir layer (i.e., consideration must be given to the soil conditions as well as the expected loads). This layer may be divided into two layers, a filter layer that underlies the choking layer (or geotextile) and a reservoir layer (typically washed, open-graded No. 57 aggregate without any fine sands).
• Recommended drawdown time of sub-surface storage layer is less than 72 hours. Intent: Soils must be allowed to dry out periodically in order to restore hydraulic capacity to receive flows from subsequent storms, maintain infiltration rates, maintain adequate sub soil oxygen levels for healthy soil biota, and to provide proper soil conditions for biodegradation and retention of pollutants.
• If underdrains are provided, they should be made of slotted, polyvinyl chloride (PVC) pipe conforming to ASTM D 3034 or equivalent or corrugated high density polyethylene (HDPE) pipe conforming to AASHTO 252M or equivalent. Intent: As compared to round-hole perforated pipe, slotted underdrains provide greater intake capacity, clog resistant drainage, and reduced entrance velocity into the pipe, thereby reducing the chances of solids migration.
Construction Considerations
• Permeable pavement should be laid close to level, the bottom of the base layers must be level to ensure uniform infiltration.
• Permeable pavement surfaces should not be used to store site materials, unless the surface is well protected from accidental spillage or other contamination.
• To prevent/minimize soil compaction in the area of the permeable pavement installation, use light equipment with tracks or oversized tires.
• Divert stormwater from the area as needed (before and during installation).
• The pavement should be the last installation done at a development site. Landscaping should be completed and adjacent areas stabilized before pavement installation to minimize risk of clogging.
• Vehicular traffic should be prohibited for at least 2 days after installation.
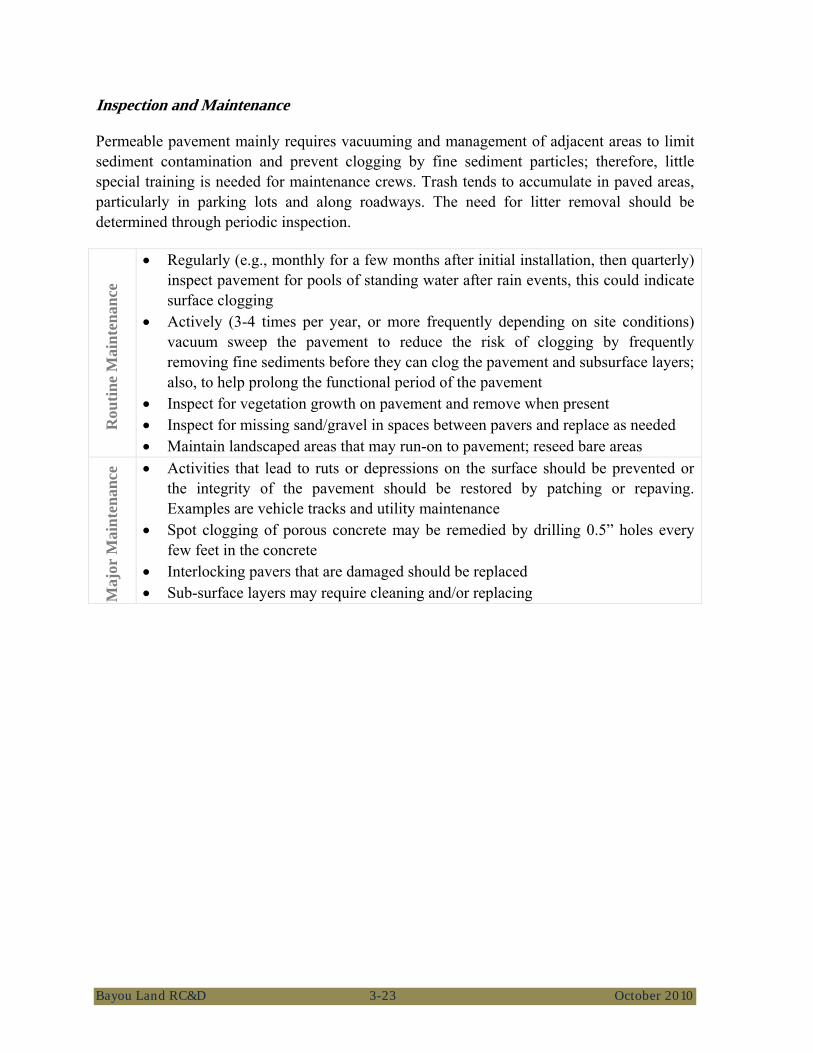
Bayou Land RC&D 3-23 October 2010
Inspection and Maintenance
Permeable pavement mainly requires vacuuming and management of adjacent areas to limit sediment contamination and prevent clogging by fine sediment particles; therefore, little special training is needed for maintenance crews. Trash tends to accumulate in paved areas, particularly in parking lots and along roadways. The need for litter removal should be determined through periodic inspection.
Rou
tine
Mai
nten
ance
• Regularly (e.g., monthly for a few months after initial installation, then quarterly) inspect pavement for pools of standing water after rain events, this could indicate surface clogging
• Actively (3-4 times per year, or more frequently depending on site conditions) vacuum sweep the pavement to reduce the risk of clogging by frequently removing fine sediments before they can clog the pavement and subsurface layers; also, to help prolong the functional period of the pavement
• Inspect for vegetation growth on pavement and remove when present • Inspect for missing sand/gravel in spaces between pavers and replace as needed • Maintain landscaped areas that may run-on to pavement; reseed bare areas
Maj
or M
aint
enan
ce • Activities that lead to ruts or depressions on the surface should be prevented or
the integrity of the pavement should be restored by patching or repaving. Examples are vehicle tracks and utility maintenance
• Spot clogging of porous concrete may be remedied by drilling 0.5” holes every few feet in the concrete
• Interlocking pavers that are damaged should be replaced • Sub-surface layers may require cleaning and/or replacing
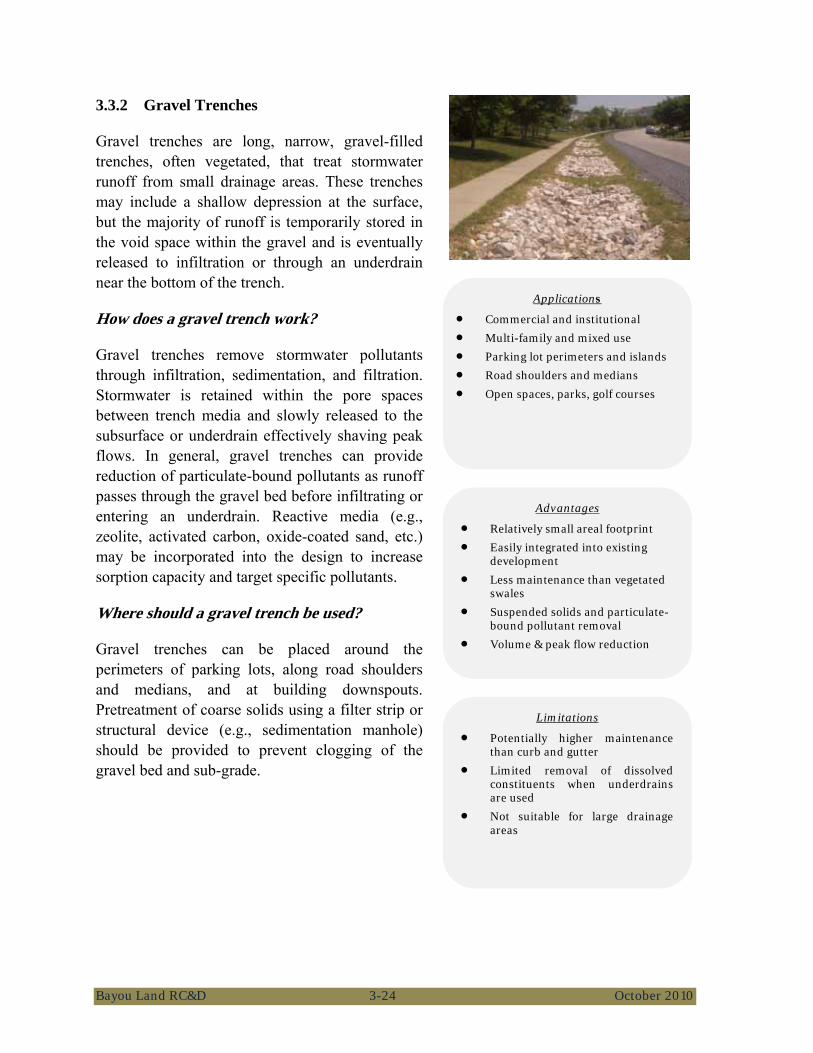
Bayou Land RC&D 3-24 October 2010
3.3.2 Gravel Trenches
Gravel trenches are long, narrow, gravel-filled trenches, often vegetated, that treat stormwater runoff from small drainage areas. These trenches may include a shallow depression at the surface, but the majority of runoff is temporarily stored in the void space within the gravel and is eventually released to infiltration or through an underdrain near the bottom of the trench.
How does a gravel trench work?
Gravel trenches remove stormwater pollutants through infiltration, sedimentation, and filtration. Stormwater is retained within the pore spaces between trench media and slowly released to the subsurface or underdrain effectively shaving peak flows. In general, gravel trenches can provide reduction of particulate-bound pollutants as runoff passes through the gravel bed before infiltrating or entering an underdrain. Reactive media (e.g., zeolite, activated carbon, oxide-coated sand, etc.) may be incorporated into the design to increase sorption capacity and target specific pollutants.
Where should a gravel trench be used?
Gravel trenches can be placed around the perimeters of parking lots, along road shoulders and medians, and at building downspouts. Pretreatment of coarse solids using a filter strip or structural device (e.g., sedimentation manhole) should be provided to prevent clogging of the gravel bed and sub-grade.
Limitations
• Potentially higher maintenance than curb and gutter
• Limited removal of dissolved constituents when underdrains are used
• Not suitable for large drainage areas
Advantages
• Relatively small areal footprint • Easily integrated into existing
development • Less maintenance than vegetated
swales • Suspended solids and particulate-
bound pollutant removal • Volume & peak flow reduction
Applications
• Commercial and institutional • Multi-family and mixed use • Parking lot perimeters and islands • Road shoulders and medians
• Open spaces, parks, golf courses
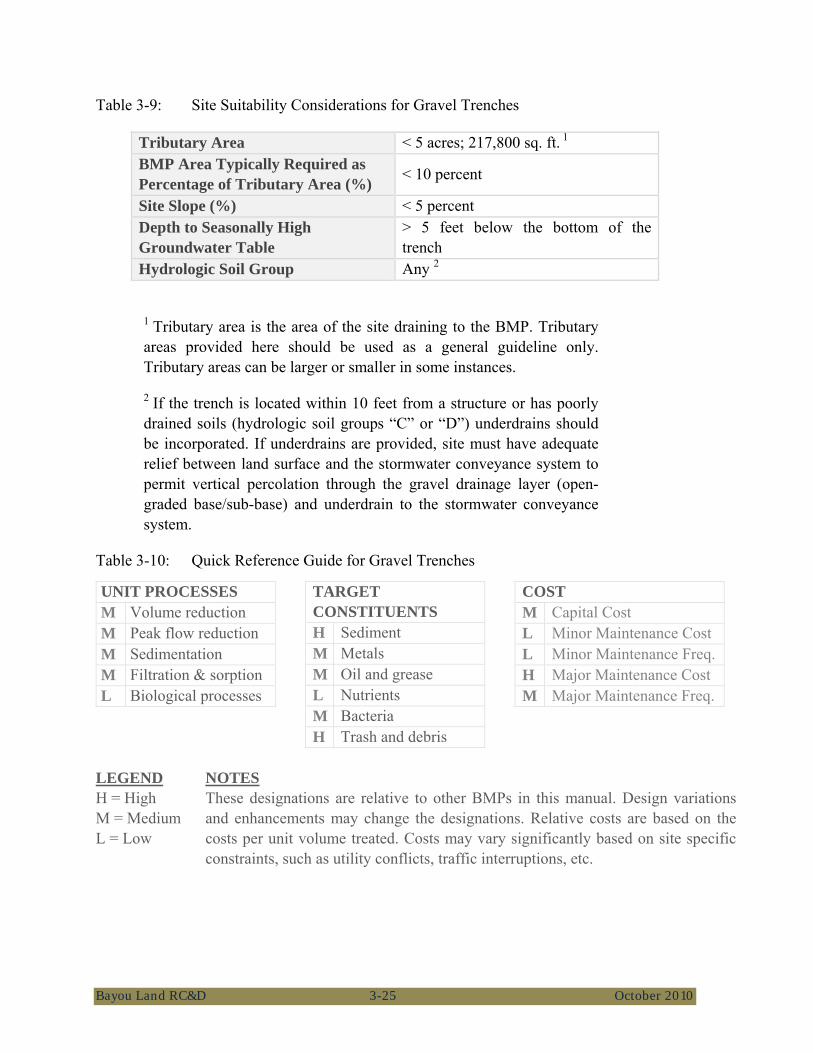
Bayou Land RC&D 3-25 October 2010
Table 3-9: Site Suitability Considerations for Gravel Trenches
Tributary Area < 5 acres; 217,800 sq. ft. 1 BMP Area Typically Required as Percentage of Tributary Area (%) < 10 percent
Site Slope (%) < 5 percent Depth to Seasonally High Groundwater Table
> 5 feet below the bottom of the trench
Hydrologic Soil Group Any 2
1 Tributary area is the area of the site draining to the BMP. Tributary areas provided here should be used as a general guideline only. Tributary areas can be larger or smaller in some instances.
2 If the trench is located within 10 feet from a structure or has poorly drained soils (hydrologic soil groups “C” or “D”) underdrains should be incorporated. If underdrains are provided, site must have adequate relief between land surface and the stormwater conveyance system to permit vertical percolation through the gravel drainage layer (open-graded base/sub-base) and underdrain to the stormwater conveyance system.
Table 3-10: Quick Reference Guide for Gravel Trenches
UNIT PROCESSES M Volume reduction M Peak flow reduction M Sedimentation M Filtration & sorption L Biological processes
TARGET CONSTITUENTS H Sediment M Metals M Oil and grease L Nutrients M Bacteria H Trash and debris
COST M Capital Cost L Minor Maintenance Cost L Minor Maintenance Freq. H Major Maintenance Cost M Major Maintenance Freq.
LEGEND H = High M = Medium L = Low
NOTES These designations are relative to other BMPs in this manual. Design variations and enhancements may change the designations. Relative costs are based on thecosts per unit volume treated. Costs may vary significantly based on site specific constraints, such as utility conflicts, traffic interruptions, etc.
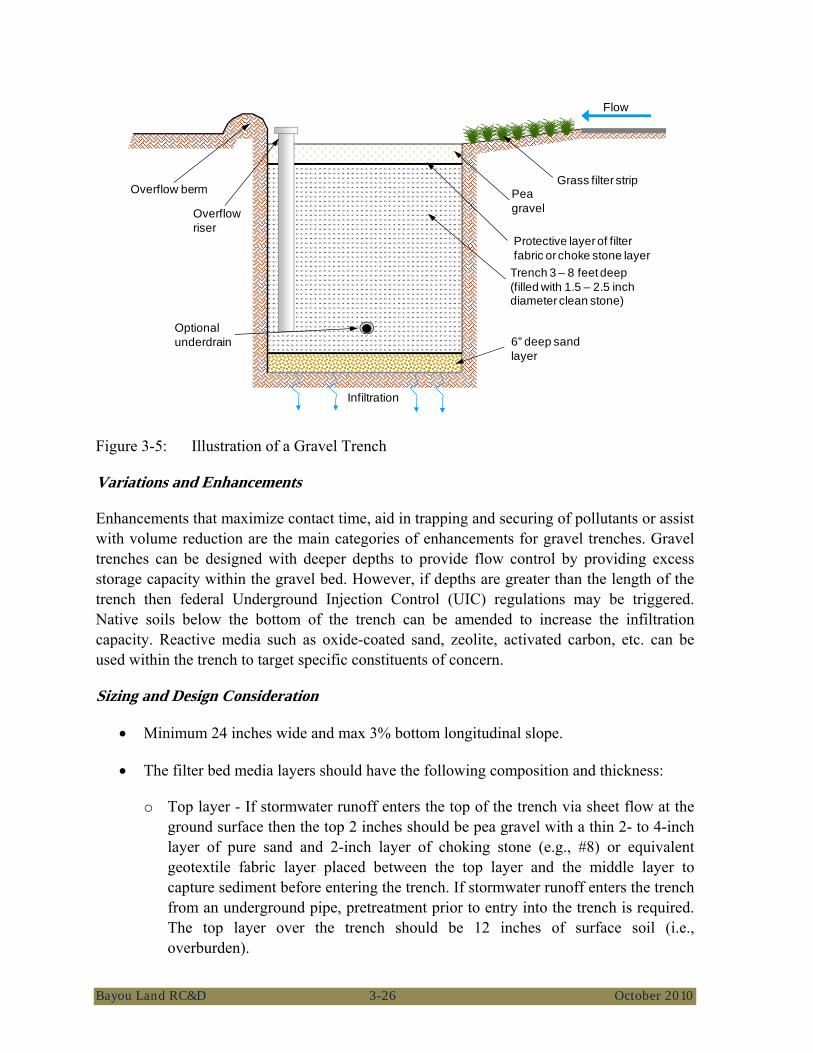
Bayou Land RC&D 3-26 October 2010
Figure 3-5: Illustration of a Gravel Trench
Variations and Enhancements
Enhancements that maximize contact time, aid in trapping and securing of pollutants or assist with volume reduction are the main categories of enhancements for gravel trenches. Gravel trenches can be designed with deeper depths to provide flow control by providing excess storage capacity within the gravel bed. However, if depths are greater than the length of the trench then federal Underground Injection Control (UIC) regulations may be triggered. Native soils below the bottom of the trench can be amended to increase the infiltration capacity. Reactive media such as oxide-coated sand, zeolite, activated carbon, etc. can be used within the trench to target specific constituents of concern.
Sizing and Design Consideration
• Minimum 24 inches wide and max 3% bottom longitudinal slope.
• The filter bed media layers should have the following composition and thickness:
o Top layer - If stormwater runoff enters the top of the trench via sheet flow at the ground surface then the top 2 inches should be pea gravel with a thin 2- to 4-inch layer of pure sand and 2-inch layer of choking stone (e.g., #8) or equivalent geotextile fabric layer placed between the top layer and the middle layer to capture sediment before entering the trench. If stormwater runoff enters the trench from an underground pipe, pretreatment prior to entry into the trench is required. The top layer over the trench should be 12 inches of surface soil (i.e., overburden).
Flow
Pea gravel
Protective layer of filter fabric or choke stone layer
Trench 3 – 8 feet deep (filled with 1.5 – 2.5 inch diameter clean stone)
6” deep sand layer
Overflow berm
Infiltration
Grass filter strip
Optional underdrain
Overflow riser
Bayou Land RC&D 3-27 October 2010
o Middle layer (3-5 feet of washed 1.5 to 2.5-inch gravel). Void space should be in the range of 30 percent to 40 percent.
o Bottom layer (6” of clean, washed sand to encourage drainage and prevent compaction of the native soil while the stone aggregate is added).
• One or more observation wells should be installed, depending on trench length, to check for water levels, drawdown time, and evidence of clogging. A typical observation well consists of a slotted PVC well screen, 4 to 6 inches in diameter, capped with a lockable, above-ground lid.
• The bottom of infiltration bed must be native soil, over-excavated to at least one foot in depth and replaced uniformly without compaction. Amending the excavated soil with 2-4 inches (~15-30%) of coarse sand is recommended.
• If underdrains are provided, they should be made of slotted, polyvinyl chloride (PVC) pipe conforming to ASTM D 3034 or equivalent or corrugated high density polyethylene (HDPE) pipe conforming to AASHTO 252M or equivalent. Intent: As compared to round-hole perforated pipe, slotted underdrains provide greater intake capacity, clog resistant drainage, and reduced entrance velocity into the pipe, thereby reducing the chances of solids migration.
Construction Considerations
• The entire area draining to the facility must be stabilized before construction begins. If this is impossible, a diversion berm must be placed around the perimeter of the infiltration site to prevent sediment entrance during construction.
• The trench should not be hydraulically connected to the stormwater conveyance system until all contributing tributary areas are stabilized. Gravel trenches should not be used as sediment control facilities.
• Compaction of the subgrade with heavy equipment should be minimized to the maximum extent possible. If the use of heavy equipment on the base of the facility cannot be avoided, the infiltrative capacity should be restored by tilling or aerating prior to placing the infiltrative bed.
• If no underdrain will be provided, the exposed soils should be inspected by a civil engineer or geologist after excavation to confirm that soil conditions are suitable.
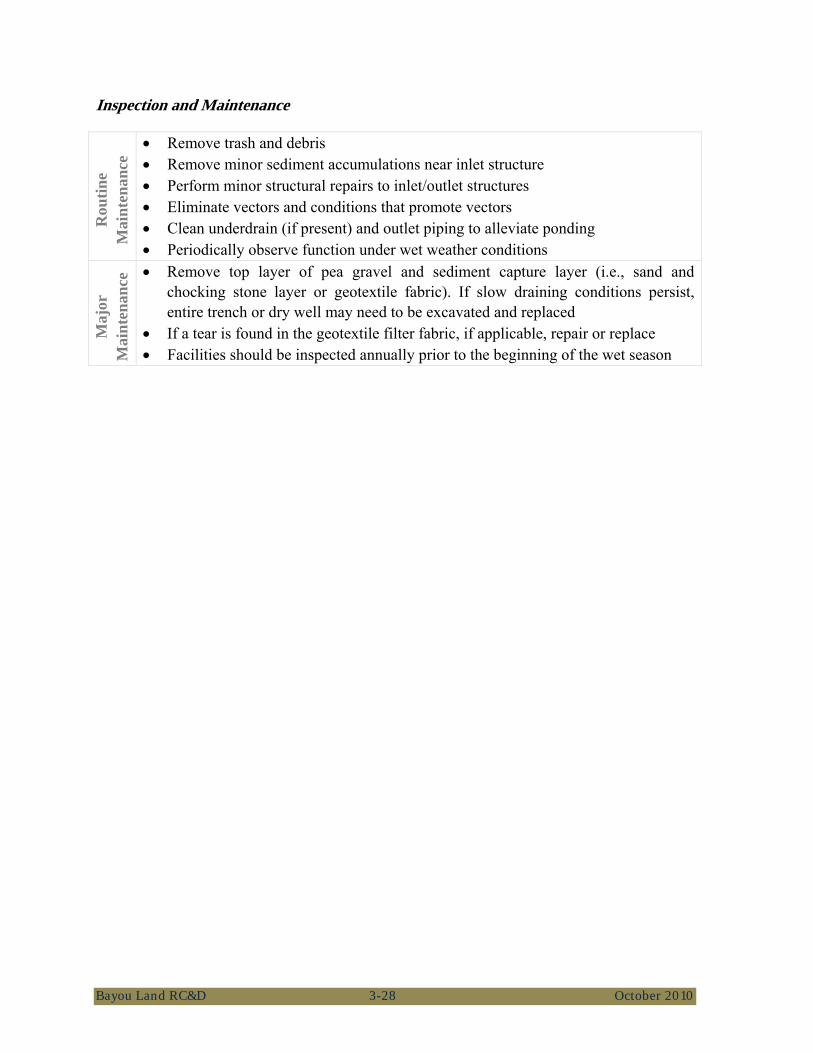
Bayou Land RC&D 3-28 October 2010
Inspection and Maintenance R
outin
e M
aint
enan
ce • Remove trash and debris
• Remove minor sediment accumulations near inlet structure • Perform minor structural repairs to inlet/outlet structures • Eliminate vectors and conditions that promote vectors • Clean underdrain (if present) and outlet piping to alleviate ponding • Periodically observe function under wet weather conditions
Maj
or
Mai
nten
ance
• Remove top layer of pea gravel and sediment capture layer (i.e., sand and chocking stone layer or geotextile fabric). If slow draining conditions persist, entire trench or dry well may need to be excavated and replaced
• If a tear is found in the geotextile filter fabric, if applicable, repair or replace • Facilities should be inspected annually prior to the beginning of the wet season

Bayou Land RC&D 3-29 October 2010
3.3.3 Sand Filters
Sand filters are engineered sand filled depressions that treat stormwater runoff from small drainage areas. Sand filters allow for the percolation of runoff through the void space within the sand before it is eventually released through an underdrain at the bottom of the filter.
How does a sand filter work?
Runoff enters the filter and spreads over the surface. As flows increase, water backs up on the surface of the filter where it is held until it can percolate through the sand. The treatment pathway is vertical (downward through the sand). As stormwater passes through the sand, pollutants are trapped in the small pore spaces between sand grains or are adsorbed to the sand surface. Reactive media (e.g., zeolite, activated carbon, oxide-coated sand, etc.) may be incorporated into the design to increase sorption capacity and target specific pollutants.
Where should a sand filter be used?
A sand filter may be used in nearly all developments where site characteristics provide adequate hydraulic head to effectively operate the filter. Approximately 4 ft of elevation difference is recommended between the inlet and outlet of the filter. Landscape uses of sand filters are limited due to the small numbers of plant species that can survive in sand. Large trees and shrubs that generate leaf litter should not be located near a sand filter, as the leaves tend to clog the surface of the filter and reduce infiltrative capacity.
Sand filters are designed to prevent water backup in the sand layer, as saturated sands can lead to anoxic conditions where metals and phosphorus can be mobilized. The underdrain system must flow freely. In areas with high groundwater tables that could potentially flood the underdrain system, an impermeable liner should be provided.
Limitations
• Site must have adequate relief between land
• Limited removal of dissolved constituents
• Not suitable for large or high sediment producing drainage areas
• Diligent maintenance required to avoid clogging
Advantages
• Relatively small areal footprint; can be constructed in a concrete box
• Suspended solids and particulate-bound pollutant removal
• Volume & peak flow reduction
Applications
• Commercial and institutional developments
• Multi-family and mixed use • Highway on/off ramps (cloverleafs) • Parking lots
• Open spaces, parks, golf courses
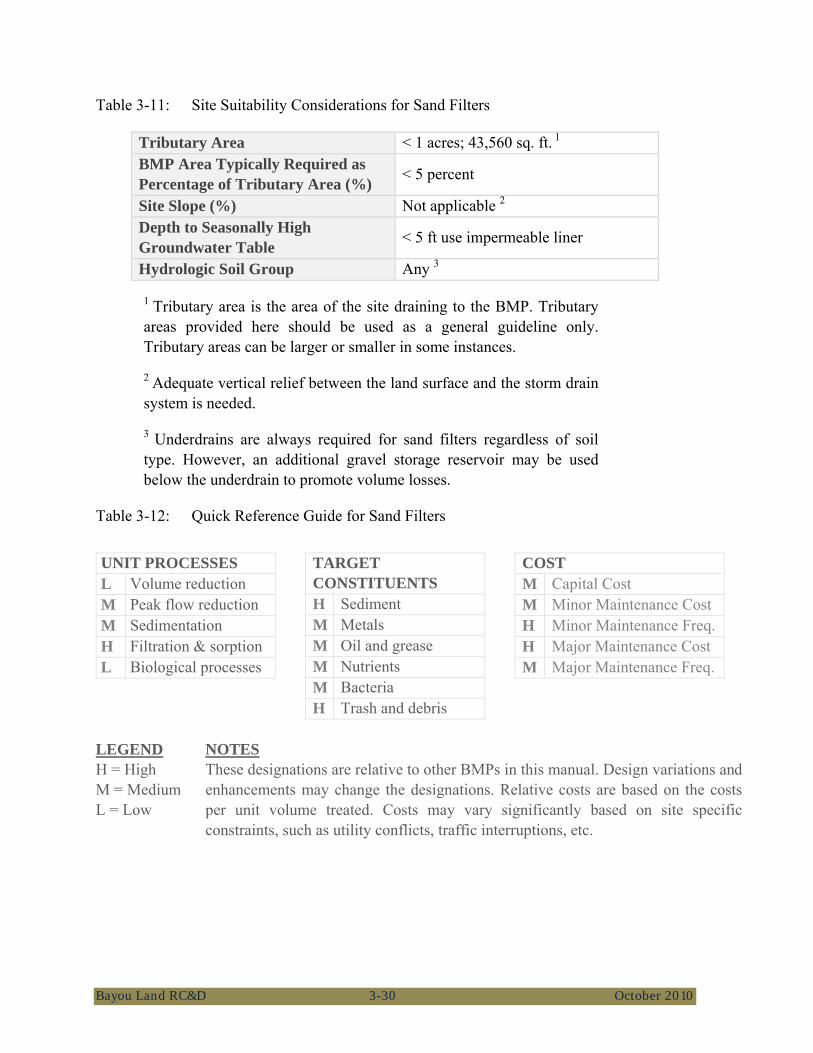
Bayou Land RC&D 3-30 October 2010
Table 3-11: Site Suitability Considerations for Sand Filters
Tributary Area < 1 acres; 43,560 sq. ft. 1 BMP Area Typically Required as Percentage of Tributary Area (%) < 5 percent
Site Slope (%) Not applicable 2 Depth to Seasonally High Groundwater Table < 5 ft use impermeable liner
Hydrologic Soil Group Any 3
1 Tributary area is the area of the site draining to the BMP. Tributary areas provided here should be used as a general guideline only. Tributary areas can be larger or smaller in some instances.
2 Adequate vertical relief between the land surface and the storm drain system is needed.
3 Underdrains are always required for sand filters regardless of soil type. However, an additional gravel storage reservoir may be used below the underdrain to promote volume losses.
Table 3-12: Quick Reference Guide for Sand Filters
UNIT PROCESSES L Volume reduction M Peak flow reduction M Sedimentation H Filtration & sorption L Biological processes
TARGET CONSTITUENTS H Sediment M Metals M Oil and grease M Nutrients M Bacteria H Trash and debris
COST M Capital Cost M Minor Maintenance Cost H Minor Maintenance Freq. H Major Maintenance Cost M Major Maintenance Freq.
LEGEND H = High M = Medium L = Low
NOTES These designations are relative to other BMPs in this manual. Design variations and enhancements may change the designations. Relative costs are based on the costs per unit volume treated. Costs may vary significantly based on site specificconstraints, such as utility conflicts, traffic interruptions, etc.
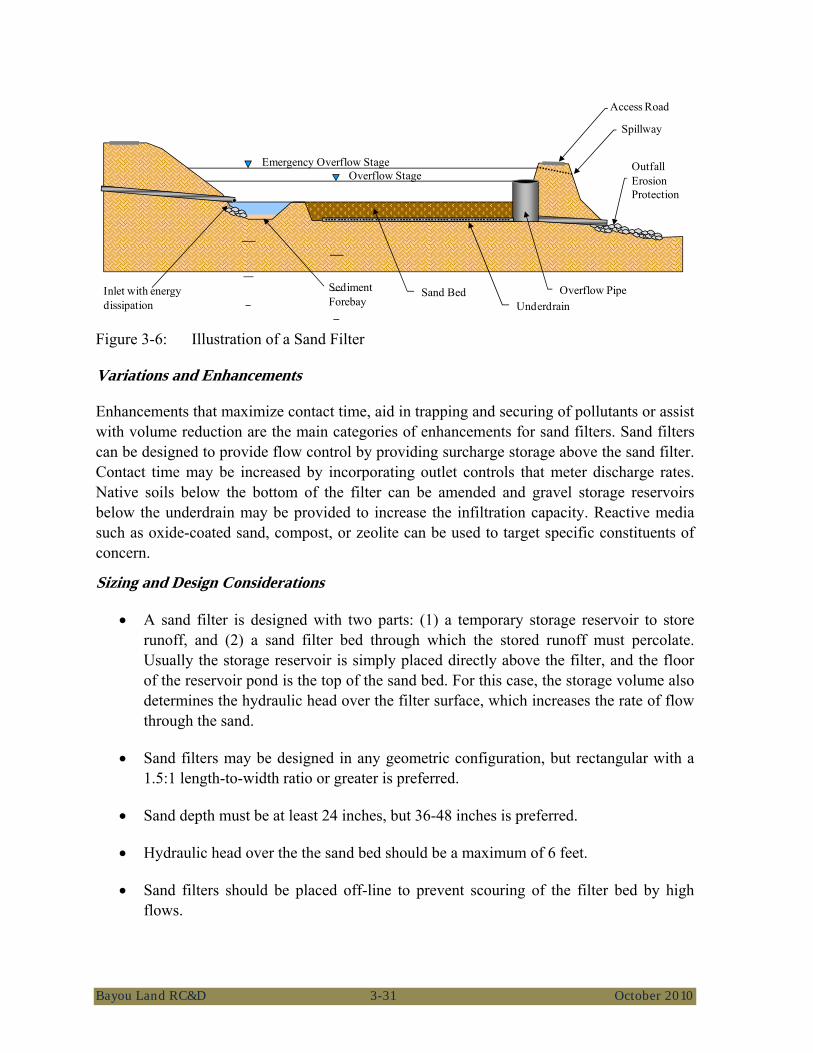
Bayou Land RC&D 3-31 October 2010
Figure 3-6: Illustration of a Sand Filter
Variations and Enhancements
Enhancements that maximize contact time, aid in trapping and securing of pollutants or assist with volume reduction are the main categories of enhancements for sand filters. Sand filters can be designed to provide flow control by providing surcharge storage above the sand filter. Contact time may be increased by incorporating outlet controls that meter discharge rates. Native soils below the bottom of the filter can be amended and gravel storage reservoirs below the underdrain may be provided to increase the infiltration capacity. Reactive media such as oxide-coated sand, compost, or zeolite can be used to target specific constituents of concern.
Sizing and Design Considerations
• A sand filter is designed with two parts: (1) a temporary storage reservoir to store runoff, and (2) a sand filter bed through which the stored runoff must percolate. Usually the storage reservoir is simply placed directly above the filter, and the floor of the reservoir pond is the top of the sand bed. For this case, the storage volume also determines the hydraulic head over the filter surface, which increases the rate of flow through the sand.
• Sand filters may be designed in any geometric configuration, but rectangular with a 1.5:1 length-to-width ratio or greater is preferred.
• Sand depth must be at least 24 inches, but 36-48 inches is preferred.
• Hydraulic head over the the sand bed should be a maximum of 6 feet.
• Sand filters should be placed off-line to prevent scouring of the filter bed by high flows.
Sediment Forebay
Emergency Overflow StageOverflow Stage
Overflow Pipe
Outfall Erosion Protection
Spillway
Access Road
Inlet with energy dissipation
Sand BedUnderdrain
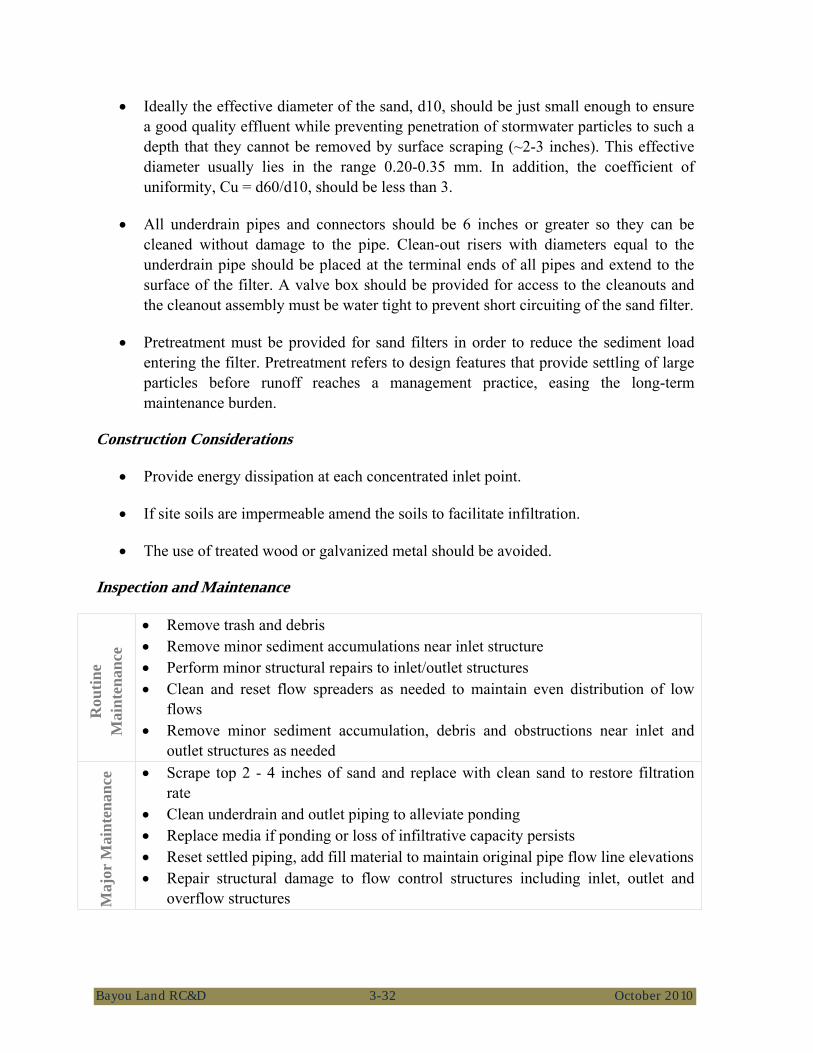
Bayou Land RC&D 3-32 October 2010
• Ideally the effective diameter of the sand, d10, should be just small enough to ensure a good quality effluent while preventing penetration of stormwater particles to such a depth that they cannot be removed by surface scraping (~2-3 inches). This effective diameter usually lies in the range 0.20-0.35 mm. In addition, the coefficient of uniformity, Cu = d60/d10, should be less than 3.
• All underdrain pipes and connectors should be 6 inches or greater so they can be cleaned without damage to the pipe. Clean-out risers with diameters equal to the underdrain pipe should be placed at the terminal ends of all pipes and extend to the surface of the filter. A valve box should be provided for access to the cleanouts and the cleanout assembly must be water tight to prevent short circuiting of the sand filter.
• Pretreatment must be provided for sand filters in order to reduce the sediment load entering the filter. Pretreatment refers to design features that provide settling of large particles before runoff reaches a management practice, easing the long-term maintenance burden.
Construction Considerations
• Provide energy dissipation at each concentrated inlet point.
• If site soils are impermeable amend the soils to facilitate infiltration.
• The use of treated wood or galvanized metal should be avoided.
Inspection and Maintenance
Rou
tine
Mai
nten
ance
• Remove trash and debris • Remove minor sediment accumulations near inlet structure • Perform minor structural repairs to inlet/outlet structures • Clean and reset flow spreaders as needed to maintain even distribution of low
flows • Remove minor sediment accumulation, debris and obstructions near inlet and
outlet structures as needed
Maj
or M
aint
enan
ce • Scrape top 2 - 4 inches of sand and replace with clean sand to restore filtration
rate • Clean underdrain and outlet piping to alleviate ponding • Replace media if ponding or loss of infiltrative capacity persists • Reset settled piping, add fill material to maintain original pipe flow line elevations • Repair structural damage to flow control structures including inlet, outlet and
overflow structures

Bayou Land RC&D 3-33 October 2010
3.4 Building BMPs
3.4.1 Cistern/Rain Barrel
Cisterns are large rain barrels. While rain barrels are less than 100 gallons, cisterns range from 100 to 10,000 gallons in capacity. Cisterns collect and temporarily store runoff from rooftops for later use as irrigation and/or other non-potable uses, such as toilet flushing.
How do cisterns/rain barrels work?
Cisterns capture and retain stormwater from impervious surfaces reducing the volume and peak flows during rain events and reducing contaminant mobilization. Reduced flows may also allow other BMPs to perform more effectively by increasing the percent of runoff volume captured downstream and limiting the volume of stormwater that is bypassed when capacity is met.
Where should cisterns/rain barrels be used?
Cisterns and rain barrels may be installed wherever a demand for non-potable water exists. Irrigation demand is typically low immediately after a storm event, so large storage volumes may be needed for this BMP to significantly reduce runoff. Supplemental non-potable indoor water uses can improve the effectiveness of this BMP. However, local plumbing and health codes may require parallel piping and onsite disinfection before indoor uses are permitted.
Cisterns and rain barrels may be placed above or below ground and pumps are often necessary to distribute the harvested rainwater to the point of use. Typically, only rooftop runoff is captured due to the additional pretreatment required prior to storing pavement runoff as well as the expense and potential feasibility of underground tanks.
Limitations
• Capturing runoff from surfaces other than rooftops requires treatment prior to storage
• Effective implementation requires reliable and constant demand for non-potable water use
• Mechanical components require regular maintenance
Advantages
• Simple design and construction • Non-potable water use and
associated cost/energy savings • Relatively low capital and
maintenance costs compared to detention basins
• Small footprint • Easy to implement as retrofit
Applications
• Any type of land use, provided adequate end use of water
• Collect rooftop runoff and other relatively clean impervious surfaces (e.g., sidewalks, driveways, etc.)
• Above or below ground
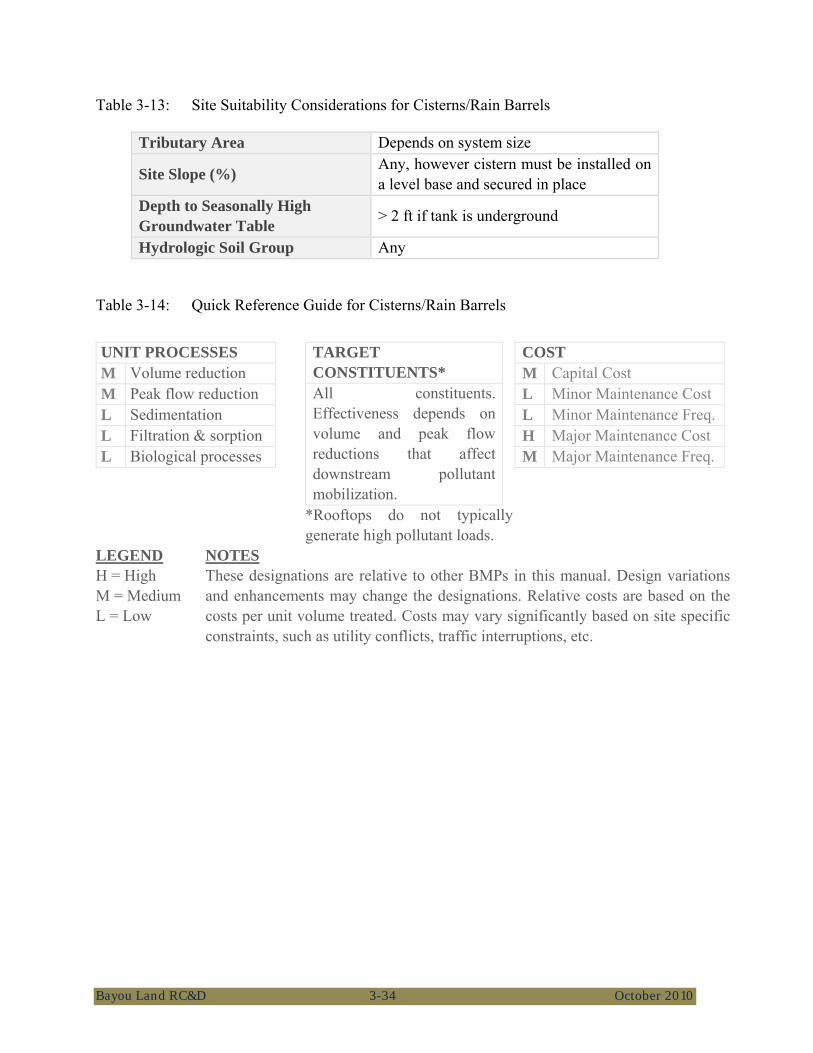
Bayou Land RC&D 3-34 October 2010
Table 3-13: Site Suitability Considerations for Cisterns/Rain Barrels
Tributary Area Depends on system size
Site Slope (%) Any, however cistern must be installed on a level base and secured in place
Depth to Seasonally High Groundwater Table > 2 ft if tank is underground
Hydrologic Soil Group Any
Table 3-14: Quick Reference Guide for Cisterns/Rain Barrels
UNIT PROCESSES M Volume reduction M Peak flow reduction L Sedimentation L Filtration & sorption L Biological processes
TARGET CONSTITUENTS* All constituents. Effectiveness depends on volume and peak flow reductions that affect downstream pollutant mobilization.
*Rooftops do not typicallygenerate high pollutant loads.
COST M Capital Cost L Minor Maintenance Cost L Minor Maintenance Freq. H Major Maintenance Cost M Major Maintenance Freq.
LEGEND H = High M = Medium L = Low
NOTES These designations are relative to other BMPs in this manual. Design variations and enhancements may change the designations. Relative costs are based on the costs per unit volume treated. Costs may vary significantly based on site specificconstraints, such as utility conflicts, traffic interruptions, etc.

Bayou Land RC&D 3-35 October 2010
Figure 3-7: Illustration of a Cistern Rainwater Harvest System
Variations and Enhancements
Smart irrigation controls may be employed to effectively manage water retained in cisterns for application between rain events. Active outlet controls that drain the cistern prior to a storm event may be employed to improve the capture efficiency and peak attenuation of the cistern. Even if there is no demand for the captured water at the time the tank needs to be emptied, these controls can be effective at reducing flood flows because captured water is released between storms when the storm drain system has ample capacity.
Sizing and Design Considerations
The following components are required for installing and utilizing a cistern: (1) pipes that divert runoff to the cistern, (2) an overflow for when the cistern if full, (3) a pump, and (4) a distribution system to get the water to where it is intended to be used. Additional components are needed if treatment prior to storage is required (e.g., downspout filter for roofs with overhanging trees, oil/water separator if capturing parking lot runoff) or if indoor water uses are desired.
The effectiveness of rainwater harvesting systems is a function of tributary area, storage volume, demand patterns and magnitudes, and operational regime. If either of the latter two factors is too complex, simple design criteria metrics are not possible. Due to the intricacies involved in considering a variable storage capacity, actively controlled cisterns are best sized using a continuous simulation model with a long-term precipitation record and known water demand cycle.
Roof drain collection system
Optional filtration system
To irrigation or other non-potable use distribution system
Optional floating cistern filter
Cistern
Optional in-house pump, filtration, disinfection system
Optional connection to non-potable plumbing system
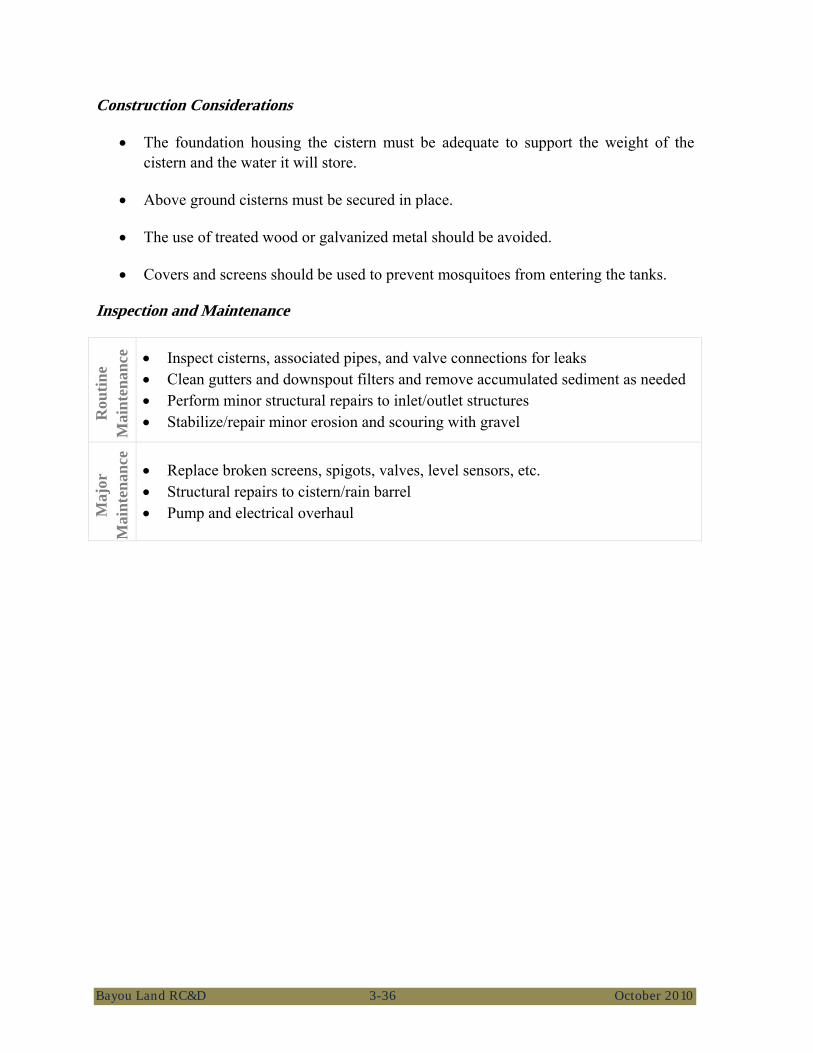
Bayou Land RC&D 3-36 October 2010
Construction Considerations
• The foundation housing the cistern must be adequate to support the weight of the cistern and the water it will store.
• Above ground cisterns must be secured in place.
• The use of treated wood or galvanized metal should be avoided.
• Covers and screens should be used to prevent mosquitoes from entering the tanks.
Inspection and Maintenance
Rou
tine
Mai
nten
ance
• Inspect cisterns, associated pipes, and valve connections for leaks • Clean gutters and downspout filters and remove accumulated sediment as needed • Perform minor structural repairs to inlet/outlet structures • Stabilize/repair minor erosion and scouring with gravel
Maj
or
Mai
nten
ance
• Replace broken screens, spigots, valves, level sensors, etc. • Structural repairs to cistern/rain barrel • Pump and electrical overhaul
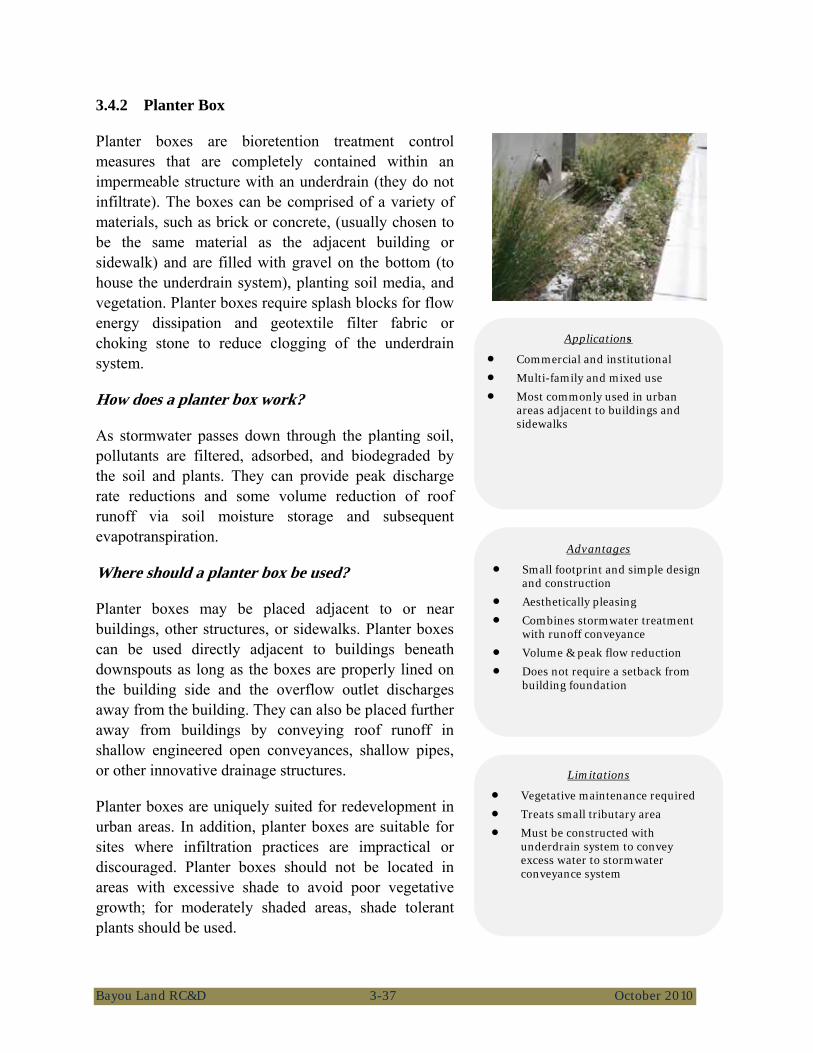
Bayou Land RC&D 3-37 October 2010
3.4.2 Planter Box
Planter boxes are bioretention treatment control measures that are completely contained within an impermeable structure with an underdrain (they do not infiltrate). The boxes can be comprised of a variety of materials, such as brick or concrete, (usually chosen to be the same material as the adjacent building or sidewalk) and are filled with gravel on the bottom (to house the underdrain system), planting soil media, and vegetation. Planter boxes require splash blocks for flow energy dissipation and geotextile filter fabric or choking stone to reduce clogging of the underdrain system.
How does a planter box work?
As stormwater passes down through the planting soil, pollutants are filtered, adsorbed, and biodegraded by the soil and plants. They can provide peak discharge rate reductions and some volume reduction of roof runoff via soil moisture storage and subsequent evapotranspiration.
Where should a planter box be used?
Planter boxes may be placed adjacent to or near buildings, other structures, or sidewalks. Planter boxes can be used directly adjacent to buildings beneath downspouts as long as the boxes are properly lined on the building side and the overflow outlet discharges away from the building. They can also be placed further away from buildings by conveying roof runoff in shallow engineered open conveyances, shallow pipes, or other innovative drainage structures.
Planter boxes are uniquely suited for redevelopment in urban areas. In addition, planter boxes are suitable for sites where infiltration practices are impractical or discouraged. Planter boxes should not be located in areas with excessive shade to avoid poor vegetative growth; for moderately shaded areas, shade tolerant plants should be used.
Limitations
• Vegetative maintenance required • Treats small tributary area • Must be constructed with
underdrain system to convey excess water to stormwater conveyance system
Advantages
• Small footprint and simple design and construction
• Aesthetically pleasing • Combines stormwater treatment
with runoff conveyance • Volume & peak flow reduction • Does not require a setback from
building foundation
Applications
• Commercial and institutional • Multi-family and mixed use • Most commonly used in urban
areas adjacent to buildings and sidewalks
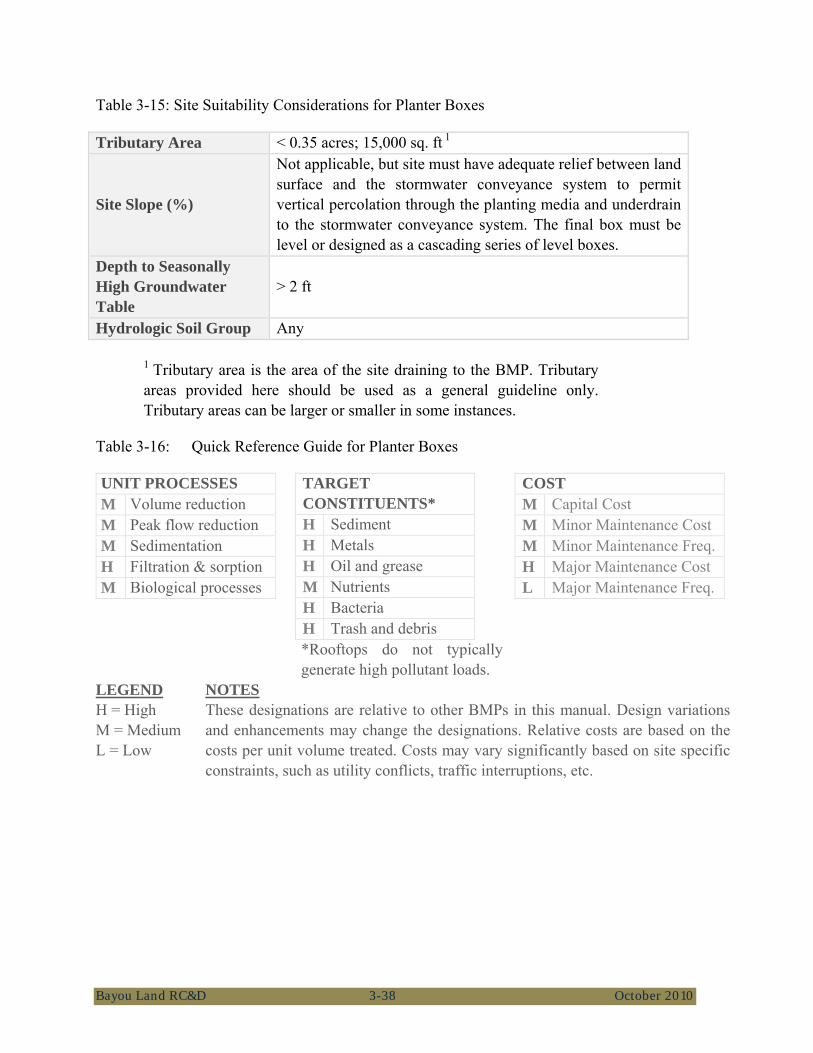
Bayou Land RC&D 3-38 October 2010
Table 3-15: Site Suitability Considerations for Planter Boxes
Tributary Area < 0.35 acres; 15,000 sq. ft 1
Site Slope (%)
Not applicable, but site must have adequate relief between land surface and the stormwater conveyance system to permit vertical percolation through the planting media and underdrain to the stormwater conveyance system. The final box must be level or designed as a cascading series of level boxes.
Depth to Seasonally High Groundwater Table
> 2 ft
Hydrologic Soil Group Any
1 Tributary area is the area of the site draining to the BMP. Tributary areas provided here should be used as a general guideline only. Tributary areas can be larger or smaller in some instances.
Table 3-16: Quick Reference Guide for Planter Boxes
UNIT PROCESSES M Volume reduction M Peak flow reduction M Sedimentation H Filtration & sorption M Biological processes
TARGET CONSTITUENTS* H Sediment H Metals H Oil and grease M Nutrients H Bacteria H Trash and debris *Rooftops do not typically generate high pollutant loads.
COST M Capital Cost M Minor Maintenance Cost M Minor Maintenance Freq. H Major Maintenance Cost L Major Maintenance Freq.
LEGEND H = High M = Medium L = Low
NOTES These designations are relative to other BMPs in this manual. Design variations and enhancements may change the designations. Relative costs are based on thecosts per unit volume treated. Costs may vary significantly based on site specific constraints, such as utility conflicts, traffic interruptions, etc.
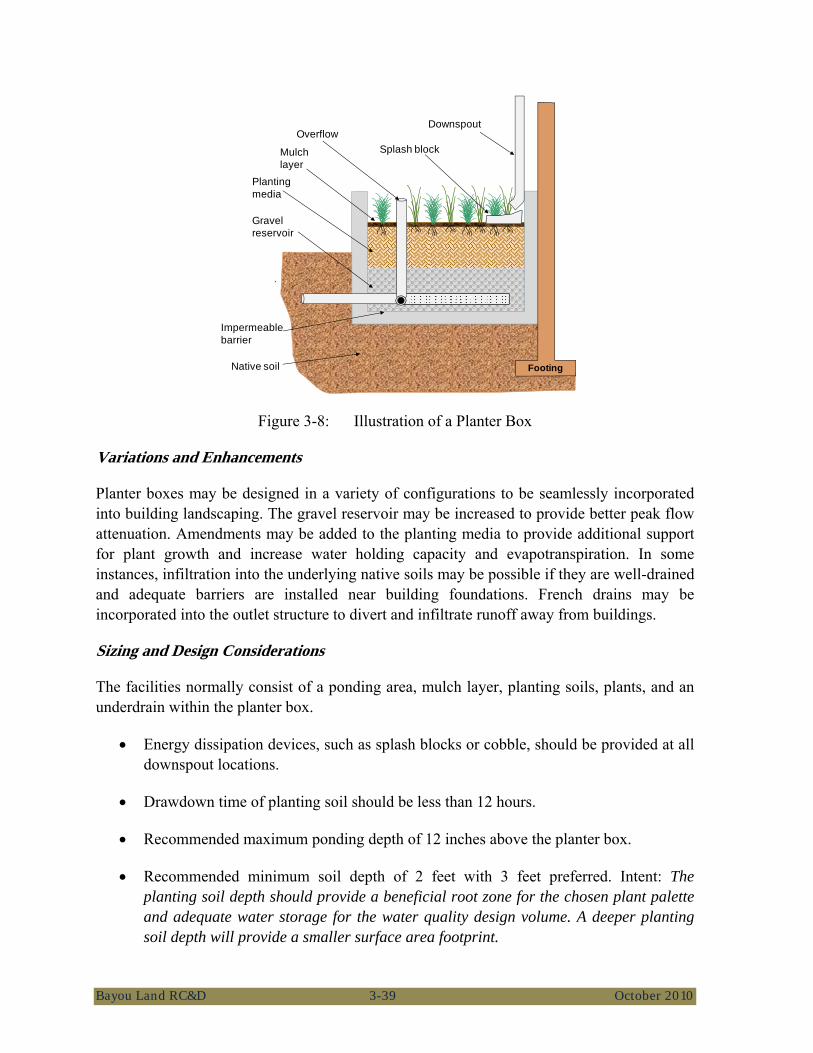
Bayou Land RC&D 3-39 October 2010
Figure 3-8: Illustration of a Planter Box
Variations and Enhancements
Planter boxes may be designed in a variety of configurations to be seamlessly incorporated into building landscaping. The gravel reservoir may be increased to provide better peak flow attenuation. Amendments may be added to the planting media to provide additional support for plant growth and increase water holding capacity and evapotranspiration. In some instances, infiltration into the underlying native soils may be possible if they are well-drained and adequate barriers are installed near building foundations. French drains may be incorporated into the outlet structure to divert and infiltrate runoff away from buildings.
Sizing and Design Considerations
The facilities normally consist of a ponding area, mulch layer, planting soils, plants, and an underdrain within the planter box.
• Energy dissipation devices, such as splash blocks or cobble, should be provided at all downspout locations.
• Drawdown time of planting soil should be less than 12 hours.
• Recommended maximum ponding depth of 12 inches above the planter box.
• Recommended minimum soil depth of 2 feet with 3 feet preferred. Intent: The planting soil depth should provide a beneficial root zone for the chosen plant palette and adequate water storage for the water quality design volume. A deeper planting soil depth will provide a smaller surface area footprint.
Footing
Planting media
Gravel reservoir
Impermeable barrier
Native soil
OverflowSplash block
Downspout
Mulch layer
Bayou Land RC&D 3-40 October 2010
• Soil composition 60 to 70% sand, 15 to 25% compost, and 10 to 20% clean topsoil; organic content 8 to 12%; pH 5.5 to 7.5.
• Overflow devices are required.
• Underdrains should be made of slotted, polyvinyl chloride (PVC) pipe conforming to ASTM D 3034 or equivalent or corrugated high density polyethylene (HDPE) pipe conforming to AASHTO 252M or equivalent. Intent: As compared to round-hole perforated pipe, slotted underdrains provide greater intake capacity, clog resistant drainage, and reduced entrance velocity into the pipe, thereby reducing the chances of solids migration.
• The underdrain should be placed within a bed of aggregate with a minimum thickness of 6 inches around the top, bottom, and sides of the slotted pipe.
• A 30 mil geomembrane liner or equivalent liner is recommended to avoid infiltration near building foundations.
Construction Considerations
• Provide energy dissipation (e.g., splash block) at each concentrated inlet point.
• The use of treated wood or galvanized metal anywhere within the planter box should be avoided.
• Material of planter boxes should be selected carefully to blend in and enhance aesthetics of adjacent structures (buildings and sidewalks).
• Plants should be selected carefully to minimize maintenance and function properly. Native plant species and/or hardy cultivars that are not invasive are preferred.
Bayou Land RC&D 3-41 October 2010
Inspection and Maintenance R
outin
e M
aint
enan
ce
• Repair small eroded areas and ruts by filling with gravel. Overseed bare areas to reestablish vegetation
• Remove trash and debris and rake surface soils to mitigate ponding • Remove accumulated fine sediments, dead leaves and trash to restore surface
permeability • Remove any evidence of visual contamination from floatables such as oil and
grease • Eradicate weeds and prune back excess plant growth that interferes with facility
operation. Remove non-native vegetation and replace with native species • Remove sediment and debris accumulation near inlet and outlet structures to
alleviate clogging • Clean and reset flow spreaders (if present) as needed to restore original function. • Periodically observe function under wet weather conditions
Maj
or
Mai
nten
ance
• Repair structural damage to flow control structures including inlet, outlet, and overflow structures
• Clean out under-drain, to alleviate ponding. Replace media (if ponding or loss of infiltrative capacity persists) and re-vegetate
• Re-grade and re-vegetate to repair damage from severe erosion/scour channelization

Bayou Land RC&D 3-42 October 2010
3.4.3 Green Roof
Green roofs (also known as eco-roofs and vegetated roof covers) are roofing systems that layer a soil/vegetative cover over a waterproofing membrane. There are two types of green roofing systems; extensive, which is a light-weight system, and intensive, which is a heavier system that allows for larger plants but requires additional structural support.
How does a green roof work?
Green roofs rely on highly porous media and moisture retention layers to store intercepted precipitation and to support vegetation that can reduce peak flows and the volume of stormwater runoff via evapotranspiration. Reduced flows may also limit contaminant mobilization and allow other downstream BMPs to perform more effectively by increasing the percent of runoff volume captured.
Where should a green roof be used?
Green roofs should only be applied on flat to slightly sloping roofs that have been designed to support the additional weight of green roof material.
Limitations
• Roof must be able to support added load from roof and designed capacity
• Vegetative maintenance required • Costs more than a conventional
roof
Advantages
• Volume and peak flow reduction • Demonstrated to keep buildings
cooler in summer and warmer in the winter
• Aesthetically pleasing • Lifespan can be significantly
longer than a conventional roof
Applications
• Commercial and institutional rooftops
• Single family, multi-family and mixed use rooftops
• Rooftops, podiums, and decks above building structures
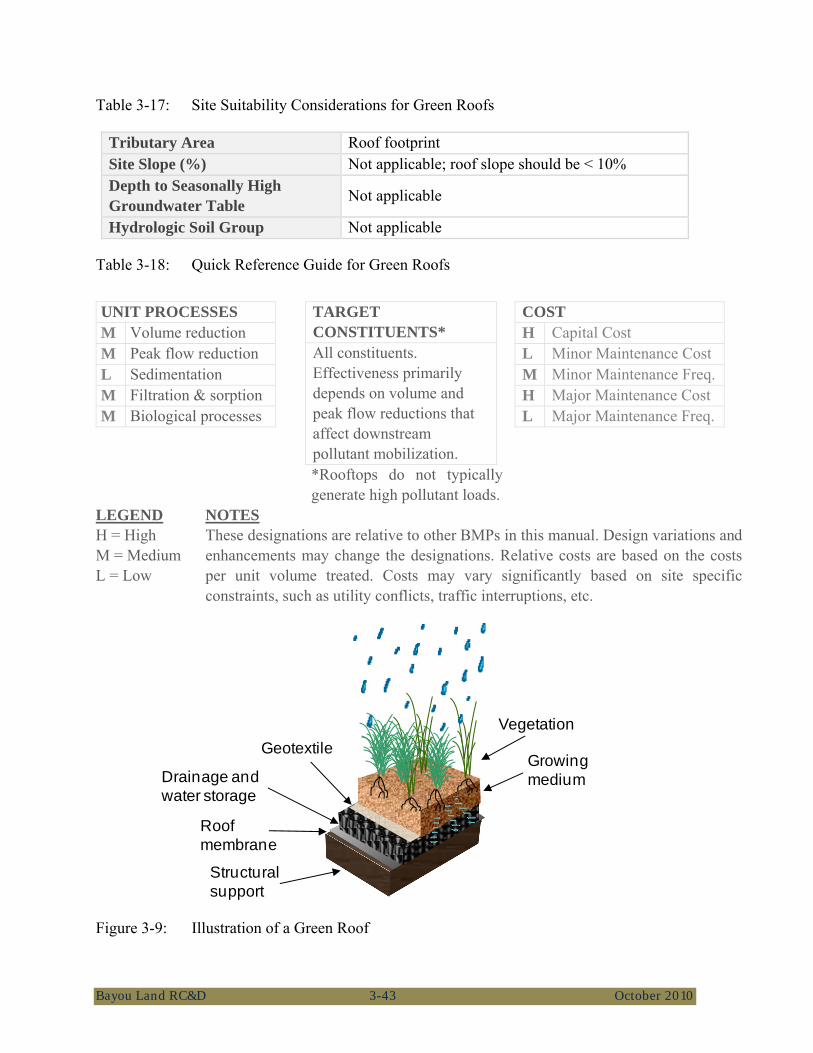
Bayou Land RC&D 3-43 October 2010
Table 3-17: Site Suitability Considerations for Green Roofs
Tributary Area Roof footprint Site Slope (%) Not applicable; roof slope should be < 10% Depth to Seasonally High Groundwater Table Not applicable
Hydrologic Soil Group Not applicable
Table 3-18: Quick Reference Guide for Green Roofs
Figure 3-9: Illustration of a Green Roof
VegetationGrowing medium
GeotextileDrainage and water storage
Structural support
Roof membrane
UNIT PROCESSES M Volume reduction M Peak flow reduction L Sedimentation M Filtration & sorption M Biological processes
TARGET CONSTITUENTS* All constituents. Effectiveness primarily depends on volume and peak flow reductions that affect downstream pollutant mobilization. *Rooftops do not typically generate high pollutant loads.
COST H Capital Cost L Minor Maintenance Cost M Minor Maintenance Freq. H Major Maintenance Cost L Major Maintenance Freq.
LEGEND H = High M = Medium L = Low
NOTES These designations are relative to other BMPs in this manual. Design variations and enhancements may change the designations. Relative costs are based on the costsper unit volume treated. Costs may vary significantly based on site specificconstraints, such as utility conflicts, traffic interruptions, etc.

Bayou Land RC&D 3-44 October 2010
Variations and Enhancements
Green roofs may be constructed with as little as two inches of growing medium to greater than a foot of growing medium. Some will only support a few varieties of sedums while others will support native flowers and grasses, highly maintained turf grass, garden vegetables, or even trees and shrubs. While the spectrum of design variations is continuous, green roofs are typically considered either intensive or extensive roofs. Extensive roofs are lightweight green roofs with typically less than six inches of growing medium and are generally planted with sedums or native plant species. Intensive green roofs generally include a deep layer of growing medium and can support a wide variety of plants, but often have greater irrigation and maintenance needs. Either type may have an integrated or modular design. Integrated designs have contiguous layers of media, drainage mat, and membrane that cover the green roof area. Modular designs may include trays or planters.
Sizing and Design Considerations
All green roof design must consider the following components.
Structural Support
The first requirement that must be met before installing a green roof is the structural support of the roof. The roof must be able to support the additional weight of the soil, water, and vegetation. This is especially a concern for retrofit projects; so for retrofits, a licensed structural engineer should be consulted to determine the current structural support present and what may need to be added to support the additional weight of 10 to 25 pounds per square foot. For new projects, the structural support concern should be addressed during the design phase.
Waterproof Roofing Membrane
Waterproof roofing membrane is an integral part of a green roofing system. The waterproof membrane prevents the roof runoff from penetrating and damaging the roofing material. There are many materials available for this purpose; they come in various forms (i.e., rolls, sheets, liquid) and exhibit different characteristics (e.g., flexibility, strength, etc.). Depending on the type of membrane chosen a root barrier may be required to prevent roots from compromising the integrity of the membrane.
Drainage Layer
Depending on the design of the roof, a drainage layer may be required to move the excess runoff off of the roof. If a drainage layer is needed, there are numerous options including a gravel layer (that may require additional structural support), and many different styles and types of plastic and drainage tray designs.
Bayou Land RC&D 3-45 October 2010
Soils
Soils are an important factor in the construction and operation of green roofs. The soil layer must have excellent drainage, not be too heavy when saturated, and be adequately fertile as a growing medium for plants. Many companies sell their own proprietary soil mixes. However, a simple mix of ¼ topsoil, ¼ compost, and the remainder pumice perlite may be used for many applications.
Vegetation
Green roofs should include erosion-resistant plant species that effectively bind the soil and can withstand the extreme environment of rooftops. A diverse selection of low growing plants that thrive under the specific site, climatic, and watering conditions should be specified. A mixture of drought tolerant, self-sustaining (perennial or self-sowing without need for fertilizers, herbicides, and or pesticides) is most effective. Plants selected should be low maintenance and able to withstand heat, cold, and high winds. Native or adapted sedum/succulent plants are preferred because they generally require less fertilizer, limited maintenance, and are more drought resistant than exotic plants.
Construction Considerations
• Building structure must be adequate to hold the additional weight of the soil, retained water, and plants.
• Plants should be selected carefully to minimize maintenance and function properly. Irrigation may be required during vegetation establishment.
Inspection and Maintenance
Rou
tine
Mai
nten
ance
• Inspect roofing membrane for signs of damage • Inspect for leaks in roofing system • Inspect drainage paths for clogging, clean if necessary • Inspect for signs of erosion or damage to vegetation • Cleaning of drain (where applicable) and/or unclogging outlet to eliminate
ponding water • Remove weeds and dead vegetation • Re-plant areas where weeds and dead vegetation were removed • Replace non-native vegetation with native species
Maj
or
Mai
nten
ance
• Clean and or replace drainage layer • Re-vegetate bare exposed portions of the swale to restore vegetation to original
level of coverage • Repair/replace waterproof roofing membrane
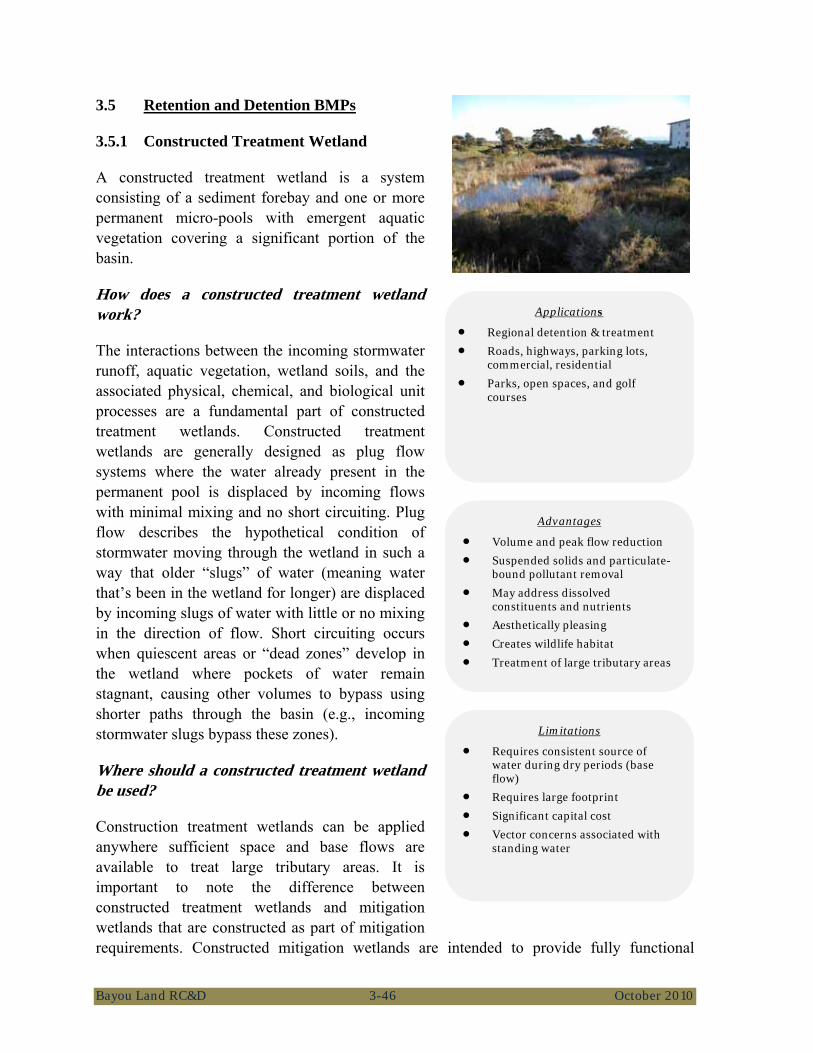
Bayou Land RC&D 3-46 October 2010
3.5 Retention and Detention BMPs
3.5.1 Constructed Treatment Wetland
A constructed treatment wetland is a system consisting of a sediment forebay and one or more permanent micro-pools with emergent aquatic vegetation covering a significant portion of the basin.
How does a constructed treatment wetland work?
The interactions between the incoming stormwater runoff, aquatic vegetation, wetland soils, and the associated physical, chemical, and biological unit processes are a fundamental part of constructed treatment wetlands. Constructed treatment wetlands are generally designed as plug flow systems where the water already present in the permanent pool is displaced by incoming flows with minimal mixing and no short circuiting. Plug flow describes the hypothetical condition of stormwater moving through the wetland in such a way that older “slugs” of water (meaning water that’s been in the wetland for longer) are displaced by incoming slugs of water with little or no mixing in the direction of flow. Short circuiting occurs when quiescent areas or “dead zones” develop in the wetland where pockets of water remain stagnant, causing other volumes to bypass using shorter paths through the basin (e.g., incoming stormwater slugs bypass these zones).
Where should a constructed treatment wetland be used?
Construction treatment wetlands can be applied anywhere sufficient space and base flows are available to treat large tributary areas. It is important to note the difference between constructed treatment wetlands and mitigation wetlands that are constructed as part of mitigation requirements. Constructed mitigation wetlands are intended to provide fully functional
Limitations
• Requires consistent source of water during dry periods (base flow)
• Requires large footprint • Significant capital cost • Vector concerns associated with
standing water
Advantages
• Volume and peak flow reduction • Suspended solids and particulate-
bound pollutant removal • May address dissolved
constituents and nutrients • Aesthetically pleasing • Creates wildlife habitat
• Treatment of large tributary areas
Applications
• Regional detention & treatment • Roads, highways, parking lots,
commercial, residential • Parks, open spaces, and golf
courses
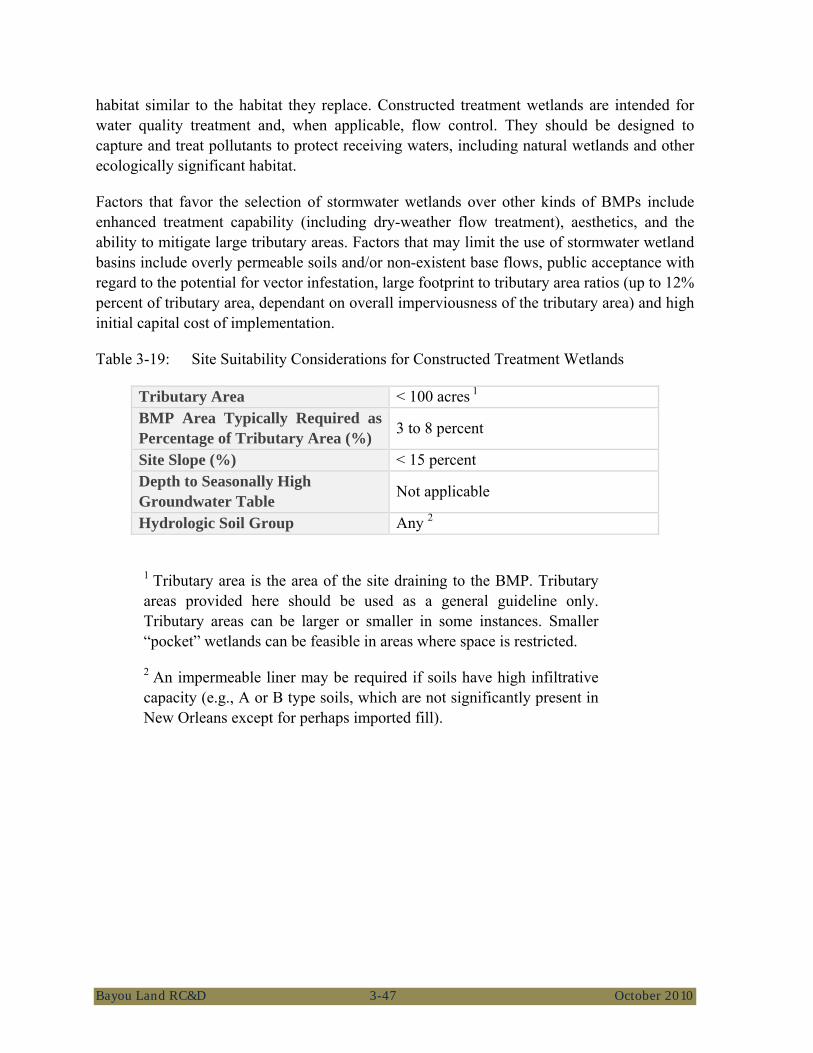
Bayou Land RC&D 3-47 October 2010
habitat similar to the habitat they replace. Constructed treatment wetlands are intended for water quality treatment and, when applicable, flow control. They should be designed to capture and treat pollutants to protect receiving waters, including natural wetlands and other ecologically significant habitat.
Factors that favor the selection of stormwater wetlands over other kinds of BMPs include enhanced treatment capability (including dry-weather flow treatment), aesthetics, and the ability to mitigate large tributary areas. Factors that may limit the use of stormwater wetland basins include overly permeable soils and/or non-existent base flows, public acceptance with regard to the potential for vector infestation, large footprint to tributary area ratios (up to 12% percent of tributary area, dependant on overall imperviousness of the tributary area) and high initial capital cost of implementation.
Table 3-19: Site Suitability Considerations for Constructed Treatment Wetlands
Tributary Area < 100 acres 1 BMP Area Typically Required as Percentage of Tributary Area (%) 3 to 8 percent
Site Slope (%) < 15 percent Depth to Seasonally High Groundwater Table Not applicable
Hydrologic Soil Group Any 2
1 Tributary area is the area of the site draining to the BMP. Tributary areas provided here should be used as a general guideline only. Tributary areas can be larger or smaller in some instances. Smaller “pocket” wetlands can be feasible in areas where space is restricted.
2 An impermeable liner may be required if soils have high infiltrative capacity (e.g., A or B type soils, which are not significantly present in New Orleans except for perhaps imported fill).
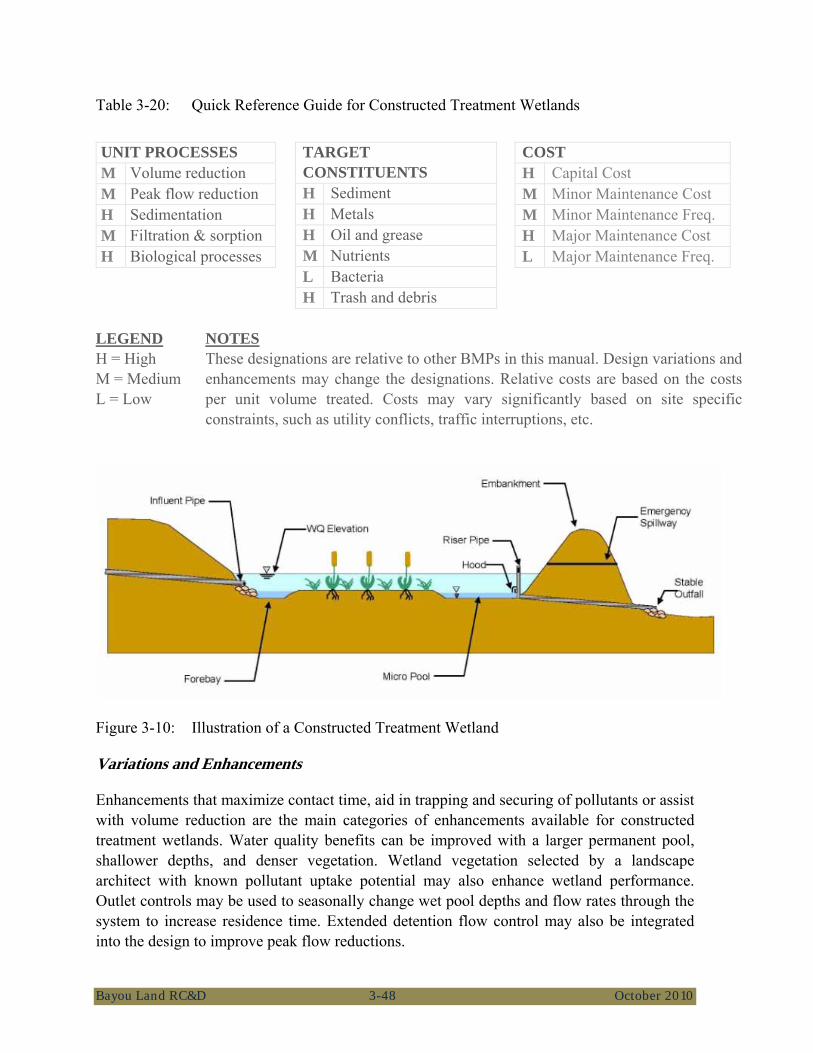
Bayou Land RC&D 3-48 October 2010
Table 3-20: Quick Reference Guide for Constructed Treatment Wetlands
Figure 3-10: Illustration of a Constructed Treatment Wetland
Variations and Enhancements
Enhancements that maximize contact time, aid in trapping and securing of pollutants or assist with volume reduction are the main categories of enhancements available for constructed treatment wetlands. Water quality benefits can be improved with a larger permanent pool, shallower depths, and denser vegetation. Wetland vegetation selected by a landscape architect with known pollutant uptake potential may also enhance wetland performance. Outlet controls may be used to seasonally change wet pool depths and flow rates through the system to increase residence time. Extended detention flow control may also be integrated into the design to improve peak flow reductions.
UNIT PROCESSES M Volume reduction M Peak flow reduction H Sedimentation M Filtration & sorption H Biological processes
TARGET CONSTITUENTS H Sediment H Metals H Oil and grease M Nutrients L Bacteria H Trash and debris
COST H Capital Cost M Minor Maintenance Cost M Minor Maintenance Freq. H Major Maintenance Cost L Major Maintenance Freq.
LEGEND H = High M = Medium L = Low
NOTES These designations are relative to other BMPs in this manual. Design variations and enhancements may change the designations. Relative costs are based on the costsper unit volume treated. Costs may vary significantly based on site specificconstraints, such as utility conflicts, traffic interruptions, etc.
Bayou Land RC&D 3-49 October 2010
Sizing and Design Considerations
Constructed treatment wetlands typically include components such as an inlet with energy dissipation, a sediment forebay for settling out coarse solids and to facilitate maintenance, a base with shallow sections (1 to 2 feet deep) planted with emergent vegetation, deeper areas or micro pools (3 to 5 feet deep), and a water quality outlet structure.
Water balance calculations should demonstrate that adequate water supply will be present to maintain a permanent pool of water during a drought year when precipitation is 50% of average for the site. Water balance calculations should include evapotranspiration, infiltration, precipitation, spillway discharge, and dry weather flow (where appropriate). Where water balance indicates that losses will exceed inputs, a source of water should be provided to maintain the wetland water surface elevation throughout the year. The water supply should be of sufficient quantity and quality to not have an adverse impact on the wetland water quality.
Some general design considerations include:
• Sediment forebay should be 4-8 feet deep and contain 10-20% of the total wetland volume.
• Emergent wetland vegetation should account for 50-70% of the permanent pool surface area.
• A range of depths intermixed throughout the wetland basin to a maximum of 5 feet is recommended with at least 50% less than 1 foot deep.
• The flowpath length-to-width ratio should be a minimum of 3:1, but preferably at least 4:1 or greater. Intent: a high flow path length to width ratio will maximize fine sediment removal.
• Residence time should be a maximum of 7 days during dry weather.
Construction Considerations
• Base flows should be temporarily diverted around the facility during construction.
• The use of treated wood or galvanized metal anywhere inside the facility should be avoided.
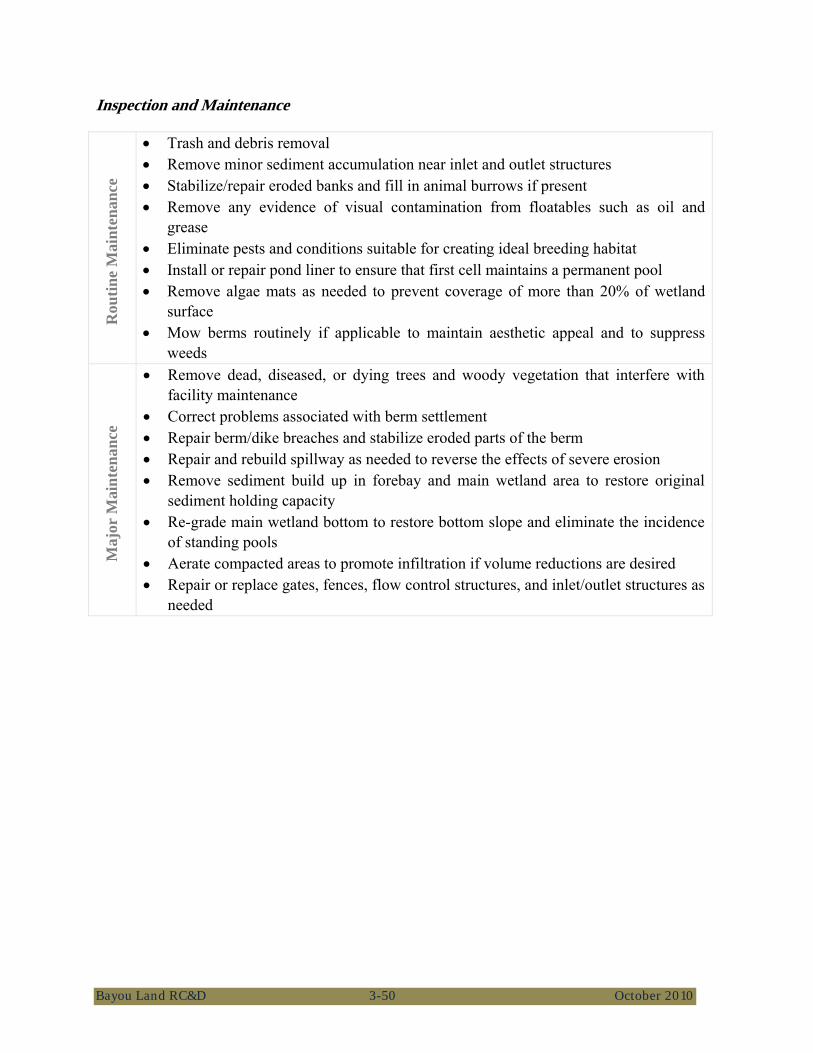
Bayou Land RC&D 3-50 October 2010
Inspection and Maintenance R
outin
e M
aint
enan
ce
• Trash and debris removal • Remove minor sediment accumulation near inlet and outlet structures • Stabilize/repair eroded banks and fill in animal burrows if present • Remove any evidence of visual contamination from floatables such as oil and
grease • Eliminate pests and conditions suitable for creating ideal breeding habitat • Install or repair pond liner to ensure that first cell maintains a permanent pool • Remove algae mats as needed to prevent coverage of more than 20% of wetland
surface • Mow berms routinely if applicable to maintain aesthetic appeal and to suppress
weeds
Maj
or M
aint
enan
ce
• Remove dead, diseased, or dying trees and woody vegetation that interfere with facility maintenance
• Correct problems associated with berm settlement • Repair berm/dike breaches and stabilize eroded parts of the berm • Repair and rebuild spillway as needed to reverse the effects of severe erosion • Remove sediment build up in forebay and main wetland area to restore original
sediment holding capacity • Re-grade main wetland bottom to restore bottom slope and eliminate the incidence
of standing pools • Aerate compacted areas to promote infiltration if volume reductions are desired • Repair or replace gates, fences, flow control structures, and inlet/outlet structures as
needed
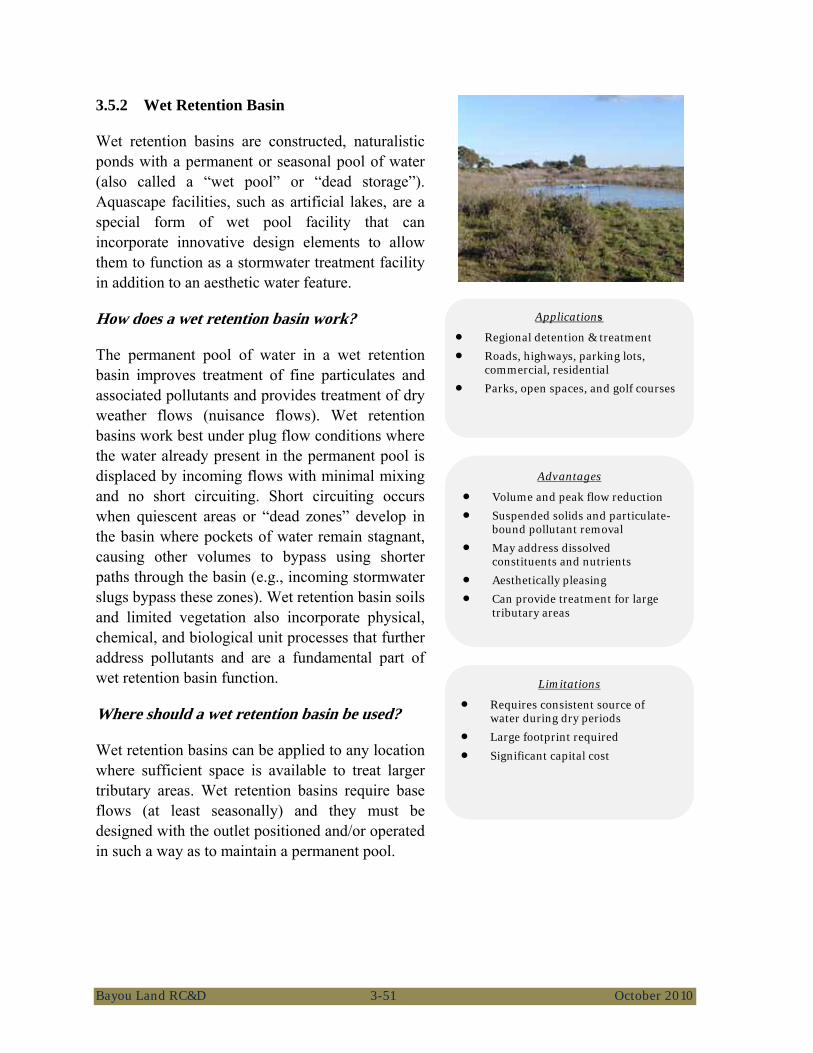
Bayou Land RC&D 3-51 October 2010
3.5.2 Wet Retention Basin
Wet retention basins are constructed, naturalistic ponds with a permanent or seasonal pool of water (also called a “wet pool” or “dead storage”). Aquascape facilities, such as artificial lakes, are a special form of wet pool facility that can incorporate innovative design elements to allow them to function as a stormwater treatment facility in addition to an aesthetic water feature.
How does a wet retention basin work?
The permanent pool of water in a wet retention basin improves treatment of fine particulates and associated pollutants and provides treatment of dry weather flows (nuisance flows). Wet retention basins work best under plug flow conditions where the water already present in the permanent pool is displaced by incoming flows with minimal mixing and no short circuiting. Short circuiting occurs when quiescent areas or “dead zones” develop in the basin where pockets of water remain stagnant, causing other volumes to bypass using shorter paths through the basin (e.g., incoming stormwater slugs bypass these zones). Wet retention basin soils and limited vegetation also incorporate physical, chemical, and biological unit processes that further address pollutants and are a fundamental part of wet retention basin function.
Where should a wet retention basin be used?
Wet retention basins can be applied to any location where sufficient space is available to treat larger tributary areas. Wet retention basins require base flows (at least seasonally) and they must be designed with the outlet positioned and/or operated in such a way as to maintain a permanent pool.
Limitations
• Requires consistent source of water during dry periods
• Large footprint required
• Significant capital cost
Advantages
• Volume and peak flow reduction • Suspended solids and particulate-
bound pollutant removal • May address dissolved
constituents and nutrients • Aesthetically pleasing • Can provide treatment for large
tributary areas
Applications
• Regional detention & treatment • Roads, highways, parking lots,
commercial, residential • Parks, open spaces, and golf courses
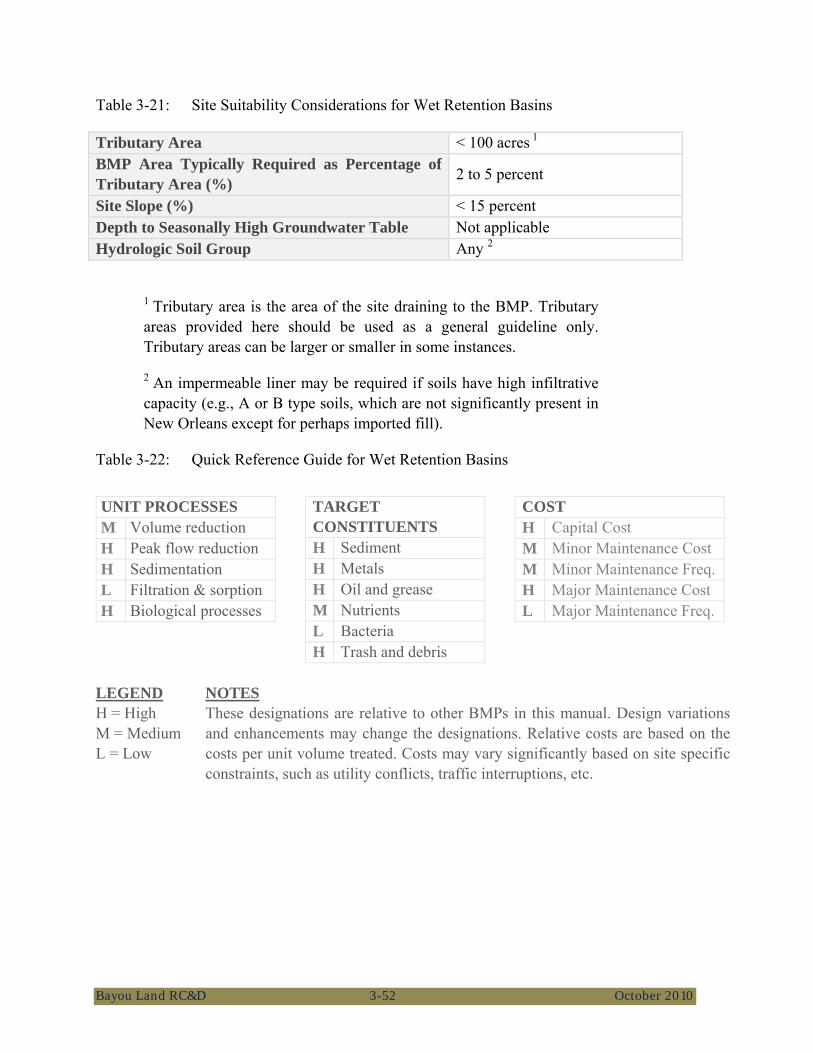
Bayou Land RC&D 3-52 October 2010
Table 3-21: Site Suitability Considerations for Wet Retention Basins
Tributary Area < 100 acres 1 BMP Area Typically Required as Percentage of Tributary Area (%) 2 to 5 percent
Site Slope (%) < 15 percent Depth to Seasonally High Groundwater Table Not applicable Hydrologic Soil Group Any 2
1 Tributary area is the area of the site draining to the BMP. Tributary areas provided here should be used as a general guideline only. Tributary areas can be larger or smaller in some instances.
2 An impermeable liner may be required if soils have high infiltrative capacity (e.g., A or B type soils, which are not significantly present in New Orleans except for perhaps imported fill).
Table 3-22: Quick Reference Guide for Wet Retention Basins
UNIT PROCESSES M Volume reduction H Peak flow reduction H Sedimentation L Filtration & sorption H Biological processes
TARGET CONSTITUENTS H Sediment H Metals H Oil and grease M Nutrients L Bacteria H Trash and debris
COST H Capital Cost M Minor Maintenance Cost M Minor Maintenance Freq. H Major Maintenance Cost L Major Maintenance Freq.
LEGEND H = High M = Medium L = Low
NOTES These designations are relative to other BMPs in this manual. Design variations and enhancements may change the designations. Relative costs are based on the costs per unit volume treated. Costs may vary significantly based on site specificconstraints, such as utility conflicts, traffic interruptions, etc.
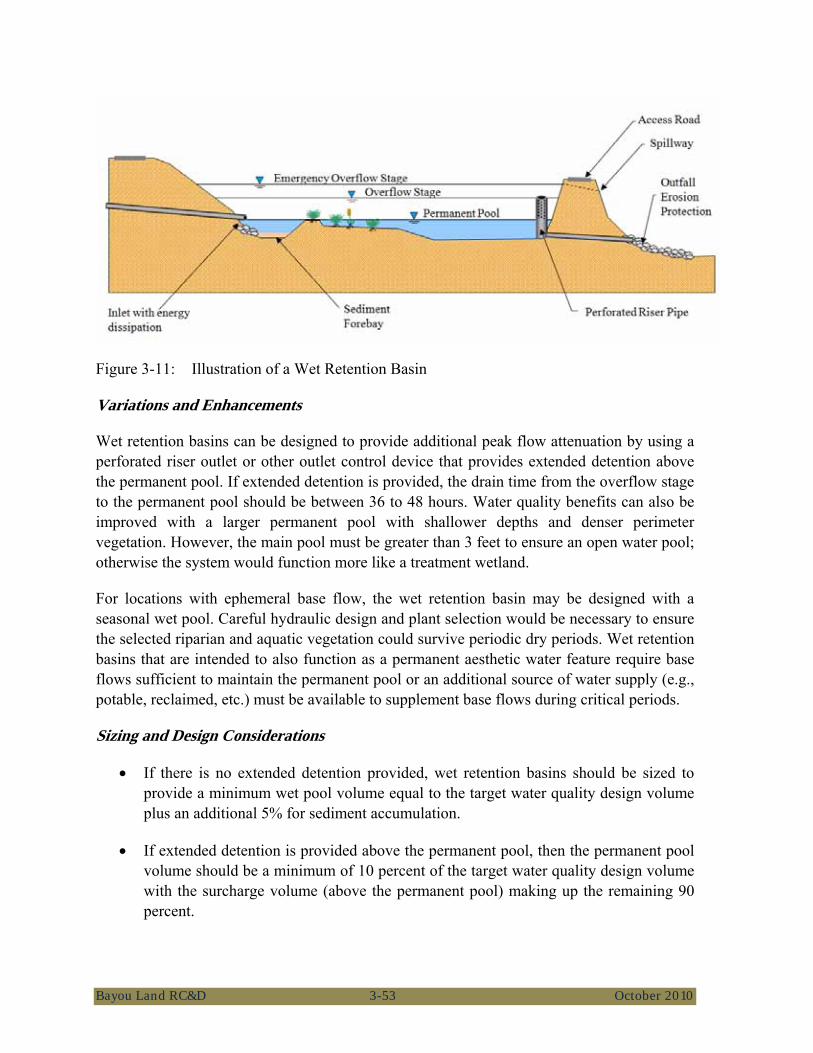
Bayou Land RC&D 3-53 October 2010
Figure 3-11: Illustration of a Wet Retention Basin
Variations and Enhancements
Wet retention basins can be designed to provide additional peak flow attenuation by using a perforated riser outlet or other outlet control device that provides extended detention above the permanent pool. If extended detention is provided, the drain time from the overflow stage to the permanent pool should be between 36 to 48 hours. Water quality benefits can also be improved with a larger permanent pool with shallower depths and denser perimeter vegetation. However, the main pool must be greater than 3 feet to ensure an open water pool; otherwise the system would function more like a treatment wetland.
For locations with ephemeral base flow, the wet retention basin may be designed with a seasonal wet pool. Careful hydraulic design and plant selection would be necessary to ensure the selected riparian and aquatic vegetation could survive periodic dry periods. Wet retention basins that are intended to also function as a permanent aesthetic water feature require base flows sufficient to maintain the permanent pool or an additional source of water supply (e.g., potable, reclaimed, etc.) must be available to supplement base flows during critical periods.
Sizing and Design Considerations
• If there is no extended detention provided, wet retention basins should be sized to provide a minimum wet pool volume equal to the target water quality design volume plus an additional 5% for sediment accumulation.
• If extended detention is provided above the permanent pool, then the permanent pool volume should be a minimum of 10 percent of the target water quality design volume with the surcharge volume (above the permanent pool) making up the remaining 90 percent.

Bayou Land RC&D 3-54 October 2010
• At least 25% of the basin area should be deeper than 3 feet to prevent the growth of emergent vegetation across the entire basin. If greater than 50% of the wet pool area is in excess of 6 feet deep, a recirculation device, such as a fountain or aerator, may be needed to prevent stratification, stagnation and low dissolved oxygen conditions.
• Inlets and outlets should be placed to maximize the flow path, and thus the residence time, through the facility.
• Residence time should be a maximum of 7 days during dry weather
• The wet detention basin should be divided into two cells separated by a berm or baffle. The first cell should contain between 25 to 35 percent of the total volume.
Construction Considerations
• Base flows should be temporarily diverted around the facility during construction.
• The use of treated wood or galvanized metal anywhere inside a wet basin should be avoided.
Inspection and Maintenance
Rou
tine
Mai
nten
ance
• Remove minor sediment accumulation near inlet and outlet structures • Stabilize/repair eroded banks and fill in animal burrows if present • Remove any evidence of visual contamination from floatables such as oil and
grease • Eliminate pests and conditions suitable for creating ideal breeding habitat • Remove algae mats as needed to prevent coverage of more than 20% of wetland
surface • Mow berms routinely if applicable to maintain aesthetic appeal and to suppress
weeds
Maj
or M
aint
enan
ce
• Remove dead, diseased, or dying trees and woody vegetation that interfere with facility maintenance
• Correct problems associated with berm settlement • Repair berm/dike breaches and stabilize eroded parts of the berm • Remove trees, large shrubs and roots from downstream slope of embankments • Repair and rebuild spillway as needed to reverse the effects of severe erosion • Remove sediment build up in forebay and main wetland area to restore original
sediment holding capacity • Re-grade main wetland bottom to restore bottom slope and eliminate the
incidence of standing pools • Aerate compacted areas to promote infiltration if volume reductions are desired • Repair or replace gates, fences, flow control structures, and inlet/outlet structures
as needed
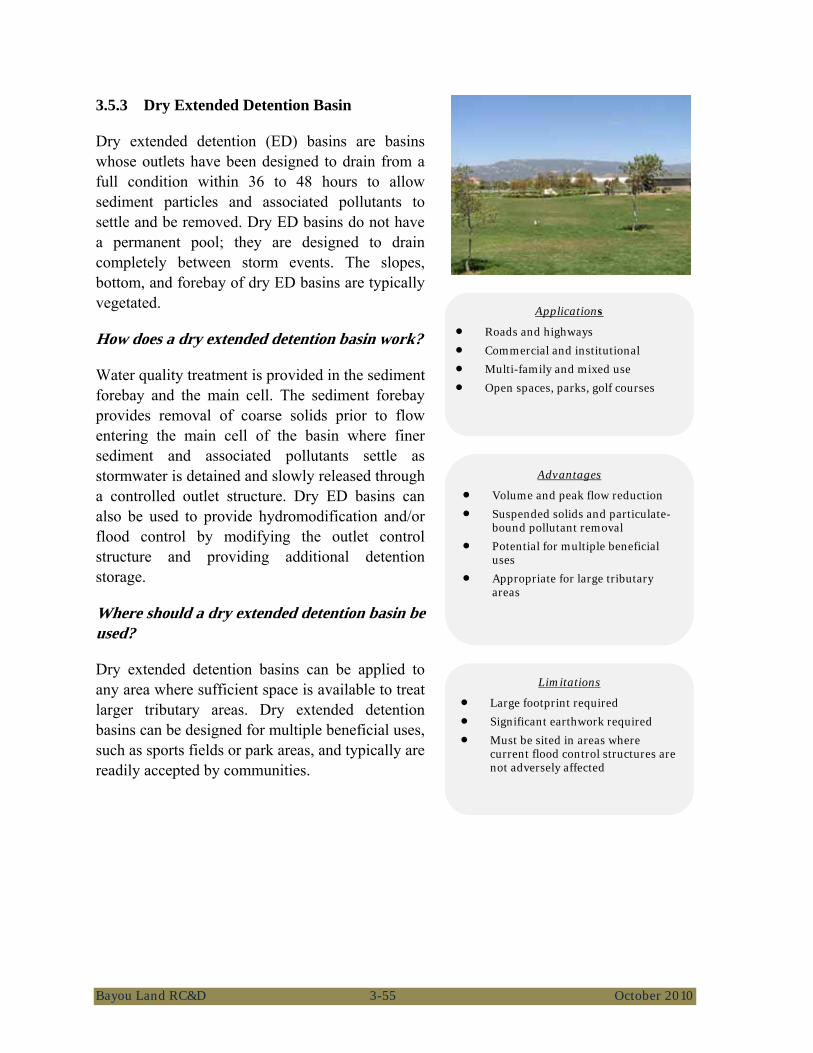
Bayou Land RC&D 3-55 October 2010
3.5.3 Dry Extended Detention Basin
Dry extended detention (ED) basins are basins whose outlets have been designed to drain from a full condition within 36 to 48 hours to allow sediment particles and associated pollutants to settle and be removed. Dry ED basins do not have a permanent pool; they are designed to drain completely between storm events. The slopes, bottom, and forebay of dry ED basins are typically vegetated.
How does a dry extended detention basin work?
Water quality treatment is provided in the sediment forebay and the main cell. The sediment forebay provides removal of coarse solids prior to flow entering the main cell of the basin where finer sediment and associated pollutants settle as stormwater is detained and slowly released through a controlled outlet structure. Dry ED basins can also be used to provide hydromodification and/or flood control by modifying the outlet control structure and providing additional detention storage.
Where should a dry extended detention basin be used?
Dry extended detention basins can be applied to any area where sufficient space is available to treat larger tributary areas. Dry extended detention basins can be designed for multiple beneficial uses, such as sports fields or park areas, and typically are readily accepted by communities.
Limitations
• Large footprint required • Significant earthwork required • Must be sited in areas where
current flood control structures are not adversely affected
Advantages
• Volume and peak flow reduction • Suspended solids and particulate-
bound pollutant removal • Potential for multiple beneficial
uses • Appropriate for large tributary
areas
Applications
• Roads and highways • Commercial and institutional • Multi-family and mixed use • Open spaces, parks, golf courses
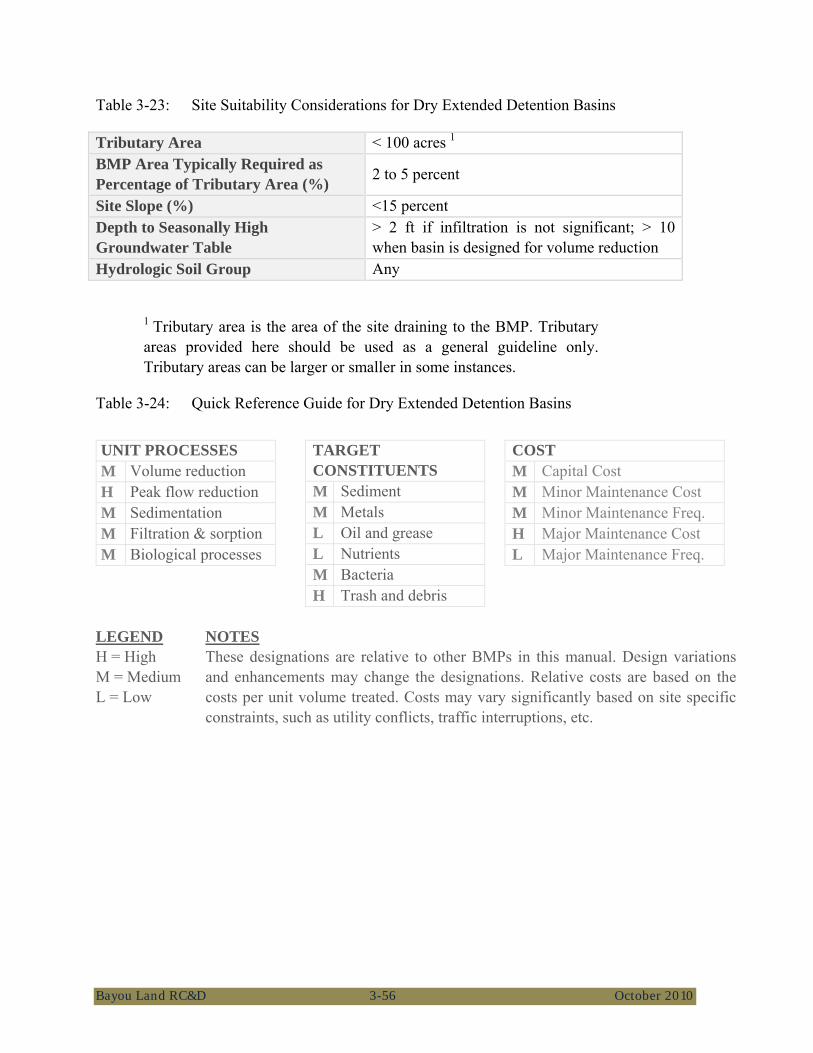
Bayou Land RC&D 3-56 October 2010
Table 3-23: Site Suitability Considerations for Dry Extended Detention Basins
Tributary Area < 100 acres 1 BMP Area Typically Required as Percentage of Tributary Area (%) 2 to 5 percent
Site Slope (%) <15 percent Depth to Seasonally High Groundwater Table
> 2 ft if infiltration is not significant; > 10 when basin is designed for volume reduction
Hydrologic Soil Group Any
1 Tributary area is the area of the site draining to the BMP. Tributary areas provided here should be used as a general guideline only. Tributary areas can be larger or smaller in some instances.
Table 3-24: Quick Reference Guide for Dry Extended Detention Basins
UNIT PROCESSES M Volume reduction H Peak flow reduction M Sedimentation M Filtration & sorption M Biological processes
TARGET CONSTITUENTS M Sediment M Metals L Oil and grease L Nutrients M Bacteria H Trash and debris
COST M Capital Cost M Minor Maintenance Cost M Minor Maintenance Freq. H Major Maintenance Cost L Major Maintenance Freq.
LEGEND H = High M = Medium L = Low
NOTES These designations are relative to other BMPs in this manual. Design variations and enhancements may change the designations. Relative costs are based on thecosts per unit volume treated. Costs may vary significantly based on site specificconstraints, such as utility conflicts, traffic interruptions, etc.
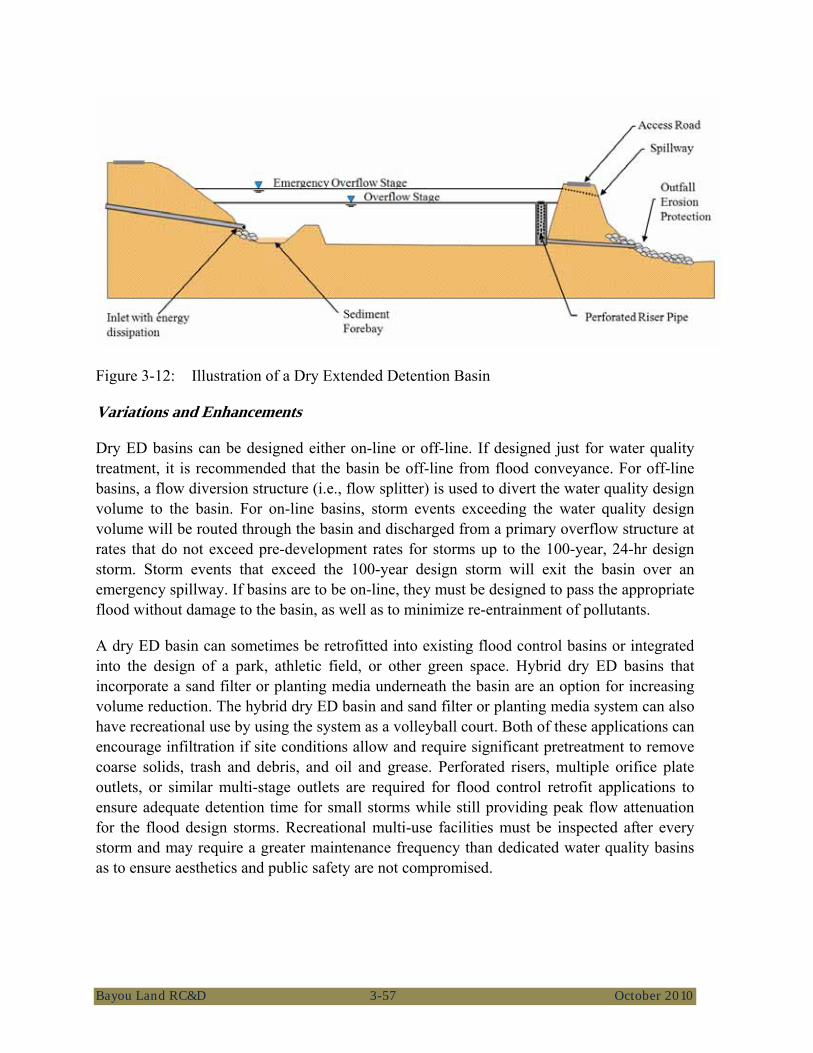
Bayou Land RC&D 3-57 October 2010
Figure 3-12: Illustration of a Dry Extended Detention Basin
Variations and Enhancements
Dry ED basins can be designed either on-line or off-line. If designed just for water quality treatment, it is recommended that the basin be off-line from flood conveyance. For off-line basins, a flow diversion structure (i.e., flow splitter) is used to divert the water quality design volume to the basin. For on-line basins, storm events exceeding the water quality design volume will be routed through the basin and discharged from a primary overflow structure at rates that do not exceed pre-development rates for storms up to the 100-year, 24-hr design storm. Storm events that exceed the 100-year design storm will exit the basin over an emergency spillway. If basins are to be on-line, they must be designed to pass the appropriate flood without damage to the basin, as well as to minimize re-entrainment of pollutants.
A dry ED basin can sometimes be retrofitted into existing flood control basins or integrated into the design of a park, athletic field, or other green space. Hybrid dry ED basins that incorporate a sand filter or planting media underneath the basin are an option for increasing volume reduction. The hybrid dry ED basin and sand filter or planting media system can also have recreational use by using the system as a volleyball court. Both of these applications can encourage infiltration if site conditions allow and require significant pretreatment to remove coarse solids, trash and debris, and oil and grease. Perforated risers, multiple orifice plate outlets, or similar multi-stage outlets are required for flood control retrofit applications to ensure adequate detention time for small storms while still providing peak flow attenuation for the flood design storms. Recreational multi-use facilities must be inspected after every storm and may require a greater maintenance frequency than dedicated water quality basins as to ensure aesthetics and public safety are not compromised.

Bayou Land RC&D 3-58 October 2010
Enhancements that maximize contact time, aid in trapping and securing of pollutants or assist with volume reduction are the main categories of enhancements available for constructed treatment wetlands. Generally larger basins, longer flow paths, longer drain times, and denser vegetation will improve water quality treatment. Native soils can also be tilled and amended to increase infiltration capacity and the removal of pollutants.
Sizing and Design Considerations
• The basin should be sized so that 25% of the total basin volume is in the forebay and 75% of the total basin volume is in the main portion of the basin.
• An outflow device should be designed to release the bottom 50% of the detention volume (half-full to empty) over 24 to 32 hours, and the top half (full to half-full) in 12 to 16 hours. Intent: Drawdown schemes that detain low flows for longer periods than high flows have greater flood control capabilities and provide enhanced treatment of low flows.
• The minimum flow-path length to width ratio at half basin height should be a minimum of 3:1 (L:W) and can be achieved using internal berms or other means to prevent short-circuiting
• The cross-sectional geometry across the width of the basin should be approximately trapezoidal with a maximum side slope of 4:1 (H:V) on interior slopes and 2:1 (H:V) on exterior slopes unless specifically permitted. Shallower side slopes are necessary if the basin is designed to have recreational uses during dry weather conditions.
• All dry ED basins should be free draining and a low flow channel should be provided. A low flow channel is a narrow, shallow trench filled with pea gravel and encased with filter fabric that runs the length of the basin to drain dry weather flows.
• A basin should be large enough to allow for equipment access via a graded access ramp. If the total basin volume is such that the basin bottom is less than 16 feet wide, an alternative BMP should be considered.
• The bottom and slopes of the dry ED basin should be vegetated. A mix of erosion-resistant plant species that effectively bind the soil should be used on the slopes and a diverse selection of plants that thrive under the specific site, climatic, and watering conditions should be specified for the basin bottom. Only native perennial grasses, forbs, or similar vegetation that can be replaced via seeding are recommended for use on the basin bottom.
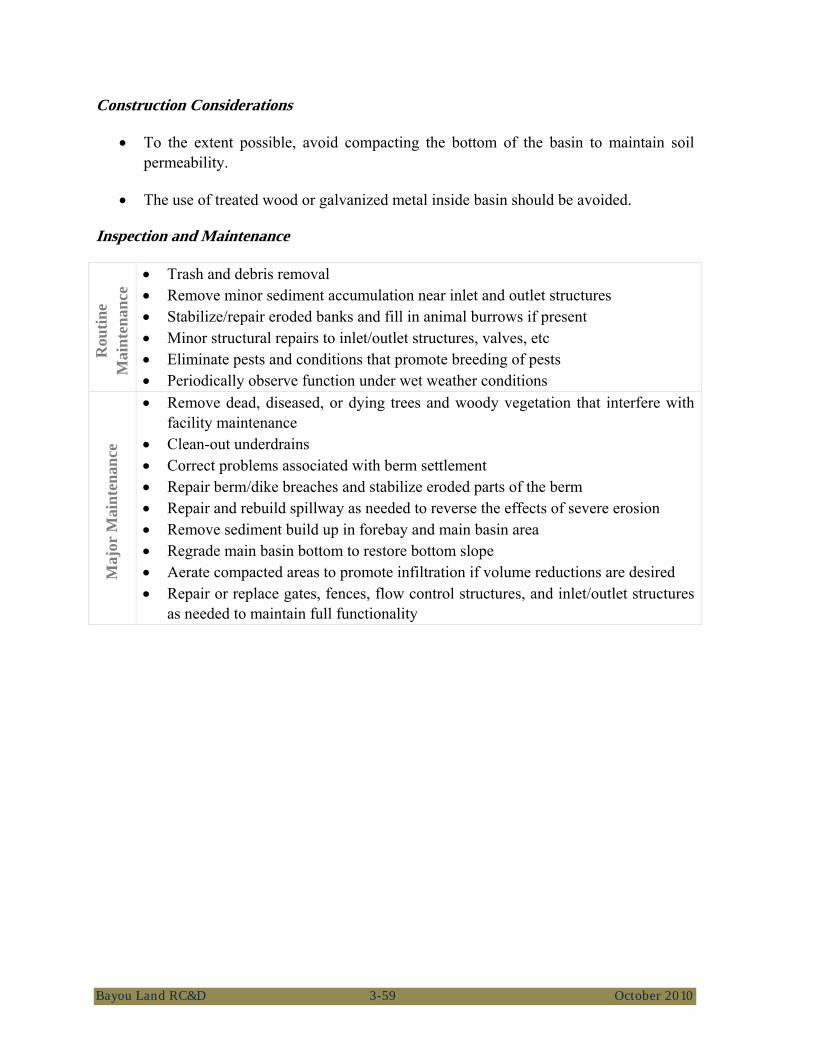
Bayou Land RC&D 3-59 October 2010
Construction Considerations
• To the extent possible, avoid compacting the bottom of the basin to maintain soil permeability.
• The use of treated wood or galvanized metal inside basin should be avoided.
Inspection and Maintenance
Rou
tine
Mai
nten
ance
• Trash and debris removal • Remove minor sediment accumulation near inlet and outlet structures • Stabilize/repair eroded banks and fill in animal burrows if present • Minor structural repairs to inlet/outlet structures, valves, etc • Eliminate pests and conditions that promote breeding of pests • Periodically observe function under wet weather conditions
Maj
or M
aint
enan
ce
• Remove dead, diseased, or dying trees and woody vegetation that interfere with facility maintenance
• Clean-out underdrains • Correct problems associated with berm settlement • Repair berm/dike breaches and stabilize eroded parts of the berm • Repair and rebuild spillway as needed to reverse the effects of severe erosion • Remove sediment build up in forebay and main basin area • Regrade main basin bottom to restore bottom slope • Aerate compacted areas to promote infiltration if volume reductions are desired • Repair or replace gates, fences, flow control structures, and inlet/outlet structures
as needed to maintain full functionality

Bayou Land RC&D 4-1 October 2010
4 STORMWATER BMP EVALUATION METHODS
Hydrologic performance and water quality performance depend on runoff volume reductions and long-term volumetric capture efficiency (i.e., the runoff volume captured and treated by the BMP). Thus, BMP performance can be characterized by quantifying the following:
• How much stormwater does the BMP “capture” and treat and/or harvest and use (vs. bypass or overflow)?
• How much stormwater does the BMP retain (i.e., eliminate from surface discharge via infiltration and evapotranspiration)?
• Of the water treated and discharged by the BMP, what effluent concentration does the BMP achieve?
• How effective is the BMP at attenuating peak discharges and/or matching pre-development flow durations?
Answering the above questions results in various performance metrics. The relative importance of each metric depends on the specific objectives and constraints of the BMP design. For example, peak flow attenuation is primarily a flood control objective where runoff is typically retained just long enough to shave the peaks of large storms, but small storms are often released too quickly to provide significant volume reductions or water quality treatment. Detention-based BMPs can be designed for both flood control and water quality by utilizing multi-stage outlets to provide extended detention (e.g., 24 to 72 hours) of the more frequent storms and provide peak attenuation of large storms (e.g., 25-yr, 24-hr storm). However, resuspension of captured sediment and associated pollutants is a major concern for online detention basins, especially if the facility will not be rigorously maintained. Consequently, it is often desirable to keep flood control and water quality control separate, particularly as drainage areas increase in size.
4.1 Hydrologic Performance Evaluation
Hydrologic performance is a key metric that is used to estimate the utility of a BMP to meet a project’s hydrologic objectives. It is strongly dependent on the volume and/or flow capacity of the BMP or upstream conveyance structures such as pipes, channels, flow dividers, curb cuts, berms, baffles, etc. Hydrologic performance evaluation of BMPs requires a hydrologic classification of the BMP, and watershed modeling to estimate BMP capture efficiency and volume reduction.
Bayou Land RC&D 4-2 October 2010
4.1.1 BMP Hydrologic Classification
Depending on the design, stormwater BMPs can be conveniently classified as either volume-based or flow-based. Volume-based BMPs depend on the storage capacity of the BMP where overflow or bypass occurs only when the BMP is full. Flow-based BMPs depend on the flow capacity of the BMP where overflow or bypass occurs when a maximum flow rate occurs. While most BMPs have both volume-limited and flow-limited elements, often either the volume or flow rate is selected as the controlling design factor for sizing the BMP and evaluating performance.
Volume-Based BMPs
Volume-based BMPs consist of any BMP type where the design is based on temporarily storing rainfall-runoff within surface detention features or the pore spaces of granular or absorptive media. Volume based BMPs typically tend to bypass flows from the tail end of large storms since the available volume of the BMP becomes exhausted as the storm progresses. Depending on the characteristics of the storm and the pollutant, bypassed flows from the tail end of a storm will frequently have lower pollutant concentrations since the majority of particulate-bound pollutants would have been removed during the initial portion of the storm, which is known as the first flush. Note, however, that for many pollutants and watersheds a first flush event may not occur.
For the purposes of performance evaluation, all BMPs included in this manual except for vegetated swales and filter strips may be considered volume-based BMPs.
Volume Definition
The storage capacity of a volume-based BMP can be defined as the sum of treatment storage and retention storage. The treatment storage is the portion of a BMP’s storage volume that would be treated and discharged downstream. Retention storage is the portion of a BMP’s storage volume that would be eliminated from surface discharge via infiltration, evapotranspiration, or non-potable water uses as the BMP drains. Soil pore water, which consists of drainable soil water (porosity minus field capacity) and plant available soil water (field capacity minus wilting point), can be a major component of the total storage volume in some BMP designs. However, for retention ponds and extended detention basins the soil moisture is negligible compared to the surface storage. Figure 4-1 is a schematic that defines the possible volume definitions for volume-based BMPs.
A generic BMP cross-section with treatment and retention storage components is provided in Figure 4-2. Considering that many of the storage elements may be negligible for any particular design, this figure is applicable to nearly all volume-based BMP types. For example, if no underdrain or surface outlet is provided then the entire volume is retention
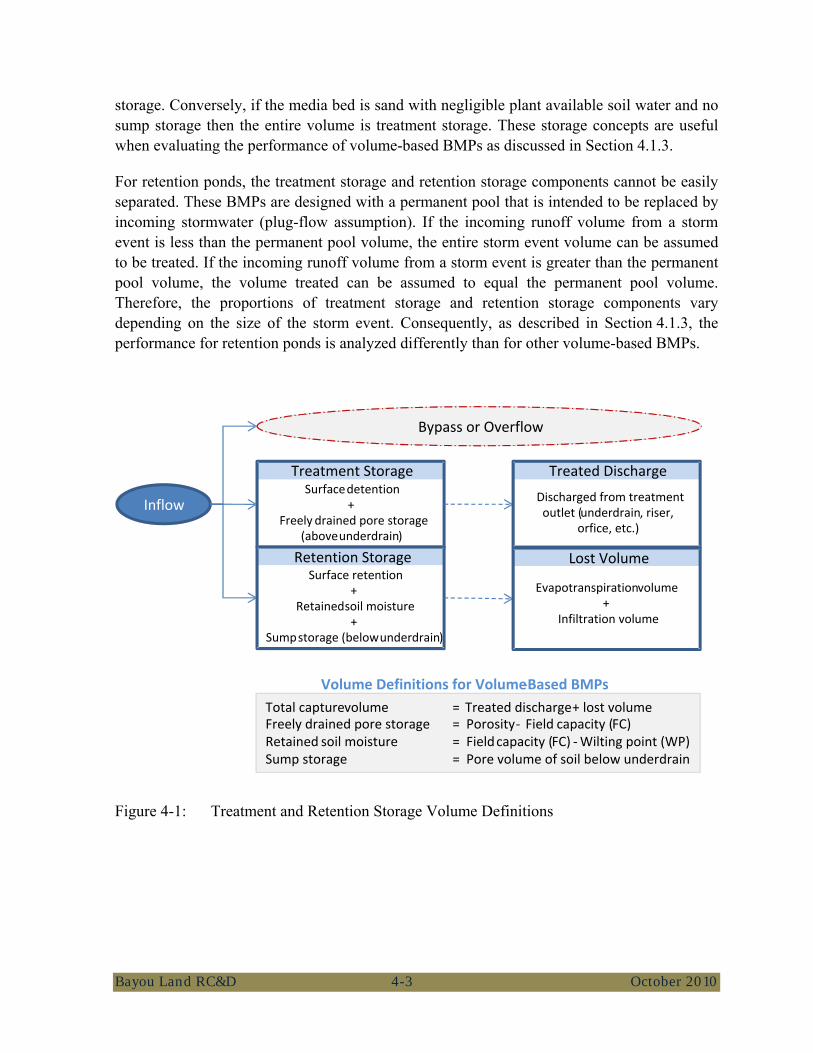
Bayou Land RC&D 4-3 October 2010
storage. Conversely, if the media bed is sand with negligible plant available soil water and no sump storage then the entire volume is treatment storage. These storage concepts are useful when evaluating the performance of volume-based BMPs as discussed in Section 4.1.3.
For retention ponds, the treatment storage and retention storage components cannot be easily separated. These BMPs are designed with a permanent pool that is intended to be replaced by incoming stormwater (plug-flow assumption). If the incoming runoff volume from a storm event is less than the permanent pool volume, the entire storm event volume can be assumed to be treated. If the incoming runoff volume from a storm event is greater than the permanent pool volume, the volume treated can be assumed to equal the permanent pool volume. Therefore, the proportions of treatment storage and retention storage components vary depending on the size of the storm event. Consequently, as described in Section 4.1.3, the performance for retention ponds is analyzed differently than for other volume-based BMPs.
Figure 4-1: Treatment and Retention Storage Volume Definitions
Lost Volume
Inflow
Bypass or Overflow
Volume Definitions for Volume ‐ Based BMPs
Treatment StorageSurface detention
+Freely drained pore storage
(above underdrain)
Retention StorageSurface retention
+ Retainedsoil moisture
+ Sump storage (below underdrain )
Total capturevolume = Treated discharge + lost volumeFreely drained pore storage = Porosity ‐ Field capacity ( FC)Retained soil moisture = Field capacity ( FC) ‐ Wilting point (WP) Sump storage = Pore volume of soil below underdrain
Evapotranspirationvolume +
Infiltration volume
Treated Discharge
Discharged from treatment outlet (underdrain , riser,
orfice , etc.)
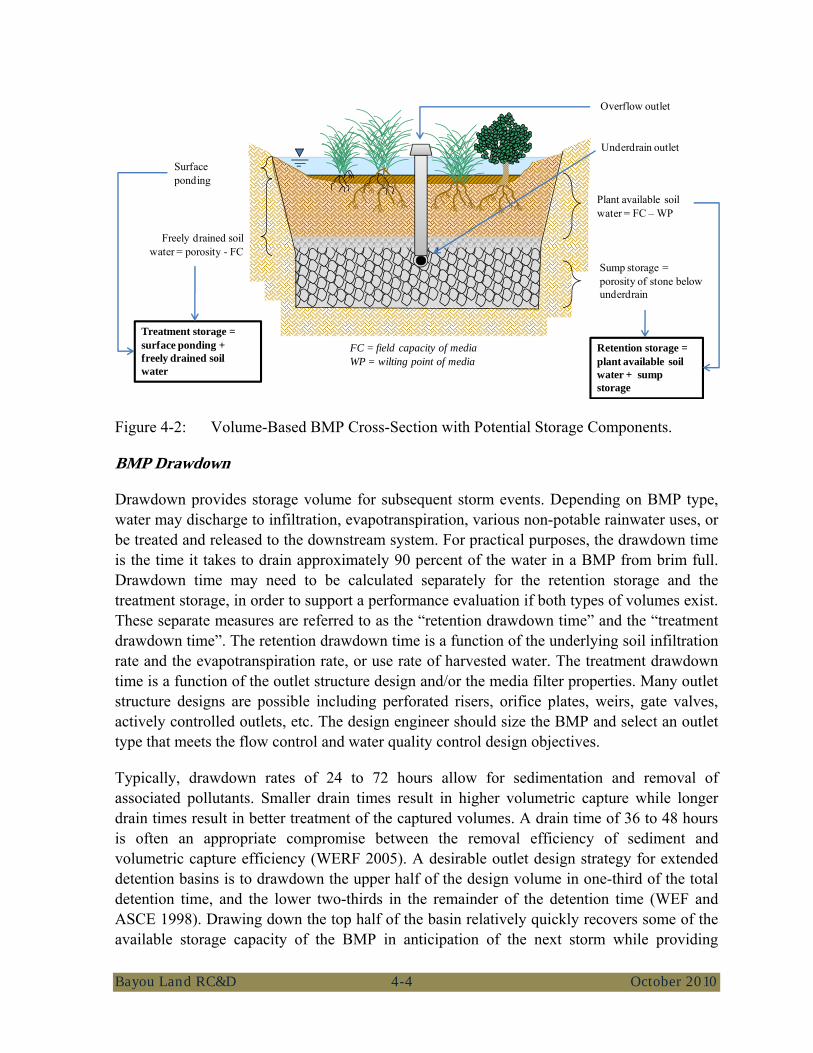
Bayou Land RC&D 4-4 October 2010
Figure 4-2: Volume-Based BMP Cross-Section with Potential Storage Components.
BMP Drawdown
Drawdown provides storage volume for subsequent storm events. Depending on BMP type, water may discharge to infiltration, evapotranspiration, various non-potable rainwater uses, or be treated and released to the downstream system. For practical purposes, the drawdown time is the time it takes to drain approximately 90 percent of the water in a BMP from brim full. Drawdown time may need to be calculated separately for the retention storage and the treatment storage, in order to support a performance evaluation if both types of volumes exist. These separate measures are referred to as the “retention drawdown time” and the “treatment drawdown time”. The retention drawdown time is a function of the underlying soil infiltration rate and the evapotranspiration rate, or use rate of harvested water. The treatment drawdown time is a function of the outlet structure design and/or the media filter properties. Many outlet structure designs are possible including perforated risers, orifice plates, weirs, gate valves, actively controlled outlets, etc. The design engineer should size the BMP and select an outlet type that meets the flow control and water quality control design objectives.
Typically, drawdown rates of 24 to 72 hours allow for sedimentation and removal of associated pollutants. Smaller drain times result in higher volumetric capture while longer drain times result in better treatment of the captured volumes. A drain time of 36 to 48 hours is often an appropriate compromise between the removal efficiency of sediment and volumetric capture efficiency (WERF 2005). A desirable outlet design strategy for extended detention basins is to drawdown the upper half of the design volume in one-third of the total detention time, and the lower two-thirds in the remainder of the detention time (WEF and ASCE 1998). Drawing down the top half of the basin relatively quickly recovers some of the available storage capacity of the BMP in anticipation of the next storm while providing
Surface ponding
Freely drained soil water = porosity - FC
Sump storage = porosity of stone below underdrain
Plant available soil water = FC – WP
Retention storage = plant available soil water + sump storage
FC = field capacity of mediaWP = wilting point of media
Treatment storage = surface ponding + freely drained soil water
Overflow outlet
Underdrain outlet

Bayou Land RC&D 4-5 October 2010
extended detention for the bottom half of the pond to maximize treatment. Smaller more frequent storms that only consume a fraction of the available volume are detained for extended periods meaning that a larger fraction of the total annual inflows are detained for extended periods.
Computing the retention storage drawdown time requires an estimate of the underlying soil infiltration rate for the sump storage and the evapotranspiration rate for the retained pore storage. Evapotranspiration includes volume losses due to evaporation from open water surface and upper soil layer pore space, as well as water losses from plants in vegetated BMPs as they transpire. Evapotranspiration rates depend on the exposed surface area of water and soil, physical soil characteristics, the amount and kinds of vegetation in the BMP, and the prevailing meteorological conditions such as wind speed, temperature, and relative humidity. If volume reductions are a goal for a BMP and ground water levels are suitable, then the soils in the BMP can typically be amended to improve the capacity for infiltration and evapotranspiration. Evapotranspiration rates are also important for replenishing the available storage in the soils after a storm in cases where infiltration rates are low.
For cisterns and rain barrels, rainwater is harvested and used to meet some or all of a particular water demand, such as irrigation or toilet flushing. Depending on the storage capacity of the system and the available water demand rate and timing, these types of systems can be very effective at reducing runoff volumes. However, the use of rainwater for meeting irrigation demand may be a challenge because when water is abundant, outdoor irrigation demand is typically low.
Design Storm Depth
When designing BMPs for new construction, it is often required to design for a specific design storm. For instance the City of New Orleans specifies the 10-year, 24-hour rainfall event. However, when designing BMPs to be retrofitted into existing infrastructure, the designer often has limited space for BMP implementation. As such, it is often of interest to calculate the depth of a storm that could be managed by the proposed BMP (known as the design storm). The determination of the design storm depth for volume-based BMPs can be computed from the water quality storage volume (treatment plus retention) as follows:
Equation 4-1
Where:
d = storm depth (inches)
V = total water quality design volume (cu-ft)
C = drainage area runoff coefficient = 0.05 + 0.9 × imp
d = V × 12 in/ft/[C × A × 43560 sf/ac]
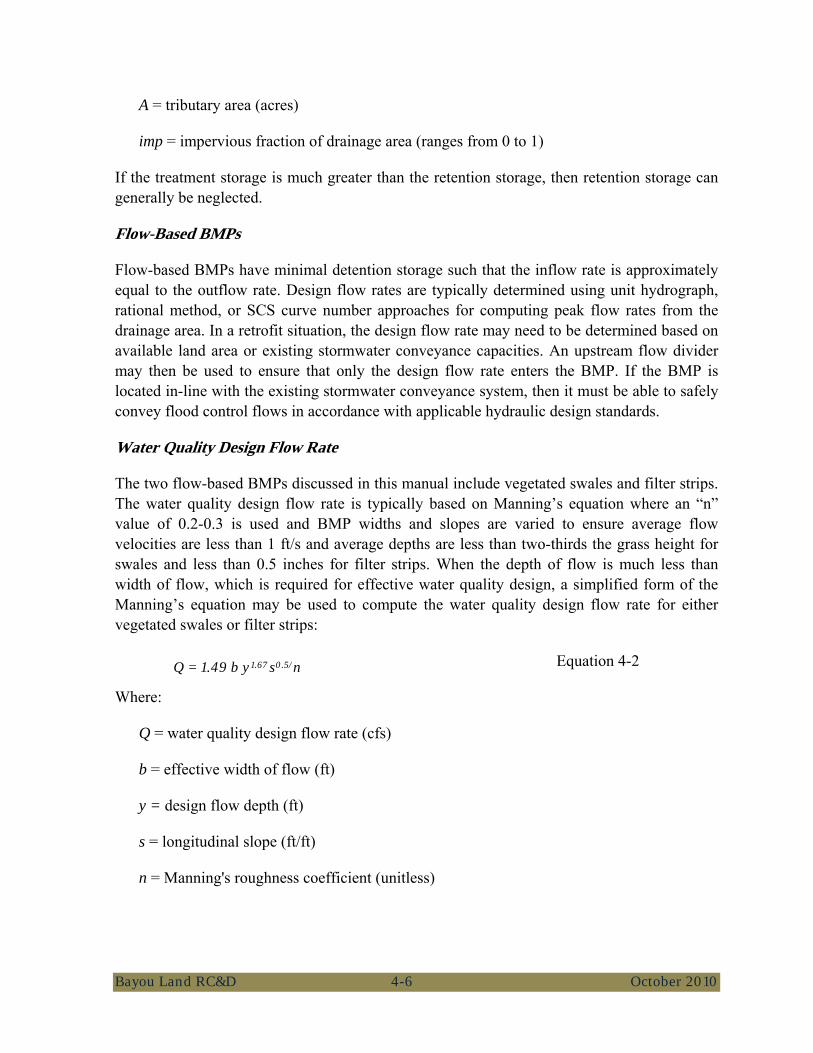
Bayou Land RC&D 4-6 October 2010
A = tributary area (acres)
imp = impervious fraction of drainage area (ranges from 0 to 1)
If the treatment storage is much greater than the retention storage, then retention storage can generally be neglected.
Flow-Based BMPs
Flow-based BMPs have minimal detention storage such that the inflow rate is approximately equal to the outflow rate. Design flow rates are typically determined using unit hydrograph, rational method, or SCS curve number approaches for computing peak flow rates from the drainage area. In a retrofit situation, the design flow rate may need to be determined based on available land area or existing stormwater conveyance capacities. An upstream flow divider may then be used to ensure that only the design flow rate enters the BMP. If the BMP is located in-line with the existing stormwater conveyance system, then it must be able to safely convey flood control flows in accordance with applicable hydraulic design standards.
Water Quality Design Flow Rate
The two flow-based BMPs discussed in this manual include vegetated swales and filter strips. The water quality design flow rate is typically based on Manning’s equation where an “n” value of 0.2-0.3 is used and BMP widths and slopes are varied to ensure average flow velocities are less than 1 ft/s and average depths are less than two-thirds the grass height for swales and less than 0.5 inches for filter strips. When the depth of flow is much less than width of flow, which is required for effective water quality design, a simplified form of the Manning’s equation may be used to compute the water quality design flow rate for either vegetated swales or filter strips:
Equation 4-2
Where:
Q = water quality design flow rate (cfs)
b = effective width of flow (ft)
y = design flow depth (ft)
s = longitudinal slope (ft/ft)
n = Manning's roughness coefficient (unitless)
Q = 1.49 b y1.67 s0.5/n
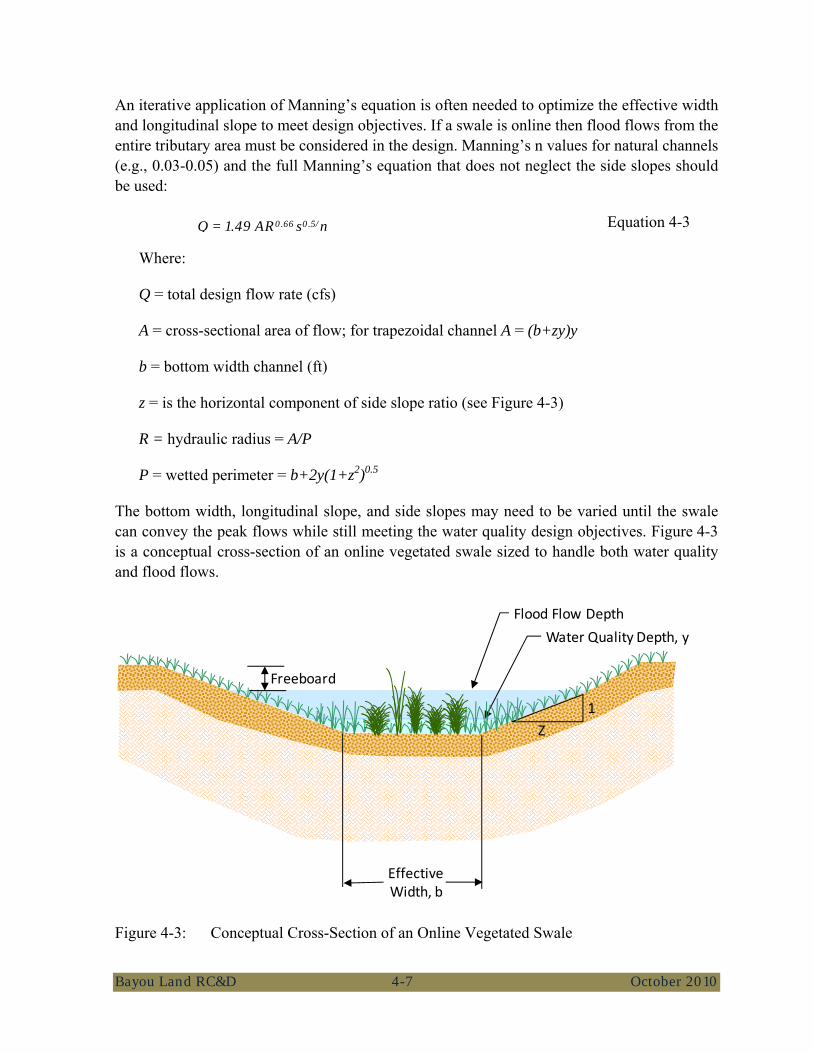
Bayou Land RC&D 4-7 October 2010
An iterative application of Manning’s equation is often needed to optimize the effective width and longitudinal slope to meet design objectives. If a swale is online then flood flows from the entire tributary area must be considered in the design. Manning’s n values for natural channels (e.g., 0.03-0.05) and the full Manning’s equation that does not neglect the side slopes should be used:
Equation 4-3
Where:
Q = total design flow rate (cfs)
A = cross-sectional area of flow; for trapezoidal channel A = (b+zy)y
b = bottom width channel (ft)
z = is the horizontal component of side slope ratio (see Figure 4-3)
R = hydraulic radius = A/P
P = wetted perimeter = b+2y(1+z2)0.5
The bottom width, longitudinal slope, and side slopes may need to be varied until the swale can convey the peak flows while still meeting the water quality design objectives. Figure 4-3 is a conceptual cross-section of an online vegetated swale sized to handle both water quality and flood flows.
Figure 4-3: Conceptual Cross-Section of an Online Vegetated Swale
Z1
Water Quality Depth, yFlood Flow Depth
Effective Width, b
Freeboard
Q = 1.49 AR0.66 s0.5/n
Bayou Land RC&D 4-8 October 2010
Design Storm Intensity
When designing flow based BMPs for new construction, the designer will often start with a design storm in mind. In retrofit situations, the BMP will act as a BMP for some storms (storms of the design intensity or less), and will behave solely as a stormwater conveyance for storm intensities in excess of the design storm intensity. For the purposes of evaluating BMP performance of flow-based BMPs, the rational method can be used to back-calculate the effective design storm intensity from the water quality design flow rate as follows:
Equation 4-4
Where:
i = storm depth (inches)
Q = total water quality design flow rate (cfs)
C = drainage area runoff coefficient = 0.05 + 0.9 × imp
A = tributary area (acres)
imp = impervious fraction of drainage area (ranges from 0 to 1) (Schueler )
4.1.2 Role of Modeling
Models that are used to evaluate BMP performance can be separated into two groups including single-event methods and continuous simulation methods. The simplest methods model the hydrology of a single rainfall-runoff event. These methods include the rational method for peak flows, and unit hydrographs and SCS curve number methods for losses and hydrographs. Single-event methods are driven not by actual monitored rainfall, but by synthetic design storms such as the SCS dimensionless hyetographs (e.g., Type III for the New Orleans area) or intensity-duration-frequency (IDF) curves. Continuous simulation models continuously model the hydrology of an area over the course of one-year or more. Continuous models include the Storm Water Management Model (SWMM) and the Hydrologic Simulation Program - FORTRAN (HSPF) among others. These models are driven by long-term historical rainfall data and not by synthetic design storms.
Single-event models have both strengths and limitations for BMP modeling. They often represent a worst-case scenario and are therefore quite useful for sizing BMPs for a particular design storm (e.g., the 10-year 24-hr storm) or for evaluating BMPs with respect to flood control requirements. Additionally, these methods are easy to apply and, as such, have a low cost associated with their use. The limitation of the single-event method arises when average BMP performance requires estimation. In order to use these methods one must assume that certain conditions exist in the watershed and that these conditions do not change over time. For instance, single-event models often assume a fixed antecedent moisture condition
i = Q × 12 in/ft/[C × A × 43560 sf/ac]
Bayou Land RC&D 4-9 October 2010
(i.e., choosing AMC I, II, or III when applying the SCS method) and typically assume BMPs are empty at the start of the analysis. If two storms occur within a short period of time, these assumptions are invalid and the modeled results lose accuracy.
Continuous simulation methods have their own strengths and limitations. Continuous simulation models adequately capture the effect of back-to-back storms on both the antecedent moisture conditions in the watershed and the storage capacity of BMPs. As such, these methods are very useful to evaluate the average behavior of a BMP. However, continuous simulation modeling can be complicated and time consuming which limits its availability and practicality in many situations.
In order to reduce the time and expense of continuous simulation modeling, graphs based on several continuous simulations and time series analyses of rainfall have been developed as discussed below. The graphs provide planning-level estimates of the expected volumetric percent capture for various BMP types, sizes, and discharge characteristics. The graphs can be used as a tool for quickly evaluating the potential performance of BMP alternatives. However, if accurate estimates of performance are desired then continuous simulation modeling should be conducted.
BMPs typically provide two primary hydrologic benefits including flow attenuation and volume reduction. Peak flow attenuation is typically provided by the detention components of BMPs while volume reduction is typically provided by the retention components. The hydrologic performance of a BMP depends on the capture efficiency as well as the volume reduction capacity of the BMP. Each of these hydrologic performance metrics is discussed further below.
4.1.3 Estimating Percent Volume Capture
BMP capture efficiency (a.k.a., percent volume capture), described as the volumetric percentage of stormwater runoff that is retained and/or treated and released by a BMP, is a key metric of hydrologic performance. As discussed above, it is sometimes necessary to separate BMPs into volume-based or flow-based and into on-line and offline BMPs when estimating capture efficiency.
Capture Efficiency for Volume-Based BMPs with Drainable Storage
For most volume based BMPs, the capture efficiency is a function of the design volume of the BMP and the drawdown time. A properly designed volume-based BMP should typically capture on the order of 70 to 90% of the long-term runoff volumes from the watershed while retaining the volume for 36 to 48 hours. However, for retrofit situations or constrained site conditions, a BMP may need to be designed to achieve a lower long-term volumetric capture efficiency or lower drawdown time.

Bayou Land RC&D 4-10 October 2010
In lieu of continuous simulation to estimate the capture efficiency of a particular volume-based BMP, percent capture graphs have been developed for a variety of design storm depths and constant drawdown times (Figure 4-4). The lower figure is zoomed in at the low end of the percent capture curves for improved readability. The curves are based on continuous simulations of runoff and detention storage using EPA SWMM 5 and a 54-year rainfall record (1954 to 2008) from the New Orleans International Airport. To use these graphs, the design volume (in watershed inches) and drawdown time (DDT) of each major storage volume must be estimated. The percent capture can then be estimated through visual interpolation. For BMPs with multiple storage components, the procedure for estimating the overall percent capture is as follows:
1. Identify the percent capture (PC1) for the storage component (V1) with the longest drawdown time (DDT1).
2. Find the storage BMP design volume (V1’) associated with PC1 on a curve of the next longest DDT (DDT2).
3. Add V1 to V1’ and read the percent capture (PC2) associated with DDT2.
4. Repeat steps 2-4 until all major storage components have been accounted for.
The percent capture associated with retention storage volumes is equal to the volume loss. Two example calculations are provided below.

Bayou Land RC&D 4-11 October 2010
Figure 4-4: Percent Capture for Volume-Based BMPs with Drainable Storage.
0%
10%
20%
30%
40%
50%
60%
70%
80%
90%
100%
0.0 0.1 0.2 0.3 0.4 0.5 0.6 0.7 0.8 0.9 1.0 1.1 1.2 1.3 1.4 1.5 1.6 1.7 1.8 1.9 2.0
Perc
ent V
olum
e Ca
ptur
e
Storage BMP Design Volume (watershed inches)
1‐Hour DDT
2‐Hour DDT
3‐Hour DDT
6‐Hour DDT
12‐Hour DDT
24‐Hour DDT
36‐Hour DDT
48‐Hour DDT
72‐Hour DDT
96‐Hour DDT
120‐Hour DDT
180‐Hour DDT
240‐Hour DDT
300‐Hour DDT
360‐Hour DDT
480‐Hour DDT
600‐Hour DDT
1200‐Hour DDT
1800‐Hour DDT
2400‐Hour DDT
0%
5%
10%
15%
20%
25%
30%
0.00 0.05 0.10 0.15 0.20 0.25 0.30 0.35 0.40 0.45 0.50
Perc
ent V
olum
e Ca
ptur
e
Storage BMP Design Volume (watershed inches)
1‐Hour DDT
2‐Hour DDT
3‐Hour DDT
6‐Hour DDT
12‐Hour DDT
24‐Hour DDT
36‐Hour DDT
48‐Hour DDT
72‐Hour DDT
96‐Hour DDT
120‐Hour DDT
180‐Hour DDT
240‐Hour DDT
300‐Hour DDT
360‐Hour DDT
480‐Hour DDT
600‐Hour DDT
1200‐Hour DDT
1800‐Hour DDT
2400‐Hour DDT

Bayou Land RC&D 4-12 October 2010
Example 4.1: Computing Capture Efficiency for a Bioretention Area BMP w/ Out Underdrain
Given:
• Drainage area = 1.5 acres • Runoff coefficient of drainage area = 0.86 • Effective area of bioretention = 1000 ft2 • Depth of bioretention media = 3 ft • Porosity of bioretention media = 0.4 • Field capacity (FC) of bioretention media = 0.2 • Wilting point (WP) of bioretention media = 0.1 • Depth of surface ponding = 1 ft • Subsurface soil infiltration rate = 0.1 in/hr • Average evapotranspiration rate = 0.15 in/day
Required:
• Estimate the capture efficiency and percent volume loss
Solution:
Since there is no underdrain, the entire storage volume is retention volume. The major components of the retention volume include: (V1) retained soil moisture and the (V2) surface retention plus freely drained pore storage. Variable Definitions D1 = effective storage depth of retained soil moisture D2 = effective storage depth of surface retention plus freely drained pore storage d1 = retained soil moisture volume as runoff storm depth in watershed inches d2 = surface retention plus freely drained pore storage as runoff storm depth in watershed
inches DDT1 = drawdown time of retained soil moisture assuming constant rate DDT2 = drawdown time of surface retention + freely drained pore storage assuming
constant rate Effective Storage Depth Calculations: D1 = ((0.2 - 0.1) x 3 ft) = 0.3 ft D2 = 1 ft + ((0.4 - 0.2) x 3 ft) = 1.6 ft Storage Volume Calculations: V1 = 0.3 ft x 1000 ft2 = 300 ft3 V2 = 1.6 ft x 1000 ft2 = 1,600 ft3
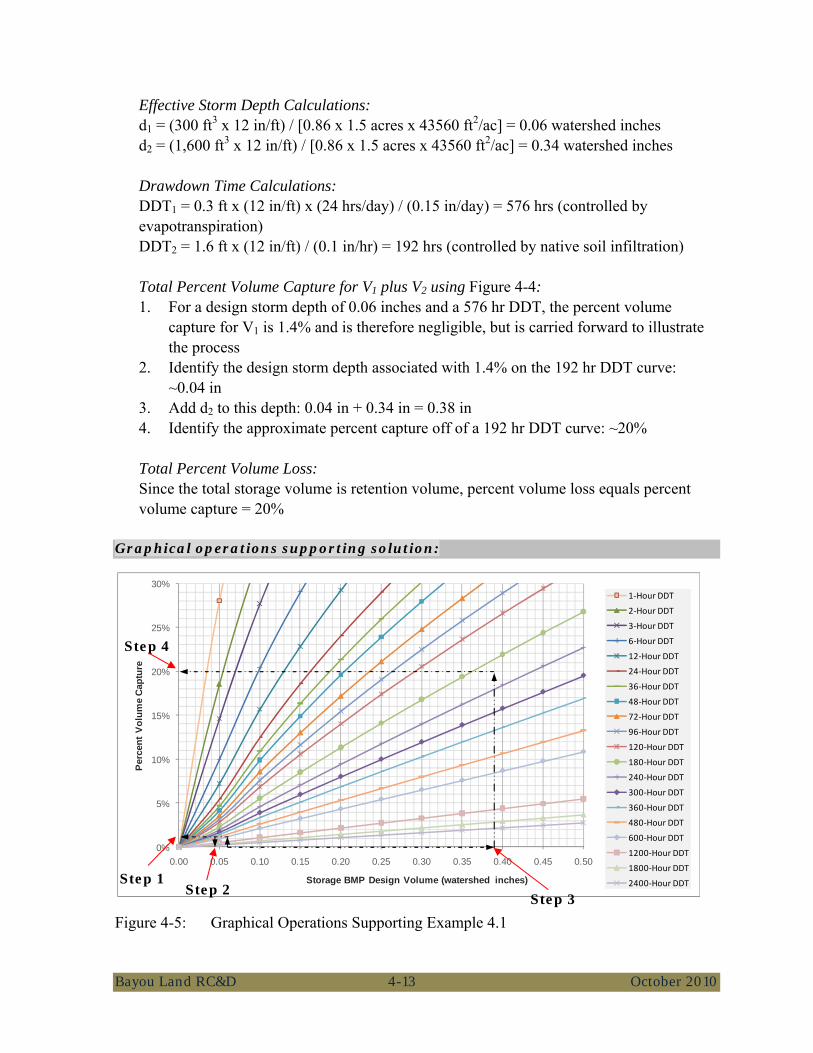
Bayou Land RC&D 4-13 October 2010
Effective Storm Depth Calculations: d1 = (300 ft3 x 12 in/ft) / [0.86 x 1.5 acres x 43560 ft2/ac] = 0.06 watershed inches d2 = (1,600 ft3 x 12 in/ft) / [0.86 x 1.5 acres x 43560 ft2/ac] = 0.34 watershed inches Drawdown Time Calculations: DDT1 = 0.3 ft x (12 in/ft) x (24 hrs/day) / (0.15 in/day) = 576 hrs (controlled by evapotranspiration) DDT2 = 1.6 ft x (12 in/ft) / (0.1 in/hr) = 192 hrs (controlled by native soil infiltration) Total Percent Volume Capture for V1 plus V2 using Figure 4-4: 1. For a design storm depth of 0.06 inches and a 576 hr DDT, the percent volume
capture for V1 is 1.4% and is therefore negligible, but is carried forward to illustrate the process
2. Identify the design storm depth associated with 1.4% on the 192 hr DDT curve: ~0.04 in
3. Add d2 to this depth: 0.04 in + 0.34 in = 0.38 in 4. Identify the approximate percent capture off of a 192 hr DDT curve: ~20% Total Percent Volume Loss: Since the total storage volume is retention volume, percent volume loss equals percent volume capture = 20%
Graphical operations supporting solution:
Figure 4-5: Graphical Operations Supporting Example 4.1
0%
5%
10%
15%
20%
25%
30%
0.00 0.05 0.10 0.15 0.20 0.25 0.30 0.35 0.40 0.45 0.50
Perc
ent V
olum
e Ca
ptur
e
Storage BMP Design Volume (watershed inches)
1‐Hour DDT
2‐Hour DDT
3‐Hour DDT
6‐Hour DDT
12‐Hour DDT
24‐Hour DDT
36‐Hour DDT
48‐Hour DDT
72‐Hour DDT
96‐Hour DDT
120‐Hour DDT
180‐Hour DDT
240‐Hour DDT
300‐Hour DDT
360‐Hour DDT
480‐Hour DDT
600‐Hour DDT
1200‐Hour DDT
1800‐Hour DDT
2400‐Hour DDTStep 1 Step 2
Step 3
Step 4
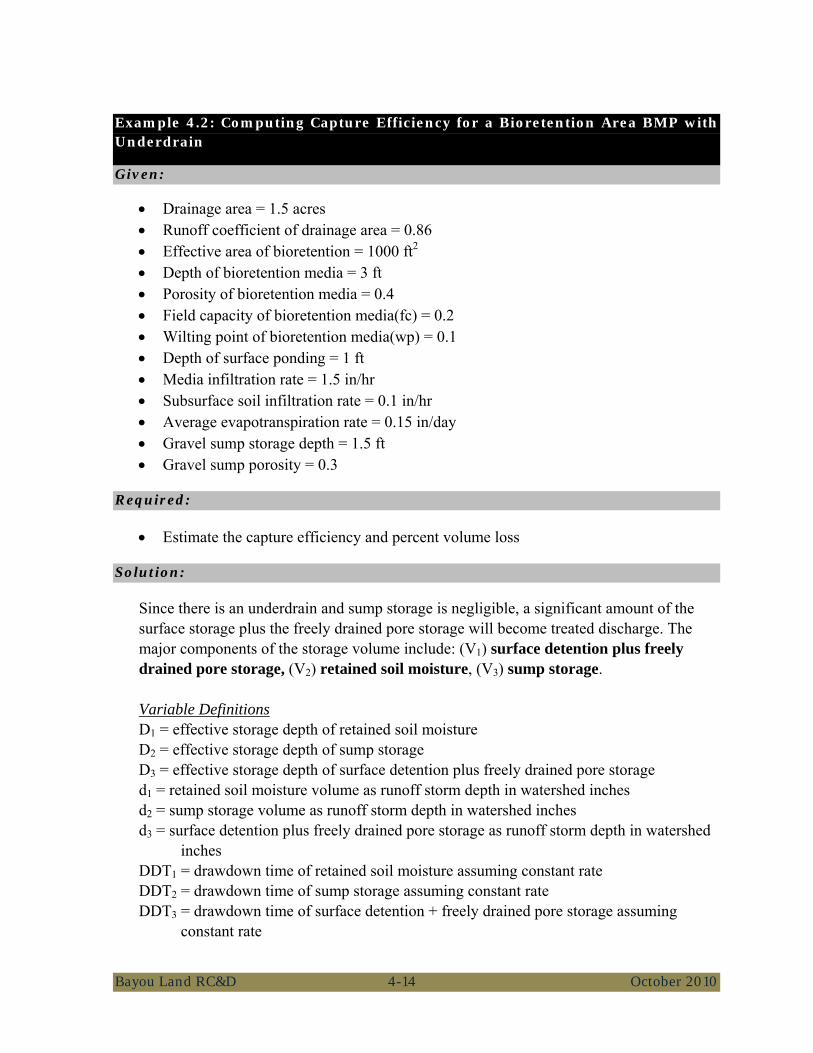
Bayou Land RC&D 4-14 October 2010
Example 4.2: Computing Capture Efficiency for a Bioretention Area BMP with Underdrain
Given:
• Drainage area = 1.5 acres • Runoff coefficient of drainage area = 0.86 • Effective area of bioretention = 1000 ft2 • Depth of bioretention media = 3 ft • Porosity of bioretention media = 0.4 • Field capacity of bioretention media(fc) = 0.2 • Wilting point of bioretention media(wp) = 0.1 • Depth of surface ponding = 1 ft • Media infiltration rate = 1.5 in/hr • Subsurface soil infiltration rate = 0.1 in/hr • Average evapotranspiration rate = 0.15 in/day • Gravel sump storage depth = 1.5 ft • Gravel sump porosity = 0.3
Required:
• Estimate the capture efficiency and percent volume loss
Solution:
Since there is an underdrain and sump storage is negligible, a significant amount of the surface storage plus the freely drained pore storage will become treated discharge. The major components of the storage volume include: (V1) surface detention plus freely drained pore storage, (V2) retained soil moisture, (V3) sump storage. Variable Definitions D1 = effective storage depth of retained soil moisture D2 = effective storage depth of sump storage D3 = effective storage depth of surface detention plus freely drained pore storage d1 = retained soil moisture volume as runoff storm depth in watershed inches d2 = sump storage volume as runoff storm depth in watershed inches d3 = surface detention plus freely drained pore storage as runoff storm depth in watershed
inches DDT1 = drawdown time of retained soil moisture assuming constant rate DDT2 = drawdown time of sump storage assuming constant rate DDT3 = drawdown time of surface detention + freely drained pore storage assuming
constant rate

Bayou Land RC&D 4-15 October 2010
Effective Storage Depth Calculations: D1 = ((0.2 - 0.1) x 3 ft) = 0.3 ft D2 = (0.3 * 1.5 ft) = 0.45 ft D3 = 1 ft + ((0.4 - 0.2) x 3 ft) = 1.6 ft Storage Volume Calculations: V1 = 0.3 ft x 1000 ft2 = 300 ft3 V2 = 0.45 ft x 1000 ft2 = 450 ft3 V3 = 1.6 ft x 1000 ft2 = 1,600 ft3 Effective Storm Depth Calculations: d1 = (300 ft3 x 12 in/ft) / [0.86 x 1.5 acres x 43560 ft2/ac] = 0.06 watershed inches d2 = (450 ft3 x 12 in/ft) / [0.86 x 1.5 acres x 43560 ft2/ac] = 0.1 watershed inches d3 = (1,600 ft3 x 12 in/ft) / [0.86 x 1.5 acres x 43560 ft2/ac] = 0.34 watershed inches Drawdown Time Calculations: DDT1 = 0.3 ft x (12 in/ft) x (24 hrs/day) / (0.15 in/day) = 576 hrs (controlled by evapotranspiration) DDT2 = 0.45 ft x (12 in/ft) / (0.1 in/hr) = 54 hrs (controlled by native soil infiltration) DDT3 = 1.6 ft x (12 in/ft) / (1.5 in/hr) = 12.8 hrs (controlled by media filtration rate) Total Percent Volume Capture for V1 plus V2 using Figure 4-6: 1. For a design storm depth of 0.06 inches and a 576 hr DDT, the percent volume capture
for V1 is 1.4% and is therefore negligible, but is carried forward to illustrate the process
2. Identify the design storm depth associated with 1.4% on the 54 hr DDT curve: ~0.02 in
3. Add d2 to this depth: 0.02 in + 0.1 in = 0.12 in. 4. Identify the approximate percent capture off of a 54 hr DDT curve: ~11% 5. Identify the design storm depth associated with 11% on the 13 hr DDT curve: ~0.08 in 6. Add d3 to this depth: 0.34 in + 0.08 in = 0.42 in 7. Identify the approximate percent capture off of a 13 hr DDT curve: ~50% Total Percent Volume Loss: The retention volume is equal to V1 plus V2, therefore the volume loss equals the percent capture computed from Step 4 above = 11%
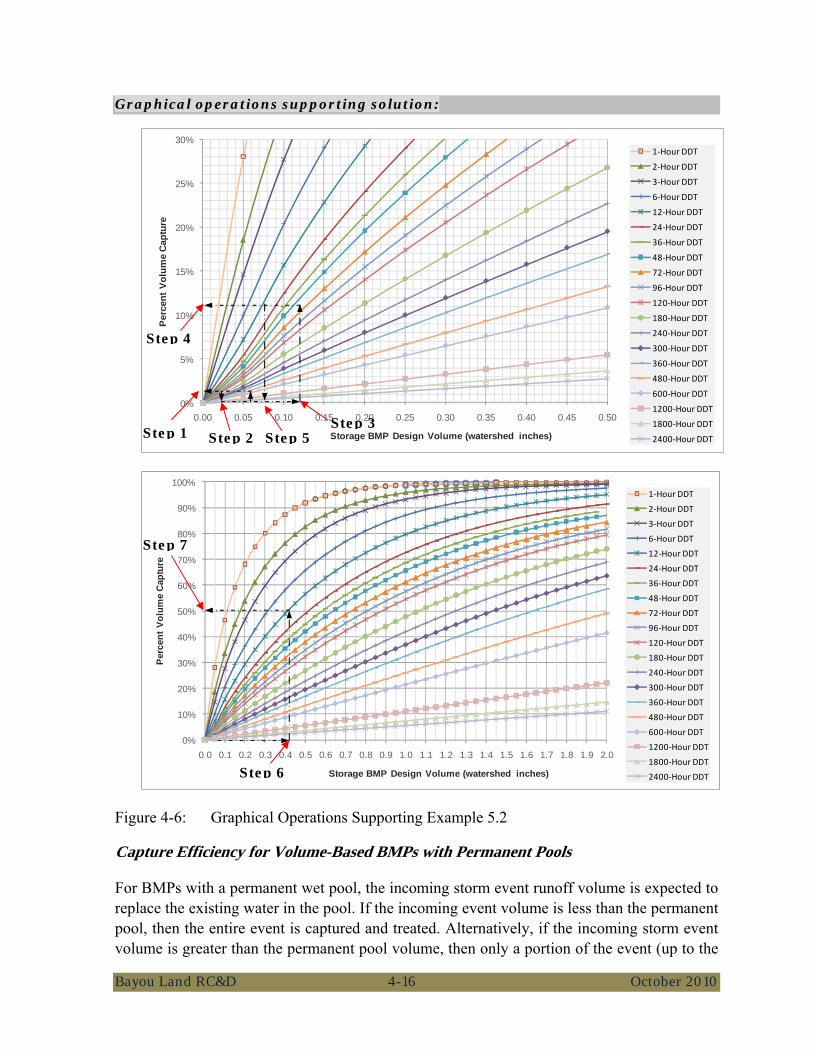
Bayou Land RC&D 4-16 October 2010
Graphical operations supporting solution:
Figure 4-6: Graphical Operations Supporting Example 5.2
Capture Efficiency for Volume-Based BMPs with Permanent Pools
For BMPs with a permanent wet pool, the incoming storm event runoff volume is expected to replace the existing water in the pool. If the incoming event volume is less than the permanent pool, then the entire event is captured and treated. Alternatively, if the incoming storm event volume is greater than the permanent pool volume, then only a portion of the event (up to the
0%
5%
10%
15%
20%
25%
30%
0.00 0.05 0.10 0.15 0.20 0.25 0.30 0.35 0.40 0.45 0.50
Perc
ent V
olum
e Ca
ptur
e
Storage BMP Design Volume (watershed inches)
1‐Hour DDT
2‐Hour DDT
3‐Hour DDT
6‐Hour DDT
12‐Hour DDT
24‐Hour DDT
36‐Hour DDT
48‐Hour DDT
72‐Hour DDT
96‐Hour DDT
120‐Hour DDT
180‐Hour DDT
240‐Hour DDT
300‐Hour DDT
360‐Hour DDT
480‐Hour DDT
600‐Hour DDT
1200‐Hour DDT
1800‐Hour DDT
2400‐Hour DDT
0%
10%
20%
30%
40%
50%
60%
70%
80%
90%
100%
0.0 0.1 0.2 0.3 0.4 0.5 0.6 0.7 0.8 0.9 1.0 1.1 1.2 1.3 1.4 1.5 1.6 1.7 1.8 1.9 2.0
Perc
ent V
olum
e Ca
ptur
e
Storage BMP Design Volume (watershed inches)
1‐Hour DDT
2‐Hour DDT
3‐Hour DDT
6‐Hour DDT
12‐Hour DDT
24‐Hour DDT
36‐Hour DDT
48‐Hour DDT
72‐Hour DDT
96‐Hour DDT
120‐Hour DDT
180‐Hour DDT
240‐Hour DDT
300‐Hour DDT
360‐Hour DDT
480‐Hour DDT
600‐Hour DDT
1200‐Hour DDT
1800‐Hour DDT
2400‐Hour DDT
Step 1 Step 2 Step 3
Step 4
Step 5
Step 6
Step 7

Bayou Land RC&D 4-17 October 2010
permanent pool volume) is considered treated. Therefore, the percent treatment volume for wet ponds may be computed based on an analysis of a discrete time-series of rainfall events. Figure 4-7 is a plot of percent treated by the permanent pool of a wet pond based on an analysis of the 54-year rainfall record and using a minimum interevent time of 6 hours to define discrete storm events.
Figure 4-7: Percent Treated Nomograph for the Permanent Pool of Retention Ponds
Flow-Based BMPs
For flow-based BMPs, bypass can occur when the inflow rate exceeds the design flow rate of the treatment facility, which causes excess flows to bypass if the facility is offline or diminishes the treatment effectiveness of the facility if it is online. An example of diminished treatment is observed in online vegetated swales where high flows can knock down vegetation thereby lowering the ability of the swale to filter runoff. Therefore, even though inflows may not physically bypass a BMP, flows that exceed the design capacity can still be considered as bypassed flows with respect to water quality treatment because the primary treatment operations within the BMP can be rendered ineffective at high flow rates. Due to the potential for diminished treatment, offline BMPs are generally preferable because they will continue to function as designed since the flow diversion structure upstream of the BMP ensures that inflows remain within the limits of the design capacity. For flow based BMPs, the annual average volumetric capture efficiency can be estimated by integrating under the historic hydrograph or the long-term flow-duration curve. The integration of all flows below a particular flow rate yields the average runoff volume to be treated. By integrating at a range of flow rates, the flow-based system can be sized for the flow rate that would capture the desired runoff volume percentage to be treated (e.g., 80%) (WERF 2005).
0%
10%
20%
30%
40%
50%
60%
70%
80%
90%
100%
0 0.5 1 1.5 2 2.5 3
Percen
t Treated
Permanent Pool Volume (in)
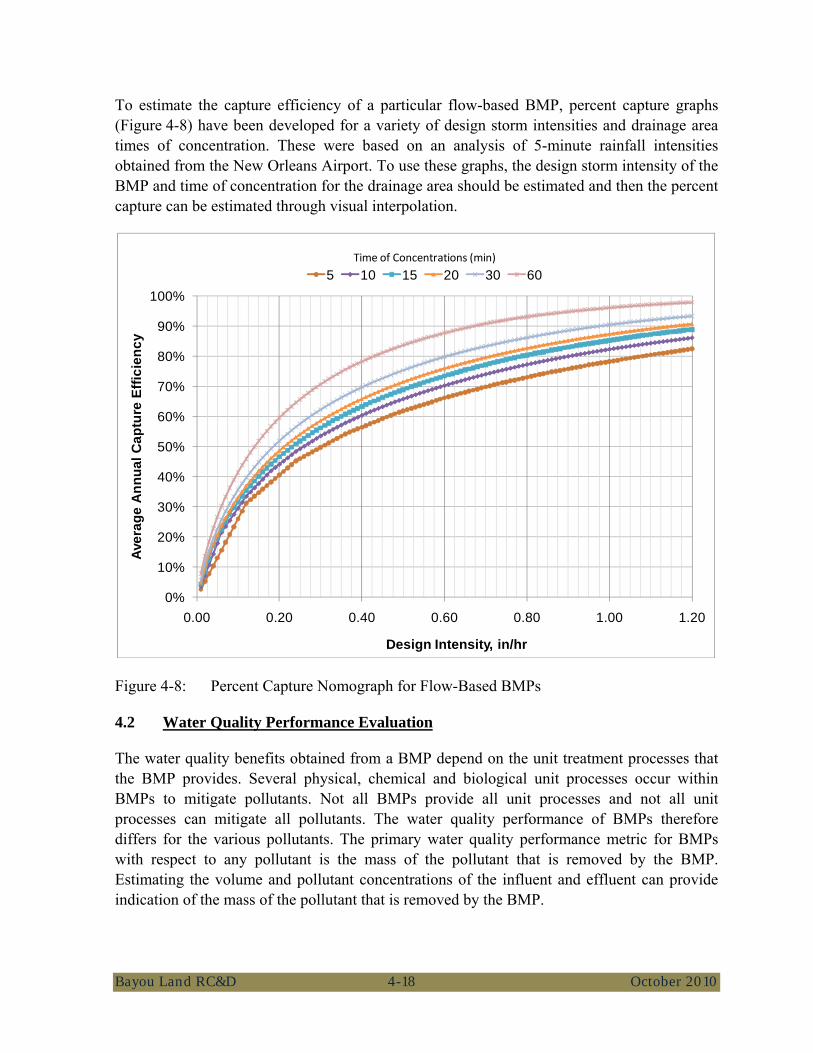
Bayou Land RC&D 4-18 October 2010
To estimate the capture efficiency of a particular flow-based BMP, percent capture graphs (Figure 4-8) have been developed for a variety of design storm intensities and drainage area times of concentration. These were based on an analysis of 5-minute rainfall intensities obtained from the New Orleans Airport. To use these graphs, the design storm intensity of the BMP and time of concentration for the drainage area should be estimated and then the percent capture can be estimated through visual interpolation.
Figure 4-8: Percent Capture Nomograph for Flow-Based BMPs
4.2 Water Quality Performance Evaluation
The water quality benefits obtained from a BMP depend on the unit treatment processes that the BMP provides. Several physical, chemical and biological unit processes occur within BMPs to mitigate pollutants. Not all BMPs provide all unit processes and not all unit processes can mitigate all pollutants. The water quality performance of BMPs therefore differs for the various pollutants. The primary water quality performance metric for BMPs with respect to any pollutant is the mass of the pollutant that is removed by the BMP. Estimating the volume and pollutant concentrations of the influent and effluent can provide indication of the mass of the pollutant that is removed by the BMP.
0%10%20%30%40%50%60%70%80%90%
100%
0.00 0.20 0.40 0.60 0.80 1.00 1.20
Aver
age
Ann
ual C
aptu
re E
ffici
ency
Design Intensity, in/hr
5 10 15 20 30 60Time of Concentrations (min)
Bayou Land RC&D 4-19 October 2010
4.2.1 Effluent Quality
The effluent quality of a BMP describes the concentrations of various pollutants in the flows that are discharged from the BMP. The effluent quality is one of the many ways of representing BMP performance. Other methods of quantifying the efficiency of a BMP include percent removals of pollutants loads. Traditionally, the efficiency of BMPs have often been described and compared based on percent removal of pollutants. However the difficultly with this approach is that BMPs do not typically function with a uniform percent removal across a wide range of influent quality concentrations. For example many BMPs demonstrate high percent removals under high loadings and poor percent removal where pollutant concentrations are low. It has been shown that in some cases a minimum concentration exists beyond which BMPs achieve little or no pollutant removal for many constituents (Schueler 2000; Minton 2005). Therefore percent removals alone, even in scenarios where results are statistically significant do not provide a useful assessment of BMP performance (Geosyntec and Wright Water Inc, 2009). Similarly, effluent quality alone also does not provide a useful assessment of BMP performance. It is often important to know the influent concentration at which a specified percent removal or effluent concentration was achieved.
Median influent and effluent concentration for various pollutants of concern for a variety of BMP types are periodically summarized for data contained in the International Stormwater BMP Database website: http://www.bmpdatabase.org. The 2008 summary can be found at: http://www.bmpdatabase.org/Docs/Performance%20Summary%20June%202008.pdf.
4.2.2 Load Reductions
Pollutant load reductions are the ultimate water quality benefit provided by BMPs. Pollutant loads are typically calculated using an average concentration multiplied by a total volume of flow over a period of time. Pollutant loads are therefore dependent on concentration and flow volume. Pollutant load reductions are achieved through reductions in BMP effluent concentration and/or through the volume reductions that occur in a BMP. Pollutant load reduction estimates are often most useful when assessing the impact to receiving waters such as lakes, rivers, estuaries, etc. where persistently high pollutant loadings can cause a host of problems.
In cases where the effluent flow rate from a BMP is small compared to flow rate of the receiving water body, potential downstream impacts are controlled by the absolute load of the pollutant rather than the concentration of the pollutant (Geosyntec and Wright Water Inc, 2009). Note that dry weather flows can substantially contribute to long-term loading. BMPs that receive appreciable dry weather flows can have a reduced pollutant load reduction capacity for mitigating wet weather pollutants.
Bayou Land RC&D 5-1 October 2010
5 CONCEPTUAL MODEL APPLICATIONS
This section presents a standardized process by which stormwater BMPs can be are integrated into public right-of-way projects and includes five site design examples that illustrate how site design, and stormwater runoff BMPs may be integrated for different land use types. The examples are intended to illustrate how BMP strategies may be incorporated into different types of sites and do not imply any specific requirements as to how a site must be designed. In practice, each site will require a unique combination of site design and stormwater BMPs. Combining several different BMPs distributed across the site and, where feasible, connecting BMPs so the outflow from one BMP is directed to another in a “treatment train”, allows for multiple opportunities to improve water retention and water quality. The examples shown in this section include:
• Single-family residential
• Multi-family residential
• Commercial development
• Office buildings
• Residential Streets
• Parking lots are included in several of these examples.
5.1 BMP Alternative Comparison Tool
A common design approach is to select BMPs that have been shown to treat the pollutants of concern (or a surrogate pollutant such as TSS) or achieve a desired hydrologic outcome (volume and/or flow rate reduction).
Table 5-1 contains a comparison tool that is designed to provide a standardized, objective process to guide BMP or treatment trains selection and can be used in the preliminary screening process of stormwater BMP installations and retrofits.
The table contains six categories based on potential project objectives as described in Section 2. The user should assign a weight to each of the criteria associated with the categories based on the importance of the criterion to the overall success of the project with weights ranging from 1 (low importance) to 3 (high importance). Since the objectives of each design application will vary, it is up to the professional and the stakeholders to assign weights. Weights will change for different projects, but the weights must be consistent when comparing BMP alternatives within the same project.
Bayou Land RC&D 5-2 October 2010
Once weights have been assigned, the user should assign ratings for the BMP alternatives in the “Raw Score” column. Suggested weights for each of the BMPs described in Section 3 are provided in Table 5-3. These weights assume proper BMP design and maintenance and will change if either of these assumptions is invalid.
The “Weighted Score” for a BMP is determined by multiplying the “Criteria Weight” by the corresponding ranking. The “Total Score” is determined by summing the weighted scores for each alternative. The BMP or treatment train with the highest “Total Score” is the preferred option to meet the user-defined objectives. Table 5-1 allows for the comparison of only two alternatives, but the format of this table is for explanatory purposes only. Incorporating Table 5-1 into a spreadsheet application would allow for the comparison of numerous alternatives.
Table 5-2 provides an example comparison of bioretention (Alternative A) to a grass filter strip (Alternative B). The weights were assigned based on their importance to project success. BMP ratings were assigned to each alternative based on Table 5-3. The total score for bioretention is 99 while the total score for the grass filter strip is 84 indicating that bioretention will better meet the design objectives than will the grass filter strip.
It is important to note that the total scores provide relative comparisons only and do not have meaning outside of this comparison process. For instance, changing the criteria weights may change the value of the total score for each option. However, if the total score for bioretention remains higher than the total score of the grass filter strip, then bioretention would remain the better of the two options for meeting the specified project objectives.
It is also important to note that a separate feasibility analysis should be performed. If a more detailed analysis indicates that the BMP with the highest total score cannot be feasibly constructed, then the BMP with the next highest score should be investigated.

Bayou Land RC&D 5-3 October 2010
Table 5-1: Proposed BMP or Treatment Train Alternative Comparison Tool
Category Criteria
BMP(s) should… Criteria Weight
Rating of Proposed BMP or Treatment Train Alternative(s)
Raw Score Weighted Score Alt. A Alt. B Alt. A Alt. B
Hydrology/ Hydraulics
reduce runoff volume or minimize volume increases reduce peak flow
Water Quality
reduce sediment concentration reduce metals concentrations reduce Oil and Grease Concentrations reduce nutrients concentrations reduce Bacteria Concentration reduce Trash and Debris
Area Requirements occupy a small surface area not consume large portions of developable space
Cost
have low capital costs have low minor operating and maintenance costs have low major operating and maintenance costs
Maintenance and Longevity
have infrequent minor maintenance requirements have infrequent major maintenance requirements
Public Acceptance
have high aesthetic appeal (visual and odor) provide for safe public access provide educational opportunities
Total Score
BMP Criteria Weight 1 = BMP Criteria has low importance for the treatment design objectives 2 = BMP Criteria is of secondary importance to the treatment design objectives 3 = BMP Criteria has high importance to the treatment design objectives
Rating of Proposed BMP(s) Alternative(s) 1 = BMP, or treatment train, has a low likelihood of satisfying the corresponding criterion 2 = BMP, or treatment train, has a reasonable likelihood of satisfying the corresponding criterion 3 = BMP, or treatment train, has a high likelihood of satisfying the corresponding criterion
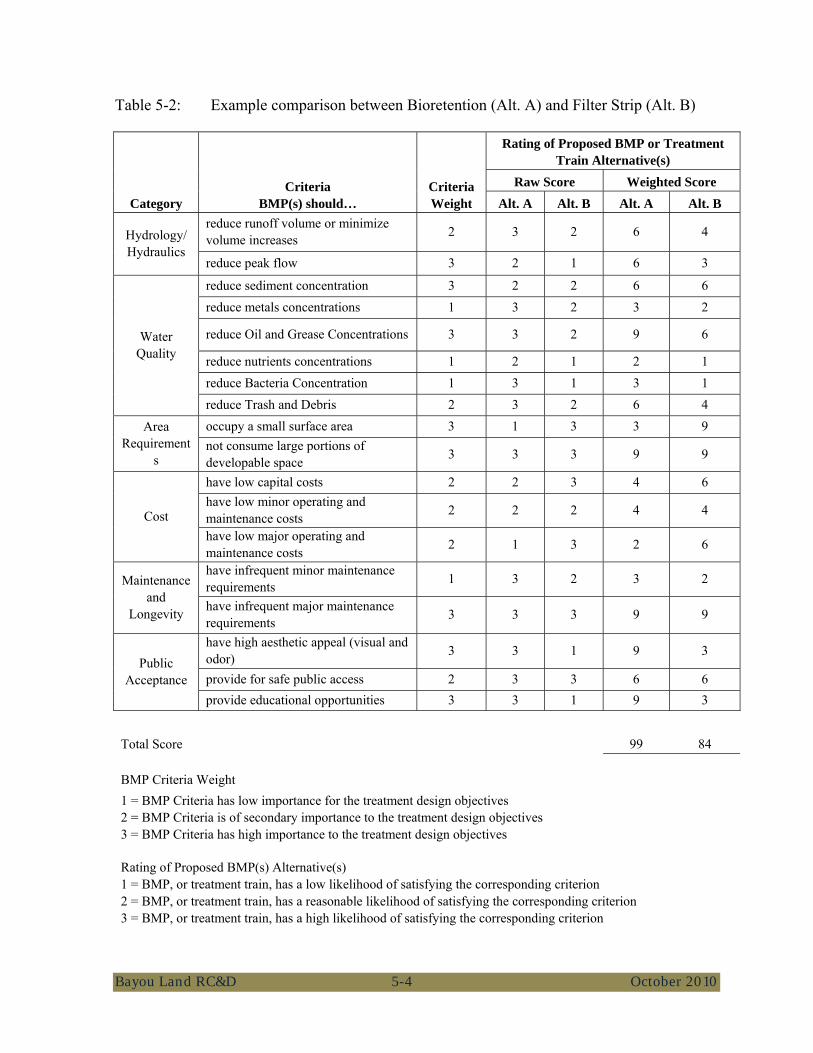
Bayou Land RC&D 5-4 October 2010
Table 5-2: Example comparison between Bioretention (Alt. A) and Filter Strip (Alt. B)
Category Criteria
BMP(s) should… Criteria Weight
Rating of Proposed BMP or Treatment Train Alternative(s)
Raw Score Weighted Score Alt. A Alt. B Alt. A Alt. B
Hydrology/Hydraulics
reduce runoff volume or minimize volume increases 2 3 2 6 4
reduce peak flow 3 2 1 6 3
Water Quality
reduce sediment concentration 3 2 2 6 6 reduce metals concentrations 1 3 2 3 2
reduce Oil and Grease Concentrations 3 3 2 9 6
reduce nutrients concentrations 1 2 1 2 1 reduce Bacteria Concentration 1 3 1 3 1 reduce Trash and Debris 2 3 2 6 4
Area Requirement
s
occupy a small surface area 3 1 3 3 9 not consume large portions of developable space 3 3 3 9 9
Cost
have low capital costs 2 2 3 4 6 have low minor operating and maintenance costs 2 2 2 4 4
have low major operating and maintenance costs 2 1 3 2 6
Maintenance and
Longevity
have infrequent minor maintenance requirements 1 3 2 3 2
have infrequent major maintenance requirements 3 3 3 9 9
Public Acceptance
have high aesthetic appeal (visual and odor) 3 3 1 9 3
provide for safe public access 2 3 3 6 6 provide educational opportunities 3 3 1 9 3
Total Score 99 84
BMP Criteria Weight 1 = BMP Criteria has low importance for the treatment design objectives 2 = BMP Criteria is of secondary importance to the treatment design objectives 3 = BMP Criteria has high importance to the treatment design objectives
Rating of Proposed BMP(s) Alternative(s) 1 = BMP, or treatment train, has a low likelihood of satisfying the corresponding criterion 2 = BMP, or treatment train, has a reasonable likelihood of satisfying the corresponding criterion 3 = BMP, or treatment train, has a high likelihood of satisfying the corresponding criterion
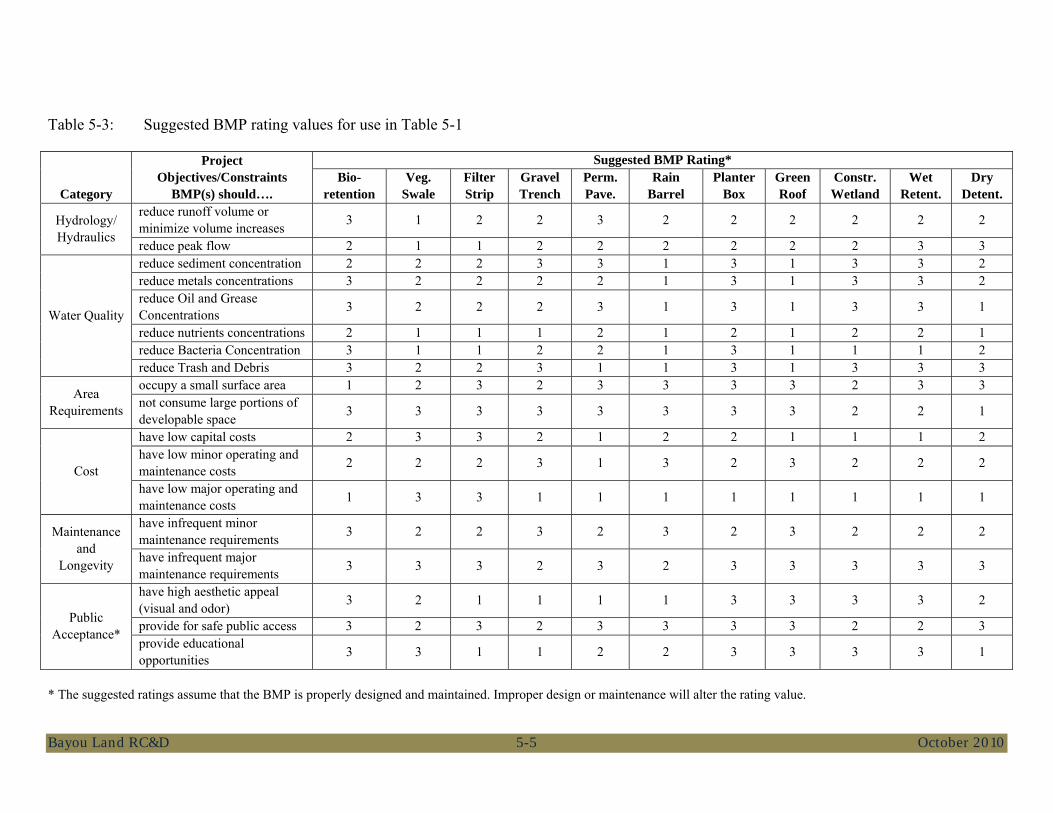
Bayou Land RC&D 5-5 October 2010
Table 5-3: Suggested BMP rating values for use in Table 5-1
Category
Project Objectives/Constraints
BMP(s) should….
Suggested BMP Rating* Bio-
retention Veg.
Swale Filter Strip
Gravel Trench
Perm. Pave.
Rain Barrel
Planter Box
Green Roof
Constr. Wetland
Wet Retent.
Dry Detent.
Hydrology/ Hydraulics
reduce runoff volume or minimize volume increases 3 1 2 2 3 2 2 2 2 2 2
reduce peak flow 2 1 1 2 2 2 2 2 2 3 3
Water Quality
reduce sediment concentration 2 2 2 3 3 1 3 1 3 3 2 reduce metals concentrations 3 2 2 2 2 1 3 1 3 3 2 reduce Oil and Grease Concentrations 3 2 2 2 3 1 3 1 3 3 1
reduce nutrients concentrations 2 1 1 1 2 1 2 1 2 2 1 reduce Bacteria Concentration 3 1 1 2 2 1 3 1 1 1 2 reduce Trash and Debris 3 2 2 3 1 1 3 1 3 3 3
Area Requirements
occupy a small surface area 1 2 3 2 3 3 3 3 2 3 3 not consume large portions of developable space 3 3 3 3 3 3 3 3 2 2 1
Cost
have low capital costs 2 3 3 2 1 2 2 1 1 1 2 have low minor operating and maintenance costs 2 2 2 3 1 3 2 3 2 2 2
have low major operating and maintenance costs 1 3 3 1 1 1 1 1 1 1 1
Maintenance and
Longevity
have infrequent minor maintenance requirements 3 2 2 3 2 3 2 3 2 2 2
have infrequent major maintenance requirements 3 3 3 2 3 2 3 3 3 3 3
Public Acceptance*
have high aesthetic appeal (visual and odor) 3 2 1 1 1 1 3 3 3 3 2
provide for safe public access 3 2 3 2 3 3 3 3 2 2 3 provide educational opportunities 3 3 1 1 2 2 3 3 3 3 1
* The suggested ratings assume that the BMP is properly designed and maintained. Improper design or maintenance will alter the rating value.
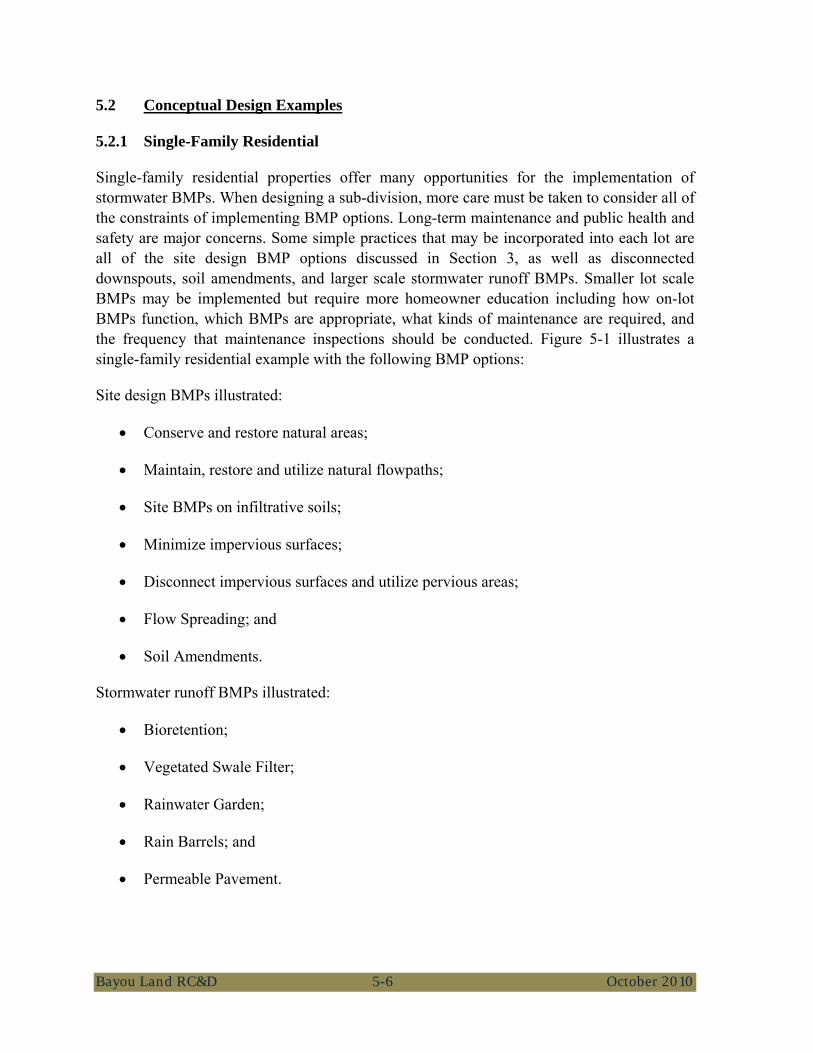
Bayou Land RC&D 5-6 October 2010
5.2 Conceptual Design Examples
5.2.1 Single-Family Residential
Single-family residential properties offer many opportunities for the implementation of stormwater BMPs. When designing a sub-division, more care must be taken to consider all of the constraints of implementing BMP options. Long-term maintenance and public health and safety are major concerns. Some simple practices that may be incorporated into each lot are all of the site design BMP options discussed in Section 3, as well as disconnected downspouts, soil amendments, and larger scale stormwater runoff BMPs. Smaller lot scale BMPs may be implemented but require more homeowner education including how on-lot BMPs function, which BMPs are appropriate, what kinds of maintenance are required, and the frequency that maintenance inspections should be conducted. Figure 5-1 illustrates a single-family residential example with the following BMP options:
Site design BMPs illustrated:
• Conserve and restore natural areas;
• Maintain, restore and utilize natural flowpaths;
• Site BMPs on infiltrative soils;
• Minimize impervious surfaces;
• Disconnect impervious surfaces and utilize pervious areas;
• Flow Spreading; and
• Soil Amendments.
Stormwater runoff BMPs illustrated:
• Bioretention;
• Vegetated Swale Filter;
• Rainwater Garden;
• Rain Barrels; and
• Permeable Pavement.
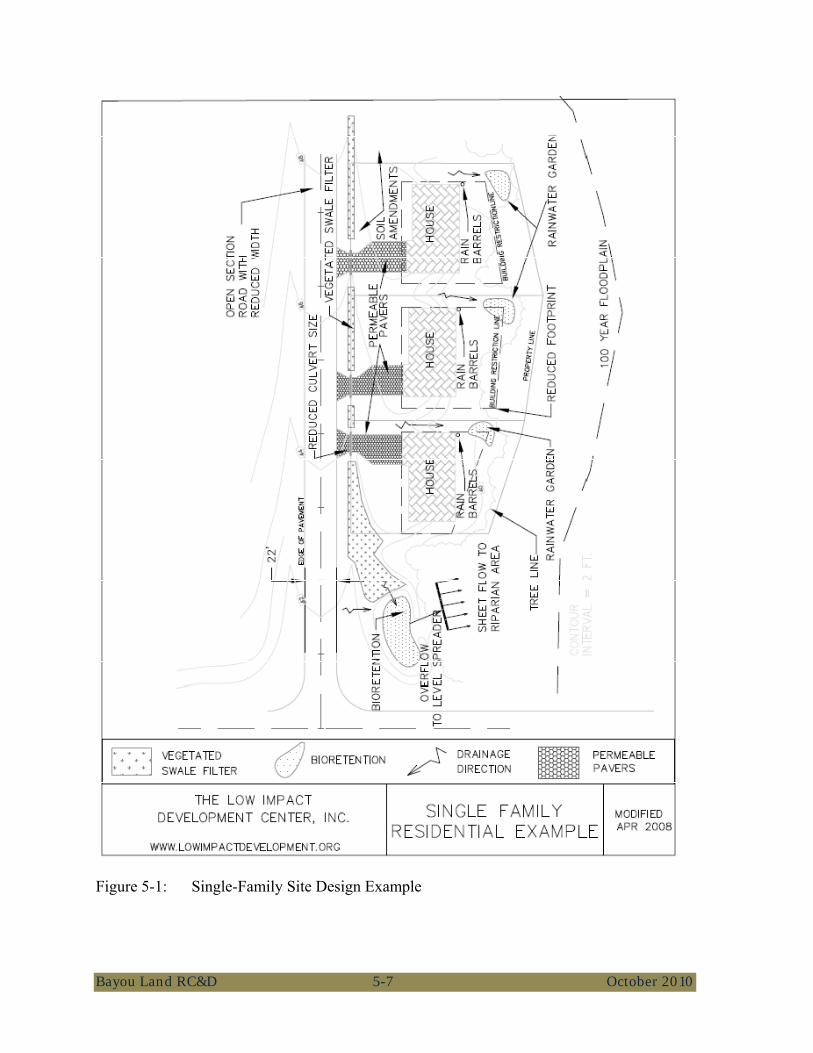
Bayou Land RC&D 5-7 October 2010
Figure 5-1: Single-Family Site Design Example
Bayou Land RC&D 5-8 October 2010
5.2.2 Multi-Family Residential
Multi-family residential sites present challenges and opportunities similar and dissimilar to single-family residential sites. Multi-family residential lots tend to have a higher impervious to pervious ratio and are usually larger in scale; thereby limiting the value of implementing some smaller scale BMP options, such as rain barrels and rainwater gardens. However, due to the larger impervious surfaces of buildings and parking lots, there are additional stormwater runoff BMPs that may be considered (i.e., cisterns and permeable pavement). By utilizing cisterns, downspouts are disconnected and the large impervious area becomes a valuable, multi-benefit water conservation tool for storing runoff water for later use in irrigating landscaped areas. The additional space available makes multi-family residential sites more amenable to vegetated swale filters that may border the site providing landscaping and stormwater filtering, infiltration, and conveyance. Figure 5-2 illustrates a multi-family residential example with the following BMP options:
Site design BMPs illustrated:
• Conserve and restore natural areas;
• Maintain, restore and utilize natural flow paths;
• Minimize impervious surfaces;
• Disconnect impervious surfaces and utilize pervious areas; and
• Soil amendments.
Stormwater runoff BMP options (Chapter 6) illustrated:
• Bioretention;
• Vegetated Swale Filter;
• Permeable Pavement;
• Planter Box; and
• Green Roof.

Bayou Land RC&D 5-9 October 2010
Figure 5-2: Multi-Family Residential Site Design Example
Bayou Land RC&D 5-10 October 2010
5.2.3 Commercial Developments
Commercial developments offer numerous opportunities for implementing stormwater BMPs, especially in parking areas and on rooftops. Commercial lots have large areas devoted to employee and customer parking and, with a few modifications, become excellent locations for implementing stormwater BMPs and also enhancing the aesthetics of the site. The largest reduction in impervious area created by installing parking lots may be accomplished by using a permeable pavement option, such as permeable asphalt, pervious concrete, or permeable pavers. Permeable designs and products must be chosen carefully, as some can warp and/or shift in high traffic areas or areas where vehicles frequently turn. In addition, impervious parking lots may be designed to drain into landscaped islands designed to house bioretention facilities that provide not only volume reduction, slowing of runoff, and water treatment but also shade for the parked cars as and enhance aesthetics. Landscaped areas may also be incorporated around buildings and in courtyards, thereby reducing imperviousness as well as creating areas for employee use and/or screening around the property.
Commercial rooftops may be installed as green roofs to absorb some of the precipitation and reduce runoff volumes. Rooftops may also be constructed with traditional gutters that direct water to downspouts; however, the downspouts may be connected to planter boxes or cisterns for direct or indirect irrigation of landscaping. Figure 5-3 illustrates a commercial development example with the following BMP options:
Site design BMPs illustrated:
• Conserve and restore natural areas;
• Site BMPs on infiltrative soils;
• Minimize impervious surfaces; and
• Disconnect impervious surfaces and utilize pervious areas.
Stormwater runoff BMPs illustrated:
• Bioretention;
• Vegetated Swale Filter;
• Permeable Pavement;
• Cistern;
• Planter Box; and
• Green Roof.
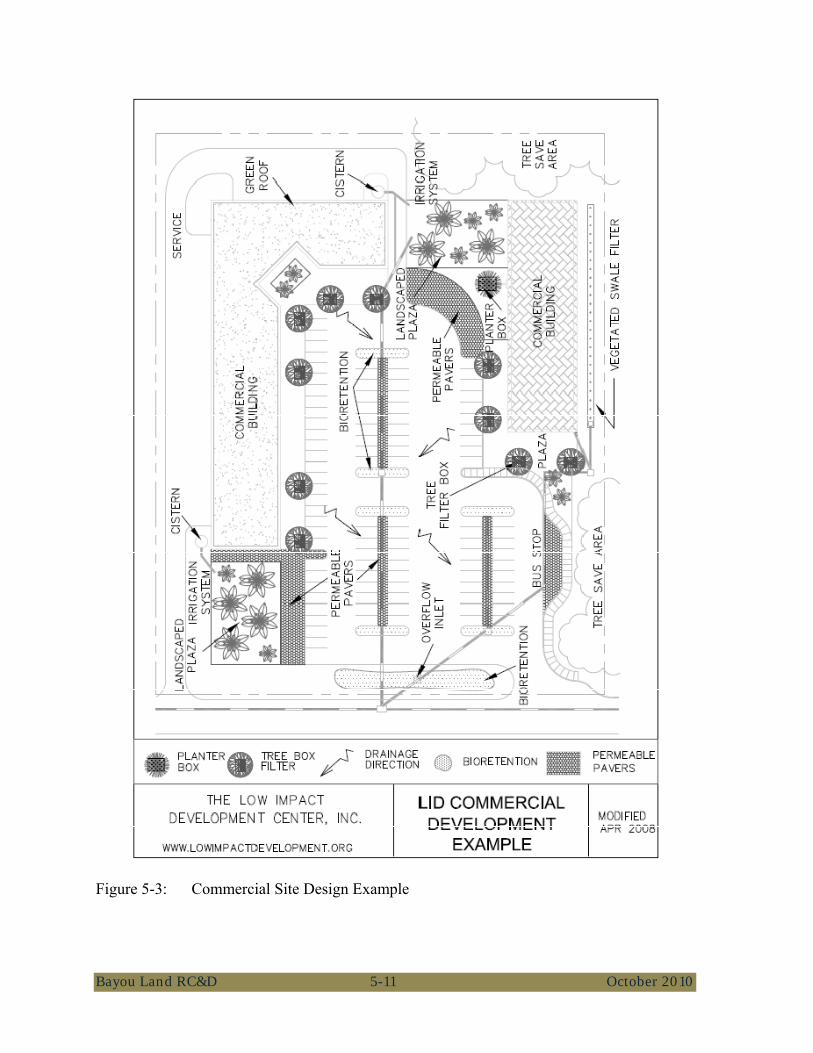
Bayou Land RC&D 5-11 October 2010
Figure 5-3: Commercial Site Design Example
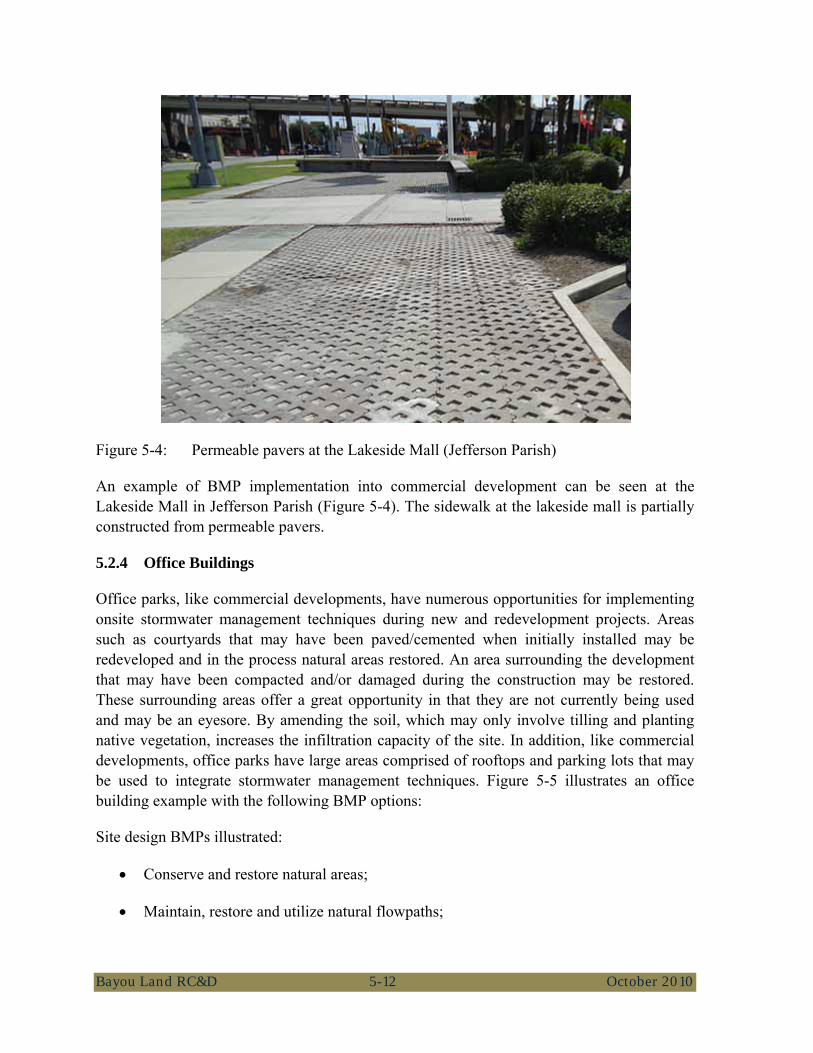
Bayou Land RC&D 5-12 October 2010
Figure 5-4: Permeable pavers at the Lakeside Mall (Jefferson Parish)
An example of BMP implementation into commercial development can be seen at the Lakeside Mall in Jefferson Parish (Figure 5-4). The sidewalk at the lakeside mall is partially constructed from permeable pavers.
5.2.4 Office Buildings
Office parks, like commercial developments, have numerous opportunities for implementing onsite stormwater management techniques during new and redevelopment projects. Areas such as courtyards that may have been paved/cemented when initially installed may be redeveloped and in the process natural areas restored. An area surrounding the development that may have been compacted and/or damaged during the construction may be restored. These surrounding areas offer a great opportunity in that they are not currently being used and may be an eyesore. By amending the soil, which may only involve tilling and planting native vegetation, increases the infiltration capacity of the site. In addition, like commercial developments, office parks have large areas comprised of rooftops and parking lots that may be used to integrate stormwater management techniques. Figure 5-5 illustrates an office building example with the following BMP options:
Site design BMPs illustrated:
• Conserve and restore natural areas;
• Maintain, restore and utilize natural flowpaths;

Bayou Land RC&D 5-13 October 2010
• Site BMPs on infiltrative soils;
• Minimize impervious surfaces;
• Disconnect impervious surfaces and utilize pervious areas;
• Flow Spreading;
• Rainwater Garden;
• Rain Barrels; and
• Soil Amendments.
Stormwater runoff BMPs illustrated:
• Bioretention;
• Vegetated Swale Filter; and
• Permeable Pavement.
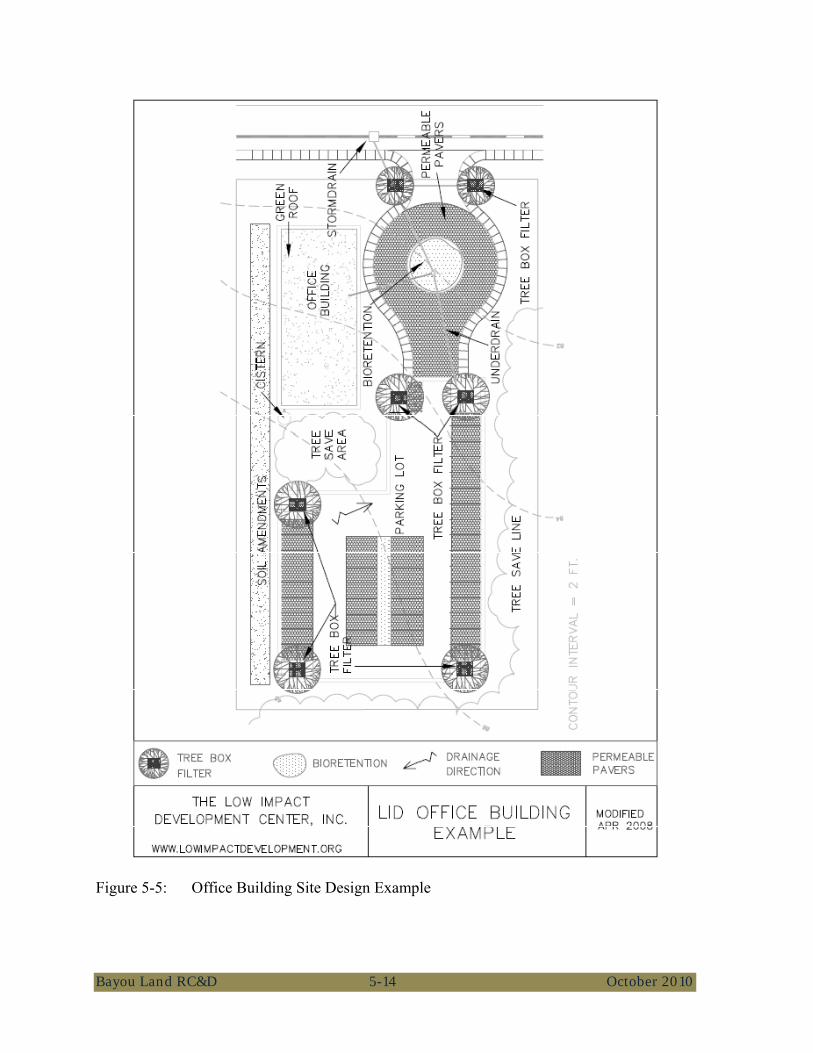
Bayou Land RC&D 5-14 October 2010
Figure 5-5: Office Building Site Design Example
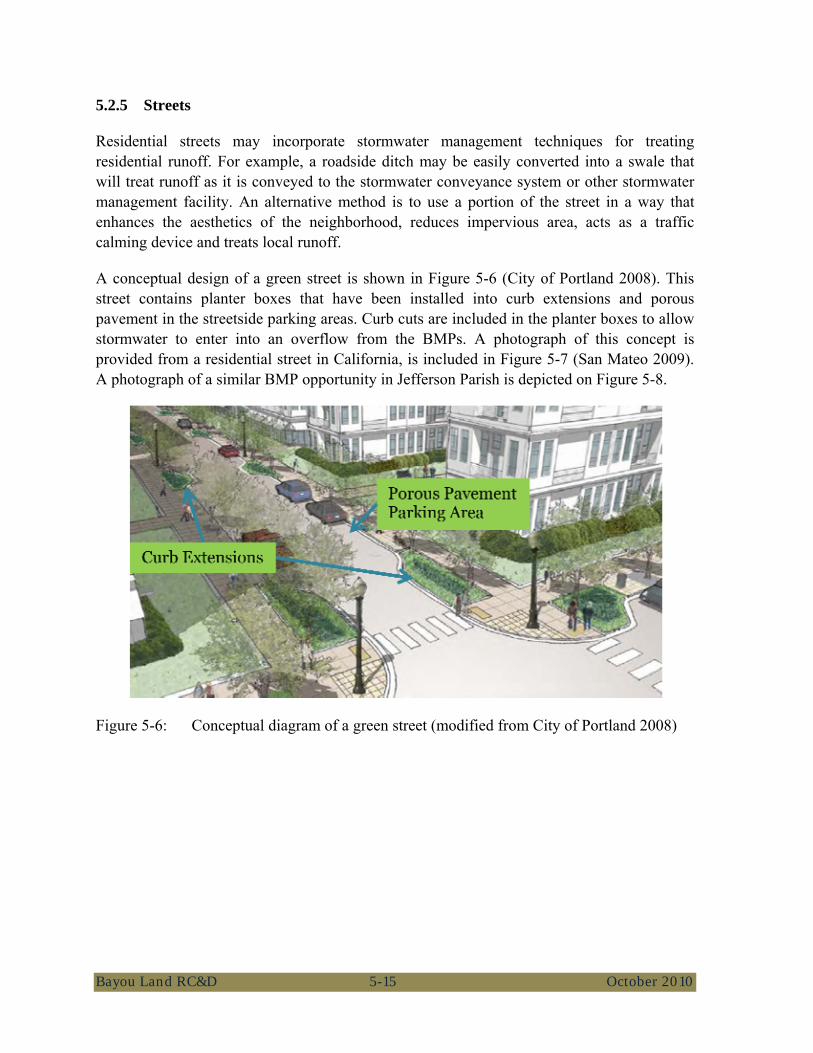
Bayou Land RC&D 5-15 October 2010
5.2.5 Streets
Residential streets may incorporate stormwater management techniques for treating residential runoff. For example, a roadside ditch may be easily converted into a swale that will treat runoff as it is conveyed to the stormwater conveyance system or other stormwater management facility. An alternative method is to use a portion of the street in a way that enhances the aesthetics of the neighborhood, reduces impervious area, acts as a traffic calming device and treats local runoff.
A conceptual design of a green street is shown in Figure 5-6 (City of Portland 2008). This street contains planter boxes that have been installed into curb extensions and porous pavement in the streetside parking areas. Curb cuts are included in the planter boxes to allow stormwater to enter into an overflow from the BMPs. A photograph of this concept is provided from a residential street in California, is included in Figure 5-7 (San Mateo 2009). A photograph of a similar BMP opportunity in Jefferson Parish is depicted on Figure 5-8.
Figure 5-6: Conceptual diagram of a green street (modified from City of Portland 2008)
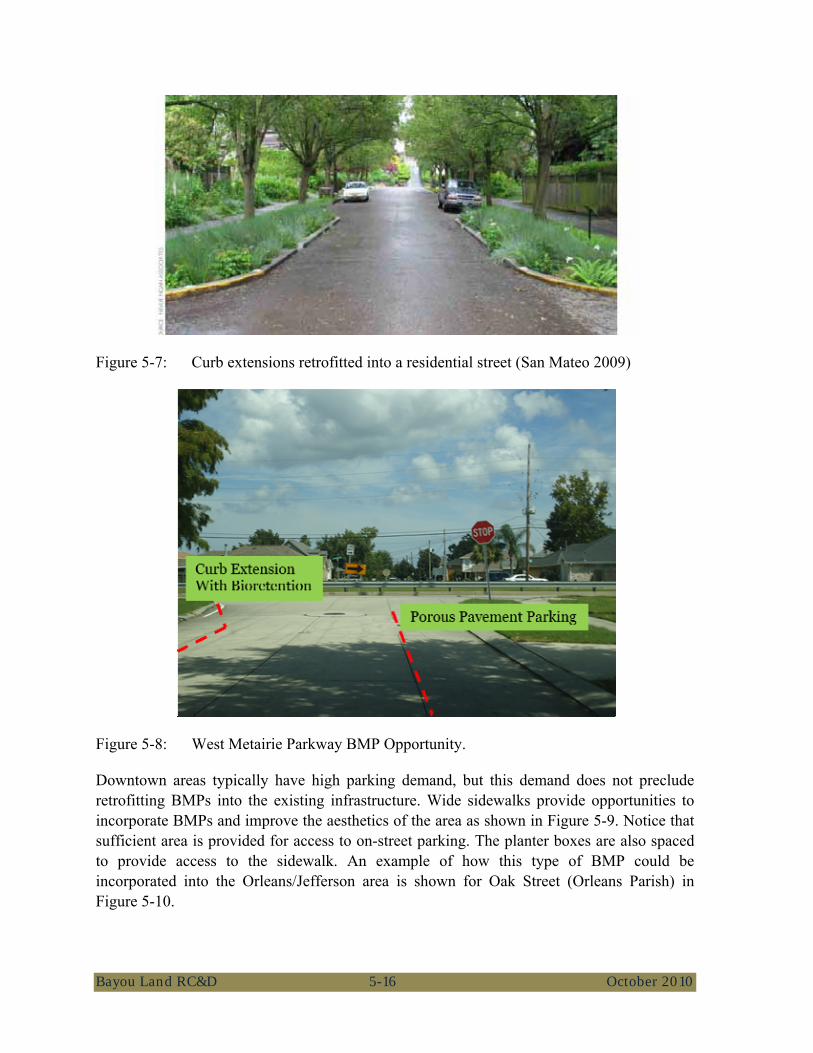
Bayou Land RC&D 5-16 October 2010
Figure 5-7: Curb extensions retrofitted into a residential street (San Mateo 2009)
Figure 5-8: West Metairie Parkway BMP Opportunity.
Downtown areas typically have high parking demand, but this demand does not preclude retrofitting BMPs into the existing infrastructure. Wide sidewalks provide opportunities to incorporate BMPs and improve the aesthetics of the area as shown in Figure 5-9. Notice that sufficient area is provided for access to on-street parking. The planter boxes are also spaced to provide access to the sidewalk. An example of how this type of BMP could be incorporated into the Orleans/Jefferson area is shown for Oak Street (Orleans Parish) in Figure 5-10.

Bayou Land RC&D 5-17 October 2010
Major, or arterial, roadways offer the fewest opportunities to incorporate BMPs due to the need for traffic conveyance. However, vegetated swales and porous pavements can be incorporated into rights-of-way as shown in Figure 5-11. Many arterial roadways already incorporate grass filter strips as inadvertent BMPs as shown in Figure 5-12.
Figure 5-9: BMPs incorporated into a wide sidewalk (modified from San Mateo 2009)
Figure 5-10: Oak Street BMP Opportunity
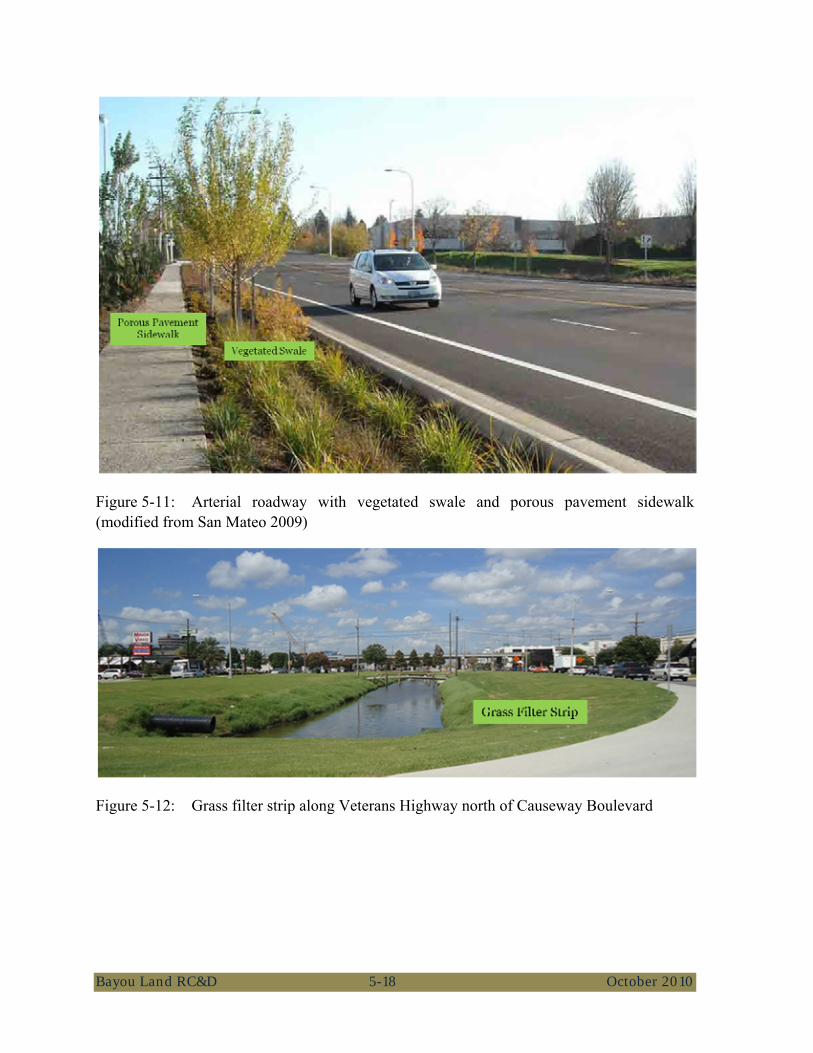
Bayou Land RC&D 5-18 October 2010
Figure 5-11: Arterial roadway with vegetated swale and porous pavement sidewalk (modified from San Mateo 2009)
Figure 5-12: Grass filter strip along Veterans Highway north of Causeway Boulevard
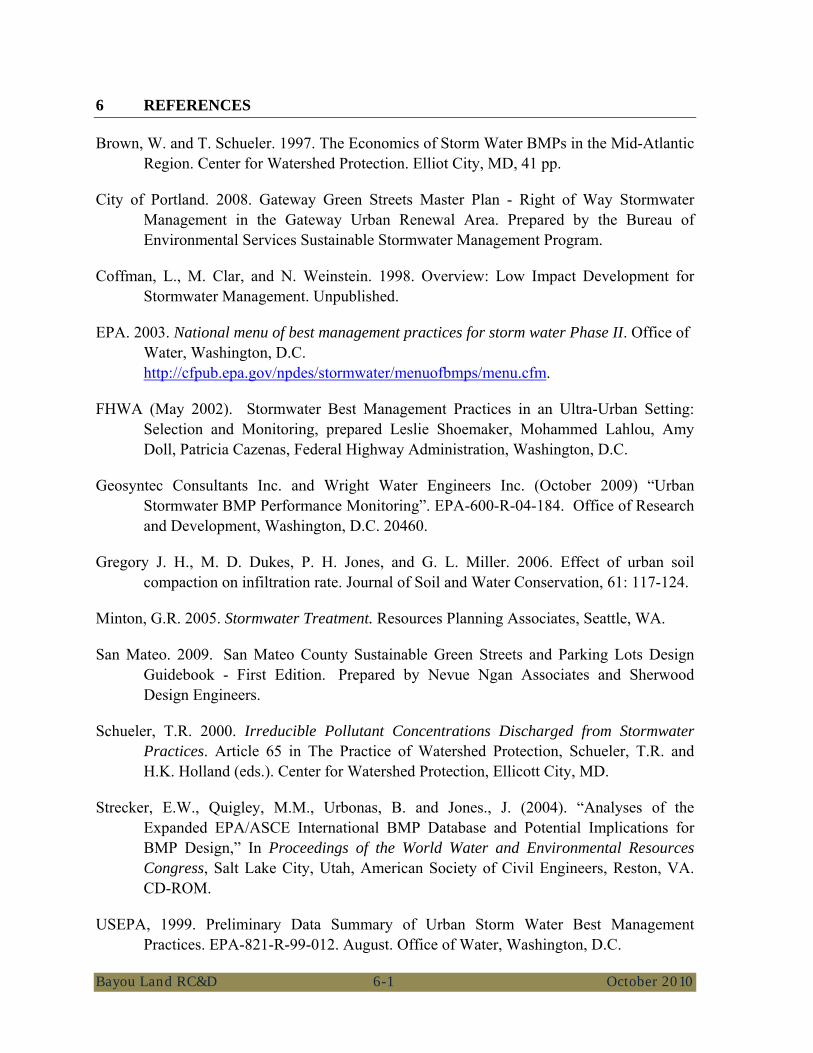
Bayou Land RC&D 6-1 October 2010
6 REFERENCES
Brown, W. and T. Schueler. 1997. The Economics of Storm Water BMPs in the Mid-Atlantic Region. Center for Watershed Protection. Elliot City, MD, 41 pp.
City of Portland. 2008. Gateway Green Streets Master Plan - Right of Way Stormwater Management in the Gateway Urban Renewal Area. Prepared by the Bureau of Environmental Services Sustainable Stormwater Management Program.
Coffman, L., M. Clar, and N. Weinstein. 1998. Overview: Low Impact Development for Stormwater Management. Unpublished.
EPA. 2003. National menu of best management practices for storm water Phase II. Office of Water, Washington, D.C. http://cfpub.epa.gov/npdes/stormwater/menuofbmps/menu.cfm.
FHWA (May 2002). Stormwater Best Management Practices in an Ultra-Urban Setting: Selection and Monitoring, prepared Leslie Shoemaker, Mohammed Lahlou, Amy Doll, Patricia Cazenas, Federal Highway Administration, Washington, D.C.
Geosyntec Consultants Inc. and Wright Water Engineers Inc. (October 2009) “Urban Stormwater BMP Performance Monitoring”. EPA-600-R-04-184. Office of Research and Development, Washington, D.C. 20460.
Gregory J. H., M. D. Dukes, P. H. Jones, and G. L. Miller. 2006. Effect of urban soil compaction on infiltration rate. Journal of Soil and Water Conservation, 61: 117-124.
Minton, G.R. 2005. Stormwater Treatment. Resources Planning Associates, Seattle, WA.
San Mateo. 2009. San Mateo County Sustainable Green Streets and Parking Lots Design Guidebook - First Edition. Prepared by Nevue Ngan Associates and Sherwood Design Engineers.
Schueler, T.R. 2000. Irreducible Pollutant Concentrations Discharged from Stormwater Practices. Article 65 in The Practice of Watershed Protection, Schueler, T.R. and H.K. Holland (eds.). Center for Watershed Protection, Ellicott City, MD.
Strecker, E.W., Quigley, M.M., Urbonas, B. and Jones., J. (2004). “Analyses of the Expanded EPA/ASCE International BMP Database and Potential Implications for BMP Design,” In Proceedings of the World Water and Environmental Resources Congress, Salt Lake City, Utah, American Society of Civil Engineers, Reston, VA. CD-ROM.
USEPA, 1999. Preliminary Data Summary of Urban Storm Water Best Management Practices. EPA-821-R-99-012. August. Office of Water, Washington, D.C.
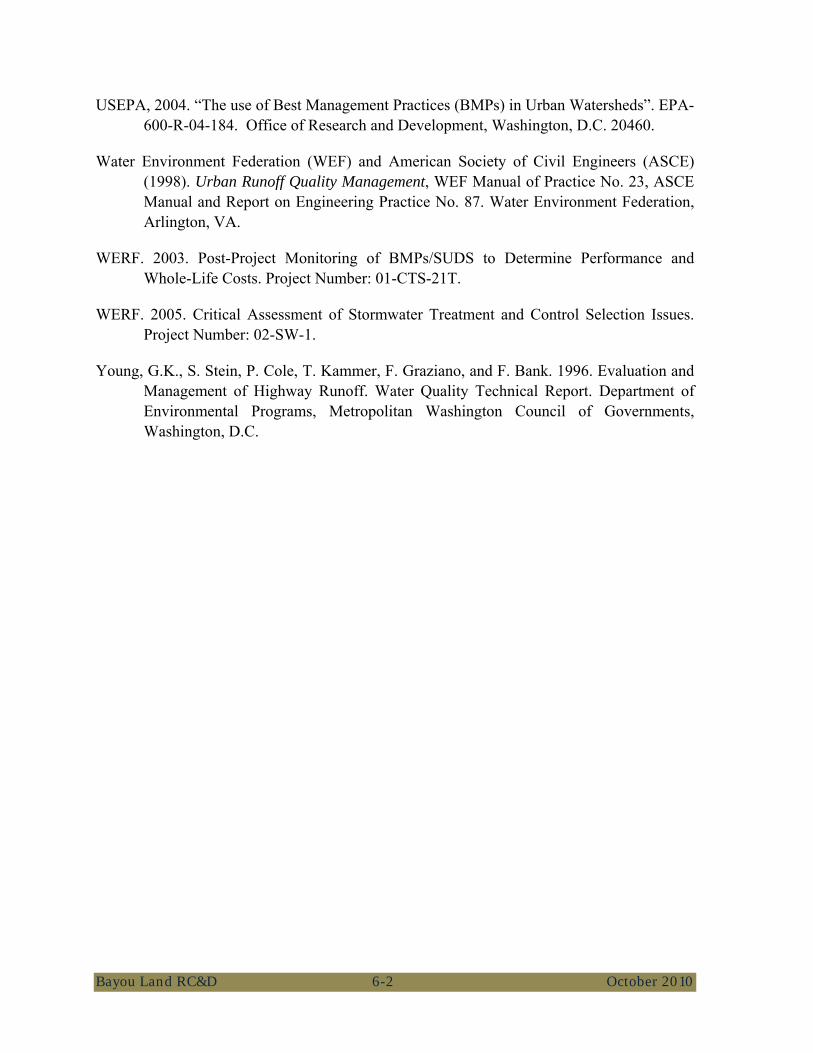
Bayou Land RC&D 6-2 October 2010
USEPA, 2004. “The use of Best Management Practices (BMPs) in Urban Watersheds”. EPA-600-R-04-184. Office of Research and Development, Washington, D.C. 20460.
Water Environment Federation (WEF) and American Society of Civil Engineers (ASCE) (1998). Urban Runoff Quality Management, WEF Manual of Practice No. 23, ASCE Manual and Report on Engineering Practice No. 87. Water Environment Federation, Arlington, VA.
WERF. 2003. Post-Project Monitoring of BMPs/SUDS to Determine Performance and Whole-Life Costs. Project Number: 01-CTS-21T.
WERF. 2005. Critical Assessment of Stormwater Treatment and Control Selection Issues. Project Number: 02-SW-1.
Young, G.K., S. Stein, P. Cole, T. Kammer, F. Graziano, and F. Bank. 1996. Evaluation and Management of Highway Runoff. Water Quality Technical Report. Department of Environmental Programs, Metropolitan Washington Council of Governments, Washington, D.C.

EXHIBITS
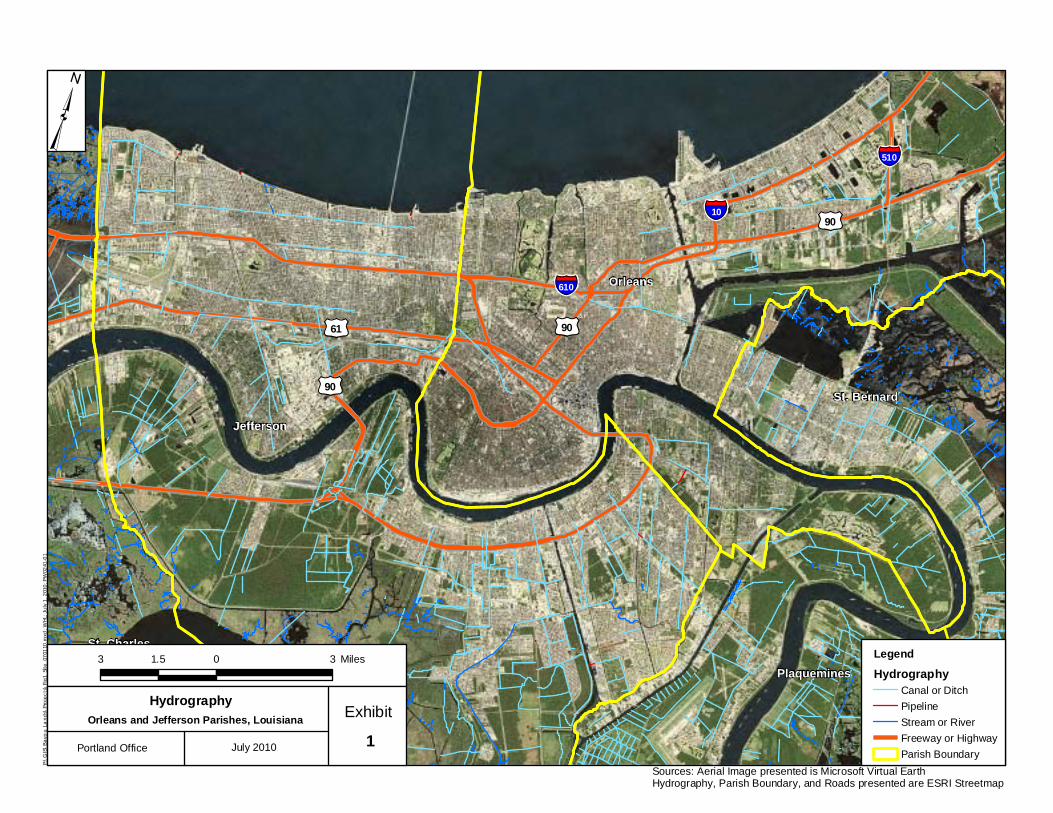
Jefferson
Orleans
St. Charles
St. Bernard
Plaquemines
§̈¦10
§̈¦610
§̈¦510
P:\GI
S\Ba
you_
Land
s\Pro
jects\
Fig1_
Site_
0701
10.m
xd; W
HL; J
uly 1,
2010
; PW
0241
-01
3 0 31.5 Miles
³
HydrographyOrleans and Jefferson Parishes, Louisiana Exhibit
1Portland Office July 2010
LegendHydrography
Canal or DitchPipelineStream or RiverFreeway or HighwayParish Boundary
£¤61
£¤90
£¤90
£¤90
Sources: Aerial Image presented is Microsoft Virtual EarthHydrography, Parish Boundary, and Roads presented are ESRI Streetmap
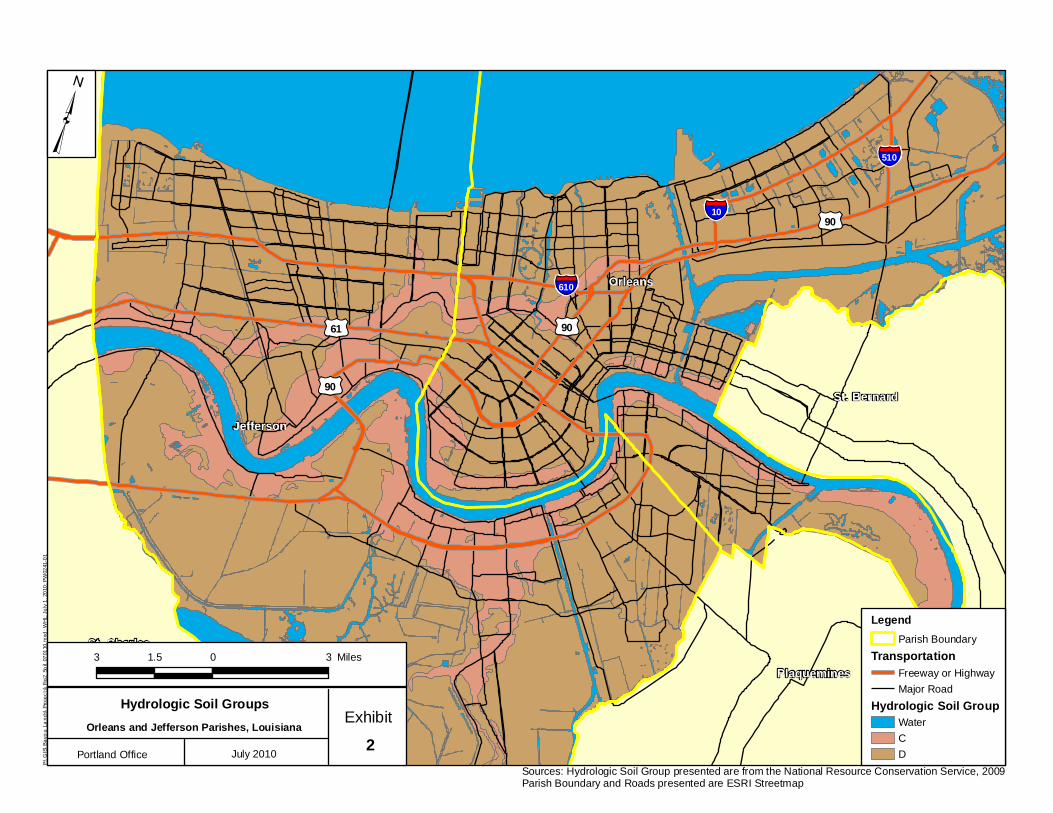
Jefferson
Orleans
St. Charles
St. Bernard
Plaquemines
§̈¦10
§̈¦610
§̈¦510
P:\GI
S\Ba
you_
Land
s\Pro
jects\
Fig2_
Soil_0
7011
0.mxd
; WHL
; July
1, 20
10; P
W02
41-0
1
³
Hydrologic Soil GroupsOrleans and Jefferson Parishes, Louisiana Exhibit
2Portland Office July 2010
LegendParish Boundary
TransportationFreeway or HighwayMajor Road
Hydrologic Soil GroupWaterCD
£¤61
£¤90
£¤90
£¤90
3 0 31.5 Miles
Sources: Hydrologic Soil Group presented are from the National Resource Conservation Service, 2009Parish Boundary and Roads presented are ESRI Streetmap

Jefferson
Orleans
St. Charles
St. Bernard
Plaquemines
§̈¦10
§̈¦610
§̈¦510
Pontchartrain, Lake
P:\GI
S\Ba
you_
Land
s\Pro
jects\
Fig3_
GW_0
7011
0.mxd
; WHL
; July
1, 20
10; P
W02
41-01
³
Depth to Water TableOrleans and Jefferson Parishes, Louisiana Exhibit
3Portland Office July 2010
LegendTransportation
Freeway or HighwayMajor Road
WaterbodyLake/PondSwamp/Marsh
Parish BoundaryDepth to Water Table (cm)
0 - 1516 - 3031 - 60> 60
£¤61
£¤90
£¤90
£¤90
3 0 31.5 Miles
Sources: Depth to Water Table presented are from the National Resource Conservation Service, 2009Parish Boundary and Roads presented are ESRI Streetmap

APPENDIX A
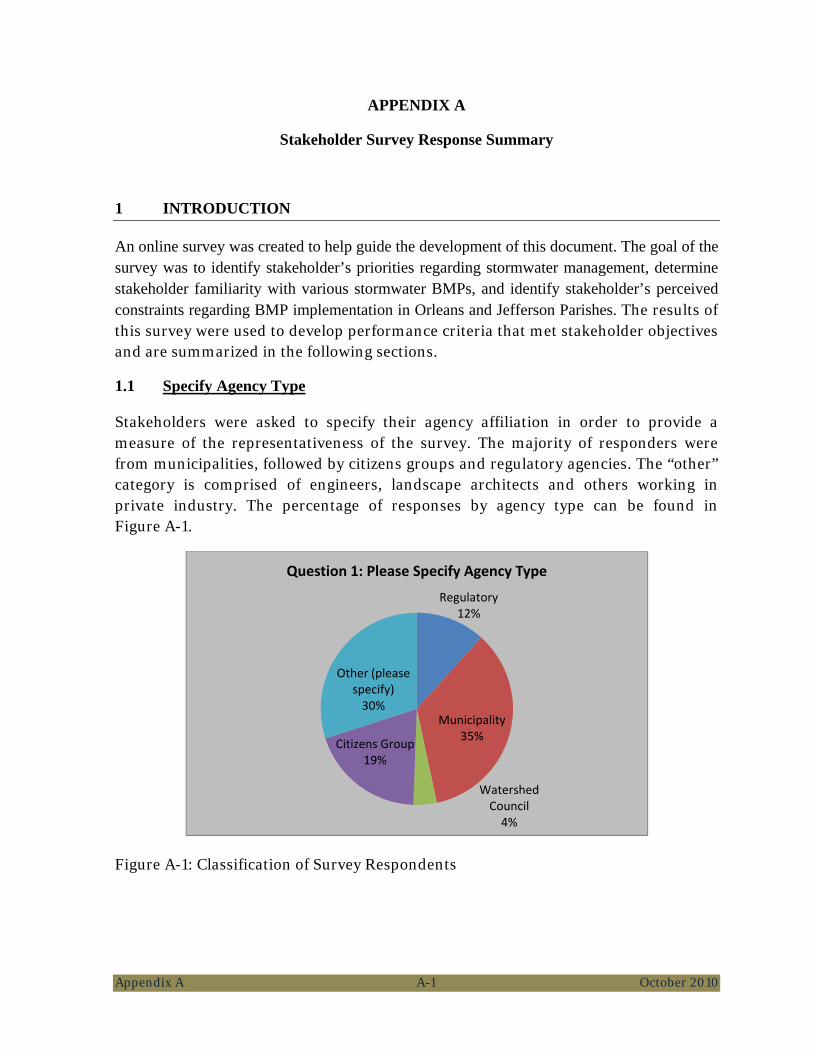
Appendix A A-1 October 2010
APPENDIX A
Stakeholder Survey Response Summary
1 INTRODUCTION
An online survey was created to help guide the development of this document. The goal of the survey was to identify stakeholder’s priorities regarding stormwater management, determine stakeholder familiarity with various stormwater BMPs, and identify stakeholder’s perceived constraints regarding BMP implementation in Orleans and Jefferson Parishes. The results of this survey were used to develop performance criteria that met stakeholder objectives and are summarized in the following sections.
1.1 Specify Agency Type
Stakeholders were asked to specify their agency affiliation in order to provide a measure of the representativeness of the survey. The majority of responders were from municipalities, followed by citizens groups and regulatory agencies. The “other” category is comprised of engineers, landscape architects and others working in private industry. The percentage of responses by agency type can be found in Figure A-1.
Figure A-1: Classification of Survey Respondents
Regulatory12%
Municipality35%
Watershed Council4%
Citizens Group19%
Other (please specify)30%
Question 1: Please Specify Agency Type
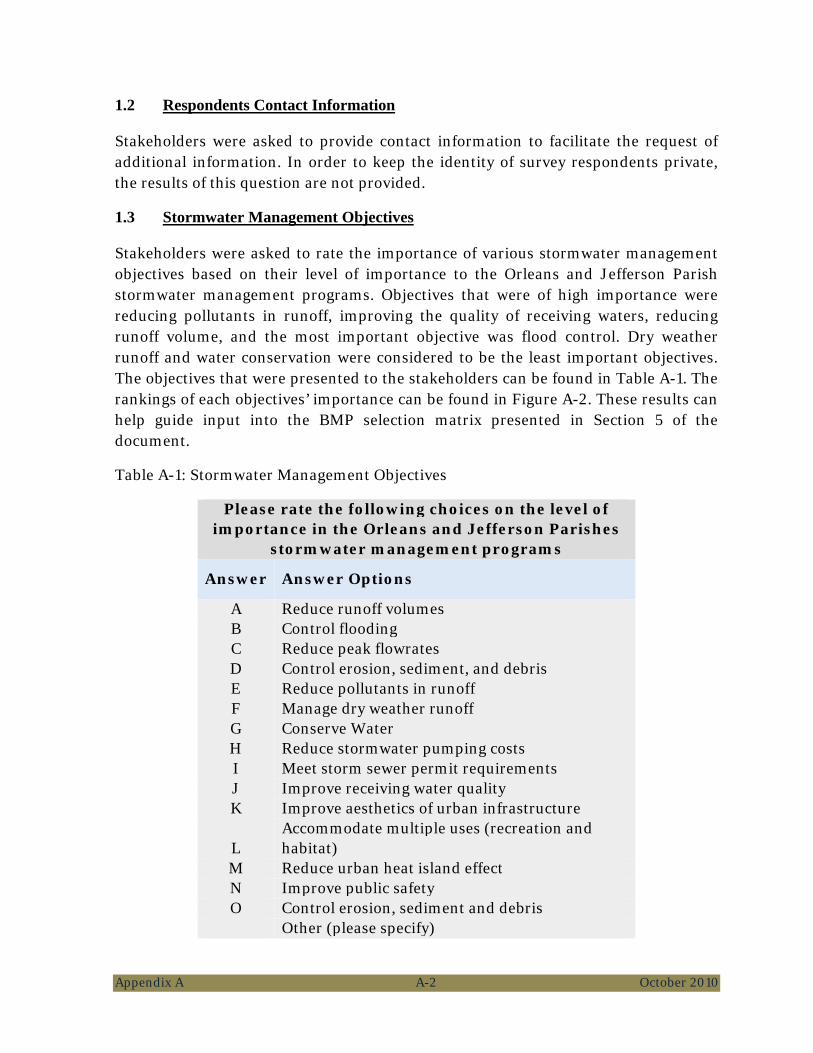
Appendix A A-2 October 2010
1.2 Respondents Contact Information
Stakeholders were asked to provide contact information to facilitate the request of additional information. In order to keep the identity of survey respondents private, the results of this question are not provided.
1.3 Stormwater Management Objectives
Stakeholders were asked to rate the importance of various stormwater management objectives based on their level of importance to the Orleans and Jefferson Parish stormwater management programs. Objectives that were of high importance were reducing pollutants in runoff, improving the quality of receiving waters, reducing runoff volume, and the most important objective was flood control. Dry weather runoff and water conservation were considered to be the least important objectives. The objectives that were presented to the stakeholders can be found in Table A-1. The rankings of each objectives’ importance can be found in Figure A-2. These results can help guide input into the BMP selection matrix presented in Section 5 of the document.
Table A-1: Stormwater Management Objectives
Please rate the following choices on the level of importance in the Orleans and Jefferson Parishes
stormwater management programs
Answer Answer Options
A Reduce runoff volumes B Control flooding C Reduce peak flowrates D Control erosion, sediment, and debris E Reduce pollutants in runoff F Manage dry weather runoff G Conserve Water H Reduce stormwater pumping costs I Meet storm sewer permit requirements J Improve receiving water quality K Improve aesthetics of urban infrastructure
L Accommodate multiple uses (recreation and habitat)
M Reduce urban heat island effect N Improve public safety O Control erosion, sediment and debris
Other (please specify)

Appendix A A-3 October 2010
Figure A-2: Rankings of Stormwater Management Objectives
1.4 BMP Type Familiarity
Stakeholders were asked to rate their familiarity with various BMPs as well as their familiarity with specific attributes and approaches associated with that BMP. BMPs that were the most familiar to respondents were rain barrels, cisterns, vegetated swales, and rain gardens. The BMPs that were rated as unknown were infiltration basins, bioretention, and hydrodynamic separators. BMPs that were presented to stakeholders in this question are presented in Table A-2. A summary of responses can be found in Figure A-3.
0%10%20%30%40%50%60%70%80%90%
100%
A B C D E F G H I J K L M N O
Question 3: Please rate the following choices on the level of importance for stormwater management
Low
Medium
High

Appendix A A-4 October 2010
Table A-2: BMP Types
Please rate your familiarity with the following types of BMPs
Answer Answer Description A Vegetated swales B Vegetated filter strips C Permeable pavement D Rain barrels E Cisterns F Bioretention G Rain gardens H Downspout planter boxes I Pocket wetlands J Hydrodynamic separators K Sand filters L Extended detention basins M Infiltration Basins N Retention basins/wet ponds
Other (please specify)
Figure A-3: Familiarity Rankings for BMP types
0%10%20%30%40%50%60%70%80%90%100%
A B C D E F G H I J K L M N
Question 4: Please rate your familiarity with the following types of BMPs
Never Heard of It
Heard of It
Somewhat Familiar
Very Familiar

Appendix A A-5 October 2010
1.5 BMP Challenges and Constraints
Stakeholders were asked to rate the frequency of challenges and constraints for stormwater BMP implementation in Orleans and Jefferson Parishes. The challenges or constraints that were considered to present the greatest obstacles to BMP implementation were water table elevations, operations and maintenance, space availability or infrastructure conflicts, and capital cost. Challenges or constraints that were never or rarely issues were water rights, environmental permitting, and public acceptance. A list of potential constraints that was presented to the stakeholders can be found in Table A-3. The stakeholder responses can be found in Figure A-4.
Table A-3: Potential Constraints for Stormwater BMP Implementation
Please rate the frequency of the following challenges and constraints for green
stormwater BMP implementation in Orleans and Jefferson Parishes
Answer Answer Description
A Space availability/infrastructure conflicts B Ownership/rights-of-way C Soil types D Water table elevations E Slope/relief F Capital cost G Operations and maintenance H Public acceptance I Existing codes and ordinances J Limited BMP design guidance available K BMP construction permitting L Environmental permitting M Water rights
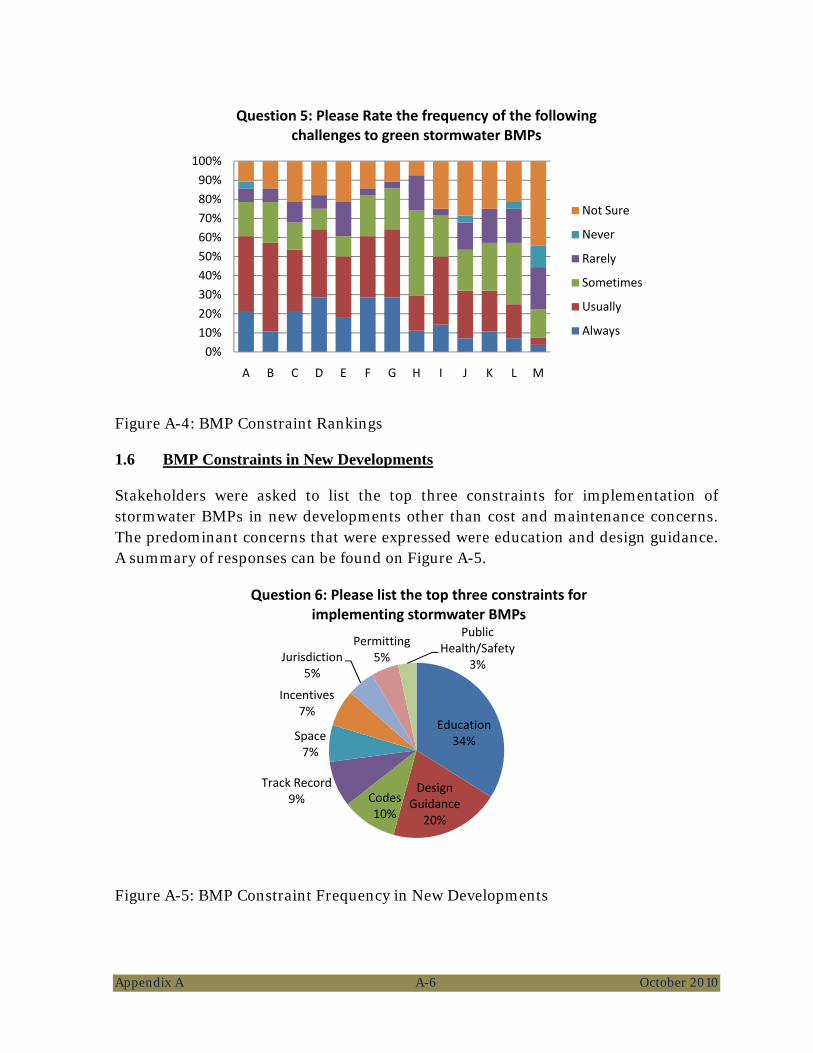
Appendix A A-6 October 2010
Figure A-4: BMP Constraint Rankings
1.6 BMP Constraints in New Developments
Stakeholders were asked to list the top three constraints for implementation of stormwater BMPs in new developments other than cost and maintenance concerns. The predominant concerns that were expressed were education and design guidance. A summary of responses can be found on Figure A-5.
Figure A-5: BMP Constraint Frequency in New Developments
0%10%20%30%40%50%60%70%80%90%100%
A B C D E F G H I J K L M
Question 5: Please Rate the frequency of the following challenges to green stormwater BMPs
Not Sure
Never
Rarely
Sometimes
Usually
Always
Education34%
Design Guidance
20%
Codes10%
Track Record9%
Space7%
Incentives7%
Jurisdiction5%
Permitting5%
Public Health/Safety
3%
Question 6: Please list the top three constraints for implementing stormwater BMPs
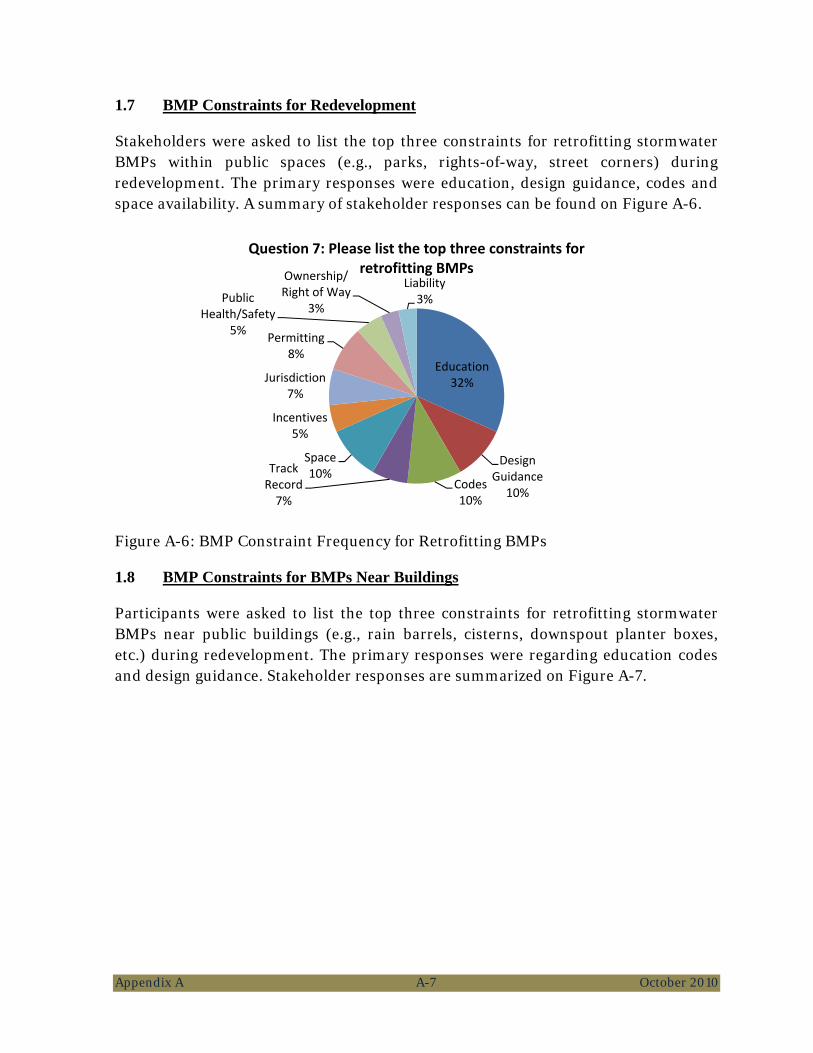
Appendix A A-7 October 2010
1.7 BMP Constraints for Redevelopment
Stakeholders were asked to list the top three constraints for retrofitting stormwater BMPs within public spaces (e.g., parks, rights-of-way, street corners) during redevelopment. The primary responses were education, design guidance, codes and space availability. A summary of stakeholder responses can be found on Figure A-6.
Figure A-6: BMP Constraint Frequency for Retrofitting BMPs
1.8 BMP Constraints for BMPs Near Buildings
Participants were asked to list the top three constraints for retrofitting stormwater BMPs near public buildings (e.g., rain barrels, cisterns, downspout planter boxes, etc.) during redevelopment. The primary responses were regarding education codes and design guidance. Stakeholder responses are summarized on Figure A-7.
Education32%
Design Guidance
10%Codes10%
Track Record7%
Space10%
Incentives5%
Jurisdiction7%
Permitting8%
Public Health/Safety
5%
Ownership/Right of Way
3%
Liability3%
Question 7: Please list the top three constraints for retrofitting BMPs
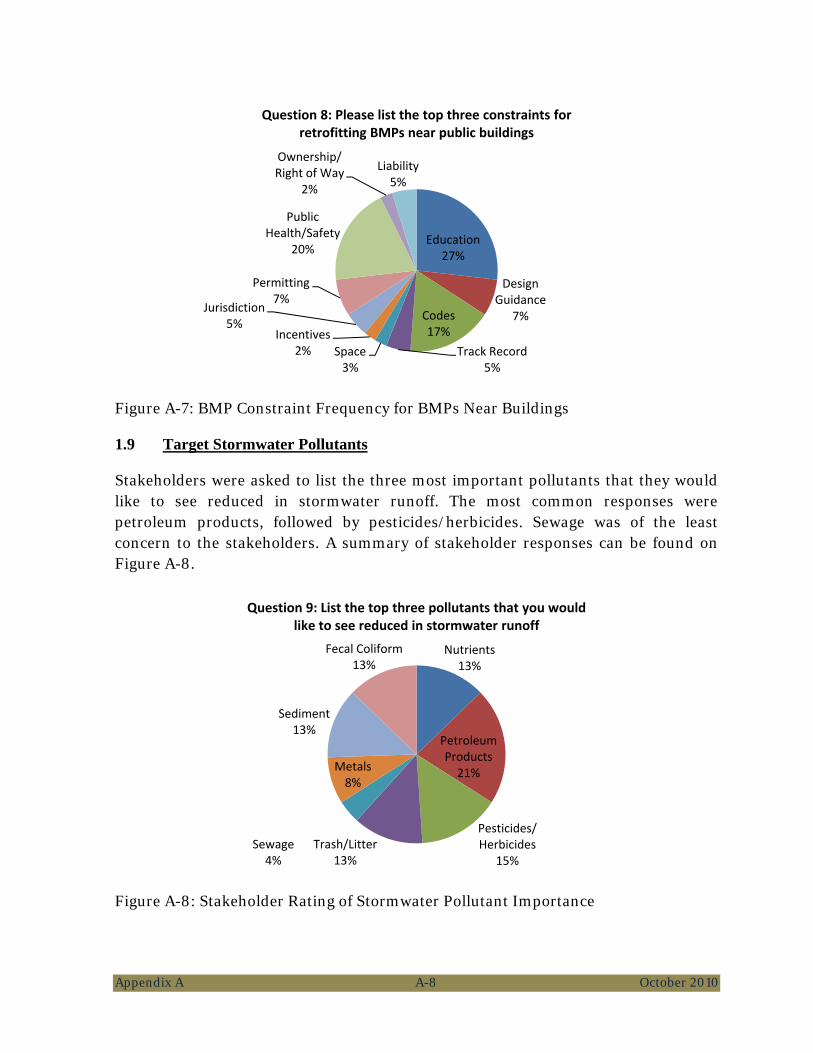
Appendix A A-8 October 2010
Figure A-7: BMP Constraint Frequency for BMPs Near Buildings
1.9 Target Stormwater Pollutants
Stakeholders were asked to list the three most important pollutants that they would like to see reduced in stormwater runoff. The most common responses were petroleum products, followed by pesticides/herbicides. Sewage was of the least concern to the stakeholders. A summary of stakeholder responses can be found on Figure A-8.
Figure A-8: Stakeholder Rating of Stormwater Pollutant Importance
Education27%
Design Guidance
7%Codes17%
Track Record5%
Space3%
Incentives2%
Jurisdiction5%
Permitting7%
Public Health/Safety
20%
Ownership/Right of Way
2%
Liability5%
Question 8: Please list the top three constraints for retrofitting BMPs near public buildings
Nutrients13%
Petroleum Products21%
Pesticides/Herbicides
15%Trash/Litter
13%Sewage4%
Metals8%
Sediment13%
Fecal Coliform13%
Question 9: List the top three pollutants that you would like to see reduced in stormwater runoff