Embed Size (px)
Citation preview

A study of Carbon Credit Market in India (Gujarat)
A thesis submitted to Gujarat Technological University
for the Award of
Doctor of Philosophy
In
Management
By
Avani Nareshbhai Shah
[119997392004]
GUJARAT TECHNOLOGICAL UNIVERSITY
AHMEDABAD
[September – 2016]

A study of Carbon Credit Market in India (Gujarat)
A thesis submitted to Gujarat Technological University
for the Award of
Doctor of Philosophy
In
Management
By
Avani Nareshbhai Shah
[119997392004]
under supervision of
Dr. Narayan Baser
GUJARAT TECHNOLOGICAL UNIVERSITY
AHMEDABAD
[September – 2016]

© [Avani Nareshbhai Shah]

iv
DECLARATION
I declare that the thesis entitled “A study of Carbon Credit Market In India
(Gujarat)” submitted by me for the degree of Doctor of Philosophy is the record of
research work carried out by me during the period from September 2011 to September
2016 under the supervision of Dr. Narayan Baser and this has not formed the basis for
the award of any degree, diploma, associateship, fellowship, titles in this or any other
University or other institution of higher learning.
I further declare that the material obtained from other sources has been duly
acknowledged in the thesis. I shall be solely responsible for any plagiarism or other
irregularities, if noticed in the thesis.
Signature of the Research Scholar: ……………………… Date: ….………………
Name of Research Scholar: Avani Nareshbhai Shah
Place: Ahmedabad

v
CERTIFICATE
I certify that the work incorporated in the thesis “A study of Carbon Credit Market in
India (Gujarat)” submitted by Shri/ Smt. / Kumari Avani Nareshbhai Shah was
carried out by the candidate under my supervision/guidance. To the best of my
knowledge: (i) the candidate has not submitted the same research work to any
other institution for any degree/diploma, Associateship, Fellowship or other similar
titles (ii) the thesis submitted is a record of original research work done by the
Research Scholar during the period of study under my supervision, and (iii) the thesis
represents independent research work on the part of the Research Scholar.
Signature of Supervisor: ……………………………… Date: ………………
Name of Supervisor: Dr. Narayan Baser
Place: Ahmedabad

vi
Originality Report Certificate
It is certified that PhD Thesis titled “A study of Carbon Credit Market in India
(Gujarat)” by Avani Nareshbhai Shah has been examined by us. We undertake the
following:
a. Thesis has significant new work / knowledge as compared already published or are under
consideration to be published elsewhere. No sentence, equation, diagram, table, paragraph
or section has been copied verbatim from previous work unless it is placed under
quotation marks and duly referenced.
b. The work presented is original and own work of the author (i.e. there is no plagiarism).
No ideas, processes, results or words of others have been presented as Author own work.
c. There is no fabrication of data or results which have been compiled / analysed.
d. There is no falsification by manipulating research materials, equipment or processes, or
changing or omitting data or results such that the research is not accurately represented in
the research record.
e. The thesis has been checked using <Turnitin> (copy of originality report attached)
and found within limits as per GTU Plagiarism Policy and instructions issued from
time to time (i.e. Permitted similarity index <=25%).
Signature of the Research Scholar: …………………………… Date: ….………….
Name of Research Scholar: Avani Nareshbhai Shah
Place: Ahmedabad
Signature of Supervisor: ……………………………… Date: ………………
Name of Supervisor: Dr. Narayan Baser
Place: Ahmedabad

vii

viii
PHD THESIS Non-Exclusive License to
GUJARAT TECHNOLOGICAL UNIVERSITY
In consideration of being a PhD Research Scholar at GTU and in the interests of the
facilitation of research at GTU and elsewhere,
I, Avani Nareshbhai Shah having (Enrollment No.) 119997392004 hereby grant a non-
exclusive, royalty free and perpetual license to GTU on the following terms:
a) GTU is permitted to archive, reproduce and distribute my thesis, in whole or in part,
and/or my abstract, in whole or in part ( referred to collectively as the “Work”)
anywhere in the world, for non-commercial purposes, in all forms of media;
b) GTU is permitted to authorize, sub-lease, sub-contract or procure any of the acts
mentioned in paragraph (a);
c) GTU is authorized to submit the Work at any National / International Library, under
the authority of their “Thesis Non-Exclusive License”;
d) The Universal Copyright Notice (©) shall appear on all copies made under the
authority of this license;
e) I undertake to submit my thesis, through my University, to any Library and Archives.
Any abstract submitted with the thesis will be considered to form part of the thesis.
f) I represent that my thesis is my original work, does not infringe any rights of others,
including privacy rights, and that I have the right to make the grant conferred by this
non-exclusive license.
g) If third party copyrighted material was included in my thesis for which, under the terms
of the Copyright Act, written permission from the copyright owners is required, I have
obtained such permission from the copyright owners to do the acts mentioned in
paragraph (a) above for the full term of copyright protection.

ix
h) I retain copyright ownership and moral rights in my thesis, and may deal with the
copyright in my thesis, in any way consistent with rights granted by me to my University
in this non-exclusive license.
i) I further promise to inform any person to whom I may hereafter assign or license my
copyright in my thesis of the rights granted by me to my University in this non-
exclusive license.
j) I am aware of and agree to accept the conditions and regulations of PhD including all
policy matters related to authorship and plagiarism.
Signature of the Research Scholar: __________________________
Name of Research Scholar: Avani Nareshbhai Shah
Date: Place: Ahmedabad
Signature of Supervisor:
Name of Supervisor: Dr. Narayan Baser
Date: Place: Ahmedabad
Seal:
x
(briefly specify the modification suggested by the panel)
(The panel must give justifications for rejecting the research work)
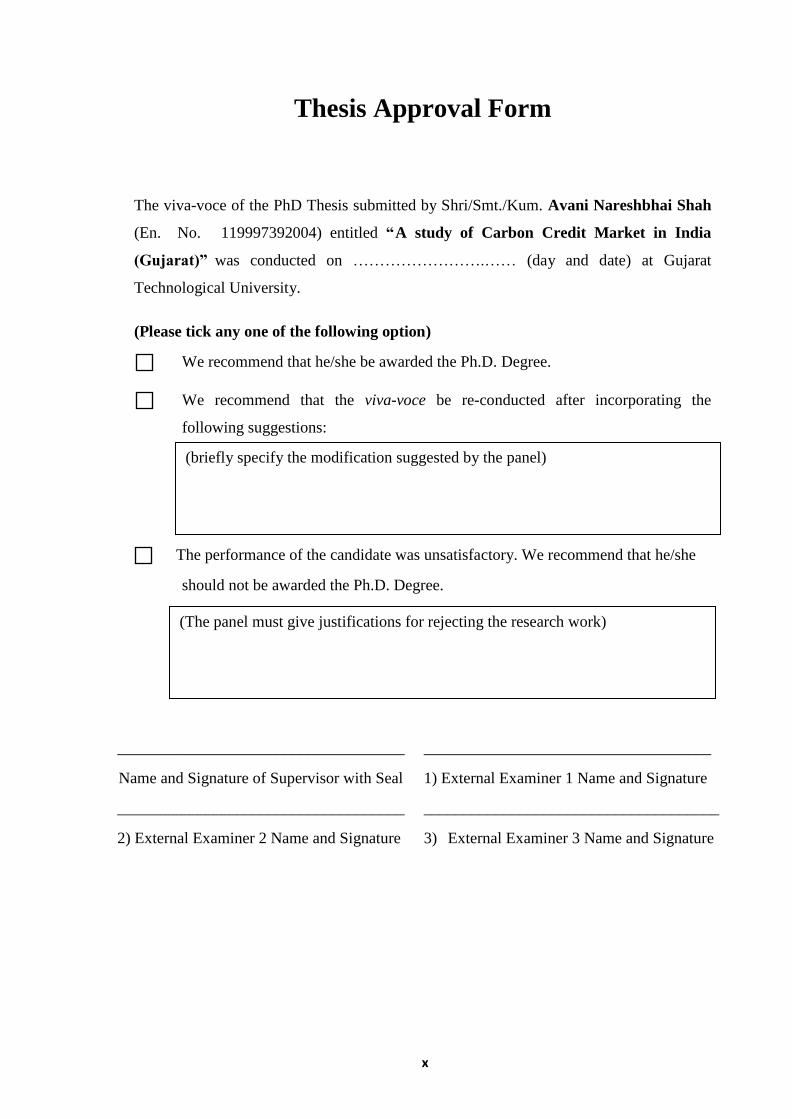
Thesis Approval Form
The viva-voce of the PhD Thesis submitted by Shri/Smt./Kum. Avani Nareshbhai Shah
(En. No. 119997392004) entitled “A study of Carbon Credit Market in India
(Gujarat)” was conducted on …………………….…… (day and date) at Gujarat
Technological University.
(Please tick any one of the following option)
We recommend that he/she be awarded the Ph.D. Degree.
We recommend that the viva-voce be re-conducted after incorporating the
following suggestions:
The performance of the candidate was unsatisfactory. We recommend that he/she
should not be awarded the Ph.D. Degree.
____________________________________
Name and Signature of Supervisor with Seal
____________________________________
1) External Examiner 1 Name and Signature
____________________________________
2) External Examiner 2 Name and Signature
_____________________________________
3) External Examiner 3 Name and Signature
xi
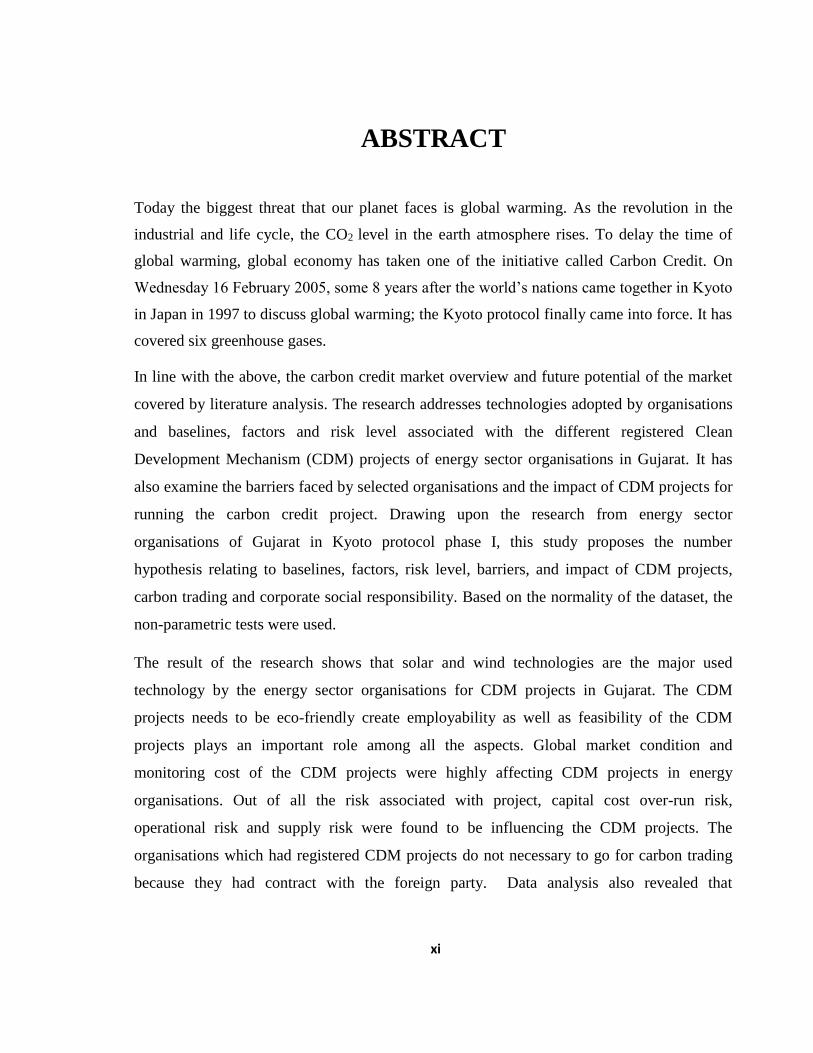
ABSTRACT
Today the biggest threat that our planet faces is global warming. As the revolution in the
industrial and life cycle, the CO2 level in the earth atmosphere rises. To delay the time of
global warming, global economy has taken one of the initiative called Carbon Credit. On
Wednesday 16 February 2005, some 8 years after the world’s nations came together in Kyoto
in Japan in 1997 to discuss global warming; the Kyoto protocol finally came into force. It has
covered six greenhouse gases.
In line with the above, the carbon credit market overview and future potential of the market
covered by literature analysis. The research addresses technologies adopted by organisations
and baselines, factors and risk level associated with the different registered Clean
Development Mechanism (CDM) projects of energy sector organisations in Gujarat. It has
also examine the barriers faced by selected organisations and the impact of CDM projects for
running the carbon credit project. Drawing upon the research from energy sector
organisations of Gujarat in Kyoto protocol phase I, this study proposes the number
hypothesis relating to baselines, factors, risk level, barriers, and impact of CDM projects,
carbon trading and corporate social responsibility. Based on the normality of the dataset, the
non-parametric tests were used.
The result of the research shows that solar and wind technologies are the major used
technology by the energy sector organisations for CDM projects in Gujarat. The CDM
projects needs to be eco-friendly create employability as well as feasibility of the CDM
projects plays an important role among all the aspects. Global market condition and
monitoring cost of the CDM projects were highly affecting CDM projects in energy
organisations. Out of all the risk associated with project, capital cost over-run risk,
operational risk and supply risk were found to be influencing the CDM projects. The
organisations which had registered CDM projects do not necessary to go for carbon trading
because they had contract with the foreign party. Data analysis also revealed that

xii
organisations which had gone for carbon trading mostly prefer forward contract because of
carbon pricing fluctuations.
The result of research shows that large scale CDM projects do not differ with reference to
organisation and project profile, except financial aspects, administration, operation and time
span of the project. The research contributes to the field by demonstrating different
parameters of CDM project focusing on energy sector of Gujarat. Finally, the research
identifies and recommends areas for future studies.
Key words: Global warming, Kyoto Protocol, CDM project and Energy sector
xiii
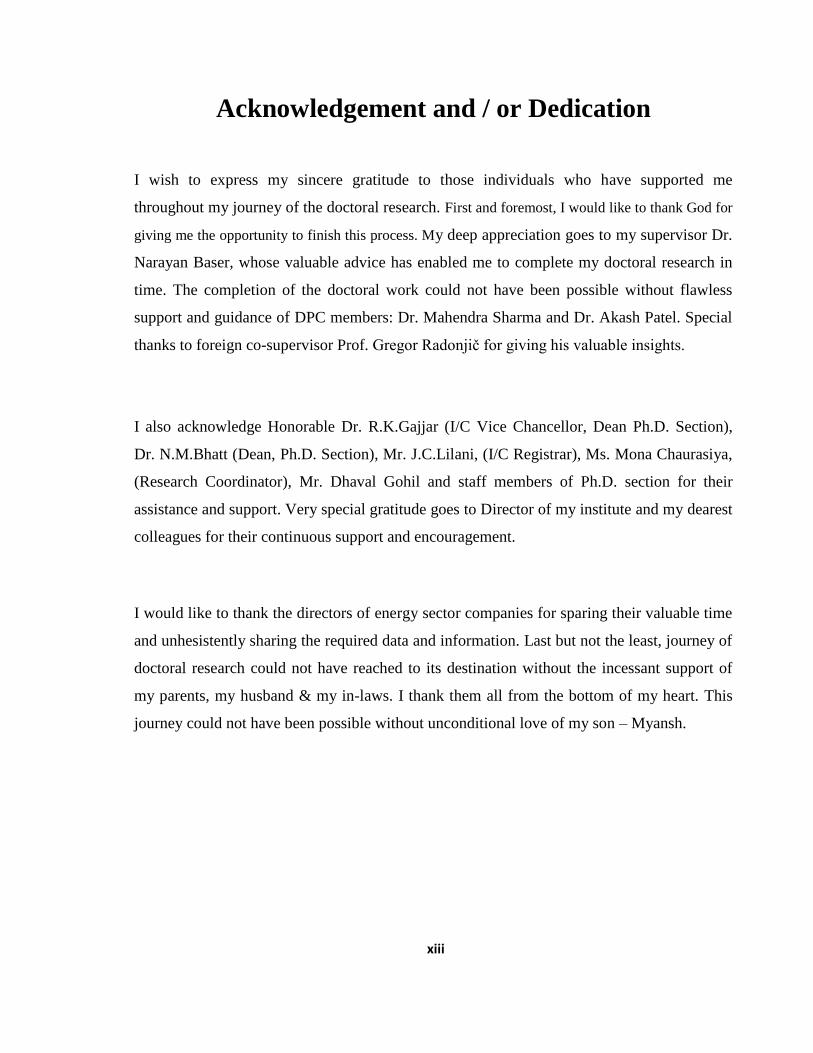
Acknowledgement and / or Dedication
I wish to express my sincere gratitude to those individuals who have supported me
throughout my journey of the doctoral research. First and foremost, I would like to thank God for
giving me the opportunity to finish this process. My deep appreciation goes to my supervisor Dr.
Narayan Baser, whose valuable advice has enabled me to complete my doctoral research in
time. The completion of the doctoral work could not have been possible without flawless
support and guidance of DPC members: Dr. Mahendra Sharma and Dr. Akash Patel. Special
thanks to foreign co-supervisor Prof. Gregor Radonjič for giving his valuable insights.
I also acknowledge Honorable Dr. R.K.Gajjar (I/C Vice Chancellor, Dean Ph.D. Section),
Dr. N.M.Bhatt (Dean, Ph.D. Section), Mr. J.C.Lilani, (I/C Registrar), Ms. Mona Chaurasiya,
(Research Coordinator), Mr. Dhaval Gohil and staff members of Ph.D. section for their
assistance and support. Very special gratitude goes to Director of my institute and my dearest
colleagues for their continuous support and encouragement.
I would like to thank the directors of energy sector companies for sparing their valuable time
and unhesistently sharing the required data and information. Last but not the least, journey of
doctoral research could not have reached to its destination without the incessant support of
my parents, my husband & my in-laws. I thank them all from the bottom of my heart. This
journey could not have been possible without unconditional love of my son – Myansh.

xiv
Table of Content
Sr. No Particular Page No.
Declaration iv
Certificate v
Originality Report Certificate vi
Non Exclusive License Certificate viii
Thesis Approval Form x
Abstract xi
Acknowledgement xiii
List of Abbreviations xviii
List of Figures xxi
List of Tables xxii
List of Appendices xxv
Key Terms xxvi
1 Introduction 1
1.1 General Introduction 1
1.2 Background of the Study 3
1.3 Rationale of the Study 3
1.4 Purpose of the Study 4
1.5 Significance of the Research 4
1.6 Structure of the Thesis 5
2 Introduction to Topic 7
2.1 Introduction 7
2.2 Background of the Global Climate Change 7
2.3 Kyoto Protocol 8

xv
2.4 Project Cycle of Clean Development Mechanism 11
2.5 Carbon Tax 12
2.6 Carbon Market Development in India 13
2.6.1 Guidelines for the Registration of CDM Project 24
2.6.2 Approval Procedure for Program of Activities 26
2.6.3 Procedure for Submitting CDM Project Reports to the National
CDM Authority 26
2.6.4 Governance of the CDM 28
2.6.5 The CDM Project Cycle 29
2.7 Clean Development Mechanism (CDM) in Gujarat 30
2.7.1 Functions of CDM Cell in Gujarat 32
2.8 Energy Sector in India 33
2.8.1 Sources of Renewable Energy 34
2.8.2 Market size 35
2.8.3 Future Potential of Energy Sector 37
3 Literature Review 39
3.1 Introduction 39
3.2 Global Warming and GHG Emissions 39
3.3 Kyoto Protocol and CDM 45
3.4 Legal Aspects of Carbon Emissions 49
3.5 Carbon Trading 52
3.6 Indian Market for Carbon Emissions 57
3.7 Carbon Credit Market in Gujarat 63
3.8 Future Aspects about Carbon Emissions 65
3.9 Summary of Literature Review 66
3.10 Research Gap 68
3.11 Conceptual Framework of Carbon Credit 68
4 Research Methodology 71

xvi
4.1 Introduction 71
4.2 Overview of the Study 71
4.3 Variables Defined 72
4.4 Objectives of the Study 73
4.5 Research Hypotheses 74
4.6 Scope of the Study 75
4.7 Research Design 75
4.8 Sampling Design 76
4.9 Data Collection 79
4.10 Statistical Tools Applied 79
4.11 Synopsis of the Organisation Studied 81
5 Data Analysis and Interpretation 82
5.1 Introduction 82
5.2 CDM Project Profile and Company Profile 82
5.3 Cross-Tabulation 94
5.4 Descriptive Analysis 96
5.5 Reliability Test 100
5.6 Hypothesis Testing 100
5.6.1 Kruskal-Wallis Test 100
5.6.2 Chi-Square Tests 112
5.6.3 Mann-Whitney U Test 117
5.7 Kyoto Protocol Phase II 138
6 Findings and Suggestions 145
6.1 Company Profile and CDM Project 146
6.2 Barriers Analysis of CDM Project 146
6.3 Factors Affecting CDM Project 147
6.4 Risk Involved in CDM Project 147
6.5 Aspects Considered for CDM Project 148

xvii
6.6 Impact of CDM Project 149
6.7 Carbon Trading 150
6.8 Corporate Social Responsibility 150
6.9 Suggestions 151
7 Conclusion and Scope for Future Research 152
7.1 Conclusion 152
7.2 Implications of the Study 153
7.3 Limitations and Direction for the Future Research 153
Bibliography 155
List of Paper Publications 162
Appendices 163

xviii
List of Abbreviation
BEE - Bureau of Energy Efficiency
CAGR - Compound annual growth rate
CCS - Carbon capture and storage
CDM - Clean Development Mechanism
CER - Certified Emission Reduction
CO2 - Carbon dioxide
CO2e - Carbon dioxide equivalent
COP - Conference of Parties
CSR - Corporate Social Responsibility
DCs - Designated Consumers
DNA - Designated National Authority
DOE - Designed Operational Entity
EB - Executive Board
ECX - European Climate Exchange
EPBT - Energy Payback Time
EPF – Energy Production Factor
ERUs - Emission Reduction Units
ET - Emissions Trading
EU - European Union
EU ETS - European Union Emissions Trading Scheme
FY - Financial Year
GATT - General Agreement on Tariffs and Trade
GDP - Gross Domestic Production
GFL – Gujarat Florochemical Ltd.

xix
GHGs - Green House Gases
GW - Giga Watt
HCA - Host Country Approval
ICAI - The Institute of Chartered Accountants of India
IET - International Emission Trading
IEX – Indian Energy Exchange
IISD – Indian Institute of Sustainable Development
IPCC- Intergovernmental Panel on Climate Change
JI - Joint Implementation
KP - Kyoto Protocol
kWh - Kilo Watt Hour
LCA - Life cycle analysis
LCCE – Life Cycle Conversion Efficiency
LUCF - Land-use change and forestry projects
MNRE - Ministry of New and Renewable Energy
MOP - Ministry of Power
MTOE - Million ton of oil equivalent
MW - Mega Watt
NCDEX - National Commodity and Derivatives Exchange Ltd
NCDMA - National CDM Authority
OECD - Organisation for Economic Co-operation and Development
ODA- Official Development Assistance
PAT - Perform, Achieve and Trade
PCN - Project Concept Note
PDD - Project Design Document
PoAs - Program of Activities
PV – Photovoltaic

xx
PXIL – Power Exchange India Ltd.
SEC – Specific Energy Consumption
TWh - Terawatt hours
UNCED - United Nations Conference on Environment and Development
UNFCCC - United Nations Framework Convention on Climate Change
WTO - World Trade Organization

xxi
List of Figures
Sr. No. Particular Page No.
1.1 Structure of Thesis 5
2.1 Kyoto Protocol Mechanisms 9
2.2 Approval Process of CDM Projects in India 27
2.3 Regulatory Institutional Structure 29
2.4 CDM Project Cycle 30
2.5 Electricity Production 36
2.6 Electricity Consumption 37
3.1 Conceptual Framework of Carbon Credit 70
4.1 Overview of the Study 71
5.1 Technology Adopted for CDM Project 83
5.2 Degree of Deployment of Corporate Social Responsibility 84
5.3 External Factors Affecting CDM Project 87
5.4 Internal Factors Affecting CDM Project 88
5.5 Barriers Faced by the Energy Sector Organisations 89
5.6 Sources of Finance 91
5.7 Modes Used for Carbon Trading 92

xxii
List of Tables
Sr. No. Particular Page
No.
2.1 Replacement and Technology 14
2.2 Total Carbon Emissions from the Consumption Of Energy 15
2.3 States Contribution to India Economy for Total CER up to 2012 31
2.4 Estimates of potential capacities from renewable energy sources 38
4.1 Variables Defined 73
4.2 CDM Projects and CER up to 2012 78
5.1 Time Span of the CDM Project 82
5.2 Technology Adopted for CDM Project 83
5.3 Deployment of Corporate Social Responsibility 83
5.4 Degree of Deployment of Corporate Social Responsibility 83
5.5 Aspects Considered for CDM Project 84
5.6 External Factors affecting CDM Project 87
5.7 Internal Factors affecting CDM Project 87
5.8 Barriers Faced by the Organisation for the CDM Project 88
5.9 Impact of CDM Project on Energy Sector Organisations 89
5.10 Risk Involve in CDM Project 90
5.11 Mode of Finance 91
5.12 Sources of Finance 91
5.13 Carbon Trading 92
5.14 Modes Used for Carbon Trading 92
5.15 Ownership Structure of Energy Organisations 93
5.16 Age of the Energy Organisations 93
5.17 Type of Organisation Based on Investment 93
5.18 Number of Registered CDM Projects 94
5.19 Technology and Ownership of Energy Organisations 94
5.20 Ownership of Energy Sector Organisations and Life of CDM
Projects
95
5.21 Ownership of Organisations and Type of Organisations based on
Investment
95
5.22 Ownership of Energy Organisations and Age of Energy
Organisations
95
5.23 Technology and Estimated CER p.a. 96
5.24 Aspects Considered for CDM Project 96
5.25 Risk Level Associated with the CDM Project 98

xxiii
5.26 Impact of CDM Project 99
5.27 Reliability Test 100
5.28 Mean Rank of External Factors and Time Span 100
5.29 Mean Rank of Internal Factors and Time Span 101
5.30 Kruskal-Wallis Test- Factors Affecting the CDM Project and Time
Span of the Project
101
5.31 Mean Rank of Barriers Affecting the CDM Project and Time Span 102
5.32 Kruskal-Wallis Test- Barriers Affecting the CDM Project and Time
Span of the Project
102
5.33 Kruskal-Wallis Test- Aspects Considered for the CDM Project
Among Age of the Energy Sector Organisations
103
5.34 Kruskal-Wallis Test- Aspects Considered for the CDM Project for
Different Classification of Organisation Based on Investment
104
5.35 Mean Rank of Barriers Faced by the Organisation among Different
Classification of Organisations Based on Investment
106
5.36 Kruskal-Wallis Test- Barriers Faced by the Organisation among
Different Classification of Organisations Based on Investment
106
5.37 Mean Rank of Barriers Faced by the Organisation and Number of
Employees
107
5.38 Kruskal-Wallis Test- Barriers Faced by the Organisation and
Number of Employees
107
5.39 Mean Rank of Carbon Trading among different Age Group of
Energy Organisations
108
5.40 Kruskal-Wallis Test- Carbon Trading and Age Group of Energy
Organisations
108
5.41 Mean Rank of Carbon Trading among Type of Organisation Based
on Investment
109
5.42 Kruskal-Wallis Test- Carbon Trading among Type of Organisation
Based on Investment
109
5.43 Kruskal-Wallis Test- Impact of CDM Project and Number of CDM
Projects
110
5.44 Kruskal-Wallis Test- Impact of CDM Project and Number of
Employees
111
5.45 Kruskal-Wallis Test- Impact of CDM Project and Age of Energy
Organisations
112
5.46 Chi-square Test- Time Span of the Project and Risk Associated with
the Registered CDM Project
113
5.47 Chi-square Test- Deployment of CSR and Age of the Energy
Organisations
114
5.48 Chi-square Test- Carbon Trading and Number of Registered CDM
Project
114
5.49 Chi-square Test- Carbon Trading and Estimated CER p.a. 115
xxiv
5.50 Chi-square Test- Carbon Trading and Ownership Structure of
Energy Sector Organisations
116
5.51 Chi-square Test- Estimated CER p.a. by Energy Sector Organisation
and Technology Adopted for CDM Project
116
5.52 Mann-Whitney U Test- Impact of CDM Projects and Ownership
Structure of Energy Organisations
117
5.53 Mann-Whitney U Test- Aspects Considered for CDM Project and
Ownership Structure of Energy Organisation
119
5.54 Mann-Whitney U Test-Barriers Faced by the Energy Organisations
and Ownership Structure of Organisations
120
5.55 Mann-Whitney U Test-Factors Affecting CDM Project and
Ownership Structure of Organisations
121
5.56 Mann-Whitney U Test- Risk Level Associated With Registered
CDM Projects and Ownership Structure of Energy Organisations
123
5.57 Mann-Whitney U Test- Deployment of CSR and Ownership
Structure of Organisations
125
5.58 Mann-Whitney U Test- Number of Registered CDM Projects and
Ownership Structure of Organisations
126
5.59 Mann-Whitney U Test- Impact of CDM Project and Technology 126
5.60 Mann-Whitney U Test- Aspects Considered for the CDM Project
and Technology
128
5.61 Mann-Whitney U Test- Barriers Faced by the Energy Organisations
and Technology
130
5.62 Mann-Whitney U Test- Factors Affecting CDM Projects and
Technology
131
5.63 Mann-Whitney U Test- Risk Associated With CDM Projects and
Technology
132
5.64 Mann-Whitney U Test- Deployment of CSR and Technology 134
5.65 Mann-Whitney U Test- Number of Registered CDM Projects and
Technology
135
5.66 Mann-Whitney U Test- Carbon Trading and Technology 136
5.67 Mann-Whitney U Test- Estimated CER p.a. and Ownership
Structure Of Energy Sector Organisations
136
5.68 Mann-Whitney U Test- Estimated CER p.a. and Carbon Trading 137

xxv
List of Appendices
Appendix A: [Questionnaire]
Appendix B: [List of Energy Sector Organisations]

xxvi
Key Terms
Kyoto Protocol: An international agreement that aims to reduce carbon dioxide emissions
and the presence of greenhouse gases. Countries that ratify the Kyoto Protocol are assigned
maximum carbon emission levels and can participate in carbon credit trading. It is an
agreement came into force on Wednesday 16 February 2005, some 8 years after the world’s
nations came together in Kyoto in Japan in 1997 to discuss global warming.
Certified Emission Reductions (CERs): CER is equal to one metric ton of Carbon dioxide
equivalent (CO2e).
Clean Development Mechanism (CDM): In CDM, a developed country can 'sponsor' a
greenhouse gas reduction project in a developing country. The developed country would be
given credits for meeting its emission reduction targets, while the developing country would
receive the capital investment and clean technology or beneficial change in land use.
Large scale CDM projects: The technology to be employed by the project activity is equal
and more than 15 MW considered to be large scale CDM project.
Carbon Credit: A permit that allows the holder to emit one ton of carbon dioxide.
Carbon Trade: An international agreement that aims to reduce carbon dioxide emissions
and the presence of greenhouse gases. Countries that ratify the Kyoto Protocol are assigned
maximum carbon emission levels and can participate in carbon credit trading.

Introduction
1
CHAPTER-1
Introduction
1.1 General Introduction
As per Kolk et al., 2009 climate change has evolved as the most persistent environmental
problem. Physical and biological systems are affected by changing ecosystems and causing
extinction of species due to temperature increase and would have a social impact and
adversely affect human health. As a result of the economic costs and risks of extreme weather,
climate change could have a severe impact on economic growth and development.
Consequently, climate change has effects on a company’s active in a wide variety of
sectors and countries. It cannot be ‘purely’ environmental issue because it is closely linked
to concerns about energy security due to dependence on fossil fuels and oil.
The electrical energy consumption is an important parameter which represents the economic
growth of the country. About two billion population of the world is reported to have no access
to the benefits of electrical energy. In India, about 360 million people are still deprived of
enjoying direct benefits of electrical power. Cost of generating new energy is three times the
cost of various measures of saving energy. According to a World Bank study (2009), India
can reduce its annual electricity usage by 183.5 billion Kilo Watt Hour (kWh) by investing 10
billion dollars in energy efficiency improvement measures. The installed capacity of India is
about 150 GW and the actual need is about 167 Giga Watt (GW). Thus there is a deficit of
about 17 GW at present. The power which is extracted from the renewable resources is about
15,695 Mega Watt (MW) (Ministry of New and Renewable Energy-MNRE report, 2009-10).

Introduction
2
To meet the energy requirement of the country, it is required to effectively manage available
resources. The conventional fuel resources have been found to be depleting very fast that
creates a need for some renewable form of energy which could add to the energy mix of India.
The climatic conditions, geographical landscape and the natural resources available in a
particular region affect the energy generated from renewable sources. A need has therefore
been felt to determine which renewable energy resources should be given priority so that a
strategic decision could be taken to help the policy makers and private entrepreneurs to
finance such projects. Thus it would be possible to derive the maximum benefit out of the
available renewable resources. The electrical energy consumption by the consumers is
directly dependent on the GDP of the country, average temperature of the country, cost of the
energy etc. The GHGs emissions which are produced as a result of power plants, transport
sector, industries etc. lead to increase of the global temperature over the last few decades.
This is causing much concern to a few countries like Maldives, Fiji and Bangladesh which are
likely to face grave consequences as a result of the global temperature rise as per the report of
Intergovernmental Panel on Climate Change (IPCC, 2007). In India, the major part of
electricity generation is based on coal which comprises about 66% of the total installed
capacity (IEA, 2006). Thus, the coal contributes a major portion of the GHGs emissions.
During 11th Five year plan, the renewable energy sector witnessed tremendous changes in the
policy to increase the contribution of solar energy in the energy mix of the country. During
the 11th plan period, there has been addition of 14660 MW taking the total installed renewable
energy to 24915 MW, with wind power contributing over 10000 MW. This clearly exhibits
how renewable energy contributes to energy mix in India. (MNRE, 2012-13).
Carbon emission reduction has been imposed on the developed countries under the Kyoto
protocol agreement. Some of the developed countries had reduced the GHGs emission while
other countries like USA is still not ready to agree with the conditions imposed by Kyoto
protocol. This can be one of the reasons for delay the mission of global emission reduction.
Developing nations with fast pace of economic growth like China, India, and Brazil etc. has
join this initiative called Kyoto protocol phase I. The agreement helps the developing counties
to implement renewable energy sources in both domestic and commercial sector. There has
been a visible impact of renewable energy in the Indian energy scenario during the last five
years. Apart from contributing about 12.96 per cent in the national electricity installed

Introduction
3
capacity, renewable energy based decentralized and distributed applications have benefited
millions of people in Indian villages by meeting their cooking, lighting and other energy
needs in an environment friendly manner. It has also resulted in social and economic benefits
such as cooking in smoky kitchens, minimization of the risks of contracting lung and eye
ailments, employment generation at village level, the improvement in the standard of living
and creation of opportunity for economic activities at village level. India has taken a voluntary
commitment of reducing emission intensity of its GDP by 20-25 per cent from 2005 levels by
2020. The increased share of renewable energy in the coming years will contribute towards
achieving this goal. India occupies the fifth position in the world with a wind power installed
capacity of 22.5 GW. During the year 1,333 MW wind power projects were commissioned.
(MNRE, 2014-15).
1.2 Background of the Study
The Kyoto protocol finally came into force in February 2005 and marked a shift from
negotiation to concrete action. According to the Protocol, Annex-I parties have the binding
quantified reduction commitments to reduce their greenhouse gases (GHGs) emissions by
5.2% below their 1990 level during the period 2008 to 2012 (IISD, 2009).
The study tries to understand the concept in detail and scenario in India with focus on Gujarat.
The focus of the study is to determine the different aspects considered by the organisation for
the Clean Development Mechanism (CDM) projects, factors and barriers faced by the energy
sector organisation, and the risk associated with the CDM projects. The study also covers in
detail the impact of CDM projects, carbon trading and corporate social responsibility.
Dependent variables mentioned earlier are further compared with independent parameters
such as technology used for the CDM projects, type of the organizations, turnover of the
organization, no of years serves in the industry. The research model further supports the
research phases.
1.3 Rationale of the Study
Carbon Credit is concept which has now become an opportunity for trading but the major
challenge in the global market is global warming. All countries have initiated efforts from

Introduction
4
their end to fight with global warming. Though carbon credit has been emerged as one of the
strategy to deal with the global warming, but the organisation which has implemented this
concept are very low in number. The Kyoto Protocol has its impact on micro as well as macro
level of the economy. Energy sector has registered highest number of projects that leads to
focus on the energy sector organizations. The study tries to focus on the large scale projects in
energy sector organisations in Gujarat for detailed analysis of different parameters.
1.4 Purpose of the Study
In Clean Development Mechanism (CDM), a developed country can 'sponsor' a greenhouse
gas reduction project in a developing country. The developed country would be given credits
for meeting its emission reduction targets, while the developing country would receive the
capital investment and clean technology or beneficial change in land use.
This study aims to have in-depth knowledge about the concept called Kyoto Protocol (KP).
The study examined the aspects considered for the Clean Development Mechanism (CDM)
projects, barriers as well as factors affecting CDM projects. On the other hand, the study also
focuses on the impact of CDM projects on organisation of energy sector of Gujarat. The past
literature has covered some of the aspects from the study on foreign organisations. Energy
sector (renewable/non-renewable sources) is considered to be highest registered CDM
projects (2219 number of projects) up to 2012.
Hence, this study aims to contribute to existing knowledge by testing the hypothetical
association between criteria of CDM projects among different classification of project as well
as organisations.
1.5 Significance of the Research
There are various challenges which affect the global market, prominent among them being
global warming. To meet the challenges of global warming, various methods were initiated,
one of them being Kyoto Protocol. The greenhouse gases market has shown valuable impact
on the global market. The researcher plants the roots for the greenhouse gases market in 90’s.
Finally it came into proper framework in 1997 named as Kyoto Protocol.

Introduction
5
Considering the importance of the subject the need is felt to undertake the research work
related to carbon credit with focus on the organisation who has already registered the projects.
The study has therefore focused on the following aspects:
Study the concept through existing literature.
Evaluating the CDM mechanisms in developing country like India as well as Gujarat.
Analyse the aspects considered by the energy sector organisation for CDM Projects.
Studying the factors as well as barriers affecting CDM projects in Gujarat.
Studying the impact of CDM projects on energy sector organisation, while the study
also covered the risk associated with CDM projects.
1.6 Structure of the Thesis
Figure 1.1: Structure of Thesis

Introduction
6
Chapter two provides the overview about the concept called carbon credit and energy industry
in India. The chapter covers the concept generation of carbon credit, legal framework with
respect to India and Gujarat. It also introduces some of the facts and figures about the energy
sector of the global as well as Indian market. CDM provides trading of greenhouse gases
reductions that is measured in terms of Certified Emission Reduction (CER) where each CER
is equal to one metric ton of Carbon dioxide equivalent (CO2e). So this chapter also
introduced the need of CER in energy industry in India.
Chapter three introduces the review of literature covering the global warming and GHGs
emission, Kyoto Protocol, and legal aspects of the concept. It also emphasised on the CER
Market in India and Gujarat.
Chapter four explores the debate over empirical studies concerning the topic investigated, in
order to find the research variables and develop the research model. Accordingly, this chapter
starts by presenting the conceptual framework developed, define variables and justify the
research hypotheses. The chapter explains and discusses methodological issues required for
conducting the research. It also covers different topics such as types of research paradigms
and designs, the research methods selected, sampling procedures, the data analysis technique
used and finally research plan for the primary data collection and its analysis.
Chapter five focuses on the data analysis of the samples that are energy sector organisations
who had registered their large scale CDM projects up to 2012 through questionnaire by
applying statistical tools.
Chapter six reviews and summarised the findings obtained from the data analysis.
Furthermore, this chapter also gives the broader overview of the findings from literature
review.
Chapter seven explores the study and provides the conclusion of the study, contribution of the
research as well as the direction for future research.

Introduction to Topic
7
CHAPTER-2
Introduction to Topic
2.1 Introduction
The chapter aims to explain the main concepts called “Carbon Credit”. This chapter spread
out in different sections covering global warming, Kyoto protocol, CDM framework in India
as well as Gujarat and Energy sector scenario. It also focused on CDM governance in India
and process of submitting CDM project under NCDMA. This chapter also covers the Energy
sector and its future potential.
2.2 Background of the Global Climate Change
One of the environmental threats our planet faces today is global warming. When carbon
dioxide is released into the atmosphere, it acts like the ceiling of a greenhouse, trapping solar
energy and retarding the escape of reflected heat. It is therefore a species—the most important
species—of a "Greenhouse Gas." Since the dawn of the industrial revolution in the mid-
eighteenth century, the concentration of CO2 in the Earth’s atmosphere has risen
approximately 30%. The rate of growth for CO2 emissions continues to increase, with the rate
much higher for the ten years of period 1995-2004 compared to the previous 24 years of
period 1970-1994 (IPCC 2007). Scientist estimates that as a result of global climate change,
the earth average temperature would increase up to six and one half degree Fahrenheit by
2100. All the nations needs to work together to prevent this sort of disruption of natural and
human systems on planet. To delay the cause of global climate change, a group of states, local
governments, and private organisations, aligned in a formal request under the clean air act to
regulate the emissions of the six main GHGs measured as the equivalent in carbon dioxide.

Introduction to Topic
8
The targets for the first commitment period of the Kyoto Protocol cover emissions of the six
main greenhouse gases, namely: Carbon dioxide (CO2); Methane (CH4); Nitrous oxide (N2O);
Hydro fluorocarbons (HFCs); Perfluorocarbons (PFCs); and Sulphur hexafluoride (SF6) Das
(2008).
Drawing on expert opinions across the globe, the IPCC concluded that "emissions resulting
from human activities are substantially increasing the atmospheric concentrations of
greenhouse gases which will enhance the greenhouse effect, resulting on average in an
additional warming of the Earth's surface." Pathak et al. (2009) emphasized on the scientific
consensus as global warming “one of the major environmental challenge”. There is a need to
develop GHGs mitigation strategies to reduce the adverse impacts of climate change. Biogas
technology provides an excellent opportunity for mitigation of GHGs and reducing global
warming through (1) replacing firewood for cooking, (2) replacing kerosene for lighting and
cooking, (3) replacing chemical fertilizers and (4) saving trees from deforestation. It creates
business opportunity to a growing global market in which industrial polluters in developed
countries that cross administered emission limits of GHGs fund clean technology projects in
developing countries. This mechanism helps to generate “carbon market,” the emission
reduction translated into currency called ‘carbon credits’ (Ball 2007). The notion of carbon
credits is rooted in the Kyoto protocol, which allows industrialized countries that agree to
carbon caps to meet their quotas in part by bankrolling emission reducing projects at sites
where the task will be less expensive.
2.3 Kyoto Protocol
On Wednesday 16 February 2005, some 8 years after the world’s nations came together in
Kyoto in Japan in 1997 to discuss global warming; the Kyoto protocol finally came into force.
As IISD (2009) described that during the Third Conference of Parties (COP) of UNFCCC
(which was agreed at the Earth Summit at Rio-de-Janeiro in 1992); the protocol has described
six greenhouse gas emissions. The implementation of concept got delayed for more than 7
years, because there were difficulties in obtaining the necessary number of ratification from
the countries, who accounted for 55% of carbon dioxide equivalent emissions of 1990 level.
As the initial stage, 141 countries of the world have ratified the protocol, although a few

Introduction to Topic
9
major GHGs emitting countries have not. India, along with most of the European Countries
and Many other developing counties, has ratified the protocol; although USA and Australia
have not (IISD, 2009).
Figure 2.1: Kyoto protocol mechanisms
(Source: www.unfccc.in)
The Kyoto Protocol has brought out three mechanisms for GHG emission abatement. They
are: (i) Joint Implementation (JI) (ii) Clean Development Mechanism (CDM) (iii)
International Emission Trading (IET). The CDM and JI are international crediting
mechanisms under the KP, which is an international agreement under the United Nations
Framework Convention on Climate Change (UNFCCC) to limit GHG emissions. The KP sets
binding GHG emissions targets for industrialized countries (known as ‘Annex B countries’),
amounting to an average of 5.2% compared with 1990 levels over the commitment period
2008-2012 (UNFCCC, 2011a).

Introduction to Topic
10
Joint Implementation (JI):
In Joint Implementation, a developed country with relatively high costs of domestic
greenhouse reduction would set up a project in another developed country. They produce
Emission Reduction Units (ERUs) just like CERs in CDM.
Clean Development Mechanism (CDM):
In Clean Development Mechanism (CDM), a developed country can 'sponsor' a greenhouse
gas reduction project in a developing country where the cost of greenhouse gas reduction
project activities is usually much lower, but the atmospheric effect is globally equivalent. The
developed country would be given credits for meeting its emission reduction targets, while the
developing country would receive the capital investment and clean technology or beneficial
change in land use.
International Emission Trading:
Here, the Annex I countries can trade in the international carbon credit market to cover their
shortfall in allowances. Countries with surplus credits can sell them to countries with capped
emission commitments under the Kyoto Protocol.
All these mechanisms are market-based. The first two are project based, wherein the third one
allows the developed countries to sell surplus emission of one country to another developed
country. CDM Projects are of importance to us amongst the rest as only Clean Development
Mechanism Projects are applicable to India and has potential opportunity for India in terms of
transfer of technology, investment, carbon trading, profits and most of all environmental
benefits (The Institute of Chartered Accountants of India- ICAI, 2009).
According to Poudyal et al., 2011, there are factors which lead to participation in green
projects including credibility and reputation, relationship with stakeholders, cost reduction,
operational effectiveness, and compliance with business and legal agreements. It has also
been argued that environmental performance indirectly generates higher revenue for
businesses through reduction of production costs, product differentiation ability, and market
access. These factors may motivate businesses to either adopt cleaner technology or to invest

Introduction to Topic
11
part of their profit in green projects such as environmental improvements, wildlife
conservation.
Carbon offsets exist as a new socio-ecological interface in the management of the
environment and economy. Offsets are tools to manage anthropogenic climate change and, in
some cases, contribute to international sustainable development; carbon dioxide is the most
common anthropogenic greenhouse gas (IPCC 2007). The calculation of ton of carbon
dioxide equivalent (i.e. tCO2e) arises from the need to develop a common benchmark of the
global warming potential of the six greenhouse gasses over a 100-year span by using the
global warming potential of 1 ton of carbon as a baseline indicator. In contrast to emissions
allowances that are allocated and either given away or auctioned by governments in cap and
trade systems, offsets employ specific technologies or forestry mechanisms to reduce
emissions in specific projects activities (Stavins, 2008).
The Protocol’s provisions have set the stage for the member states of the European Union to
address their commitments using a regional cap-and-trade system. By far the largest existing
active cap-and-trade program in the world is the European Union Emissions Trading Scheme
(EU ETS) for CO2 allowances, which has operated for the past couple of years. Although the
first phase, a pilot program from 2005 to 2007, permitted only trading in CO2, the second
phase, from 2008 to 2012, potentially broadens the program to include other GHGs. In its first
2 years of operation, the EU ETS has produced a functioning CO2 market, with spikes in
trading activity occurring along with major price changes. Apart from some problems with the
program design and early implementation, it would soon to provide a definitive assessment of
the system’s performance (Perdan et al. 2011).
2.4 Project Cycle of Clean Development Mechanism (CDM)
Sarkar (2010) has focused on the carbon credit development in India. The Clean Development
Mechanism (CDM) is one of the initiatives taken by developed countries to meet their GHGs
emission reduction commitments by investing in GHG mitigation projects in developing
countries under the head of UNFCCC. The CDM will serve as a symbiotic association
between the Annexure I and Non Annexure I country parties where both the countries
benefited from the association. Through this mechanism, developed nation derived the

Introduction to Topic
12
benefits from the association by achieving G HG emission abatement targets by implementing
projects in developing nations at a lower cost. The projects were implemented within national
boundaries; the developing country parties would be also benefited by receiving new
sustainable technologies and funding aids helping to achieve the objectives. The other benefits
to the developing country parties would be in terms of increased income, employment
generation, alleviation of the poor and improvement of ambient air quality and standards of
living.
CDM provides trading of greenhouse gases reductions that is measured in terms of Certified
Emission Reductions (CERs) where each CER is equal to one metric ton of Carbon dioxide
equivalent (CO2e). Trading of CERs can take place between those countries who have agreed
emissions reductions targets under UNFCCC (Annex-1 countries) and those who have not yet
agreed to emission reductions targets (Non Annex countries). Out of the 3 Kyoto mechanisms,
CDM is the only mechanism for the developing world which encourages cleaner development
in developing countries and brings infusion of investments and technologies in developing
countries. It provides an opportunity to adopt cleaner technologies and be paid for emission
reductions. CDM undergoes through a project cycle involving four stages (IISD, 2009) such
as:
Project Development
Validation and Registration
Project Monitoring
Verification, Certification and Issuance of Certified Emission Reductions (CERs)
2.5 Carbon Tax
Hetman (2009) describes the energy trade and WTO law dimensions. GATT and WTO
provide the underpinnings to the global trading system. Without those rules, the ordered
processes of international commerce, including trade in energy goods and services, would be
at risk. In the context of efforts aimed at reducing greenhouse gases (GHGs), including
measures implementing the UNFCCC, the Kyoto Protocol. The GATT/WTO trade law

Introduction to Topic
13
dimension is increasingly pertinent as proposals percolate to the surface involving use of
border taxes or adjustments of one sort or another to deal with GHG reductions, including
climate-change bills introduced in the US Congress.
2.6 Carbon Market Development in India
India signed the UNFCCC on 10 June 1992 and ratified it on 1 November 1993. Under the
UNFCCC, developing countries such as India do not have binding GHG mitigation
commitments in recognition of their small contribution to the greenhouse problem as well as
low financial and technical capacities. The ministry of environment and forest is the nodal
agency for climate change issues in India. It has constituted working Groups on the UNFCCC
and Kyoto Protocol. Looking at India’s CDM scenario in terms of corporate participation, Big
corporations such as Tata, Reliance, Ambuja, Birla, Bajaj, and many others, who ritually emit
millions of tons of carbon dioxide into the biosphere and earn handsome returns in the name
of ’clean development mechanism’. Ever since the unique mitigation strategy of carbon
trading was conceptualized in the Kyoto Protocol, India seems to have been one of the busiest
countries to put the concept into action (NFFPFW, 2011). By the end of 2012, India had 2784
CDM projects registered with the UNFCCC, taken together; the projects claim to reduce a
whopping 722,827,037 tons of CO2 equivalent in Kyoto protocol phase I (meaning that the
same amount of tradable CERs will be credited to the projects, if UNFCCC registers them
all). The projects will able to reduce about 1520 million tons of GHGs till 2020 (MNRE,
2009-10).
Power Exchange India Ltd (PXIL), Mumbai and Indian Energy Exchange (IEX) Delhi had on
March 30, 2011 opened First trading session for trading of Renewable Energy Certificates
(RECs). 532 RECs issued, 424 were sold successfully. Though there was sizable demand for
Solar RECs, no trade concluded on any of the exchanges, since none of the solar energy
projects has been accredited/ issued any solar REC, so far. The Ministry of Power (MOP),
Government of India, under the proposed “Perform, Achieve and Trade (PAT)” Scheme, has
developed a market based mechanism to drive delivery of additional energy savings on a cost
effective basis. Under proposed scheme MOP, has notified 563 Designated Consumers (DCs)
in eight industrial sectors viz. thermal power plants, fertilizers, cements, pulp and paper,

Introduction to Topic
14
textiles choir-alkali, iron and steel and aluminums. The DCs would be required to comply
with the energy conservation norms and prescribed standards as per the EC Act 2001. The
mechanism will further call for a setting up of baseline for individual targets for saving at
plant level and the issuance of Energy Saving Certificates (EScerts) which will be traded over
the counter as well in the energy exchanges. The energy efficiency improvements targets
would be unit specific i.e. each DC would be required to reduce its specific energy
consumption (SEC) by a fixed percentage, based on its baseline SEC. Bureau of Energy
Efficiency (BEE) is designated as the overall regulator and dispute resolution agency and
Energy Efficiency Service Ltd. (EESL) as the process manager in the entire mechanism. The
first cycle of PAT is started in April 2011 with the aim to cover aforesaid eight industrial
sectors to achieve higher energy efficiency in a span of three years. The subsequent PAT
cycle will include more sectors. PAT aims at increase in industrial energy efficiency by
bringing down energy consumption by 5%, amounting to an avoided capacity of over 5,600
MW over the three-year period. The ministers from Basic countries felt that the agreements
made during the earlier conference on climate change at Cancun, Mexico couldn't serve as a
substitute to the Bali Road Map and a number of issues particularly; issues of equity,
intellectual property rights and trade which were very important to countries were not
addressed (MNRE, 2009-10).
Table 2.1: Replacement and Technology
Year Annual reduction Cumulative reduction
Normal
replacement
Accelerated
replacement
Normal
replacement
Accelerated
replacement
2003 23 31 23 31
2004 24 34 47 65
2005 26 40 73 105
2006 29 44 102 149
2007 32 47 134 196
2008 35 50 169 246
2009 37 52 206 298
2010 41 54 247 351
2011 44 56 290 407
2012 47 58 337 465
2013 50 60 388 524
2014 54 62 442 586
2015 54 61 496 647
Introduction to Topic
15
2016 54 60 550 707
2017 54 59 603 765
2018 54 58 657 823
(Source: Bernstein et al., 2006)
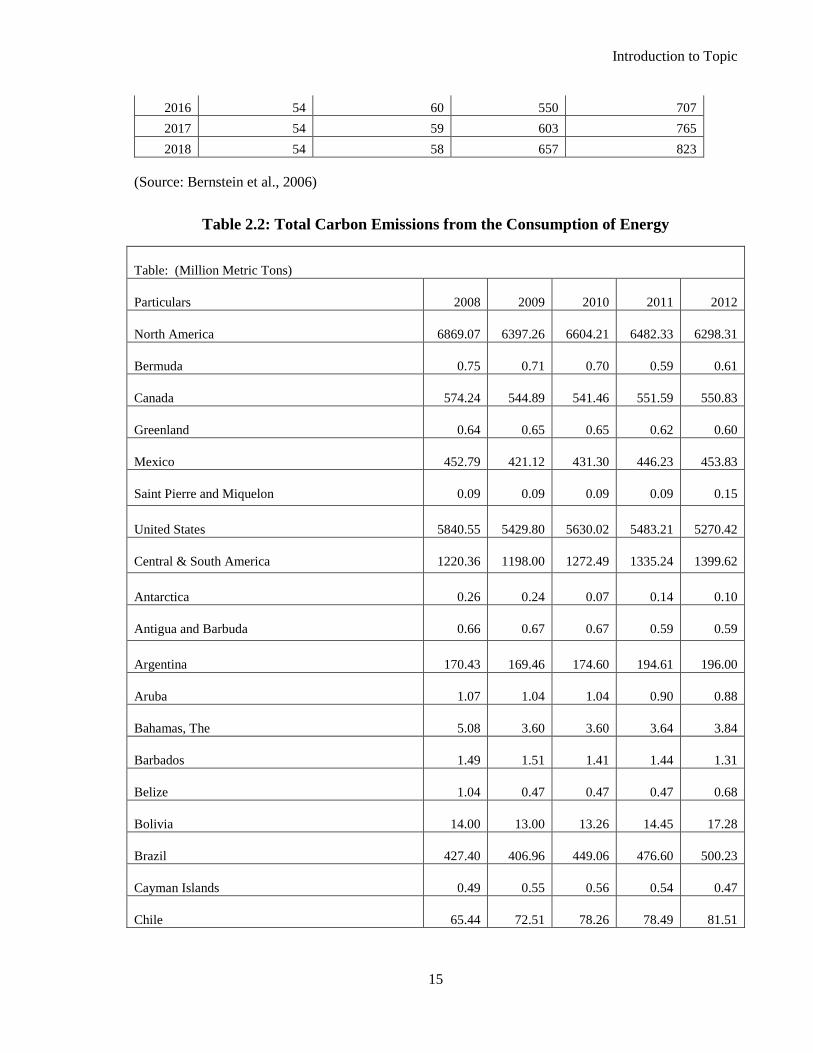
Table 2.2: Total Carbon Emissions from the Consumption of Energy
Table: (Million Metric Tons)
Particulars 2008 2009 2010 2011 2012
North America 6869.07 6397.26 6604.21 6482.33 6298.31
Bermuda 0.75 0.71 0.70 0.59 0.61
Canada 574.24 544.89 541.46 551.59 550.83
Greenland 0.64 0.65 0.65 0.62 0.60
Mexico 452.79 421.12 431.30 446.23 453.83
Saint Pierre and Miquelon 0.09 0.09 0.09 0.09 0.15
United States 5840.55 5429.80 5630.02 5483.21 5270.42
Central & South America 1220.36 1198.00 1272.49 1335.24 1399.62
Antarctica 0.26 0.24 0.07 0.14 0.10
Antigua and Barbuda 0.66 0.67 0.67 0.59 0.59
Argentina 170.43 169.46 174.60 194.61 196.00
Aruba 1.07 1.04 1.04 0.90 0.88
Bahamas, The 5.08 3.60 3.60 3.64 3.84
Barbados 1.49 1.51 1.41 1.44 1.31
Belize 1.04 0.47 0.47 0.47 0.68
Bolivia 14.00 13.00 13.26 14.45 17.28
Brazil 427.40 406.96 449.06 476.60 500.23
Cayman Islands 0.49 0.55 0.56 0.54 0.47
Chile 65.44 72.51 78.26 78.49 81.51

Introduction to Topic
16
Colombia 63.14 63.47 65.97 70.58 74.90
Costa Rica 7.13 6.93 7.02 6.67 7.29
Cuba 29.09 29.26 28.32 27.88 25.99
Dominica 0.13 0.13 0.13 0.14 0.13
Dominican Republic 19.32 18.13 18.59 20.70 20.80
Ecuador 27.12 30.41 32.70 34.73 37.23
El Salvador 5.93 5.93 5.92 6.35 6.37
Falkland Islands (Islas Malvinas) 0.05 0.05 0.05 0.05 0.05
French Guiana 1.06 0.82 0.99 1.07 1.04
Grenada 0.29 0.27 0.27 0.27 0.43
Guadeloupe 2.35 2.13 2.13 2.19 2.33
Guatemala 10.92 11.73 11.17 12.52 13.07
Guyana 1.52 1.64 1.63 1.68 1.66
Haiti 2.01 2.25 2.12 2.09 2.09
Honduras 7.91 7.21 7.54 8.03 10.33
Jamaica 12.55 9.29 9.18 9.62 12.75
Martinique 2.45 2.67 2.68 2.80 2.84
Montserrat 0.09 0.08 0.08 0.09 0.09
Netherlands Antilles 10.59 12.21 11.56 12.15 11.84
Nicaragua 4.50 4.49 4.46 4.82 5.29
Panama 14.98 15.87 17.50 17.18 16.23
Paraguay 3.83 4.09 4.44 3.99 3.87
Peru 36.29 37.05 42.29 42.22 53.58
Puerto Rico 34.37 28.99 32.35 26.76 26.81
Saint Kitts and Nevis 0.27 0.27 0.27 0.27 0.25
Saint Lucia 0.43 0.41 0.41 0.42 0.42

Introduction to Topic
17
Saint Vincent/Grenadines 0.23 0.20 0.20 0.20 0.27
Suriname 1.95 2.05 2.01 2.19 2.27
Trinidad and Tobago 49.56 47.83 52.30 52.17 51.27
Turks and Caicos Islands 0.08 0.17 0.17 0.16 0.16
Uruguay 8.00 9.06 8.47 8.37 7.59
Venezuela 161.79 157.56 160.91 171.12 184.79
Virgin Islands, U.S. 12.93 15.21 15.56 13.75 12.41
Virgin Islands, British 0.12 0.11 0.11 0.12 0.16
Europe 4581.15 4279.52 4375.66 4348.06 4263.26
Albania 4.37 2.82 3.80 4.08 3.96
Austria 69.99 65.26 70.06 69.34 66.68
Belgium 153.53 134.71 137.19 140.13 139.14
Bosnia and Herzegovina 21.06 21.58 21.95 27.51 26.00
Bulgaria 50.61 44.74 48.02 52.56 48.85
Croatia 21.74 20.05 19.27 17.83 20.18
Cyprus 9.82 9.23 8.90 8.73 8.80
Czech Republic 99.10 92.10 94.69 94.35 91.15
Denmark 51.91 48.83 49.55 45.31 40.51
Faroe Islands 0.70 0.72 0.73 0.77 0.75
Finland 53.62 50.94 57.83 51.61 46.81
France 421.56 386.37 385.73 374.32 364.54
Germany 812.61 758.18 801.36 784.38 788.32
Gibraltar 4.55 4.86 4.95 4.75 3.95
Greece 106.04 99.83 92.87 92.08 87.56
Hungary 56.01 51.90 52.16 52.17 47.90
Iceland 3.72 3.32 3.27 3.59 3.50

Introduction to Topic
18
Ireland 44.87 38.92 39.47 36.21 35.49
Italy 449.75 407.63 416.82 411.56 385.81
Kosovo 6.29 7.23 7.78 7.56 7.58
Luxembourg 11.96 11.44 12.16 11.63 11.69
Macedonia 8.98 8.41 7.97 8.69 8.08
Malta 3.18 6.68 8.00 7.52 6.56
Montenegro 2.16 1.55 2.22 16.91 19.72
Netherlands 229.53 222.93 233.48 239.74 239.61
Norway 40.03 44.72 44.81 41.65 41.06
Poland 294.70 286.47 304.72 308.10 289.45
Portugal 56.14 57.10 53.81 53.16 51.20
Romania 93.88 81.17 78.29 89.48 86.06
Serbia 51.57 49.73 49.86 43.88 41.38
Slovakia 38.30 35.18 36.84 35.04 32.08
Slovenia 17.42 16.11 15.94 15.99 15.87
Spain 354.70 327.80 312.40 318.23 312.44
Sweden 54.71 51.84 58.52 54.04 51.08
Switzerland 45.26 43.90 41.99 41.92 42.97
Turkey 272.90 269.06 269.37 294.91 296.93
United Kingdom 563.87 516.19 528.89 488.31 498.88
Eurasia 2534.58 2211.98 2437.91 2551.37 2671.98
Armenia 11.08 10.01 10.50 11.50 12.12
Azerbaijan 43.18 34.09 32.47 32.23 35.14
Belarus 66.95 61.12 64.36 67.73 67.13
Estonia 6.32 5.22 4.96 5.53 5.69
Georgia 5.79 6.53 6.40 5.90 6.26

Introduction to Topic
19
Kazakhstan 196.67 172.83 183.58 206.86 224.22
Kyrgyzstan 5.84 8.30 8.40 8.66 9.28
Latvia 8.03 7.92 7.83 8.05 7.90
Lithuania 18.12 13.39 14.24 15.19 16.69
Moldova 7.32 6.62 6.70 6.63 9.41
Russia 1629.09 1479.04 1661.51 1710.03 1781.72
Tajikistan 6.87 2.43 2.65 2.96 2.97
Turkmenistan 59.81 51.80 52.79 54.87 64.98
Ukraine 342.40 245.53 274.97 298.14 290.38
Uzbekistan 127.12 107.15 106.56 117.09 123.17
Middle East 1630.85 1740.68 1807.43 1959.43 2035.65
Bahrain 29.91 30.21 30.59 30.25 32.20
Iran 512.05 562.58 564.30 594.46 603.59
Iraq 104.17 112.59 113.54 119.95 130.74
Israel 68.74 66.91 71.92 74.37 80.36
Jordan 19.30 19.63 20.66 18.15 16.86
Kuwait 78.10 82.24 90.10 100.46 105.68
Lebanon 14.65 19.85 18.89 20.63 16.44
Oman 43.75 46.04 52.73 53.68 62.85
Palestinian Territories 3.01 2.04 2.04 2.59 3.01
Qatar 63.50 68.41 69.77 81.48 99.17
Saudi Arabia 421.64 437.69 468.73 551.39 582.67
Syria 54.41 61.63 65.52 63.19 50.92
United Arab Emirates 193.94 208.79 217.65 228.67 234.06
Yemen 23.69 22.09 20.98 20.15 21.28
Africa 1152.38 1145.85 1156.73 1168.66 1205.70

Introduction to Topic
20
Algeria 106.92 113.99 112.71 122.13 133.92
Angola 23.08 24.47 26.59 29.76 31.61
Benin 3.36 4.51 5.06 5.21 4.58
Botswana 4.34 4.32 5.05 4.67 3.92
Burkina Faso 1.38 1.70 1.73 1.68 1.41
Burundi 0.36 0.20 0.20 0.19 0.32
Cameroon 7.54 8.31 8.55 8.06 6.22
Cape Verde 0.32 0.38 0.38 0.39 0.39
Central African Republic 0.34 0.34 0.34 0.34 0.44
Chad 0.26 0.25 0.25 0.26 0.26
Comoros 0.12 0.15 0.13 0.15 0.16
Congo (Brazzaville) 5.96 6.46 6.79 6.84 6.69
Congo (Kinshasa) 2.73 2.63 3.17 2.83 2.48
Cote divoire (IvoryCoast) 6.39 6.52 6.62 6.80 6.40
Djibouti 1.71 1.16 1.16 1.39 1.80
Egypt 181.29 185.02 191.39 199.42 206.29
Equatorial Guinea 4.68 5.41 5.48 5.12 5.61
Eritrea 0.73 0.51 0.51 0.47 0.74
Ethiopia 6.42 6.98 6.45 7.13 8.21
Gabon 4.67 4.26 4.54 5.35 5.44
Gambia, The 0.38 0.44 0.48 0.43 0.47
Ghana 7.39 7.49 9.11 9.25 9.10
Guinea 1.35 1.43 1.43 1.43 1.39
Guinea-Bissau 0.46 0.41 0.41 0.42 0.46
Kenya 11.20 11.75 12.70 13.14 13.45
Lesotho 0.24 0.23 0.55 0.45 0.27

Introduction to Topic
21
Liberia 0.69 0.55 0.54 0.59 0.54
Libya 56.78 58.00 62.11 40.68 54.60
Madagascar 2.81 1.86 1.88 1.84 2.89
Malawi 1.19 0.96 0.97 0.99 1.91
Mali 0.70 0.70 0.70 0.74 0.77
Mauritania 2.76 1.89 1.89 1.61 2.41
Mauritius 5.04 4.48 4.70 4.87 5.32
Morocco 37.25 41.99 43.53 42.92 39.35
Mozambique 2.38 2.54 2.55 3.55 4.79
Namibia 3.30 3.30 3.13 3.26 3.72
Niger 1.29 1.21 1.32 1.31 1.41
Nigeria 99.16 78.96 73.76 83.13 86.40
Reunion 2.82 2.94 2.94 2.84 2.77
Rwanda 0.72 0.76 0.76 0.80 0.77
Saint Helena 0.01 0.01 0.01 0.02 0.01
Sao Tome and Principe 0.14 0.13 0.13 0.14 0.14
Senegal 6.08 5.89 5.95 6.22 7.14
Seychelles 1.03 1.17 0.98 1.24 1.30
Sierra Leone 1.26 1.40 1.40 1.44 1.31
Somalia 0.87 0.81 0.81 0.76 0.86
South Africa 489.97 477.56 473.77 471.52 473.16
Sudan and South Sudan 12.10 18.13 18.57 19.40 13.94
Swaziland 1.03 0.98 0.98 0.97 0.94
Tanzania 6.01 6.57 6.30 7.11 9.30
Togo 2.74 1.33 1.41 1.45 1.63
Tunisia 18.27 18.79 19.16 20.12 20.27

Introduction to Topic
22
Uganda 1.97 3.28 3.39 3.40 2.55
Western Sahara 0.31 0.27 0.27 0.27 0.32
Zambia 2.25 1.95 2.19 2.57 3.05
Zimbabwe 7.81 8.10 8.82 9.56 10.12
Asia & Oceania 11656.21 12462.34 13405.03 14309.90 14435.77
Afghanistan 1.59 6.41 7.16 8.03 8.55
American Samoa 0.66 0.60 0.28 0.45 0.61
Australia 429.61 434.76 422.67 426.46 420.63
Bangladesh 51.40 55.94 57.84 59.21 63.50
Bhutan 0.28 0.33 0.35 0.36 0.32
Brunei 10.62 7.27 8.36 8.71 8.68
Burma (Myanmar) 14.84 11.90 11.91 12.41 13.34
Cambodia 4.18 4.08 4.10 4.61 6.05
China 6166.57 6816.10 7446.52 8126.69 8106.43
Cook Islands 0.09 0.07 0.07 0.07 0.15
Fiji 2.34 1.36 1.33 1.37 1.54
French Polynesia 0.99 1.06 1.10 1.07 1.07
Guam 1.77 1.07 0.91 2.03 1.77
Hong Kong 78.88 89.56 91.87 94.30 88.63
India 1448.99 1642.93 1714.73 1752.68 1830.94
Indonesia 370.19 405.70 414.55 450.08 456.21
Japan 1216.25 1104.91 1180.58 1200.27 1259.06
Kiribati 0.04 0.06 0.06 0.06 0.06
Korea, North 69.20 66.26 63.98 66.56 67.00
Korea, South 521.77 524.44 581.02 650.45 657.09
Laos 1.42 1.45 1.52 1.53 1.62

Introduction to Topic
23
Macau 2.39 1.80 1.52 1.63 1.69
Malaysia 171.32 175.33 190.28 195.70 198.79
Maldives 0.89 1.06 1.06 1.07 1.12
Mongolia 7.19 7.67 8.22 8.39 11.36
Nauru 0.19 0.18 0.18 0.17 0.17
Nepal 2.95 3.28 3.54 3.76 3.64
New Caledonia 2.95 2.95 3.07 3.18 3.07
New Zealand 40.73 37.42 37.23 37.66 37.89
Niue 0.01 0.00 0.00 0.00 0.00
Pakistan 136.31 138.83 139.90 141.97 146.89
Papua New Guinea 4.55 3.23 3.28 3.38 3.38
Philippines 74.42 69.36 78.08 83.27 83.95
Samoa 0.18 0.17 0.17 0.16 0.16
Singapore 155.24 192.38 228.62 205.44 207.96
Solomon Islands 0.23 0.19 0.21 0.22 0.27
Sri Lanka 12.44 12.88 11.80 14.43 15.23
Taiwan 290.38 259.56 286.90 311.34 307.15
Thailand 255.09 267.88 273.09 293.36 290.72
Timor-Leste (East Timor) 0.35 0.19 0.19 0.33 0.50
Tonga 0.20 0.19 0.19 0.18 0.19
U.S. Pacific Islands 0.29 0.30 0.35 0.30 0.29
Vanuatu 0.12 0.12 0.12 0.15 0.17
Vietnam 104.75 109.81 124.82 135.09 131.73
Wake Island 1.34 1.27 1.29 1.33 1.29
World 29644.60 29435.62 31059.46 32154.99 32310.29
(Source: Total Carbon Dioxide Emissions from the Consumption of Energy, retrieved from
http://www.eia.gov/cfapps/ipdbproject/iedindex3.cfm?tid=90&pid=44&aid=8 accessed on May 20, 2012)

Introduction to Topic
24
2.6.1 Guidelines for the registration of CDM project (Approval Process retrieved from
http://www.cdmindia.gov.in/approval_process.php assessed on May 15, 2012.)
As the National CDM Authority of India (NCDMA) has clearly describes the guidelines for
registration of CDM projects. The following parameters have been covered by the authority:
Purpose
The purpose of the CDM is defined in Article 12 of the Kyoto Protocol to the UNFCCC. The
CDM has a two-fold purpose: (a) to assist developing country parties in achieving sustainable
development, thereby contributing to the objective of the convention, and (b) to assist
developed country parties in achieving compliance with part of their quantified emission
limitation and reduction commitments under Article 3.
Eligibility
The project proposal should establish the following in order to qualify for consideration as
CDM project activity:
Additionality:
Emission Additionality: The project should lead to real, measurable and long term
GHG mitigation. The additional GHG reductions are to be calculated with reference to a
baseline.
Financial Additionality: The procurement of Certified Emission Reduction (CERs)
should not be from Official Development Assistance (ODA).
Sustainable Development Indicators
It is the prerogative of the host party to confirm whether a Clean Development Mechanism
project activity assists it in achieving sustainable development. The CDM projects should also
be oriented towards improving the quality of life of the poor from the environmental
standpoint.

Introduction to Topic
25
Following aspects should be considered while designing CDM project activity:
Social well-being: The CDM project activity should lead to alleviation of poverty by
generating additional employment, removal of social disparities and contribution to
provision of basic amenities to people leading to improvement in quality of life of
people.
Economic well-being: The CDM project activity should bring in additional investment
consistent with the needs of the people.
Environmental well-being: This should include a discussion of impact of the project
activity on resource sustainability and resource degradation, if any, due to proposed
activity; bio-diversity friendliness; impact on human health; reduction of levels of
pollution in general;
Technological well-being: The CDM project activity should lead to transfer of
environmentally safe and sound technologies that are comparable to best practices in
order to assist in up gradation of the technological base. The transfer of technology
can be within the country as well from other developing countries also.
Baselines for CDM project
The project proposal must clearly and transparently describe methodology of determination of
baseline. It should confirm to following:
Baselines should be precise, transparent, comparable and workable;
Should avoid overestimation;
The methodology for determination of baseline should be homogeneous and
reliable;
Potential errors should be indicated;
System boundaries of baselines should be established;

Introduction to Topic
26
Interval between updates of baselines should be clearly described;
Role of externalities should be brought out (social, economic and environmental);
Should include historic emission data-sets wherever available;
Lifetime of project cycle should be clearly mentioned;
The project proponent could develop a new methodology for its project activity or could use
one of the approved methodologies by the CDM Executive Board. For small scale CDM
projects, the simplified procedures can be used by the project proponent. The project proposal
should indicate the formulae used for calculating GHG offsets in the project and baseline
scenario. Leakage, if any, within or outside the project boundary, should be clearly described.
Determination of alternative project, which would have come up in absence of proposed
CDM project activity should also be described in the project proposal.
2.6.2 Approval procedure for program of activities (PoAs)
The Coordinator/ Managing Entity of a PoA is required to submit the PoA-DD, CPA-DD,
CPA-DD (Typical) & PCN to the National CDM Authority for HCA. CPAs (joining a PoA)
that do not require any approval from any state /central agency e.g. replacement of bulbs,
energy efficiency measures etc., the Coordinator/ Managing Entity of the PoA shall post facto
inform the Member Secretary, NCDMA , the salient details of CPAs added on a bi-annual
basis. However for CPAs that needs any state / central clearance, such CPAs shall be
submitted to the National CDM Authority for approval as in the case of project based CDM
activities.
2.6.3 Procedure for submitting CDM project reports to the national CDM authority
The National CDM Authority (NCDMA) is a single window clearance for CDM projects in
the country. The project proponents are required to apply to the administrator of National
CDM Authority through the website by filling the User Registration form. Upon acceptance
of the request, the project proponent shall fill in online the Project Concept Note (PCN) and
also upload the Project Design Document (PDD). During the initial period, up to September

Introduction to Topic
27
2009 , or as notified by National CDM Authority, the project proponents shall also submit 15
hard copies of PCN and PDD in proper format to Member Secretary, NCDMA along with soft
copies in CDs, though covering letter signed by the project proponent. The National CDM
Authority examines the documents and if there are any preliminary queries the same are asked
from the project proponents. The project proposals are then put up for consideration by the
National CDM Authority. The project proponent and his consultants are normally given about
10-15 days’ notice to come to the Authority meeting and give a brief power point presentation
regarding their CDM project proposals. Members seek clarifications during the presentation
and in case the members feel that some additional clarifications or information is required
from the project proponent, the same is informed to the presenter. Once the members of
Authority are satisfied, the Host Country Approval (HCA) is issued by the Member-Secretary
of the National CDM Authority.
Figure 2.2: Approval process of CDM project in India
(Source: IISD, 2009)

Introduction to Topic
28
2.6.4 Governance of the CDM
The CDM is a governed mechanism that embraces a wide range of stakeholders. It transcends
levels of national and areas of governmental decision making. The following data focuses on
the CDM’s regulatory framework, which comprises its institutional roles and functions and
the project cycle process.
CDM Institutions
The CMP acts as the supreme body of the Kyoto Protocol with the Executive Board (EB)
being the main centralized regulatory body. The CMP decides on the broader policy
framework and the strategic development of the CDM and it is the EB that translates these to
the project level. When implementing the CMP’s decisions, the EB engages in subsidiary law-
making; both through direct rule-making and by its decisions as an adjudicator (Streak, 2007).
In essence the EB takes decisions on methodologies and projects, mandates reviews and is
assisted in these tasks by its support structure: The Designed Operational Entity (DOEs) that
serve as the validators and verifiers of projects and emission reductions and the DNAs that
exercise their support functions at a decentralised level. The credibility of the CDM
governance therefore depends on the integrity and robustness of this regulatory framework
and assesses in the following sections.

Introduction to Topic
29
Figure 2.3: Regulatory institutional structure
(Source: Regulatory Institutional structure adopted from UNCTAD CDM guide document retrieved from
http://www.unctad.org/en/docs/cdm2009_en.pdf assessed on June 1,2012)
2.6.5 The CDM project cycle
Figure 2.4 explains the CDM project cycle. The basic operational principle of the CDM is the
crediting of greenhouse gas (GHG) emissions reductions generated by project activities
implemented in developing countries. The figure shows a step-by-step process from
preparation of the project design document (PDD) to issuance of Certified Emissions
Reduction credits (CERs) indicating the decision making bodies at each stage. The validation
of PDDs by DOEs is one of the most crucial steps in the governance of the CDM, hence the
importance of clear validation standards, procedures and guidelines, and strict principles for
the accreditation of DOEs. Other AEA 9 phases from approval to issuance of CERs are also
areas that are affected by the governance of the EB. We will focus on all aspects of the project
cycle in the following sections.

Introduction to Topic
30
Figure 2.4: CDM project cycle
(Source: CDM Project Cycle adopted from UNCTAD CDM guide document retrieved from
http://www.unctad.org/en/docs/cdm2009_en.pdf assessed on June 1,2012 )
2.7 Clean Development Mechanism (CDM) in Gujarat
Gujarat is the first state in India to sign such a MoU with the World Bank. Under this
agreement, Gujarat has launched a campaign to reduce carbon emissions from the state.
Emissions from industries and steps like safe handling of solid wastes were also taken under
this campaign. In return, the World Bank will provide financial incentives to the state.
Emissions from industries and steps like safe handling of solid wastes will also be taken under
this campaign. However, the new trend is going to trigger another trade in the enterprising
state of Gujarat. Till now carbon credit trade was limited to a very few industries in the state.
With the government's plan to launch a campaign for carbon emission control, this trade is
bound to get a boost now (vibrant Gujarat, 2013).

Introduction to Topic
31
India is the leading country in the world with the second rank in carbon emission reduction
earning after China. China accounted for more than 55% of total CER issued under UNFCCC,
where as 15% of total CER issued are of India. Gujarat is the first state in the country
accounted Rs.127, 021,481 CER issued till 2012 that 18% of the total CER in India. There is
still huge potential for the development of the project in exploring CDM potentialities through
future planning and documentation.
Table 2.3: States contribution to India economy for total CER up to 2012
Name of States/Country No of Projects CER up to 2012
% of contribution to
Total CER
Multi State 84 1,323,143 0.18
Andhra Pradesh 206 86,823,972 12.01
Arunachal Pradesh 1 156,393 0.02
Assam 13 852,579 0.12
Bhutan 1 529,914 0.07
Bihar 8 750,896 0.10
Chhattisgarh 104 27,368,203 3.79
Delhi 16 3,823,996 0.53
Goa 4 1,186,500 0.16
Gujarat 351 127,021,481 17.57
Haryana 35 4,512,243 0.62
Himachal Pradesh 91 17,273,314 2.39
J&K 4 9,686,384 1.34
Jammu & Kashmir 2 128,326 0.02
Jharkhand 32 24,046,731 3.33
Karnataka 250 69,697,979 9.64
Kerala 16 642,032 0.09
Madhya Pradesh 70 8,787,799 1.22

Introduction to Topic
32
Maharashtra 367 61,620,089 8.52
Meghalaya 4 1,598,429 0.22
Multi State 97 25,330,436 3.50
Orissa 79 22,794,520 3.15
Pondicherry 1 139,332 0.02
Pondicherry 2 14,674 0.00
Punjab 74 12,157,425 1.68
Rajasthan 218 63,178,620 8.74
Sikkim 10 9,973,169 1.38
Tamil Nadu 355 51,882,998 7.18
Tripura 1 4,427,526 0.61
Uttaranchal 36 19,454,380 2.69
Uttar Pradesh 163 37,813,167 5.23
Uttarakhand 13 1,030,493 0.14
West Bengal 76 26,799,892 3.71
Total 2784 722,827,037 100.00
No of Projects : 2784 CER up to 2012 : 722827037 tonnes
(Source: Sate wise Approved Projects retrieved from http://www.cdmindia.gov.in/reports_new.php
assed on Feb. 28, 2013.)
2.7.1 Functions of CDM cell in Gujarat
CDM cell works in various areas to get maximum benefit for Government Projects for getting
more revenue in terms of CERs from various projects.
Capacity Building: The cell shall work in developing technical capacity in Governmental
organizations regarding taking benefit of CDM Scheme of UNFCCC in development
projects.

Introduction to Topic
33
Facilitation Centre: The cell work in facilitation of all Government projects, and single
coordination point from government shall help in speed up of process.
Technical Advice: The cell can bring the most knowledgeable and skilled experts for CDM
for handling all projects and can provide 360 degree technical solution for the project
including development of methodology, Project Design Document (PDD) etc. The cell also
keeps some consultants on panel for their constant expert advice.
Administration: The cell can manage all statutory administration for projects like project
registration with National Authority, UNFCCC Office etc.
Nodal Agency for the State: The cell can be a fulltime body of State Government for all
CDM related activities including providing necessary support to private CDM projects from
state.
Bundling of similar CDM projects at state level can be carried out in coordination of the cell.
Thus the CDM cell becomes a common platform for all the State Government Organizations.
2.8 Energy Sector in India
Power or electricity is one of the most critical components of infrastructure, affecting
economic growth and wellbeing of nations. The existence and development of adequate
power infrastructure is essential for sustained growth of the Indian economy. With a
production of 1,006 terawatt hours (TWh), India is the fifth largest producer and consumer of
electricity in the world after US, China, Japan and Russia. The Indian power sector is one of
the most diversified in the world. Sources for power generation range from commercial
sources such as coal, lignite, natural gas, oil, hydro and nuclear power to other viable non-
conventional sources such as wind, solar, and agriculture and domestic waste. The demand for
electricity in the country has been growing at a rapid rate and is expected to grow further in
the years to come. In order to meet the increasing requirement of electricity, massive addition
to the installed generating capacity in the country is required.

Introduction to Topic
34
2.8.1 Sources of renewable energy (GENI, 2006)
Hydro Power
The hydroelectric power refers to the energy produced from water (rainfall flowing into
rivers, etc). Consequently, rainfall can be a good indicator to investors looking for a location
to implement or build a new hydroelectric power plant in India. India utilizes twelve primary
hydroelectric power plants: Bihar (3), Punjab, Uttaranchal, Karnataka, Uttar Pradesh, Sikkim,
Jammu & Kashmir, Gujarat, and Andhra Pradesh (2).
Solar Energy
Because of its location between the Tropic of Cancer and the Equator, India has an average
annual temperature that ranges from 25°C – 27.5 °C. This means that India has huge solar
potential. The sunniest parts are situated in the south/east coast, from Calcutta to Madras.
Solar energy has several applications: photovoltaic (PV) cells are placed on the roof top of
houses or commercial buildings, and collectors such as mirrors or parabolic dishes that can
move and track the sun throughout the day are also used. This mechanism is being used for
concentrated lighting in buildings. Photovoltaic (PV) cells have a low efficiency factor, yet
power generation systems using photovoltaic materials have the advantage of having no
moving parts. PV cells find applications in individual home rooftop systems, community
street lights, community water pumping, and areas where the terrain makes it difficult to
access the power grid.
Wind Energy
India is surpassed only by Germany as one of the world's fastest growing markets for wind
energy. By the mid 1990s, the subcontinent was installing more wind generating capacity than
North America, Denmark, Britain, and the Netherlands. The ten machines near Okha in the
province of Gujarat were some of the first wind turbines installed in India. These 15-meter
Vistas wind turbines overlook the Arabian Sea.

Introduction to Topic
35
Biomass Energy
Biomass includes solid biomass (organic, non-fossil material of biological origins), biogas
(principally methane and carbon dioxide produced by anaerobic digestion of biomass and
combusted to produce heat and/or power), liquid bio fuels (bio-based liquid fuel from biomass
transformation, mainly used in transportation applications), and municipal waste (wastes
produced by the residential, commercial and public services sectors and incinerated in specific
installations to produce heat and/or power). The most successful forms of biomass are sugar
cane biogases in agriculture, pulp and paper residues in forestry and manure in livestock
residues. It is argued that biomass can directly substitute fossil fuels, as more effective in
decreasing atmospheric CO2 than carbon sequestration in trees. The Kyoto Protocol
encourages further use of biomass energy (GENI, 2006).
2.8.2 Market size
Electricity production in India (excluding captive generation) stood at 911.6 TWh in Financial
Year (FY) 13, 4 per cent growth over the previous fiscal. Over FY 07–13, electricity
production expanded at a compound annual growth rate (CAGR) of 5.5 per cent. The
Planning Commission’s 12th Plan projects that total domestic energy production would reach
669.6 million ton of oil equivalent (MTOE) by 2016–17 and 844 MTOE by 2021–22.
As of October 2013, total thermal installed capacity stood at 156.5 giga watt (GW), while
hydro and renewable energy installed capacity totaled 39.8 GW and 28.2 GW, respectively.
Nuclear energy capacity remained broadly constant at 4.8 GW. The growth in energy demand
in India would be the highest among all countries by 2030–35, beating even China, according
to the 2014 energy outlook report by British oil giant BP. India is the 4th largest country with
regard to installed power generation capacity in the field of renewable energy sources and
much is waiting to be discovered by it. Wind, Hydro, Biomass and Solar are main renewable
energy sources. India has tremendous potentialities to harness the much- needed energy from
renewable sources and is considered as one of the ideal investment destinations for renewable
energy equipment manufacturers and service providers. Wind energy has posted the highest
growth. India could become top player in world's solar market. India intends to provide a
reliable energy supply through a diverse and sustainable fuel mix that addresses major

Introduction to Topic
36
national drivers. These include security concerns, commercial exploitation of renewable
power potential, eradication of energy poverty, ensuring availability and affordability of
energy supply and preparing the nation for imminent energy transition. The market in India
for the RE business is growing at an annual rate of 15%. The scope for private investment in
RE is estimated to $3 billion approx. This growth is expected to continue in the coming years
as stricter environmental norms and regulatory pressure are placed on Indian industries. Best
prospects in sub-sectors that continue to show a high growth rate.
Energy consumption and climate change are highly correlated. Leading enterprises
increasingly understand the links between greenhouse gas (GHG) emissions and energy
consumption. Companies need short-term solutions to optimize energy usage and better
understand their GHG emissions. In the long term, organisations want to optimize the usage
and financial impact of energy and reduce GHG emissions. Energy is a key contributor to
carbon and other GHG emissions.
Figure 2.5: Electricity Production
(Source: GENI, Overview of Renewable Energy Potential of India retrieved
http://www.geni.org/globalenergy/library/energytrends/currentusage/renewable/Renewable-Energy-Potential-
for-India.pdf assed on June 15, 2015)

Introduction to Topic
37
Figure 2.6: Electricity Consumption
(Source: GENI, Overview of Renewable Energy Potential of India retrieved
http://www.geni.org/globalenergy/library/energytrends/currentusage/renewable/Renewable-Energy-Potential-
for-India.pdf assed on June 15, 2015)
2.8.3 Future potential of energy sector
Wind energy is the largest renewable energy source in India; projects like the Jawaharlal
Nehru National Solar Mission (aims to generate 20,000 MW of solar power by 2022) is
creating a positive environment among investors keen to tap into India’s potential. The
country offers unlimited growth potential for solar photovoltaic (PV) industry as well. India is
endowed with vast potential of solar energy and is quickly developing itself as a major
manufacturing hub for solar power plants. A projection in the 12th Plan document of the
Planning Commission indicates that total domestic energy production of 669.6 million tons of
oil equivalent (MTOE) will be reached by 2016-17 and 844 MTOE by 2021-22. This will
meet around 71 per cent and 69 per cent of expected energy consumption, with the balance to
be met from imports, projected to be about 267.8 MTOE by 2016-17 and 375.6 MTOE by
2021-22 (Energy Statistics, 2013).

Introduction to Topic
38
Table 2.4: Estimates of potential capacities from renewable energy sources (in MWs)
Sources Approx. Potential
Biomass Energy 19500
Solar Energy 20000
Wind Energy 47000
Small Hydropower 15000
Ocean energy 50000
(Source: GENI, Overview of Renewable Energy Potential of India retrieved
http://www.geni.org/globalenergy/library/energytrends/currentusage/renewable/Renewable-Energy-Potential-
for-India.pdf assed on June 15, 2015)

Literature Review
39
CHAPTER-3
Literature Review
3.1 Introduction
A literature review focuses on the published information within a certain time period. The data for
the literature review taken from journals, working paper, newspaper articles, government reports
etc. the literature review classified into sub sections such as: global warming and GHG emissions,
Kyoto protocol and CDM, legal aspects and carbon trading, carbon credit market India and
Gujarat. From the literature, the variables has been identified and covered for the study.
3.2 Global Warming and GHG Emissions
The emerging issue that is Global warming focused by each country and they started to delay
the burning issue result. Burning of fossil fuels is a major source of industrial greenhouse
gases (GHGs) emissions, especially for power, cement, and steel, textile, and fertilizer
industries. The major GHG emitted by these industries are carbon dioxide, methane, nitrous
oxide, HFCs, etc. which all increase the atmosphere’s ability to trap infrared energy and thus
affect the climate, leading to global warming. As there are various factors that affect CO2
emissions: country GDP, income level, industrialization, weather effect. Due to temperature
increases, it already affects physical and biological systems by changing ecosystems and
causing extinction of species, and will increasingly have a social impact and adversely affect
human health. It has been a long time since the first deliberations on regulation of greenhouse
gas emissions started, almost two decades ago, until sufficient ratification and thus entry into
force of the Kyoto Protocol, in early 2005. The concept of carbon credits came into existence
as a result of increasing awareness of the need for controlling emissions.

Literature Review
40
As the issue came in highlight in 21st century, the research had been started. The recent
studies gives an idea about the implementation of Clean Development mechanism in different
industries and companies and the lacking points where the economy and companies need to
be cleared. P. David (2003) stipulated the social cost of carbon is an important factor for
developing this concept. Cost–benefit analysis is also one the approach that will help the
economy to set the standards where this social cost just equals the incremental cost of
controlling emissions. The past study was based on the UK government’s assessment of the
cost. This study emphasizes on incorporating adaptive behavior so still it requires time for
adoption as an integral part. Cost–benefit analysis is not work under the long-term percepts
but, in the short run at least, a comparison of cost and benefits is required.
Forest MSW (2005) stipulated that wood compares favorably to competing materials Timber
from plantations performs well compared to competing materials. One study has indicated
that timber can store up to 15 times the amount of carbon that is released during its
manufacture. GHGs release in manufacture of construction materials covered different
products that are as follows. Aluminum and copper are the two major industries that release
highest CO2 through manufacturing process.
In 2007, the Intergovernmental Panel on Climate Change (IPCC) released its fourth
assessment report. The conclusions of this long-running analysis of studies on climate change
and its effects are widely accepted as the consensus of the world’s scientific community.
Wara (2008) stipulates that Global warming is one of the most difficult and important
environmental challenges facing the international community. The most significant effort to
address climate change is the Kyoto Protocol. Since 2004 it has grown rapidly and is now a
critical component of developed-country government and private-firm compliance strategies
for the Kyoto Protocol. To address a global environment problem with market based
mechanism, Global market has done their first attempt called the Clean Development
Mechanism (CDM) of the Kyoto Protocol. The CDM is a carbon credit market where sellers,
located exclusively in developing countries, can generate and certify emissions reductions that
can be sold to buyers located in developed countries.

Literature Review
41
S. Robert (2008) stipulated that so far there is no structured policy to reduce the emissions of
carbon dioxide and other greenhouse gases, majority of the previous researches were focused
on the western countries. With reference to the emerging issue – global warming, majority of
the country across the globe have started showing their serious concern for this issue, and
need has been raised to form a structured policy to have fair distribution of emission
allowances which also exert positive impact on the economy of the country.
Doran (2007) had emphasis that Human activity is motivating unwanted climate change that
resulting from the emissions of greenhouse gases (GHGs) into the atmosphere. To avoid
theserious and potentially appalling environmental, economic and health consequences
associated with an increasing global temperature, everyone has to reduced and slowed for
global emissions of GHGs.
B. Robert (2009) found that there is broad agreement that the climate is warming: air and
ocean temperatures are higher, snow and ice are melting, and sea levels are rising. Further,
natural systems are being affected: plant and animal ranges are moving towards the poles, and
there are changes in fish and algae due to rising ocean temperatures. The IPCC found that the
warming of the climate was very likely due to anthropogenic GHGs emissions. GHGs
emissions from humans have increased by 70% between 1970 and 2004.With current climate
change policies, GHG emissions are projected to continue to increase this century. Further,
there is no single technology that will mitigate the problem of climate change; a range of
policies and innovations is required. The report lists both energy efficiency and individual
behavior modification as suggested GHGs mitigation strategies. Kolk (2009) stipulates
climate change is seen as the most pressing environmental problem of our time by many
companies, policymakers and other stakeholders. It is currently also at the forefront of
attention in view of attempts to conclude a successor to the Kyoto Protocol that expires in
2012. Over the past decade climate change has evolved as the most pressing environmental
problem of our time. Particularly due to temperature increases, it already affects physical and
biological systems by changing ecosystems and causing extinction of species, and will
increasingly have a social impact and adversely affect human health. It has been a long time
since the first deliberations on regulation of greenhouse gas emissions started, almost two
decades ago, until sufficient ratification and thus entry into force of the Kyoto Protocol, in

Literature Review
42
early 2005. The adoption of the Kyoto Protocol in 1997, however, had already set some things
in motion, such as an emissions trading scheme in the EU (the EU-ETS which started on 1
January 2005). Moreover, as the Kyoto Protocol expires in 2012, there is a large uncertainty
as to future emission reduction targets and policy arrangements at various levels. This also
affects emissions trading and the Clean Development Mechanism (CDM) which was designed
as an integral part of it.
Barnwal et al. (2008) stipulates the life cycle energy metrics and CO2 credit analysis. In this
research paper, life cycle energy metrics, such as energy payback time (EPBT), energy
production factor (EPF) and life cycle conversion efficiency (LCCE), and mitigation of CO2
emissions for a hybrid photovoltaic/thermal (PV/T) greenhouse dryer have been analyzed.
The EPBT of the hybrid PV/T greenhouse dryer has been analyzed on an energy basis. The
net CO2 mitigations and carbon credit earned by using a hybrid PV/T greenhouse dryer have
also been highlighted. Krey et al. (2009) emphases on the delay participation and technology
failure, these two factors affect the green house gases emissions in 21st century. The
feasibility of limiting greenhouse gas concentrations and associated global mean temperature
increase to 2 °C above preindustrial levels has recently attracted considerable scientific and
policy attention. Whether or not such low targets can be achieved in the long-term depends on
a number of assumptions about, for instance, technological change and the willingness of
countries to immediately join a post-Kyoto agreement to limit anthropogenic climate change.
The research paper distinguish between “first-best scenarios” with full participation, and
“second-best scenarios” with delayed participation of Brazil, China, India, and Russia in
2030. Efficiency and enhanced energy conservation play an important role across all
scenarios. In addition, carbon capture and storage (CCS) is found to be important for
achieving particularly low forcing targets as well as for avoiding pronounced overshoot of the
target in the medium-term. The most important finding was significant delay in the
participation of major emitter’s leads to the unattainability of the most stringent forcing
targets. Moreover, delayed participation may lead to excessive additional global mitigation
cost that may even exceed the mitigation costs of the most stringent forcing targets in the best
case with full participation. Bouvart et al. (2009) covered the life cycle of GHGs emissions
and selection of technology. The European DYNAMIS project is part of the HYPOGEN
quick-start program and aims at investigating viable routes for large-scale cost-effective
Literature Review
43
combined hydrogen and electricity production with integrated CO2 Capture and geological
Storage (CCS). This paper presents the environmental evaluation carried out for each
technology option studied, producing Hydrogen and Electricity with CCS. The methodology
used is based on life cycle analysis (LCA) principles and concentrates on the assessment of
two criteria: greenhouse gas (GHG) emissions and non-renewable primary energy
consumption. CCS leads to significant GHG emissions reduction on the whole studied
pathways of electricity and H2 production; this decrease ranges from 70% to 82% when
considering CO2 capture rates between 80.3% and 96.1%. However, this technology requires
significant additional energy consumption mainly associated to CO2 capture processes.
The Australian Government production commission (2011) undertakes a research study into
effective carbon prices that result from emissions-reduction policies in Australia and other
key economics. It was estimates the effective carbon price per tonne of CO2 faced by the
electricity generation sectors in these economies, and selected industries drawn from
manufacturing and transport sectors in these and other countries where relevant and data
permitting. AUSTRAC (2011) covered the scam was identified in Australia and the problem
faced in that case. Australian victimized into sending more than AUD 3.5 million to accounts
in Taiwan. Many of the victims were small business operators, self-funded retirees or
investors seeking ethical investment opportunities. The company came to AUSTRAC’s
attention after three suspicious matter reports (SMRs) were submitted by an Australian bank
over a two-day period. The reports outlined complaints by customers, living in different
states, who had been cold-called about a carbon credits investment scam. Two of the
customers had previously sent funds overseas to the company, but had since been contacted
and asked to transfer more money for further ‘investment opportunities’.
Simon et al. (2011) encountered the win-win scenario has been done for climate change
development specially focusing on stove replacement program with carbon finance and study
the possibilities for the same. They focuses on the improved cook stove technologies form an
important, if asymmetrical, environment–development interface, and illustrate the mutually
supported local (development) and global (climate change) benefits of continued improved
stoves use. In practice, there are a number of challenges to achieving effective ‘win-win’
outcomes—including cultural, financial, governance and technological barriers. Carbon

Literature Review
44
finance provides an opportunity to fund scalable. Nicholson et al. (2011) stipulates the carbon
pricing and relative competitiveness about the low-carbon base load generating technologies.
Here the research paper define and apply a set of fit-for-service criteria to identify
technologies capable of supplying base load electricity and reducing GHGs by amounts and
within the timescale set by the Intergovernmental Panel on Climate Change (IPCC). Only five
current technologies meet these criteria: coal (both pulverised fuel and integrated gasification
combined cycle) with carbon capture and storage (CCS); combined cycle gas turbine with
CCS; Generation III nuclear fission; and solar thermal backed by heat storage and gas
turbines. The analysis of the data shows nuclear power to be the standout solution for low
emissions base load electricity, in terms of cost and ability to meet the timetable for GHG
abatement. Further, nuclear power’s relative competitiveness increases as the carbon price
rises.
Guo et al. (2011) examined the carbon emissions in Chinese energy policy. The estimation of
CO2 emissions reduction potential in China is an important issue for China's energy policy. In
this paper, data envelopment analysis (DEA) is used to evaluate the carbon emission
performance of 29 Chinese provincial administrative regions (Tibet and Taiwan are not
included since of data lack) by computing potential carbon emission reductions for energy
conservation technology (ECT) and energy structural adjustment (ESA). Since the Chinese
National Assessment Report on Climate Change was published in 2006, a low-carbon
economy has been advocated by the Chinese government. A series of policies to prompt the
development of non-fossil energy has been proposed to reduce carbon emissions and mitigate
climate change. As the largest developing country in the world, China has the highest CO2
emissions at 6.468 billion tones in 2007 corresponding to 4.9 tons per capita. The Chinese
GDP accounts for no more than 6.2% of the world's total production, whereas China accounts
for 20.85% of the world's total carbon emissions.
Bharti et al. (2011) focused on carbon credit from composting of municipal solid waste. The
Municipal Solid Waste (MSW) used in formation of windrow was collected from the NERIST
campus. Loss on Ignition (LOI) was measured which represents the amount of carbon and
remaining ash in solid waste samples after ignition. As an absolute measure of biodegradable
carbon, LOI provides an excellent measure of biological decomposition in a composting

Literature Review
45
process. Only, biodegradable components of waste are converted into CO2 during the
composting process.
3.3 Kyoto Protocol and CDM
In 1992 at the Rio Earth Summit nations from around the world met and agreed to voluntarily
reduce greenhouse gases (GHGs) emissions benchmarking 1990 levels. The Rio Treaty was
not legally binding and because reducing emissions would likely cause great economic
damage; many nations would not meet the goal. Representatives from around the world met
again in December of 1997 at a conference in Kyoto to sign a revised agreement. The
negotiators agreed to legally binding, internationally enforceable limits on the emission of
greenhouse gases as a key tenet of the treaty. By 2012 the industrialized countries would be
obliged to cut their GHGs emissions by an average of 5% relative to their base-year emissions
in 1990. At the global level, countries around the world have expressed a firm commitment to
strengthening international responses to the risks of climate change. India has the potential to
generate at least 500 million carbon credits, which is worth about 3 billion USD (IISD, 2009).
Zhang (2005) covered the effective implementation of clean development mechanism projects
in China. China is widely expected as the one of the host country of Clean Development
Mechanism Projects for the clear institutional structure, and implementation strategy. The
implementation of CDM Projects learned to improve capacity building assistances, the
establishment of streamlined and transparent CDM procedures and sound governance. By
gaining real experience, China will reduce perceived risks and lower the barriers to CDM
projects.
Paula et al. (2007) covered the international climate policy has developed in a series of
international agreements over the last 15 years. The original treaty, the United Nations
Framework Convention on Climate Change (UNFCCC) was signed in 1992. Since it entered
into force in 1994, the Parties to the Convention meet annually at the Conference of the
Parties (COP). In the framework of the Kyoto Protocol negotiated in Kyoto in 1997, the
industrialized countries - also known as Annex B countries as they are listed in Annex B of
the Kyoto Protocol1 - finally adopted legally binding quantitative constraints, in which they
agreed to reduce greenhouse gas emissions by 5.2 per cent below their 1990 level on average

Literature Review
46
over a first commitment period of 2008-2012. As Annex I of the UNFCCC list the
industrialized countries that were members of the OECD (Organisation for Economic Co-
operation and Development) in 1992, plus countries with economies in transition, including
the Russian Federation, the Baltic States, and several Central and Eastern European States.
Under the Convention, these countries agreed to reduce GHGs emissions to 1990 levels by the
year 2000. Annex B of the Kyoto Protocol lists the industrialized countries that signed the
Protocol in 1997 and thus have emission reduction targets for the period 2008-2012.
Countries in both lists are the same, except for Belarus and Turkey that do not figure in
Annex B.
Paula et al. (2007) examined the parameters to evaluate the performance of the projects: Host
country; unilateral or bilateral character of the project; type of project developer; project category and
type; project size and designated Operational Entity in charge of validation. In the in-depth case
studies, three further key CDM project parameters have been assessed: the quality of the additional
argumentation, the quality of the stakeholder consultation and the quality of the expected sustainability
benefits as stated in the PDDs.
Olsen (2007) focused on the clean development mechanism for contributing to the
development of economy. The challenges of how to respond to climate change and ensure
sustainable development are currently high on the political agenda among the world’s leading
nations. The Clean Development Mechanism (CDM) is part of the global carbon market
developing rapidly as part of the Kyoto response towards the mitigation of global warming.
One of the aims of the CDM is to achieve sustainable development in developing countries,
but uncertainty prevails as to whether the CDM is doing what it promises to do. The past
studies on the CDM have been carried out since its birth in 1997 including peer-reviewed
articles and reports from the grey literature. The objective behind this literature is how CDM
will help the sustainable development but the result shows that CDM is not that much
contributing for Sustainable development for the Kyoto.
B. Emily, C. Esteve and E. Manuel (2008) covered the issues discussed politics in pre-Kyoto
to COP-9 related to operations of Kyoto Protocol and eligibility for the projects under the
CDM sinks. In 1997, the Kyoto Protocol of the United Nations Framework Convention on
Climate Change (UNFCCC) established the Clean Development Mechanism (CDM) as one of

Literature Review
47
its flexibility instruments, together with Joint Implementation (JI) and Emissions Trading
(ET). The emphasis on sustainable development was recognized in the mechanism’s stated
purpose to ‘assist Parties not included in Annex I in achieving sustainable development and in
contributing to the ultimate objective of the Convention’ (Kyoto Protocol, Article 12), which
differentiates it from the other two flexible instruments (both exclusive for Annex I
countries). By the mid 1990s the concept of sinks was firmly on the agenda, including under
provisions for the joint implementation of policies between Parties set out in the Convention.
A pilot project phase of Activities Implemented Jointly (AIJ) was established at the first
Conference of the Parties (COP-1) in 1995, and in 2002, 157 pilot projects have been
proposed with 13% in the land use and forestry sector.
C. Oscar, H. Robyn, W. Russell (2008) examined that GHG, CO2 are two main components in
the atmosphere that is the reason that CER is getting focused in the international market.
Several approaches to accounting for carbon sequestration in LUCF projects have been
proposed. The emission of greenhouse gases, particularly carbon dioxide, and the consequent
potential for climate change are the focus of increasing international concern. Temporary
land-use change and forestry projects (LUCF) can be implemented to offset permanent
emissions of carbon dioxide from the energy sector. To identify the permanent emissions of
carbon dioxide from energy sector, there are many approaches for cost evaluation. In this
research paper they focused on Australian forestry system concerning investors and
landholders. Not only the chemical and manufacturing industries but also agricultural industry
was going for accounting of CER.
Stewart et al. (2009) covered the risks, opportunities and preparedness related to financial
sector and climate change association. Climate change is one of the most significant
challenges that face by business, government and the society. The impact on financial sector
that was not clear at initial phase. Financial sector will be critical to climate change response
due to its role as a provider of capital and advice that influence the business and consumers.
Through the climate change, asset value as well as business performance and risk associated
with it is also affected. The financial sector also impacted by regulatory changes in relation to
environmental law. To minimize the disparities, they have to translate into systematic sector.

Literature Review
48
Janelle Knox-Hayes (2009) emphasised on that there is an opportunities to develop carbon
financial service industry. Carbon markets differ from other markets in terms of the scope of
government involvement—the commodity of exchange is a regulatory creation and emissions
reductions are registered and verified by government. The construction of carbon markets
requires not only capital and resources, but also shared expertise and social connectivity,
which is built through the use of complementarities. Financial intermediaries, such as
exchanges, banks and brokerages help develop and improve the liquidity of carbon trading.
As with legal firms, these institutions use Type 2 inter-firm complementarities to transfer
expertise from existing sectors and develop carbon information. The development of a new
market, particularly a market with enough potential scope and scale to require independence,
amplifies the complexity of complementarities. It is likely the carbon market will be a trillion
dollar (or euro) market within the next decade.
Mizrach (2010) examined that Kyoto also created a Clean Development Mechanism (CDM)
which provides incentives for developing countries to lower their carbon emissions. These
projects, the majority of which are in China and India, generate primary Certified Emission
Reductions (pCERs) which serve as substitutes for emissions in the EU ETS. Nearly 2500
projects have been approved by the CDM executive board which produce an annual average
of 389:3 million CERs. CDM credits have, since 2007, traded in secondary markets (sCERs).
Volumes reached 887 MMtCO2e in 2009.The European Climate Exchange (ECX) has
emerged as the major trading venue. In 2009, it handled 78% of EUA trading volume and
almost 97% of the CER activity. Because CO2 is a global pollutant, that .linkage between
emissions trading schemes is emerging as a substantive issue.
C. Nitin and L. Shubhangi (2011) stipulates the potential for the energy projects under clean
development mechanism and voluntary market. Climate change is one of the greatest
environmental threats facing the world today. To tackle this problem, a protocol was adopted
in Kyoto in 1997 which establishes legally binding commitments to developed countries to
bring down the emissions of six major greenhouse gases by 5.2% compared to the year 1990.
Three flexibility mechanisms have been provided to developed countries to achieve the target
of emission reduction under this protocol and one of them is the Clean Development
Mechanism (CDM), which allows industrialized nations or private entities therein to

Literature Review
49
implement emission reduction projects in developing countries and receive credits in the form
of Certified Emission Reduction (CERs), which may be counted against their national
reduction targets. The paper discusses about the scope of hydroelectric and wind projects in
the CDM market in India and also looked at the options available other than the CDM market,
namely the Voluntary Carbon Market. It also identifies to what extent the potential of these
projects could be harnessed and also presents the key challenges to making full use of these
opportunities.
Galinato et al. (2011) examined that the effect of the Clean Development Mechanism
regulations that create temporary certified emission reductions on harvesting decisions, land
use allocation, and the carbon supply in forest plantations. Under the accounting rules set
during the 2003 Conference of the Parties (COP) in Milan under the United Nations
Framework Convention on Climate Change (UNFCCC), forest projects can accumulate
carbon credits called temporary certified emission reductions (tCERs) and long-term certified
emission reductions (lCERs).The important aspect is to decide the proper policy of CDM
regarding the amount of supply and rotation interval choices. Here the author emphasis on
how increase or decreases in demand for carbon affects the CDM policy/program. The policy
also emphasis on getting tCERs approval, there are two criteria: First, the host country must
have ratified the Kyoto Protocol and must establish a Designated National Authority (DNA)
to determine sustainability of crediting projects within the country. Second, any land that is to
be converted into carbon forest plantations must have been without forest cover between
December 31, 1989, and the start of the projects activity.
3.4 Legal Aspects of Carbon Emissions
H. Lawewnce L. (2009) focused on legal frame of carbon emissions in the international
market. The rules in General Agreement on Tariffs and Trade and the World Trade
Organization Agreement provide the underpinnings to the Global Trading System. Without
those rules, the energy goods and services would be a risk. The various proposals, will affect
cross-border energy trade in an important way. To overcome from that question, every
country must have within legal obligation. Carbon Taxes and related national GHG- emission
control schemes applying to the products which have been covered under GATT and WTO

Literature Review
50
rules and disciplines. Notwithstanding international treaties such as the UNFCCC and the
Koto protocol, WTO member states still have to justify carbon-reduction measures applied at
the border. Avi-Yonah et al. (2009) focused on the major tow policies related to CO2
emissions. During the 2008 presidential campaign, both major party candidates supported cap
and trade. Many of the mainstream environmental groups advocate cap and trade and, in an
unusual alliance, their position is shared by many industry groups. A cap and trade system
therefore is likely to be the focal point of domestic legislation during the Obama
Administration and whatever international agreement follows the Kyoto Protocol, which
expires in 2012. A carbon tax would enable the market to account for the societal costs of
carbon dioxide emissions and thereby promote emission reductions, just like a cap and trade
sys-tem. A carbon tax would be easier to implement and enforce, however, and simpler to
adjust if the resulting market-based changes were either too weak or too strong. A carbon tax
also would produce revenue that could be used to fund research and development of
alternative energy and tax credits to offset any re-gressive effects of the carbon tax. Because a
carbon tax could be implemented and become effective almost immediately, it would be a
much quicker method of reducing greenhouse gas emissions than a cap and trade system. F.
David et al. (2011) stated that Climate change and the actions taken against this global threat
continue to be on the top agenda of politicians, economists, businesses, lawyers and other
parts of the society. One of the instruments to achieve this global objective is carbon trading.
Carbon trading aims to reduce emissions of greenhouse gases by providing for economic
incentives. Carbon trading has implemented this idea by the modification of a ‘cap & trade’
scheme: a specific budget of greenhouse gas emissions is set up by regulators based on
international agreements (cap) and is then divided up into tradable units (emissions
allowances). Emitters of greenhouses gases have to acquire these allowances (trade) in order
to be allowed to continue with their activities.
Galle et al. (2011) discussed about Carbon tax. To see the central problem of the rebate
scheme, the author considered: Would you rather be poor for eleven months and rich for one
or middle-class the whole year round? From the way they behave, it looks like most people
would prefer the latter-a "smooth" income is better than an income with the same total value
but more peaks and valleys. That is because the pain of the lows is, typically, worse than the
satisfaction of the pinnacles. Thus, we save up for rainy days, or insure against them,
Literature Review
51
transferring money from ourselves when we are wealthy to ourselves when we are poor. Here
evidence that, at a minimum, human cognition and credit markets will play large roles in the
ultimate fairness of any carbon tax. There are several solutions that could mitigate these
distributional impacts while allowing climate change prevention to move forward. The
consumers have focused here on carbon pricing as the most politically salient example of the
importance of timing in the delivery of government benefits, but it may not be the most
significant in terms of overall welfare.
Machado et al. (2011) covered the accounting treatment for carbon credit. This paper
analyzed about the might superiority using the real options models on top of traditional
Discounted Cash Flows (DCF) most because the flexibility of exercising or not the put option
of carbon in counterpoint of the log price and how to valorize the advance down payment of
carbon credits using the derivatives methodology in a simple example based on actual CCX
data, demonstrating the similarity of this kind of business with the financial derivatives.
Considering the presupposition that the negotiable carbon credits are intangible assets, in
other words, it is clear that such credits will generate future benefits in cash flow, their value
are relevant and it is possible to measure it with certain precision In the light of IAS20, which
regulates the accounting for, and in the disclosure of, government grants and in the disclosure
of other forms of government assistance, it is necessary debit intangible assets and credit Net
Worth, inside the group of Capital Reserves, to be transferred for P&L in the moment of the
consumption of such permissions. Regarding the carbon credits value the emission is based on
historical cost, but the trading is by fair value, the IAS37, which regulate accrual, provision
and contingencies, demand the necessity to create the liability of that difference. Dhana et al.
(2011) covered the carbon offset market and providers. Carbon offsets are allowances that
represent one unit of carbon dioxide emissions that are linked to climate change. The
emergence of carbon offsets has spawned a new and growing industry of “carbon offset
providers.” These entrepreneurial ventures facilitate the trading of carbon credits between
private entities and publicly traded organizations around the world by promoting and
financing specific emission- reducing projects. These projects are financed via the buying and
selling of offsets by individuals, groups, and firms interested in sustainability. The concept of
carbon neutrality has been in popular usage for over a decade, although it originally emerged
from modeling research on pollution reduction in the late 1960s. Carbon neutrality is the

Literature Review
52
baseline criterion for the movement. It can be achieved in five general steps (Clean Air Cool
Planet, 2006). The first step is to assess a carbon footprint—that is, the amount and
breakdown of different greenhouse gases an individual or organization produces. Tools for
estimating footprints, such as Web-based calculators, are widely available for use by
individuals and corporations. Once a person or company determines its approximate amount
of carbon emissions, the next step is to formulate a strategy to reduce emissions through
changes in energy conservation and efficiency activities. The third step is to estimate
remaining carbon emissions—those that are not eradicated in the previous step. The fourth
step is to purchase carbon offsets for that remainder. The fifth step is to communicate carbon
neutrality status. This final step is more applicable to larger organizations than it is to
individuals or smaller firms.
3.5 Carbon Trading
Bosello (1999) demonstrated that development of carbon emissions trading market, everyone
needs to test presence of externality and internality. If these are internalized prior to the
introduction of the market, there is always difference in the market. Due to existence
imbalance between internality and externality, till today there is some market which was
missed out by countries. The internalization of externalities (e.g. through taxation) amounts to
reconstruction of the missing markets, so that the theorems of welfare can continue to hold.
For developing this market the key important concern is that how the final distribution of
wealth has been done for property rights on the environment resources which were allocated.
James et al. (2002) emphasised on development of the standardization process of the carbon
contract that helps to facilitate trades and emissions projects by contractual process so it helps
to reduce the transaction cost. The paper covers the clauses related to parties, recitals, sale and
purchase, deliver, evidence the validity, risk associated with the contract, price and terms of
payments, warranties, representation, defaults, confidentiality, arbitration, taxes and third
parties related clauses. There is no regulated scheme for transactions involving project based
emission reductions and the market for such emission reductions is not yet liquid. Borger et
al. (2007) focused on managing the financial risks induced by power plants is one of the key
components of the risk management of utility companies. These financial risks may be

Literature Review
53
represented by certain financial futures positions, e.g. a coal-powered power plant can be
thought of as a long position in electricity, a short position of coal and, due to recent efforts to
regulate emissions, a short position in CO2 emission certificates. The research paper
considered the interaction of all of these positions including emission certificates. In order to
evaluate the risk of these portfolios, need to analyze the dependence structure across different
commodities.
E. Christian (2007) emphasised the carbon emissions trading schemes. Carbon emissions
trading is likely to be a crucial pillar of future climate change policy. Since 2005 the European
Union (EU) has implemented a CO2 emissions trading scheme, the first major global scheme
of its kind, and potentially an important precursor for other such schemes. Launched in 2005,
the EU ETS is the first cross-border tradable permit or emissions trading scheme to address
GHGs emissions, covering almost 11,500 installations or about 45% of total CO2 emissions in
the EU, including process emissions. It provides for a mechanism by which emitters – factory
operators, oil refineries, power plants etc. – can identify the most cost-effective ways to
reduce their emissions. By factoring carbon-reduction strategies into day to- day business
decisions, emissions trading would go beyond conventional environmental policy, mainly
seen as an inescapable overhead. Another potential advantage is that the resulting (forward)
carbon price would improve long-term predictability, a crucial factor for business to make
efficient investment decisions. Third, a cap-and-trade system such as the EU ETS provides
environmental certainty by capping the overall emission level from the covered sources. Such
a system lends itself well to the implementation of the Kyoto Protocol targets which are
expressed in absolute terms. Fourth, emissions trading can be expected to minimise the
distortions to competition in the EU market as it imposes an EU-wide carbon price for all
industries alike. Doran (2007) states that cap-and-trade program (Pricing theory of Carbon) is
one of the most effective and efficient mechanisms for reducing GHGs emissions currently
known to policy makers. They also focused on the EU ETS countries applied Cap and Trade.
Ladaniwskyj (2008) examined that the futures market contract constellation for Kyoto Phase
II carbon financial instruments (CFI’s) as traded on the European Climate Exchange; the most
sophisticated and liquid carbon exchange in the EU. Among the leaders of the world’s
nations, a growing accord has come about whereby it has been conceded that the observed

Literature Review
54
changes in the earth’s climate constitute an alarming trend, and are, in all likelihood largely a
product of human activity. The research paper also emphasis on the theory “behind a cap and
trade mechanism is based upon a Pigovian tax type structure that minimizes deadweight
losses in the economy by ensuring that the ability to continue to emit GHGs remains with
agents that attach to it the highest value and in tandem, ensure that the cost of abatement is
minimized as it will naturally flow to areas where the value attached to the right to emit is
lowest. Carbon Reduction Institute (2009) produced the purchasing guidelines for the carbon
credit. Carbon credit projects are tested against standards so that the buyer can be sure that
they are funding a reduction of greenhouse gas from the atmosphere that would not otherwise
have occurred. Any carbon credit used by an organization to meet emission reduction
requirements under the CO2 certification program must meet the following standards.
1. Financially additional
For a carbon credit to be financially additional, the money from the credits must have been
required to make the project happen beyond business as usual. Their energy savings pays back
in time frames that make it a ‘business as usual’ proposition.
2. Environmentally additional
The project must be additional to the environment. Carbon Credits cannot be claimed on
projects that would have occurred anyway. Furthermore, carbon savings from a carbon offset
must be additional to a country’s mandatory Kyoto target. For countries/states with a binding
target, such as Australia, NZ and the EU, (from 2008-2012), this can be achieved through the
Joint Implementation mechanism, or through sourcing carbon credits that pre-date the Kyoto
commitment period.
3. Permanent
Permanence is a very important requirement for a voluntary credit. Carbon savings that have
been forward claimed or carbon emissions that have been stored can present a liability risk for
any party using them to make a claim. If the emissions fail to happen, or are released into the
atmosphere, and the project proponent does not make good this reduction, then the liability
may fall back on the purchaser who made a claim, to rectify the issue.

Literature Review
55
4. Leakage
Leakage is where a project results in an increase of emissions elsewhere. This is a major risk
in avoided deforestation projects where the removal of one section of forest product from the
market encourages the destruction of forest in another due to inelastic demand.
5. Validated and Verified Savings
The project must use a methodology that conservatively quantifies its emissions reductions
through a scientifically valid approach. The project must be audited by an independent third
party to quantify the number of tonnes of greenhouse gas that it has saved. This can occur
through ISO 14064.3 and 14065; through a GHGs program, or through using an approved
methodology from a GHG Program. Any credit from projects that satisfy the 5 criteria above
can be used within the CO2 certification program.
Chaklader (2010) states that increasing pollution level; the economic activity is focusing on
Emission Trading (ET) industry actively. As per Multi-Commodity Exchange of India, with
the increasing ratification of Kyoto Protocol (KP) by countries and rising social accountability
of polluting industries in the developed nations, the carbon emissions trading is likely to
emerge as a multibillion-dollar market in global emissions trading. Carbon Credit is tradable
permits as well as it gives monetary values.
Hamilton et al. (2010) covered the international market trend regarding carbon trading. In
2009, voluntary markets (excluding the now defunct Chicago Climate Exchange) were
estimated to account for about 1 per cent of total volume of emissions rights traded,
representing about 0.3 per cent of total value of trade, mostly from carbon forest sinks or
renewable. In 2009, transactions in voluntary carbon markets (including the Chicago Climate
Exchange) amounted to 93.7 million tonnes of CO2-e valued at US$387 million, and 51
million tonnes CO2-e estimated at US$338 million without the Chicago Climate Exchange.
Perdan et al. (2011) emphasis on the greenhouse gas emissions trading schemes and examine
the prospects of carbon trading. Companies that keep their emissions below the level low their
allowances can sell their excess allowances at a price determined by supply and demand at
that time. For the carbon emissions there is three phases: Phase I covered the European

Literature Review
56
Commission has cut the volume of emission allowances to 6.5% below the 2005level. Phase
II began on 1 January 2008 and will run until 31 December 2012 which coincides with the
‘‘first commitment period’’ of the Kyoto Protocol— the 5-year period during which the EU
and its member states must comply with their emission targets under the Protocol. Phase3 will
run for 8years, from1 January 2013 to 31 December 2020. Perdan et al. (2011) discussed
about the carbon trading operations and the future aspects about the carbon credit in Phase III
which starts from 2013. There are several emissions schemes for carbon trading some of the
schemes are linked with the Kyoto commitments (UNFCC, 1998), while others are operating
in countries which have not ratified the Kyoto Protocol (e.g. the USA).The research paper
analysed the five carbon trading systems such as EU ETS, RGGI, GGAS, NZ ETS and
Tokyo-ETS. P. Bond (2012) stipulates emission trading and eco-social environmental factors.
The political-economic branch of the geography discipline offers insights into the last
decade’s policy reactions to climate change, particularly because of its unique critique of
mainstream economic approaches to greenhouse gas emissions mitigation. Systematically
cutting emissions is vital to avoiding climate chaos, thereby maintaining the world’s average
temperature rise at 1◦C this century, a level deemed necessary to avoid submersion of small
islands and heavily inhabited coastland, and destruction of most African agriculture (that
figure was formerly estimated to be 2◦C but has since been lowered in demands made by the
climate justice movement and tabled in the United Nations. Even after a price recovery, by
2007 it was apparent that Europe’s carbon trading pilot was not working. As Peter Atherton
(2007) of Citigroup conceded, “ETS has done nothing to curb emissions is a highly regressive
tax falling mostly on poor people”. Already a half-decade earlier, a first generation of carbon
trade critics—affected communities (from Indonesia, Thailand, India, South Africa, Brazil
and Ecuador), academics and researchers, and radical environmentalists—took the name
Durban Group for Climate Justice and issued the “Durban Declaration” in October 2004 to
sound the alarm about ethical and economic shortcomings.
Torres et al. (2011) demonstrates the new schemes through Local Emissions Trading Scheme.
Local authorities are important actors to mitigate climate change. They can implement
policies which can reduce emissions of greenhouse gases in sectors like transport, waste,
agriculture and land use, land use change and forestry (LULUCF). The Portuguese mainland
provides a test bed for the implementation of such a scheme beyond the Kyoto Protocol’s

Literature Review
57
commitment period (2013–2020). Under this scheme, the Central Government starts by
allocating allowances to the different local authorities and, at the end of each year (in our case
study between 2013 and 2020), local authorities return a number of allowances corresponding
to the level of emissions observed in their municipality during that year. If, in a particular
case, that level is lower than the level allocated for, that local authority can bank those surplus
allowances for the following year or sell them to other local authorities. If there are higher
emissions in one municipality than the quantity allowed for in the previous allocation, that
authority must buy the necessary allocations in the market.
3.6 Indian Market for Carbon Emissions
To study the Indian Market, the timeframe started from the year 1998 to 2012 had been
studied. Schumacher et al. (1998) emphasis that the productivity growth of Indian iron and
steel sector. The variance may be traced to the time period of study, source of data for
analysis, and type of indices and econometric specifications used for reporting productivity
growth. The research paper derived both growths accounting and econometric estimates of
productivity growth for this sector. The results show that over the observed period from 1973-
74 to 1993-94 productivity declined by 1.71% as indicated by the Trans log index. Using a
Tran’s log specification the econometric analysis reveals that technical progress in India’s
iron and steel sector has been biased towards the use of energy and material, while it has been
capital and labor saving.
S. Katja and S. Jayant (1999) focusing on Indian Cement Industry and the opportunity for
Carbon Emission market. The cement industry presents one of the most energy-intensive
sectors within the Indian Economy. Increases in productivity through the adoption of more
efficient and cleaner technologies in the manufacturing sector will be effective in merging
economic, environmental, and social development objectives. Energy use and carbon
emissions depend mainly on the level of production and the technologies employed. Even the
structure and policies also affects the productivity. The author pointed out cost effective low
cost potentials for reducing energy consumption as well as carbon emissions. In comparing
Indian energy consumption to best practice energy consumption showed that energy savings
of up to 38% could be achieved.

Literature Review
58
Deodhar (2003) covered the financial structure for CDM projects in India. To meet the
emission reduction requirement through purchase of carbon credit from projects in developing
countries, the Clean Development Mechanism (CDM) under the Kyoto Protocol to the UN
Framework Conversion on Climate Change developed the legal framework. Initially, banks
and financial institutions have not developed procedure for efficient financing of CDM
projects. To encourage private sector for project development capacity, there should be
transparent and effective rules at central and state level. CDM funds and CDM bonds become
attractive to reduce the credit risks and political risk.
S. Inderjeet and M. Axel Michaelowa (2004) covered the urban building sector in India.
Indian economic growth is likely to lead to a huge increase of energy use in buildings but so
far, policies to address this issue are lacking. Standard building energy use concerning
glazing, air conditioning and lighting in different climatic zones across India leads to energy
use per m2 which is 3-4 times of the German average. The research paper focusing on the
potential to improve building energy efficiency and measures in the building sector could be
framed as projects under the Clean Development Mechanism. The research paper taken case
based analysis for large buildings in the Indian public and private sector are presented.
Khuranana et al. (2004) examined the Indian urban sector potential for CDM through energy efficient.
Indian economic growth is likely to lead to a huge increase of energy use in buildings but so far,
policies to address this issue are lacking. Standard building energy use concerning glazing, air
conditioning and lighting in different climatic zones across India leads to energy use per m2 which is
3-4 times of the German average. We assess the potential to improve building energy efficiency and
how measures in the building sector could be framed as projects under the Clean Development
Mechanism. CDM case studies for large buildings in the Indian public and private sector are
presented. They achieve annual greenhouse gas reductions of 500 to 10,000 ton, which may not be
sufficient to overcome the CDM transaction cost barrier. Michaelowa et al. (2006) stipulates to assess
additionality and sustainable development issues of energy efficiency CDM projects with an emphasis
on the situation in India. In the second half of 2005, almost 100 energy efficiency projects has been
submitted for validation and 54 of those projects were analysed with regards to additionality and
sustainable development benefits based on Activity Scale (Large Scale & Small Scale), Sector (WHR,
DSM, Cement Blending, Service), project start date. 60% are large scale projects and 90% had started
before 2005. Besides resource conservation, energy efficiency projects do not create much qualitative

Literature Review
59
sustainable development benefits on the whole. Technology transfer occurred rarely and indigenous
technology development happened only in 2 projects.
IL&FS (2007) focused on the CDM befits to the waste management in India. 42 Million tons
MSW generated per annum as well as open Dumping a common practice that is applied
negligible compliance to MSW 2000 Rules. But there are limitations of lack of financial
resources, institutional weakness and improper choice of technology main cause of non
compliance. Municipal Solid Waste Management focused on collection and transportation
with minimal focus on treatment and disposal. The assessment provides information on
India’s emissions of Greenhouse gases (Carbon Dioxide [CO2], Methane [CH4] and Nitrous
Oxide [N2O]) emitted from anthropogenic activities at national level from Energy; Industry;
Agriculture; Waste; and Land Use Land Use Change & Forestry (LULUCF) sectors. They
analysed the different sectors CO2 emissions with 1994 to 2007.The total GHG emissions
without LULUCF have grown from 1251.95 million tons in 1994 to 1904.73 million tons in
2007 at a compounded annual growth rate (CAGR) of 3.3% and with LULUCF the CAGR is
2.9%. Between 1994 and 2007, some of the sectors indicate significant growth in GHG
emissions such as cement production (6.0%), electricity generation (5.6%) and transport
(4.5%). The robustness of the GHG inventory making process is dependent on the Tier of
methodology used. Higher the Tier, more representatives is the emission estimated of the
actual emissions. Of the total 1727.71 million tons of CO2 equivalent emissions from India in
2007, 21% of the emissions have been estimated using Tier I methodology, 67% by Tier II
and 12% by Tier III (INCCA 2007)
Two years after the Kyoto Protocol entered into force in 2005, India has emerged as the most
active seller of carbon credits worldwide, with many of the country's firms implementing eco-
friendly systems of production and going 'green.' According to Environment Secretary Meena
Gupta, India accounts for 289 CDM projects out of the 844 registered - or 34 per cent -
making it a global market leader. China and Brazil follow with 16 and 13 per cent
respectively. Projects are mostly in the areas of renewable energy, followed by energy
efficiency, industrial processes and municipal solid-waste. Substantial carbon credits are also
coming from the infrastructure and power sectors which are thriving in India's fast-growing
economy. Take India's cement industry. It generates 5 per cent of India's total carbon dioxide

Literature Review
60
emission of about 150 million tons every year, but is now eyeing carbon credits in a big way.
A study carried out by ACC, India's leading cement maker, says India accounts for 44 out of
76 total CDM cement projects worldwide and would deliver roughly 40 per cent of emission
reductions in the sector. However, in terms of volumes, projections say that by 2012, China
will lead the Asian market with 45 per cent of the supply market and India will drop to 16 per
cent. Chinese projects are on a much larger scale than India's programs (India Features, 2007).
Shukla (2007) covered the CO2 Emissions in Energy sector in India. In energy sector, taking
time series data for energy consumption and supply applying I-O model, while I-O show the
flow of goods and services, in one economy. In I-O model, for the energy sector it was
modified and taking five independent variables and CO2 Emission as a dependent variable and
find out the effect taking 1998 as a base year. Each and every study I-O model can be changed
based on the assumptions used by the author.
Pathak et al. (2009) focusing on Biogas technology, using local resources such as cattle dung
and organic wastes, provides an alternate source of energy for cooking and lighting in rural
areas and manure in the form of biogas spent slurry. When organic waste is stored in the
absence of air, a microbial degradation process starts producing biogas, which is a mixture of
55% to 70% methane (CH4), which is the combustible component, 30% to 45% carbon
dioxide (CO2) and a small amount of hydrogen (H2). Urban (2009) covered the
implementation part for the two developing county such as China and India. The research
paper analyzed case studies of two countries. Three modeling case studies are presented: for
the Chinese power sector, the economy of Beijing and rural Indian households without access
to electricity. The paper demonstrates a significant reduction in greenhouse gas emissions and
energy use, while costs are likely to increase. Lastly on the basis of analysis the researcher
gave suggestion for financial assistance and technology transfer to support their efforts
towards a climate-friendly low-carbon economy.
Humbad et al. (2009) reveals that Rural India has a potential to earn carbon credit. To reduce
green house gas emissions, the authors applied efficient mechanism by setting up household
based energy substitution such as biogas plant projects. The design variables are rank ordered
using statistical analysis. The basis of this model is the research study conducted in 10
Literature Review
61
villages of Jhunjhunu district of Rajasthan, India spanning a population of around 31,000
people. Under the International emission trading (IET) mechanism, the countries can trade
their surplus credits in the international carbon credits market to those countries with
quantified emission limitation and reduction commitments under the Kyoto Protocol.
Amongst the developing nations, India is considered as one of the largest beneficiary of the
carbon trade through the Clean Development Mechanism (CDM). Prabhakant et al. (2009)
covered the energy security in India going for carbon credits. The analysis was based on the
carbon credit earned by each district for supplying minimum substance electricity to each
family in India. Indian economy growth rate is 8-10% per annum. For sustaining that growth
rate, it depends on coal as well as electricity majorly. Energy consumption of a country is one
of the indicators of socio-economic development. For the research the author first go for
covers average electricity required in one home assuming that there is one fan and one light.
SAPV panels are one of system to earn carbon credit. For the calculation of the cost the
author applies return of capital cost model and indentifies the amount of carbon credit earned.
Agarwal (2010) reveals the energy price regulation is an important policy issue in the context
of any developing nation, including India. It is believed that the existing pricing policy for
Natural Gas in India has constrained the growth of natural gas market in India, leading to a
large unmet demand, primarily from the heavily subsidized power and fertilizer sector. This
paper is an attempt to analyze the policy issue of natural gas pricing in India, using Kingdon’s
Multiple Policy Stream Model. According to this multiple streams approach, the
developments in the policy making process can be explained by the efforts of policy
entrepreneurs to successful capitalize on the occasional “policy windows” by coupling
elements in three different "streams": problems, policies, and politics. The paper focuses on
the developments in gas pricing policy in India, identifying the problem, policy, and political
streams, and the ways in which key political entrepreneurs have coupled the streams at critical
times is past, thereby illustrating the possibility of a current opportunity for taking a
regulatory initiative on natural gas pricing.
Chaklader (2010) stated that Global economy concern about increasing pollution level, and
for that the global economic focusing on Emission Trading (ET) industry actively. As per
Multi-Commodity Exchange of India, with the increasing ratification of Kyoto Protocol (KP)
by countries and rising social accountability of polluting industries in the developed nations,

Literature Review
62
the carbon emissions trading is likely to emerge as a multibillion-dollar market in global
emissions trading. Carbon Credit is tradable permits besides giving monetary values. Carbon
Emission Reduction (CER) is traded in the derivative trading market as a commodity. In India
the trading in National Commodity and Derivatives Exchange Ltd (NCDEX), India started
from the month of April, 2008.
Palmetto (2010) offered carbon financing for the carbon credit projects in India. Palmetto’s
CDM Project team has successfully completed over €100 million worth of transactions in the
global carbon markets. Within the Clean Development Mechanism (CDM), they are able to
execute Certified Emission Reduction (CER) transactions with sophisticated, innovative
structures to benefit CDM Project Developers. This includes recent CDM transactions, the
impact of policy changes and the growth of localized environmental market opportunities. In
this way, the aim is improve market transparency and increase market access. They are
charging the commission is based on a success-fee, which is directly linked to the value of the
CER transaction. This ensures that their clients do not pay until there is a successfully
completed sale.
Poudyal et al. (2011) emphasis on motivation and support for green projects varies by their
organizational objectives and characteristics. There are the certain factors which motivate to
participate in Green Projects like credibility and reputation, relationship with stakeholders,
cost reduction, operational effectiveness, and compliance with business and legal agreements.
It has been also focused on that environmental performance indirectly generates higher
revenue for businesses through reduction of production costs, product differentiation ability,
and market access. The author emphasis on consumer perceptions towards factors that is
considered for emission management decision and for that the companies which were
registered under CCX were taken as base. The development of market based incentives could
be beneficial for the businesses to be innovative in environmental management.
Mukharjee (2011) covered the unique path to lower the carbon emissions taken by India. With
four times the population of the United States, an economy growing 8-9 percent a year and
surging energy demand, India's race to become an economic power has propelled it to
Number 3 in the list of top carbon polluters. India's greenhouse gas emissions will keep rising

Literature Review
63
as it tries to lift millions out of poverty and connect nearly half a billion people to electricity
grids. But it is also trying to curb emissions growth in a unique way, fearing the impacts of
climate change and spiraling energy costs. In the world's first such national market-based
mechanism, called Perform, Achieve and Trade (PAT), India is starting a mandatory scheme
that sets benchmark efficiency levels for 563 big polluting from power plants to steel mills
and cement plants, that account for 54 percent of the country's energy consumption.
N.E. Hultman et al. (2012) emphasis on the firms’ perceptions of CDM decisions in Brazil
and India. It reveals challenges to market development that should be addressed in order to
make the roll out of a post-2012 CDM more effective. They conducted firm-level interviews
covering 82 CDM plants in the sugar and cement sectors in Brazil and India, focusing on how
individual managers understood the potential benefits and risks of undertaking clean
development mechanism (CDM) investments. The results indicate that the CDM operates in a
far more complex way in practice than that of simply add in marginal incremental a project’s
internal rate of return.
3.7 Carbon Credit Market in Gujarat
The research focused on the potential of Gujarat market. One of the researches covered the
initiate taken by the Municipal Corporation to earn carbon credit and the opportunity for the
new carbon projects. Nadene Ghouri (2009) covered the facts that affect environment and
human rights in Gujarat taking florochemical companies. GFL had spoiled the land and water
area nearest to plant and that affect the human. GFL is part of a worldwide carbon-trading
scheme, centered in London, which is supposed to be helping to save the planet from global
warming. Under the Kyoto agreement and supervised by the UN, looks like an efficient way
to cut global carbon emissions. However, a live investigation has exposed a series of major
failings and loopholes in the scheme. Four years ago, GFL installed technology to reduce the
greenhouse gases it produces and was given a vast financial reward by the UN; a UK
company was also given considerable sums for investing in the projects. However, far from
being a flagship green factory, GFL stands accused of poisoning the local environment. S.
Shwetal (2011) covered the possibility of exclusive use of renewable energy for electricity
required by the Municipality for Pumping, Lighting and Municipality Buildings etc. This can

Literature Review
64
be one of the many first initiatives of the State for climate change mitigation, Gujarat can be
the first State in the World to have carbon neutral municipalities by adopting this practice.
Gujarat Government is supporting establishment of renewable energy power plants through
Power Purchase Agreement (PPA) based on policies for solar, wind, biomass etc. By
development of Carbon Neutral Towns, Government will further establish an example of
Convenient Action for curbing challenges of Climate Change. Proposed 10 Carbon Neutral
towns will require a 1 time expense of about Rs. 75 to 100 Cr., in return will get assured
supply of electricity for coming 25 years. Pearson (2011) covered the Gujarat carbon credit
award with reference to Gujarat Flourochemicals Ltd. Gujarat Flourochemicals Ltd., an
Indian maker of refrigerant gases, rose to a three-year high after winning carbon credits for
the first time since the United Nations ended a probe into projects claiming emission
reductions of industrial gases. The shares gained 4.5 percent to 263.95 rupees in Mumbai
trading, its highest close since February 2008. The benchmark Sensitive Index advanced 1.1
percent. Such credits are bought by companies and nations to comply with limits on emissions
of greenhouse gases. While HFC-23 projects represent less than 1 percent of all registered
CDM projects, their credits account for more than half the tradable offsets issued so far by the
UN. The 19 projects cutting the gas under the CDM program are mainly in China and India.
United Nations Environment Program (2011) covered Gujarat earned carbon credits. The 24-
year-old wants Gujarat to be the world's highest carbon-credits earner and emerge as the
number one player in green initiatives. Shwetal Shah's aspiration and zeal have earned him an
invitation from the United Nations Environment Program (UNEP) to participate in the 5th
International Marine Debris Conference (IMDC) in Honolulu in March 2011. The conference
focuses on waste management in marine ecosystems, a crucial necessity for the long-term
environmental sustainability of coastal states. Gujarat is the first state in India to sign such
MoU with the World Bank. Under this agreement, Gujarat is planning to launch a campaign
to reduce carbon emissions from the state. Emissions from industries and steps like safe
handling of solid wastes will also be taken under this campaign. In return, the World Bank
will provide financial incentives to the state. The recent agreement with the World Bank will
go a long way in ensuring that the new industries, which will open shops in the state, abide by
the global pollution standards. According to the Environment and Forestry Ministry in India,
companies in the country have already earned $7.9 million through carbon credit trading. The

Literature Review
65
CDM under the Kyoto Protocol lets wealthier nations trade their emission reduction
commitments with developing countries by buying carbon credits earned by the latter for
projects reducing greenhouse gas emission. Since the CDM began in 2005, India has
registered more than 450 projects for carbon trading.
3.8 Future Aspects about Carbon Emissions
In the year 2012, the Kyoto Protocol Phase I was over and all the countries need to decide
about the adoption of Phase II that started from the year 2013 to 2018. The future is uncertain
because there technical and non technical parameters affects the carbon market. The research
also focused on the future aspects about the carbon trading schemes.
As the climate change issue reaches fever pitch, interest in the use of forests as a means of
removing carbon dioxide (CO2) from the atmosphere has accelerated. Carbon storage in new
forests can provide a cost-effective form of net greenhouse gas abatement and a valuable
source of transitional emissions reductions until new energy technologies are developed.
Forest establishment can also contribute to other social and environmental outcomes. New
plantations and replanting will only occur if a positive investment environment exists. The
potential of Australian forests to store more carbon depends on the rate of new plantings or
forest regeneration, harvesting and growth rates, and tree deaths by fire, pests and disease.
Anonymous (2010) covered the future aspects of carbon credit. Under the United Nations’
clean development mechanism, or CDM, developed countries buy carbon credits—generic
units to measure carbon emission reduction—from projects and companies in developing
countries. India has been second only to China in sale of carbon credits (19.24% of the global
total) and the number of projects that have sold credits (23.07%). This scheme depends on
developed countries’ commitment to reduce carbon dioxide emission and other so-called
greenhouse gases, which scientists say are responsible for climate change worldwide. But
developed nations have made these commitments only until 2012. As climate talks remain
stalled, the future of trading in carbon emission reductions is uncertain.
Perdan et al. (2011) focused on the future aspects about carbon trading schemes. In 2009 the
carbon market endured its most challenging year to date, and in the midst of a global

Literature Review
66
economic crisis, emissions trading looked ‘‘clouded by uncertainty.’’ At the same time, there
are notable intentions within the current schemes to expand geographically and temporary and
include more sectors and greenhouse gases. Furthermore, new schemes are being planned
around the world too and there are indications that some of them would be linked or merged
with the current emission trading mechanisms. This raises a possibility of the emergence of a
global carbon market. However, there are significant technical and non-technical (policy and
political) obstacles to a possible expansion. The paper has also argued that an expansion of
current emissions trading schemes and their possible linking depends not only on technical
fixes and harmonization of different trading systems, but also on clear policy signals,
continuing political support and a more stable economic environment.
3.9 Summary of Literature Review
In these literatures, the research had covered the timeframe from year 1998 to 2014. In 2003,
the study was focused on the development and implementation of GHG emission mechanism
developed under Kyoto Protocol. Kyoto Protocol is an agreement which was signed by all the
member countries and shows their commitment towards the burning issue “Global Warming”.
Kyoto Protocol came into force in 2005. In 2005, the research covered the different industries
that come under the head of CO2 emission and how much CO2 had been released by those
industries. Further, the research has done the trading part of Carbon Credit which was
initiated by EUETS and how the developing countries take an advantage of this opportunity
by developing carbon finance industry.
One of the research focused area was to implement Clean Development Mechanism (CDM)
for the developing countries. Gradually the research covered the conceptual framework for
clean development mechanism and Norms developed by UNFCCC in the year of 2007 and
2008. The studies done in the year of 2008 was focused on the implementation of the first
attempt done by Kyoto Protocol for the developing countries that is Clean Development
Mechanism (CDM). In 2009, the new model came into existence that is life cycle energy
metrics. The researcher focused on the implementation of life cycle energy metrics in
different economy and industries. In addition to this model, other research was focused on
descriptive study on phase II of Kyoto Protocol which started from 2008 to 2012.

Literature Review
67
Legal aspects of carbon emissions play an important role from company as well as economy
point of view. The research studies covered the GATT and WTO rules and disciplines with
standing of UNFCCC and the Kyoto protocol. In 2010, the studies more focused on the
carbon trading and cap and trade system. In addition to these, one of the studies covered the
accounting treatment for the carbon credit by the companies. The recent studies focused on
the carbon tax which will come into existence in near future. In 2011, the studies more
focused on the implementation done in different industries such as Energy, Steel, and Cement
etc. in developing countries like India and China. Carbon trading emerged as the new
financial industry for the global market. The timeframe covered for the study is year 1999 to
2012. In 1999 study focused on internal and external carbon trading market and find out the
inequality between these two parameters. In the year of 2012, the research more focused on
the development of standardized process for carbon trading market. After the development of
standardized format, in the year 2007 the studies focused on the risk involvement in carbon
trading market and expansion of carbon trading market by introducing new schemes under
EUETS. From the year 2008 to 2012, the Kyoto Protocol Phase II started. Majority of the
research emphasised on the carbon trading market and economy indicators. From the year
2011, the researcher focused on the future trends and aspects about Carbon trading market.
From Indian Perceptive there were very less research done on industry specific. Initial phase
of research, it focused the productivity and growth rate of different industries in India which
affect the carbon credit market. From 2002, the study covered the clean development
mechanism process and applicability. From year 2004 to 2007, the research was done on
industry basis. Each research focused on the individual industry and urbanization in Indian
economy. This was helped to identify the potential industries for carbon emission. In the year
2009, the area covered by the researcher was technology adoption issues and potential in rural
India. Carbon trading market study started from the year 2010 covered the MCX data. It also
emphasised on the comparison of carbon emission market with other developing countries
more with China. The recent research focused on the political and economic parameter affects
the carbon market and motivate the green projects by emerged venture capitalist and
involvement by the government. Gujarat is the first state to sign MOU for the carbon credit
market and started the new department that is “Climate Change” under the Gujarat Urban
Development Corporation (GUDC).

Literature Review
68
3.10 Research Gap
From the literature, it has been identified that there were very less research done on Indian
Organisations. There were no researches done on primary data from organisations in Gujarat
state. This leads to study different parameters of energy organisations. The study will become
pioneer for the further research.
3.11 Conceptual Framework of Carbon Credit
One of the environmental threats our planet faces today is the potential for long-term changes
in the earth climate and temperature known as Global Climate Change. Although Climate
Change may result in some benefit to some extend but overall effects are likely to be harmful.
GHG emissions from humans have increased by 70% between 1970 and 2004.With current
climate change policies, GHG emissions are projected to continue to increase this century. In
1992 at the Rio Earth Summit nations from around the world met and agreed to voluntarily
reduce greenhouse gas (GHG) emissions benchmarking 1990 levels but it was not legally
binding so they would not get great success. Again in 1997, the entire representatives around
the world meet again in Kyoto at Japan to sign an agreement that is legally bounded and
named as Kyoto Agreement. The agreement gives internationally enforceable limits on the
emission of greenhouse gases as a key tenet of the treaty. By 2012 the industrialized countries
would be obliged to cut their GHG emissions by an average of 5.2% relative to their base-year
emissions in 1990. The focus of Kyoto Protocol, however is the reduction in the level of six
gases: carbon dioxide (CO2), methane (CH4), nitrous oxide (N2O), hydroflourocarbons
(HFCs), perfluorocarbons (PFCs), and sulfur hexafluoride (SF6). The Kyoto Protocol has
bought out three mechanisms for GHG emission abatement that is (i) Joint Implementations;
(ii) Clean Development Mechanism; (iii) International Emission Trading. All these
mechanisms are market-based. The first two are project based, where as the third one allows
the developed countries to sell surplus emission of one country to another developed country.
To develop a common base of the global warming for all the countries potential of six gases
covered under the Kyoto Protocol agreement, it is decided that 1 tonne of carbon equivalent to
1 credit as a baseline indicator under any one of the mechanism. For the implementation of
the three mechanisms, under Kyoto Agreement, they categorized countries under two heads:

Literature Review
69
(i) Annexure I for Developed Countries and (ii) Non-Annexure I for Developing and Under
Developed countries.
India is developing country. From the three mechanisms, In India Clean Development
Mechanism is applied. The Clean Development Mechanism (CDM) will serve as a symbiotic
association between the Annexure I and Non Annexure I country parties where both will be
mutually benefited from the association. India would be benefited by receiving new
sustainable technologies and funding aids helping them achieve their sustainable development
objectives. The other benefits to the developing country parties would be in terms of increased
income, employment generation, alleviation of the poor and improvement of ambient air
quality and standards of living. The National CDM Authority (NCDMA) is a single window
clearance for CDM projects in the country. India is the leading country in the world with the
second rank in Carbon Emission Reduction earning after China. China accounted for more
than 55% of total CER issued under UNFCCC, where as 15% of total CER issued are of
India. Gujarat is the first state in the country accounted Rs.127, 021,481 CER issued till 2012
that 18% of the total CER in India.
Although the world leaders struggle to achieve target in Kyoto Protocol first commitment
period is ending on 31 December 2012, but still they initiated for the second commitment
period will start right after it. The commitment period started in 2013 and extended until 2017
or 2020. At the UN’s annual climate change conference just concluded in Doha, 194 countries
agreed to an extension of the Kyoto Protocol through 2020. But the second phase still omits
the world’s two biggest greenhouse gas emitters – China and the United States. Governments
agreed to work toward a universal climate change agreement covering all countries from
2020, to be adopted by 2015, and to find ways to scale up efforts before 2020 beyond the
existing pledges to curb emissions. Still the Global market have an opportunity to delay the
Global warming effects by adopting Kyoto Protocol Phase II and put their efforts to save the
world.

Literature Review
70
Figure 3.1: Conceptual Framework of Carbon Credit

Research Methodology
71
CHAPTER- 4
Research Methodology
4.1 Introduction
The purposes of this section are to (1) define the research question for this research effort and
(2) present a set of specific hypotheses that address the research question.
4.2 Overview of the Study
Figure 4.1: Overview of the Study
The first phase is to conduct a literature review to study the concept in detail and identify the
scenario in India as well as Gujarat. A summary of the literature review is presented in
chapter III of this document. A thorough literature review produced no previous studies that
Pilot Study Literature Review Research Model Development
Primary Study
Fundamental
Review
Data Analysis & Interpretation Data Collection
Reliability
Analysis
Data
Collection
Questionnaire
Development
Instrument
Identification
Construct
Identification

Research Methodology
72
investigated the projects which already registered by the energy sector organizations. This
observation emphasizes the need to address the research question in this study.
The second phase is to incorporate to identify and development of instrument. This step
involves developing a questionnaire depicting the hypothesized relationships between aspects
considered, factors and barriers and risk association with the CDM project, selecting a
measurement tool for each construct (based on the content, and lineage of the available tools),
and finally developing a general model that is questionnaire includes all the aspects identify
from the literature review. The structural model is presented in this document, while the
general model and a summary of the construct selection process are presented in this chapter.
The third phase is to conduct a pilot study. The primary objective of this research phase is to
collect responses and conduct a pilot study designed to confirm the reliability and validity of
the measurement instruments. Pilot data is collected via structured interview as well as
through mail. The objective of the pilot study is to conduct an initial analysis of the general
model in order to gain introductory insight into relationships between model constructs.
Although the sample size for the pilot study is not large enough to conduct reliable analysis,
analysis of the general model can provide an indication of possible relationships which will be
reinforced by the primary study.
The fourth and final phase is the primary research study. The primary research study involves
collecting data, conducting analysis for each of the instruments utilized to collect data, and the
study the relationships between model variables.
4.3 Variables Defined
The next phase of the research effort is to construct a structural model (Questionnaire) which
depicts the relationship between expertise and the constructs identified during literature
review. In the literature review, a set of constructs consisting of different aspects considered
by the organization, list of factors and barriers need to be considered for CDM projects and
the risk level association are identified as traits which potentially influence the development
of CDM Projects. The concept of exogenous and endogenous variables is similar to the
concept of independent and dependent variables that is common in many statistical

Research Methodology
73
applications. Exogenous variables affect or influence the model without being affected by it.
That is, an exogenous variable only has paths coming from it and none leading to it.
Endogenous variables are affected or influenced by other variables in the model, and therefore
have at least one path leading to it (Blunch 2008).
Table 4.1: Variables Defined
Sr. No. Variables Extracted from
1. Aspects considered for CDM projects CDM website, ‘CDM Project Cycle’:
http://cdm.unfccc.int/Projects/diagram.html accessed
Sept.,2013
2. Factors affecting CDM projects www.paryavaranmitra.org.in
3. Barriers faced by organisation for CDM
projects
www.paryavaranmitra.org.in
4. Risk associated with CDM projects Clean Development Mechanism and Carbon Credits,
ICAI, April,2009
5. Impact of CDM projects www.cdmindia.gov.in
6. Carbon Financing Clean Development Mechanism and Carbon Credits,
ICAI, April,2009
7. Carbon Trading www.unfccc.int
4.4 Objectives of the Study
1. To review the global carbon credit market with respect to global climate change and
GHGs emissions, Kyoto protocol and its mechanisms and carbon trading.
2. To assimilate the various technologies and parameters considered by organisations and
also examine the factors and risk level associated with registered CDM projects of energy
sector organisations in Gujarat.
3. To examine the barriers faced by selected organisations for CDM projects and the impact
of CDM projects on functions of organisations.
4. To explore the future potential of carbon credit market in Gujarat and India.

Research Methodology
74
4.5 Research Hypotheses
H1: There is a significant difference between factors affecting the CDM projects and time
span of the project/ public & private sector organisations/ technology adopted for CDM
projects.
H2: There is a significant difference between barriers affecting CDM projects and time span
of the CDM project/ classification of organisations based on investment/number of
employees/public & private sector organisations/technology adopted for CDM projects.
H3: There is a significant difference between aspects considered for the CDM projects and
number of years serves in the industry/ classification of organisation based on
investment/public & private organisation/technology adopted for CDM projects.
H4: There is a significant difference for carbon trading among different type of organisation
based on no of years serves in industry/ classification of organisation based on
investment/public & private organisation/ technology adopted for CDM projects.
H5: There is a significant difference between impact of CDM projects on organisation and
number of registered project/number of employees/number of years serves in industry/public
& private organisation/ technology adopted for CDM projects.
H6: There is a significant association between risk associated with the CDM projects and time
span of the CDM projects/ public & private energy sector organisations / technology adopted
for CDM projects.
H7: There is a significant association between deployment of corporate social responsibility
and number of years serves in industry/public & private organisations/ technology adopted for
CDM projects.
H8: There is a significant difference between number of registered CDM projects among
public & private organisations/ technology adopted for CDM projects.
H9: There is a significant difference between estimated CER p.a. among public & private
organisations/ technology adopted for CDM projects /carbon trading.

Research Methodology
75
4.6 Scope of the Study
The scope of the study refers to the parameters under which the study examines Registered
CDM projects in the state of Gujarat. The study focuses on carbon credit market in India and
Gujarat state including Kyoto protocol and its mechanism, The Indian nodal agency for
carbon credit is NCDMA and CDM cell in Gujarat. The result of the study may be
specifically applied to only a niche segment of CDM projects. The sampling frame is defined
as energy sector organisations in Gujarat which have registered their large scale CDM
projects for carbon emission reduction (CER) up to 2012 under NCDMA (Kyoto protocol
phase I).
4.7 Research Design
Malhotra and Das (2009) describe the research design as the formidable problem that follows
the task of defining the research problem is the preparation of the design of the research
project. Decisions regarding what, where, when, how much, by what means concerning an
inquiry or a research study constitute a research design. Different research designs can be
conveniently described if it is categorized as: (1) research design in case of exploratory
research studies; (2) research design in case of descriptive and diagnostic research studies,
and (3) research design in case of hypothesis-testing research studies.
Research design in case of exploratory research studies: Exploratory research
studies are also termed as formularise research studies. The main purpose of such
studies is that of formulating a problem for more precise investigation or of
developing the working hypotheses from an operational point of view. The major
emphasis in such studies is on the discovery of ideas and insights. As such the
research design appropriate for such studies must be flexible enough to provide
opportunity for considering different aspects of a problem under study. Inbuilt
flexibility in research design is needed because the research problem, broadly defined
initially, is transformed into one with more precise meaning in exploratory studies,
which fact may necessitate changes in the research procedure for gathering relevant
data.

Research Methodology
76
Research design in case of descriptive and diagnostic research studies: Descriptive
research studies are those studies which are concerned with describing the
characteristics of a particular individual, or of a group, whereas diagnostic research
studies determine the frequency with which something occurs or its association with
something else. The studies concerning whether certain variables are associated are
examples of diagnostic research studies. As against this, studies concerned with
specific predictions, with narration of facts and characteristics concerning individual,
group or situation are all examples of descriptive research studies. Most of the social
research comes under this category.
Research design in case of hypothesis-testing research studies: Hypothesis-testing
research studies (generally known as experimental studies) are those where the
researcher tests the hypotheses of causal relationships between variables. Such studies
require procedures that will not only reduce bias and increase reliability, but will
permit drawing inferences about causality.
Research design selected: The most important criterion for deciding the type of
research design is the research question. Therefore, the present research uses
descriptive research design to study the nature and facts of variables listed above and
carbon credit.
4.8 Sampling Design
Malhotra and Das (2009) classified sample designs into two types viz., non-probability
sampling and probability sampling.
Non-probability sampling: Non-probability sampling is that sampling procedure
which does not afford any basis for estimating the probability that each item in the
population has of being included in the sample. Non-probability sampling is also
known by different names such as deliberate sampling, purposive sampling and
judgement sampling. In this type of sampling, items for the sample are selected
deliberately by the researcher; his choice concerning the items remains supreme. In
other words, under non-probability sampling the organisers of the inquiry purposively

Research Methodology
77
choose the particular units of the universe for constituting a sample on the basis that
the small mass that they so select out of a huge one will be typical or representative of
the whole.
Probability sampling: Probability sampling is also known as ‘random sampling’ or
‘chance sampling’. Under this sampling design, every item of the universe has an
equal chance of inclusion in the sample. It is, so to say, a lottery method in which
individual units are picked up from the whole group not deliberately but by some
mechanical process.
Sample design selected:
The samples are defining in terms of numbers of energy sectors organisations. Sample
organisations are selected based on the data availability and convenience. Here the
sampling design used is non-probability convenience sampling.
Target population:
The companies who had registered CDM projects under NCDMA in Kyoto protocol
phase I (till 2012) in Gujarat state.
Target group: In Gujarat, the companies from energy sector (Renewable/Non-
renewable) who has registered their projects on large scale basis till year 2012 for
carbon emission reduction with NCDMA. There are total 33 organisations that had
registered large scale CDM projects in Gujarat.
Sample size:
Top management employees from energy sector organisations were approached for
data collection. Phone calls were made with the potential respondents before going for
data collection to give them brief outline about the study and the objectives of the
study. Based on the convenience of the respondents, the data has been collected
through semi structured questionnaire which was responded by the energy sector
organisations in Gujarat which has already registered their large scale projects under
NCDMA till 2012. For the primary study, 22 organisations had been covered for the

Research Methodology
78
study. Respondents for the sample are General Managers or Managing directors or
Project managers at the sampling unit which is the Organisation. The list of
Organisations has been attached in Appendix B.
Table 4.2: CDM projects and CER up to 2012
Name of Sector No of projects CER up to 2012(in
tonnes)
Afforestation and Reforestation 18 10,874,541
Agriculture 3 74,393
Chemical Industries 18 11,793,853
Energy Demand 221 27,109,485
Energy Distribution 9 657,149
Energy industries(Renewable/Non-renewable sources) 2219 487,417,048
Fugitive emissions from fuel(Solid, Oil and gas) 3 165,438
Fugitive emissions from production and consumption of halocarbons and
Sulphur 6 82,095,771
Manufacturing Industries 237 64,405,361
Metal Production 5 5,425,126
Mining/Mineral Production 4 19,053,935
Solvent use 1 103,579
Transport 13 1,238,906
Waste handling and disposal 69 12,498,337
Total (Number of Projects) 2826 722,912,923
(Source: CDM Projects and CER up to 2012 retrieved from http://www.cdmindia.gov.in/reports_new.php
assessed on Feb. 28, 2013)

Research Methodology
79
4.9 Data Collection
The present study incorporates the collection of both primary and secondary data for an in
depth study.
Primary data are collected through semi structured questionnaire. The questionnaire was pre-
tested with pilot study and minor modifications were made to the questionnaire. The data has
been collected through personal interviews, telephonic interviews and through e-mail.
Secondary data are collected from periodicals, journals, research papers, articles, magazines,
newspapers, web-sites and other reference material available from various sources.
4.10 Statistical Tools Applied
Levin and Rubin (1998) described the data analysis tools and hypothesis testing. Data analysis
is an attempt to organize and summarize the data in order to fulfill the objectives. Varieties of
analytical and statistical tools are used for coding and decoding of data, analysis of data and
for establishing relationship among various factors. Special software named, Statistical
Package for Social Science (SPSS), used for analysis.
As stated earlier, the computation of certain indices or measures along with searching
for patterns of relationship that exists among the data groups. Analysis, particularly in
case of survey or experimental data, involves estimating the values of unknown
parameters of the population and testing of hypotheses for drawing inferences.
Analysis may, therefore, be categorised as descriptive analysis and inferential analysis
(Inferential analysis is often known as statistical analysis). “Descriptive analysis is
largely the study of distributions of one variable. This study provides us with profiles
of companies, work groups, persons and other subjects on any of a multiple of
characteristics such as size, composition, efficiency, preferences, etc. This sort of
analysis may be in respect of one variable (described as univariate analysis), or in
respect of two variables (described as bivariate analysis) or in respect of more than
two variables (described as multivariate analysis).

Research Methodology
80
When the test applied (to test the hypothesis) without a model, it is known as
distribution-free test, or the nonparametric test. Non-parametric tests do not make an
assumption about the parameters of the population and thus do not make use of the
parameters of the distribution. In other words, under non-parametric or distribution-
free tests, the researcher does not assume that a particular distribution is applicable, or
that a certain value is attached to a parameter of the population. Following non-
parametric tests have been used for this research.
Cronbach -Alpha:
Cronbach's alpha is the most common measure of internal consistency ("reliability").
It is most commonly used when you have multiple Likert questions in a
survey/questionnaire that form a scale and you wish to determine if the scale is
reliable.
The Kruskal-Wallis Test:
This test is conducted in a way similar to the U test described above. This test is used
to test the null hypothesis that ‘k’ independent random samples come from identical
universes against the alternative hypothesis that the means of these universes are not
equal. This test is analogous to the one-way analysis of variance, but unlike the latter it
does not require the assumption that the samples come from approximately normal
populations or the universes having the same standard deviation.
Chi-square Test:
The chi-square test for independence, also called Pearson's chi-square test or the chi-
square test of association, is used to discover if there is a relationship between two
categorical variables. When the researcher choose to analyse your data using a chi-
square test for independence, need to make sure that the data you want to analyse
"passes" two assumptions. These two assumptions are: The data has two variables
should be measured at an ordinal or nominal level (i.e., categorical data). The two
variables should consist of two or more categorical, independent groups.

Research Methodology
81
Mann-Whitney U Test:
The Mann-Whitney U test is used to compare differences between two independent
groups when the dependent variable is either ordinal or continuous, but not normally
distributed. For example, the Mann-Whitney U test use to understand whether
attitudes towards pay discrimination, where attitudes are measured on an ordinal scale,
differ based on gender (i.e., your dependent variable would be "attitudes towards pay
discrimination" and your independent variable would be "gender", which has two
groups: "male" and "female"). Alternately, you could use the Mann-Whitney U test to
understand whether salaries, measured on a continuous scale, differed based on
educational level (i.e., your dependent variable would be "salary" and your
independent variable would be "educational level", which has two groups: "high
school" and "university"). The Mann-Whitney U test is often considered the
nonparametric alternative to the independent t-test although this is not always the case.
4.11 Synopsis of the organisation studied
There are total 33 energy sector organisations who had registered their large scale CDM
projects under NCDMA till 2012 in Gujarat. Finally the study is able to covered 22
organisations out of 33 organisations (approx. 66.67% of the population). From 22
organisations, 18 organisations were from private sector and 4 organisations from public
sector.
The studied organisations were majorly from the large scale organisations based on
investments and three organisations from small and medium scale organisations. In terms of
no of years serves in the industry, there are nine organisations who has served less than five
years, six organisations served five to ten years, three organisations served ten to fifteen years
and four organisations served more than fifteen years in the industry. There are eleven
organisations that had registered only single CDM projects in Kyoto protocol phase I. out of
22 organisations, 17 organisations had registered CDM projects for less than 14 years’ time
period and 5 organisations had registered for more than 14 years’ time period.

Data Analysis and Interpretation
82
CHAPTER – 5
Data Analysis and Interpretation
5.1 Introduction
This chapter gives insight of data collected from energy sector organisations which had
registered large scale CDM projects up to 2012. The time frame covered by the data set is
based on the availability of the data. After applying reliability test on the data collection
instrument, the final data had been collected. Based on the normality of the data set, the non-
parametric test has been used for the data analysis. The chapter also covers the individual
findings of the data set.
5.2 CDM Projects Profile and Company Profile
Time span of the CDM projects
Table 5.1: Time span of the CDM projects
Particulars Phase I (1to 7years)
Phase II (8to
14years)
Phase III (15 to
21years)
Time span 8 9 5
Interpretation:
Majority of the energy sector organisations had registered their CDM projects for the Phase I
(1 to 7 years) and Phase II (7 to 14 years).

Data Analysis and Interpretation
83
Technology adopted for CDM Projects
Table 5.2: Technology adopted for CDM Projects
Particulars Solar Wind
Technology adopted for CDM Projects 11 11
Figure 5.1: Technology adopted for CDM Projects
Interpretation:
From the above table, it is interpreted that out of 22 organisations, 11 organisations used wind
technology and 11 organisations used solar technology.
Carbon credit can be deployment of corporate social responsibility
Table 5.3: Deployment of corporate social responsibility
Particular No Yes
Deployment of CSR 4 18
If Yes, than degree of deployment of Corporate Social Responsibility
Table 5.4: Degree of deployment of Corporate Social Responsibility
Particular Very
Low Low Neutral High
Very
High
Degree of deployment of CSR 0 1 3 13 1

Data Analysis and Interpretation
84
Figure 5.2: Degree of deployment of corporate social responsibility
Interpretation:
From the above table, it can be interpreted that out of 22 organisations, 18 organisations agree
upon deployment of corporate social responsibility. From 18 organisations, 14 organisations
said that the degree of deployment of CSR is high. So CDM Projects is affecting CSR.
Aspects considered for CDM Projects by energy sector organisations
Table 5.5: Aspects considered for CDM Projects
Aspects considered for CDM
Projects
Strongly
Disagree
(1)
Disagree(2) Neutral
(3) Agree (4)
Strongly
Agree (5)
Weighted
Average
Reduce Pollution level 0 2 4 7 9
0 4 12 28 45 17.8
Eco Friendly 0 1 1 1 19
0 2 3 4 95 20.8
Positive Impact on Human
Well Being 0 1 2 3 16
0 2 6 12 80 20
Does not make Environment
Safe 16 5 0 1 0
1 10 0 4 0 3

Data Analysis and Interpretation
85
Sound Technology 0 2 2 4 14
0 4 6 16 70 19.2
Technology affect Positive on
Company 0 0 3 7 12
0 0 9 28 60 19.4
Technology help in
development of Economy 0 1 7 8 6
0 2 21 32 30 17
Upgradation of Technology 1 3 5 11 2
1 6 15 44 10 15
PDD is Real 1 0 3 6 12
1 0 9 24 60 18.8
Proper Methodology for CER 0 1 2 3 16
0 2 6 12 80 20
Create Employability 1 1 3 5 12
1 2 9 20 60 18.4
Reduce Poverty 1 3 6 7 5
1 6 18 28 25 15.6
Improve Quality of Life 0 4 4 7 7
0 8 12 28 35 16.6
Attract add. Investment 0 2 2 12 6
0 4 6 48 30 17.6
Clear Time Span 0 0 2 8 12
0 0 6 32 60 19.6
Clear Baseline 0 0 1 10 11
0 0 3 40 55 19.6
Impact on Resource
Sustainability 0 3 4 10 5

Data Analysis and Interpretation
86
0 6 12 40 25 16.6
Precise Baseline 0 2 3 6 11
0 4 9 24 55 18.4
Transparent Projects Need 0 2 0 8 12
0 4 0 32 60 19.2
Comparable Projects Need 0 0 10 5 7
0 0 30 20 35 17
Feasibility of the Projects
Workable 0 0 2 6 14
0 0 6 24 70 20
Avoid Overestimation 1 0 2 8 11
0 0 6 32 55 18.6
Methodology of Baseline is
Homogeneous 0 3 1 10 8
0 6 3 40 40 17.8
Reliable Baseline 0 0 2 10 10
0 0 6 40 50 19.2
Define Potential Error 0 1 0 10 11
0 2 0 40 55 18.4
Updated Baseline 0 0 5 7 10
0 0 15 28 50 18.6
Interpretation:
After taking weighted average of all the aspects considered by the energy sector organisations
for CDM Projects, the result reveals that eco-friendly, positive impact on Human well-being
and proper methodology of CER are playing vital role compare to other aspects considered by
the organisations for the CDM Projects.
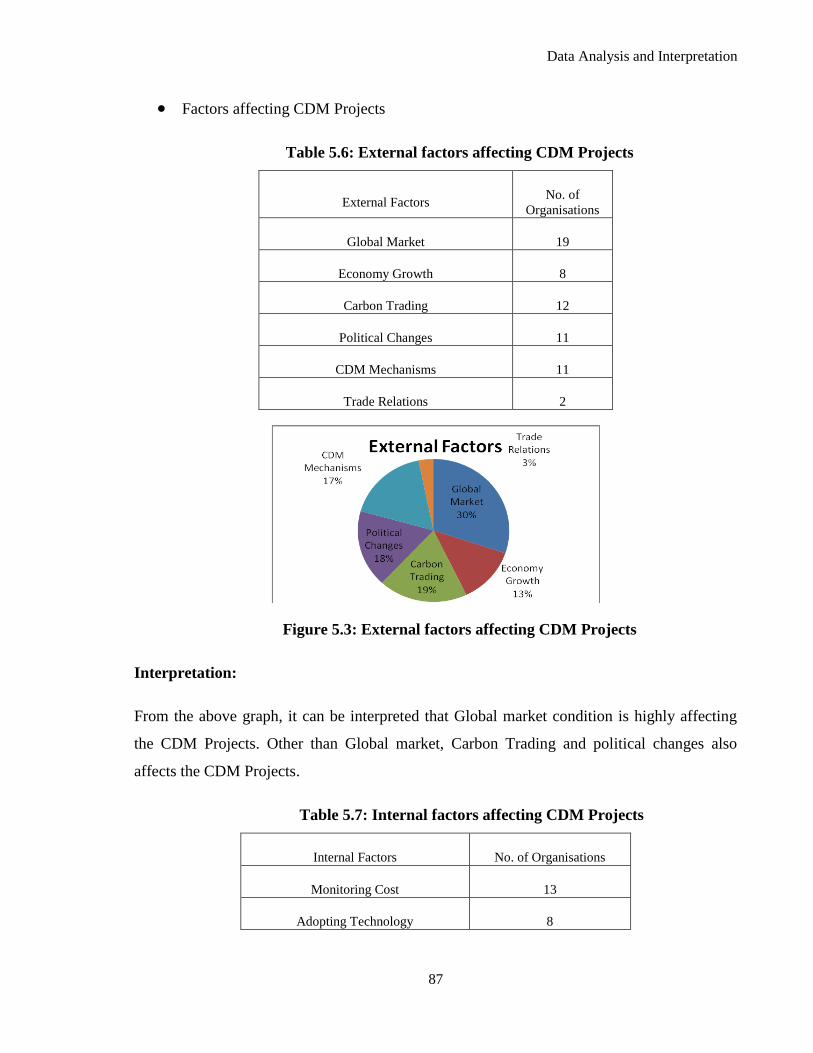
Data Analysis and Interpretation
87
Factors affecting CDM Projects
Table 5.6: External factors affecting CDM Projects
External Factors No. of
Organisations
Global Market 19
Economy Growth 8
Carbon Trading 12
Political Changes 11
CDM Mechanisms 11
Trade Relations 2
Figure 5.3: External factors affecting CDM Projects
Interpretation:
From the above graph, it can be interpreted that Global market condition is highly affecting
the CDM Projects. Other than Global market, Carbon Trading and political changes also
affects the CDM Projects.
Table 5.7: Internal factors affecting CDM Projects
Internal Factors No. of Organisations
Monitoring Cost 13
Adopting Technology 8

Data Analysis and Interpretation
88
HR Practices 1
Management 10
Others 1
Figure 5.4: Internal factors affecting CDM Projects
Interpretation:
From the above graph, it can be interpreted that monitoring cost of the CDM Projects is
highly affecting the CDM Projects which is 40%. Other than monitoring cost, management
and technology also affects the CDM Projects.
Barriers faced by the energy sector organisation for the CDM Projects
Table 5.8: Barriers faced by the organisation for the CDM Projects
Barriers No. of Organisations
Technological 7
Institutional 6
Governance 3
Co-operation 1
Others 14
Total 31

Data Analysis and Interpretation
89
Figure 5.5: Barriers faced by the energy sector organisations
Interpretation:
From the above graph, the result reveals that other barriers is contributing high and in others
the respondent focuses on financial barriers. Technological berries is also affecting CDM
Projects. Impact of CDM Projects on energy sector organisations.
Table 5.9: Impact of CDM Projects on energy sector organisations
Impact of CDM Projects Very Low Low Neutral High Very High
Administration 3 5 10 3 1
Operations 1 2 9 8 2
Finance 0 0 4 14 4
Human Resource 1 3 11 7 0
Technology 1 2 8 7 4
Marketing 2 5 8 6 1
Management 0 1 9 11 1
Stakeholder 0 0 5 15 2
Competitors 3 4 8 7 0
Economy 0 2 7 7 6

Data Analysis and Interpretation
90
Interpretation:
The above data shows that the CDM Projects has an impact on financial aspect, management
aspects and stakeholders of the energy sector organisation.
Risk involved in CDM Projects
Table 5.10: Risk involve in CDM Projects
Risk involve in Projects at
different level
Low(Less than
20%)
Moderate (20 to
40%)
Medium (40 to
70%)
High (More
than 70%)
Planning Phase
Feasibility Risk 5 8 7 2
Permit/License Risk 6 6 6 4
Construction Phase
Time Over-run Risk 2 4 7 9
Capital Cost over-run Risk 1 6 12 3
Operation Phase
Technology Risk 7 4 8 3
Market Risk 6 3 5 8
Supply Risk 8 4 5 5
Operation Risk 8 3 5 6
Political/Legal Risk 6 4 6 6
Financial Risk 4 3 5 10
Counterparty Risk 5 3 8 6

Data Analysis and Interpretation
91
Interpretation:
There are different category of the risk involved in different stages of the CDM Projects life
cycle. Among all time over-run risk, capital cost over-run risk and financial risk had high
degree of the risk compare to other risk as per the response from energy organisations.
Mode of finance used for CDM Projects
Table 5.11: Mode of finance
Mode of Finance No
Internal 19
External 15
Table 5.12: Sources of Finance
Sources of Finance No
Grants 1
Loans 16
Equity 17
Other 4
Figure 5.6: Sources of Finance

Data Analysis and Interpretation
92
Interpretation:
From the above table, it can be interpreted that the organisations can deploy both the mode of
finance that is internal as well as external. Out of all the financial sources, most of the
organisations raise funds through equity and loans.
Carbon Trading for the CDM Projects
Table 5.13: Carbon trading
Particular Yes No Total
Carbon Trading 6 16 22
If Yes, than which modes used for carbon trading
Table 5.14: Modes used for carbon trading
Particular No. of Organisations
Spot 1
Future Contract 1
OTC 0
Forward Contract 4
Total 6
Figure 5.7: Modes used for carbon trading

Data Analysis and Interpretation
93
Interpretation:
From the above table, it can be interpreted that out of 22 organisations; only 6 organisations
had gone for carbon trading. Most of the organisations used forward contract as carbon
trading instrument.
Company profile
Table 5.15: Ownership structure of energy organisations
Particulars No. of Organisations
Public 4
Private 18
Total 22
Interpretation:
From the above table, it can be interpreted that out of 22 organisations; only 4 organisations
are from public sector and 18 organisations are from private sector.
Table 5.16: Age of the energy sector organisations
Particular Less than 5
years
5 to 10
years
10 to 15
years
More than 15
years Total
No of Years serve in Industry 9 6 3 4 22
Interpretation:
The above table shows that 15 organisations (more than 50% of samples) has less than 10
years of the life serves in the industry.
Table 5.17: Type of organisation based on investment
Particular Micro Small Medium Large Total
Type of org. based on Investment 0 2 1 19 22

Data Analysis and Interpretation
94
Interpretation:
The above table reveals that majority of the samples are belong to large scale organisation
based on investment.
Table 5.18: Number of registered CDM Projects
Number of registered
Projects 1 2 3 5 7 8 Total
Number of organisations 11 2 4 3 1 1 22
Interpretation:
The energy sector organisations have registered CDM Projects. From the samples, 11
organisations (50% of the samples) had registered single CDM Projects.
5.3 Cross-Tabulation
Technology and Ownership of energy organisations
Table 5.19: Technology and ownership of energy organisations
Particulars Public Private
Solar 0 11
Wind 4 7
Interpretation:
The result shows that out of the whole sample there are 11 private sector organisations which
have registered their CDM Projects for solar technology and there is no single public sector
organisation registered their Projects for solar technology. On the other hand, 7 private sector
organisations had registered their CDM Projects for wind technology and 4 public sector
organisations had also registered their CDM Projects for wind technology.

Data Analysis and Interpretation
95
Ownership of energy sector organisations and life of CDM Projects
Table 5.20: Ownership of energy sector organisations and life of CDM Projects
Particulars Phase I (1to 7years) Phase II (8to 14
years)
Phase III (15to 21
years)
Public 2 1 1
Private 6 8 4
Interpretation:
Out of 22 energy organizations, 17 organizations has registered the CDM Projects for less
than 14 years. Only 5 energy organisations has registered CDM Projects for more than 14
years.
Ownership of energy organisations and type of energy organisations based on
investment
Table 5.21: Ownership of organisations and type of organisations based on investment
Particulars Micro Small Medium Large
Public 0 0 0 4
Private 0 2 1 15
Interpretation:
Out of 22 organisations, 19 organisations are large scale based on investment (4 public and 15
private).
Ownership of energy organisations and age of energy organisations
Table 5.22: Ownership of energy organisations and age of energy organisations
Particulars Less than 5 years 5 to 10 years 10 to 15 years More than 15
years
Public 0 0 2 2
Private 9 6 1 2

Data Analysis and Interpretation
96
Interpretation:
All the public sector organisations have more than 10 years of age in the industry. From the
private sector, majority have less than 5years of age in the industry.
Technology and estimated carbon emission reduction p.a.
Table 5.23: Technology and estimated CER p.a.
Particulars
Estimated Carbon Emission Reduction p.a.
Less than 50000 50001 to 100000 More than 100000
Solar 8 1 2
Wind 4 6 1
Interpretation:
In solar technology, majority of the energy organisations estimate less than 50000 CER p.a...
On the other hand, in wind technology organisations have registered less than 100000 CER
p.a. that shows that in wind organisations have better opportunity to generate more CER p.a.
5.4 Descriptive Analysis
Different aspects considered for CDM Projects by energy organisations
Table 5.24: Aspects considered for CDM Projects
N Minimum Maximum Mean Std. Deviation
Reduce pollution 22 2.00 5.00 4.0455 .99892
Eco friendly 22 2.00 5.00 4.7273 .76730
Positive impact on Human
wellbeing 22 2.00 5.00 4.5455 .85786
Does not make environment safe 22 1.00 4.00 1.3636 .72673
Sound Technology 22 2.00 5.00 4.3636 1.00216
Technology affect positive on
Company 22 3.00 5.00 4.4091 .73414

Data Analysis and Interpretation
97
Technology help development of
Economy 22 2.00 5.00 3.8636 .88884
Upgradation of Technology 22 1.00 5.00 3.4545 1.01076
PDD is Real 22 1.00 5.00 4.2727 1.03196
Proper Methodology for
measurement 22 2.00 5.00 4.5455 .85786
Create Employability 22 1.00 5.00 4.1818 1.13961
Reduce Poverty 22 1.00 5.00 3.5455 1.14340
Improve Quality of Life 22 2.00 5.00 3.7727 1.10978
Attract additional Investment 22 2.00 5.00 4.0000 .87287
Clear Timespan 22 3.00 5.00 4.4545 .67098
Clear Baseline 22 3.00 5.00 4.4545 .59580
Impact on resource Sustainability 22 2.00 5.00 3.7727 .97257
Precise Baseline 22 2.00 5.00 4.1818 1.00647
Transparent Projects 22 2.00 5.00 4.3636 .90214
Comparable Projects 22 3.00 5.00 3.8636 .88884
Feasibility of the Projects 22 3.00 5.00 4.5455 .67098
Avoid Overestimation 22 1.00 5.00 4.2727 .98473
Homogeneous Baseline 22 2.00 5.00 4.0455 .99892
Reliable Baseline 22 3.00 5.00 4.3636 .65795
Potential Error 22 2.00 5.00 4.4091 .73414
Updated Baseline 22 3.00 5.00 4.2273 .81251
Valid N (list wise) 22
Interpretation:
From the above table, all the aspects considered by the organisation for the CDM Projects has
mean score higher than 2.5. From all the aspects, the Projects feasibility, the Projects should
be eco-friendly, proper methodology as well as reliable baseline have mean score of 4.54,

Data Analysis and Interpretation
98
4.72, 4.54 and 4.36 respectively. Out of that all four aspects, the minimum deviation is 0.65
and 0.67 for feasibility of the Projects and reliable baseline.
Risk level associated with the CDM Projects
Table 5.25: Risk level associated with the CDM Projects
N Minimum Maximum Mean Std. Deviation
Feasibility Risk 22 1.00 4.00 2.2727 .93513
License Risk 22 1.00 4.00 2.3636 1.09307
Time Over run Risk 22 1.00 4.00 3.0455 .99892
Capital Cost Overrun Risk 22 1.00 4.00 2.7727 .75162
Technology Risk 22 1.00 4.00 2.3182 1.08612
Market Risk 22 1.00 4.00 2.6818 1.24924
Supply Risk 22 1.00 4.00 2.3182 1.21052
Operation Risk 22 1.00 4.00 2.4091 1.25960
Legal Risk 22 1.00 4.00 2.5455 1.18431
Financial Risk 22 1.00 4.00 2.9545 1.17422
Counterparty Risk 22 1.00 4.00 2.6818 1.12911
Valid N (list wise) 22
Interpretation:
From the above table, the risk associated with the CDM Projects are playing vital role. Time
over run risk has highest mean score that is 3.045, second highest mean score is 2.95 for
financial Risk, and the third highest mean score is 2.77 for capital cost over-run risk. Out of
the all the three Risk, capital cost over-run risk has lowest standard deviation that 0.75. So it
can be interpreted that capital cost over-run risk and time over-run risk has highest impact on
CDM Projects.

Data Analysis and Interpretation
99
Impact of CDM Projects on energy organisations
Table 5.26: Impact of CDM Projects
Particulars N Minimum Maximum Mean Std. Deviation
Administration 22 1.00 5.00 2.7273 1.03196
Operations 22 1.00 5.00 3.3636 .95346
Finance 22 3.00 5.00 4.0000 .61721
Human Resource 22 1.00 4.00 3.0909 .81118
Technology 22 1.00 5.00 3.5000 1.05785
Marketing 22 1.00 5.00 2.9545 1.04550
Management 22 2.00 5.00 3.5455 .67098
Stakeholders 22 3.00 5.00 3.8636 .56023
Competitors 22 1.00 4.00 2.8636 1.03719
Economy 22 2.00 5.00 3.7727 .97257
Valid N (list wise) 22
Interpretation:
From the above table, the impact of CDM Projects on the different aspects of organisation as
well as economy of country is considered for the study. The mean score for the finance,
stakeholder and economy is 4.00, 3.86 and 3.77 respectively. So it can be said that finance,
stakeholder and economy has higher impact compare to other aspects. Out of these three
aspects, stakeholder has lowest standard deviation that is 0.56 followed by finance that is
0.617.

Data Analysis and Interpretation
100
5.5 Reliability Test
Cronbach alpha reliability test was conducted to check fitness of questionnaire.
Table 5.27: Reliability Test
Cronbach's Alpha Cronbach's alpha based on standardized items
.869 .857
Interpretation:
Value of Cronbach alpha value as exhibited by table is 0.857 which is more than 0.75.
Therefore the reliability of the data can be said to be good.
5.6 Hypothesis Testing
5.6.1 Kruskal-Wallis Test
H1 0: There is no significant difference in factors affecting the CDM Projects for different
time span of the Projects.
H1 A: There is a significant difference in factors affecting the CDM Projects for different
time span of the Projects.
Table 5.28: Mean rank of external factors and time span
Particular Time span N Mean Rank
External factors 1.0000
2.0000
3.0000
Total
8
9
5
22
6.50
13.72
15.50

Data Analysis and Interpretation
101
Table 5.29: Mean rank of internal factors and time span
Particular Time span N Mean Rank
Internal Factors 1.0000
2.0000
3.0000
Total
8
9
5
22
11.25
12.83
9.50
Table 5.30: Kruskal-Wallis Test- Factors affecting the CDM Projects and time span of
the Projects
Sr. No. Factors affecting the CDM Projects Sig. value
1 External Factors 0.018
2 Internal Factors 0.550
Interpretation:
Above table shows the significant value for the external factors and internal factors such as
0.018 and 0.550 respectively. In the case of external factors, the significant value is less than
0.05 so null hypothesis is rejected. For the internal factors, the significant value is higher than
0.05 so null hypothesis is not rejected. Therefore it can be interpreted that there is a difference
for external factors (global market, political changes and trade relations) among different time
span of the CDM Projects and rest of the factors does not have difference in terms of time
span of the Projects.
H2 0: There is no significant difference in barriers affecting the CDM Projects for different
time span of the Projects.
H2 A: There is a significant difference in barriers affecting the CDM Projects for different
time span of the Projects.

Data Analysis and Interpretation
102
Table 5.31: Mean rank of barriers affecting the CDM Projects and time span
Time Span N Mean Rank
Barriers affecting the CDM Projects 1.0000 8 10.94
2.0000 9 13.94
3.0000 5 8.00
Total 22
Table 5.32: Kruskal-Wallis Test- Barriers affecting the CDM Projects and time span of the
Projects
Barriers affecting the CDM Projects
Chi-Square 4.149
df 2
Asymp. Sig. .126
a. Kruskal Wallis Test
b. Grouping Variable: Time Span
Interpretation:
The above referred table shows the significant value for the barriers faced by the organisation
which are higher than 0.05. It means that Null Hypothesis is not rejected. It can be interpreted
that there is no difference for the barriers faced by the organization among different time span
of the CDM Projects.
H3 0: There is no significant difference in aspects considered for the CDM Projects among
Age of the Energy Organisations.
H3 A: There is a significant difference in aspects considered for the CDM Projects among
Age of the Energy Organisations.

Data Analysis and Interpretation
103
Table 5.33: Kruskal-Wallis Test- Aspects considered for the CDM Projects among age
of the energy sector organisations
Sr.
No.
Statements Sig.
value
1 I believe that pollution level of the environment get reduced because of the CDM Projects. 0.844
2 The Projects is ecofriendly according to me. 0.827
3 The Projects has positive impact on human wellbeing. 0.149
4 I believe that the CDM Projects does not make the environment a safer place. 0.510
5 I believe that the company has adopted/used sound technology. 0.426
6 The technology adopted for the CDM Projects has affected the company positively. 0.787
7 The technology adopted for CDM Projects shall help in the development of the Economy. 0.978
8 According to me, the technology adopted for the CDM Projects has affected in the
upgradation of the technology base.
0.454
9 I believe that the emission level mention in the PDD is real. 0.399
10 The measurement of the CER followed by the proper methodology. 0.084
11 According to me, the Projects will able to create employability. 0.766
12 I believe that the Projects helps in reduces poverty. 0.180
13 The Projects helps in the improvement of the quality of life. 0.105
14 I believe that the Projects attract the addition investment in the economy. 0.752
15 According to me, the time span of the Projects needs to be clear. 0.682
16 The baseline of the Projects has been cleared. 0.510
17 I believe that the Projects has an impact on the resource sustainability. 0.628
18 The baseline of the Projects is precise according to me. 0.435
19 According to me, the Projects needs to be transparent. 0.392
20 The Projects needs to be comparable. 0.091
21 I believe that the feasibility of the Projects needs to be workable. 0.293
22 The Projects has avoided overestimation. 0.033
23 According to me, the methodology to decide baseline is homogeneous. 0.347

Data Analysis and Interpretation
104
24 I believe that the baseline needs to reliable for the Projects feasibility. 0.210
25 The Projects has well defined the potential errors. 0.025
26 I believe that the updated baseline needs to be clear. 0.105
Overall result of aspects considered by organisations 0.263
Interpretation:
From the above table, it can be understood that the significant value for the aspects considered
by the organization is higher than 0.05 except overestimation and potential error such as 0.033
and 0.025 respectively. So in case of the majority of the aspects considered by the
organisation, null hypothesis is not rejected. It can be interpreted that there is no difference for
aspects considered by the organization for the CDM Projects among life of the organisation
except overestimation and the potential error.
H4 0: There is no significant difference in aspects considered for the CDM Projects for
different classification of organisation based on Investment.
H4 A: There is significant difference in aspects considered for the CDM Projects for different
classification of organisation based on Investment.
Table 5.34: Kruskal-Wallis Test- aspects considered for the CDM Projects for different
classification of organisation based on investment
Sr. No. Statements Sig. value
1 I believe that pollution level of the environment get reduced because of the CDM
Projects. 0.815
2 The Projects is ecofriendly according to me. 0.771
3 The Projects has positive impact on human wellbeing. 0.546
4 I believe that the CDM Projects does not make the environment a safer place. 0.235
5 I believe that the company has adopted/used sound technology. 0.761
6 The technology adopted for the CDM Projects has affected the company positively. 0.731

Data Analysis and Interpretation
105
7 The technology adopted for CDM Projects shall help in the development of the
Economy. 0.335
8 According to me, the technology adopted for the CDM Projects has affected in the
upgradation of the technology base. 0.237
9 I believe that the emission level mention in the PDD is real. 0.672
10 The measurement of the CER followed by the proper methodology. 0.746
11 According to me, the Projects will able to create employability. 0.256
12 I believe that the Projects helps in reduces poverty. 0.696
13 The Projects helps in the improvement of the quality of life. 0.989
14 I believe that the Projects attract the addition investment in the economy. 0.672
15 According to me, the time span of the Projects needs to be clear. 0.272
16 The baseline of the Projects has been cleared. 0.203
17 I believe that the Projects has an impact on the resource sustainability. 0.500
18 The baseline of the Projects is precise according to me. 0.600
19 According to me, the Projects needs to be transparent. 0.272
20 The Projects needs to be comparable. 0.218
21 I believe that the feasibility of the Projects needs to be workable. 0.742
22 The Projects has avoided overestimation. 0.615
23 According to me, the methodology to decide baseline is homogeneous. 0.385
24 I believe that the baseline needs to reliable for the Projects feasibility. 0.547
25 The Projects has well defined the potential errors. 0.613
26 I believe that the updated baseline needs to be clear. 0.526
Overall result of aspects considered by organisations 0.623
Interpretation:
From the above table, it can be interpreted that the significant value for the aspects considered
by the organization for CDM Projects are higher than 0.05. It means that null hypothesis is

Data Analysis and Interpretation
106
not rejected for all the aspects. It can be interpreted that there is no difference among aspects
considered by the organisation with the classification of organisation based on investment.
H5 0: There is no significant difference in barriers faced by the organisation among different
classification of organisations based on investment.
H5 A: There is a significant difference in barriers faced by the organisation among different
classification of organisations based on investment.
Table 5.35: Mean rank of barriers faced by the organisation among
different classification of organisations based on investment
Classification of organisation based
on investment N Mean Rank
Barriers faced by the
organisation
2.0000 2 8.00
3.0000 1 8.00
4.0000 19 12.05
Total 22
Table 5.36: Kruskal-Wallis Test- barriers faced by the organisation
among different classification of organisations based on investment
Barriers faced by the Organisations
Chi-Square 1.502
df 2
Asymp. Sig. .472
a. Kruskal Wallis Test
b. Grouping Variable: Type of Organisation based on Investment
Interpretation:
From the above table, it can be interpreted that the significant value for the barriers faced by
the organisation for CDM Projects (0.472) which is higher than 0.05. It means that null
hypothesis is not rejected for the barriers faced by the organisation. So it can be interpreted
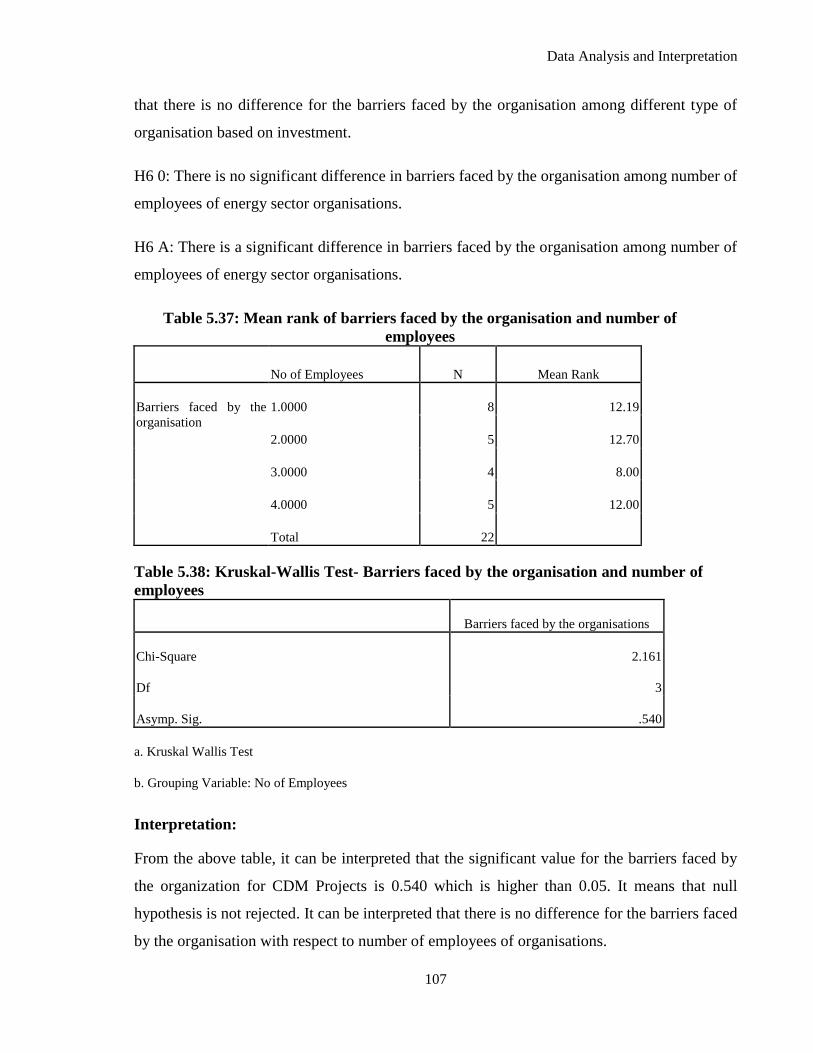
Data Analysis and Interpretation
107
that there is no difference for the barriers faced by the organisation among different type of
organisation based on investment.
H6 0: There is no significant difference in barriers faced by the organisation among number of
employees of energy sector organisations.
H6 A: There is a significant difference in barriers faced by the organisation among number of
employees of energy sector organisations.
Table 5.37: Mean rank of barriers faced by the organisation and number of
employees
No of Employees N Mean Rank
Barriers faced by the
organisation
1.0000 8 12.19
2.0000 5 12.70
3.0000 4 8.00
4.0000 5 12.00
Total 22
Table 5.38: Kruskal-Wallis Test- Barriers faced by the organisation and number of
employees
Barriers faced by the organisations
Chi-Square 2.161
Df 3
Asymp. Sig. .540
a. Kruskal Wallis Test
b. Grouping Variable: No of Employees
Interpretation:
From the above table, it can be interpreted that the significant value for the barriers faced by
the organization for CDM Projects is 0.540 which is higher than 0.05. It means that null
hypothesis is not rejected. It can be interpreted that there is no difference for the barriers faced
by the organisation with respect to number of employees of organisations.

Data Analysis and Interpretation
108
H7 0: There is no significant difference in carbon trading among different age of energy
sector organisations.
H7 A: There is a significant difference in carbon trading among different age of energy sector
organisations.
Table 5.39: Mean Rank of carbon trading among different age group of energy
organisations
No of years serves in industry N Mean Rank
Carbon trading 1.00000 9 9.72
2.00000 6 10.33
3.00000 3 12.17
4.00000 4 16.75
Total 22
Table 5.40: Kruskal-Wallis Test- Carbon trading and age group of energy
organisations
Carbon trading
Chi-Square 5.894
df 3
Asymp. Sig. .117
a. Kruskal Wallis Test
b. Grouping Variable: No of years serves in Industry
Interpretation:
From the above result, it can be understood that the significant value for the carbon trading for
CDM Projects is 0.117 which is higher than 0.05. So null hypothesis is not rejected. Therefore
it can be said that there is no difference for the carbon trading among age of energy sector
organisation.

Data Analysis and Interpretation
109
H8 0: There is no significant difference in carbon trading among different classification of
organisation based on investment.
H8 A: There is a significant difference for carbon trading among different classification of
organisation based on investment.
Table 5.41: Mean rank of carbon trading among type of organisation based
on investment
Type of Organisation
based on Investment N Mean Rank
Carbon trading 2.0000 2 8.50
3.0000 1 19.50
4.0000 19 11.39
Total 22
Table 5.42: Kruskal-Wallis Test- Carbon trading among type of organisation based
on investment
Carbon trading
Chi-Square 3.270
Df 2
Asymp. Sig. .195
a. Kruskal Wallis Test
b. Grouping Variable: Type of Organisation based on Investment
Interpretation:
From the above table, it can be interpreted that the significant value for the carbon trading for
CDM Projects is 0.195 which is higher than 0.05. It means that null hypothesis is not rejected.
It can be interpreted that there is no difference for the carbon trading among different type of
organisation based on investment.
H9 0: Impact of CDM Projects does not differ significantly with number of registered CDM
Projects by energy sector organisation.

Data Analysis and Interpretation
110
H9 A: Impact of CDM Projects does differ significantly with number of registered CDM
Projects by energy sector organisation.
Table 5.43: Kruskal-Wallis Test- Impact of CDM Projects and number of CDM Projects
Sr. No. Impact of CDM Projects Sig value
1 Administration 0.837
2 Operations 0.198
3 Finance 0.494
4 Human Resource 0.667
5 Technology 0.182
6 Marketing 0.112
7 Management 0.522
8 Stakeholder 0.376
9 Competitors 0.382
10 Economy 0.192
Overall result of impact of CDM Projects 0.192
Interpretation:
From the above table, it can be referred that the significant value for the impact of CDM
Projects on organisation is higher than 0.05. It means that null hypothesis is not rejected. So it
can be interpreted that impact of CDM Projects does not differ on various parameters of
energy organisation with respect to total number of registered CDM Projects.
H10 0: Impact of CDM Projects does not differ significantly on various parameters of energy
sector organization with respect to number of employees.
H10 A: Impact of CDM Projects does differ significantly on various parameters of Energy
Organization with respect to number of employees.

Data Analysis and Interpretation
111
Table 5.44: Kruskal-Wallis Test- Impact of CDM Projects and number of employees
Sr. No. Impact of CDM Projects Sig value
1 Administration 0.039
2 Operations 0.199
3 Finance 0.758
4 Human Resource 0.733
5 Technology 0.970
6 Marketing 0.554
7 Management 0.384
8 Stakeholder 0.201
9 Competitors 0.905
10 Economy 0.381
Overall result of impact of CDM Projects 0.396
Interpretation:
From the above table, it can be interpreted that the significant value for the impact of CDM
Projects on organisation administrative part is 0.039 which is less than 0.05. It means that null
hypothesis is rejected. The result revealed that there is significant difference between impact
of CDM Projects on organisation and number of employees but only administrative part, other
parameters does not have any difference with size of organisation based on employees.
H11 0: Impact of CDM Projects does not differ significantly of energy sector organization
with respect to age of them.
H11 A: Impact of CDM Projects does differ significantly of energy sector organization with
respect to age of them.

Data Analysis and Interpretation
112
Table 5.45: Kruskal-Wallis Test- Impact of CDM Projects and age of energy
organisations
Sr. No. Impact of CDM Projects Sig. value
1 Administration 0.207
2 Operations 0.386
3 Finance 0.814
4 Human Resource 0.422
5 Technology 0.708
6 Marketing 0.875
7 Management 0.685
8 Stakeholder 0.689
9 Competitors 0.441
10 Economy 0.216
Overall result of impact of CDM Projects 0.568
Interpretation:
From the above table, it can be identified that the significant value for the impact of CDM
Projects on organisation is higher than 0.05. It means that null hypothesis is not rejected. It
can be interpreted that impact of CDM Projects does not differ on various parameters of
energy organization with respect to age of energy organisations.
5.6.2 Chi-Square Tests
H12 0: Time span of the Projects and risk associated with the registered CDM Projects is
independent.
H12 A: Time span of the Projects and risk associated with the registered CDM Projects is
dependent.

Data Analysis and Interpretation
113
Table 5.46: Chi-square Test- Time span of the Projects and risk associated with the
registered CDM Projects
Sr. No. Risk associated with registered CDM Projects Sig. value
1 Feasibility Risk 0.755
2 License Risk 0.200
3 Time Over-run Risk 0.089
4 Capital Cost Over-run Risk 0.045
5 Technology Risk 0.063
6 Market Risk 0.850
7 Supply Risk 0.682
8 Operation Risk 0.107
9 Legal Risk 0.261
10 Financial Risk 0.155
11 Counter Party Risk 0.427
Overall result of risk associated with CDM Projects 0.048
Interpretation:
The above referred table shows the significant value for the risk associated with registered
CDM Projects is 0.048 which are less than 0.05. It means that null hypothesis is rejected. It
can be interpreted that time span of the Projects and risk associated with the registered CDM
Projects are dependent. From the above table, all the risk associated with the registered CDM
Projects does not have individual difference except capital cost over-run risk.
H13 0: Deployment of CSR and age of the energy sector organisations are independent.
H13 A: Deployment of CSR and age of the energy sector organisations are dependent.

Data Analysis and Interpretation
114
Table 5.47: Chi-square Test- Deployment of CSR and age of the energy organisations
Value df Asymp. Sig. (2-sided)
Pearson Chi-Square 4.821 3 .185
Likelihood Ratio 5.782 3 .123
Linear-by-Linear Association .618 1 .432
N of Valid Cases 22
Interpretation:
From the above table, it can be interpreted from the significant value is 0.185 which is higher
than 0.05 therefore null hypothesis is not rejected. Deployment of corporate social
responsibility (CSR) through registered CDM Projects and age of the energy sector
organisations are independent.
H14 0: Energy sector organisations gone for carbon trading and number of registered CDM
Projects are independent.
H14 A: Energy sector organisations gone for carbon trading and number of registered CDM
Projects are dependent.
Table 5.48: Chi-square Test- Carbon trading and number of registered CDM Projects
Value Df Asymp. Sig. (2-sided)
Pearson Chi-Square 3.858 5 .570
Likelihood Ratio 4.573 5 .470
Linear-by-Linear Association .304 1 .581
N of Valid Cases 22

Data Analysis and Interpretation
115
Interpretation:
The significant value of result is 0.570 which is higher than 0.05 therefore null hypothesis is
not rejected. So energy sector organisation gone for carbon trading and number of registered
CDM Projects are independent to each other. It has been identified that the organisations
which had registered CDM Projects does not necessary to go for carbon trading.
H15 0: Energy sector organisations gone for carbon trading and estimated carbon emission
reduction p.a. are independent.
H15 A: Energy sector organisations gone for carbon trading and estimated carbon emission
reduction p.a. are dependent.
Table 5.49: Chi-square Test- Carbon trading and estimated CER p.a.
Value df Asymp. Sig. (2-sided)
Pearson Chi-Square 3.034 2 .219
Likelihood Ratio 2.774 2 .250
Linear-by-Linear Association 2.562 1 .109
N of Valid Cases 22
Interpretation:
The significant value is 0.219 which is higher than 0.05. So Null Hypothesis is not rejected.
The result of the test shows that energy sector organisations gone for carbon trading and
estimated carbon emission reduction p.a. are independent to each other. It means that
estimated carbon emission reduction p.a. and the organisation gone for carbon trading do not
have dependency to each other.
H16 0: Energy sector organisations gone for carbon trading and ownership structure of
organisations are independent.
H16 A: Energy sector organisations gone for carbon trading and ownership structure of
organisations are dependent.

Data Analysis and Interpretation
116
Table 5.50: Chi-square Test- Carbon trading and ownership structure of energy sector
organisations
Value df
Asymp. Sig. (2-
sided) Exact Sig. (2-sided)
Exact Sig. (1-
sided)
Pearson Chi-Square .013 1 .910
Continuity Correctionb .000 1 1.000
Likelihood Ratio .013 1 .910
Fisher's Exact Test 1.000 .708
Linear-by-Linear Association .012 1 .912
N of Valid Cases 22
Interpretation:
From the above table, it can be interpreted that the significant value of energy sector
organisations gone for carbon trading is 0.910 which is higher than 0.05. It means that null
hypothesis is not rejected. The result stipulates that organisations gone for carbon trading and
ownership structure of organisations are independent.
H17 0: Estimated CER p.a. by energy sector organisation and technology adopted for CDM
Projects are independent.
H17 A: Estimated CER p.a. by energy sector organisation and technology adopted for CDM
Projects are dependent.
Table 5.51: Chi-square Test- Estimated CER p.a. by energy sector organisation and
technology adopted for CDM Projects
Value df Asymp. Sig. (2-sided)
Pearson Chi-Square 5.238 2 .043
Likelihood Ratio 5.661 2 .059
Linear-by-Linear Association .759 1 .384
N of Valid Cases 22

Data Analysis and Interpretation
117
Interpretation:
The result of the test shows that the significant value is 0.043 which is less than 0.05. Null
hypothesis is rejected. From the above table, it can be interpreted that estimated CER p.a. by
energy sector organisation and technology adopted for CDM Projects are dependent. It can be
understood that estimated CER p.a. by energy sector organisation and technology adopted for
CDM Projects are inter-related.
5.6.3 Mann-Whitney U Test
H18 0: Impact of CDM Projects does not differ significantly with respect to ownership
structure of energy sector organisations.
H18 A: Impact of CDM Projects does differ significantly with respect to ownership structure
of energy sector organisations.
Table 5.52: Mann-Whitney U Test- Impact of CDM Projects and ownership structure of
energy organisations
Public and
Private N Mean Rank Sum of Ranks
Sig.
Administration 1.00 4 8.50 34.00 0.279
2.00 18 12.17 219.00
Total 22
Operations 1.00 4 13.50 54.00 0.469
2.00 18 11.06 199.00
Total 22
Finance 1.00 4 11.50 46.00 1.000
2.00 18 11.50 207.00
Total 22
Human Resource 1.00 4 14.50 58.00 0.266
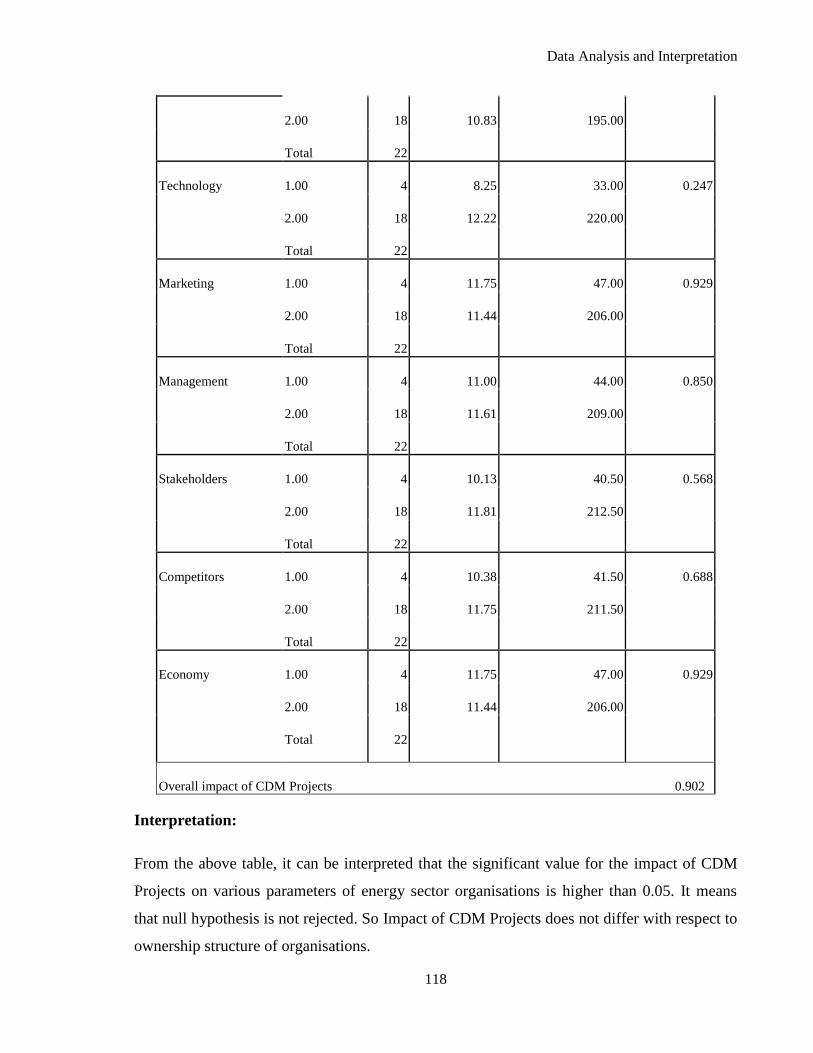
Data Analysis and Interpretation
118
2.00 18 10.83 195.00
Total 22
Technology 1.00 4 8.25 33.00 0.247
2.00 18 12.22 220.00
Total 22
Marketing 1.00 4 11.75 47.00 0.929
2.00 18 11.44 206.00
Total 22
Management 1.00 4 11.00 44.00 0.850
2.00 18 11.61 209.00
Total 22
Stakeholders 1.00 4 10.13 40.50 0.568
2.00 18 11.81 212.50
Total 22
Competitors 1.00 4 10.38 41.50 0.688
2.00 18 11.75 211.50
Total 22
Economy 1.00 4 11.75 47.00 0.929
2.00 18 11.44 206.00
Total 22
Overall impact of CDM Projects 0.902
Interpretation:
From the above table, it can be interpreted that the significant value for the impact of CDM
Projects on various parameters of energy sector organisations is higher than 0.05. It means
that null hypothesis is not rejected. So Impact of CDM Projects does not differ with respect to
ownership structure of organisations.

Data Analysis and Interpretation
119
H19 0: Aspects considered for CDM Projects does not differ significantly with respect to
ownership structure of energy sector organisation.
H19 A: Aspects considered for CDM Projects does differ significantly with respect to
ownership structure of energy sector organisation.
Table 5.53: Mann-Whitney U Test- Aspects considered for CDM Projects and
ownership structure of energy organisation
Sr.
No. Statements
Sig.
value
1 I believe that pollution level of the environment get reduced because of the CDM Projects. 0.685
2 The Projects is eco friendly according to me. 0.476
3 The Projects has positive impact on human wellbeing. 0.786
4 I believe that the CDM Projects does not make the environment a safer place. 0.870
5 I believe that the company has adopted/used sound technology. 0.692
6 The technology adopted for the CDM Projects has affected the company positively. 0.602
7 The technology adopted for CDM Projects shall help in the development of the Economy. 0.720
8 According to me, the technology adopted for the CDM Projects has affected in the
upgradation of the technology base. 0.199
9 I believe that the emission level mention in the PDD is real. 0.851
10 The measurement of the CER followed by the proper methodology. 0.192
11 According to me, the Projects will able to create employability. 0.925
12 I believe that the Projects helps in reduces poverty. 0.428
13 The Projects helps in the improvement of the quality of life. 0.232
14 I believe that the Projects attract the addition investment in the economy. 0.638
15 According to me, the time span of the Projects needs to be clear. 0.338
16 The baseline of the Projects has been cleared. 0.268
17 I believe that the Projects has an impact on the resource sustainability. 0.086

Data Analysis and Interpretation
120
18 The baseline of the Projects is precise according to me. 0.645
19 According to me, the Projects needs to be transparent. 1.000
20 The Projects needs to be comparable. 0.336
21 I believe that the feasibility of the Projects needs to be workable. 0.109
22 The Projects has avoided overestimation. 0.575
23 According to me, the methodology to decide baseline is homogeneous. 0.358
24 I believe that the baseline needs to reliable for the Projects feasibility. 0.186
25 The Projects has well defined the potential errors. 0.268
26 I believe that the updated baseline needs to be clear. 0.521
Overall aspects considered for CDM Projects 0.538
Interpretation:
The result of the data reveals that the significant value for the various aspects considered by
the organisations is higher than 0.05 that means null hypothesis is not rejected. It can be
interpreted that aspects considered for the CDM Projects does not differ significantly with the
ownership structure of energy sector organisations.
H20 0: Barriers faced by the organisations does not differ significantly with the ownership
structure of energy sector organisations.
H20 A: Barriers faced by the organisations does differ significantly with the ownership
structure of energy sector organisations.
Table 5.54: Mann-Whitney U Test-Barriers faced by the energy organisations and
ownership structure of organisations
Technological Institutional Governance Cooperation Other
Mann-Whitney U 33.000 35.000 30.000 34.000 31.000
Wilcoxon W 43.000 45.000 40.000 44.000 202.000
Z -.316 -.110 -.858 -.471 -.510

Data Analysis and Interpretation
121
Asymp. Sig. (2-tailed) .752 .912 .391 .637 .610
Exact Sig. [2*(1-tailed Sig.)] .837a .967a .652a .902a .712a
a. Not corrected for ties.
Interpretation:
From the above table, it can be interpreted that the significant value for the barriers faced by
the organisations for CDM Projects are higher than 0.05. It means that null hypothesis is not
rejected. So it can be identifies that barriers faced by the organisations does not differ with the
ownership structure of energy sector organisations and all the barriers faced by the energy
organisations and ownership structure of the organisation are negatively correlated.
H21 0: Factors affecting registered CDM Projects does not differ significantly with the
ownership structure of energy sector organisations.
H21 A: Factors affecting registered CDM Projects does differ significantly with the
ownership structure of energy sector organisations.
Table 5.55: Mann-Whitney U Test-Factors affecting CDM Projects and ownership
structure of organisations
Public and Private N Mean Rank Sum of Ranks Sig.
External
Factors
1.00 4 13.00 52.00
2.00 18 11.17 201.00 0.391
Total 22
External
Factors
1.00 4 7.50 30.00
2.00 18 12.39 223.00 0.102
Total 22
External
Factors
1.00 4 8.25 33.00
2.00 18 12.22 220.00 0.200
Total 22
External 1.00 4 11.50 46.00

Data Analysis and Interpretation
122
Factors
2.00 18 11.50 207.00 1.000
Total 22
External
Factors
1.00 4 8.75 35.00
2.00 18 12.11 218.00 0.280
Total 22
External
Factors
1.00 4 10.50 42.00
2.00 18 11.72 211.00 0.495
Total 22
Internal
Factors
1.00 4 16.00 64.00
2.00 18 10.50 189.00 0.072
Total 22
Internal
Factors
1.00 4 10.25 41.00
2.00 18 11.78 212.00 0.610
Total 22
Internal
Factors
1.00 4 11.00 44.00
2.00 18 11.61 209.00 0.637
Total 22
Internal
Factors
1.00 4 12.00 48.00
2.00 18 11.39 205.00 0.844
Total 22
Internal
Factors
1.00 4 13.75 55.00 0.034
2.00 18 11.00 198.00
Total 22
Overall result of External/ Internal
factors affecting CDM Projects 0.195/0.042

Data Analysis and Interpretation
123
Interpretation:
From the above table, it can be interpreted that the overall significant value for internal and
external factors affecting the CDM Projects are 0.195/0.042. It means that null hypothesis is
not rejected except internal factors. In the individual factors results not all the internal factors
only finance as internal factor has difference with ownership structure of organisations. So it
can be identified that various factors affecting registered CDM Projects does not differ with
the ownership structure of energy sector organisations who had registered and implement the
Projects in Gujarat.
H22 0: Risk associated with registered CDM Projects does not differ significantly with the
ownership structure of energy sector organisations.
H22 A: Risk associated with registered CDM Projects does differ significantly with the
ownership structure of energy sector organisations.
Table 5.56: Mann-Whitney U Test- Risk level associated with registered CDM Projects
and ownership structure of energy organisations
Public and Private Sum of Ranks Sig.
Feasibility Risk
1.00 4 6.25 25.00
2.00 18 12.67 228.00 0.061
Total 22
License Risk
1.00 4 9.25 37.00
2.00 18 12.00 216.00 0.428
Total 22
Time Overrun Risk
1.00 4 14.00 56.00
2.00 18 10.94 197.00 0.368
Total 22
Capital Cost Overrun Risk
1.00 4 11.25 45.00
2.00 18 11.56 208.00 0.925
Total 22

Data Analysis and Interpretation
124
Technology Risk
1.00 4 6.75 27.00
2.00 18 12.56 226.00 0.091
Total 22
Market Risk
1.00 4 11.00 44.00
2.00 18 11.61 209.00 0.859
Total 22
Supply Risk
1.00 4 4.50 18.00
2.00 18 13.06 235.00 0.013
Total 22
Operation Risk
1.00 4 5.88 23.50
2.00 18 12.75 229.50 0.046
Total 22
Legal Risk
1.00 4 11.25 45.00
2.00 18 11.56 208.00 0.930
Total 22
Financial Risk
1.00 4 10.88 43.50
2.00 18 11.64 209.50 0.821
Total 22
Counterparty Risk
1.00 4 7.75 31.00
2.00 18 12.33 222.00 0.183
Total 22
Overall result of risk associated with CDM
Projects 0.118
Interpretation:
From the above table, it can be interpreted that the significant value of the risk level
associated with different phase of CDM Projects is higher than 0.05 except supply risk and
operation risk. It means that null hypothesis is not rejected for the rest of the risk level. It can

Data Analysis and Interpretation
125
be identified that risk level associated with registered CDM Projects does not differ with the
ownership structure of energy sector organisations except supply risk and operation risk.
H23 0: Deployment of corporate social responsibility through CDM Projects does not differ
significantly with the ownership structure of energy sector organisations.
H23 A: Deployment of corporate social responsibility through CDM Projects does differ
significantly with the ownership structure of energy sector organisations.
Table 5.57: Mann-Whitney U Test- Deployment of CSR and ownership structure of
organisations
Deployment of CSR
Mann-Whitney U 28.000
Wilcoxon W 199.000
Z -1.018
Asymp. Sig. (2-tailed) .309
Exact Sig. [2*(1-tailed Sig.)] .538b
a. Grouping Variable: Public and Private
Interpretation:
The test of the result shows that the significant value for the deployment of CSR through
CDM Projects is higher than 0.05. It means that null hypothesis is not rejected. It can be
interpreted that deployment of corporate social responsibility through CDM Projects does not
differ with the ownership structure of energy sector organisations as well as both the
parameters are negatively correlated.
H24 0: There is no significant difference in number of registered CDM Projects among
public/private organisations.
H24 A: There is a significant difference in number of registered CDM Projects among
public/private organisations.

Data Analysis and Interpretation
126
Table 5.58: Mann-Whitney U Test- number of registered CDM Projects and ownership
structure of organisations
No of Register Projects
Mann-Whitney U 30.000
Wilcoxon W 40.000
Z -.548
Asymp. Sig. (2-tailed) .583
Exact Sig. [2*(1-tailed Sig.)] .652a
Interpretation:
From the above table, it can be interpreted that the significant value for number of registered
CDM Projects is higher than 0.05. From the result, it can be interpreted that there is no
difference for number of registered CDM Projects among public/private organisations.
H25 0: Impact of CDM Projects on energy sector organisations does not differ significantly
with the technology adopted for the CDM Projects.
H25 A: Impact of CDM Projects on energy sector organisations does differ significantly with
the technology adopted for the CDM Projects.
Table 5.59: Mann-Whitney U Test- Impact of CDM Projects and technology
Technology N Mean Rank Sum of Ranks Sig.
Administration 2.00 11 13.73 151.00 0.088
3.00 11 9.27 102.00
Total 22
Operations 2.00 11 9.45 104.00 0.116
3.00 11 13.55 149.00
Total 22

Data Analysis and Interpretation
127
Technology N Mean Rank Sum of Ranks Sig.
Finance 2.00 11 9.05 99.50 0.038
3.00 11 13.95 153.50
Total 22
Human Resource 2.00 11 10.18 112.00 0.299
3.00 11 12.82 141.00
Total 22
Technology 2.00 11 10.82 119.00 0.607
3.00 11 12.18 134.00
Total 22
Marketing 2.00 11 10.36 114.00 0.392
3.00 11 12.64 139.00
Total 22
Management 2.00 11 10.64 117.00 0.488
3.00 11 12.36 136.00
Total 22
Stakeholders 2.00 11 11.95 131.50 0.689
3.00 11 11.05 121.50
Total 22
Competitors 2.00 11 10.59 116.50 0.492
3.00 11 12.41 136.50
Total 22
Economy 2.00 11 12.18 134.00 0.607
3.00 11 10.82 119.00
Total 22
Overall impact of CDM Projects 0.243

Data Analysis and Interpretation
128
Interpretation:
The result reveals that impact of CDM Projects on various parameters of energy sector
organisations does not have difference with the technology adopted for the CDM Projects.
The significant value for all the parameters is higher than 0.05 except finance parameter. So
null hypothesis is not rejected for various parameters except finance. Registered CDM
Projects has impact on the finance part of the energy sector organisations.
H26 0: Aspects considered for the CDM Projects by organisations does not differ
significantly with the technology adopted for the CDM Projects.
H26 A: Aspects considered for the CDM Projects by organisations does differ significantly
with the technology adopted for the CDM Projects.
Table 5.60: Mann-Whitney U Test- Aspects considered for the CDM Projects and
technology
Sr.
No. Statements
Sig.
value
1 I believe that pollution level of the environment get reduced because of the CDM Projects. 0.155
2 The Projects is eco friendly according to me. 0.621
3 The Projects has positive impact on human wellbeing. 0.240
4 I believe that the CDM Projects does not make the environment a safer place. 0.899
5 I believe that the company has adopted/used sound technology. 0.168
6 The technology adopted for the CDM Projects has affected the company positively. 0.380
7 The technology adopted for CDM Projects shall help in the development of the Economy. 0.254
8 According to me, the technology adopted for the CDM Projects has affected in the
upgradation of the technology base. 0.040
9 I believe that the emission level mention in the PDD is real. 0.167
10 The measurement of the CER followed by the proper methodology. 0.049
11 According to me, the Projects will able to create employability. 0.857

Data Analysis and Interpretation
129
12 I believe that the Projects helps in reduces poverty. 0.359
13 The Projects helps in the improvement of the quality of life. 0.207
14 I believe that the Projects attract the addition investment in the economy. 0.014
15 According to me, the time span of the Projects needs to be clear. 0.712
16 The baseline of the Projects has been cleared. 0.170
17 I believe that the Projects has an impact on the resource sustainability. 0.254
18 The baseline of the Projects is precise according to me. 0.337
19 According to me, the Projects needs to be transparent. 0.712
20 The Projects needs to be comparable. 0.832
21 I believe that the feasibility of the Projects needs to be workable. 0.280
22 The Projects has avoided overestimation. 0.248
23 According to me, the methodology to decide baseline is homogeneous. 0.547
24 I believe that the baseline needs to reliable for the Projects feasibility. 0.058
25 The Projects has well defined the potential errors. 0.031
26 I believe that the updated baseline needs to be clear. 0.417
Overall aspects considered for CDM Projects 0.076
Interpretation:
From the above table, it can be identify that the significance value of the aspects considered
for the CDM Projects is higher than 0.05 except potential error, resource sustainability,
additional investment, and proper methodology and updated technology. It means that null
hypothesis is not rejected for rest of the aspects. It can be interpreted that there is no
difference for the aspects considered for the CDM Projects by energy organisations with the
technology adopted for the CDM Projects. Only few aspects that are updated technology,
proper methodology, additional investment, resource sustainability and potential error.

Data Analysis and Interpretation
130
H27 0: Barriers faced by the energy sector organisations does not differ significantly with the
technology adopted for the CDM Projects.
H27 A: Barriers faced by the energy sector organisations does differ significantly with the
technology adopted for the CDM Projects.
Table 5.61: Mann-Whitney U Test- Barriers faced by the energy organisations and
technology
Technological Institutional Governance Cooperation Other
Mann-Whitney U 55.000 38.500 55.000 55.000 38.500
Wilcoxon W 121.000 104.500 121.000 121.000 104.500
Z -.447 -1.871 -.607 -1.000 -1.732
Asymp. Sig. (2-tailed) .655 .061 .544 .317 .083
Exact Sig. [2*(1-tailed Sig.)] .748a .151a .748a .748a .151a
Interpretation:
From the above table, it can be interpreted that the significance value for barriers faced by the
energy sector organisations is higher than 0.05. It means that null hypothesis is not rejected. It
can be interpreted that barriers faced by the organisations does not differ with the technology
adopted for the CDM Projects.
H28 0: Factors affecting registered CDM Projects does not differ significantly with the
technology adopted for the CDM Projects by organisations.
H28 A: Factors affecting registered CDM Projects does differ significantly with the
technology adopted for the CDM Projects by organisations.

Data Analysis and Interpretation
131
Table 5.62: Mann-Whitney U Test- Factors affecting CDM Projects and technology
Methodology Used N Mean Rank Sum of Ranks Sig.
External Factors
2.00 11 11.00 121.00
3.00 11 12.00 132.00 0.544
Total 22
External Factors
2.00 11 11.50 126.50
3.00 11 11.50 126.50 1.000
Total 22
External Factors
2.00 11 11.50 126.50
3.00 11 11.50 126.50 1.000
Total 22
External Factors
2.00 11 11.00 121.00
3.00 11 12.00 132.00 0.677
Total 22
External Factors
2.00 11 10.00 110.00
3.00 11 13.00 143.00 0.211
Total 22
External Factors
2.00 11 10.50 115.50
3.00 11 12.50 137.50 0.147
Total 22
Internal Factors
2.00 11 11.00 121.00
3.00 11 12.00 132.00 0.672
Total 22
Internal Factors
2.00 11 10.50 115.50
3.00 11 12.50 137.50 0.386
Total 22
Internal Factors
2.00 11 12.00 132.00
3.00 11 11.00 121.00 0.317

Data Analysis and Interpretation
132
Total 22
Internal Factors
2.00 11 11.50 126.50
3.00 11 11.50 126.50 1.000
Total 22
Internal Factors
2.00 11 11.00 121.00
3.00 11 12.00 132.00 0.317
Total 22
Overall External/ Internal factors affecting
CDM Projects 0.438/ 0.217
Interpretation:
From the above table, it can be interpreted that the significance value of various factors
affecting CDM Projects is higher than 0.05. It means that null hypothesis is not rejected. It
can be identified that factors affecting the registered CDM Projects does not differ with the
technology adopted for the CDM Projects.
H29 0: Risk associated with registered CDM Projects does not differ significantly with the
technology adopted by organisations.
H29 A: Risk associated with registered CDM Projects does differ significantly with the
technology adopted by energy sector organisations.
Table 5.63: Mann-Whitney U Test- Risk associated with CDM Projects and technology
Methodology Used N Mean Rank Sum of Ranks Sig.
Feasibility Risk
2.00 11 12.64 139.00
3.00 11 10.36 114.00 0.389
Total 22
License Risk
2.00 11 10.59 116.50
3.00 11 12.41 136.50 0.497

Data Analysis and Interpretation
133
Total 22
Time Overrun Risk
2.00 11 10.36 114.00
3.00 11 12.64 139.00 0.385
Total 22
Capital Cost Overrun Risk
2.00 11 12.09 133.00
3.00 11 10.91 120.00 0.637
Total 22
Technology Risk
2.00 11 11.27 124.00
3.00 11 11.73 129.00 0.864
Total 22
Market Risk
2.00 11 10.14 111.50
3.00 11 12.86 141.50 0.304
Total 22
Supply Risk
2.00 11 11.36 125.00
3.00 11 11.64 128.00 0.918
Total 22
Operation Risk
2.00 11 11.68 128.50
3.00 11 11.32 124.50 0.891
Total 22
Legal Risk
2.00 11 10.50 115.50
3.00 11 12.50 137.50 0.455
Total 22
Financial Risk
2.00 11 10.68 117.50
3.00 11 12.32 135.50 0.530
Total 22
Counterparty Risk
2.00 11 10.68 117.50
3.00 11 12.32 135.50 0.538

Data Analysis and Interpretation
134
Total 22
Overall risk associated with CDM Projects 0.847
Interpretation:
The test of the result shows that all the category of risk associated with CDM Projects does
not differ with the technology adopted by organisations. Because the significant value of all
the risk associated with the CDM Projects is higher than 0.05 which indicates that null
hypothesis is not rejected.
H30 0: Deployment of CSR through CDM Projects does not differ significantly with the
technology adopted by the energy sector organisations.
H30 A: Deployment of CSR through CDM Projects does differ significantly with the
technology adopted by the energy sector organisations.
Table 5.64: Mann-Whitney U Test- Deployment of CSR and technology
Deployment of CSR
Mann-Whitney U 49.500
Wilcoxon W 115.500
Z -1.080
Asymp. Sig. (2-tailed) .280
Exact Sig. [2*(1-tailed Sig.)] .478b
a. Grouping Variable: Methodology
b. Not corrected for ties.
Interpretation:
From the above table, it can be interpreted that the significance value of the result is higher
than 0.05. It means that null hypothesis is not rejected. It can be interpreted that deployment
of CSR through CDM Projects does not differ with technology adopted by the energy sector
organisations.
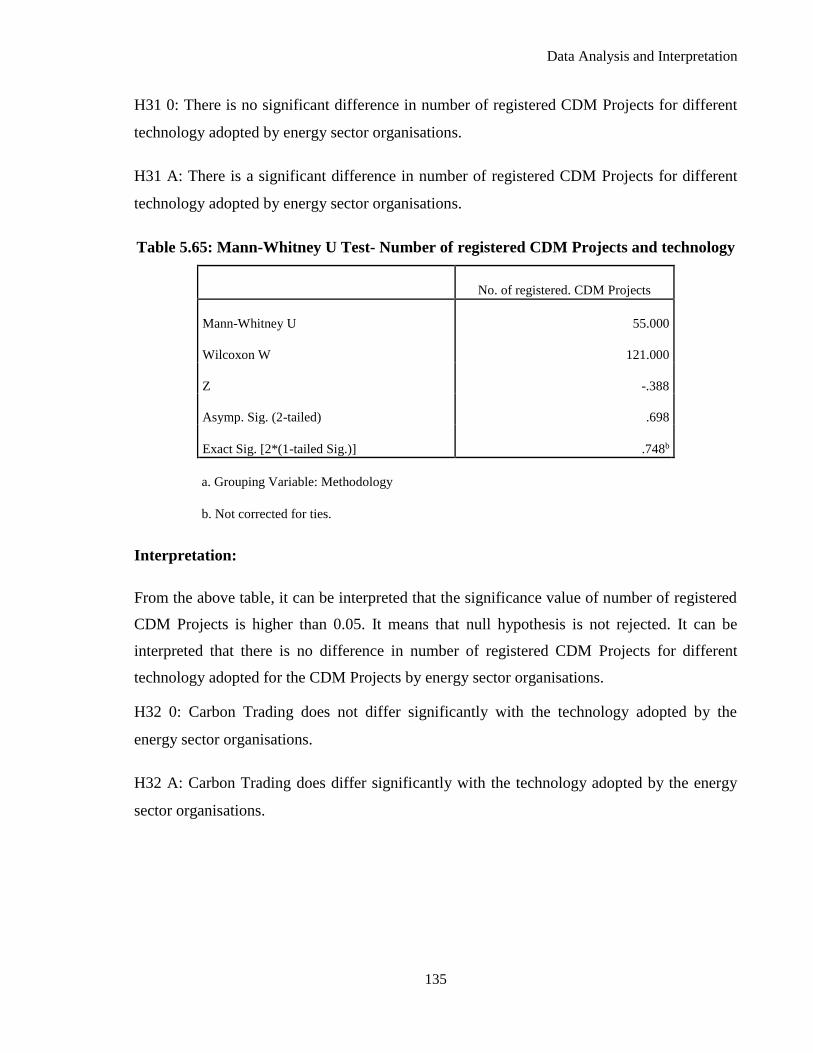
Data Analysis and Interpretation
135
H31 0: There is no significant difference in number of registered CDM Projects for different
technology adopted by energy sector organisations.
H31 A: There is a significant difference in number of registered CDM Projects for different
technology adopted by energy sector organisations.
Table 5.65: Mann-Whitney U Test- Number of registered CDM Projects and technology
No. of registered. CDM Projects
Mann-Whitney U 55.000
Wilcoxon W 121.000
Z -.388
Asymp. Sig. (2-tailed) .698
Exact Sig. [2*(1-tailed Sig.)] .748b
a. Grouping Variable: Methodology
b. Not corrected for ties.
Interpretation:
From the above table, it can be interpreted that the significance value of number of registered
CDM Projects is higher than 0.05. It means that null hypothesis is not rejected. It can be
interpreted that there is no difference in number of registered CDM Projects for different
technology adopted for the CDM Projects by energy sector organisations.
H32 0: Carbon Trading does not differ significantly with the technology adopted by the
energy sector organisations.
H32 A: Carbon Trading does differ significantly with the technology adopted by the energy
sector organisations.

Data Analysis and Interpretation
136
Table 5.66: Mann-Whitney U Test- Carbon trading and technology
Carbon Trading
Mann-Whitney U 49.500
Wilcoxon W 115.500
Z -.935
Asymp. Sig. (2-tailed) .350
Exact Sig. [2*(1-tailed Sig.)] .478a
a. Not corrected for ties.
b. Grouping Variable: Methodology
Interpretation:
From the above table, it can be interpreted that the significance value for the organisation
gone for Carbon Trading is higher than 0.05. It means that Null Hypothesis is not rejected. It
can be interpreted that Carbon Trading does not differ with the technology adopted by the
energy sector organisations.
H33 0: Estimated carbon emission reduction p.a. does not differ significantly with the
ownership structure of energy sector organisations.
H33 A: Estimated carbon emission reduction p.a. does differ significantly with the ownership
structure of energy sector organisations.
Table 5.67: Mann-Whitney U Test- Estimated CER p.a. and ownership structure of
energy sector organisations
CER p.a.
Mann-Whitney U 35.000
Wilcoxon W 45.000
Z -.095
Asymp. Sig. (2-tailed) .924
Exact Sig. [2*(1-tailed Sig.)] .967a

Data Analysis and Interpretation
137
Interpretation:
The test of the result reveals that estimated carbon emission reduction p.a. does not differ
significantly with the ownership structure of energy sector organisations. The significant
value of the test result is higher than 0.05 which means null hypothesis is not rejected.
H34 0: There is no significant difference for estimated CER p.a. and organisation gone for
carbon trading.
H34 A: There is a significant difference for estimated CER p.a. and organisation gone for
carbon trading.
Table 5.68: Mann-Whitney U Test- Estimated CER p.a. and carbon trading
CER p.a.
Mann-Whitney U 30.000
Wilcoxon W 166.000
Z -1.479
Asymp. Sig. (2-tailed) .139
Exact Sig. [2*(1-tailed Sig.)] .203a
a. Not corrected for ties.
b. Grouping Variable: Carbon Trading
Interpretation:
From the above table, it can be interpreted that the significance value of estimated CER p.a.
and organisation gone for carbon trading is higher than 0.05. It means that null hypothesis is
not rejected. It can be interpreted that there is no difference for CER p.a. and organisation
gone for carbon trading.

Data Analysis and Interpretation
138
5.7 Kyoto Protocol Phase II
CFR (2013) reported that climate change is one of the most significant threats facing the
world today. According to the American Meteorological Society, there is a 90 percent
probability that global temperatures will rise by 3.5 to 7.4 degrees Celsius (6.3 to 13.3 degrees
Fahrenheit) in less than one hundred years, with even greater increases over land and the
poles. These seemingly minor shifts in temperature could trigger widespread disasters in the
form of rising sea levels, violent and volatile weather patterns, desertification, famine, water
shortages, and other secondary effects including conflict. In November 2011, the International
Energy Agency warned that the world may be fast approaching a tipping point concerning
climate change, and suggested that the next five years will be crucial for greenhouse gas
reduction efforts. One way to reduce emissions would be to switch from fossil-fuel-based
power to alternative sources of energy, such as nuclear, solar, and wind.
At the launch of the United Nations Framework Convention on Climate Change seventeenth
Conference of Parties (COP-17) in Durban, South Africa, many climate change experts were
concerned that the Kyoto Protocol could expire in 2012 with no secondary legally binding
accord on limiting global emissions in place. This fear, however, was somewhat assuaged as
the nearly two hundred countries present at the COP-17 approved an extension of the protocol
through 2017 and potentially 2020.The limitations of the Durban Platform, as well as the
increasingly tenuous status of the Kyoto Protocol, have created a fresh imperative for global
action on climate change. The tension between developing and developed countries is fueled
by ongoing disagreements over how to interpret a fundamental underpinning of the UNFCCC
and Kyoto framework--namely, the principle of common but differentiated responsibilities
among industrialized (Annex I) and developing (non-Annex I) countries, particularly when it
comes to establishing and achieving meaningful mitigation targets. The international climate
regime is at its strongest when it comes to understanding the threats posed by climate change.
Such efforts, which are centered on the Intergovernmental Panel on Climate Change (IPCC),
predate any other dedicated element of the regime. Yet, the infiltration of politics into the
climate change debate has hampered the legitimacy and pervasiveness of new findings.
There was no urgent action to ensure that the global mean temperature does not rise beyond
the critical 2 degree Celsius above pre-industrial levels. There was little progress on green

Data Analysis and Interpretation
139
climate fund, technology transfer and capacity building issues. On the other hand, there was
considerable heated rhetoric indicative of new battle lines for future negotiations. The world
heaved a sign of relief that the Kyoto Protocol did not collapse and was extended for another
five years up to 2017. The stark reality is that CO2 emission reduction obligations for the first
commitment period of the Kyoto Protocol, which ends in 2012, have been breached by
Annexure I countries with impunity. Their emissions have increased and not reduced by five
per cent from the 1990 level as was agreed to in the Kyoto Protocol. It is doubtful whether
meaningful emissions reductions will emerge during the second commitment period of the
Kyoto Protocol (2012-2017).
The Doha Conference
At the UN’s annual climate change conference just concluded in Doha, 194 countries agreed
to an extension of the Kyoto Protocol through 2020. But the second phase still omits the
world’s two biggest greenhouse gas emitters – China and the United States. Governments
agreed to work toward a universal climate change agreement covering all countries from
2020, to be adopted by 2015, and to find ways to scale up efforts before 2020 beyond the
existing pledges to curb emissions. The extension of Kyoto will have various implications on
the future of carbon markets. EU, Australia and New Zealand had proposed varying level of
commitments at Cancun COP 16. The local carbon trading schemes of these countries allow
varying percentage of international offsets that will come through CDM. This provides a hope
for the ongoing CDM Projects to sell out the astronomical CERs produced to be sold out in
the market at competitive prices. There will be huge demand of international offsets under
Kyoto phase II periods whether it extends for 5 year up to 2017 or 8 years up to 2020.
Recognizing that developed countries are principally responsible for the current high levels of
GHG emissions in the atmosphere as a result of more than 150 years of industrial activity, the
Protocol places a heavier burden on developed nations under the principle of "common but
differentiated responsibilities."
During the first commitment period, 37 industrialized countries and the European Community
committed to reduce GHG emissions to an average of five percent against 1990 levels. During
the second commitment period, Parties committed to reduce GHG emissions by at least 18

Data Analysis and Interpretation
140
percent below 1990 levels in the eight-year period from 2013 to 2020; however, the
composition of Parties in the second commitment period is different from the first.
o Monitoring emission targets
Under the Protocol, countries' actual emissions have to be monitored and precise records have
to be kept of the trades carried out registry systems track and record transactions by Parties
under the mechanisms. The UN Climate Change Secretariat, based in Bonn, Germany, keeps
an international transaction log to verify that transactions are consistent with the rules of the
Protocol.
Adaptation
The Kyoto Protocol, like the Convention, is also designed to assist countries in adapting to the
adverse effects of climate change. It facilitates the development and deployment of
technologies that can help increase resilience to the impacts of climate change. The
Adaptation Fund was established to finance adaptation Projects and programs in developing
countries that are Parties to the Kyoto Protocol. In the first commitment period, the Fund was
financed mainly with a share of proceeds from CDM Projects activities. In Doha, in 2012, it
was decided that for the second commitment period, international emissions trading and joint
implementation would also provide the Adaptation Fund with a 2 percent share of proceeds.
Factors that affect the Kyoto Protocol
o Carbon Emission Targets: Carbon footprint of each nation (including imports and
excluding exports), the progress made under Kyoto looks extremely poor, with
Europe's savings reduced to just 1% from 1990 to 2008 and the developed world as a
whole seeing its emissions rise by 7% in the same period. It shows that the concept has
not taken seriously.
o Registrations Process: For the registration of CDM Projects, the organisation need to
go through with process and that process required more paper work and time
consuming.
Data Analysis and Interpretation
141
o Classification of Nations: Kyoto Protocol has classified the nations into two broad
categories Annexure I and Annexure II. Some of the countries argued that the
classification of the nations is not proper, that will be the reason for discontinue of the
some countries in Kyoto Protocol Phase II.
o Carbon Pricing: There was initial rush for registration CDM Projects and get carbon
credit, but it was only when number of applications from India were turned down and
facing problem. The mindset of Indian companies has changed dramatically. Earlier,
they were not even prepared to sell their carbon credit at 15 euros, and now they have
given open mandates to sell whenever the price comes to 4 euros.
o Economic Downturn: The global financial crisis and the resulting economic slowdown
may be assumed to have at least the benefit of also reducing environmental
degradation in the individual countries. There are some short-term benefits to the
global environment from the economic slowdown. Such benefits include reduction in
the rate of air and water pollution from reduced energy use - which has direct
implications for the urban poor’s health. Government action to support investment in
green growth measures, promoting direct investment or fiscal incentives for energy
efficiency and clean environment low-carbon technologies (Anbumozhi et al. 2010).
o Technology Transfer: Developed world started to limit emission of Greenhouse Gases,
but the question can be whether the current structure of CDM provides sufficient
incentives for technology transfer (Popp 2010).
India and Kyoto Protocol Phase II
India has taken a number of initiatives to reduce its GHG emissions; for instance, it has
announced that per-capita emission levels will not exceed the developed countries’ emission
levels. It also aims to reduce emission intensity of its Gross Domestic Production by 20-25
per cent of the 2005 level by 2020. India has also adopted the National Action Plan on
Climate Change, which includes both mitigation and adaptation measures. Several initiatives
have been taken to promote clean energy and energy efficiency in order to reduce the CO2

Data Analysis and Interpretation
142
emissions. The National Solar Mission intends to promote solar energy and the National
Mission on Energy Efficiency aims to enhance energy efficiency (ICWA, 2013).
The Doha outcomes have offered mixed success and failure for India. New Delhi had argued
for a meaningful and comprehensive outcome in the Kyoto Protocol and implementation of
Long-term Cooperative Action (LCA) tracks. However, several key concerns of India have
been implicitly and explicitly incorporated in the discussions at Doha meetings. India
successfully brought the Intellectual Property Rights matter into the climate change discourse.
The second commitment for emissions reduction under the Kyoto Protocol is elusive, but
developing countries including India have no binding obligation to reduce emissions by 2020.
India is of the view that clean technology should be declared as ‘global public goods’,
available to developing countries for free or affordable cost. The Doha Climate Platform
launched at the Doha conference neither offers hope for adequate sources of climate finance
nor technology transfer. India also advocated that the principle of equity is the mainstay of
global climate change regime, and categorically stated that any tinkering with the term
‘equity’ would not be acceptable to it.
To conclude, despite there being no significant changes or major breakthrough in international
negotiations on climate change to address the environmental and development challenges,
people’s awareness of the environmental challenges has been rising slowly across the world
and countries are taking initiatives to address these challenges. There is a need for
comprehensive and coordinated efforts at the global level for an effective and meaningful
transition towards a low-carbon economy. The international community should adopt clean
technologies, improve energy efficiency, and turn to more sustainable sources of energy and
modes of production and consumption without the economic growth. Unchecked climate
change could radically alter the prospects for growth and development in some of the poorest
countries. Millennium Development Goals for 2015 are unlikely to be achieved in many
regions of the world. Climate change can pose serious implications for the long-term
‘sustainability of development progress in the developing countries. This underlines the
urgency of strong and early action to reduce GHG emissions. The fact that the developing
countries are so far behind the advanced industrialized countries in energy consumption per
capita suggests that more widespread adoption of energy-saving techniques would be needed

Data Analysis and Interpretation
143
to prevent a significant increase in world-wide energy consumption and CO2 emissions
(ICWA, 2013). With around 17 percent of world population, one of fastest growing
economies of the world and the world’s fourth largest emitter of greenhouse gases, India has
become a crucial player in the climate change negotiations. Climate change issue underpins
almost all aspects of economy and society and has been intrinsically connected with global
trade, security, technology transfer, energy etc. India should enhance its diplomatic activities
with countries who share common concerns. Successful adaptation finely tuned with
mitigation holds the key for inclusive development and economic progress in the country. The
country’s expenditure on the adaptation programs has increased to 2.84 per cent during 2009-
10. Climate concerns and its related issues should be explicitly mainstreamed in India’s
energy and foreign policy (ICWA, 2013).
India and US signed a deal to enhance cooperation on cutting emissions and investing in low
carbon energy sources. India’s economy is currently heavily reliant on coal, and that’s
unlikely to change any time soon. Last year, almost 60 per cent of India’s installed power
plants were coal-based. Wind power currently accounts for about 70 per cent of India’s
renewable energy capacity, and the government wants to add 10,000 megawatts more each
year. Modi also wants to try and scale-up the solar power-driven economic revival he
instigated as Gujarat governor, adding 100 gigawatts nationwide by 2022. Over 800
million Indians use cook stoves that burn dung, wood, or other solid fuels to generate heat,
many of them in rural communities. As India’s population increases, demand for these fuels is
set to rise. The fuels used in the cook stoves release lots of particulate matter and greenhouse
gases, such as methane, contributing to air pollution, climate change and hundreds of
thousands of deaths each year. India’s government is trying to rollout a biogas cookstove
program to reduce the emissions from these stoves.(India’s Energy and Climate Change
Challenge)
Conference of Parties (COP- 21)
As International Energy Agency had focused on COP 21 in world energy outlook
2016. The major focus of Paris agreement is renewable energy sources. The broad
policy framework laydown by the National Environment Policy (2006) which was

Data Analysis and Interpretation
144
promotes sustainable development along with respect for ecological constraints and
the social justice.
UNFCCC has described about the steps taken for determined contribution. India
declared a voluntary goal of reducing the emission intensity of its GDP by 20-25% ,
over 2005 levels, by 2020. India has a definite plan of action for clean energy, energy
efficiency in various sectors of industries, steps to achieve lower emission intensity in
the automobile and transport sector, a major thrust to non-fossil based electricity
generation and a building sector based on energy conservation. The Indian Economy
has adopted strategies for carbon mitigation like clean and efficient energy system,
enhancing energy efficiency in industries, developing climate resilient urban centers,
promoting waste to wealth conversion and planned afforestation etc.

Findings and Suggestions
145
Chapter – 6
Findings and Suggestions
The alarm for global warming affect crop production, and cause sea levels to rise significantly
and this would adversely affect mankind as well as inhabitants on earth. Burning of fossil
fuels is a major source of industrial GHG emissions, especially from power, cement, steel,
textile, fertilizer industries. The major greenhouse gases emitted by these industries increases
the atmosphere's ability to trap infrared energy and thus affect the Climate. The United
Nations Framework Convention on Climate Change (UNFCCC) is an international
environmental treaty framed at United Nations Conference on Environment and Development
(UNCED), held in Rio de Janeiro in 1992. The treaty is aimed at reducing emissions of
greenhouse gases in order to combat Global Warming. It covers emission of the six main
greenhouse gases, namely: Carbon dioxide (CO2), Methane (CH4), Nitrous oxide (N2O),
Hydrofluorocarbons (HFCs), Perfluorocarbons (PFCs) and Sulphur hexafluoride (SF6). India
being a developing or “Non-Annex country” has no restrictions that needs to be followed with
regards to carbon emission i.e. there is no cap prescribed on how much carbon it can emit.
Various companies have already made a mark in this field by entering into carbon trade and
clean development mechanism Projects. They are deriving benefits in terms of better
technological knowledge and carbon trade profits.
The study has been carried out to study CDM Projects and different parameters of CDM
Projects. Although there are several articles that appear to express parameters considered for
CDM Projects. The research highlights the research gap identified from comprehensive
review of literature which shows that there is significant gap in the understanding of the

Findings and Suggestions
146
concept from the organisations point of view. An empirical study utilising structured
questionnaire was employed to survey energy sector organisations which had registered and
implement the CDM Projects in Gujarat. Furthermore the research attempted to provide
unique insights into the question raised in relation to barriers analysis of CDM Projects,
factors affecting CDM Projects, risk involved in CDM Projects, aspects considered for CDM
Projects, impact of CDM Projects, carbon trading and corporate social responsibility by using
non-parametric test with an understanding of the data normality and small sampling unit. In
this chapter, the findings of the empirical study discussed. The discussion focuses on the
result presented and analysed in the previous chapter.
6.1 Company Profile and CDM Projects
From the inferential statistics, the data has been classified as per technology adopted for CDM
Projects, ownership of energy sector organisations, classification of organisation based on
investment and number of years serves in industry. Out of all the technology, solar and wind
are the major used technologies by the energy sector organisation for CDM Projects in
Gujarat. From the data analysis, it shows that the whole sample distributed equally among
solar and wind technology (11-solar, 11-wind). The energy sector organisations categorised
into public and private. Out of 22 organisations, 18 organisations are private and 4
organisations belong to public sector. The life of the organisations in the industry varies from
less than 5 years to more than 15 years. 9 organisations have less than 5 years of life in the
industry. The organisations has categorised based on investment. Out of all, 19 organisations
belong to large scale organisations.
6.2 Barriers Analysis of CDM Projects
There is vast literature on the barriers which impede the transfer of climate technologies to
developing countries. As UNFCCC has described the guidelines to evaluate the additionality
of CDM Projects, there are different approaches for additionality assessment. The first step is
to apply barrier analysis. Barriers analysis addresses the barriers faced by the CDM Projects.
As part of the barrier analysis, Projects have to show that at least one alternative plan. The
literature emphasised that every Projects has different barriers such as technological barrier
for adopting and implementing technology, geographical barriers for the organisations outside
Gujarat and implement in Gujarat, financial barrier for Projects financing for more than 10

Findings and Suggestions
147
years, institutional barrier from management acceptance, governance barrier as guidelines and
government support for CDM Projects, alliance between countries and trade policies that act
as barrier relating to technology transfer as well as return of the CDM Projects. Out of all the
barriers, financial barriers, and technological barriers are highly faced by the energy sector
organisations as per the study. To check the significant differences for barriers faced by the
energy sector organisations, they have been categorised as organisation based on investment,
number of employees, ownership structure of energy sector organisations (public/private) and
technology adopted for CDM Projects. The result shows that there is no difference among all
the independent variables listed above. So it can be interpreted that barriers faced by energy
sector organisations are independent.
6.3 Factors Affecting CDM Projects
The factors categorised into two that internal as well as external factors. Out of all the external
factors, global market condition is highly affecting the CDM Projects. Monitoring cost of the
CDM Projects can be fluctuating so it affects the CDM Projects as internal factors. By
applying statistical tool to check difference for factors affecting CDM Projects with
independent variables such as time span of the Projects, ownership structure of organisations
(public/private) and technology adopted for CDM Projects. The result shows that there is
significant difference for external factors (global market, political changes and trade relations)
among different time span of the CDM Projects. Rest of the factors does not have difference
in terms of time span of the Projects. Various factors affecting registered CDM Projects does
not differ with the ownership structure of energy sector organisations except internal factor
that is financial factor. The technology adopted for CDM Projects does not affect the factors
considered for CDM Projects.
6.4 Risk Involved in CDM Projects
There are different types of risk involved in CDM Projects. The risk associated with CDM
Projects are categorized into major five heads such as: registration risk, performance risk,
counter party risk, market risk and country risk (ICAI, 2009). Projects sponsors will be
particularly concerned with the assessment of all the risk associated with CDM Projects.
Conventional Projects risks can be divided in terms of three phases in which they occur;

Findings and Suggestions
148
planning, construction and operation risks. The sponsors of the Projects will undertake their
own risk assessment early in the Projects planning process. The lenders will undertake their
risk assessment at a later stage, focusing on construction and operation phase risk. The risk
associated with CDM Projects can be measure on nominal scale or monetary terms. The
literature defined financial risk is highly involved with CDM Projects from the view point of
sponsors of the Projects. From the study, it can be identified that other than financial risk,
time over-run risk and operation risk are also associated with CDM Projects. The study also
reveals that capital cost over-run risk and financial risk involve in the CDM Projects as per
the respondent studied because of the estimated cost of the Projects gets increased. The
statistical analysis shows that time span of the Projects and risk associated with the registered
CDM Projects are dependent. Out of all risk, capital cost over-run risk and time over-run risk
has difference with the time span of the registered energy sector CDM Projects. To check the
significant differences for risk involved in CDM Projects, the statistical tool applied with
ownership structure of energy sector organisations (public/private) and technology adopted
for CDM Projects. The result of the data shows that the significant value of the risk level
associated with different phases of CDM Projects is higher than 0.05 except supply risk and
operation risk. It means that supply risk and operational risk have difference with the
ownership structure of energy sector organisations. Risk involved with CDM Projects does
not differ significantly with the technology adopted for CDM Projects.
6.5 Aspects Considered for CDM Projects
The validation serves as Projects design verification and is a requirement of all Projects. The
validation is an independent third party assessment of the Projects design. In particular, the
Projects's baseline, the monitoring plan (MP), and the Projects’s compliance with relevant
UNFCCC and host country criteria are validated in order to confirm that the Projects design,
as documented, is sound and reasonable, and meet the stated requirements and identified
criteria. Validation is a requirement for all CDM Projects and is necessary to provide
assurance to stakeholders of the quality of the Projects and its intended generation of certified
emission reductions (CERs). The CDM Projects should meet prescribed criteria for
registration as per NCDMA broadly named as: additionality, sustainable development
indicators and baselines. By taking the base of all the criteria’s, the questions have been
drafted for study. The study has covered all the criteria to analyse and identify most preferred

Findings and Suggestions
149
criteria by the energy sector organisations. There are various aspects considered for the CDM
Projects. From all the aspects, the CDM Projects needs to be eco friendly this criterion has the
highest mean score of 4.72. The study has also analysed difference of all the criteria with age
of energy sector organisations, classification of energy sector organisations based on
investment and ownership structure of energy sector organisations (public/private). From the
result, it can be interpreted that there is no difference for aspects considered by the energy
sector organisations for the CDM Projects among all the independent variables listed above
except certain criteria that are financial additionality(additionality), environmental well-being
and technological well-being (Sustainable development indicators), and overestimation and
the potential error (baselines). The research also found that out of all, these aspects play a
vital role that social well being, economic well being and environmental well being.
6.6 Impact of CDM Projects
When the organisations registered CDM Projects/s, there are certain areas where
organisations find changes. Out of all the parameters, one of the points is impact of CDM
Projects on organisations and other parameters. The organisations certain functions such as
finance, stakeholder and management functions affected by the Projects. The study has
analysed the difference for impact of CDM Projects on energy sector organisations with
respect to total number of registered Projects, number of employees, age of energy sector
organisations, ownership structure of organisation and technology adopted for the CDM
Projects. The output of the data reveals that impact of CDM Projects does not differ with total
number of registered Projects, the age of energy sector organizations, ownership structure of
energy sector organisations, and the technology adopted for the CDM Projects except finance
part. But there is difference for the impact of CDM Projects on organisations with number of
employees but only administrative part. Energy sector organisation adopts technology that
requires additional investment and for the implementation of technology, the organisation
required manpower. That why CDM Projects is affecting finance and administrative part.
Finally at the end management has impact of CDM Projects.

Findings and Suggestions
150
6.7 Carbon Trading
Carbon trading refers to the trading of emissions of six major greenhouse gases. It is a market-
based instrument. There are currently several national emissions trading systems being
planned or beginning to be implemented. These can be split up into those that are: (a) based
upon a 'cap and trade' model or (b) those operating as a 'baseline and credit' system. In a cap
and trade system, such as international emissions trading under the Kyoto Protocol or the US
CO2 emissions trading system, an overall limit or 'cap' is established for emission by
participants, and allowances equal to the overall cap are distributed. Participants may trade
any allowances above the amount they must hold for their particular emissions level. The
energy sector organisations registered their Projects but majority of the organisations does not
prefer to go for carbon trading because they had contract with the foreign party. Out of all the
samples studied, six organisations had gone for carbon trading and most of the organisations
prefer forward contract. The sampling organisations have different life span in the industry,
but it does not make any difference for the organisations gone for carbon trading. From the
data, it has been identified that organisations gone for carbon trading is independent form the
organisations category, type of organisation based on investment, estimated carbon emission
reduction p.a., ownership structure of energy organisations, number of registered CDM
Projects and technology adopted for CDM Projects. It has been identified that organisations
which had registered CDM Projects does not necessary to go for carbon trading.
6.8 Corporate Social Responsibility
Corporate social responsibility credit scheme: Given the subjective nature of industry, the
scheme should clearly identify what qualifies for credits. As in carbon credits, this can be
based on a barrier analysis. The barrier analysis should explain the activities that qualify for
the second category, as explained above. Also important is the methodology for quantifying
the credits, which may not be a simple calculation like in carbon credits. Quantifying CSR
credits is not going to be easy. It definitely needs to be based on the impact of the activity,
with clearly-identified indicators for success and there are methodologies available to evaluate
this. CDM Projects used as a tool for the corporate social responsibility. In data set, the result
also found the same relation and the degree for the deployment of corporate social

Findings and Suggestions
151
responsibility is high. The analysis has identified that majority of the organisation used carbon
credit as a tool for CSR. Deployment of corporate social responsibility (CSR) through
registered CDM Projects and age of the energy sector organisations are independent.
Deployment of corporate social responsibility through CDM Projects does not differ with the
ownership structure of energy sector organisations as well as both the parameters are
negatively correlated. The data revealed that deployment of CSR through CDM Projects does
not differ with the technology adopted by the energy sector organisations.
6.9 Suggestions
Suggestions to the governing body
India has potential to generate more carbon credit. Government body of India (NCDMA) has
increasingly being creating awareness in the market for the concept. Global market conditions
and trade relationship affects the CDM market so economy has to draft such a policy to
overcome from the factors. Government has to generate more source of carbon financing that
will help the organisation for better implementation of the CDM Projects.
Suggestions to the organisations
Various parameters affecting CDM Projects were studied. Analysis revealed that majority
organisation used two renewable sources: wind and solar. So still there is opportunity to
explore other renewable sources. CDM Projects has impact on administrative functions due to
availability of specialized manpower so companies can have manpower that help them for
better performance. Time over-run risk and capital risk are associated with CDM Projects
that shows that companies has to put their efforts to complete the CDM Projects within time
limit.

Conclusion and Scope for Future Research
152
Chapter – 7
Conclusion and Scope for Future Research
7.1 Conclusion
The current study deals with the energy sector organisations that had registered large scale
CDM Projects and implemented in Gujarat till 2012. (Kyoto Protocol Phase I). The study has
examined aspects considered for registration, factors affecting CDM projects, barriers faced
by organisation, risk involved in projects, impact on organisations, carbon trading and carbon
financing and corporate social responsibility.
There is various renewable energy sources used for the CDM Projects. The data shows that
solar and wind technologies are the major used technology by the organisations for CDM
Projects because of geographical location of Gujarat. Waste Management and biogas
technology can be used by the organisations and that is an opportunity available for
organisations. As per NCDMA, there are list of aspects to be considered by the organisation
for registration of the projects. Through study it has been identified that projects need to be
eco friendly, create employability and feasibility of the CDM Projects are vital aspects to be
considered. The findings further revealed that there are certain external and internal factors
affects the CDM Projects. In last few years, changes in the global economy has played a vital
role in implementing the projects as an external factor and lack of skilled manpower has
increased the monitoring cost is considered as an internal factor. The result of the study
indicate that there various risks involved in the CDM Project life cycle. Out of all the risks
associated with Projects, capital cost over-run risk, operational risk and supply risk were
found to be influencing the CDM Projects. CDM Projects also affects organisation functions.
Finance, Stakeholder and Management are most affected functions in organisation by CDM

Conclusion and Scope for Future Research
153
Projects. With perspective of no. of employees, only administrative function was analysed as
being affected. The major source for carbon financing used by the energy sector organisations
are equity and loans. The organisations which had registered CDM Projects do not necessary
to go for carbon trading because they had contract with the foreign Organisations. Some of
the organisations which had gone for carbon trading mostly prefer forward contract because
of carbon pricing fluctuations. As per the current trend, Corporate Social Responsibility has
given high priority by the Organisations and the study revealed that carbon credit play
positive role for the deployment of CSR. The degree for the deployment of CSR is high as per
the respondents of energy organisations.
Majority of the energy sector organisations had registered single Projects. By the discussion
with the representative of energy organisation, there are very less organisations who wish to
register other projects. This will affect the future of the Kyoto protocol phase II. The energy
organisations think that they were not able to get expected return from carbon pricing and
other hand the cost of the project is also increased. Till the carbon credit will not reach up to
proper pricing, there are less energy organisations who wish to register projects in near future.
7.2 Implications of the Study
The study presented various concepts that related to CDM Projects. The study contributes to
the society where the contemporary issue has been focused that help the society for better
understanding of the concept and decide the new strategy for delay the global warming. The
governing bodies also get some facts that help them for designing future strategies. It helps
for the organisations for better understanding and important criteria need to be focus. It also
derived the relation of CDM Projects and organisations functions. The research helps the
economy to understand the Annexure I and Annexure II classifications and Kyoto protocol
mechanisms defined by UNFCCC. It also presented the future potential of Kyoto protocol
phase II that will help the researcher for the further research.
7.3 Limitations and Direction for the Future Research
This section is not a long-period plan for future research; instead, it outlines some relevant
topics that will be investigated in the next few years, which are natural extensions of my
Conclusion and Scope for Future Research
154
current research. The current study has some of the limitations that are beyond the scope of
the current study which may affect the strength of findings. The study has focused primarily
on energy sector only in Gujarat with large scale Projects. The research can be extended by
covering all the CDM Projects of Gujarat and makes inter industry comparison. At the same
time, the study has covered only conceptual framework of India. The future research will be
done on cross-national comparison with the selected economic indicators. Kyoto protocol
phase II started after 2012 and it is not that much analysed so researcher can go for detailed
analysis of Kyoto protocol phase II. Carbon credit is treating as one of the commodity in the
market. Carbon credit pricing is always unpredictable so by analysed the pricing of carbon
credit, the research can be extended.

Bibliography
155
Bibliography
Research Papers
Agarwal, Parson (February, 2010), Energy Price Regulation in India: The Case of Natural Gas Sector.
USAEE-IAEE WP 10-040. Available at SSRN: http://ssrn.com/abstract=1548435.
Avi-Yonah, Reuven S. and Uhlmann, David M. (2009), Combating Global Climate Change: Why a
Carbon Tax is a Better Response to Global Warming than Cap and Trade. Stanford Environmental Law
Journal, Vol. 28, No. 3, 2009; U of Michigan Public Law Working Paper No. 117. Available at SSRN:
http://ssrn.com/abstract=1333673.
Barnwal and Tiwari (2008), Life cycle energy metrics and CO2 credit analysis of a hybrid
photovoltaic/thermal greenhouse dryer. Int. J. Low-Carbon Tech. Vol. 3 Issue 3, p203-220.s
B. Emily, C. Esteve and E. Manuel (2008), “UNFCCC negotiations (pre-Kyoto to COP-9): what the
process says about the politics of CDM-sinks”, Int Environ Agreements Vol. 8, p95–112.
Bernstein, P.M., Montgomery, W.D. & Tuladhar, S.D. (2006). Potential for reducing carbon emissions
from non-Annex B countries through changes in technology. Energy Economics, Vol. 28, Issue 5-6, p.
742-762.
Bharti Ajay and Saha Biswajit (2011), Carbon credit from composting of municipal solid waste.
International Journal of Environmental Technology & Management; Vol. 14 Issue 1-4, p203-219.
Bosello, Francesco and Roson, Roberto (July 1999), Carbon Emissions Trading and Equity in
International Agreements FEEM Working Paper No. 57.99. Available at SSRN:
http://ssrn.com/abstract=200623 or http://dx.doi.org/10.2139/ssrn.200623.
Boerger, Reik H., Cartea, Álvaro, Kiesel, Ruediger and Schindlmayr, Gero (January 2009), Cross-
Commodity Analysis and Applications to Risk Management (December 1, 2007). Journal of Futures
Markets, Vol. 29, No. 3. Available at SSRN: http://ssrn.com/abstract=981127
Bouvart and Prieur (2009), Comparison of Life Cycle GHG Emissions and Energy Consumption of
combined Electricity and H2 production pathways with CCS: Selection of technologies with Natural
Gas, Coal and Lignite as fuel for the European HYPOGEN program. Energy Procedia 1, p.3779–3786.
Cameron, James, Hobley, Anthony, Reid-Thomas, Duncan and Guli, Mina (April 8, 2002), Carbon
Contracts Cornerstones - Drafting Contracts for the Sale of Projects-Based Emissions Reductions. IETA
Discussion Paper No 02-01. Available at SSRN: http://ssrn.com/abstract=317559 or
http://dx.doi.org/10.2139/ssrn.317559.
Chaklader, Barnali (January 24, 2010), Spot and Future Prices of Carbon Emission Reduction Trading
of NCDEX India: An Econometric Study. Available at SSRN: http://ssrn.com/abstract=1541636.

Bibliography
156
C. Oscar, H. Robyn, W. Russell (2008), ‘Carbon-accounting methods and reforestation incentives’ The
Australian Journal of Agricultural and Resource Economics, Vol.47 Issue 2, p.153–179.
Deodhar, Vinay, Michaelowa, Axel and Krey, Matthias (September 2003), Financing Structures for
CDM Projects in India and Capacity Building Options for EU-Indo Collaboration. HWWA Discussion
Paper No. 247. Available at SSRN: http://ssrn.com/abstract=452400 or
http://dx.doi.org/10.2139/ssrn.452400.
Doran, Kevin L. and Ginnochio, Alaine (September 2007), United States Climate Policy: Using
Market-Based Strategies to Achieve Greenhouse Gas Emission Reductions. U of Colorado Law Legal
Studies Research Paper No. 08-15. Available at SSRN: http://ssrn.com/abstract=1015849.
E. Christian (2007), The Making of the EU Emissions Trading Scheme: Status, Prospects and
Implications for Business. European Management Journal Vol. 25, Issue 6, p.453–463, 2007.
F. David and S. Charlotte (2011), Legal Aspects of Carbon Trading: Kyoto, Copenhagen, and Beyond,
Journal of World Energy Law and Business, Vol. 4, No. 1, p. 88-90
G. L. Simon et al. (2012), “Win-win scenarios at the climate–development interface: Challenges and
opportunities for stove replacement programs through carbon finance”, Global Environmental Change
Vol.22, p.275–287.
Galinato, G. I. and Uchida, S. (2011), The Effect of Temporary Certified Emission Reductions on
Forest Rotations and Carbon Supply. Canadian Journal of Agricultural Economics/Revue canadienne
d'agroeconomie, Vol.59, p.145–164.
Guo, Zhu, Fan and Xie (2011), Evaluation of potential reductions in carbon emissions in Chinese
provinces based on environmental DEA. Energy Policy Volume 39 Issue 5, p.2352-2360.
H. Nathan et al. (2012), Carbon market risks and rewards: Firm perceptions of CDM investment
decisions in Brazil and India. Energy Policy 40, p.90–102.
Humbad, Kumar,and Babu (2009), “Carbon credits for energy self sufficiency in rural India – A case
study”, Energy Education Science and Technology Part A: Energy Science and Research, Volume 22
Issue 2, p.187-197
Hamilton, K, Sjardin, M, Peters-Stanley, M and Marcello, T, 2010, Building Bridges: State of the
Voluntary Carbon Markets 2010. Available from URL:
http://www.ecosystemmarketplace.com/pages/dynamic/resources.library.page.php?page_id=7585§i
on=our_publications&eod=1.
H. Lawrence L. (2009), Energy trade, carbon emissions and the WTO. Journal of World Energy Law &
Business, Vol. 2, Issue 3, p. 196-218.
Janelle Knox-Hayes (2009), “The developing carbon financial service industry: expertise, adaptation
and complementarity in London and New York”, Journal of Economic Geography 9, pp. 749–777.
Khurana, Inderjeet Singh and Michaelowa, Axel (August 2004), Indian Urban Building Sector: CDM
Potential through Energy Efficiency in Electricity Consumption. HWWA Discussion Paper No. 289.
Available at SSRN: http://ssrn.com/abstract=576001.
Krey and Riahi (2009), Implications of delayed participation and technology failure for the feasibility,
costs, and likelihood of staying below temperature targets—Greenhouse gas mitigation scenarios for the
21st century. Energy Economics 31, S94–S106.

Bibliography
157
Ladaniwskyj, Adrian John (October 30, 2008), Price Dynamics in the European Carbon Market.
Available at SSRN: http://ssrn.com/abstract=1494092.
Mizrach, Bruce (December 14, 2010), Integration of the Global Carbon Markets. Available at SSRN:
http://ssrn.com/abstract=1542871.
Michaelowa, Axel and Umamaheswaran, K. (2006), Additionality and Sustainable Development Issues
Regarding CDM Projects in Energy Efficiency Sector. HWWA Discussion Paper No. 346. Available at
SSRN: http://ssrn.com/abstract=908824
Nicholson, Biegler and Brook (2011), How carbon pricing changes the relative competitiveness of low-
carbon baseload generating technologies, Energy 36, p. 305-313
Olsen (2007), the clean development mechanism’s contribution to sustainable development: a review of
the literature. Climate Change, Volume 84, No. 1, p.59-73
Pathak and at al. (2009), Global warming mitigation potential of biogas plants in India, Environ Monit
Assess Volume 157, p. 407–418
P. Bond (2012), Emissions Trading, New Enclosures and Eco-Social Contestation. Antipode, Vol. 44
No. 3, pp 684–701.
P. David (2003), the Social Cost Of Carbon and Its Policy Implications. oxford review of economic
policy, Vol. 19, Issue 3, p. 362-384.
Perdan and Azapagic (2011), Carbon trading: Current schemes and future developments. Energy Policy
39, p.6040–6054
Prabhakant and G.N. Tiwari (2009), Evaluation of carbon credits earned by energy security in India.
International Journal of Low- Carbon Technologies 2009, Vol. 4, p.42-51
Poudyal, N. C., Siry, J. P. and Bowker, J. M. (2011), Stakeholders' Engagement in Promoting
Sustainable Development: Businesses and Urban Forest Carbon. Business Strategy and the
Environment. doi: 10.1002/bse.724.
S. Inderjeet and M. Axel Michaelowa (August, 2004), “Indian Urban Building Sector: CDM Potential
through Engergy Efficiency in Electricity Consumption”, HWWA DISCUSSION PAPER 289.
Slobodan Perdan and Adisa Azapagic (2011), Carbon trading: Current schemes and future
developments, Energy Policy 39, 6040–6054.
Stewart, Jenny and Brimble, Mark (2009), the Financial Sector and Climate Change: Risks,
Opportunities and Overall Preparedness. Available at SSRN: http://ssrn.com/abstract=1460676 or
http://dx.doi.org/10.2139/ssrn.1460676
S. Robert (2008), Addressing climate change with a comprehensive US cap-and-trade system. Oxford
Review of Economic Policy, Volume 24, pp.298–321.
S. Katja and S. Jayant (1999), India’s Cement Industry: Productivity, Energy Efficiency and Carbon
Emissions. Berkeley, CA 94720, p. 1-59.
Torres and Pinho (2011), Encouraging low carbon policies through a Local Emissions Trading Scheme
(LETS). Cities 28,576–582.

Bibliography
158
Urban, Frauke (November 2009), Climate-Change Mitigation Revisited: Low-Carbon Energy
Transitions for China and India. Development Policy Review, Vol. 27, Issue 6, pp. 693-715. Available
at SSRN: http://ssrn.com/abstract=1486348 or doi:10.1111/j.1467-7679.2009.00466.x
Wara, Michael W. (January 20, 2008)., Measuring the Clean Development Mechanism's Performance
and Potential UCLA Law Review, Vol. 55, No. 6, p. 17-59, Available at SSRN:
http://ssrn.com/abstract=1086242.
Zhang, Zhong Xiang (July 2005), Towards an Effective Implementation of Clean Development
Mechanism Projects in China available at SSRN: http://ssrn.com/abstract=555906 or
http://dx.doi.org/10.2139/ssrn.555906.
Reports
AEA (2011), Governance of the CDM adopted from UNCTAD CDM guide document, Volume 1
retrieved from http://www.unctad.org/en/docs/cdm2009_en.pdf).
Australian Transaction Reports and Analysis Centre (AUSTRAC 2011), Typologies and case studies
report 2011 available at www.austrac.gov.au.
B. Robert (2009), Literature Review on Carbon Footprint Collection and Analysis, CSDL Technical
Report 09-05 retrieved from http://csdl.ics.hawaii.edu/techreports/09-05/09-05.pdf.
CDM benefit to solid waste management, An analysis of methodology issues, Prepared by IL & FS
ECOSMART LTD, NEW DELHI 22nd October, 2007
Carbon Reduction Institute (July 2009), Carbon Credit Purchasing Guide, retrived from
www.NOCO2.com.au
Das k. Kanchan (2008), carbon credits.... A VC perspective, Global strategy & investment consulting.
Energy Statistics, 2013 retrieved from www. mospi.gov.in.mo
Forests NSW (2005), Forest, Timber and the Greenhouse Effect, available at
http://www.forest.nsw.gov.au/publication/forest_facts/forests_timber_greenhouse_effect/default.asp.
Global Energy Network Institute (GENI, 2006), Overview of Renewable Energy Potential of India.
Retrieved from
http://www.geni.org/globalenergy/library/energytrends/currentusage/renewable/Renewable-Energy-
Potential-for-India.pdf assessed on June 15,2015.
Gujarat and trade in Carbon Credit (2007), available at www.radiff.com
Global Climate Change Regime, Council on Foreign Relations, June 2013 retrieved from www.cfr.org
Gujarat Clean Development Mechanism (CDM) Cell, 2010 retrieved from
http://www.gujaratcmfellowship.org/document/Fellows/Carbon-Development-Mechanism-
%28CDM%29-Cell-Shwetal-Shah-26Nov10.pdf assessed on 18March, 2013.
Indian Institute of Sustainable Development (IISD 2009), CDM Basics.
Intergovernmental Panel for Climate Change (IPCC 1995), Greenhouse gas inventory: IPCC Guidelines
for National Greenhouse Gas Inventories, United Kingdom Meteorological Office, Bracknell, England.

Bibliography
159
International Energy Agency (IEA 2006), World Energy Outlook retrieved from
http://www.worldenergyoutlook.org/
Indian Network for Climate Change Assessment (INCCA 2007), India: Greenhouse Gas Emissions
2007, Ministry of Environment and Forest & Government of India.
Intergovernmental Panel on Climate Change (IPCC 2007), Climate change 2007: Impact, adoptions and
Vulnerability, Contribution to Working group II to the Fourth Assessment Report, Cambridge
University Press, Cambridge, UK, 976 pp.
The Institute of Chartered Accountants of India (ICAI, 2009), Corporate Communiqué, Issue No. 2
available at www.icai.org
Indian Council of World Affairs (ICWA 2013) , Doha Climate Change Conference: Uncertainty amidst
Urgency available at www.icwa.in
Ministry of Environment and Forest (MNRE 2012), India’s Renewable Energy Sector - Potential and
Investment Opportunities available at www.mnre.gov.in.
Ministry of Environment and Forest (MNRE 2009-10), Development of Conceptual Framework for
Renewable Energy Certificate Mechanism for India retrieved from http://mnre.gov.in.
NFFPFW (National Forum of Forest People and Forest Workers) &DISHA (Society for Direct
Initiative for Social and Health Action) November 2011, The Indian Clean Development Mechanism:
Subsidizing and Legitimizing Corporate Pollution, available at www.dishaearth.org.
Paula and Axel (2007), Empirical Analysis of Performance of CDM Projects, Climate Strategic Report.
Palmetto (2010), CDM Projects. Available at www.palmetto.com.
Productivity Commission 2011, Carbon Emission Policies in Key Economies, Research Report,
Canberra. (Australian Government)
Peter Meisen (President), Overview of Renewable Energy Potential of India. Global Energy Network
Institute (GENI), October 2006.
Pearson Natalie (2011), Gujarat Rises to 3-Year High on Carbon Credits Award (Update1), Carbon
feedback news.
S. Shwetal (2011) Convenient Action: Gujarat’s Response to Challenges of Climate Change by
Narendra Modi, Macmillan Publishers.
Sustainable Innovation Forum (2015), Climate Commitments of Subnational Actors and Business
retrived from http://www.cop21paris.org/knowledge-centre/reports/climate-commitments-of-subnational-actors-and-business
Vibrant Gujarat 2013, Industrial Extension Bureau Gujarat. Issue 14 Oct., 2012.
Research Articles
Anonymous (2010), Future of trading in carbon emission reductions uncertain available at
http://www.livemint.com/2010/05/09214534/Future-of-trading-in-carbon-em.html.

Bibliography
160
Ball, J. (2007). Cows, climate change and carbon credits. The Wall Street Journal-Online, B1
Dhana and Murphy (2011), the new wild west is Green: Carbon offset markets, transactions and
providers, Academy of Management Perspectives, Page no 37-49.
Ellerman, A. Denny, Barbara K. Buchner, and Carlo Carraro (eds.) (2007), Allocation in the European
Emissions Trading Scheme: Rights, Rents and Fairness, Cambridge and New York: Cambridge
University Press, 2007.
Galley and Utset (2010-11), Is Cap-and-Trade Fair to the Poor? Shortsighted Households and the
Timing of Consumption Taxes. Available at HeinOnline -- 79 Geo. Wash. L. Rev. 42.
Koll, Ansa and Pinks, Jonatan (May 2009), “Business and Climate Change: Key Challenges in the Face
of Policy Uncertainty and Economic Recession”, Management Online Review retrieved from
www.morexpertise.com.
Mukharjee (2011), Analysis: India Takes Unique Path to Lower Carbon Emissions. Available at
www.planetark.com.
Machado and et al. (2011), carbon credit storage: a study of how to measure and account posting.
Review of Business Research, Volume 11, Number 1.
Nadene Ghouri (2009), “The great carbon credit con: Why are we paying the Third World to poison its
environment?” retrived from http://the-great-carbon-credit-eco-companies-causing-pollution.html.
Sarkar A. N. (2010), emissions trading and carbon credit accounting for sustainable energy
development with focus on India. GMJ,vol 4,issue 1 & 2.
Streck (2007), Energy Liability: The governance of the CDM: the case for strength and stability.
Environmental Liability Published By Lawtext Publishing Limited retrived from www.lawtext.com
Shukla Megha (2007), Estimation of CO2 Emission using Energy Input-Output tables for India, V.R.F.
Series No. 430.
News Papers
Gujarat's green warrior at UN, The Times of India Ahmedabad, Jan 19, 2011.
Kyoto Protocol Phase II, 22Dec., 2011 retrieved from www.frontier-carbon.net
Doha Outcome : Kyoto Protocol, Global Climate deal by 2015, 8 Dec.,2012 retrieved from http://ens-
newswire.com/2012/12/08/doha-outcome-kyoto-protocol-lives-global-climate-deal-by-2015/
India's greening industries lead in world carbon credit game, India Features Dec. 1, 2007.
India’s Energy and Climate Change Challenge, 2016 retireved from
https://www.carbonbrief.org/briefing-indias-energy-and-climate-change-challenge.

Bibliography
161
Books
Levin & Rubin, (1998), “statistics for management”, person education, 7th edition, pp. 791-860.
Malhotra & Das, (2009), “Marketing research”, person education, 5th edition, pp. 75-403.
C. Nitin and L. Shubhangi (2011), “The Potential of Major Hydro and Wind Energy Projects for
Seeking Carbon Credits Under the Clean Development Mechanism and Voluntary Markets”, The
Economic, Social and Political Elements of Climate Change, Climate Change Management, pp 325-
334.
Web links
Approval Process retrieved from http://www.cdmindia.gov.in/approval_process.php assessed on May 15,
2012.
CDM Project Cycle adopted from UNCTAD CDM guide document retrieved from
http://www.unctad.org/en/docs/cdm2009_en.pdf assessed on June 1,2012 .
CDM Projects and CER up to 2012 retrieved from http://www.cdmindia.gov.in/reports_new.php assessed
on Feb. 28, 2013.
Energy and Climate Change retrieved from
https://www.iea.org/publications/freepublications/publication/WEO2015SpecialReportonEnergyandClimate
Change.pdf assessed on June 15, 2015.
Regulatory Institutional structure adopted from UNCTAD CDM guide document retrieved from
http://www.unctad.org/en/docs/cdm2009_en.pdf assessed on June 1,2012
Sate wise Approved Projects retrieved from http://www.cdmindia.gov.in/reports_new.php assessed on Feb.
28, 2013.
Total Carbon Dioxide Emissions from the Consumption of Energy, retrieved from
http://www.eia.gov/cfapps/ipdbproject/iedindex3.cfm?tid=90&pid=44&aid=8 accessed on May 20, 2012.

List of Publications
162
List of Publications
Sr.
No.
Title of the research paper Name of Journal Author’s Name
1 Study of Carbon Credit Management
at Ahmedabad Municipal
Corporation
ICEI-2012 Tejal Bhatt, Hetal
Jani and Avani Shah
2 Carbon Credit: Indian Economy
Perspective
Asian Journal of
Research in Business
Economics and
Management
Avani Shah and Dr.
Narayan Baser
3 Impact of Clean Development
Mechanism (CDM) Projects on
Energy Industry Organisations of
Gujarat
Guvesana Journal of
Management
Avani Shah and Dr.
Narayan Baser
4 Carbon Market: A road map ahead ‘Sankalpa': Journal of
Management &
Research
Avani Shah and Dr.
Narayan Baser

Appendix
163
Appendix A
Questionnaire
Dear Sir/Madam,
The questionnaire is prepared for the research study leading to PhD in Management registered
with Gujarat Technological University. I heartily request you to provide impartial and realistic
answers to all these questions on the basis of your experience and expertise to make this
research fruitful and applicable. Questionnaire attempts to study the carbon credit scenario in
Indian market. Besides this study is also an attempt to study the impact of carbon credit on
economic indicators. Questionnaire is divided into three sections - Section A deals covered
the registered Projects related information: Section B covers the general information
regarding Projects and section C covers the organisation details. I assure you that the
information/opinion/data given by you will be used exclusively for academic purpose.
Thanking you in anticipation of your support.
-Avani Shah

Appendix
164
Section A – CDM Registered Projects
1. Are you aware about the Global Warming? (Please put sign wherever applicable.)
YES NO
2. Are you aware about the Carbon Emission Reduction (CER)? (Please put sign
wherever applicable.)
YES NO
3. Have you registered your Projects for Carbon Emission Reduction? (Please put
sign wherever applicable.)
YES NO
4. Under which legal body your organization has registered the Projects/s? (Please put
sign wherever applicable.)
Central Govt. State Govt. Multi state Govt.
5. Mention applied mandatory laws and regulation
Central Government: _________________________________________________
State Government: ___________________________________________________
Industry Laws: ______________________________________________________
6. How much time span of the Projects you consider before registration? (Please put
sign wherever applicable.)
Phase I (1to 7years) Phase II (8to 14 years) Phase III (15to 21 years)

Appendix
165
7. Geographical boundaries: (Please put sign wherever applicable.)
Local/Regional National International
8. Which methodology has been used for CDM Projects?
Biomass Solar Wind Natural Gas Thermal Other
__________
9. Do you feel that Carbon Credit can be deployment for Corporate Social
Responsibility? (Please put sign wherever applicable.)
YES NO
9.1 If YES, than what level… (Please put sign wherever applicable.)
Very Low Low Neutral High Very High
10. Aspects considered for the CDM Projects in India (Please put sign wherever
applicable.) (1- Strongly Disagree, 2- Disagree, 3-Neither agree not disagree, 4- Agree, 5-
Strongly Agree)
Sr. No. Statements 1 2 3 4 5
1
I believe that pollution level of the
environment get reduced because of
the CDM Projects.
2 The Projects is eco friendly according
to me.
3 The Projects has positive impact on
human wellbeing.
4
I believe that the CDM Projects does
not make the environment a safer
place.
5 I believe that the company has
adopted/used sound technology.

Appendix
166
6
The technology adopted for the CDM
Projects has affected the company
positively.
7
The technology adopted for CDM
Projects shall help in the development
of the Economy.
8
According to me, the technology
adopted for the CDM Projects has
affected in the upgradation of the
technology base.
9 I believe that the emission level
mention in the PDD is real.
10 The measurement of the CER
followed by the proper methodology.
11 According to me, the Projects will
able to create employability.
12 I believe that the Projects helps in
reduces poverty.
13 The Projects helps in the
improvement of the quality of life.
14 I believe that the Projects attract the
addition investment in the economy.
15 According to me, the time span of the
Projects needs to be clear.
16 The baseline of the Projects has been
cleared.
17 I believe that the Projects has an
impact on the resource sustainability.
18 The baseline of the Projects is precise
according to me.
19 According to me, the Projects needs
to be transparent.
20 The Projects needs to be comparable.

Appendix
167
21 I believe that the physibility of the
Projects needs to be workable.
22 The Projects has avoided
overestimation.
23 According to me, the methodology to
decide baseline is homogeneous.
24 I believe that the baseline needs to
reliable for the Projects physibility.
25 The Projects has well defined the
potential errors.
26 I believe that the updated baseline
needs to be clear.
11. What are the factors affecting the carbon credit Projects? (Please put sign
wherever applicable.)
External factors
Recession in Global Market Country’s Economic growth
Carbon Trading Mechanism Political Changes
CDM Mechanism Trade Relations Others _____________
Internal factors
Monitoring cost of the Projects Adopting and Implementing Technology
HR Practices Management Others ___________________
12. What are the barriers that would prevent the implementation of proposed Projects
activity? (Please put sign wherever applicable.)
Technological Barriers Institutional Barriers Governance level

Appendix
168
Cooperation between Host and Investors Country Others _________________
13. What according to you is the impact of CDM on the following factors? Please tick on
the appropriate impact level.
Particulars Very Low Low Neutral High Very High
Administration
Operations
Finance
Human Resource
Technology
Marketing
Management
Stakeholders
Competitors
Economy
14. The funds to start a CDM Projects can be raised from… (Please put sign wherever
applicable.)
Internal Sources of Financing External Sources of Financing
15. The sources of financing (Please put sign wherever applicable.)
Grants Loans (Debt) Equity Others
Please Specify the Source____________________________________________________
16. The degree of risk involve in different level of Projects
(Please put sign wherever applicable.)

Appendix
169
Risk Involve in Projects at
Different level
Low(Less
than
20%)
Moderate
(20 to
40%)
Medium
(40 to
70%)
High
(More than
70%)
Planning Phase
Feasibility Risk
Permit/License Risk
Construction Phase
Time Over-run Risk
Capital Cost over-run Risk
Operation Phase
Technology Risk
Market Risk
Supply Risk
Operation Risk
Political/Legal Risk
Financial Risk
Counterparty Risk
17. Investment Analysis (Please put sign wherever applicable.)
17.1 Selected Appropriate Analysis Methods
Simple Cost Analysis Investment Comparison Analysis

Appendix
170
Benchmark Analysis Others please specify
______________________________
17.2 Models Apply for the calculation
Net Present Value Internal Rate of Return Sensitivity Analysis
Scenario Analysis Return on Investment Others
__________________
18. Have your organisation gone for Carbon Trading? (Please put sign wherever
applicable.)
YES NO
18.1 If yes, than which instruments…. (Please put sign wherever applicable.)
Spot Futures OTC Others ____________________
Section B – Projects Details
Please fill the following information related to Registered Projects
Projects Design Documents
Title of the Projects
Projects Size
Sectorial Scope
Projects Participant(s)
Host Party(ies)
Selected Methodology
Purpose of Projects

Appendix
171
Technology Employed
Estimated GHG Emissions p.a.
Section C – Organisation Details
Your Organization (Optional) is ________________
No of years serve in Industry:
Less than 5 Years 5to 10 Years 10to 15 Years More than 15 years
Type of Organisation Based on Investment:
Micro(Less than 25 lakhs) Small (25 Lakhs to 5 Crore)
Medium (5Crore to 10 Crore) Large (More than 10 Crore)
No of Employees:
Less than 100 101to 500 501to 1000 More than 1000
Main Manufacturing Activity_________________
No of Registered Projects______ No of Projects planning for
registration_________
Name of the Respondents: ____________________________________________
Email ID:____________________________ Contact No:____________________
(Note: Your personal and corporate details will remain confidential. It use for only
research purpose.)

Appendix
172
Appendix B
List of Energy Sector Organisations
Sr. No. Name of Organisation
1 Sunborne Energy Gujarat One Pvt Ltd
2 CLP Wind Farms India Private Limited
3 Bharat Forge Limited
4 Green Infra Wind Power Limited
5 Gujrat Flurochemicals Limited
6 Cargo Solar Power (Gujarat) Private Limited
7 Vaayu Group of Companies
8 Hiraco Renewable Energy Private Limited
9 Ganges Green Energy Private Limited
10 Sand Land Real Estates Private Limited
11 Tata Power Renewable Energy Limited
12 Adani Enterprises Limited
13 Gujarat State Fertilizer Limited
14 Abellon Clean Energy Pvt. Ltd.
15 AES Saurashtra Windfarms Private Limited
16 Precious Energy Services Private Limited and Solitaire Energies Private Limited
17 Surajbari Windfarm Development Private Limited
18 Visual Percept Solar Projects Private Limited
19 Gujarat Narmada Valley Fertilizers Company Limited(GNFC)
20 Rddhi Siddhi GlucoBiols Limted(RSGBL)
21 Gujarat State Energy Generation Limited
22 Enking International