Embed Size (px)
Citation preview

A STUDY OF THE RELATIONSHIP BETWEEN DAYLIGHT PERFORMANCE AND HEIGHT DIFFERENCE OF BUILDINGS IN HIGH DENSITY CITIES USING
COMPUTATIONAL SIMULATION
1 2 3 4 5 6 7 8 9
10
Edward Ng
Department of Architecture, Chinese University of Hong Kong
ABSTRACT
Daylight design for “extremely” obstructed urban environment is a relatively uncharted area of scholarship. The reason might be that the problem has not been critically important. No city in the world has an urban density as high as Hong Kong. Deisgning and providing adequate daylight into buildings is a difficult challenge. A key question designers often ask is: If there is a need to build a high density city, what should it look like? What one should or should not do? There are many design variables. This study examined one of them: building heights. It attempted to determine what one could gain by optimizing it; and to understand what is the relationship between height difference of buildings in a city and the daylight performance. The study utilized computational lighting simulation as a study tool. Simplified cityscapes of various degrees of height differences are studied. They are plotted against the Vertical Daylight Factor (VDF) available to the building envelop. It has been found that, given the same high density, better daylight availability to the lower floors of buildings could be achieved by varying buildng heights.
INTRODUCTION
Figure 1 Tall buildings in a compact high density city. Currently in Hong Kong, developers are
‘encouraged’ to build to the same height. These towers are 40 storey tall.
Hong Kong is a city with 7.5 millions inhabitants living on a collection of islands that total 1000 square kilometer. Urban density is around 50,000 person per square kilometer. Take away the areas for roads, rails, utilities and open spaces, building sites end up with a development density of around 3000 person per hectare. This results in a plot ratio of some 5 to 10, and high rise buildings, some 40-80 storeys, built very closely together. (Figure 1)
The Planning department of Hong Kong operates a height control system. Buildings are allowed a certain maximum height. This policy, together with the economics of building high, means that developers are “encouraged” to design towers that are similar in height. Is this the best way to build a high density city?
This paper attempts to provide some scientific hints to planners and architects dealing with the design of high density cities. The aim is to illustrate preliminarily that “height difference” of a city could be a useful planning and design variable to optimise the daylight performance of buildings. The suggestion might add an important element to the array of existing controllling mechanisms.
LITERATURE Very limited literature exists to inform the subject. The closest was a proposal by Hopkinson. The Daylight Code method was an idea to come to term with tall towers favored by planners and architects after the WW2. (Crompton 1955, Allen 1947, Pound 1947) The idea was cunning in that Hopkinson recognized it was more important to have “gaps” between buildings than to regulate building heights. The main reason was that once the vertical obstruction angle exceeded 45 degree, it did not really matter if the obstruction was 60 degree or 65 degree. However, the density difference in terms of building height is great. For example, the difference between 60 and 65 degrees for tall towers is around 20 meters. This is equal to building 8 extra floors. Hopkinson reckoned then that the age old rule using vertical obstruction angle was not adequate. (Hopkinson 1963) Instead, he developed the Permissible Height Indicators. (HMSO 1964)
Ninth International IBPSA Conference Montréal, Canada
August 15-18, 2005
- 847 -
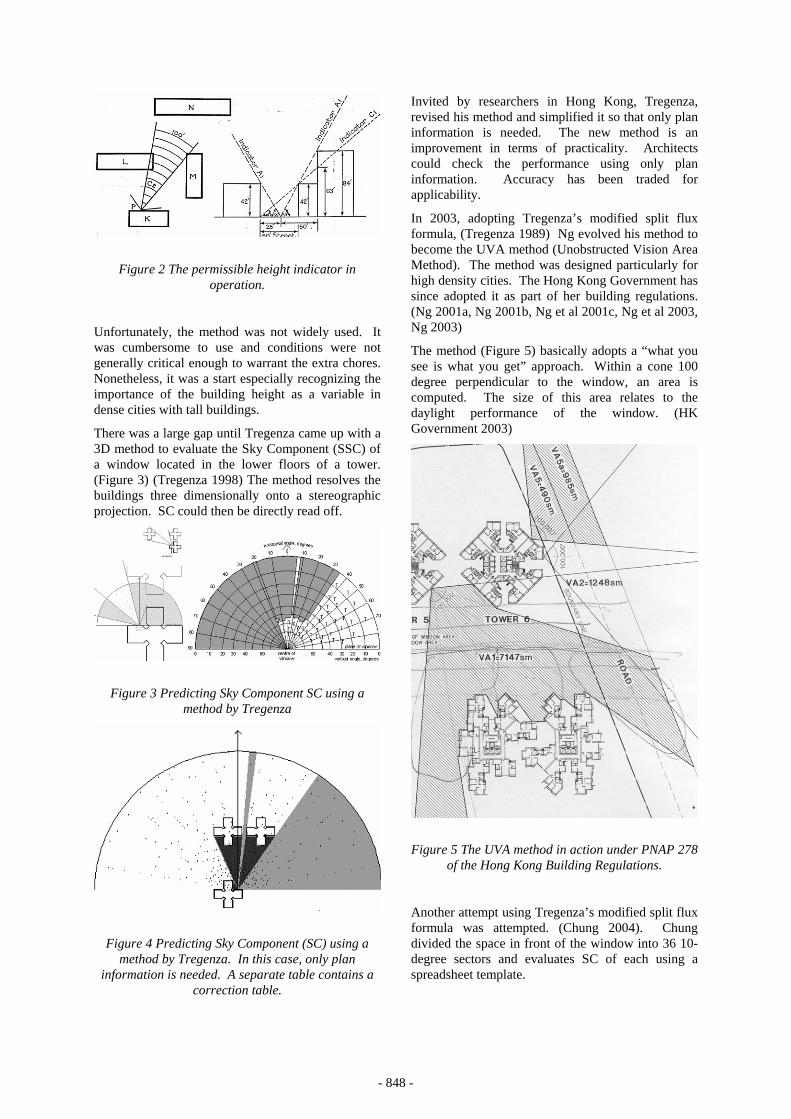
Figure 2 The permissible height indicator in operation.
Unfortunately, the method was not widely used. It was cumbersome to use and conditions were not generally critical enough to warrant the extra chores. Nonetheless, it was a start especially recognizing the importance of the building height as a variable in dense cities with tall buildings.
There was a large gap until Tregenza came up with a 3D method to evaluate the Sky Component (SSC) of a window located in the lower floors of a tower. (Figure 3) (Tregenza 1998) The method resolves the buildings three dimensionally onto a stereographic projection. SC could then be directly read off.
Figure 3 Predicting Sky Component SC using a method by Tregenza
Figure 4 Predicting Sky Component (SC) using a method by Tregenza. In this case, only plan
information is needed. A separate table contains a correction table.
Invited by researchers in Hong Kong, Tregenza, revised his method and simplified it so that only plan information is needed. The new method is an improvement in terms of practicality. Architects could check the performance using only plan information. Accuracy has been traded for applicability.
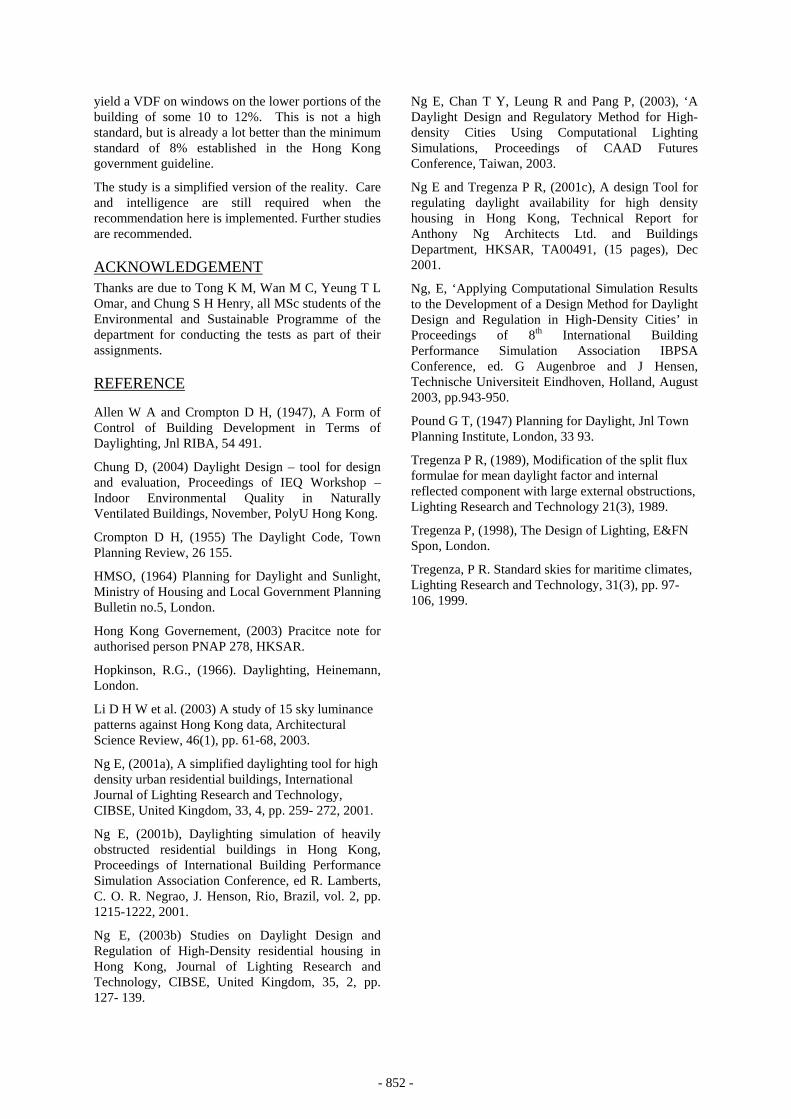
In 2003, adopting Tregenza’s modified split flux formula, (Tregenza 1989) Ng evolved his method to become the UVA method (Unobstructed Vision Area Method). The method was designed particularly for high density cities. The Hong Kong Government has since adopted it as part of her building regulations. (Ng 2001a, Ng 2001b, Ng et al 2001c, Ng et al 2003, Ng 2003)
The method (Figure 5) basically adopts a “what you see is what you get” approach. Within a cone 100 degree perpendicular to the window, an area is computed. The size of this area relates to the daylight performance of the window. (HK Government 2003)
Figure 5 The UVA method in action under PNAP 278 of the Hong Kong Building Regulations.
Another attempt using Tregenza’s modified split flux formula was attempted. (Chung 2004). Chung divided the space in front of the window into 36 10-degree sectors and evaluates SC of each using a spreadsheet template.
- 848 -

PLANNING FOR DAYLIGHT The UVA rule, and most of the methods before it, was about the allocation of building blocks on site. A question remains to be answered: what about the building heights? Should a juxtaposition of building heights be factored into the evaluation? Is there anything to be gained factoring it in?
The questions boil down to the key question of the sensitivity of building height variation and daylight availability. That is to say, should a city be designed to have buildings of similar heights, or should variations be permitted and even encouraged? Based on Hopkinson’s earlier works, it seems that “gaps between” is a way to look at high density cities. Thus it could be speculated that by varying the building heights some benefits might be gained. But how much? Take for example there are two buildings in front of a window obstructing. If they are of an equal height forming say a 70 degree vertical obstruction, the available SC using the International Commission on Illumination (CIE) Overcast Sky is 2.8%. Now, suppose the building on the right is stacked on top of the building on the left. Then the left side of the hemisphere could be assumed to be completely blocked with an 80 degree obstruction (remaining SC=0.7%). However, the right side will be completely open and would give some 20% of SC. The density in both cases is the same, but the daylight performance of the window would be different by around 20%.
THE STUDY A simplified scenario based approach is used in this study. The advantage with a simplified approach in lieu of studies based on realistic circumstances is that issues could be isolated to reduce noise and error of results. It is also much easier to design experimentally. The disadvantage is that results obtained could not be directly and readily feed back to real problems. In most cases, results could only indicate the ‘likely’ sensitivity of the performance due to the variable.
For this study, to mimic the conditions of an urban neighborhood, a 5x5 ground plate was used. The ground plate had 25 buildings on a square array. Each building is 1 unit by 1 unit on plan. They were separated by a “street” of 1 unit wide. The buildings were made up of blocks of 1x1x1 unit cubes. All scenarios tested had 100 cubes, that is to say, all scenarios tested had the same design density. For example, figure 6 shows a scenario with 100 cubes. Each of the 25 buildings were therefore made up of 4 cubes. All buildings were of the same height. This was regarded as the “base case” with a height difference of 0. The differences in building heights were then investigated using a number of scenarios. (Figure 6)
Figure 6 Showing the9x9 array making up of the 5 x 5 array of the base plate and 2 additional rows of
surrounding on four sides. The final tests were conducted with 5 rows of surroundings.
THE TOOL The model was made in FormZ solid modeler. This gives better and more accurate model than using AutoCAD. Light leak of intercepting surfaces is a reported problem; the solid modeler has no problem in this respect. The file was then translated directly into Lightscape. Materials of Ideal Diffuse at reflectance of 0.2 were assigned. Lightscape 3.2 was used to simulate the Vertical Daylight Factor (VDF) on the center of each blocks of the lowest level. The software has been previously validated to be suitable for high density studies – especially for the lower floors. (Table 1) (Ng 2001b; Ng et al 2003) Simulations were run with a high resolution setting. Sunlight was set to 0 to mimic the CIE Overcast Sky. Recent studies in Hong Kong indicate that the CIE Overcast Sky is a good approximate to the real conditions. (Li 2003) (Tregenza 1999)
The tests were run until less than 0.001% of energy was unaccounted for. This is important, as most of the ‘left over’ energy of the last few percentages tend to be from the lower levels where the readings would be taken. It is therefore prudent to run the test a bit more extensively than normal.
Table 1 A brief summary of results of the validation tests
Errors between simulated and measured results
Units on upper floors -22.5% Units on middle floors -5.2% Units on lower floors -6.5%
The scenarios were defined in Table 2. There are 16 scenarios A to P. The heights of the building block
- 849 -

from top left down to bottom right are illustrated. The differences in height between the tallest and the lowest buildings are shown in ‘red’ at the bottom. All scenarios have 100 blocks and their distributions are generated using Excel Random Number function.
Table 2 Layouts of the 16 scenarios. Numbers shown are height of the 25 buildings. For example, starting from the top left corner with scenario A, there are 25
buildings with heights of 4, 3, 3 and so on. At the bottom of the table in red is 2, which is the difference between the tallest (in this case 5) and the lowest (in
this case 3) building.
Figure 7 An example of the 5 x 5 array. TheVertical Daylight Factor (VDF) of the four surfaces of the
lowest cube (total 25 of them) are measured..
Figure 8 An example of the simulation with the surroundings.
RESULTS Simulations were run with the surroundings. (Figure 8) The base plate was surrounded with itself 8 times. This gives a reasonable context. Vertical Daylight Factors (VDF) of the center of the 4 vertical “external” faces of the bottom 25 blocks of each building were measured. (Figure 7) The Min, Max, Mean, Median and Standard Deviation of all 16 scenarios were recorded. (Table 3) (Figure 9)
Table 3 Results of the 16 scenarios
0
5
10
15
20
25
9 9 8 7 7 7 6 6 5 5 4 4 3 3 2 2
height difference
Df %
mean
median
Min
Max
Figure 9 A summary of the results of the 16
- 850 -

scenarios.
VDF was measured in this study to indicate how much light is available to the external façade of the building. As the study concentrates more on planning issues, VDF is a better indicator of the effects of the layout and configurations of buildings on daylight performance. In addition, the Hong Kong Government has recently published design guidelines based on the use of VDF. (HKSAR 2003)
Only results of the bottom 25 blocks were noted. There are 2 reasons. Firstly, one should be more focused on providing light where it is needed most. Secondly, the government design guidelines control this lower threshold. Thus, 100 data points were taken for each of the 16 scenarios.
The results illustrate a number of observations.
(A) In general, better Daylight to the lower floors could be achieved with larger height differences. It is not surprising as explained above. The difference is some 8% to 14%. The Mean and the median are close indicating normal distribution of results. The improvements could be as much as some 70%.
(B) The minimum DF stays relatively constant. Occasionally, there are problem spots, for example scenario K. On the whole it is in the region of 8%.
(C) The maximum DF drops rapidly as the height difference decreases. The very high maximums in some cases are due to open spaces (block of 0 on plan).
IMPLICATION TO DEISIGN It has been demonstrated that larger height differences in general will improve daylight performances of windows on the lower floors. Architects and planners are advised to find ways to allow for these opportunities. However, in practice, it may be uneconomical to aim for extreme differences. For example, if the lower buildings are 10 storey high, the higher buildings will be in the order of 90 storeys based on the scenarios tested.
What height difference is preferred? This depends on two factors:
(A) The minimum DF demanded. In our tests, it is in the order of 8%. Should user survey of inhabitants results in a higher desirable DF, this should be regarded as the minimum. In Hong Kong, recent user surveys indicate that for inhabitants who are used to congested cities, their minimum expectation is in the order of VDF=8% [80% satisfaction rate used. (Ng 2003b)]
(B) The overall density. The tests use 100 1x1x1 blocks. This translates to an overall site coverage, including roads, of 25% and a plot ratio of 1. If roads are discounted using simplified assumptions
(the 4 block building equates to a 100m tower), the roads are 25m wide, which is typical of many streets in Hong Kong. Assuming 4 buildings on one site. This will give a site coverage of 45% (again, this is typical of Hong Kong. Incidentally, on-site measurement in Hong Kong has indicated that VDF of 8% on windows of lower floors can normally be expected. This illustrates that the scenarios tested can be very similar to real conditions of Hong Kong.
(C) The block configuration. Blocks are assumed to be square on plan. In Hong Kong, most buildings are cruciform on plan. (Figure 10) If a widow is near to the corner of the cruciform, it will see only half of the open space in front. This means it will receive roughly a VDF of 5-6% as compare with a window on a flat surface. Hence if VDF=8% is a minimum expected in reality, a VDF of some 11 to 12% would be needed for the test scenarios.
Figure 10 A typical housing estate in Hong Kong with cruciform plans. These towers are around 40
storey or 110m high. They are public housing.
(D) The amount of open space around the estates. In our tests, only scenarios D, H, L and O with an extreme height difference of 7 and above are with open spaces. They extend the maximum values of the results and push up the mean. Ideally, they should be well distributed in the 5x5 study area to even out the differences.
CONCLUSION In summary, in Hong Kong, it is opined that a height difference of around 100% between the taller and the shorter buildings be the optimum. That is to say, on average, the taller buildings should be say 100m and the shorter one should be 50m, with the bulk of the building heights normally distributed with a mean of 75m. This 75m average could then be used to work out the desirable plot ratio of the sites when planning the neighbourhood. Circumstances warrant, this will
- 851 -
yield a VDF on windows on the lower portions of the building of some 10 to 12%. This is not a high standard, but is already a lot better than the minimum standard of 8% established in the Hong Kong government guideline.
The study is a simplified version of the reality. Care and intelligence are still required when the recommendation here is implemented. Further studies are recommended.
ACKNOWLEDGEMENT Thanks are due to Tong K M, Wan M C, Yeung T L Omar, and Chung S H Henry, all MSc students of the Environmental and Sustainable Programme of the department for conducting the tests as part of their assignments.
REFERENCE
Allen W A and Crompton D H, (1947), A Form of Control of Building Development in Terms of Daylighting, Jnl RIBA, 54 491.
Chung D, (2004) Daylight Design – tool for design and evaluation, Proceedings of IEQ Workshop – Indoor Environmental Quality in Naturally Ventilated Buildings, November, PolyU Hong Kong.
Crompton D H, (1955) The Daylight Code, Town Planning Review, 26 155.
HMSO, (1964) Planning for Daylight and Sunlight, Ministry of Housing and Local Government Planning Bulletin no.5, London.
Hong Kong Governement, (2003) Pracitce note for authorised person PNAP 278, HKSAR.
Hopkinson, R.G., (1966). Daylighting, Heinemann, London.
Li D H W et al. (2003) A study of 15 sky luminance patterns against Hong Kong data, Architectural Science Review, 46(1), pp. 61-68, 2003.
Ng E, (2001a), A simplified daylighting tool for high density urban residential buildings, International Journal of Lighting Research and Technology, CIBSE, United Kingdom, 33, 4, pp. 259- 272, 2001.
Ng E, (2001b), Daylighting simulation of heavily obstructed residential buildings in Hong Kong, Proceedings of International Building Performance Simulation Association Conference, ed R. Lamberts, C. O. R. Negrao, J. Henson, Rio, Brazil, vol. 2, pp. 1215-1222, 2001.
Ng E, (2003b) Studies on Daylight Design and Regulation of High-Density residential housing in Hong Kong, Journal of Lighting Research and Technology, CIBSE, United Kingdom, 35, 2, pp. 127- 139.
Ng E, Chan T Y, Leung R and Pang P, (2003), ‘A Daylight Design and Regulatory Method for High-density Cities Using Computational Lighting Simulations, Proceedings of CAAD Futures Conference, Taiwan, 2003.
Ng E and Tregenza P R, (2001c), A design Tool for regulating daylight availability for high density housing in Hong Kong, Technical Report for Anthony Ng Architects Ltd. and Buildings Department, HKSAR, TA00491, (15 pages), Dec 2001.
Ng, E, ‘Applying Computational Simulation Results to the Development of a Design Method for Daylight Design and Regulation in High-Density Cities’ in Proceedings of 8th International Building Performance Simulation Association IBPSA Conference, ed. G Augenbroe and J Hensen, Technische Universiteit Eindhoven, Holland, August 2003, pp.943-950.
Pound G T, (1947) Planning for Daylight, Jnl Town Planning Institute, London, 33 93.
Tregenza P R, (1989), Modification of the split flux formulae for mean daylight factor and internal reflected component with large external obstructions, Lighting Research and Technology 21(3), 1989.
Tregenza P, (1998), The Design of Lighting, E&FN Spon, London.
Tregenza, P R. Standard skies for maritime climates, Lighting Research and Technology, 31(3), pp. 97-106, 1999.
- 852 -