Embed Size (px)
Citation preview

sensors
Article
A Systematic Approach to the Design andCharacterization of a Smart Insole for DetectingVertical Ground Reaction Force (vGRF) inGait Analysis
Anas M. Tahir 1, Muhammad E. H. Chowdhury 1 , Amith Khandakar 1 , Sara Al-Hamouz 1,Merna Abdalla 1, Sara Awadallah 1, Mamun Bin Ibne Reaz 2 and Nasser Al-Emadi 1,*
1 Department of Electrical Engineering, Qatar University, Doha 2713, Qatar; [email protected] (A.M.T.);[email protected] (M.E.H.C.); [email protected] (A.K.); [email protected] (S.A.-H.);[email protected] (M.A.); [email protected] (S.A.)
2 Department of Electrical, Electronic & Systems Engineering, Universiti Kebangsaan Malaysia, Bangi,Selangor 43600, Malaysia; [email protected]
* Correspondence: [email protected]; Tel.: +974-4403-4213
Received: 7 December 2019; Accepted: 28 January 2020; Published: 11 February 2020
Abstract: Gait analysis is a systematic study of human locomotion, which can be utilized in variousapplications, such as rehabilitation, clinical diagnostics and sports activities. The various limitationssuch as cost, non-portability, long setup time, post-processing time etc., of the current gait analysistechniques have made them unfeasible for individual use. This led to an increase in research interest indeveloping smart insoles where wearable sensors can be employed to detect vertical ground reactionforces (vGRF) and other gait variables. Smart insoles are flexible, portable and comfortable for gaitanalysis, and can monitor plantar pressure frequently through embedded sensors that convert theapplied pressure to an electrical signal that can be displayed and analyzed further. Several researchteams are still working to improve the insoles’ features such as size, sensitivity of insoles sensors,durability, and the intelligence of insoles to monitor and control subjects’ gait by detecting variouscomplications providing recommendation to enhance walking performance. Even though systematicsensor calibration approaches have been followed by different teams to calibrate insoles’ sensor,expensive calibration devices were used for calibration such as universal testing machines or infraredmotion capture cameras equipped in motion analysis labs. This paper provides a systematic designand characterization procedure for three different pressure sensors: force-sensitive resistors (FSRs),ceramic piezoelectric sensors, and flexible piezoelectric sensors that can be used for detecting vGRFusing a smart insole. A simple calibration method based on a load cell is presented as an alternativeto the expensive calibration techniques. In addition, to evaluate the performance of the differentsensors as a component for the smart insole, the acquired vGRF from different insoles were used tocompare them. The results showed that the FSR is the most effective sensor among the three sensorsfor smart insole applications, whereas the piezoelectric sensors can be utilized in detecting the startand end of the gait cycle. This study will be useful for any research group in replicating the design ofa customized smart insole for gait analysis.
Keywords: gait analysis; characterization; smart insole; vertical ground reaction forces; force sensitiveresistors; piezoelectric sensors; sensor calibration
Sensors 2020, 20, 957; doi:10.3390/s20040957 www.mdpi.com/journal/sensors

Sensors 2020, 20, 957 2 of 25
1. Introduction
Gait analysis offers an opportunity for assessment of the act of walking, one of the most importantfeatures of the individual’s use pattern that displays posture in action. By identifying gait kinetics, gaitkinematics and musculoskeletal activity, gait analysis can be utilized in various applications, such asrehabilitation, clinical diagnostics and sport activities [1]. Gait kinetics studies the forces and momentsthat results in movement of lower extremities during gait cycle. Vertical ground reaction forces(vGRFs) are the forces between the foot and ground which can be obtained by wearable sensors [2]and are considered as the main measurement in kinetic analysis. Gait kinetics have recently becomea convenient tool for biomedical research and clinical practice. Different research teams studied theability to diagnose or early detection of various diseases using gait analysis [3–5]. Some research teamsused gait analysis in fall detection of elderly people, one of the most common domestic accidentsamong the elderly. With smart insoles, the fall event can be detected and doctors or personal who takescare of the elderly can be notified to take action. In athletic sports where walking, running, jumpingand throwing are involved, gait analysis can be utilized to recognize an athlete’s faulty movement and,accordingly, enhance it. In addition, gait analysis can play positive role in the rehabilitation process forseveral diseases and complications.
Recently, with the development in sensor technologies, gait analysis using wearable systemsbecame an effective approach [6–8]. Various types of wearable sensors such as force sensors, straingauges, magneto-resistive sensors, accelerometers, gyroscopes, inclinometers etc. can analyze differentgait characteristics. Accelerometers were used to conduct gait analysis studies, in which they wereattached to feet or legs to measure the acceleration or velocity of human lateral movements during gaitcycles [4]. Gyroscopes were used in gait analysis to measure the changes in orientation of lower bodyextremes with respect to the vertical axis. Goniometers measured the relative rotational motion betweendifferent body segments [2]. Electromagnetic tracking systems were developed as 3D measurementdevice that can be applied in the kinematic study of body movements [9].
Gait analysis is typically carried out using a force plate system or multi-camera-based systemto capture the ground reaction forces (GRF) during different gait cycles. However, this methodrequires a costly set up and long post-processing time and can measure only limited number of strides.Therefore, it is not affordable by individuals for personal use [3,8,10]. Instrumented trade mills withfew force plates laid on the trade mill are used by different research groups to mitigate the limitationsof conventional force plates [2], but with treadmills restrictions are still present as subjects need to walkin a straight line where direction changes and turning cannot be realized. This led to an increase inresearch interest towards developing smart insoles, where wearable sensors can be employed to detectvGRF, joint movements, acceleration of lower extremities, and other gait variables [3,4,11,12]. vGRF is auseful tool to assess the health conditions of the patient, to enhance the performance of athletes [13–15].Among different solutions for vGRF measurement, smart insoles have several extra advantages overforce plates and multi-camera systems. Although force plates can measure shear forces and pressurechanges, smart insoles are portable and capable of tracking motions and measuring pressure withoutrigid mounting, whereas the camera-based system requires large space for set-up along with longpost-processing time. The smart insole offers flexible, portable, and comfortable solution for vGRFmeasurement. It is designed to monitor, process and display plantar pressure using pressure sensorsembedded in the insole [3,4,11,12]. Recently, several off-the-shelf smart insoles have been offered bysome companies (e.g., F-scan [16], MoveSole [17], Bonbouton [18], FeetMe [19] etc.), however, thecommercial systems are very expensive for individual use, making it difficult for a home setting.
The aim of this study is to design and characterize smart insoles to detect vGRF during gait,with three different types of low-cost commercial force sensor: force-sensitive resistors (FSRs) [20],ceramic piezoelectric sensors [21], and flexible piezoelectric sensors [22]. All three types of sensor werecalibrated before checking their suitability for smart insole application. A simple low-cost calibrationmethod based on load cells is presented, mitigating the need to use expensive calibration devices orMotion Analysis Labs as a calibration reference. This work provides a systematic approach for sensor
Sensors 2020, 20, 957 3 of 25
calibration guides, which can be replicated easily by other researchers to perform studies on smartinsoles or other body-sensing technologies. To the best of our knowledge, this is the first article tocompare three different low-cost commercially available force sensors for smart insole application.
The remainder of the article is organized into five sections. In Section 2, a comprehensive reviewof the recent works with smart insoles to detect vGRF in gait cycles are summarized. In Section 3, theexperimental details for sensors calibration and insole characterization are presented. In Section 4, themathematical analysis of each insole characterization and sensor calibration are explained. Results anda discussion are presented in Section 5. Finally, we conclude with future recommendations in Section 6.
2. Literature Review
Several research teams focused on fabricating and synthesizing the sensing parts or sensingfabrics of the smart insoles [23–25]. Sensing fabrics are fibers/yarns with sensing technologies orelectrical components made of fabric materials, offering a flexible alternative to comfortably measuringhuman movement. Usually, piezoelectric, piezoresistive and piezo-capacitive materials are used tofabricate the sensing parts of the sensing fabrics, due to their elastic properties [26,27]. Shu et al. [26]implemented a low-cost insole with high pressure sensitivity using a fabric pressure sensing arraymade by the researchers with a pressure range of 10 Pa to 1000 kPa. It is attached to six locationscorresponding to a polyimide film circuit board that takes the shape of the foot. They were able tomeasure the peak pressure, mean pressure, center of pressure (COP), and illustrate different pressurelevels occurring at the six-targeted areas. However, the quality of the gait cycle records was poor,with irregular peak values, where the common gait shape with two peaks of the heel strike and toeoff cannot be distinguished. Kessler et al. [27] demonstrated a low-cost flexible insole, made withVelostat and conductive ink electrodes printed on polyethylene terephthalate (PET) substrate. However,repeatability was a major problem and they proposed an averaging method to reduce the repeatabilityissue. However, the proposed method does not provide a generic solution for the force-sensingproblem, it can be utilized only with periodic forces where spatial information is the key. On the otherhand, some research teams used low-cost flexible force sensors to design the smart insoles [28–30]using commercially available piezoresistive [20], piezoelectric [21,22], capacitive transducers [2], fiberbrag grating [5,31] sensors.
Piezoelectric force sensors are materials that generate electric charges when stressed. However,there are a few factors which limit the usage of piezoelectric sensors in smart insoles. The parasiticeffect of piezo materials neutralizes the generated charge within a short time. Therefore, sophisticatedelectronics are needed to extract resultant charges, and this makes it difficult to use these sensors inmeasuring static or slow varying forces. In addition, protection circuits are needed, since piezo sensorsgenerate high voltage values, which might reach above 100 V with peak vGRF values. Capacitive forcesensors are another alternative force sensor, consisting of parallel capacitor plates that changes thecapacitance in correspondence to applied force/weight. However, they need complex conditioningcircuits and are highly subject to noise [20].
A commonly used body-sensing technology is the piezo-resistive sensor or FSR, which changes itsconductivity based on the applied force. FSR is a polymer thick film (PTF) that is used to measure theapplied force in different applications such as human touch and medical applications, industrial androbotics applications, and automotive electronics. The main advantages of FSRs are: thin size, verygood shock resistance, low power requirement, fast response to force changes, robustness against noise,simple conditioning circuits, ability to fabricate using flexible materials, and low unit cost compared toother commercial force sensors [20]. However, these sensors have some disadvantages that need to becompensated for, such as non-linear behavior and repeatability error [3].
Bamberg et al. [4] used a combination of different FSRs, piezo electric sensors, accelerometersand gyroscopes to determine the vGRF. The main advantage of this approach is that it enables thedetection of heel strike and toe off events in each gait cycle. In addition, it helps in estimating footorientation and position. Even though gait variability can be analyzed by walking in a straight line,

Sensors 2020, 20, 957 4 of 25
gait analysis concentrating merely on straight walking or running may not be adequate to interpret gaitvariability, since changing walking directions or turning have effects on extrinsic gait variability [11].Similar research was done recently in [32], where the research group used the FSR sensor to developthe smart foot sole which transmits wirelessly the vGRF to a computer, and the patients were asked towalk on treadmill during the signal acquisition. Liu et al. [11] developed a wearable measuring insoleusing five triaxial force sensors in each shoe capable of measuring GRF and center of pressure (COP)on insole. The GRF results showed a great correspondence between the insole and the reference data.Kim et al. [33] conducted a similar study, where they have used similar triaxial force sensors and thesensors performance were tested on seven healthy male subjects. An in-shoe plantar measurementsensor with 64 sensing points made from an optoelectronics transducer covered with silicon in a matrixform covering 80% of contact region between the foot and the insole and handling capability of 1MPawas implemented by De Rossi et al. to measure COP and vGRF [5]. Howel et al. [3] demonstrated thedesign of a wearable smart insole using low-cost FSRs for gait analysis. This provided subject-specificlinear regression models to determine the vGRF accurately using simultaneous collected data frommotion analysis laboratory. However, insufficient information was given about the sensors calibrationand the hardware design of the insole and the wireless system to transmit the data to host PC, makingit difficult for other researchers to replicate the work.
Even though systematic sensor calibration with clear steps was followed by different researchteams, expensive calibration devices were used to calibrate the force sensors. Some research teamscarried out the experiments on the smart insoles in motion analysis labs, where simultaneous datacollection from infrared motion capture cameras/RGB depth camera and force plates were done asreference measurement for the collected insole data [34,35]. In addition, some research teams used auniversal testing machine to apply incremental weight values to sensor active area during calibration.Barnea et al. [36] used the CETR Universal Micro-Tribometer (UMT)-2 micro tribometer) device forcalibrations, that can apply precise weights in X, Y and Z directions. Marco et al. [5] performed thesensor calibrations using robotic platform that can precisely apply controllable loads to the desiredpositions. Parmar et al. [37] evaluated the performance of 5 different commercial FSRs during staticand dynamic loading with reliable test setups that can mimic realistic conditions when applyingpressure on human limbs. The sensors were evaluated quantitatively based on their accuracy, drift,and repeatability behaviors. The tested sensors showed lower accuracy levels with static pressurescompared to the dynamic pressure test, with high drift values. This necessitates the need for furtherstudy and analysis on the use of FSRs for static pressure applications.
3. Methodology
This section demonstrates the design of a complete system describing the main blocks of the smartinsole along with illustrations of sensor calibration and insole characterization process.
3.1. Smart Insole Sub-System
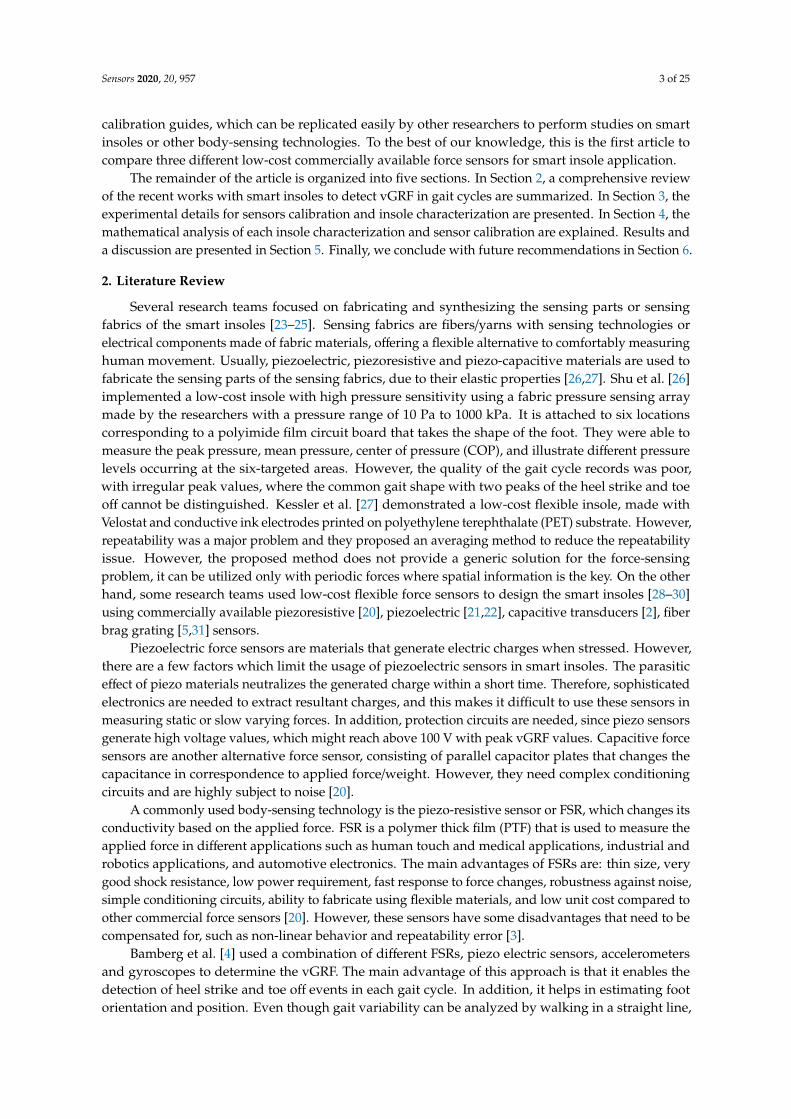
Figure 1 shows the complete block diagram of the system, where the pressure sensor arraywas placed in a customized shoe above the control circuit. Pressure data were digitized through amicrocontroller before they were sent wirelessly to a host computer for post processing and analysis.This subsystem was powered by a battery with the help of a power management unit. Pressure datawere analyzed to extract various gait characteristics for different gait applications.
Sensors 2020, 20, 957 5 of 25
Sensors 2020, 20, 957 5 of 25
relation between the applied force and the sensor’s resistance. In addition, no direct relationship is
provided in the sensor’s datasheet. Therefore, proper calibration must be done prior to the sensor
usage.
Figure 1. Smart insole block diagram.
B. Ceramic Piezoelectric Sensor
A piezoelectric element is a sensor that produces an alternating voltage in response to an applied
dynamic pressure or vibration. With applications related to dynamic forces, the piezoelectric sensor
is highly recommended. When a force applied to the piezoelectric crystal element, the net movement
of both positive and negative ions occurs. When there is a constant or zero pressure, the dipole is not
formed [38]. It is important to mention that the force plate is originally made of piezoelectric material
mounted between two metal plates to produce three‐dimensional forces with a special mechanical
arrangement [39]. This comes in different sizes; however, a ceramic piezoelectric element with 12.8
mm electrode diameter would be suitable to obtain a high‐resolution pressure map as shown in
Figure 2b.
C. Micro‐Electromechanical Systems (MEMS) Sensor
The micro‐electromechanical systems (MEMS) sensor is a new member of piezoelectric sensors
family (Figure 2c). Similar to ceramic piezo electric sensors, it converts mechanical forces into
electrical signals. However, the MEMS sensor can detect forces in x, y or z axes generating electrical
impulses with positive or negative amplitudes depending on the force direction on a certain axis[40].
MEMS sensors are useful for detecting human motion sensor due to their flexibility, wide frequency
range (0.001 Hz to 10 MHz), low acoustic impedance, high mechanical strengths, and high stability
resisting moisture, etc. [40].
Figure 2. (A) Force‐sensitive resistor (FSR) sensor from Interlink Electronics [20], (B) piezo‐electric
sensor from Murata Manufacturing Co.[38], (C) micro‐electromechanical systems (MEMS) sensor
LDT0‐028K from Measurement Specialties Inc. [40].
A B C
Figure 1. Smart insole block diagram.
3.1.1. Pressure-Sensing Array
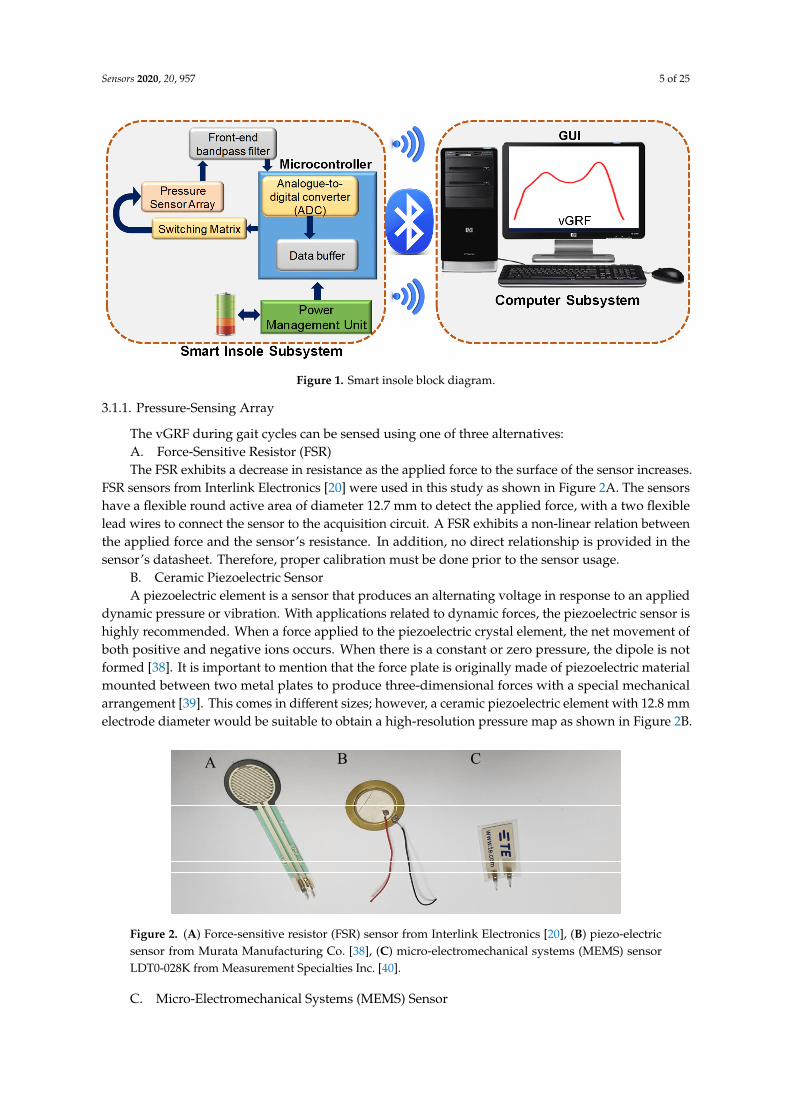
The vGRF during gait cycles can be sensed using one of three alternatives:A. Force-Sensitive Resistor (FSR)The FSR exhibits a decrease in resistance as the applied force to the surface of the sensor increases.
FSR sensors from Interlink Electronics [20] were used in this study as shown in Figure 2A. The sensorshave a flexible round active area of diameter 12.7 mm to detect the applied force, with a two flexiblelead wires to connect the sensor to the acquisition circuit. A FSR exhibits a non-linear relation betweenthe applied force and the sensor’s resistance. In addition, no direct relationship is provided in thesensor’s datasheet. Therefore, proper calibration must be done prior to the sensor usage.
B. Ceramic Piezoelectric SensorA piezoelectric element is a sensor that produces an alternating voltage in response to an applied
dynamic pressure or vibration. With applications related to dynamic forces, the piezoelectric sensor ishighly recommended. When a force applied to the piezoelectric crystal element, the net movement ofboth positive and negative ions occurs. When there is a constant or zero pressure, the dipole is notformed [38]. It is important to mention that the force plate is originally made of piezoelectric materialmounted between two metal plates to produce three-dimensional forces with a special mechanicalarrangement [39]. This comes in different sizes; however, a ceramic piezoelectric element with 12.8 mmelectrode diameter would be suitable to obtain a high-resolution pressure map as shown in Figure 2B.
Sensors 2020, 20, 957 5 of 25
relation between the applied force and the sensor’s resistance. In addition, no direct relationship is
provided in the sensor’s datasheet. Therefore, proper calibration must be done prior to the sensor
usage.
Figure 1. Smart insole block diagram.
B. Ceramic Piezoelectric Sensor
A piezoelectric element is a sensor that produces an alternating voltage in response to an applied
dynamic pressure or vibration. With applications related to dynamic forces, the piezoelectric sensor
is highly recommended. When a force applied to the piezoelectric crystal element, the net movement
of both positive and negative ions occurs. When there is a constant or zero pressure, the dipole is not
formed [38]. It is important to mention that the force plate is originally made of piezoelectric material
mounted between two metal plates to produce three‐dimensional forces with a special mechanical
arrangement [39]. This comes in different sizes; however, a ceramic piezoelectric element with 12.8
mm electrode diameter would be suitable to obtain a high‐resolution pressure map as shown in
Figure 2b.
C. Micro‐Electromechanical Systems (MEMS) Sensor
The micro‐electromechanical systems (MEMS) sensor is a new member of piezoelectric sensors
family (Figure 2c). Similar to ceramic piezo electric sensors, it converts mechanical forces into
electrical signals. However, the MEMS sensor can detect forces in x, y or z axes generating electrical
impulses with positive or negative amplitudes depending on the force direction on a certain axis[40].
MEMS sensors are useful for detecting human motion sensor due to their flexibility, wide frequency
range (0.001 Hz to 10 MHz), low acoustic impedance, high mechanical strengths, and high stability
resisting moisture, etc. [40].
Figure 2. (A) Force‐sensitive resistor (FSR) sensor from Interlink Electronics [20], (B) piezo‐electric
sensor from Murata Manufacturing Co.[38], (C) micro‐electromechanical systems (MEMS) sensor
LDT0‐028K from Measurement Specialties Inc. [40].
A B C
Figure 2. (A) Force-sensitive resistor (FSR) sensor from Interlink Electronics [20], (B) piezo-electricsensor from Murata Manufacturing Co. [38], (C) micro-electromechanical systems (MEMS) sensorLDT0-028K from Measurement Specialties Inc. [40].
C. Micro-Electromechanical Systems (MEMS) Sensor
Sensors 2020, 20, 957 6 of 25
The micro-electromechanical systems (MEMS) sensor is a new member of piezoelectric sensorsfamily (Figure 2C). Similar to ceramic piezo electric sensors, it converts mechanical forces into electricalsignals. However, the MEMS sensor can detect forces in x, y or z axes generating electrical impulseswith positive or negative amplitudes depending on the force direction on a certain axis [40]. MEMSsensors are useful for detecting human motion sensor due to their flexibility, wide frequency range(0.001 Hz to 10 MHz), low acoustic impedance, high mechanical strengths, and high stability resistingmoisture, etc. [40].
3.1.2. Data Acquisition System
A. Microcontroller (MCU):A microcontroller (MCU) was used to collect the data from the sensor and to send to the computer
for classification. Simblee is a very compact and powerful ARM Cortex-M0 MCU with a six channels10-bit analog-to-digital converter (ADC). It is featured with an inter-integrated circuit (I2C) and serialperipheral interface (SPI) communication interface, which were required for 9-degree of freedom (DOF)module. Moreover, it has an incorporated Bluetooth low energy (BLE) 4.0 module, which can beutilized to send data to the computer. This MCU operates on a power supply between +2.1 to 3.6 V.
B. Multiplexer (MUX)Since MCU has a limited number of ADC channels whereas the number of sensors is needed for
better spatial resolution of smart insole, it is suggested to use multiplexers (MUX) to reduce the numberof required channels in MCU. A MUX allows several inputs in parallel to be routed into a single outputdepending on the input combinations of the data selectors. Active area of these sensors are closeand sixteen sensors were used to create sensors’ array for each leg insole to obtain a high-resolutionpressure map. Therefore, the CD74HC4067 multiplexer from Texas Instruments with 16 input channelswas used in this study [41].
3.1.3. Transmission Techniques
Three commonly used transmission techniques for connected biomedical sensors are ZigBee,Bluetooth Low Energy (BLE) and Wi-Fi. ZigBee is a two-way wireless communication techniquedeveloped for sensors and control networks, which need a wider range, low latency, low energyconsumption at lower data rates. BLE is an alternative to the classical Bluetooth with higher data rateand low power consumption within a limited area with low latency at 2.4 GHz. Wi-Fi makes a goodcandidate for transmitting data with a data rate of up to 450 Mbps for indoor applications. However, itimposes latency on the system of more than 25 ms and higher power consumption. Table 1 shows acomparison between three different communication interfaces.
Table 1. Transmission methods comparison [42–46].
Latency Speed Power Consumption Range
ZigBee 15 ms 250 Kbps 9.3 mA 291 mBluetooth Low
Energy 6 ms 1–11 Mbps 4.5 mA 10 m
Wi-Fi ≥25 ms1.3 Gbps over 5
GHz and 450 Mbpsover 2.4 GHz
35 mA 50 m
Since the smart insole was intended for indoor application, BLE and WiFi both were suitable forcommunication interface; however, the higher power consumption and latency made WiFi non-suitablefor smart insole application. Moreover, Simblee MCU has in-built BLE in its small form factor.Therefore, BLE has been chosen as communication interface.
Sensors 2020, 20, 957 7 of 25
3.1.4. Power Management Unit (PMU)
Power supplies were chosen depending on the operating voltage of the system components. Themicrocontroller and multiplexer both can operate at 3.3 V. The power management unit (PMU) isLiPo Charger/Booster module MCP73831 [47] and AMS1117 voltage regulator connected to a LithiumPolymer (LiPo) battery of 3.7 V (1000 mAh), which was regulated to 3.3 V. The PMU is not onlydelivering regulated 3.3 V to the system but also capable to charge LiPo battery.
3.1.5. Host Computer
The acquired data from smart insole can be sent wirelessly to a host computer, where postprocessing, thereby displaying the vGRF as pressure maps during gait cycle, was carried out.The obtained data can be used in different gait analysis applications such as medical diagnostics,rehabilitation and athlete’s performance assessment.
3.2. Sensors’ Calibration
The first step in designing the smart insole is to calibrate the force sensors that are going to beused to detect the vGRF during the gait cycle. Three different force sensors were calibrated: FSR [20],piezo-electric sensor [21] and piezo -vibration sensor [22].
3.2.1. Force-Sensitive Resistor (FSR) Calibration
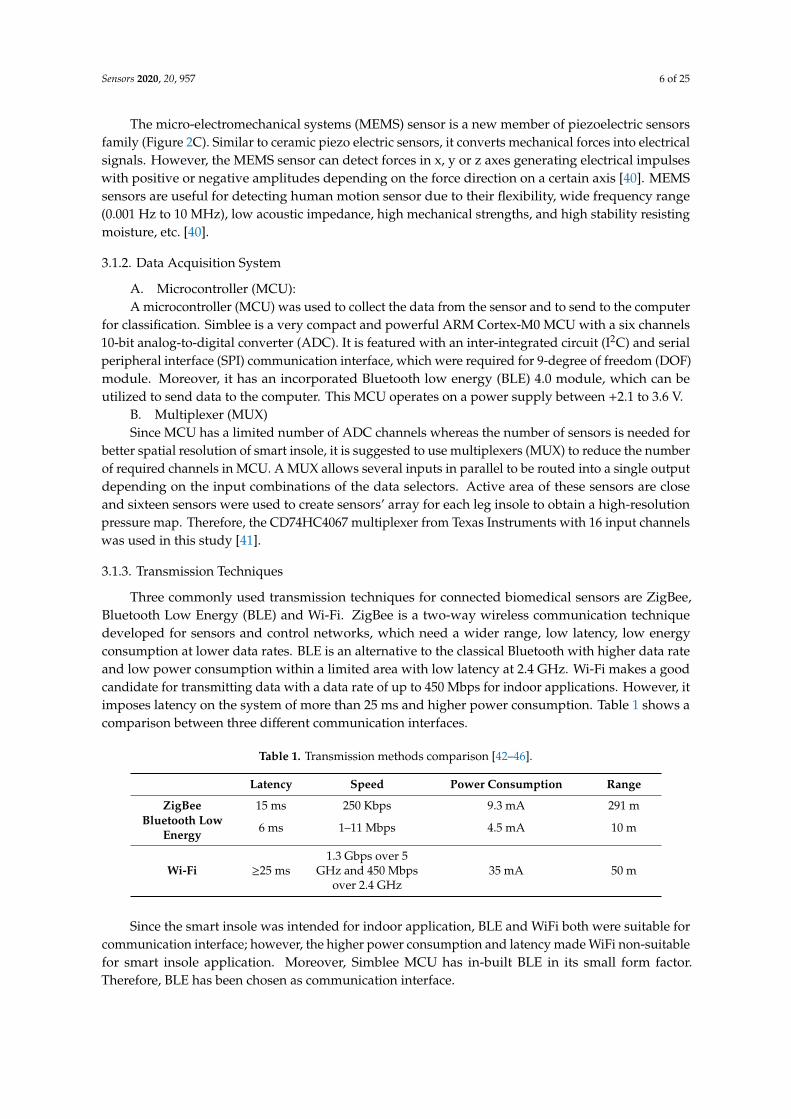
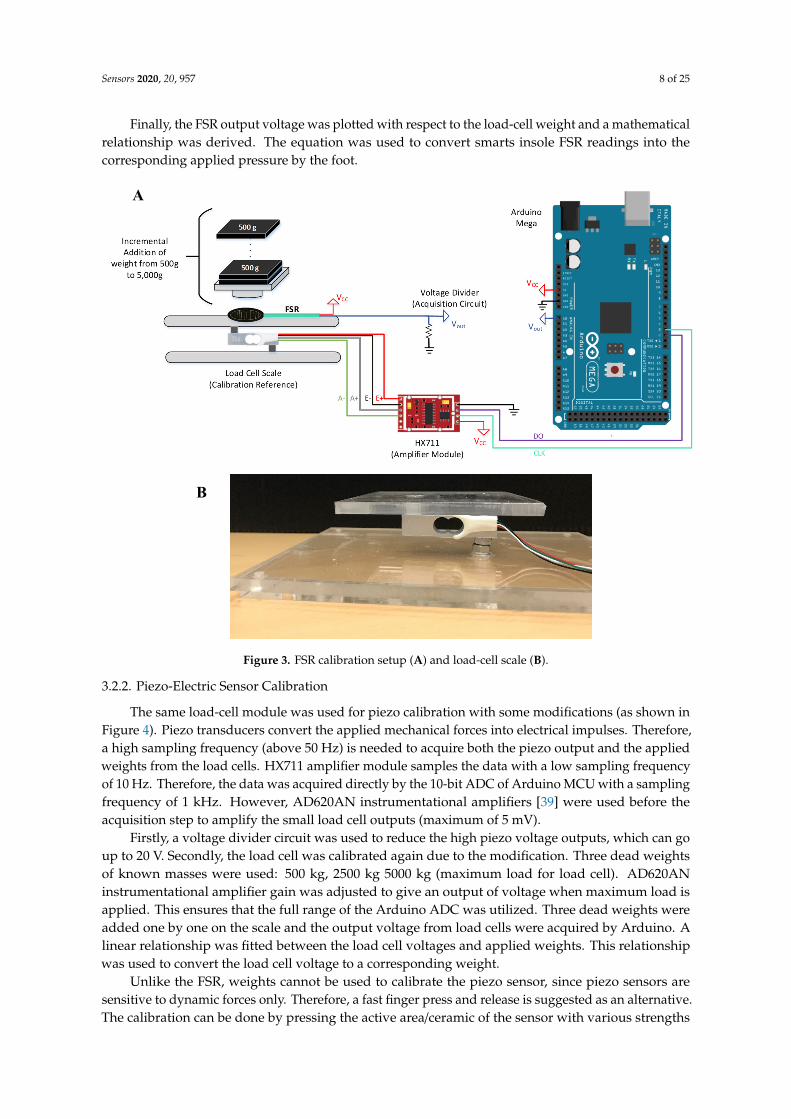
Firstly, a voltage divider circuit must be used with the sensor to convert the resistance change (dueto applied force) of the sensor to a voltage value, which can be acquired by microcontrollers. Secondly, aload cell of 5kg from HT sensor technology company [48], with HX711 amplifier modules [15] was usedas a weight reference for FSR calibration (Figure 3). The load cells consist of straight metal bar with twostrain gauge sensors and two normal resistors arranged in a Whitestone bridge configuration, a constantexcitation voltage (3–5 V) can be applied as an input to the circuit and the balanced configuration ofthe circuit replicates a zero output voltage in normal conditions when no force is applied. Any forceapplied to the load cell results in an unbalanced condition of the bridge leading to small voltage valuesin the output that can be detected and converted to force [48]. The load cell has high sensitivity andcan detect as small as 1 gm of weight variation. However, the output voltage from the load cell is verysmall, with a maximum value of 5 mV. Therefore, a HX711 amplifier module was used. The amplifiermodule has instrumentational amplifier to amplify the signal with a 24-bit ADC that converts theanalog signal from the load cell bridge to digital value that is readable by a microcontroller. The HX711transmits data to the microcontroller using I2C communication protocol with 10Hz sampling rate [15].
The bar-type load cell was mounted with screws and spacers so that the strain can be measuredcorrectly (refer Figure 3B). The load cell was placed between two plates with only one side screwedinto each plate/board. This setup provides a moment of force on the strain gauges rather than just asingle compression force, resulting in higher sensitivity to applied forces. The output voltage from theload cell exhibits a linear relationship with the applied force. This can be calibrated easily with anysmall object of known mass such as a coin that weighs a few grams.
A known weight object (ex. a coin) was placed on load cell plate; the calibration factor wasadjusted until the output reading matches the known weight. Once the correct calibration factor isobtained, it was used to convert the load cell voltages to corresponding weights. The calibration factoris the slope of output voltage of load cell vs. real weights’ graph. The FSR was attached to adhesivematerial on the back face of the active area, which was used to fix the FSR on the scale. A cylindricalacrylic of 12.7 mm diameter, matching the active area of FSR, was used to apply force on the sensoronly. In addition, a square shaped acrylic plate was glued on top of the cylindrical acrylic to supportthe weights, as shown in Figure 3. Then, 500 g weights are placed every 4 to 5 s until 5000 g is reached.Readings from load cell and FSR circuit are acquired simultaneously by Arduino, which were saved ina text file in a computer.
Sensors 2020, 20, 957 8 of 25
Finally, the FSR output voltage was plotted with respect to the load-cell weight and a mathematicalrelationship was derived. The equation was used to convert smarts insole FSR readings into thecorresponding applied pressure by the foot.
Sensors 2020, 20, 957 7 of 25
The acquired data from smart insole can be sent wirelessly to a host computer, where post
processing, thereby displaying the vGRF as pressure maps during gait cycle, was carried out. The
obtained data can be used in different gait analysis applications such as medical diagnostics,
rehabilitation and athlete’s performance assessment.
3.2. Sensors’ Calibration
The first step in designing the smart insole is to calibrate the force sensors that are going to be
used to detect the vGRF during the gait cycle. Three different force sensors were calibrated: FSR [20],
piezo‐electric sensor [21] and piezo ‐vibration sensor [22].
3.2.1. Force‐Sensitive Resistor (FSR) Calibration
Firstly, a voltage divider circuit must be used with the sensor to convert the resistance change
(due to applied force) of the sensor to a voltage value, which can be acquired by microcontrollers.
Secondly, a load cell of 5kg from HT sensor technology company [48], with HX711 amplifier modules
[15] was used as a weight reference for FSR calibration (Figure 3). The load cells consist of straight
metal bar with two strain gauge sensors and two normal resistors arranged in a Whitestone bridge
configuration, a constant excitation voltage (3–5 V) can be applied as an input to the circuit and the
balanced configuration of the circuit replicates a zero output voltage in normal conditions when no
force is applied. Any force applied to the load cell results in an unbalanced condition of the bridge
leading to small voltage values in the output that can be detected and converted to force [48]. The
load cell has high sensitivity and can detect as small as 1 gm of weight variation. However, the output
voltage from the load cell is very small, with a maximum value of 5 mV. Therefore, a HX711 amplifier
module was used. The amplifier module has instrumentational amplifier to amplify the signal with
a 24‐bit ADC that converts the analog signal from the load cell bridge to digital value that is readable
by a microcontroller. The HX711 transmits data to the microcontroller using I2C communication
protocol with 10Hz sampling rate [15].
A
Sensors 2020, 20, 957 8 of 25
Figure 3. FSR calibration setup (a) and load‐cell scale (b).
The bar‐type load cell was mounted with screws and spacers so that the strain can be measured
correctly (refer Figure 3b). The load cell was placed between two plates with only one side screwed
into each plate/board. This setup provides a moment of force on the strain gauges rather than just a
single compression force, resulting in higher sensitivity to applied forces. The output voltage from the
load cell exhibits a linear relationship with the applied force. This can be calibrated easily with any
small object of known mass such as a coin that weighs a few grams.
A known weight object (ex. a coin) was placed on load cell plate; the calibration factor was
adjusted until the output reading matches the known weight. Once the correct calibration factor is
obtained, it was used to convert the load cell voltages to corresponding weights. The calibration factor
is the slope of output voltage of load cell vs. real weights’ graph. The FSR was attached to adhesive
material on the back face of the active area, which was used to fix the FSR on the scale. A cylindrical
acrylic of 12.7 mm diameter, matching the active area of FSR, was used to apply force on the sensor
only. In addition, a square shaped acrylic plate was glued on top of the cylindrical acrylic to support
the weights, as shown in Figure 3. Then, 500 g weights are placed every 4 to 5 s until 5000 g is reached.
Readings from load cell and FSR circuit are acquired simultaneously by Arduino, which were saved in
a text file in a computer.
Finally, the FSR output voltage was plotted with respect to the load‐cell weight and a
mathematical relationship was derived. The equation was used to convert smarts insole FSR readings
into the corresponding applied pressure by the foot.
3.2.2. Piezo‐Electric Sensor Calibration
The same load‐cell module was used for piezo calibration with some modifications (as shown in
Figure 4). Piezo transducers convert the applied mechanical forces into electrical impulses. Therefore,
a high sampling frequency (above 50 Hz) is needed to acquire both the piezo output and the applied
weights from the load cells. HX711 amplifier module samples the data with a low sampling frequency
of 10 Hz. Therefore, the data was acquired directly by the 10‐bit ADC of Arduino MCU with a
sampling frequency of 1 kHz. However, AD620AN instrumentational amplifiers [39] were used
before the acquisition step to amplify the small load cell outputs (maximum of 5mV).
B
Figure 3. FSR calibration setup (A) and load-cell scale (B).
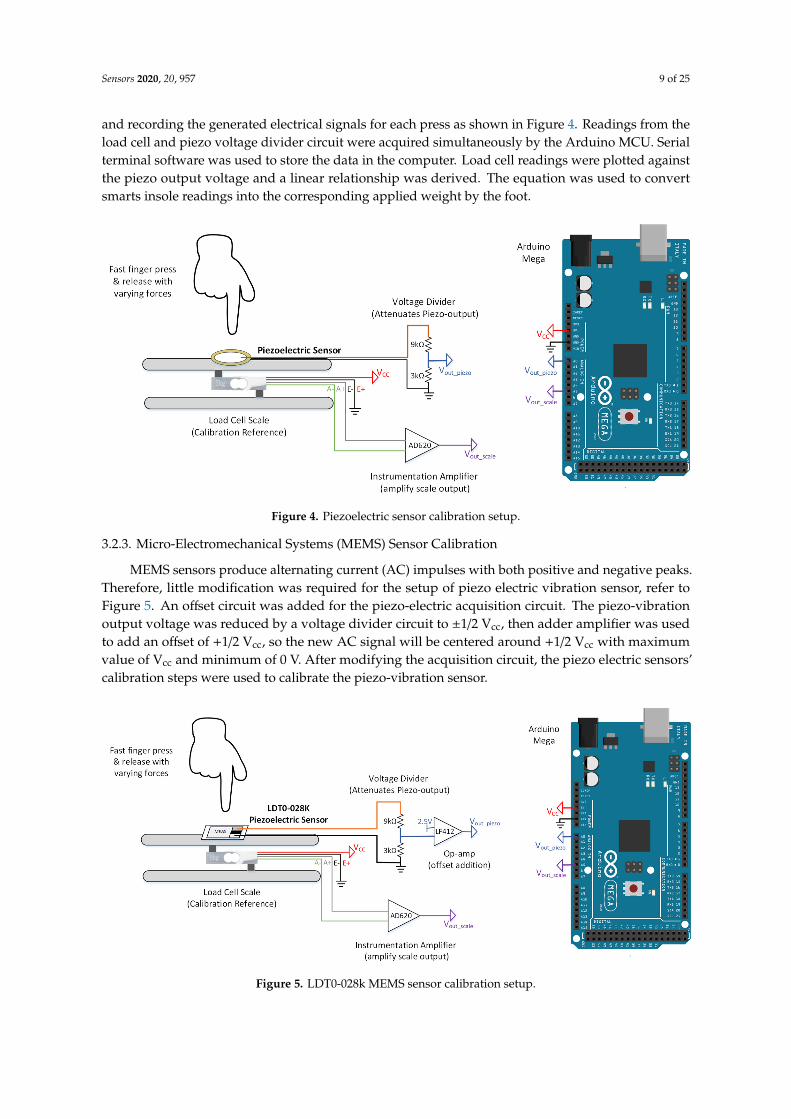
3.2.2. Piezo-Electric Sensor Calibration
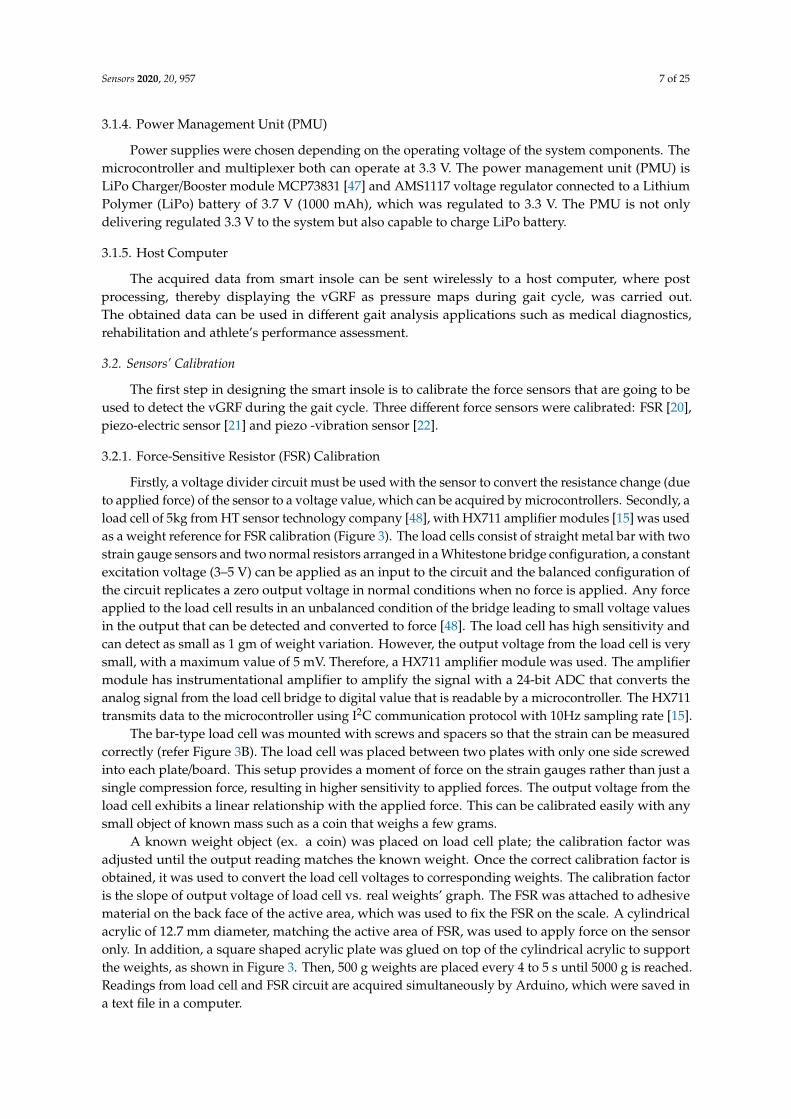
The same load-cell module was used for piezo calibration with some modifications (as shown inFigure 4). Piezo transducers convert the applied mechanical forces into electrical impulses. Therefore,a high sampling frequency (above 50 Hz) is needed to acquire both the piezo output and the appliedweights from the load cells. HX711 amplifier module samples the data with a low sampling frequencyof 10 Hz. Therefore, the data was acquired directly by the 10-bit ADC of Arduino MCU with a samplingfrequency of 1 kHz. However, AD620AN instrumentational amplifiers [39] were used before theacquisition step to amplify the small load cell outputs (maximum of 5 mV).
Firstly, a voltage divider circuit was used to reduce the high piezo voltage outputs, which can goup to 20 V. Secondly, the load cell was calibrated again due to the modification. Three dead weightsof known masses were used: 500 kg, 2500 kg 5000 kg (maximum load for load cell). AD620ANinstrumentational amplifier gain was adjusted to give an output of voltage when maximum load isapplied. This ensures that the full range of the Arduino ADC was utilized. Three dead weights wereadded one by one on the scale and the output voltage from load cells were acquired by Arduino. Alinear relationship was fitted between the load cell voltages and applied weights. This relationshipwas used to convert the load cell voltage to a corresponding weight.
Unlike the FSR, weights cannot be used to calibrate the piezo sensor, since piezo sensors aresensitive to dynamic forces only. Therefore, a fast finger press and release is suggested as an alternative.The calibration can be done by pressing the active area/ceramic of the sensor with various strengths
Sensors 2020, 20, 957 9 of 25
and recording the generated electrical signals for each press as shown in Figure 4. Readings from theload cell and piezo voltage divider circuit were acquired simultaneously by the Arduino MCU. Serialterminal software was used to store the data in the computer. Load cell readings were plotted againstthe piezo output voltage and a linear relationship was derived. The equation was used to convertsmarts insole readings into the corresponding applied weight by the foot.Sensors 2020, 20, 957 9 of 25
Figure 4. Piezoelectric sensor calibration setup.
Firstly, a voltage divider circuit was used to reduce the high piezo voltage outputs, which can
go up to 20 V. Secondly, the load cell was calibrated again due to the modification. Three dead
weights of known masses were used: 500 kg, 2500 kg 5000 kg (maximum load for load cell).
AD620AN instrumentational amplifier gain was adjusted to give an output of voltage when
maximum load is applied. This ensures that the full range of the Arduino ADC was utilized. Three
dead weights were added one by one on the scale and the output voltage from load cells were
acquired by Arduino. A linear relationship was fitted between the load cell voltages and applied
weights. This relationship was used to convert the load cell voltage to a corresponding weight.
Unlike the FSR, weights cannot be used to calibrate the piezo sensor, since piezo sensors are
sensitive to dynamic forces only. Therefore, a fast finger press and release is suggested as an
alternative. The calibration can be done by pressing the active area/ceramic of the sensor with various
strengths and recording the generated electrical signals for each press as shown in Figure 4. Readings
from the load cell and piezo voltage divider circuit were acquired simultaneously by the Arduino
MCU. Serial terminal software was used to store the data in the computer. Load cell readings were
plotted against the piezo output voltage and a linear relationship was derived. The equation was
used to convert smarts insole readings into the corresponding applied weight by the foot.
3.2.3. Micro‐Electromechanical Systems (MEMS) Sensor Calibration
MEMS sensors produce alternating current (AC) impulses with both positive and negative
peaks. Therefore, little modification was required for the setup of piezo electric vibration sensor, refer
to Figure 5. An offset circuit was added for the piezo‐electric acquisition circuit. The piezo‐vibration
output voltage was reduced by a voltage divider circuit to ±1/2 Vcc, then adder amplifier was used to
add an offset of +1/2 Vcc, so the new AC signal will be centered around +1/2 Vcc with maximum value
of Vcc and minimum of 0 V. After modifying the acquisition circuit, the piezo electric sensors’
calibration steps were used to calibrate the piezo‐vibration sensor.
Figure 4. Piezoelectric sensor calibration setup.
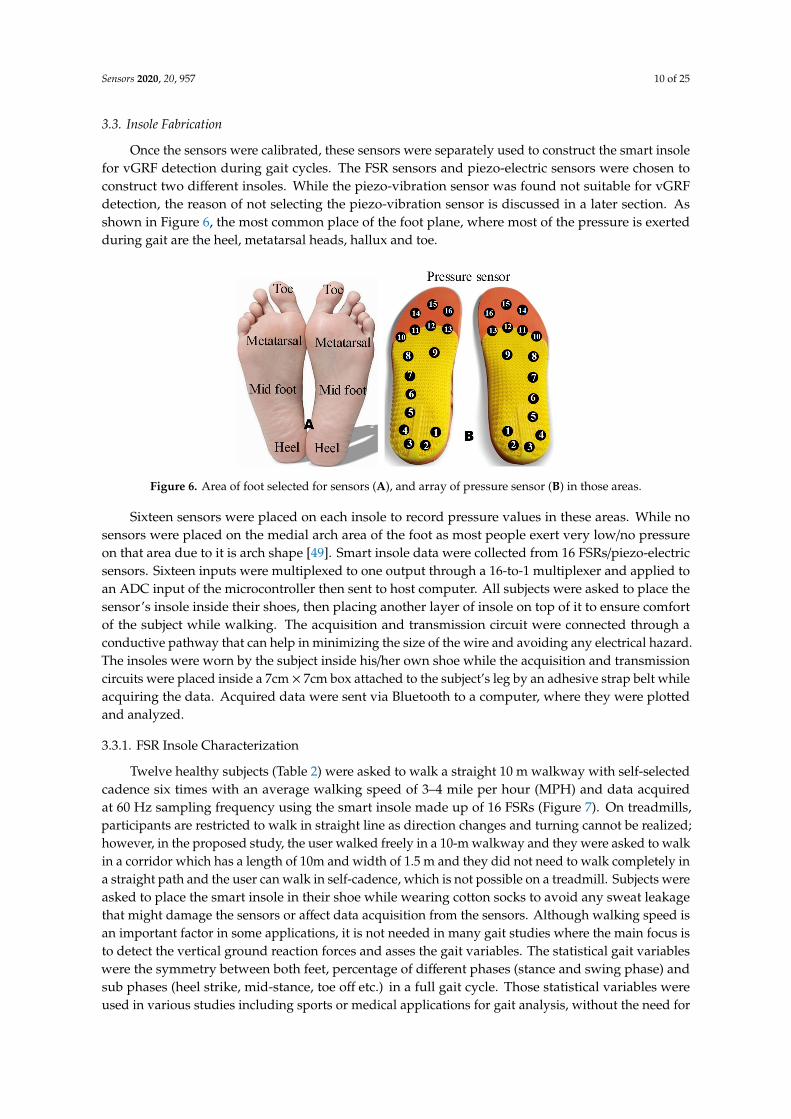
3.2.3. Micro-Electromechanical Systems (MEMS) Sensor Calibration
MEMS sensors produce alternating current (AC) impulses with both positive and negative peaks.Therefore, little modification was required for the setup of piezo electric vibration sensor, refer toFigure 5. An offset circuit was added for the piezo-electric acquisition circuit. The piezo-vibrationoutput voltage was reduced by a voltage divider circuit to ±1/2 Vcc, then adder amplifier was usedto add an offset of +1/2 Vcc, so the new AC signal will be centered around +1/2 Vcc with maximumvalue of Vcc and minimum of 0 V. After modifying the acquisition circuit, the piezo electric sensors’calibration steps were used to calibrate the piezo-vibration sensor.Sensors 2020, 20, 957 10 of 25
Figure 5. LDT0‐028k MEMS sensor calibration setup.
3.3. Insole Fabrication
Once the sensors were calibrated, these sensors were separately used to construct the smart
insole for vGRF detection during gait cycles. The FSR sensors and piezo‐electric sensors were chosen
to construct two different insoles. While the piezo‐vibration sensor was found not suitable for vGRF
detection, the reason of not selecting the piezo‐vibration sensor is discussed in a later section. As
shown in Figure 6, the most common place of the foot plane, where most of the pressure is exerted
during gait are the heel, metatarsal heads, hallux and toe.
Sixteen sensors were placed on each insole to record pressure values in these areas. While no
sensors were placed on the medial arch area of the foot as most people exert very low/no pressure on
that area due to it is arch shape [49]. Smart insole data were collected from 16 FSRs/piezo‐electric
sensors. Sixteen inputs were multiplexed to one output through a 16‐to‐1 multiplexer and applied to
an ADC input of the microcontroller then sent to host computer. All subjects were asked to place the
sensor’s insole inside their shoes, then placing another layer of insole on top of it to ensure comfort
of the subject while walking. The acquisition and transmission circuit were connected through a
conductive pathway that can help in minimizing the size of the wire and avoiding any electrical
hazard. The insoles were worn by the subject inside his/her own shoe while the acquisition and
transmission circuits were placed inside a 7cm × 7cm box attached to the subject’s leg by an adhesive
strap belt while acquiring the data. Acquired data were sent via Bluetooth to a computer, where they
were plotted and analyzed.
Figure 6. Area of foot selected for sensors (A), and array of pressure sensor (B) in those areas.
3.3.1. FSR Insole Characterization
Figure 5. LDT0-028k MEMS sensor calibration setup.
Sensors 2020, 20, 957 10 of 25
3.3. Insole Fabrication
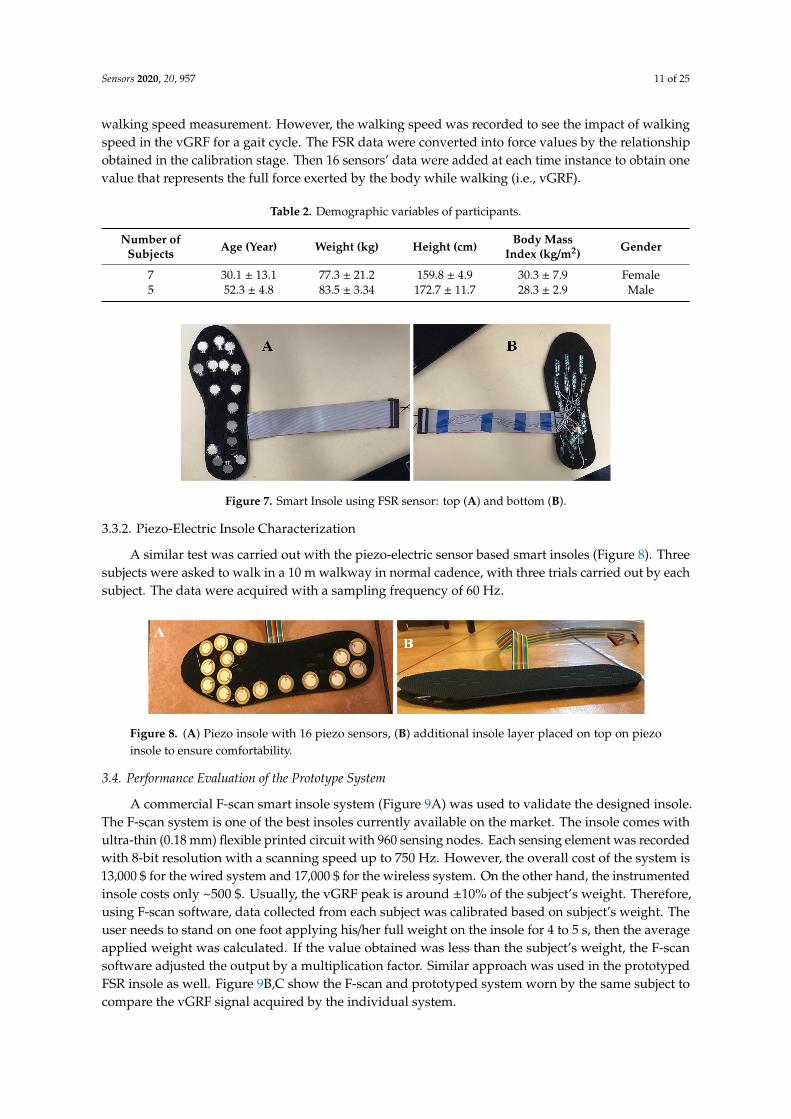
Once the sensors were calibrated, these sensors were separately used to construct the smart insolefor vGRF detection during gait cycles. The FSR sensors and piezo-electric sensors were chosen toconstruct two different insoles. While the piezo-vibration sensor was found not suitable for vGRFdetection, the reason of not selecting the piezo-vibration sensor is discussed in a later section. Asshown in Figure 6, the most common place of the foot plane, where most of the pressure is exertedduring gait are the heel, metatarsal heads, hallux and toe.
Sensors 2020, 20, 957 10 of 25
Figure 5. LDT0‐028k MEMS sensor calibration setup.
3.3. Insole Fabrication
Once the sensors were calibrated, these sensors were separately used to construct the smart
insole for vGRF detection during gait cycles. The FSR sensors and piezo‐electric sensors were chosen
to construct two different insoles. While the piezo‐vibration sensor was found not suitable for vGRF
detection, the reason of not selecting the piezo‐vibration sensor is discussed in a later section. As
shown in Figure 6, the most common place of the foot plane, where most of the pressure is exerted
during gait are the heel, metatarsal heads, hallux and toe.
Sixteen sensors were placed on each insole to record pressure values in these areas. While no
sensors were placed on the medial arch area of the foot as most people exert very low/no pressure on
that area due to it is arch shape [49]. Smart insole data were collected from 16 FSRs/piezo‐electric
sensors. Sixteen inputs were multiplexed to one output through a 16‐to‐1 multiplexer and applied to
an ADC input of the microcontroller then sent to host computer. All subjects were asked to place the
sensor’s insole inside their shoes, then placing another layer of insole on top of it to ensure comfort
of the subject while walking. The acquisition and transmission circuit were connected through a
conductive pathway that can help in minimizing the size of the wire and avoiding any electrical
hazard. The insoles were worn by the subject inside his/her own shoe while the acquisition and
transmission circuits were placed inside a 7cm × 7cm box attached to the subject’s leg by an adhesive
strap belt while acquiring the data. Acquired data were sent via Bluetooth to a computer, where they
were plotted and analyzed.
Figure 6. Area of foot selected for sensors (A), and array of pressure sensor (B) in those areas.
3.3.1. FSR Insole Characterization
Figure 6. Area of foot selected for sensors (A), and array of pressure sensor (B) in those areas.
Sixteen sensors were placed on each insole to record pressure values in these areas. While nosensors were placed on the medial arch area of the foot as most people exert very low/no pressureon that area due to it is arch shape [49]. Smart insole data were collected from 16 FSRs/piezo-electricsensors. Sixteen inputs were multiplexed to one output through a 16-to-1 multiplexer and applied toan ADC input of the microcontroller then sent to host computer. All subjects were asked to place thesensor’s insole inside their shoes, then placing another layer of insole on top of it to ensure comfortof the subject while walking. The acquisition and transmission circuit were connected through aconductive pathway that can help in minimizing the size of the wire and avoiding any electrical hazard.The insoles were worn by the subject inside his/her own shoe while the acquisition and transmissioncircuits were placed inside a 7cm × 7cm box attached to the subject’s leg by an adhesive strap belt whileacquiring the data. Acquired data were sent via Bluetooth to a computer, where they were plottedand analyzed.
3.3.1. FSR Insole Characterization
Twelve healthy subjects (Table 2) were asked to walk a straight 10 m walkway with self-selectedcadence six times with an average walking speed of 3–4 mile per hour (MPH) and data acquiredat 60 Hz sampling frequency using the smart insole made up of 16 FSRs (Figure 7). On treadmills,participants are restricted to walk in straight line as direction changes and turning cannot be realized;however, in the proposed study, the user walked freely in a 10-m walkway and they were asked to walkin a corridor which has a length of 10m and width of 1.5 m and they did not need to walk completely ina straight path and the user can walk in self-cadence, which is not possible on a treadmill. Subjects wereasked to place the smart insole in their shoe while wearing cotton socks to avoid any sweat leakagethat might damage the sensors or affect data acquisition from the sensors. Although walking speed isan important factor in some applications, it is not needed in many gait studies where the main focus isto detect the vertical ground reaction forces and asses the gait variables. The statistical gait variableswere the symmetry between both feet, percentage of different phases (stance and swing phase) andsub phases (heel strike, mid-stance, toe off etc.) in a full gait cycle. Those statistical variables wereused in various studies including sports or medical applications for gait analysis, without the need for
Sensors 2020, 20, 957 11 of 25
walking speed measurement. However, the walking speed was recorded to see the impact of walkingspeed in the vGRF for a gait cycle. The FSR data were converted into force values by the relationshipobtained in the calibration stage. Then 16 sensors’ data were added at each time instance to obtain onevalue that represents the full force exerted by the body while walking (i.e., vGRF).
Table 2. Demographic variables of participants.
Number ofSubjects Age (Year) Weight (kg) Height (cm) Body Mass
Index (kg/m2) Gender
7 30.1 ± 13.1 77.3 ± 21.2 159.8 ± 4.9 30.3 ± 7.9 Female5 52.3 ± 4.8 83.5 ± 3.34 172.7 ± 11.7 28.3 ± 2.9 Male
Sensors 2020, 20, 957 11 of 25
Twelve healthy subjects (Table 2) were asked to walk a straight 10 m walkway with self‐selected
cadence six times with an average walking speed of 3–4 mile per hour (MPH) and data acquired at
60 Hz sampling frequency using the smart insole made up of 16 FSRs (Figure 7). On treadmills,
participants are restricted to walk in straight line as direction changes and turning cannot be realized;
however, in the proposed study, the user walked freely in a 10‐m walkway and they were asked to
walk in a corridor which has a length of 10m and width of 1.5 m and they did not need to walk
completely in a straight path and the user can walk in self‐cadence, which is not possible on a
treadmill. Subjects were asked to place the smart insole in their shoe while wearing cotton socks to
avoid any sweat leakage that might damage the sensors or affect data acquisition from the sensors.
Although walking speed is an important factor in some applications, it is not needed in many gait
studies where the main focus is to detect the vertical ground reaction forces and asses the gait
variables. The statistical gait variables were the symmetry between both feet, percentage of different
phases (stance and swing phase) and sub phases (heel strike, mid‐stance, toe off etc.) in a full gait
cycle. Those statistical variables were used in various studies including sports or medical applications
for gait analysis, without the need for walking speed measurement. However, the walking speed was
recorded to see the impact of walking speed in the vGRF for a gait cycle. The FSR data were converted
into force values by the relationship obtained in the calibration stage. Then 16 sensors’ data were
added at each time instance to obtain one value that represents the full force exerted by the body
while walking (i.e., vGRF).
Table 2. Demographic variables of participants.
Number of Subjects Age (Year) Weight (kg) Height (cm) Body Mass Index
(kg/m2) Gender
7 30.1 ± 13.1 77.3 ± 21.2 159.8 ± 4.9 30.3 ± 7.9 Female
5 52.3 ± 4.8 83.5 ± 3.34 172.7 ± 11.7 28.3 ± 2.9 Male
Figure 7. Smart Insole using FSR sensor: top (A) and bottom (B).
3.3.2. Piezo‐Electric Insole Characterization
A similar test was carried out with the piezo‐electric sensor based smart insoles (Figure 8). Three
subjects were asked to walk in a 10 m walkway in normal cadence, with three trials carried out by
each subject. The data were acquired with a sampling frequency of 60 Hz.
Figure 8. (A) Piezo insole with 16 piezo sensors, (B) additional insole layer placed on top on piezo
insole to ensure comfortability.
Figure 7. Smart Insole using FSR sensor: top (A) and bottom (B).
3.3.2. Piezo-Electric Insole Characterization
A similar test was carried out with the piezo-electric sensor based smart insoles (Figure 8). Threesubjects were asked to walk in a 10 m walkway in normal cadence, with three trials carried out by eachsubject. The data were acquired with a sampling frequency of 60 Hz.
Sensors 2020, 20, 957 11 of 25
Twelve healthy subjects (Table 2) were asked to walk a straight 10 m walkway with self‐selected
cadence six times with an average walking speed of 3–4 mile per hour (MPH) and data acquired at
60 Hz sampling frequency using the smart insole made up of 16 FSRs (Figure 7). On treadmills,
participants are restricted to walk in straight line as direction changes and turning cannot be realized;
however, in the proposed study, the user walked freely in a 10‐m walkway and they were asked to
walk in a corridor which has a length of 10m and width of 1.5 m and they did not need to walk
completely in a straight path and the user can walk in self‐cadence, which is not possible on a
treadmill. Subjects were asked to place the smart insole in their shoe while wearing cotton socks to
avoid any sweat leakage that might damage the sensors or affect data acquisition from the sensors.
Although walking speed is an important factor in some applications, it is not needed in many gait
studies where the main focus is to detect the vertical ground reaction forces and asses the gait
variables. The statistical gait variables were the symmetry between both feet, percentage of different
phases (stance and swing phase) and sub phases (heel strike, mid‐stance, toe off etc.) in a full gait
cycle. Those statistical variables were used in various studies including sports or medical applications
for gait analysis, without the need for walking speed measurement. However, the walking speed was
recorded to see the impact of walking speed in the vGRF for a gait cycle. The FSR data were converted
into force values by the relationship obtained in the calibration stage. Then 16 sensors’ data were
added at each time instance to obtain one value that represents the full force exerted by the body
while walking (i.e., vGRF).
Table 2. Demographic variables of participants.
Number of Subjects Age (Year) Weight (kg) Height (cm) Body Mass Index
(kg/m2) Gender
7 30.1 ± 13.1 77.3 ± 21.2 159.8 ± 4.9 30.3 ± 7.9 Female
5 52.3 ± 4.8 83.5 ± 3.34 172.7 ± 11.7 28.3 ± 2.9 Male
Figure 7. Smart Insole using FSR sensor: top (A) and bottom (B).
3.3.2. Piezo‐Electric Insole Characterization
A similar test was carried out with the piezo‐electric sensor based smart insoles (Figure 8). Three
subjects were asked to walk in a 10 m walkway in normal cadence, with three trials carried out by
each subject. The data were acquired with a sampling frequency of 60 Hz.
Figure 8. (A) Piezo insole with 16 piezo sensors, (B) additional insole layer placed on top on piezo
insole to ensure comfortability. Figure 8. (A) Piezo insole with 16 piezo sensors, (B) additional insole layer placed on top on piezoinsole to ensure comfortability.
3.4. Performance Evaluation of the Prototype System
A commercial F-scan smart insole system (Figure 9A) was used to validate the designed insole.The F-scan system is one of the best insoles currently available on the market. The insole comes withultra-thin (0.18 mm) flexible printed circuit with 960 sensing nodes. Each sensing element was recordedwith 8-bit resolution with a scanning speed up to 750 Hz. However, the overall cost of the system is13,000 $ for the wired system and 17,000 $ for the wireless system. On the other hand, the instrumentedinsole costs only ~500 $. Usually, the vGRF peak is around ±10% of the subject’s weight. Therefore,using F-scan software, data collected from each subject was calibrated based on subject’s weight. Theuser needs to stand on one foot applying his/her full weight on the insole for 4 to 5 s, then the averageapplied weight was calculated. If the value obtained was less than the subject’s weight, the F-scansoftware adjusted the output by a multiplication factor. Similar approach was used in the prototypedFSR insole as well. Figure 9B,C show the F-scan and prototyped system worn by the same subject tocompare the vGRF signal acquired by the individual system.

Sensors 2020, 20, 957 12 of 25
Sensors 2020, 20, 957 12 of 25
3.4. Performance Evaluation of the Prototype System
A commercial F‐scan smart insole system (Figure 9A) was used to validate the designed insole.
The F‐scan system is one of the best insoles currently available on the market. The insole comes with
ultra‐thin (0.18 mm) flexible printed circuit with 960 sensing nodes. Each sensing element was
recorded with 8‐bit resolution with a scanning speed up to 750 Hz. However, the overall cost of the
system is 13,000 $ for the wired system and 17,000 $ for the wireless system. On the other hand, the
instrumented insole costs only ~500 $. Usually, the vGRF peak is around ±10% of the subject’s weight.
Therefore, using F‐scan software, data collected from each subject was calibrated based on subject’s
weight. The user needs to stand on one foot applying his/her full weight on the insole for 4 to 5 s,
then the average applied weight was calculated. If the value obtained was less than the subject’s
weight, the F‐scan software adjusted the output by a multiplication factor. Similar approach was used
in the prototyped FSR insole as well. Figure 9B,C show the F‐scan and prototyped system worn by
the same subject to compare the vGRF signal acquired by the individual system.
Figure 9. F‐scan commercial system (A), F‐scan system worn by Subject 01 (B) and FSR‐based
prototype system worn by Subject 01 (C).
4. Analysis
This section explains the mathematical calculations and analyses used for the sensor calibrations
and insole characterization.
4.1. Sensors’ Calibration
4.1.1. FSR Sensor Calibration
The FSR sensors exhibits resistance change in correspondence to the applied force. Therefore, a
voltage divider circuit was used to convert the resistance changes to voltage values to be acquired by
microcontroller.
𝑉 𝑉𝑅
𝑅 𝐹𝑆𝑅5𝑉
11 𝑘𝛺 11 𝑘𝛺 𝐹𝑆𝑅
(1)
As the applied force increases, the FSR resistance also decreases, showing an increased output
voltage according to Equation (1). The acquired voltages were then converted to their equivalent FSR
resistance values by substitution of Equation (1).
𝐹𝑆𝑅5𝑉 11𝑘𝛺
𝑉 11𝑘𝛺 (2)
4.1.2. Piezo‐Electric Sensor Calibration
The piezo‐electric sensor generates high voltage values, as high as 20 V with weights less than 5
kg, which requires using a voltage divider circuit before data acquisition by microcontroller.
V 𝑉𝑜𝑙𝑡𝑎𝑔𝑒 𝑑𝑖𝑣𝑖𝑑𝑒𝑟 𝐺𝑎𝑖𝑛 V (3)
Figure 9. F-scan commercial system (A), F-scan system worn by Subject 01 (B) and FSR-based prototypesystem worn by Subject 01 (C).
4. Analysis
This section explains the mathematical calculations and analyses used for the sensor calibrationsand insole characterization.
4.1. Sensors’ Calibration
4.1.1. FSR Sensor Calibration
The FSR sensors exhibits resistance change in correspondence to the applied force. Therefore, avoltage divider circuit was used to convert the resistance changes to voltage values to be acquiredby microcontroller.
Vout = VCC ×R
R + FSR= 5V ×
11 kΩ11 kΩ + FSR
(1)
As the applied force increases, the FSR resistance also decreases, showing an increased outputvoltage according to Equation (1). The acquired voltages were then converted to their equivalent FSRresistance values by substitution of Equation (1).
FSR =5V × 11kΩ
Vout− 11kΩ (2)
4.1.2. Piezo-Electric Sensor Calibration
The piezo-electric sensor generates high voltage values, as high as 20 V with weights less than 5kg, which requires using a voltage divider circuit before data acquisition by microcontroller.
Vmax input = Voltage divider Gain ×VPiezo max (3)
⇒ Voltage divider Gain =Vmax input
VPiezo max=
VCCVPiezo max
=5V20V
= 0.25 (4)
Therefore, the voltage divider circuit were chosen as follows:
Vout =R1
R1 + R2×VPiezo =
3 MΩ3 MΩ + 9 MΩ
×VPiezo = 0.25VPiezo (5)
Substituting the maximum piezo voltage in Equation (5) gives:
Vout max = 0.25VPiezo max = 0.25(20V) = 5V (6)
This ensures that maximum microcontroller input voltage (5 V) was not exceeded. The acquiredvoltages were then converted to their equivalent Piezo sensor voltage outputs by subject substitutionof Equation (5).
VPiezo =1
0.25×Vout = 4Vout (7)

Sensors 2020, 20, 957 13 of 25
There are different equivalent electrical models for the piezo-electric sensors [28]. A simplifiedcommon model is a voltage source/generator with a capacitance, which was used in this study. Usually,the capacitance values are in Nano Farad range. The equivalent capacitance is typically measuredusing a parallel connection of a capacitance meter to the sensor. Connecting the piezo-electric sensor tothe voltage divider circuit forms a first order high-pass filter. Therefore, high resistance values in megaohms were used to ensure that most of the generated frequencies by the applied forces would pass.Assuming equivalent capacitance of piezo-electric sensor equal to 9 nF, the cut-off frequency can bewritten as:
fcutt−o f f =1
2πRC=
12π(3M + 9M)9nF
= 1.47Hz (8)
Apart from DC and very low frequency components, other signal components were expected tobe applied to the MCU input. AD620AN instrumentational amplifiers were used to amplify the lowamplitude load cell signals, before it was applied to the microcontroller. The load cells give an outputof maximum 40 mV, which can be amplified to the full-scale range of the analog channel. Therefore,the gain of the amplifier and the amplifier gain resistor were chosen as follows:
G =Vcc
Vload max=
5 V40mV
= 125 (9)
RG =49.9kG− 1
=49.9kΩ
124= 402 Ω (10)
4.1.3. MEMS Sensor Calibration
As mentioned previously, the MEMS generates positive or negative amplitude signals based onthe applied force in x, y or z directions. This requires an offset circuit along with a voltage dividercircuit to reduce the signal amplitude. It is assumed the piezo-vibration output can go up to 10 V withthe maximum applied force.
Vmax input = Voltage divider Gain ×VPiezo max (11)
Voltage divider Gain =Vmax input
VPiezo max=
VCC/2VPiezo max
=5V/210V
= 0.25 (12)
Therefore, the voltage divider circuit were chosen as follows:
Vout =R1
R1 + R2×VPiezo =
3 MΩ3 MΩ + 9 MΩ
×VPiezo = 0.25VPiezo, (13)
Substituting the maximum and minimum piezo voltage in Equation (13) gives:
Vout max/min = 0.25VPiezo max/min = 0.25(±10V) = ±2.5V (14)
The next step is to add an offset of 1/2Vcc to ensure that the signal was within 0 V to Vcc range.
4.2. Piezo-Electric Sensor Response
The piezo-electric sensors can detect the applied forces efficiently, by converting the mechanicalmovements into electrical signals. However, the movements need to be dynamic. The piezo-electricsensor generated electrical pulses that mimicked the applied mechanical movement. If the mechanicalmovement was a fast press and release of finger on the active area of the piezo-electric sensor, the pulsewas shrunk to an impulse-liked shape.
On the other hand, if a gentle force was applied by a slow press and remove by the palm of ahand, the generated signal had irregular pulse shape with longer duration compared to the fast fingerpress. Even though the piezo-electric sensor’s output can mimic dynamically changing force, it fails to
Sensors 2020, 20, 957 14 of 25
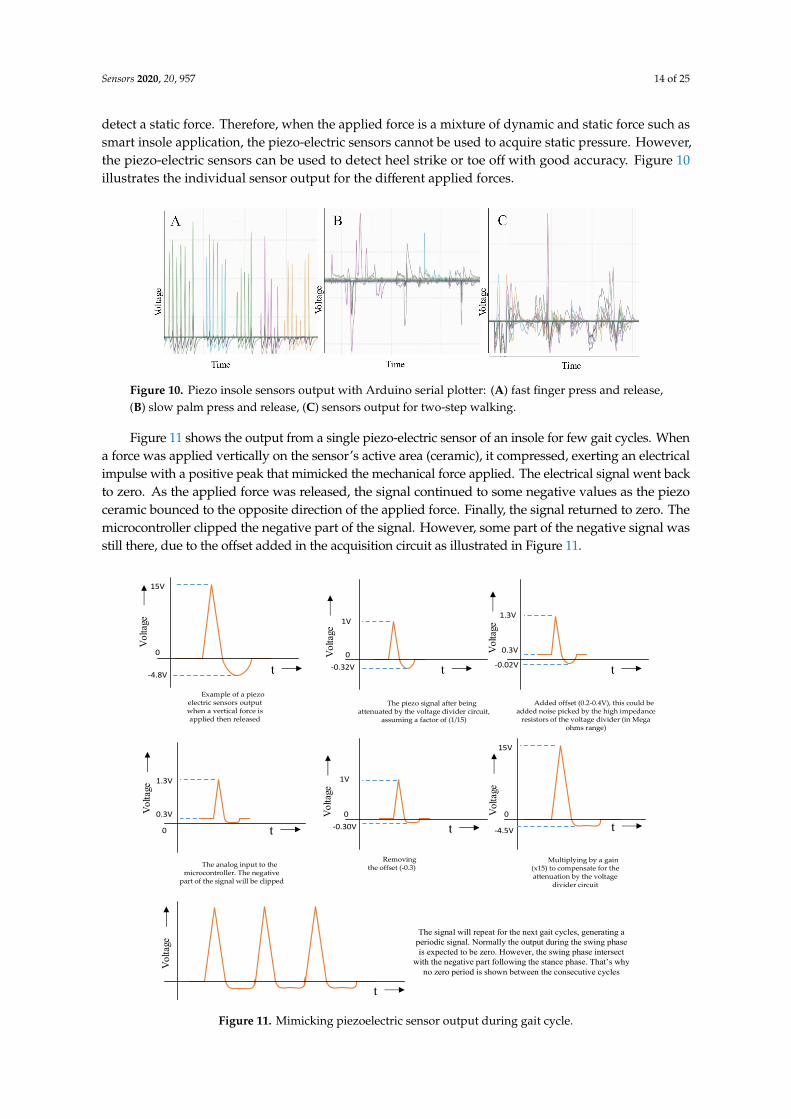
detect a static force. Therefore, when the applied force is a mixture of dynamic and static force such assmart insole application, the piezo-electric sensors cannot be used to acquire static pressure. However,the piezo-electric sensors can be used to detect heel strike or toe off with good accuracy. Figure 10illustrates the individual sensor output for the different applied forces.
Sensors 2020, 20, 957 14 of 25
The next step is to add an offset of 1/2Vcc to ensure that the signal was within 0 V to Vcc range.
4.2. Piezo‐Electric Sensor Response
The piezo‐electric sensors can detect the applied forces efficiently, by converting the mechanical
movements into electrical signals. However, the movements need to be dynamic. The piezo‐electric
sensor generated electrical pulses that mimicked the applied mechanical movement. If the
mechanical movement was a fast press and release of finger on the active area of the piezo‐electric
sensor, the pulse was shrunk to an impulse‐liked shape.
Figure 10. Piezo insole sensors output with Arduino serial plotter: (A) fast finger press and release,
(B) slow palm press and release, (C) sensors output for two‐step walking.
On the other hand, if a gentle force was applied by a slow press and remove by the palm of a
hand, the generated signal had irregular pulse shape with longer duration compared to the fast finger
press. Even though the piezo‐electric sensor’s output can mimic dynamically changing force, it fails
to detect a static force. Therefore, when the applied force is a mixture of dynamic and static force such
as smart insole application, the piezo‐electric sensors cannot be used to acquire static pressure.
However, the piezo‐electric sensors can be used to detect heel strike or toe off with good accuracy.
Figure 10 illustrates the individual sensor output for the different applied forces.
Figure 11 shows the output from a single piezo‐electric sensor of an insole for few gait cycles.
When a force was applied vertically on the sensor’s active area (ceramic), it compressed, exerting an
electrical impulse with a positive peak that mimicked the mechanical force applied. The electrical
signal went back to zero. As the applied force was released, the signal continued to some negative
values as the piezo ceramic bounced to the opposite direction of the applied force. Finally, the signal
returned to zero. The microcontroller clipped the negative part of the signal. However, some part of
the negative signal was still there, due to the offset added in the acquisition circuit as illustrated in
Figure 11.
Figure 10. Piezo insole sensors output with Arduino serial plotter: (A) fast finger press and release,(B) slow palm press and release, (C) sensors output for two-step walking.
Figure 11 shows the output from a single piezo-electric sensor of an insole for few gait cycles. Whena force was applied vertically on the sensor’s active area (ceramic), it compressed, exerting an electricalimpulse with a positive peak that mimicked the mechanical force applied. The electrical signal went backto zero. As the applied force was released, the signal continued to some negative values as the piezoceramic bounced to the opposite direction of the applied force. Finally, the signal returned to zero. Themicrocontroller clipped the negative part of the signal. However, some part of the negative signal wasstill there, due to the offset added in the acquisition circuit as illustrated in Figure 11.Sensors 2020, 20, 957 15 of 25
Figure 11. Mimicking piezoelectric sensor output during gait cycle.
5. Results and Discussion
This section illustrates and discuss the results obtained from calibration and characterization
tests.
5.1. Sensors’ Calibration
5.1.1. FSR Sensor Calibration
Three calibration trials were undertaken for one FSR sensor from Interlink Electronics [22],
following the calibration procedure explained previously; 500 g weights where placed one by one
every 3–4 s until it reached 5000 g, followed by unloading process from 5000 g down to 0g. In the
loading experiment, output voltage from the voltage divider circuit showed increasing values
reflecting the decrease in FSR resistance as shown in Figure 12A. When the applied weight was
constant, the output voltage remained constant with small variations.
In addition, if the constant weight was kept for a longer time (a few minutes), the sensor voltage
stabilized to a steady value. However, the aim of this study was to investigate the dynamic response
of the FSR. Therefore, the average output voltage for the sample were calculated and plotted against
the corresponding applied weights. Figure 12b shows the plotted data with the fitted waveform. The
calibration showed slight difference between the loading and unloading curves, which was expected
due to the hysteresis behavior of FSRs. However, the error was caused by the FSR hysteresis, which
can be neglected, as the difference was not significantly high. This can be justified if the response
from the smart insole using FSR sensors resembles typical vGRF reported in the literature.
15V
0
‐4.8V
1V
0
‐0.32V
1.3V
0.3V
‐0.02V
1.3V
0.3V
0
1V
0
‐0.30V
15V
0
‐4.5V
Example of a piezo electric sensors output when a vertical force is applied then released
The piezo signal after being attenuated by the voltage divider circuit,
assuming a factor of (1/15)
Added offset (0.2‐0.4V), this could be added noise picked by the high impedance resistors of the voltage divider (in Mega
ohms range)
The analog input to the microcontroller. The negative
part of the signal will be clipped
Removing the offset (‐0.3)
Multiplying by a gain (x15) to compensate for the attenuation by the voltage
divider circuit
The signal will repeat for the next gait cycles, generating a periodic signal. Normally the output during the swing phase is expected to be zero. However, the swing phase intersect
with the negative part following the stance phase. That’s why no zero period is shown between the consecutive cycles
t t t
t t t
t
Vol
tage
Vol
tage
Vol
tage
Vol
tage
Vol
tage
Vol
tage
Vol
tage
Figure 11. Mimicking piezoelectric sensor output during gait cycle.
Sensors 2020, 20, 957 15 of 25
5. Results and Discussion
This section illustrates and discuss the results obtained from calibration and characterization tests.
5.1. Sensors’ Calibration
5.1.1. FSR Sensor Calibration
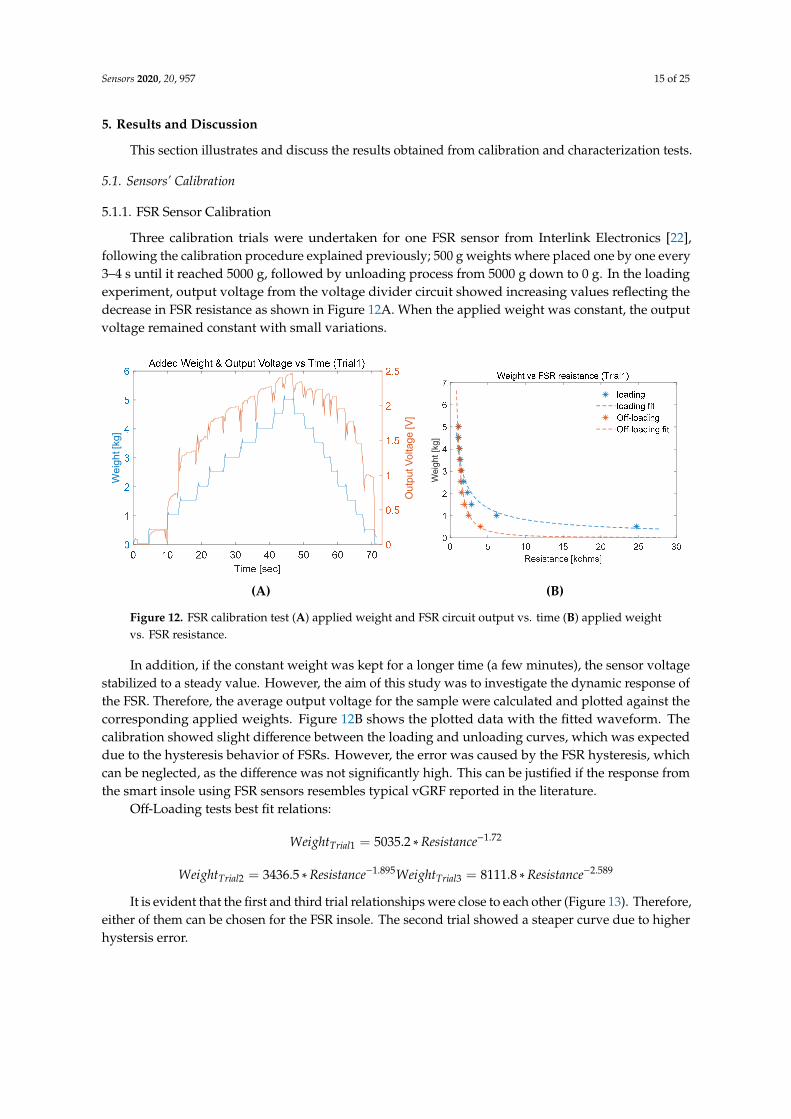
Three calibration trials were undertaken for one FSR sensor from Interlink Electronics [22],following the calibration procedure explained previously; 500 g weights where placed one by one every3–4 s until it reached 5000 g, followed by unloading process from 5000 g down to 0 g. In the loadingexperiment, output voltage from the voltage divider circuit showed increasing values reflecting thedecrease in FSR resistance as shown in Figure 12A. When the applied weight was constant, the outputvoltage remained constant with small variations.Sensors 2020, 20, 957 16 of 25
(A) (B)
Figure 12. FSR calibration test (A) applied weight and FSR circuit output vs. time (B) applied weight
vs. FSR resistance.
For each of the three trials, loading and off‐loading relationships where obtained.
Loading tests best fit relations:
𝑊𝑒𝑖𝑔ℎ𝑡 4233.3 ∗ 𝑅𝑒𝑠𝑖𝑠𝑡𝑎𝑛𝑐𝑒 .
𝑊𝑒𝑖𝑔ℎ𝑡 3657.4 ∗ 𝑅𝑒𝑠𝑖𝑠𝑡𝑎𝑛𝑐𝑒 .
𝑊𝑒𝑖𝑔ℎ𝑡 5117.4 ∗ 𝑅𝑒𝑠𝑖𝑠𝑡𝑎𝑛𝑐𝑒 .
Figure 13. FSR calibration test: best fit curves between applied weight and FSR resistance for three
trials.
Off‐Loading tests best fit relations:
𝑊𝑒𝑖𝑔ℎ𝑡 5035.2 ∗ 𝑅𝑒𝑠𝑖𝑠𝑡𝑎𝑛𝑐𝑒 .
𝑊𝑒𝑖𝑔ℎ𝑡 3436.5 ∗ 𝑅𝑒𝑠𝑖𝑠𝑡𝑎𝑛𝑐𝑒 . 𝑊𝑒𝑖𝑔ℎ𝑡 8111.8 ∗ 𝑅𝑒𝑠𝑖𝑠𝑡𝑎𝑛𝑐𝑒 .
It is evident that the first and third trial relationships were close to each other (Figure 13).
Therefore, either of them can be chosen for the FSR insole. The second trial showed a steaper curve
due to higher hystersis error.
5.1.2. Piezo‐Electric Sensor Calibration
Two piezoelectric sensors were used in the calibration process. Three trials were conducted on
the first sensors with four trials for the second sensor. The piezoelectric sensors showed a linear
relationship with the applied weights (Figure 14).
Wei
ght [
kg]
Out
put V
olta
ge [V
]
Wei
ght
[kg
]
We
igh
t [kg
]
Figure 12. FSR calibration test (A) applied weight and FSR circuit output vs. time (B) applied weightvs. FSR resistance.
In addition, if the constant weight was kept for a longer time (a few minutes), the sensor voltagestabilized to a steady value. However, the aim of this study was to investigate the dynamic response ofthe FSR. Therefore, the average output voltage for the sample were calculated and plotted against thecorresponding applied weights. Figure 12B shows the plotted data with the fitted waveform. Thecalibration showed slight difference between the loading and unloading curves, which was expecteddue to the hysteresis behavior of FSRs. However, the error was caused by the FSR hysteresis, whichcan be neglected, as the difference was not significantly high. This can be justified if the response fromthe smart insole using FSR sensors resembles typical vGRF reported in the literature.
Off-Loading tests best fit relations:
WeightTrial1 = 5035.2 ∗Resistance−1.72
WeightTrial2 = 3436.5 ∗Resistance−1.895WeightTrial3 = 8111.8 ∗Resistance−2.589
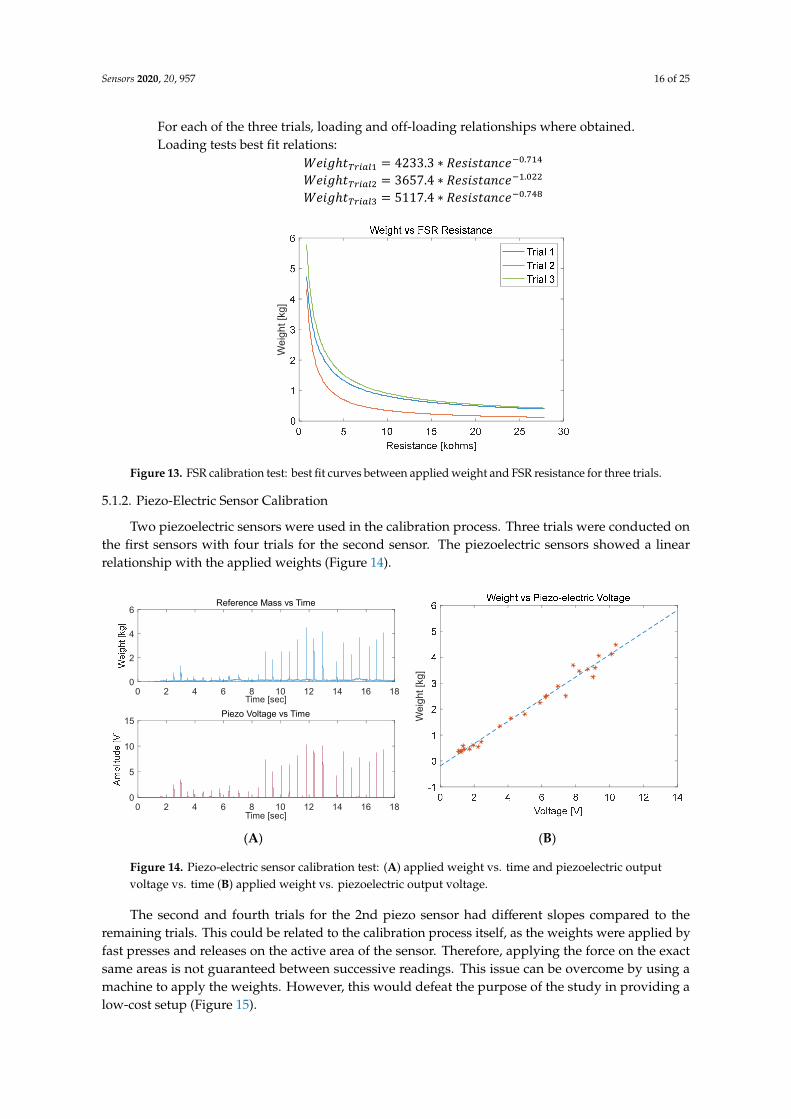
It is evident that the first and third trial relationships were close to each other (Figure 13). Therefore,either of them can be chosen for the FSR insole. The second trial showed a steaper curve due to higherhystersis error.
Sensors 2020, 20, 957 16 of 25
Sensors 2020, 20, 957 16 of 25
(A) (B)
Figure 12. FSR calibration test (A) applied weight and FSR circuit output vs. time (B) applied weight
vs. FSR resistance.
For each of the three trials, loading and off‐loading relationships where obtained.
Loading tests best fit relations:
𝑊𝑒𝑖𝑔ℎ𝑡 4233.3 ∗ 𝑅𝑒𝑠𝑖𝑠𝑡𝑎𝑛𝑐𝑒 .
𝑊𝑒𝑖𝑔ℎ𝑡 3657.4 ∗ 𝑅𝑒𝑠𝑖𝑠𝑡𝑎𝑛𝑐𝑒 .
𝑊𝑒𝑖𝑔ℎ𝑡 5117.4 ∗ 𝑅𝑒𝑠𝑖𝑠𝑡𝑎𝑛𝑐𝑒 .
Figure 13. FSR calibration test: best fit curves between applied weight and FSR resistance for three
trials.
Off‐Loading tests best fit relations:
𝑊𝑒𝑖𝑔ℎ𝑡 5035.2 ∗ 𝑅𝑒𝑠𝑖𝑠𝑡𝑎𝑛𝑐𝑒 .
𝑊𝑒𝑖𝑔ℎ𝑡 3436.5 ∗ 𝑅𝑒𝑠𝑖𝑠𝑡𝑎𝑛𝑐𝑒 . 𝑊𝑒𝑖𝑔ℎ𝑡 8111.8 ∗ 𝑅𝑒𝑠𝑖𝑠𝑡𝑎𝑛𝑐𝑒 .
It is evident that the first and third trial relationships were close to each other (Figure 13).
Therefore, either of them can be chosen for the FSR insole. The second trial showed a steaper curve
due to higher hystersis error.
5.1.2. Piezo‐Electric Sensor Calibration
Two piezoelectric sensors were used in the calibration process. Three trials were conducted on
the first sensors with four trials for the second sensor. The piezoelectric sensors showed a linear
relationship with the applied weights (Figure 14).
Wei
ght [
kg]
Out
putV
olta
ge[V
]W
eigh
t [kg
]
We
igh
t [kg
]
Figure 13. FSR calibration test: best fit curves between applied weight and FSR resistance for three trials.
5.1.2. Piezo-Electric Sensor Calibration
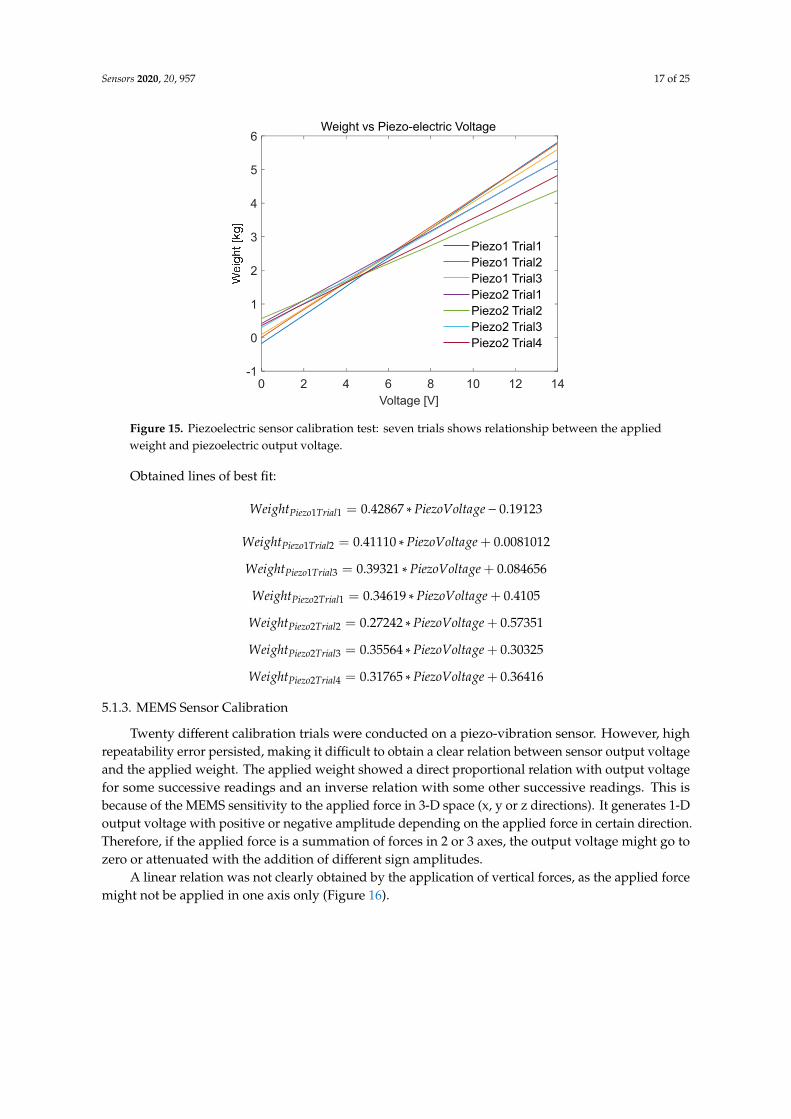
Two piezoelectric sensors were used in the calibration process. Three trials were conducted onthe first sensors with four trials for the second sensor. The piezoelectric sensors showed a linearrelationship with the applied weights (Figure 14).Sensors 2020, 20, 957 17 of 25
(A) (B)
Figure 14. Piezo‐electric sensor calibration test: (A) applied weight vs. time and piezoelectric output
voltage vs. time (B) applied weight vs. piezoelectric output voltage.
The second and fourth trials for the 2nd piezo sensor had different slopes compared to the
remaining trials. This could be related to the calibration process itself, as the weights were applied
by fast presses and releases on the active area of the sensor. Therefore, applying the force on the exact
same areas is not guaranteed between successive readings. This issue can be overcome by using a
machine to apply the weights. However, this would defeat the purpose of the study in providing a
low‐cost setup (Figure 15).
Figure 15. Piezoelectric sensor calibration test: seven trials shows relationship between the applied
weight and piezoelectric output voltage.
Obtained lines of best fit:
𝑊𝑒𝑖𝑔ℎ𝑡 0.42867 ∗ 𝑃𝑖𝑒𝑧𝑜𝑉𝑜𝑙𝑡𝑎𝑔𝑒 0.19123 𝑊𝑒𝑖𝑔ℎ𝑡 0.41110 ∗ 𝑃𝑖𝑒𝑧𝑜𝑉𝑜𝑙𝑡𝑎𝑔𝑒 0.0081012 𝑊𝑒𝑖𝑔ℎ𝑡 0.39321 ∗ 𝑃𝑖𝑒𝑧𝑜𝑉𝑜𝑙𝑡𝑎𝑔𝑒 0.084656
𝑊𝑒𝑖𝑔ℎ𝑡 0.34619 ∗ 𝑃𝑖𝑒𝑧𝑜𝑉𝑜𝑙𝑡𝑎𝑔𝑒 0.4105 𝑊𝑒𝑖𝑔ℎ𝑡 0.27242 ∗ 𝑃𝑖𝑒𝑧𝑜𝑉𝑜𝑙𝑡𝑎𝑔𝑒 0.57351 𝑊𝑒𝑖𝑔ℎ𝑡 0.35564 ∗ 𝑃𝑖𝑒𝑧𝑜𝑉𝑜𝑙𝑡𝑎𝑔𝑒 0.30325 𝑊𝑒𝑖𝑔ℎ𝑡 0.31765 ∗ 𝑃𝑖𝑒𝑧𝑜𝑉𝑜𝑙𝑡𝑎𝑔𝑒 0.36416
5.1.3. MEMS Sensor Calibration
0 2 4 6 8 10 12 14 16 18Time [sec]
0
2
4
6Reference Mass vs Time
0 2 4 6 8 10 12 14 16 18Time [sec]
0
5
10
15Piezo Voltage vs Time W
eig
ht [k
g]
0 2 4 6 8 10 12 14Voltage [V]
-1
0
1
2
3
4
5
6Weight vs Piezo-electric Voltage
Piezo1 Trial1Piezo1 Trial2Piezo1 Trial3Piezo2 Trial1Piezo2 Trial2Piezo2 Trial3Piezo2 Trial4
Figure 14. Piezo-electric sensor calibration test: (A) applied weight vs. time and piezoelectric outputvoltage vs. time (B) applied weight vs. piezoelectric output voltage.
The second and fourth trials for the 2nd piezo sensor had different slopes compared to theremaining trials. This could be related to the calibration process itself, as the weights were applied byfast presses and releases on the active area of the sensor. Therefore, applying the force on the exactsame areas is not guaranteed between successive readings. This issue can be overcome by using amachine to apply the weights. However, this would defeat the purpose of the study in providing alow-cost setup (Figure 15).
Sensors 2020, 20, 957 17 of 25
Sensors 2020, 20, 957 17 of 25
(A) (B)
Figure 14. Piezo‐electric sensor calibration test: (A) applied weight vs. time and piezoelectric output
voltage vs. time (B) applied weight vs. piezoelectric output voltage.
The second and fourth trials for the 2nd piezo sensor had different slopes compared to the
remaining trials. This could be related to the calibration process itself, as the weights were applied
by fast presses and releases on the active area of the sensor. Therefore, applying the force on the exact
same areas is not guaranteed between successive readings. This issue can be overcome by using a
machine to apply the weights. However, this would defeat the purpose of the study in providing a
low‐cost setup (Figure 15).
Figure 15. Piezoelectric sensor calibration test: seven trials shows relationship between the applied
weight and piezoelectric output voltage.
Obtained lines of best fit:
𝑊𝑒𝑖𝑔ℎ𝑡 0.42867 ∗ 𝑃𝑖𝑒𝑧𝑜𝑉𝑜𝑙𝑡𝑎𝑔𝑒 0.19123 𝑊𝑒𝑖𝑔ℎ𝑡 0.41110 ∗ 𝑃𝑖𝑒𝑧𝑜𝑉𝑜𝑙𝑡𝑎𝑔𝑒 0.0081012 𝑊𝑒𝑖𝑔ℎ𝑡 0.39321 ∗ 𝑃𝑖𝑒𝑧𝑜𝑉𝑜𝑙𝑡𝑎𝑔𝑒 0.084656
𝑊𝑒𝑖𝑔ℎ𝑡 0.34619 ∗ 𝑃𝑖𝑒𝑧𝑜𝑉𝑜𝑙𝑡𝑎𝑔𝑒 0.4105 𝑊𝑒𝑖𝑔ℎ𝑡 0.27242 ∗ 𝑃𝑖𝑒𝑧𝑜𝑉𝑜𝑙𝑡𝑎𝑔𝑒 0.57351 𝑊𝑒𝑖𝑔ℎ𝑡 0.35564 ∗ 𝑃𝑖𝑒𝑧𝑜𝑉𝑜𝑙𝑡𝑎𝑔𝑒 0.30325 𝑊𝑒𝑖𝑔ℎ𝑡 0.31765 ∗ 𝑃𝑖𝑒𝑧𝑜𝑉𝑜𝑙𝑡𝑎𝑔𝑒 0.36416
5.1.3. MEMS Sensor Calibration
0 2 4 6 8 10 12 14 16 18Time [sec]
0
2
4
6Reference Mass vs Time
0 2 4 6 8 10 12 14 16 18Time [sec]
0
5
10
15Piezo Voltage vs Time W
eig
ht [k
g]
0 2 4 6 8 10 12 14Voltage [V]
-1
0
1
2
3
4
5
6Weight vs Piezo-electric Voltage
Piezo1 Trial1Piezo1 Trial2Piezo1 Trial3Piezo2 Trial1Piezo2 Trial2Piezo2 Trial3Piezo2 Trial4
Figure 15. Piezoelectric sensor calibration test: seven trials shows relationship between the appliedweight and piezoelectric output voltage.
Obtained lines of best fit:
WeightPiezo1Trial1 = 0.42867 ∗ PiezoVoltage− 0.19123
WeightPiezo1Trial2 = 0.41110 ∗ PiezoVoltage + 0.0081012
WeightPiezo1Trial3 = 0.39321 ∗ PiezoVoltage + 0.084656
WeightPiezo2Trial1 = 0.34619 ∗ PiezoVoltage + 0.4105
WeightPiezo2Trial2 = 0.27242 ∗ PiezoVoltage + 0.57351
WeightPiezo2Trial3 = 0.35564 ∗ PiezoVoltage + 0.30325
WeightPiezo2Trial4 = 0.31765 ∗ PiezoVoltage + 0.36416
5.1.3. MEMS Sensor Calibration
Twenty different calibration trials were conducted on a piezo-vibration sensor. However, highrepeatability error persisted, making it difficult to obtain a clear relation between sensor output voltageand the applied weight. The applied weight showed a direct proportional relation with output voltagefor some successive readings and an inverse relation with some other successive readings. This isbecause of the MEMS sensitivity to the applied force in 3-D space (x, y or z directions). It generates 1-Doutput voltage with positive or negative amplitude depending on the applied force in certain direction.Therefore, if the applied force is a summation of forces in 2 or 3 axes, the output voltage might go tozero or attenuated with the addition of different sign amplitudes.
A linear relation was not clearly obtained by the application of vertical forces, as the applied forcemight not be applied in one axis only (Figure 16).
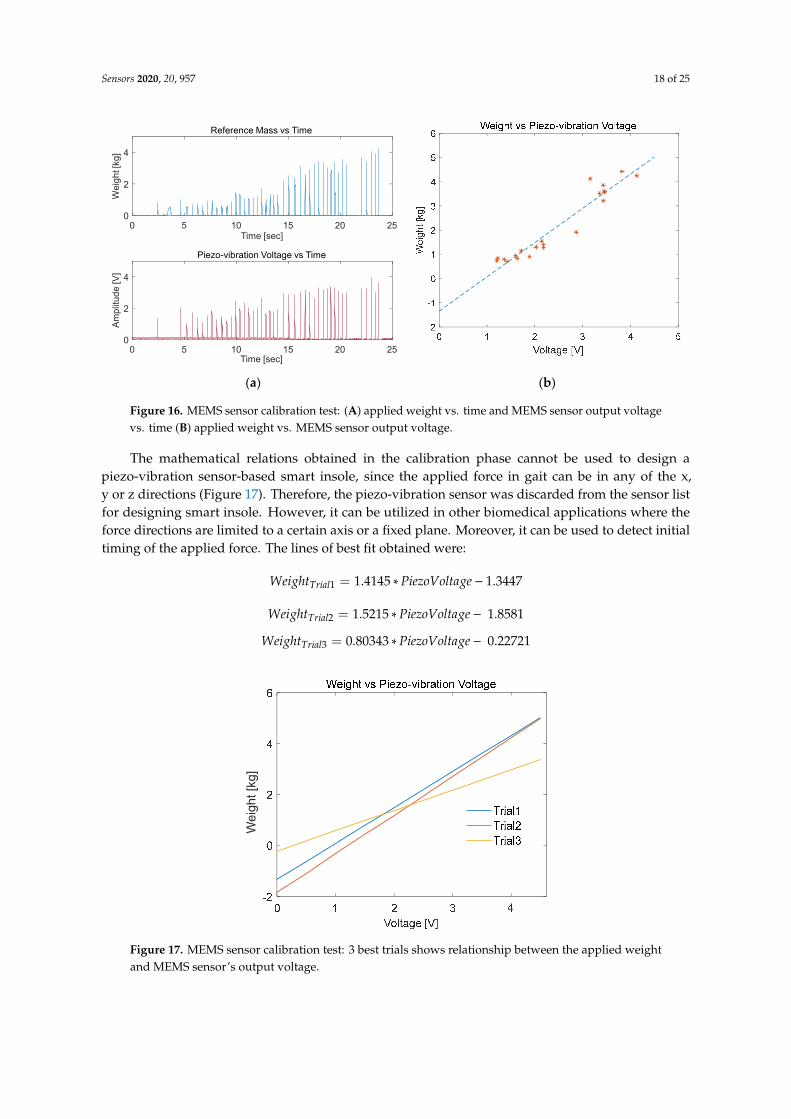
Sensors 2020, 20, 957 18 of 25
Sensors 2020, 20, 957 18 of 25
Twenty different calibration trials were conducted on a piezo‐vibration sensor. However, high
repeatability error persisted, making it difficult to obtain a clear relation between sensor output
voltage and the applied weight. The applied weight showed a direct proportional relation with
output voltage for some successive readings and an inverse relation with some other successive
readings. This is because of the MEMS sensitivity to the applied force in 3‐D space (x, y or z
directions). It generates 1‐D output voltage with positive or negative amplitude depending on the
applied force in certain direction. Therefore, if the applied force is a summation of forces in 2 or 3
axes, the output voltage might go to zero or attenuated with the addition of different sign amplitudes.
A linear relation was not clearly obtained by the application of vertical forces, as the applied
force might not be applied in one axis only (Figure 16).
(a) (b)
Figure 16. MEMS sensor calibration test: (A) applied weight vs. time and MEMS sensor output voltage
vs. time (B) applied weight vs. MEMS sensor output voltage.
Figure 17. MEMS sensor calibration test: 3 best trials shows relationship between the applied weight
and MEMS sensor’s output voltage.
The mathematical relations obtained in the calibration phase cannot be used to design a piezo‐
vibration sensor‐based smart insole, since the applied force in gait can be in any of the x, y or z
directions (Figure 17). Therefore, the piezo‐vibration sensor was discarded from the sensor list for
designing smart insole. However, it can be utilized in other biomedical applications where the force
directions are limited to a certain axis or a fixed plane. Moreover, it can be used to detect initial timing
of the applied force. The lines of best fit obtained were:
0 5 10 15 20 25Time [sec]
0
2
4
We
igh
t [kg
]
Reference Mass vs Time
0 5 10 15 20 25Time [sec]
0
2
4
Am
plit
ud
e [V
]
Piezo-vibration Voltage vs Time
Wei
ght [
kg]
Figure 16. MEMS sensor calibration test: (A) applied weight vs. time and MEMS sensor output voltagevs. time (B) applied weight vs. MEMS sensor output voltage.
The mathematical relations obtained in the calibration phase cannot be used to design apiezo-vibration sensor-based smart insole, since the applied force in gait can be in any of the x,y or z directions (Figure 17). Therefore, the piezo-vibration sensor was discarded from the sensor listfor designing smart insole. However, it can be utilized in other biomedical applications where theforce directions are limited to a certain axis or a fixed plane. Moreover, it can be used to detect initialtiming of the applied force. The lines of best fit obtained were:
WeightTrial1 = 1.4145 ∗ PiezoVoltage− 1.3447
WeightTrial2 = 1.5215 ∗ PiezoVoltage− 1.8581
WeightTrial3 = 0.80343 ∗ PiezoVoltage− 0.22721
Sensors 2020, 20, 957 18 of 25
Twenty different calibration trials were conducted on a piezo‐vibration sensor. However, high
repeatability error persisted, making it difficult to obtain a clear relation between sensor output
voltage and the applied weight. The applied weight showed a direct proportional relation with
output voltage for some successive readings and an inverse relation with some other successive
readings. This is because of the MEMS sensitivity to the applied force in 3‐D space (x, y or z
directions). It generates 1‐D output voltage with positive or negative amplitude depending on the
applied force in certain direction. Therefore, if the applied force is a summation of forces in 2 or 3
axes, the output voltage might go to zero or attenuated with the addition of different sign amplitudes.
A linear relation was not clearly obtained by the application of vertical forces, as the applied
force might not be applied in one axis only (Figure 16).
(a) (b)
Figure 16. MEMS sensor calibration test: (A) applied weight vs. time and MEMS sensor output voltage
vs. time (B) applied weight vs. MEMS sensor output voltage.
Figure 17. MEMS sensor calibration test: 3 best trials shows relationship between the applied weight
and MEMS sensor’s output voltage.
The mathematical relations obtained in the calibration phase cannot be used to design a piezo‐
vibration sensor‐based smart insole, since the applied force in gait can be in any of the x, y or z
directions (Figure 17). Therefore, the piezo‐vibration sensor was discarded from the sensor list for
designing smart insole. However, it can be utilized in other biomedical applications where the force
directions are limited to a certain axis or a fixed plane. Moreover, it can be used to detect initial timing
of the applied force. The lines of best fit obtained were:
0 5 10 15 20 25Time [sec]
0
2
4
We
igh
t [kg
]
Reference Mass vs Time
0 5 10 15 20 25Time [sec]
0
2
4
Am
plit
ud
e [V
]
Piezo-vibration Voltage vs Time
Wei
ght [
kg]
Figure 17. MEMS sensor calibration test: 3 best trials shows relationship between the applied weightand MEMS sensor’s output voltage.
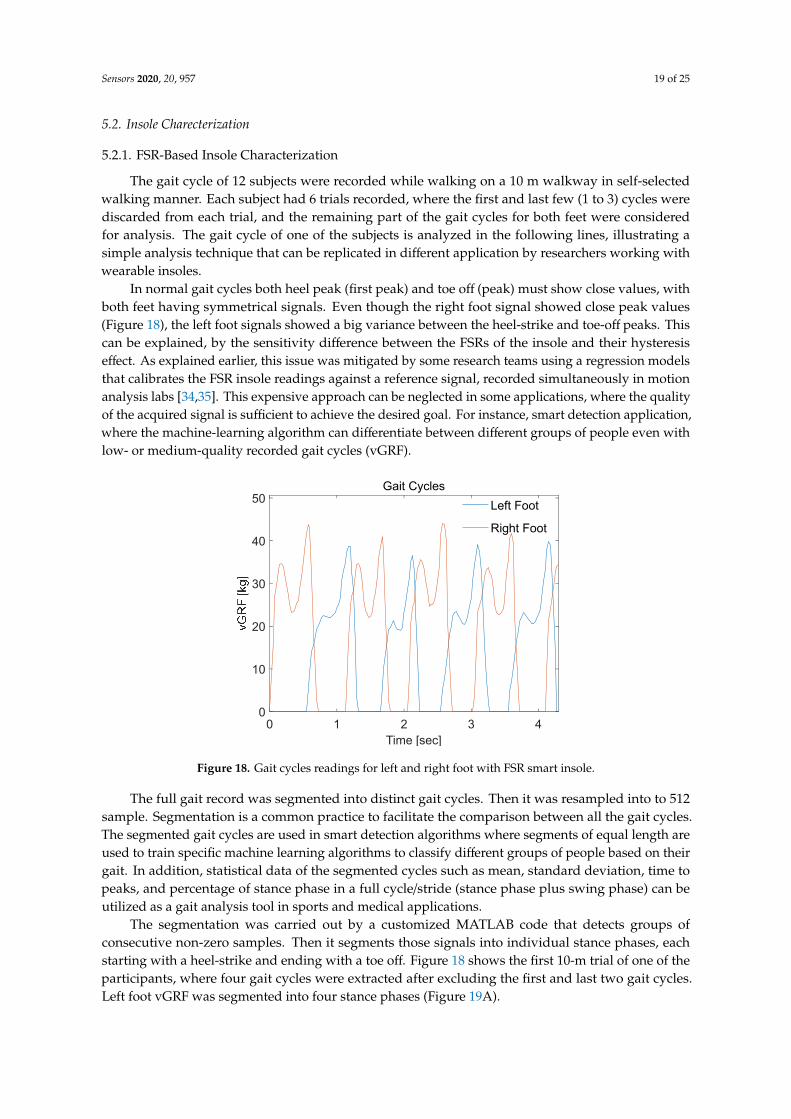
Sensors 2020, 20, 957 19 of 25
5.2. Insole Charecterization
5.2.1. FSR-Based Insole Characterization
The gait cycle of 12 subjects were recorded while walking on a 10 m walkway in self-selectedwalking manner. Each subject had 6 trials recorded, where the first and last few (1 to 3) cycles werediscarded from each trial, and the remaining part of the gait cycles for both feet were consideredfor analysis. The gait cycle of one of the subjects is analyzed in the following lines, illustrating asimple analysis technique that can be replicated in different application by researchers working withwearable insoles.
In normal gait cycles both heel peak (first peak) and toe off (peak) must show close values, withboth feet having symmetrical signals. Even though the right foot signal showed close peak values(Figure 18), the left foot signals showed a big variance between the heel-strike and toe-off peaks. Thiscan be explained, by the sensitivity difference between the FSRs of the insole and their hysteresiseffect. As explained earlier, this issue was mitigated by some research teams using a regression modelsthat calibrates the FSR insole readings against a reference signal, recorded simultaneously in motionanalysis labs [34,35]. This expensive approach can be neglected in some applications, where the qualityof the acquired signal is sufficient to achieve the desired goal. For instance, smart detection application,where the machine-learning algorithm can differentiate between different groups of people even withlow- or medium-quality recorded gait cycles (vGRF).
Sensors 2020, 20, 957 19 of 25
𝑊𝑒𝑖𝑔ℎ𝑡 1.4145 ∗ 𝑃𝑖𝑒𝑧𝑜𝑉𝑜𝑙𝑡𝑎𝑔𝑒 1.3447 𝑊𝑒𝑖𝑔ℎ𝑡 1.5215 ∗ 𝑃𝑖𝑒𝑧𝑜𝑉𝑜𝑙𝑡𝑎𝑔𝑒 1.8581
𝑊𝑒𝑖𝑔ℎ𝑡 0.80343 ∗ 𝑃𝑖𝑒𝑧𝑜𝑉𝑜𝑙𝑡𝑎𝑔𝑒 0.22721
5.2. Insole Charecterization
5.2.1. FSR‐Based Insole Characterization
The gait cycle of 12 subjects were recorded while walking on a 10 m walkway in self‐selected
walking manner. Each subject had 6 trials recorded, where the first and last few (1 to 3) cycles were
discarded from each trial, and the remaining part of the gait cycles for both feet were considered for
analysis. The gait cycle of one of the subjects is analyzed in the following lines, illustrating a simple
analysis technique that can be replicated in different application by researchers working with
wearable insoles.
In normal gait cycles both heel peak (first peak) and toe off (peak) must show close values, with
both feet having symmetrical signals. Even though the right foot signal showed close peak values
(Figure 18), the left foot signals showed a big variance between the heel‐strike and toe‐off peaks. This
can be explained, by the sensitivity difference between the FSRs of the insole and their hysteresis
effect. As explained earlier, this issue was mitigated by some research teams using a regression
models that calibrates the FSR insole readings against a reference signal, recorded simultaneously in
motion analysis labs [35,50]. This expensive approach can be neglected in some applications, where
the quality of the acquired signal is sufficient to achieve the desired goal. For instance, smart detection
application, where the machine‐learning algorithm can differentiate between different groups of
people even with low‐ or medium‐quality recorded gait cycles (vGRF).
Figure 18. Gait cycles readings for left and right foot with FSR smart insole.
The full gait record was segmented into distinct gait cycles. Then it was resampled into to 512
sample. Segmentation is a common practice to facilitate the comparison between all the gait cycles.
The segmented gait cycles are used in smart detection algorithms where segments of equal length are
used to train specific machine learning algorithms to classify different groups of people based on
their gait. In addition, statistical data of the segmented cycles such as mean, standard deviation, time
to peaks, and percentage of stance phase in a full cycle/stride (stance phase plus swing phase) can be
utilized as a gait analysis tool in sports and medical applications.
The segmentation was carried out by a customized MATLAB code that detects groups of
consecutive non‐zero samples. Then it segments those signals into individual stance phases, each
starting with a heel‐strike and ending with a toe off. Figure 18 shows the first 10‐m trial of one of the
0 1 2 3 4Time [sec]
0
10
20
30
40
50Gait Cycles
Left Foot
Right Foot
Figure 18. Gait cycles readings for left and right foot with FSR smart insole.
The full gait record was segmented into distinct gait cycles. Then it was resampled into to 512sample. Segmentation is a common practice to facilitate the comparison between all the gait cycles.The segmented gait cycles are used in smart detection algorithms where segments of equal length areused to train specific machine learning algorithms to classify different groups of people based on theirgait. In addition, statistical data of the segmented cycles such as mean, standard deviation, time topeaks, and percentage of stance phase in a full cycle/stride (stance phase plus swing phase) can beutilized as a gait analysis tool in sports and medical applications.
The segmentation was carried out by a customized MATLAB code that detects groups ofconsecutive non-zero samples. Then it segments those signals into individual stance phases, eachstarting with a heel-strike and ending with a toe off. Figure 18 shows the first 10-m trial of one of theparticipants, where four gait cycles were extracted after excluding the first and last two gait cycles.Left foot vGRF was segmented into four stance phases (Figure 19A).
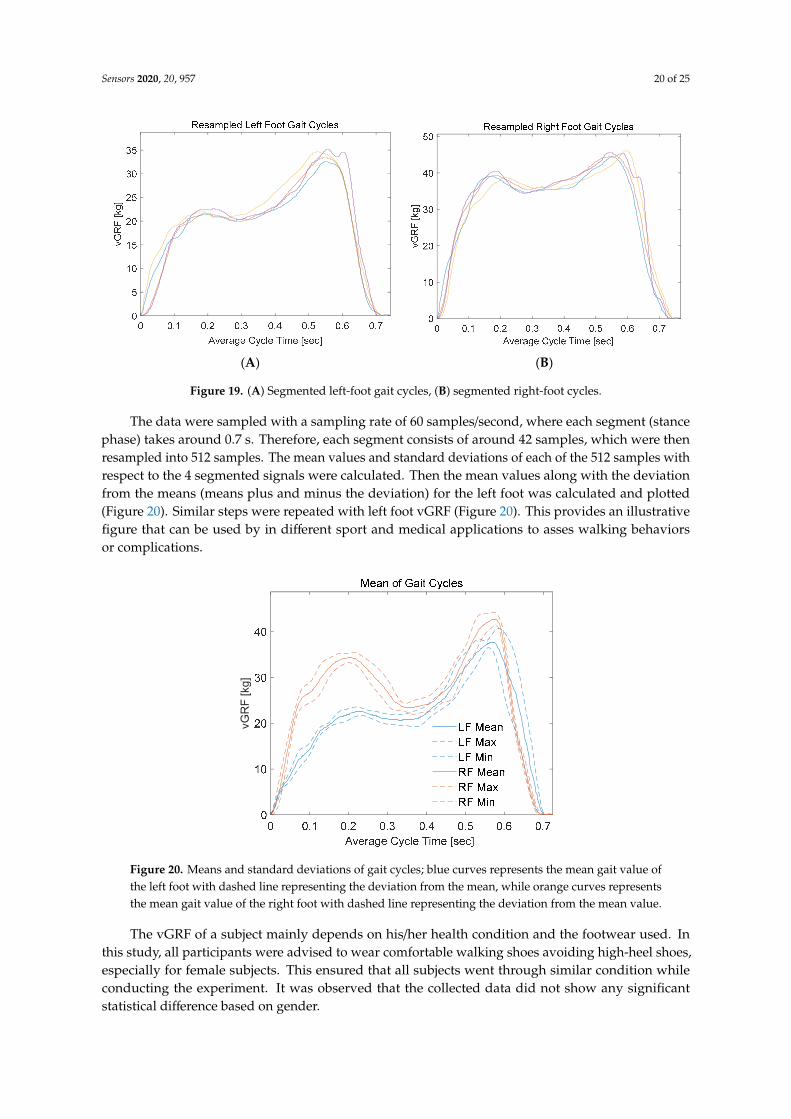
Sensors 2020, 20, 957 20 of 25
Sensors 2020, 20, 957 20 of 25
participants, where four gait cycles were extracted after excluding the first and last two gait cycles.
Left foot vGRF was segmented into four stance phases (Figure 19A).
(A) (B)
Figure 19. (A) Segmented left‐foot gait cycles, (B) segmented right‐foot cycles.
The data were sampled with a sampling rate of 60 samples/second, where each segment (stance
phase) takes around 0.7 s. Therefore, each segment consists of around 42 samples, which were then
resampled into 512 samples. The mean values and standard deviations of each of the 512 samples
with respect to the 4 segmented signals were calculated. Then the mean values along with the
deviation from the means (means plus and minus the deviation) for the left foot was calculated and
plotted (Figure 20). Similar steps were repeated with left foot vGRF (Figure 20). This provides an
illustrative figure that can be used by in different sport and medical applications to asses walking
behaviors or complications.
Figure 20. Means and standard deviations of gait cycles; blue curves represents the mean gait value
of the left foot with dashed line representing the deviation from the mean, while orange curves
represents the mean gait value of the right foot with dashed line representing the deviation from the
mean value.
The vGRF of a subject mainly depends on his/her health condition and the footwear used. In this
study, all participants were advised to wear comfortable walking shoes avoiding high‐heel shoes,
especially for female subjects. This ensured that all subjects went through similar condition while
vGR
F [k
g]
Figure 19. (A) Segmented left-foot gait cycles, (B) segmented right-foot cycles.
The data were sampled with a sampling rate of 60 samples/second, where each segment (stancephase) takes around 0.7 s. Therefore, each segment consists of around 42 samples, which were thenresampled into 512 samples. The mean values and standard deviations of each of the 512 samples withrespect to the 4 segmented signals were calculated. Then the mean values along with the deviationfrom the means (means plus and minus the deviation) for the left foot was calculated and plotted(Figure 20). Similar steps were repeated with left foot vGRF (Figure 20). This provides an illustrativefigure that can be used by in different sport and medical applications to asses walking behaviorsor complications.
Sensors 2020, 20, 957 20 of 25
participants, where four gait cycles were extracted after excluding the first and last two gait cycles.
Left foot vGRF was segmented into four stance phases (Figure 19A).
(A) (B)
Figure 19. (A) Segmented left‐foot gait cycles, (B) segmented right‐foot cycles.
The data were sampled with a sampling rate of 60 samples/second, where each segment (stance
phase) takes around 0.7 s. Therefore, each segment consists of around 42 samples, which were then
resampled into 512 samples. The mean values and standard deviations of each of the 512 samples
with respect to the 4 segmented signals were calculated. Then the mean values along with the
deviation from the means (means plus and minus the deviation) for the left foot was calculated and
plotted (Figure 20). Similar steps were repeated with left foot vGRF (Figure 20). This provides an
illustrative figure that can be used by in different sport and medical applications to asses walking
behaviors or complications.
Figure 20. Means and standard deviations of gait cycles; blue curves represents the mean gait value
of the left foot with dashed line representing the deviation from the mean, while orange curves
represents the mean gait value of the right foot with dashed line representing the deviation from the
mean value.
The vGRF of a subject mainly depends on his/her health condition and the footwear used. In this
study, all participants were advised to wear comfortable walking shoes avoiding high‐heel shoes,
especially for female subjects. This ensured that all subjects went through similar condition while
vGR
F [k
g]
Figure 20. Means and standard deviations of gait cycles; blue curves represents the mean gait value ofthe left foot with dashed line representing the deviation from the mean, while orange curves representsthe mean gait value of the right foot with dashed line representing the deviation from the mean value.
The vGRF of a subject mainly depends on his/her health condition and the footwear used. Inthis study, all participants were advised to wear comfortable walking shoes avoiding high-heel shoes,especially for female subjects. This ensured that all subjects went through similar condition whileconducting the experiment. It was observed that the collected data did not show any significantstatistical difference based on gender.

Sensors 2020, 20, 957 21 of 25
5.2.2. Piezoelectric Sensor Based-Insole Characterization
Three subjects participated in the piezo-electric insole test in the same manner as the testing ofFSR based insole. The piezoelectric insoles were expected to detect the gait cycle, with impulse signalsin heel-area sensors during the heel strike phase and lower amplitude impulses from all the sensorsduring the mid-stance phase. Finally, impulse signals from the toe and metatarsal heads sensors weretaken in the toe-off phase. However, the readings were not promising, showing single irregular shapepulses per sensor for each individual gait cycle. The addition of different sensors output showedperiodic impulses, one impulse per period (Figure 21). This indicates that the full stance period wasdetected as one event only. Meanwhile, the correct vGRF must show two distinct peaks betweenthe mid-stance phase, summing up to three main phases: heel strike, mid stance and toe off. Therigid nature of the piezo sensor made it difficult to detect different gait phases. Therefore, it can besummarized that it is not suitable for the smart insole application which requires to produce reliablevGRF signal due to gait.
Sensors 2020, 20, 957 21 of 25
conducting the experiment. It was observed that the collected data did not show any significant
statistical difference based on gender.
5.2.2. Piezoelectric Sensor Based‐Insole Characterization
Three subjects participated in the piezo‐electric insole test in the same manner as the testing of
FSR based insole. The piezoelectric insoles were expected to detect the gait cycle, with impulse signals
in heel‐area sensors during the heel strike phase and lower amplitude impulses from all the sensors
during the mid‐stance phase. Finally, impulse signals from the toe and metatarsal heads sensors were
taken in the toe‐off phase. However, the readings were not promising, showing single irregular shape
pulses per sensor for each individual gait cycle. The addition of different sensors output showed
periodic impulses, one impulse per period (Figure 21). This indicates that the full stance period was
detected as one event only. Meanwhile, the correct vGRF must show two distinct peaks between the
mid‐stance phase, summing up to three main phases: heel strike, mid stance and toe off. The rigid
nature of the piezo sensor made it difficult to detect different gait phases. Therefore, it can be
summarized that it is not suitable for the smart insole application which requires to produce reliable
vGRF signal due to gait.
(a) (b)
Figure 21. Gait cycles for left and right foot with piezoelectric smart insole (A) subject 1, (B) subject
2.
In this study, the authors have characterized three samples from each sensor category randomly;
however, the smart insole was implemented using 16‐sensors. Therefore, it was expected that there
would be a small variation of the vGRF recorded from the smart insole in different trials and in
different subjects. However, Figure 20 clearly depicts that the vGRF from an individual foot has a
unique pattern and this finding matches with the vGRF recorded by the commercial smart insole and
force plate. This reflects the fact that the smart insole designed using FSR is capable of acquiring
vGRF reliably and the designed system is robust enough to adapt to the age, gender and body mass
index (BMI) variation of the participants. However, carbon piezoresistive material (like Velostat),
which authors have tested in preliminary experiments (not reported here in order to avoid
unnecessary length of the manuscript), showed very high hysteresis and this type of material is not
suitable for human dynamicity monitoring. On the other hand, piezoelectric sensors can monitor
dynamic pressure variation however, they are very sensitive to small pressure change and incapable
to reliably produce mean vGRF. Moreover, the vGRF changed over trials and over subjects
significantly and, therefore, temporal feature of vGRF cannot be identified using piezoelectric sensor‐
based smart insole.
5.3. Performance Evaluation of the FSR‐Based System
Comparing the mean and standard deviation of vGRF for a gait cycle of the same subject
recorded using the two systems, commercial F‐scan and the proposed FSR insoles, it can be seen that
0 1 2 3 4 5 6 7Time [sec]
-50
0
50
100
Gait Cycles (Subject A)
Left Foot
Right FootvG
RF
[kg]
Figure 21. Gait cycles for left and right foot with piezoelectric smart insole (a) subject 1, (b) subject 2.
In this study, the authors have characterized three samples from each sensor category randomly;however, the smart insole was implemented using 16-sensors. Therefore, it was expected that therewould be a small variation of the vGRF recorded from the smart insole in different trials and in differentsubjects. However, Figure 20 clearly depicts that the vGRF from an individual foot has a unique patternand this finding matches with the vGRF recorded by the commercial smart insole and force plate. Thisreflects the fact that the smart insole designed using FSR is capable of acquiring vGRF reliably and thedesigned system is robust enough to adapt to the age, gender and body mass index (BMI) variation ofthe participants. However, carbon piezoresistive material (like Velostat), which authors have tested inpreliminary experiments (not reported here in order to avoid unnecessary length of the manuscript),showed very high hysteresis and this type of material is not suitable for human dynamicity monitoring.On the other hand, piezoelectric sensors can monitor dynamic pressure variation however, they arevery sensitive to small pressure change and incapable to reliably produce mean vGRF. Moreover, thevGRF changed over trials and over subjects significantly and, therefore, temporal feature of vGRFcannot be identified using piezoelectric sensor-based smart insole.
5.3. Performance Evaluation of the FSR-Based System
Comparing the mean and standard deviation of vGRF for a gait cycle of the same subject recordedusing the two systems, commercial F-scan and the proposed FSR insoles, it can be seen that bothshowed good quality signals except slight differences in peak values (Figure 22). The FSR insoleshowed smaller vGRF during left-foot heel strike phase compared to the F-scan insole. This is anexpected behavior as each sensor is somewhat unique due to the manufacturing process and we cannot

Sensors 2020, 20, 957 22 of 25
calibrate individual sensors, which can lead to some variation. In addition, due to the presence ofan insole, the sensitivity of some FSRs decreases more than the others in the shoe. To mitigate thisproblem, a highly uniform pressure should be applied across individual sensors. Each sensor shouldproduce uniform output. When this is not the case for a specific sensor, the software should determinea unique scale factor to compensate for the output variation. Currently, there are a few companies suchas T-scan, that provide a special piece of equipment (equilibration device) which applies a uniformpressure on the full insole using a thin flexible membrane to perform such calibration. Moreover,compared to the F-scan system, the FSR readings showed smaller differences between vGRF peaksand mid stance values. This was mainly due to the superior number of sensors for the F-scan system(960 sensing areas) compared to the proposed insole (16 FSRs). In addition, the F-scan sensing elementswere uniformly distributed on the full foot area, while the FSR sensors were placed on the foot areaswhere most of the pressure is exerted with no sensors placed on the low-pressure areas (medial arch).Adding a few FSR sensors to the medial arch can improve the quality of the signal obtained, especiallyfor subjects with flat foot, who exerts considerable amount of pressure on medial arch areas.
Sensors 2020, 20, 957 22 of 25
both showed good quality signals except slight differences in peak values (Figure 22). The FSR insole
showed smaller vGRF during left‐foot heel strike phase compared to the F‐scan insole. This is an
expected behavior as each sensor is somewhat unique due to the manufacturing process and we
cannot calibrate individual sensors, which can lead to some variation. In addition, due to the presence
of an insole, the sensitivity of some FSRs decreases more than the others in the shoe. To mitigate this
problem, a highly uniform pressure should be applied across individual sensors. Each sensor should
produce uniform output. When this is not the case for a specific sensor, the software should
determine a unique scale factor to compensate for the output variation. Currently, there are a few
companies such as T‐scan, that provide a special piece of equipment (equilibration device) which
applies a uniform pressure on the full insole using a thin flexible membrane to perform such
calibration. Moreover, compared to the F‐scan system, the FSR readings showed smaller differences
between vGRF peaks and mid stance values. This was mainly due to the superior number of sensors
for the F‐scan system (960 sensing areas) compared to the proposed insole (16 FSRs). In addition, the
F‐scan sensing elements were uniformly distributed on the full foot area, while the FSR sensors were
placed on the foot areas where most of the pressure is exerted with no sensors placed on the low‐
pressure areas (medial arch). Adding a few FSR sensors to the medial arch can improve the quality
of the signal obtained, especially for subjects with flat foot, who exerts considerable amount of
pressure on medial arch areas.
Figure 22. Comparison between the mean and standard deviation of vertical ground reaction forces
(vGRF) from left (blue) and right (orange) foot using F‐scan system (A) and FSR‐system (B).
6. Conclusion
In this study, the authors have proposed and designed low‐cost calibration setups for calibrating
three different force sensors: FSR, ceramic piezoelectric and flexible piezoelectric sensors. The
experiments conducted showed the effectiveness of the proposed setup in calibrating FSR and
piezoelectric sensors, which are mainly affected by 1D force. It was found that the flexible
piezoelectric sensors were performing poor in terms of calibration due to their sensitivity to 3D forces.
Special force calibration machines are required to control the applied force in x, y or z directions. In
addition, a systematic procedure for designing and characterizing two different smart insoles were
illustrated. The vGRF signal acquired and segmented to obtain mean vGRF and its standard deviation
for a gait cycle were calculated, which can be used to measure different statistical metrics (such as
mean standard deviation, time to peak, etc.) that can help in assessing the walking behavior of
athletes, patients or normal people. The FSR‐based smart insole was able to acquire high quality
vGRF for different gait cycles. On the other hand, the piezoelectric sensor‐based insole failed to detect
distinct gait phases. It cannot be utilized as an alternative to FSR in smart insole application.
However, the calibrated piezo sensors can be utilized in other bio‐sensing technologies such as
detecting the start and end of each gait cycle.
A B
Figure 22. Comparison between the mean and standard deviation of vertical ground reaction forces(vGRF) from left (blue) and right (orange) foot using F-scan system (A) and FSR-system (B).
6. Conclusions
In this study, the authors have proposed and designed low-cost calibration setups for calibratingthree different force sensors: FSR, ceramic piezoelectric and flexible piezoelectric sensors. Theexperiments conducted showed the effectiveness of the proposed setup in calibrating FSR andpiezoelectric sensors, which are mainly affected by 1D force. It was found that the flexible piezoelectricsensors were performing poor in terms of calibration due to their sensitivity to 3D forces. Specialforce calibration machines are required to control the applied force in x, y or z directions. In addition,a systematic procedure for designing and characterizing two different smart insoles were illustrated.The vGRF signal acquired and segmented to obtain mean vGRF and its standard deviation for a gaitcycle were calculated, which can be used to measure different statistical metrics (such as mean standarddeviation, time to peak, etc.) that can help in assessing the walking behavior of athletes, patients ornormal people. The FSR-based smart insole was able to acquire high quality vGRF for different gaitcycles. On the other hand, the piezoelectric sensor-based insole failed to detect distinct gait phases. Itcannot be utilized as an alternative to FSR in smart insole application. However, the calibrated piezosensors can be utilized in other bio-sensing technologies such as detecting the start and end of eachgait cycle.

Sensors 2020, 20, 957 23 of 25
Author Contributions: Experiments were designed by M.E.H.C., N.E. and A.K. Experiments were performedand experimental data were acquired by A.M.T., S.A.-H., M.A., and S.A. Data were analyzed by A.M.T., M.E.H.C.,A.K. and N.A.-E. All authors were involved in interpretation of data and writing the paper. All authors have readand agreed to the published version of the manuscript.
Funding: This research was partially funded by Qatar National Research Foundation (QNRF), grant numberNPRP12S-0227-190164 and Research University Grant DIP-2018-017. The publication of this article was funded bythe Qatar National Library.
Acknowledgments: The authors would like to thank Engr. Ayman Ammar, Electrical Engineering, QatarUniversity for helping in printing the printed circuit boards (PCBs).
Conflicts of Interest: The authors declare no conflict of interest.
References
1. Kowalski, E.; Catelli, D.S.; Lamontagne, M. Side does not matter in healthy young and olderindividuals–Examining the importance of how we match limbs during gait studies. Gait Posture 2019,67, 133–136.
2. Tao, W.; Liu, T.; Zheng, R.; Feng, H. Gait analysis using wearable sensors. Sensors 2012, 12, 2255–2283.[CrossRef] [PubMed]
3. Howell, A.M.; Kobayashi, T.; Hayes, H.A.; Foreman, K.B.; Bamberg, S.J.M. Kinetic gait analysis using alow-cost insole. IEEE Trans. Biomed. Eng. 2013, 60, 3284–3290. [CrossRef] [PubMed]
4. Bamberg, S.J.M.; Benbasat, A.Y.; Scarborough, D.M.; Krebs, D.E.; Paradiso, J.A. Gait analysis using ashoe-integrated wireless sensor system. IEEE Trans. Inf. Technol. Biomed. 2008, 12, 413–423. [CrossRef][PubMed]
5. De Rossi, S.; Lenzi, T.; Vitiello, N.; Donati, M.; Persichetti, A.; Giovacchini, F.; Vecchi, F.; Carrozza, M.C.Development of an in-shoe pressure-sensitive device for gait analysis. In Proceedings of the 2011 AnnualInternational Conference of the IEEE Engineering in Medicine and Biology Society, Boston, MA, USA,30 August–3 September 2011; IEEE: Piscataway, NJ, USA, 2011.
6. Smart Tracking and Wearables: Techniques in Gait Analysis and Movement in Pathological Aging. Availableonline: https://www.intechopen.com/books/smart-healthcare/smart-tracking-and-wearables-techniques-in-gait-analysis-and-movement-in-pathological-aging (accessed on 9 February 2020).
7. Gurchiek, R.D.; Choquette, R.H.; Beynnon, B.D.; Slauterbeck, J.R.; Tourville, T.W.; Toth, M.J.; McGinnis, R.S.Remote gait analysis using wearable sensors detects asymmetric gait patterns in patients recovering fromACL reconstruction. In Proceedings of the 2019 IEEE 16th International Conference on Wearable andImplantable Body Sensor Networks (BSN), Chicago, IL, USA, 19–22 May 2019; IEEE: Piscataway, NJ, USA,2019.
8. Brognara, L.; Palumbo, P.; Grimm, B.; Palmerini, L. Assessing gait in parkinson’s disease using wearablemotion sensors: A systematic review. Diseases 2019, 7, 18. [CrossRef] [PubMed]
9. Mills, P.M.; Morrison, S.; Lloyd, D.G.; Barrett, R.S. Repeatability of 3D gait kinematics obtained from anelectromagnetic tracking system during treadmill locomotion. J. Biomech. 2007, 40, 1504–1511. [CrossRef]
10. Huang, E.; Sharp, M.T.; Osborn, E.; MacLellan, A.; Mlynash, M.; Kemp, S.; Buckwalter, M.S.; Lansberg, M.G.Abstract TP173: Feasibility and Utility of Home-Based Gait Analysis Using Body-Worn Sensors. Stroke 2019,50, ATP173. [CrossRef]
11. Liu, T.; Inoue, Y.; Shibata, K. A wearable ground reaction force sensor system and its application to themeasurement of extrinsic gait variability. Sensors 2010, 10, 10240–10255. [CrossRef] [PubMed]
12. Razak, A.; Hadi, A.; Zayegh, A.; Begg, R.K.; Wahab, Y. Foot plantar pressure measurement system: A review.Sensors 2012, 12, 9884–9912. [CrossRef] [PubMed]
13. Alam, U.; Riley, D.R.; Jugdey, R.S.; Azmi, S.; Rajbhandari, S.; D’Août, K.; Malik, R.A. Diabetic neuropathyand gait: A review. Diabetes Ther. 2017, 8, 1253–1264. [CrossRef] [PubMed]
14. Farahpour, N.; Jafarnezhad, A.; Damavandi, M.; Bakhtiari, A.; Allard, P. Gait ground reaction forcecharacteristics of low back pain patients with pronated foot and able-bodied individuals with and withoutfoot pronation. J. Biomech. 2016, 49, 1705–1710. [CrossRef] [PubMed]
15. Sacco, I.C.; Picon, A.P.; Macedo, D.O.; Butugan, M.K.; Watari, R.; Sartor, C.D. Alterations in the lower limbjoint moments precede the peripheral neuropathy diagnosis in diabetes patients. Diabetes Technol. Ther. 2015,17, 405–412.

Sensors 2020, 20, 957 24 of 25
16. Dabbah, M.A.; Graham, J.; Petropoulos, I.N.; Tavakoli, M.; Malik, R.A. Automatic analysis of diabeticperipheral neuropathy using multi-scale quantitative morphology of nerve fibres in corneal confocalmicroscopy imaging. Med. Image Anal. 2011, 15, 738–747. [CrossRef] [PubMed]
17. International Diabetes Federation: IDF Diabetes Atlas. Available online: https://www.idf.org/e-library/
epidemiology-research/diabetes-atlas/19-atlas-6th-edition.html (accessed on 9 February 2020).18. Dworkin, R.H.; Malone, D.C.; Panarites, C.J.; Armstrong, E.P.; Pham, S.V. Impact of postherpetic neuralgia
and painful diabetic peripheral neuropathy on health care costs. J. Pain 2010, 11, 360–368. [CrossRef]19. Dyck, P.J.; Overland, C.J.; Low, P.A.; Litchy, W.J.; Davies, J.L.; Dyck, P.J.B.; O’brien, P.C. Signs and symptoms
versus nerve conduction studies to diagnose diabetic sensorimotor polyneuropathy: Cl vs. NPhys trial.Muscle Nerve 2010, 42, 157–164.
20. Taksande, B.; Ansari, S.; Jaikishan, A.; Karwasara, V. The diagnostic sensitivity, specificity and reproducibilityof the clinical physical examination signs in patients of diabetes mellitus for making diagnosis of peripheralneuropathy. J. Endocrinol. Metab. 2011, 1, 21–26. [CrossRef]
21. Watari, R.; Sartor, C.D.; Picon, A.P.; Butugan, M.K.; Amorim, C.F.; Ortega, N.R.; Sacco, I.C. Effect of diabeticneuropathy severity classified by a fuzzy model in muscle dynamics during gait. J. Neuroeng. Rehabil. 2014,11, 11. [CrossRef]
22. England, J.; Gronseth, G.; Franklin, G.; Carter, G.; Kinsella, L.; Cohen, J.; Asbury, A.; Szigeti, K.; Lupski, J.;Latov, N. Practice Parameter: Evaluation of distal symmetric polyneuropathy: Role of laboratory and genetictesting (an evidence-based review) Report of the American Academy of Neurology, American Associationof Neuromuscular and Electrodiagnostic Medicine, and American Academy of Physical Medicine andRehabilitation. Neurology 2009, 72, 185–192.
23. Zhang, Q.; Wang, Y.L.; Xia, Y.; Wu, X.; Kirk, T.V.; Chen, X.D. A low-cost and highly integrated sensing insolefor plantar pressure measurement. Sens. Bio-Sens. Res. 2019, 26, 100298. [CrossRef]
24. Zhang, W.; Yin, B.; Wang, J.; Mohamed, A.; Jia, H. Ultrasensitive and wearable strain sensors based onnatural rubber/graphene foam. J. Alloys Compd. 2019, 785, 1001–1008. [CrossRef]
25. Sengupta, D.; Pei, Y.; Kottapalli, A.G.P. Ultralightweight and 3D Squeezable Graphene-PolydimethylsiloxaneComposite Foams as Piezoresistive Sensors. ACS Appl. Mater. Interfaces 2019, 11, 35201–35211. [CrossRef][PubMed]
26. Shu, L.; Hua, T.; Wang, Y.; Li, Q.; Feng, D.D.; Tao, X. In-shoe plantar pressure measurement and analysissystem based on fabric pressure sensing array. IEEE Trans. Inf. Technol. Biomed. 2010, 14, 767–775. [PubMed]
27. Giovanelli, D.; Farella, E. Force sensing resistor and evaluation of technology for wearable body pressuresensing. J. Sens. 2016, 2016. [CrossRef]
28. Feasibility of Force Detection in 3D Printed Flexible Material Using Embedded Sensors. Availableonline: https://www.spiedigitallibrary.org/conference-proceedings-of-spie/10970/109702F/Feasibility-of-force-detection-in-3D-printed-flexible-material-using/10.1117/12.2514051.short?SSO=1 (accessed on9 February 2020).
29. Heng, W.; Pang, G.; Xu, F.; Huang, X.; Pang, Z.; Yang, G. Flexible Insole Sensors with Stably ConnectedElectrodes for Gait Phase Detection. Sensors 2019, 19, 5197. [CrossRef]
30. Lee, W.; Hong, S.-H.; Oh, H.-W. Characterization of Elastic Polymer-Based Smart Insole and a Simple FootPlantar Pressure Visualization Method Using 16 Electrodes. Sensors 2019, 19, 44. [CrossRef]
31. Theodosiou, A.; Kalli, K. Recent trends and advances of fibre Bragg grating sensors in CYTOP polymeroptical fibres. Opt. Fiber Technol. 2020, 54, 102079. [CrossRef]
32. Abdelhady, M.; van den Bogert, A.; Simon, D. A High-Fidelity Wearable System for Measuring Lower-LimbKinetics and Kinematics. IEEE Sens. J. 2019. [CrossRef]
33. Kim, J.; Bae, M.N.; Lee, K.B.; Hong, S.G. Gait event detection algorithm based on smart insoles. ETRI J. 2019.[CrossRef]
34. Vilas-Boas, M.d.C.; Rocha, A.P.; Choupina, H.M.P.; Cardoso, M.; Fernandes, J.M.; Coelho, T.; Cunha, J.P.S.TTR-FAP Progression Evaluation Based on Gait Analysis Using a Single RGB-D Camera. In Proceedings ofthe 2019 41st Annual International Conference of the IEEE Engineering in Medicine and Biology Society(EMBC), Berlin, Germany, 23–27 July 2019; IEEE: Piscataway, NJ, USA, 2019.
35. Cui, X.; Zhao, Z.; Ma, C.; Chen, F.; Liao, H. A Gait Character Analyzing System for Osteoarthritis Pre-diagnosisUsing RGB-D Camera and Supervised Classifier. In Proceedings of the World Congress on Medical Physicsand Biomedical Engineering, Prague, Czech Republic, 3–8 June 2018; Springer: Berlin, Germany, 2018.

Sensors 2020, 20, 957 25 of 25
36. Barnea, A.; Oprisan, C.; Olaru, D. Force Sensitive Resistors Calibration for the Usage in Gripping Devices.Diagn. Predict. Mech. Eng. Szstems DIPRE 2012, 3, 18–27.
37. Parmar, S.; Khodasevych, I.; Troynikov, O. Evaluation of flexible force sensors for pressure monitoring intreatment of chronic venous disorders. Sensors 2017, 17, 1923. [CrossRef]
38. Insole Energy Harvesting from Human Movement Using Piezoelectric Generators. Available online:https://trepo.tuni.fi/handle/123456789/25768 (accessed on 9 February 2020).
39. Development of a Smart Insole System for Real-Time Detection of Temporal Gait Parameters and RelatedDeviations in Unilateral Lower-Limb Amputees. Available online: https://scholarlyrepository.miami.edu/
cgi/viewcontent.cgi?article=1393&context=oa_theses (accessed on 9 February 2020).40. Sacco, I.; Amadio, A. A study of biomechanical parameters in gait analysis and sensitive cronaxie of diabetic
neuropathic patients. Clin. Biomech. 2000, 15, 196–202. [CrossRef]41. Menz, H.B.; Lord, S.R.; St George, R.; Fitzpatrick, R.C. Walking stability and sensorimotor function in older
people with diabetic peripheral neuropathy1. Arch. Phys. Med. Rehabil. 2004, 85, 245–252. [CrossRef][PubMed]
42. Dementyev, A.; Hodges, S.; Taylor, S.; Smith, J. Power consumption analysis of Bluetooth Low Energy, ZigBeeand ANT sensor nodes in a cyclic sleep scenario. In Proceedings of the 2013 IEEE International WirelessSymposium (IWS), Beijing, China, 14–18 April 2013; IEEE: Piscataway, NJ, USA, 2013.
43. Sacco, I.; Amadio, A. Influence of the diabetic neuropathy on the behavior of electromyographic and sensorialresponses in treadmill gait. Clin. Biomech. 2003, 18, 426–434. [CrossRef]
44. Kwon, O.-Y.; Minor, S.D.; Maluf, K.S.; Mueller, M.J. Comparison of muscle activity during walking in subjectswith and without diabetic neuropathy. Gait Posture 2003, 18, 105–113.
45. Akashi, P.M.; Sacco, I.C.; Watari, R.; Hennig, E. The effect of diabetic neuropathy and previous foot ulcerationin EMG and ground reaction forces during gait. Clin. Biomech. 2008, 23, 584–592. [CrossRef] [PubMed]
46. Sacco, I.C.; Akashi, P.M.; Hennig, E.M. A comparison of lower limb EMG and ground reaction forces betweenbarefoot and shod gait in participants with diabetic neuropathic and healthy controls. BMC Musculoskelet.Disord. 2010, 11, 24. [CrossRef]
47. Gomes, A.A.; Onodera, A.N.; Otuzi, M.E.; Pripas, D.; Mezzarane, R.A.; Sacco, N.; Isabel, C. Electromyographyand kinematic changes of gait cycle at different cadences in diabetic neuropathic individuals. Muscle Nerve2011, 44, 258–268.
48. Sawacha, Z.; Spolaor, F.; Guarneri, G.; Contessa, P.; Carraro, E.; Venturin, A.; Avogaro, A.; Cobelli, C.Abnormal muscle activation during gait in diabetes patients with and without neuropathy. Gait Posture 2012,35, 101–105.
49. Zhu, H.; Wertsch, J.J.; Harris, G.F.; Loftsgaarden, J.D.; Price, M.B. Foot pressure distribution during walkingand shuffling. Arch. Phys. Med. Rehabil. 1991, 72, 390–397.
© 2020 by the authors. Licensee MDPI, Basel, Switzerland. This article is an open accessarticle distributed under the terms and conditions of the Creative Commons Attribution(CC BY) license (http://creativecommons.org/licenses/by/4.0/).