Embed Size (px)
Citation preview

ABSTRACT
Title of Thesis: CHARACTERIZATION OF PTFD1, A BZIP
TRANSCRIPTION FACTOR USING TRANSGENIC POPLARS
Minggang Wu, Master of Science, 2006 Thesis Directed By: Associate Professor Gary D. Coleman
Department of Natural Resource Science and Landscape Architecture
Dormancy is an adaptive mechanism that enables plants to survive unfavorable
environmental conditions and resume growth when the conditions become favorable
again. Bud formation is the morphological event associated with bud dormancy. The
research presented in this thesis focuses on the role of PtFD1, a bZIP transcription
factor, in apical bud development in poplar. This research included the construction of
binary Agrobacterium vectors for the overexpressing of PtFD1 and for down
regulation or silencing of PtFD1 expression using RNAi technology. These vectors
were used to create transgenic poplars (Populus alba×Populus tremula) with altered
expression of PtFD1. The overexpression of PtFD1 prevented apical bud development
while apical bud development appeared normal in PtFD1 RNAi expressing plants.
Flowering was also induced in long days in poplars overexpressing PtFD1. Anatomical
studies indicate that overexpression of PtFD1 impinges on bud scale development
during short day induced bud formation.
CHARACTERIZATION OF PTFD1, A BZIP TRANSCRIPTION FACTOR USING
TRANSGENIC POPLARS
By
Minggang Wu
Thesis submitted to the Faculty of the Graduate School of the University of Maryland, College Park, in partial fulfillment
of the requirements for the degree of Master of Science
2006 Advisory Committee: Associate Professor Gary D. Coleman, Chair Associate Professor Harry Swartz Associate Professor Joseph Sullivan

© Copyright by Minggang Wu
2006

ii
Acknowledgements
I would like to thank my advisor, Dr. Coleman, for his expertise, advise and
assistance with this project and his patient guidance throughout my studies.
Thanks to Dr. Sullivan and Dr. Swartz for being on my committee and for their
valuable suggestions to my research.
Thanks to Dr. Swartz for the generous use of his lab facilities.
Thanks to Dr. Parmentier-Line for her help in my research.

iii
Table of Contents Acknowledgements…………………………………………………………………... ii Table of Contents…………………………………………………………………….. iii List of Tables…………………………………………………………………….…… vi List of Figures………………………………………………………………………... vii List of Abbreviations…………………………………………………………….…… viii Introduction…………………………………………………………………………... 1 Literature Review…………………………………………………………………….. 3
I. Tree Growth and Dormancy……………………………………………….. II. Poplar as a Model Plant to Study Bud Dormancy…………………………. III. The Apical Bud…………………………………………………………….
A. Bud Structure……………………………………………………………... B. Apical Bud Formation and Dormancy in Poplar………………………….
1. Endodormancy Establishment is a Complex Process…………….….. 2. Stages of Bud Formation……………………………………………...
C. Significance of Bud Formation……………………………………….…... IV. Physiological and Biochemical Changes during Dormancy………………. V. Regulators of Bud Formation………………………………………….…...
A. Environmental Factors……………………………………………………. 1. Photoperiod…………………………………………………………... 2. Temperature………………………………………………………….. 3. Water and Nutrition…………………………………………………..
B. Hormonal Control of Bud Dormancy…………………………………….. 1. Abscisic Acid (ABA)…………………………………………….…... 2. Gibberellin (GA)……………………………………………………...
VI. Genes Involved in the ABA Signal Transduction Pathway……………….. A. Abscisic Acid-Incentive (ABI) Genes……………………………………. B. Genes Regulated by ABI5…………………………………………….…..
VII. basic Leucine Zipper (bZIP) Transcription Factors……………………….. A. bZIP Transcription Factors in Arabidopsis……………………………….. B. PtFD1………………………………………………………………….…..
1. PtFD1 Encodes a bZIP Transcription Factor………………………… 2. Expression of PtFD1 in Poplar……………………………………….
3 5 6 6 7 7 7 8 9 10 10 10 12 13 13 13 14 16 16 17 17 20 20 20 21
Materials and Methods……………………………………………………………….. 22 I. Materials…………………………………………………………………....
A. Plant Material and Growth Conditions…………………………………… 22 22

iv
B. T-DNA Binary Vectors…………………………………………………… II. Methods…………………………………………………………………….
A. Sample Collection and RNA Extraction……………………………….…. B. Plasmid DNA Extraction…………………………………………………. C. PCR Amplification…………………………………………………….….. D. Gel Purification of PCR Products………………………………………… E. TOPO Cloning and Transformation of PCR Products……………………. F. Gateway™ LR Recombination Reaction…………………………………. G. Make Agrobacterium Competent Cells…………………………………… H. Agrobacterium Transformation…………………………………………… I. Agrobacterium-Mediated Poplar Transformation…………………………
1. Pre-Conditioning……………………………………………………... 2. Co-Cultivation…………………………………………………….….. 3. Decontamination……………………………………………………... 4. Regeneration…………………………………………………………. 5. Rooting………………………………………………………………..
J. DNase Treatment of RNA Samples Prior to RT-PCR……………………. K. cDNA Synthesis…………………………………………………………... L. Tissue Culture Media Preparation………………………………………… M. DNA and RNA Quantification……………………………………………. N. DNA Sequencing…………………………………………………………. O. Sequence Analysis………………………………………………………...
II. Experimentation…………………………………………………………… A. Construction of PtFD1 RNAi and Overexpression Vectors………………. B. Generation of A. tumefaciens with T-DNAs……………………………… C. Propagation of Transgenic Poplars…………………………………….…. D. RT-PCR of PtFD1………………………………………………………... E. Histological Analysis of Apical Buds………………………………….….
23 23 23 24 24 25 25 26 26 27 27 28 28 28 29 29 29 30 30 31 31 31 32 32 34 35 36 37
Results………………………………………………………………………………... 40 I. Construction of Transgenic Vectors………………………………………..
A. PCR Amplification of PtFD1 Fragments……………………………….… B. Cloning of PCR Products into pENTR/D-TOPO Vector……………….… C. Transfer of the PtFD1 Fragments to the Binary Vectors…………………. D. Transfer of the Binary Vectors to A. tumefaciens…………………………
II. Propagation of Transgenic Poplars………………………………………... III. Morphological Characteristics of the Transgenic Poplars……………….… IV. RT-PCR of PtFD1 in Transgenic Poplars……………………………….…
A. PtFD1 Expression in Shoot Tips or Apical Buds…………………………. B. PtFD1 Expression in other Tissues………………………………………..
V. Histological Analysis of Transgenic Shoot Tips or Apical Buds…………..
40 40 44 44 49 51 52 57 57 61 63
Discussion……………………………………………………………………………. 65 I. Origin of the Study of PtFD1……………………………………………… II. Sequence Analysis of PtFD1………………………………………………. III. Characterization of PtFD1…………………………………………………
65 68 70

v
A. Involvement of PtFD1 in Bud Formation and Development……………... B. Involvement of PtFD1 in Flowering……………………………………… C. PtFD1 and ABA Pathways……………………………………………….. D. Possible Roles of PtFD1…………………………………………………..
IV. Suggestions for Future Study………………………………………………
70 71 73 74 76
Appendices…………………………………………………………………………… 77 References……………………………………………………………………………. 79

vi
List of Tables 1. Treatments for the plant materials in growth chamber 22
2. PCR reaction conditions 25
3. Media for poplar transformation 27
4. Primers for PCR of 4w PCR2-14 PTBF1 32
5. PtFD1 specific primers for PCR amplification 37
6. Paraffin/TBA method 38
7. Staining processes for the slides 39
8. Restriction enzymes and predicted digestion production of PtFD1 binary plasmids 45

vii
List of Figures
1. PtFD1 cDNA sequence 42
2. PCR of 4wk PCR 2-14 PTBF1 43
3. Digestion of the RNAi vector pB7GWIWG2 (II)::Rev51 with EcoRI 47
4. Digestion of RNAi vector pB7GWIWG2 (II)::+TGA and overexpression vector pB7WG2::+TGA 48
5. Digestion of T-DNA binary plasmids extracted from A. tumefaciens 50
6. PtFD1 transgenic plants (Overexpression and RNAi) and control (717-1B4) plants 53
7. Shoot apices of 717-1B4 and PtFD1 overexpression plants in LD or after 8 weeks of SD treatment 55
8. Flower buds on PtFD1 overexpression plantlets 56
9. RT-PCR of PtFD1 58
10. RT-PCR of PtFD1 60
11. RT-PCR of PtFD1 62
12. Anatomy of control and transgenic shoot tips or apical buds 64
13. Sequence analysis of PtFD1 and the Group A Arabidopsis bZIP transcription factors 66
14. ClustalW alignment of PtFD1, AtbZIP14 and AtbZIP27 sequences 67
15. Amino acid sequence of PtFD1 bZIP protein 69

viii
List of Abbreviations ABA Abscisic Acid
ABI Abscisic Acid Insensitive
bp base pair
C Celsius
CaCl2 calcium chloride
cDNA complementary DNA
dNTP deoxynucleotide triphosphate
EtBr ethidium bromide
EtOH ethanol
FAA Formalin-acetic acid-alcohol
GA Gibberellic Acid
kDa kiloDalton
KoAc potassium acetate
L Liter
LB Luria-Bertani
LD long days
LT low temperature
mg milligram
µg microgram
min minute(s)
ml Milliliter
µl microliter

ix
MS Murashige and Skoog
ng nanogram
nm nano-meter
OE over-expression
PCR Polymerase Chain Reaction
RNAi RNA interference
RPM revolutions per minute
RT-PCR reverse transcription-polymerase chain reaction
SD short days
sec second(s)
S.O.C. Salt-Optimized + Carbon
TBA tert-Butanol
T-DNA Transferred-DNA
UV Ultraviolet
wk week
w/v weight/volume

1
Introduction
The growth of temperate woody perennial plants is characterized by growth
periods (time between spring bud break and fall bud set) interrupted by a vegetative
dormancy phase during the winter. Dormancy is an adaptive mechanism that
enables plants to survive unfavorable environmental conditions and resume growth
when conditions become favorable. Vegetative bud dormancy also influences the
morphology and architecture of trees (Rohde et al., 2000).
Formation of the apical buds is the most obvious morphological change
associated with the transition from vegetative growth to dormancy (Rohde et al.,
2000). The physiological and morphological changes that occur during dormancy
allow trees to cope with water and temperature stress (Thomas and Vince-Prue,
1997). The release from dormancy requires exposure to chilling temperature and
once the chilling requirement has been fulfilled, bud breaking occurs and vegetative
growth resumes in favorable conditions (Powell, 1987).
Apical bud formation is central to bud development (Juntilla and Kaurin,
1990). Although extensive research has been performed in this field, most studies
focused on physiological aspects of bud dormancy. The molecular mechanisms that
control apical bud formation still remain elusive. However, with the development
of modern genetic technologies, research has begun to concentrate on discovering
the genes regulating this process.

2
The research in this thesis focuses on PtFD1, a basic leucine zipper (bZIP)
transcription factor expressed in poplar apical buds. The expression of PtFD1 is
coincident with the process of apical bud formation and maturation. PtFD1 mRNA
level peaks after several weeks of short day (SD) treatment and then decline.
Exogenous abscisic acid (ABA) application can also induce the expression of
PtFD1 (Gnewikow, 2001). From this, PtFD1 appears to be a candidate gene
regulating poplar apical bud formation and maturation.
To test this hypothesis, transgenic poplars that either overexpress PtFD1 or
which downregulate PtFD1 expressing using RNAi were generated. The
experiments presented in this thesis focused on: 1) the role of PtFD1 in poplar
apical bud formation; 2) the possible interactions of PtFD1 with other bud
formation-related genes; 3) whether PtFD1 is involved in other physiological
events.
3
Literature Review
I. Tree Growth and Dormancy
Woody perennial plants of the temperate zone synchronize their growth cycle
with changing seasons, fluctuating temperature, different photoperiod (Villiers,
1975). Typically, tree growth involves two phases: a period of active growth and a
dormant period. The growing period begins with spring bud break during which the
shoot elongates. The shortening of daylength induces growth cessation and bud
formation in late summer and autumn. The formation of an apical bud usually
signals the beginning of dormancy and is an adaptive response to harsh
environments. The breaking or release from dormancy requires exposure to chilling
temperatures. After the chilling requirement has been fulfilled, the apical bud is
released from dormancy and shoot elongation can resume (Powell, 1987). In
Populus, a perennial woody plant, growth cessation, bud formation and dormancy
are phytochrome-mediated SD photoperiod responses (Howe et al, 1996; Zhu &
Coleman, 2001).
Although dormancy is not completely understood, researchers have defined
dormancy based on practical terms. Dormancy is defined as “the temporary
suspension of visible growth of any plant structure containing a meristem” (Lang,
1987). Based on this definition, dormancy can occur in any organ that contain
meristems, including seeds, buds, tubers, roots and vascular cambium.
Dormancy is an adaptive mechanism that enables meristems to survive

4
unfavorable environmental conditions such as cold temperature or desiccation, and
resume growth when the conditions become favorable again (Rohde et al., 2000).
For trees, dormancy also has a morphogenetic effect in influencing growth habit
and tree form. Because of dormancy, woody plants can adapt to a wide range of
circumstances.
Dormancy has been classified into three categories: ecodormancy,
paradormancy and endodormancy (Lang, 1987). In ecodormancy, growth cessation
is imposed by one or more unsuitable environmental factors, such as nutrient or
water deficiencies or unfavorable temperature. Growth can resume when the
conditions become favorable. In paradormancy, growth control is imposed by plant
structures other than the affected organ. When the control of dormancy occurs
within the dormant organ, it is defined as endodormancy. In endodormancy, growth
cannot resume even under favorable environmental conditions (Lang, 1987). Once
the chilling requirement has been fulfilled, apical buds can break (Amling, 1980).
However, low temperature may still prevent the buds from breaking. Only when
temperatures become warm can apical buds be released from dormancy (Martin,
1991).
Trees can undergo each of the three types of dormancy in their growth cycle
(Critchfield, 1960). During shoot elongation, the growth of lateral buds is inhibited
by auxin from the shoot apex, which is the effect of paradormancy. Endodormancy
occurs when the dormancy enters into a stage when growth will not resume even
under favorable conditions. Chilling requirements must be fulfilled before the buds

5
are released from dormancy. Also the buds may be held in a dormant status until a
favorable temperature is reached, which can be defined as ecodormancy. The type
of dormancy that this research focused on is endodormancy.
Seed and bud dormancy have some common features such as chilling
requirements, the regulatory role of GA and ABA, accumulation of reserve proteins
and acquisition of desiccation tolerance (Powell, 1987; Dennis 1996). Although
little is known about the genetic regulatory factors involved in bud dormancy, it has
been shown that Abscisic Acid Insensitive 3 (ABI3) plays an important role in late
seed development (Giraudat et al., 1992; Parcy et al., 1994). The poplar ABI3
homologue PtABI3 is essential for correct embryonic leaf differentiation during bud
set in poplar (Rohde et al., 2002). Because of the similarities between seed and bud
dormancy, it is possible that similar regulatory mechanisms exist between them.
II. Poplar as a Model Plant to Study Bud Dormancy
Poplar can serve as a model system for the study of bud dormancy in woody
plants. First, as a woody perennial plant, poplar undergoes dormancy in response to
short day (SD) photoperiod and forms apical buds (Howe et al, 1996; Zhu &
Coleman, 2001). These features can be manipulated in growth chambers using
different photoperiods. Second, it is one of the fastest growing temperature trees
and can be easily propagated. Third, many genetic techniques have been practiced
successfully in poplar, such as Agrobacterium-mediated transformation. Poplar also
has a relatively small genome size (450-550 Mbp) that has been sequenced. Besides,

6
poplar also has commercial values as a tree for timber, plywood, pulp and paper
(Taylor, 2002).
III. The Apical Bud
A. Bud Structure
Two types of buds are found in woody plants, apical and lateral buds. Apical
buds consist of the apical meristem that was formed during embryogenesis while
lateral buds are found in the axis of leaf petioles and contain meristems for branch
shoots. Lateral buds often do not elongate during the season in which they were
formed. In angiosperms, the meristem consists of several zones including a central
zone with three layers of cells, which acts to maintain the population of
indeterminate cells. Beneath the central zone is the peripheral zone, which is the
major source of new cells in the apical meristem and of organ primordia. The rib
meristem in the very center is where cells begin to elongate (Kerstetter and Hake,
1997).
The apical bud is located at the apex of a stem. It is a short axis consisting of a
densely packed series of leaf primordial that is produced by the shoot apical
meristem (Rohde et al, 2000). In buds that are actively growing, the axis elongates
with progressive formation of the primordia. During bud set, internode elongation
ceases above the primordial that will develop into bud scales. Bud scales are formed
by overlapping, modified stipules of unexpanded leaf primordia. An apical bud of
Populus trichocarpa usually consists of apical meristem at the center and 6-9 leaf
7
primordia, which are enveloped by bud scales (Critchfield, 1960).
B. Apical Bud Formation and Dormancy in Poplar
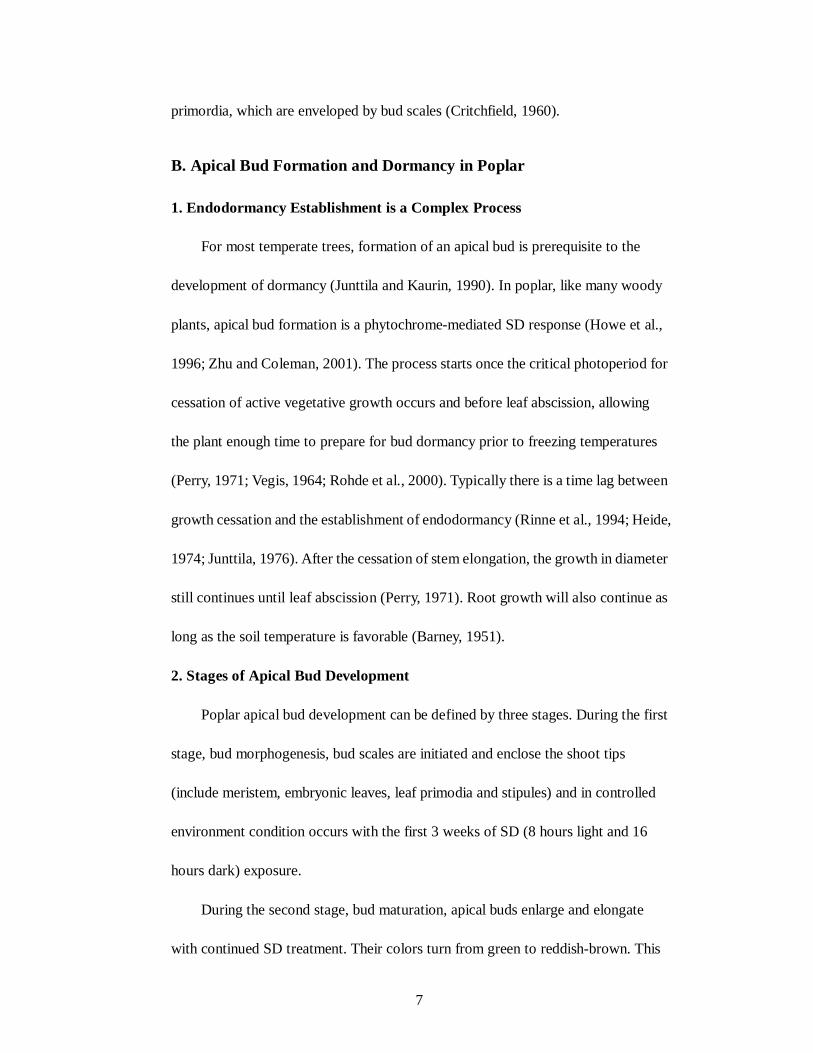
1. Endodormancy Establishment is a Complex Process
For most temperate trees, formation of an apical bud is prerequisite to the
development of dormancy (Junttila and Kaurin, 1990). In poplar, like many woody
plants, apical bud formation is a phytochrome-mediated SD response (Howe et al.,
1996; Zhu and Coleman, 2001). The process starts once the critical photoperiod for
cessation of active vegetative growth occurs and before leaf abscission, allowing
the plant enough time to prepare for bud dormancy prior to freezing temperatures
(Perry, 1971; Vegis, 1964; Rohde et al., 2000). Typically there is a time lag between
growth cessation and the establishment of endodormancy (Rinne et al., 1994; Heide,
1974; Junttila, 1976). After the cessation of stem elongation, the growth in diameter
still continues until leaf abscission (Perry, 1971). Root growth will also continue as
long as the soil temperature is favorable (Barney, 1951).
2. Stages of Apical Bud Development
Poplar apical bud development can be defined by three stages. During the first
stage, bud morphogenesis, bud scales are initiated and enclose the shoot tips
(include meristem, embryonic leaves, leaf primodia and stipules) and in controlled
environment condition occurs with the first 3 weeks of SD (8 hours light and 16
hours dark) exposure.
During the second stage, bud maturation, apical buds enlarge and elongate
with continued SD treatment. Their colors turn from green to reddish-brown. This

8
stage is also characterized by the decrease of bud water content and accumulation of
storage reserves. During bud maturation, the meristem is not dormant and when
plants are transferred to long day (LD, 16 hours light and 8 hours dark) or SD with
night break, shoot growth will resume and leaves will emerge from the bud.
The third stage is bud dormancy. In controlled environment conditions, this
stage occurs after more than 6 weeks of SD exposure. During this stage, bud growth
eventually ceases, bud water content continues to decline and the meristem
becomes dormant. At this stage, bud burst and regrowth will be delayed by at least 4
weeks when treated with LD.
C. Significance of Bud Formation
The actual growth period of temperate woody perennials occurs between
spring bud break and fall bud set and determines tree productivity and wood quality
(Rohde et al., 2000). In tree breeding programs, an appropriate bud flushing date, an
indeterminate shoot growth and the timing of bud set are of great importance
(Dickmann and Keathley, 1996). The timing of bud set in temperate climates is
crucial for the trees to avoid frost damage. Failure of bud break when chilling
requirements cannot be fulfilled in warm climates can significantly impact
productivity.
Apical bud formation is prerequisite to the development of bud dormancy.
Since bud scales enclose leaf primordia, they may act as possible regulators
controlling growth and dormancy (Perry, 1971). In some species, it seems that the
bud scales produce some unknown compounds that inhibit growth. It has been

9
shown that the presence of bud scale inhibits the growth of primordia enclosed
within the bud and this effect correlate with the stage of quiescence the bud has
reached (Iwasaki and Weaver, 1977; Tinklin and Schwabe, 1970; Swartz et al.,
1984).
Since bud formation functions in both adaptive and morphological responses,
it is essential in the understanding of tree biology. Such knowledge will assist in tree
breeding, maintenance and improvement.
IV. Physiological and Biochemical Changes during Dormancy
The physiology of bud dormancy has been extensively studied for decades. In
addition to the visible morphological changes, many physiological and biochemical
changes occur within the plant during the process of bud formation and dormancy.
These include changes in enzyme activities, membrane lipid composition, bud
water status, amino acids, carbohydrates, proteins and respiration.
SD treatments result in the accumulation of starch, markedly thickened cell
walls and much denser cytoplasm, suggesting that plants synthesize and accumulate
starch, cellulose, lipids, proteins and other bio-polymers during dormancy
induction (Perry, 1971; Bonicel et al., 1987; Coleman and Chen, 1996).
Dormant buds usually have reduced water content and water molecules appear
to be associated with macromolecules (Faust et al., 1997). More than half of the
bound water molecules disasscociate from macromolecules after the chilling
requirement has been fulfilled (Faust et al., 1995).

10
SD leads to the closure of plasmodesmata that connect the cells in the apical
meristem. The altered cell-to-cell communication may initiate growth cessation and
dormancy development (Jian et al., 1997; Rinne and van der Schoot, 1998). Release
from bud dormancy by chilling involves restoration of the cell-to-cell connection
through plasmodesmata.
Growth cessation leads to the accumulation of photosynthesis assimilates and
proteins in the plant (Sauter et al., 1996). Cellulose synthesis is reduced prior to
dormancy while synthesis of lignin is accelerated (Perry, 1971). During the
induction of dormancy, carbon and nitrogen are stored as starch and protein
respectively (Coleman and Chen, 1996). SD also induces the expression of bark
storage protein (BSP) genes (Coleman et al., 1992).
V. Regulators of Bud Formation
Regulators of bud formation and dormancy include light (photoperiod),
temperature, water and hormones (abscisic acid, gibberellins) (Rohde et al., 2000)
A. Environmental Factors
1. Photoperiod
Photoperiod is a key regulator of bud formation and dormancy in poplar and
many other trees with indeterminate growth patterns (Howe et al., 1996). It affects
both the vegetative growth period and the onset of bud set.
Growth cessation is one of the initial events in the dormancy process and is

11
mainly induced by perception of critical photoperiod, which is the longest
photoperiod that can induce growth cessation. The critical photoperiod shows
ecotypic variation among species and is inherited as a quantitative trait (Hummel et
al., 1982; Junttila, 1982; Li and Adams, 1993). Generally, northern ecotypes have
longer critical photoperiods than southern ecotypes so that trees in higher latitudes
can enter growth cessation and bud formation earlier to cope with the frost that will
come sooner (Junttila, 1980).
Phytochrome is the primary photoreceptor in photoperiodism. They are
dimeric chromoproteins with monomers of 120-130kD, which exist in two forms
that are interchangeable. They convert to an active far-red light (FR) absorbing
form (Pfr) after absorbing red light (R); after FR treatment, they convert to an
inactive R absorbing form (Pr). In darkness, phytochromes are converted from Pfr
to Pr. The ratio of R to FR declines during sunset and is employed by the plants to
measure the length of the day (Tai and Zeiger, 2002).
In Arabidopsis, five distinct phytochrome genes were identified, named phyA
to phyE. Both phytochrome A and phytochrome B may be involved in
photoperiodic responses. PhyA is a type I phytochrome that is much more abundant
in dark-grown seedlings. PHYA protein accumulates in the dark and breaks down
rapidly after converting to its Pfr form in light. Experiments with transgenic hybrid
aspen suggest that responses to photoperiod could be affected by the amount of
phytochromes present in plants. Olsen et al. 1997 showed that poplars (Populus
tremula × P. tremuloides) that overexpress oat PHYA did not stop shoot elongation
12
under SD treatment, and were unable to shed leaves and cold acclimate (Olsen et al.,
1997)
2. Temperature
Lavender et al. 1973 suggested a scenario in which air and soil temperatures
and photoperiod all interact to permit the earliest possible bud activity compatible
with the risk of frost for any given year (Lavender et al., 1973). Dormancy intensity
is promoted in woody plants exposed to a few weeks of chilling temperature after
bud formation (Walser et al., 1981). Junttila et al. 2003 showed that induction and
depth of bud dormancy in birch are significantly affected by temperature. In six
ecotypes of Betula pubescens Ehrh and two ecotypes of Betula pendula Roth that
were tested by raising temperature during dormancy induction, bud dormancy
developed most rapidly at 15-18°C and was delayed by both 9-12°C and 21°C
temperatures (Junttila et al., 2003). These results are consistent with what was
found in Norway spruce and Acer rubrum (Heide, 1974; Downs and Borthwick,
1956). In some species that are insensitive to photoperiod, such as apple and pear,
growth cessation, formation of bud scales and winter buds, leaf senescence and
abscission, dormancy induction and release occur in response to low temperature
(Heide and Prestrud, 2005). Plant receptors for low temperatures have not been
found. Örvar et al. 2000 showed that changes in membrane fluidity in response to a
decrease in temperature trigger calcium influx from vacuoles or extracellular
storage and induces a signaling cascade leading to changes in the expression of
genes that are responsible for increased tolerance of freezing (Örvar et al., 2000).

13
Temperature also has a role in release of dormancy, bud break and resumption
of shoot elongation. Buds need to be exposed to chilling temperature for a certain
time to be released from dormancy. After the chilling requirements have been
fulfilled, shoot elongation resumes in response to rising temperature (Perry, 1971).
3. Water and Nutrition
Both water supply and mineral nutrition interact with dormancy induction.
Dehydration has been shown to be an integral part of bud dormancy development
(Rohde et al., 2000). Water stress will deepen dormancy and if severe enough will
result in a resting bud and leaf abscission in some species. Mineral nutrition, in
particular nitrogen status influence dormancy induction. High levels of nitrogen
will delay the onset of dormancy, induce bud break and growth resumption if
applied to plants in late summer or early fall.
B. Hormonal Control of Bud Dormancy
1. Abscisic Acid (ABA)
Abscisic acid (ABA) is known to be a “stress hormone” involved in plant
responses to abiotic stress, such as dehydration, low temperature and salinity. ABA
also plays a role in the regulation of plant development, including embryogenesis,
shoot growth, seed dormancy and leaf transpiration. ABA triggers rapid stomata
closure by ion effluxes from guard cells to inhibit water loss through transpiration
(Taiz and Zeiger, 2002). In seeds, ABA acts as an efficient inhibitor of germination
and occurs in high concentrations in dormant seeds (Bewley, 1997). The
involvement of ABA in potato microtuber dormancy has been demonstrated (Suttle

14
& Hulstrand, 1994).
ABA is assumed to be associated with vegetative growth cessation. Seasonal
changes in ABA levels have been observed in leaves, buds and xylem saps in
various species of woody plants. The level is the highest during mid-summer or
autumn and declines during winter (Rohde et al., 2000). Rinne et al. 1994 showed
that in apical and lateral buds of Betula pubescens, ABA levels are 5-8 fold higher
under SD conditions than under LD. Under water stress, the ABA levels in lateral
buds doubled (Rinne et al., 1994).
In poplar, it has been found that ABA contents are much higher in apices
exposed to LD than to SD and the contents increase when temperature is lower
(Welling et al., 2002). ABA levels increase transiently in developing poplar apical
buds after 24-27 days of SD treatment and decline with continued SD treatment
(Rhode et al., 2002). Exogenous ABA treatment has also been observed to cause
growth cessation and bud dormancy in some species under LD conditions and can
also prevent release of bud in ecodormancy (El-Antably et al., 1967; Rinne et al.,
1994). Maintenance of endodormancy requires continuous endogenous ABA
biosynthesis (Le Bris et al., 1999).
All evidence indicates that ABA plays a role in maintaining dormancy in
apical bud. Whether it is an inducer of dormancy remains elusive, but it appears that
ABA alone is not enough to induce apical bud dormancy.
2. Gibberellin (GA)
In addition to ABA, the role of GAs in bud dormancy has been extensively

15
studied. GAs was suggested to act as an antagonist of ABA and functions in
accelerating growth (Taiz and Zeiger, 2002). Among the GAs, GA1 appears to be
the active GA involved in stem elongation and growth cessation in woody plants
(Junttila et al., 1991; Olsen et al., 1995).
The levels of GAs are lower under SD than under LD in many species, this
suggests that photoperiodic regulation of shoot elongation may be mediated by the
regulation of GA biosynthesis (Jackson and Thomas, 1997). SD may block some
steps in GA biosynthesis and is mediated by PHYA (Olsen et al., 1997). Reduction
in GA1 levels affect cell divisions in the subapical meristem and result in growth
cessation (Hansen et al., 1999). Olsen et al. 2004 showed that in deciduous plants,
GA1 can completely substitute for a long photoperiod, and SD induced growth
cessation is preceded by a significant reduction of GA1 levels, particularly in the
elongation zone. Apart from the phytochrome pathway, cessation of growth and
initiation of hardening in trees can also be controlled through the GA mediated
pathways (Olsen et al., 2004).
Due to current experimental results, it is reasonable to hypothesize that GAs are
involved in shoot growth cessation induced by SD, further evidence are needed to
confirm this hypothesis.

16
VI. Genes Involved in the ABA Signal Transduction Pathway
A. Abscisic Acid-Insensitive (ABI) Genes
The ABA signal transduction pathway involves hormone binding to its
receptor, amplification of the primary signal and initiation of gene expression that
are responsible for the physiological effects (Taiz and Zeiger, 2002). In Arabidopsis,
a series of mutants that have normal ABA biosynthesis but display alternative
sensitivity to ABA have been isolated to identify the components of the pathway.
These mutants consist of five loci, abi1, abi2, abi3, abi4 and abi5 that were selected
by the ability of the seeds to germinate in the presence of inhibitory concentrations
of ABA. Mutant abi1, abi2 and abi3 display significant reduction in seed dormancy
while abi3, abi4 and abi5 show defects in various aspects of seed maturation. Also,
abi1 and abi2 affect ABA responses in vegetative tissues (Koornneef et al., 1984;
Finkelstein, 1994; Nambara et al., 2000). The ABI1 and ABI2 genes encode
homologous type 2C serine/threonine protein phosphatases (Leung and Giraudat
1998). The other three, ABI3, ABI4, and ABI5, encode putative transcription factors
(Giraudat et al. 1992; Finkelstein and Lynch 2000). ABI3 is the ortholog of the
maize vp1 gene, encoding a B3-domain transcription factor. ABI4 contains an
APETALA2-like DNA binding domain. ABI5 encodes a bZIP transcription factor
(Finkelstein et al., 2002).
The ABA response effects of ABI3, ABI4 and ABI5 during seed germination
are well known. Research in poplar demonstrated that ABI3 (PtABI3) is an
essential factor of bud set and a precondition for dormancy establishment (Rohde et

17
al., 2002). The three transcription factors may form a regulatory complex to
mediate gene expression (Brocard et al., 2002).
B. Genes Regulated by ABI5
ABI5 is a member of the basic leucine zipper transcription factor family,
grouped as AtbZIP39 in Group A. In Arabidopsis, it is expressed in both seeds and
vegetative tissues and is required for ABA-regulated gene expression (Finkelstein
and Lynch, 2000). Mutations in abi5 will cause reduced ABA sensitivity during
seed germination. Furthermore, abi5 mutation has decreased expression of some
LEA (Late Embryogenesis Abundant) genes that are ubiquitous in most of the
higher plants. LEA proteins accumulate during late stages of embryo development
and are thought to be involved in desiccation tolerance (Bensmihen et al., 2002). In
Arabidopsis, among the ABREs (ABA-responsive elements) of Em (encodes a
class I LEA protein) promoter, a G-box type element shows strong binding with
ABI5, suggesting ABI5’s role in regulating these genes (Carles et al., 2002). In
sunflower, genes encoding DPBFs (Dc3 promoter-binding factors) that can bind to
the promoter of Dc3 (a carrot lea class gene) have been isolated. An Arabidopsis
homolog of DPBF, AtDPBF-1 is identical to ABI5 (Kim et al., 2002).
VII. Basic Leucine Zipper (bZIP) Transcription Factors
Transcription factors are proteins that bind DNA at a specific promoter or
enhancer region and facilitate its transcription. They play critical roles in almost all

18
biological processes. Despite the difference in the structures, the transcription
factors share two functional domains: a DNA-binding domain that recognizes and
binds to the specific DNA sequence of the promoter or enhancer, a transcription
activation domain that interacts with other proteins and increasing the efficiency of
transcription. Transcription factors are categorized according to the structure of
their DNA binding domains, including zinc finger proteins, helix-turn-helix
proteins, and leucine zipper proteins. Transcription factors can be activated or
deactivated by other proteins.
One group of transcription factors is defined as basic leucine zipper (bZIP)
motif. Plant bZIP proteins play a role in gene control of many processes, such as
seed storage, photomorphogenesis and organ establishment (Schmidt et al., 1990;
Oyama et al., 1997; Waltch et al., 1998). They also exhibit functions of gene control
in response to stimuli including ABA, light and developmental signals (Menkens et
al., 1995).
Basic leucine zipper transcription factors function as dimers. Each of the
mononers contains a basic DNA binding domain at the carboxyl terminus
(C-terminus), adjacent to a leucine zipper helix that is characterized by several
leucine residues regularly spaced at seven-amino acid intervals. These leucine
residues or other bulky hydrophobic amino acids locate exact nine amino acids
towards the C-terminus to generate an amphipathic helix. To form a dimer, two
subunits adhere via interactions between the hydrophobic sides of their helix,
creating a superimposing coiled-coil structure (so called “leucine zipper”). The

19
monomers can be either identical or not and form homodimers or heterodimers. The
DNA binding domain consists of a basic region, a highly conserved region enriched
in basic amino acids that is approximately 25 residues in length, that contacts
directly with DNA to stimulate or repress transcription. To bind DNA, the two basic
regions are inserted into the major groove of the DNA, each helix finding an
identical DNA sequence, results in a scissors look (Landschulz et al., 1988; Pathak
and Sigler, 1992; Meshi and Iwabuchi, 1995).
Plant bZIP proteins exhibit a DNA-binding specificity for DNA sequence
motifs containing an ACGT core (Foster et al., 1994). Experiments demonstrated
that nucleotides flanking the ACGT core also affected binding specificity. Three
different types of ACGT motifs were identified: G-box, CACGTG; C-box,
GACGTC and A-box, TACGTA. Correspondingly, bZIP transcription factors could
also be categorized into three groups according to their qualitative and quantitative
specificity for G-box and C-box elements: Group 1 have a stronger binding affinity
for G-box; Group 2 show a comparable binding affinity to both G-box and C-box
(Group 2); Group 3 display a stronger binding affinity for C-box (Izawa et al.,
1993).
Transcription activation domains interact with basal machinery to activate
transcription. The structure of activation domain has not yet been clarified. They
exhibit common amino acid sequence features in some cases and thus are classified
in several categories including acidic activation domains, Glutamine-rich domains
and Proline-rich domains. In addition, three serine residues that are highly

20
conservative in bZIP transcription factors have been identified. Phosphorylation of
the serine residues affects the binding preference and ability of the bZIP proteins
(Meshi et al., 1998).
A. bZIP Transcription Factors in Arabidopsis
Transcription factors with bZIP domains are present in almost all eukaryotes.
In plants, bZIP proteins regulate processes including light and stress signaling, seed
maturation, flower development. In the Arabidopsis genome, 73 distinct members
of the bZIP families were found as potential bZIP genes. The AtbZIP family
members were further classified into ten groups, named from Group A to Group I,
and Group S, according to similarities of their basic regions. A number of Group A
bZIP are associated with ABA signal transduction in both seeds and vegetative
tissues (Jakoby et al., 2002).
B. PtFD1
1. PtFD1 Encodes a bZIP Transcription Factor
First termed as PTBF1 (Poplar Terminal Bud Factor 1;GenBank Access
Number: AF288616), PtFD1 encodes a bZIP protein of 29.5kD that shares
significant sequence similarity in the basic and leucine zipper region with
AtbZIP14, a members of the Arabidopsis Group A bZIP transcription factors, which
was later identified as FD. FD is a bZIP protein that is required for FT to promote
flowering through protein interaction in the shoot apex in Arabidopsis (Abe et al.,
2005).
21
2. Expression of PtFD1 in Poplar
PtFD1 is expressed during bud formation in response to SD photoperiod. The
expression of PtFD1 occurs after bud morphogenesis and correlates with the
process of apical bud formation and maturation. The abundance of PtFD1 mRNA
reaches its peak after 4-6 weeks of SD treatment and then declines with prolonged
SD treatment.
PtFD1 expression is limited in the shoot meristem and young leaf primordial. It was
also detected in lateral buds at a lower level than in apical buds, but not expressed in
other tissues including leaves, stipules, bud scales, bark.
Under LD conditions, the expression of PtFD1 in shoot apex can also be
induced by ABA treatment and high water stress (Gnewikow et al., 2001).

22
Materials and Methods
I. Materials
A. Plant Material and Growth Conditions
The hybrid poplar (Populus alba × Populus tremula) clone 717-1B4 was used
for all experiments. Plants were maintained and propagated using shoot cultures.
For all growth chamber experiments, rooted plants derived from tissue culture were
potted in small plastic containers, one in each pot. The plantlets were first grown in
the growth chamber under LD photoperiod (16hour light/8hour dark, 18 ºC) for
approximately 4 weeks or until the plantlets have reached 25-30cm in height. After
this, the photoperiod of the growth chamber was switched to SD photoperiod
(8hour light/16hour dark, 18 ºC). The plants were treated in SD for 8 weeks. After
that, the growth chamber was set to SD plus low temperature (LT) (8hour
light/16hour dark, 10 ºC/4 ºC) for another 4 weeks. After the SD and SD+LT
treatments, the plants were returned to LD (16hour light/8hour dark, 18 ºC).
Table 1. Treatments for the plant materials in growth chamber
LD SD SD+LT LD
Light 16 h / 18 ºC 8 h / 18 ºC 8 h / 10 ºC 16 h / 18 ºC
Dark 8 h / 18 ºC 16 h / 18 ºC 16 h / 4 ºC 8 h / 18 ºC
Duration 5~6 weeks 8 weeks 4 weeks ∞
During the period, the plants were watered every other day supplemented with
0.5X Hoagland’s solution.

23
B. T-DNA Binary Vectors
The T-DNA binary vectors used to construct the chimeric genes are
pB7GWIWG2(II) for RNAi and pB7WG2 for overexpression (Karimi et al., 2002).
Their maps were shown in the Appendix.
II. Methods
A. Sample Collection and RNA Extraction
Tissues (shoots tips, buds, leaves) were collected at specific time intervals (in
LD or after 3, 6, 8,12 weeks of SD treatment) and immediately frozen in liquid
nitrogen.
Following the modifications to Qiagen’s RNeasy mini kit modified by O.
Shevchenko and A. Brunner, the tissues were grounded to a fine powder in liquid
nitrogen using a mortal and pestle. Ground tissue (~ 200mg) was added to RNA
extraction buffer (1ml Qiagen RLT buffer, 0.01g soluble polyvinylpyrrolidone
(PVP-40, Sigma), 10μl β-mercaptoethanol), and vortex for 1 min to homogenize.
0.4 Volume of 5M potassium acetate (KoAC) (pH6.5) was added and mixed by
inversion. The mixture was incubated on ice for 15 min, divided into two 1.5ml
eppendorf tubes and centrifuged at 12,000 RPM for 15 min at 4 ºC. The supernatant
were transferred to 2 new 1.5 ml eppendorf tubes and 0.5 Volume of 100% ethanol
(EtOH) was added, mixed by pipetting up and down. The homogenate was
transferred to two RNeasy Spin Columns following Qiagen’s instructions for RNA

24
isolation from plant tissues. The column was washed twice with 50μl RNase-free
water to elute and collect RNA (Qiagen). The RNA (4×50μl) was precipitated
overnight with 0.1 Volume of 3M sodium acetate (NaoAC) (pH5.2) and 2 Volumes
of 100% EtOH at –20 ºC. The RNA was pelleted by centrifuging at 14,000RPM for
30 min at 4 ºC, washed twice with 70% EtOH (cold), dried under vacuum and
resuspend with 30μl of RNase-free water. RNA concentration was determined by
measuring absorption at 260 nm wavelength. The RNA samples were stored at –80
ºC.
B. Plasmid DNA Extraction
Plasmid DNA was extracted using Concert™ Rapid Plasmid Miniprep System
kit (Gibco BRL). Bacteria were cultured at 37 ºC overnight in 5 ml LB broth
supplemented with appropriate antibiotics. The cells were pelletted by centrifuging
at 12,000 RPM for 10 min. Following the manufacturer’s instruction, plasmid DNA
was eluted from the silica-based spin columns with TE or water. The plasmid DNA
was then digested with restriction enzymes and checked by agarose gel
electrophoresis.
C. PCR Amplification
All PCR reactions used the GeneAmp PCR System 9700 thermocycler (PE
Biosystems). A single 10µl PCR reaction consisted of 1µl 10X ExTaq Buffer, 2mM
MgCl2, 200 µM dNTPs, 0.2µM forward primer, 0.2µM reverse primer, 0.25 unit
Takara ExTaq DNA polymerase (Takara Biomedicals, Japan) and 2-20ng of DNA

25
template. Unless otherwise indicated, the conditions for the PCR reaction are listed
below:
Table 2. PCR reaction conditions
Denature Anneal Extend
Temperature 94 ºC 62 ºC 72 ºC
Duration 30 sec 1 min 1.5 min
D. Gel Purification of PCR Products
Extraction of DNA PCR products from agarose gels was accomplished using
the Concert™ Rapid Gel Extraction System kit (Gibco BRL). DNA bands in the gel
were stained with ethidium bromide (EtBr) and visualized under UV light. The
appropriate bands were cut from the gel and weighed. The agarose was dissolved in
gel extraction buffer at 50 ºC for 15 min. Following the manufacturer’s protocol,
the DNA/PCR products were purified and eluted from the silica-based spin
columns with appropriate amount of TE or water.
E. TOPO Cloning and Transformation with PCR Products
An appropriate amount of purified PCR product was mixed with 1µl salt
solution and 1µl TOPO vector and sterile water (optional) to a total volume of 6µl
(Invitrogen). The tube was incubated at room temperature for 5 min, then placed on
ice. 2µl of the cloning reaction was added to 100µl competent E. coli (TOP 10) cells
in an eppendorf test tube, and gently mixed. The tube was incubated on ice for 30
min, heat treated at 42ºC for 30 sec (heat-shock), and transferred immediately to ice.
Room temperature S. O. C. medium (250µl) was then added to the tube. The tube

26
was agitated horizontally at 37ºC for 1 hour (200RPM), then centrifuged at
4,000RPM for 10 min. The supernatant was discarded and 100µl fresh S.O.C.
medium was added to re-suspend the pellet. The cell suspension was spread on 2-3
pre-warmed LB agar plates supplemented with appropriate antibiotics. The plates
were incubated overnight at 37ºC.
F. Gateway™ LR Recombination Reaction
Reaction ingredients were added to a 1.5ml microcentrifuge tube at room
temperature, including 300ng of entry clone, 300ng of binary vectors, 1µl of
Topoisomerase I and 4µl of 5X LR Clonase™ reaction buffer. Then TE Buffer
(pH8.0) was added to a final volume of 16µl. The LR Clonase™ Enzyme Mix was
removed from -80ºC, thawed on ice, and mixed by vortexing briefly twice (2
sec/each). 4µl of the enzyme mix was added to the 16µl reaction mix (Invitrogen).
The recombination reaction was incubated at 25ºC for 1 hour. After incubation, 2µl
of 2µg/µl Proteinase K solution was added to the reaction and incubated at 37ºC for
10 min to stop the reaction. The expression resulting from the Invitrogen cloning
reaction was transformed to competent cells and selected on LB agar plates with
antibiotics.
G. Make Agrobacterium Competent Cells
Agrobacterium strain C58/pMP90 were grown overnight at 28 ºC in 5ml LB
broth with 20mg/L gentamicin. The next day, 2ml of the overnight culture was
added to 50ml of LB broth with 20mg/L gentamicin in a 250-ml flask and was

27
shaken vigorously (250RPM) at 28 ºC until the culture grew to an OD600 of 0.5-1.0.
The cell suspension was chilled on ice and centrifuged at 3,000g for 5 min at 4 ºC.
The supernatant solution was discarded. The cells were re-suspended in 1ml of
20mM ice-cold CaCl2, aliquoted into pre-chilled eppendorf tubes (100µl/each tube),
froze in liquid nitrogen and stored in –80 ºC for future use.
H. Agrobacterium Transformation (Freeze-Thaw Method)
Approximately 1µg plamid DNA is added to thawed competent cells at 4ºC.
The cells were then frozen in liquid nitrogen and thawed by incubating the test tube
in 37ºC water bath for 5 min (Freeze-Thaw Method). After incubation at 37ºC, 1ml
of LB broth was added to the tube and incubated at 28ºC for 2 –4 hours with gentle
shaking (~150RPM). The cells are then centrifuged for 30 sec and the supernatant
discarded. The cells were re-suspended in 100µl LB broth and spreaded on 2-3 LB
agar plates containing appropriate antibiotics. The plates were incubated at room
temperature in the dark. Transformed colonies appeared in 2-3 days.
I. Agrobacterium-Mediated Poplar Transformation
Table 3. Media for poplar transformation
M M1 M2
10µM NAAb 5µM 2iPc
M3
4.57g/L basal medium MSa 1mg/L L-cysteine 200mg/L L-glutamine 30g/L Sucrose
500mg/L Carbd 250mg/L Cefoe
0.1µM TDZf
BASTA
M1/2 1/2 dose BASTA
4g/L
phytaga
r
aMurashige and Skoog bNAA= naphthaleneacetic acid c2iP=6-(y,y,dimethylally-amino)-purine dCarb= carbenicillin eCefo= cefotaxime fTDZ= thidiazuron
28
1. Pre-Conditioning
Explants (stems and petioles) from the plants were pre-incubated on solidified
M1 medium that included 4.57g/L basal MS medium, 1mg/L L-cysteine, 200mg/L
L-glutamine, 30g /L sucrose and 4g/L phytagar for 48 hours at 24 ºC in darkness.
2. Co-Cultivation
A two-day culture of Agrobacteria containing appropriate binary vectors
grown on LB agar plates with appropriate antibiotics was used to prepare 25ml LB
medium with corresponding antibiotics. The 25-ml culture was shaken at 28 ºC
until OD660 reached about 0.3. The cell suspension was centrifuged at 12,000RPM
for 10 min and the supernatant was discarded. The cells were resuspended in 100ml
M liquid that consists of 457mg of basal medium MS, 0.1mg of L-cysteine, 20mg of
L-glutamine, 3g sucrose and appropriate antibiotics. Forty explants (stems and
petioles) were dipped into 25ml of the bacteria suspension in Petri dishes and stirred
slowly. After 16 hours, the explants were blotted on sterile paper towel to remove
excess bacteria and cultured on solidified M1 medium supplemented with 10µlM
NAA and 5µM 2iP. The explants were culture at room temperature on M1 medium
for 48 hours in darkness.
3. Decontamination
The explants were washed 4 times (5min/each time) in an antibiotic solution
that included sterile water, 250mg/L cefotaxime, 500mg/L carbenicillin and
25mg/L tetracycline with vigorous stirring. After the antibiotic wash, the explants
were washed 4 more times (5min/each) in sterile water, also vortexed vigorously.

29
After washing, the explants were transferred to M2 medium consisting of 4.57g/L
basal medium MS, 1mg/L L-cysteine, 200mg/L L-glutamine, 30g/L sucrose and
4g/L phytagar, supplemented with 10µM NAA, 5µM 2iP, 500mg/L carbenicillin,
and 250mg/L cefotaxime. The explants were cultured on M2 medium for 10 to 15
days for stems and about 25 days for leaves in darkness at 24 ºC.
4. Regeneration
The explants were transferred from darkness to light and cultured on solidified
M3 medium consisting of 4.57g/L basal MS medium, 1mg/L L-cysteine, 200mg/L
L-glutamine, 30g/L sucrose, 4g/L phytagar, supplemented with 500mg/L
carbenicillin, 250mg/L cefotaxime, 0.1µM thidiazuron.
5. Rooting
The shoots were transferred to M1/2 medium that contains the same
ingredients as M medium but only half the concentration of the macro-nutrients and
15g/L sucrose.
J. DNase Treatment of RNA Samples Prior to RT-PCR
RNA samples were treated with DNase to remove DNA. RNA was mixed with
RQ1 RNase-Free DNase buffer, RQ1 RNase-Free DNase (1u/µg RNA) and
Nuclease-free water to a final volume of 10µl (Promega), incubated at 37 ºC for 30
min. After DNA digestion, the reaction was terminated by adding 1µl of Stop
Solution and incubating at 65 ºC for 10 min.

30
K. cDNA Synthesis
First strand cDNA was synthesized using the ImProm-II™ Reverse
Transcription System (Promega) according to the manufacture’s instructions.
Approximately 0.4µg of total RNA (in 4.5µl or less) was mixed with 0.5µl
Oligo(dT), preheated at 70ºC for 5 min and immediately chilled on ice for at least 5
min. After incubation on ice, 4µl ImProm-II™ 5XReaction Buffer, 4.8µl 25mM
MgCl2 (6mM final conc.), 1µl 10mM dNTP Mix (0.5mM/each final conc.), 0.5µl
Recombinant RNasin® Ribonuclease Inhibitor (20 units) and ImProm-II™ Reverse
Transcriptase (1µl /reaction) (Promega) were added to the cDNA and reaction
volume adjusted to 20µl with nuclease-free water. The reaction was first incubated
at 25 ºC for 5 min for annealing followed by 42 ºC for 1 hour for cDNA synthesis.
After synthesis, the reaction was stopped by incubation at 70 ºC for 15 min. The
inactivated reverse transcription reaction was used directly for PCR amplification.
L. Tissue Culture Media Preparation
Media was prepared with nano pure water, autoclaved at 120 ºC for 15 min.
Vitamins, growth regulators, antibiotics and herbicides were added by filter
sterilization after the media was cooled to 50 ºC. After adding filter sterilized
ingredients, the media was poured to sterile Petri dishes or baby food jars and
allowed to cool before use.

31
M. DNA and RNA Quantification
DNA and RNA were quantified by measuring absorbance at 260nm (A260).
The DNA or RNA samples were diluted with water and loaded in a 96-well Costar
low UV plate for absorbance detection by µQuant™ Microplate Spectrophotometer
(Bio-Tek Instruments, Inc) following the manufacturer’s instruction. For reliable
quantification, A260 readings should lie between 0.1 and 1.0.
Absorbance at 280nm (A280) was also measured to calculate the ration of A260
to A280 (A260/A280) ratio, a measure of nucleic acid purity. A ratio between 1.8 and
2.0 is acceptable.
N. DNA Sequencing
All DNA sequencing was performed by the DNA Sequencing Facility
operated by the Center for Biosystem Research, University of Maryland
Biotechnology Institute, College Park, MD. DNA samples were prepared according
to the instructions from facility and M13 Forward and Reverse primers were used
for all sequencing.
O. Sequence Analysis
Sequence similarity searches were performed using BLAST in the NIH
website (http://www.ncbi.nlm.nih.gov/BLAST) (Altschul et al., 1990). Clustal W
alignments were performed using Lasergene® (DNASTAR Inc.) or GeneDoc 2.6.02
from GeneDoc HomePage (http://www.psc.edu/biomed/genedoc/). Restriction site

32
analysis used NEBcutter V2.0 from the website of New England Biolabs, Inc.
(http://tools.neb.com/NEBcutter2/index.php).
III. Experimentation
A. Construction of PtFD1 RNAi and Overexpression (OE) Vectors
For the functional characterization of function of PtFD1 during poplar apical
bud formation and dormancy, transgenic poplars that either overexpress PtFD1 or
transgenic poplars with reduced or silence PtFD1 using RNAi were created. DNA
sequences were first cloned into the entry vector, pENTR/D-TOPO®. After cloning
into the entry vector, DNA of interest was transferred to the binary T-DNA binary
vectors pB7GWIWG2 (II) for RNAi and pB7WG2 for overexpression.
PtFD1 DNA used for chimeric gene construction was produced by PCR using
4w PCR2-14 PTBF1, a PCR product that contains the full length of PtFD1 cDNA
sequence. The primers are listed below:
Table 4. Primers for PCR of 4w PCR2-14 PTBF1
Direction Primer Name Primer Sequence
Forward PTBF1-ATG (CACC)1 ATG TGG TCA TCG CCA GGA GCA
Reverse PTBF1+TGA TCA AAA TGG AGC TGT TGA GGT TCT ATA
GAG
Reverse PTBF1-Rev51 GCC AGA GAC ATC ACC GTT TTC TTG AG 1 (CACC) were added to the 5’ end of the primer for directional cloning of the
PCR product to the pENTR-TOPO® vector.
PCR reactions were carried out using 200ng of template DNA, 1µM of each
primer, 1Xreaction Buffer, 2mM MgCl2, 0.2mM/each dNTPs, and 0.25 unit Takara

33
ExTaq DNA polymerase. PCR amplification with PTBF1-ATG and PTBF1+TGA
primer set produced the coding region of PtFD1 (+TGA) while PTBF1-ATG and
PTBF1-Rev51 primer combination gave a PtFD1 fragment that terminates prior to
the bZIP basic region (Rev51). PCR products (+TGA and Rev51) were separated
on a 1% agarose gel. Bands of interest were excised and purified using Concert™
Rapid Gel Extraction System kit (Gibco BRL). Purified fragments were cloned into
the pENTR/D-TOPO entry vector (Invitrogen, MD). Competent E. coli (TOP 10)
cells were transformed with the entry vector and transformed bacteria selected by
their resistance to kanamycin (50µg/ml) on solidified LB agar medium. Plasmid
DNA from kanamycin resistant colonies was extracted, digested with restriction
enzymes (AscI and NotI ) and visualized in agarose gels. Plasmids that produced the
desired restriction patterns were sequenced. After confirmation of the DNA
sequence, it was transferred to the appropriate Gateway™ binary vector by in vitro
recombination (Invitrogen) (Karimi et al., 2002).
Construction of PtFD1 RNAi Chimeric Gene
PtFD1 inserts in pENTR/D-TOPO clones, +TGA and Rev51 were transferred
to the destination binary vector pB7GWIWG2 (II) using the Gateway™ LR
Recombination Reaction (Invitrogen, MD). When transcribed, this construct will
produce a double-stranded RNA (hairpin RNA) from the inserted sequence of
PTFD1, which then triggers post-transcriptional gene silencing. Competent E. coli
(TOP 10) cells were transferred with RNAi expression vectors and selected by
resistance to spectinomycin (50µg/ml) and chloramphenicol (50µg/ml).

34
Construction of PtFD1 Overexpression Chimeric Gene
PtFD1 DNA sequences in pENTR/D-TOPO clones, +TGA, were transferred
to the destination binary vector pB7WG2 using Gateway™ LR Recombination
Reaction (Invitrogen, MD). This results in a chimeric gene where the full length
PtFD1 cDNA was inserted downstream of the CaMV 35S promoter. The vector
pB7WG2::+TGA was transformed into competent E. coli (TOP 10) cells and grown
on LB agar plates containing spectinomycin (50µg/ml).
Spectinomycin-resistant colonies were selected and cultured in 5ml LB broth
supplemented with appropriate antibiotics overnight at 37 °C. Plasmids DNA were
purified and digested with restriction enzymes (RNAi/+TGA and RNAi/Rev51
vectors: EcoRI; Overexpression/+TGA: SpeI ans XbaI) and visualized in agarose
gel to confirm the recombination.
B. Generation of A. tumefaciens with T-DNAs
After the PtFD1 RNAi [pB7GWIWG2 (II)::+TGA, pB7GWIWG2 (II)::Rev51]
and overexpression [pB7WG2::+TGA] vectors were verified, bacteria stocks were
made by mixing 850µl of the cell suspension and 150µl sterile glycerol and directly
frozen in liquid nitrogen. The bacteria stocks were stored in -80 °C.
To transfer the binary T-DNA plasmids to Agrobacterium, TOP10 cells
transformed with the binary T-DNA plasmids were grown on LB agar plates
supplemented with the antibiotics including spectinomycin (50µg/ml),
chloramphenicol (50µg/ml) for RNAi or spectinomycin (50µg/ml) for
overexpression. Single colonies were selected and cultured in 5ml LB broth with
35
the same antibiotics overnight at 37 °C. After overnight incubation, plasmids DNAs
were extracted and quantified. The Agrobacterium strain used in this experiment is
C58/pMP90. Approximately 1µg of plasmid DNAs were transformed to
C58/pMP90 competent cells via the freeze-thaw method. C58/pMP90 cells
transformed with the PtFD1 RNAi vectors [pB7GWIWG2 (II)::+TGA,
pB7GWIWG2 (II)::Rev51] were selected on LB agar plates supplemented with
gentamicin (20µg/ml), spectinomycin (50µg/ml) and chloramphenicol (50µg/ml)
while cells transformed with PtFD1 overexpression vectors [pB7WG2::+TGA]
were selected using gentamicin (20µg/ml) and spectinomycin (50µg/ml). The
plates were incubated at room temperature in darkness.
Single colonies were selected from the plates and cultured overnight at 28°C in
5ml LB broth supplemented with antibiotics including gentamicin (20µg/ml),
spectinomycin (50µg/ml), chloramphenicol (50µg/ml) for RNAi and gentamicin
(20µg/ml), spectinomycin (50µg/ml) for overexpression. Purified plasmids DNA
were digested with restriction enzymes (RNAi/+TGA and RNAi/Rev51 vectors:
EcoRI; Overexpression/+TGA: SpeI ans XbaI) and analyzed by agarose gel
electrophoresis to confirm the presence and organization of the vectors.
C. Propagation of Transgenic Poplars
The protocols used to generate transgenic poplars were adopted from Leple et
al. 1992. Agrobacterium mediated transformation of poplar (Populus alba ×
Populus tremula) clone 717-1B4 was performed by co-cultivating sterile explants
with A. tumefaciens containing the RNAi or overexpression binary vectors.
36
Explants used for transformation consisted of stems and petiole sections
approximately 8mm in length with the stems split longitudinally. The explants were
first preconditioned on M1 medium for 48 hours before co-cultivation. After
co-cultivation, the explants were de-contaminated and cultured on M2 medium
with carbenicillin (500mg/L) and cefotaxime (250mg/L). The explants were
transferred to M3 medium for regeneration after 2 weeks of culture on M2.
Regenerated shoots were excised from calli when they were approximately 1cm in
length and transferred to M1/2 medium for rooting (Leple et al., 1992). The
regenerated shoots were sub-cultured on M1/2 medium.
BASTA was added to the medium M3 and M1/2 at 5mg/L to select
transformed cells. Both the pB7GWIWG2 (II) T-DNA and the pB7WG2 T-DNA
contain a Bar gene that confers resistance to glufosinate ammonium (Karimi et al.,
2002). Therefore, cells that were not transformed with the Bar gene were killed by
the herbicide and failed to grow.
D. RT-PCR of PtFD1
To determine the expression of PtFD1 in shoot tips or apical buds at different
development stages, buds or shoot tips were collected from both the transgenic and
control plants that were grown in either LD or after 3, 6, 8, 12 weeks of SD
treatment for RT-PCR. PtFD1 specific primers (ATG and Rev51) were used to
detect PtFD1 mRNA. Total RNA was extracted, precipitated and quantified. The
RNAs were first treated with DNase to remove the DNAs that might occur in the
samples. First strand cDNAs were synthesized from 0.4µg of total RNA using the

37
ImProm-II™ Reverse Transcription System kit (Promega). PCR amplification was
performed using Takara Extaq polymerase (Takara Biomedicals, Japan). PCR
products were separated and visualized by agarose gel electrophoresis. The primers
used for PCR amplification are listed below:
Table 5. PtFD1 specific primers for PCR amplification
Direction Primer Name Primer Sequence Forward ATG ATG TGG TCA TCG CCA GGA GCA Reverse Rev51 GCC AGA GAC ATC ACC CTT TTC TTG AG
Total RNA from leaves of the 717-1B4 and two overexpression transgenic
lines (OE2-1; OE2-3) treated with LD or after 8 weeks of SD treatment were also
analyzed by RT-PCR. In addition, flowers produced in two of the overexpression
lines were also collected and used for RT-PCR experiments with PtFD1 specific
primers to detect PtFD1 expression.
E. Histological Analysis of Apical Buds
For PtFD1 RNAi plants, shoot tips were collected every five days after the
photoperiod was changed to SD up to 25 days. For PtFD1 overexpression plants,
shoot tips or apical buds were collected after 3, 6 or 8 weeks of SD treatment.
Corresponding shoot tips were also collected from control 717-1B4 poplars for
comparison.
The collected tissues were fixed immediately in fresh FAA [50% EtOH, 5%
glacial acetic acid, 10% formaldehyde, 35% water (v/v)]. Vacuum infiltrated for 2
hours. Fixed tissues were dehydrated and infiltrated according to Table 6.
38
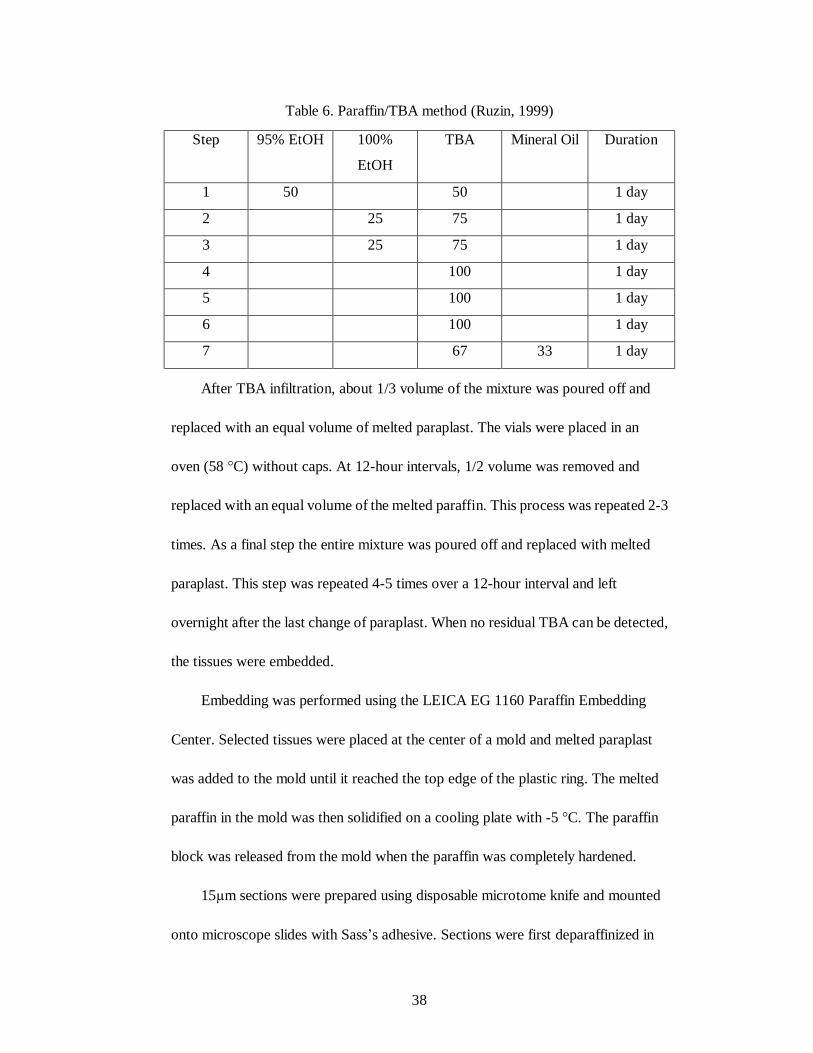
Table 6. Paraffin/TBA method (Ruzin, 1999)
Step 95% EtOH 100%
EtOH
TBA Mineral Oil Duration
1 50 50 1 day
2 25 75 1 day
3 25 75 1 day
4 100 1 day
5 100 1 day
6 100 1 day
7 67 33 1 day
After TBA infiltration, about 1/3 volume of the mixture was poured off and
replaced with an equal volume of melted paraplast. The vials were placed in an
oven (58 °C) without caps. At 12-hour intervals, 1/2 volume was removed and
replaced with an equal volume of the melted paraffin. This process was repeated 2-3
times. As a final step the entire mixture was poured off and replaced with melted
paraplast. This step was repeated 4-5 times over a 12-hour interval and left
overnight after the last change of paraplast. When no residual TBA can be detected,
the tissues were embedded.
Embedding was performed using the LEICA EG 1160 Paraffin Embedding
Center. Selected tissues were placed at the center of a mold and melted paraplast
was added to the mold until it reached the top edge of the plastic ring. The melted
paraffin in the mold was then solidified on a cooling plate with -5 °C. The paraffin
block was released from the mold when the paraffin was completely hardened.
15µm sections were prepared using disposable microtome knife and mounted
onto microscope slides with Sass’s adhesive. Sections were first deparaffinized in

39
xylene followed by hydration in a graded EtOH series and water (Ruzin, 1999). The
sections were stained in Safranin O (1% w/v in water) for 1 min, destained with
water and then dehydrated in a graded EtOH series to 95% EtOH, followed with
staining in Fast Green FCF (0.1% w/v in 95% EtOH) for 2 min and destained in
100% EtOH, 2 times at 2 minutes each time (Table 7).
Sections were cleared with 1:1 xylene and methyl salicylate for 5 sec, then
dipped 2 times in 100% xylene. Coverslides were mounted with Permount®.
Table 7. Staining processes for the slides
Step Name Procedure
10min in 100% Xylene (2 times) 1 Deparaffinization
15min in acetone
2min in 100% EtOH (3 times)
1min in 95% EtOH
1min in 85% EtOH
1min in 70% EtOH
1min in 50% EtOH
1min in 30% EtOH
2 Hydration
2min in H2O
3 Staining 1min in Safranin O (1% w/v in H2O)
4 Destaining 3-4 times in H2O till the water is clear
5 Dehydration 2min in 30% EtOH
2min in 50% EtOH
2min in 70% EtOH
2min in 85% EtOH
2min in 95% EtOH
6 Staining 2min in Fast Green FCF (0.1% w/v in 95% EtOH)
7 Destaining 2min in 100% EtOH (2 times)
40
Results
I. Construction of Transgenic Vectors
A. PCR Amplification of PtFD1 Fragments
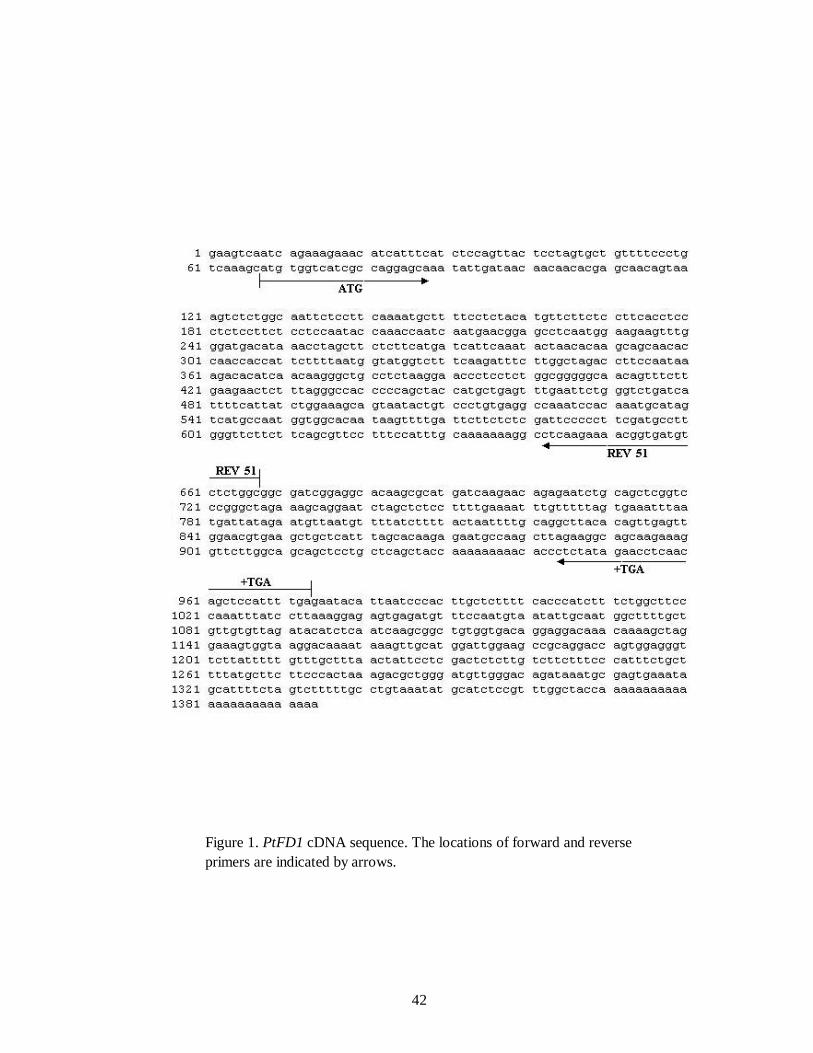
Two sets of primers (Figure 1) were used to amplify PtFD1 fragments by
using a full length PtFD1 cDNA (4w PCR2-14 PTBF1) as the PCR template. PCR
amplification with PTBF1-ATG and PTBF1+TGA primer set produced an 820bp
DNA fragment consisting of the coding region of PtFD1 while PTBF1-ATG and
PTBF1-Rev51 primer combination results in a 600bp PtFD1 fragment consisting of
the 5’ region of the cDNA that terminates prior to the bZIP basic region. The PCR
products were analyzed on a 1% agarose gel. Figure 2 shows the results of the PCR
amplification and two bands approximately 820bp and 600bp are detected. After
gel electrophoresis, the 820bp and 600bp bands were cut from the gel and purified.
To further verify that the correct fragments were amplified, the purified fragments
were digested with endonuclease restriction enzymes. For the 820bp product,
EcoRI digestion was expected to produce 2 bands approximately 400bp while StuI
gives 2 bands of 580bp and 240bp. For the 600bp product, EcoRI digestion was
expected to produce 2 bands of 400bp and 200bp while NsiI gives 2 bands of 470bp
and 130bp. The PCR products were digested with these enzymes and separated by
agarose gel electrophoresis. The gel image showed bands of these predicted size

41
(data not shown), confirming that the PCR products were consistent with the PtFD1
cDNA sequence.
42
Figure 1. PtFD1 cDNA sequence. The locations of forward and reverse primers are indicated by arrows.

43
Figure 2. PCR of 4wk PCR 2-14 PTBF1. Primer combinations are as following: lane +TGA, PTBF1-ATG and PTBF1+TGA; lane Rev51, PTBF1-ATG and PTBF1-Rev51. PCR products were resolved through a 1% agarose gel containing ethidium bromide..
44
B. Cloning of PCR Products into pENTR/D-TOPO Vector
The purified PCR products (+TGA and Rev51) were cloned into
pENTR/D-TOPO vector, transformed into competent E. coli (TOP 10) cells and
grown overnight on LB plates containing 50µg/ml kanamycin. Individual colonies
from the plates were picked and grown in LB broth containing kanamycin overnight
at 37°C. Plasmid DNA was extracted from bacteria culture, digested with AscI and
NotI and separated through a 1% agarose gel. For the +TGA clone, digestion with
AscI and NotI should produce two bands of approximately 2580bp and 840bp. Two
of the seven colonies tested showed the predicted bands. For the Rev51 clone,
digestion with AscI and NotI should result in two bands of 2580bp and 620bp. Of all
the 16 colonies tested, 3 of them showed the predicted bands (data not shown).
Plasmids containing the predicted bands were sequenced to verify the sequences of
the cloned PCR products.
The sequences of the PCR clones were aligned to the PtFD1 cDNA sequence
and proved to be identical. Two clones (+TGA1 and Rev51-2) were selected for use
in the LR recombination reaction for producing the binary T-DNA vectors.
C. Transfer of the PtFD1 Fragments to the Binary Vectors
The PtFD1 fragments (+TGA1 and Rev51-2) cloned into the
pENTR/D-TOPO vector were transferred to the RNAi and Overexpression binary
vectors to generate 3 chimeric genes. These include two RNAi clones
(pB7GWIWG2(II)::+TGA) and (pB7GWIWG2(II)::Rev51) and one

45
overexpression clone (pB7WG2::+TGA). Transfer to the pB7GWIWG2(II) and
pB7WG2 binary vectors was accomplished using the GATEWAY™ LR
recombination reaction. The entry vector pENTR/D-TOPO contains attL sites
(attL1 and attL2) that will recombine with the attR sites (attR1 and attR2) in the
destination binary vector resulting in the transfer of the cloned PtFD1 fragments in
the entry vector to the destination vector. The recombination reaction used the LR
Clonase™ enzyme mix. Topoisomerase I was added to relax the DNA of the
destination vector and increase the efficiency of the LR reaction (GATEWAY™
Technology Instruction Manual, Invitrogen). The binary vectors were transferred to
E. coli competent cells (TOP10) and grown overnight on LB agar plates
supplemented with spectinomycin and chloramphenicol for RNAi and only
spectinomycin for overexpression. After overnight culture at 37°C, colonies were
picked from the plates and cultured overnight with shaking in 5ml of LB broth
containing the appropriate antibiotics. Plasmid DNA was extracted from the
cultured bacteria cells, digested with restriction enzymes and separated through 1%
agarose gel electrophesis containing ethidium bromide. Table 8 listed the restriction
enzymes used to analyze the purified plasmids.
Table 8. Restriction enzymes and predicted digestion production of PtFD1 binary plasmids
pB7GWIWG2 (II)::Rev51
RNAi
pB7GWIWG2 (II)::+TGA
RNAi
pB7WG2::+TGA overexpression
EcoRI 880bp, 1.2kb, 10.2kb 10.8kb, 1.4kb, 1.2kb
SpeI + XbaI 1.3kb, 8.9kb

46
As shown in Figures 3 and 4, clones digested with the respective restriction
enzymes produced predicted bands, confirming that the PtFD1 fragments had been
transferred to the T-DNA binary vector.

47
Figure 3. Digestion of the RNAi vector pB7GWIWG2 (II)::Rev51 with EcoRI. Lanes 1 to 4 contains pB7GWIWG2 (II)::Rev51 plasmid DNA extracted from 4 different colonies. Lane Ø is a control pB7GWIWG2 (II) vector without an insert. The digestion reaction was carried out at 37 °C for 1 hour and resolved through a 1% agarose gel contains ethidium bromide. 1kb DNA plus ladder was used as a size marker.

48
Figure 4. Digestion of RNAi vector pB7GWIWG2 (II)::+TGA and overexpression vector pB7WG2::+TGA. Lanes 1 to 4 (left side) are four independent colonies containing pB7WIWG2(II)::+TGA digested with EcoRI. Lane Ø is the pB7WIWG2(II) vector without an insert. Lanes 1 to 4 (right side) are four independent colonies containing pB7WG2::+TGA digested with SpeI and XbaI.

49
D. Transfer of the Binary Vectors to A. tumefaciens
Approximately 1µg of the binary RNAi and overexpression plasmids were
individually transferred to A. tumefaciens competent cells (C58/pMP90) using the
freeze-thaw method. Transformed A. tumefaciens RNAi [pB7GWIWG (II)::+TGA,
pB7GWIWG (II)::Rev51] cells were selected on LB plates supplemented with
gentamicin, spectinomycin, chloramphenicol and LB plates with gentamicin and
spectinomycin for overexpression [pB7WG2::+TGA]. The plates were incubated at
room temperature in darkness. After 3-4 days transformed colonies were visible.
After 4 days of growth, colonies transformed with pB7GWIWG (II)::+TGA,
pB7GWIWG (II)::Rev51 and pB7WG2::+TGA were picked and cultured overnight
in 5ml LB broth supplemented with corresponding antibiotics. Plasmids was
extracted, digested by restriction enzymes digestion as previously described and
separated through a 1% agarose gel containing ethidium bromide. Figure 5 shows
that the predicted bands (Table 8) for all of the plasmids were detected.
Agrobacteria with RNAi and overexpression binary T-DNA were then used for
poplar transformation.

50
Figure 5. Digestion of T-DNA binary plasmids extracted from A. tumefaciens. RNAi/Rev51 and RNAi/+TGA were digested with EcoRI. OE/+TGA was digested with SpeI and XbaI. 1kb plus DNA ladder was used as the marker.

51
II. Propagation of Transgenic Poplars
The hybrid poplar clone 717-1B4 (Populus tremula X P. alba) was used for
the transgenic studies because of its efficiency in adventitious shoot regeneration.
Shoot cultures of the clone were cultured in vitro on M1/2 MS medium. Sterile
explants (stems and petioles) were dissected from the 717-1B4 shoot cultures.
Regenerated transgenic shoots were cultured in M1/2 MS medium supplemented
with 5mg/L BASTA while non-transgenic 717-1B4 seedlings were grown in M1/2
MS medium without BASTA.
Of the 160 explants transformed with pB7WG::+TGA (OE/+TGA) chimeric
gene, 12 explants regenerated shoots. Among 200 explants transformed with
pB7WIWG2 (II)::+TGA (RNAi/+TGA), 6 explants regenerated shoots. After
repeated selection on BASTA, 4 individual lines of each of the transgenic types
(OE/+TGA and RNAi/+TGA) were obtained. No RNAi/Rev51 plants were
obtained from the 200 explants transformed with pB7WIWG2(II)::Rev51
(RNAi/Rev51). Plantlets from individual transgenic lines were transferred to fresh
M1/2 medium with BASTA in a certain time interval, usually 1-2 months. Cuttings
were made to propagate more plantlets. It can be noticed that the plantlets of
OE/+TGA had a thicker stem, a smaller leaf and not as green as RNAi/+TGA and
the control.

52
III. Morphological Characteristics of the Transgenic Poplars
When enough plants were generated by tissue culture, seedlings with 5-6cm
stems, 4-6 leaves and complete roots from several transgenic lines and the control
were transferred to soil pots and grown in plant growth chambers (30 plantlets /each
line).
After 2-3 weeks of growth in LDs, morphological differences between PtFD1
overexpressing and control plants were observed. PtFD1 overexpression plants
failed to grow with an upright habit and instead the stems grow with a prostrate
habit (Figure 6). This growth habit was observed in all of the PtFD1 overexpressing
lines. In addition to the change in growth habit, the leaves of PtFD1 overexpressing
plants were smaller and coiled upward compared to non-transgenic control plants.
There were no significant morphological differences between the RNAi/+TGA and
the control plants.

53
Figure 6. PtFD1 transgenic plants (Overexpression and RNAi) and control (717-1B4) plants in growth chamber (A) and greenhouse (B).

54
After 5-6 weeks of growth in LD, plants were transferred to SD. For control
717-1B4 poplars, apical bud morphogenesis began after 3 weeks of SD treatment.
Compared to control plants, apical bud development appeared to be accelerated for
the PtFD1 RNAi expressing plants but the difference was not significant. Although
both control and PtFD1 RNAi plants developed apical buds at similar rate after 56
days of SD, the apical buds of the PtFD1 RNAi expressing poplar were visibly
smaller in size. In contrast to PtFD1 RNAi expressing plant and control plants,
poplars overexpressing PtFD1 failed to form apical buds when treated with SD even
after 8 weeks. Because the shoot apices failed to develop apical buds, shoot growth
continued in SD (Figure 7). It was also noticeable that the shoot elongation of
PtFD1 overexpression plants was slower both in tissue culture and in growth
chambers. After 8 weeks of SD treatment, the plants were transferred to SD plus LT.
Leaf abscission occurred for both control and PtFD1 RNAi expressing plants while
leaf abscission for PtFD1 overexpressing plants failed to occur.
In addition, flowers were induced in both tissue cultured plantlets and
greenhouse grown plants of all PtFD1 overexpressing lines (Figure 8). Wild type
poplars usually do not form flower buds during the first several years of their life
cycle (Hsu et al., 2006).

55
Figure 7. Shoot apices of 717-1B4 and PtFD1 overexpression plants in LD or after 8 weeks of SD treatment.

56
Figure 8. Flower buds on PtFD1 overexpression plantlets. The plantlets are from (A) tissue culture in continuous light and (B) a one month old green house grown plant in LD treatment.

57
IV. RT-PCR of PtFD1 in Transgenic Poplars
Two RNAi lines (RNAi 1-2, RNAi 1-6), two overexpression lines (OE 2-1,
OE 2-3) and control 717-1B4 were transferred from tissue culture to growth
chambers and treated with SD after LD. Plants were treated for 8weeks in SD at 18
ºC and an additional 4weeks in SD with 10 ºC in the day and 4 ºC at night.
A. PtFD1 Expression in Shoot Tips and Apical Buds
Shoot tips or apical buds were collected from LD and after 3, 6, 12 weeks of
SD treatment. RNA was extracted and used for RT-PCR with PtFD1 gene specific
primers. As shown in Figure 9, PtFD1 mRNA was not detected in control plants in
LD and after 3 weeks of SD treatment, but was detected after 6 weeks of SD
treatment and with continued SD (8 weeks of SD followed by 4 weeks of SD+LT)
treatment, PtFD1 mRNA abundance decrease to undetectable levels. This
expression is consistent with that previously observed (Gnewikow, 2001). For the
two RNAi lines, PtFD1 mRNA levels were similar to that observed in control plants.
PtFD1 mRNA was detected in all treatments for the PtFD1 overexpression lines.

58
Figure 9. RT-PCR of PtFD1. RNA was extracted from shoot tips or apical buds of control 717-1B4 (Ø), overexpression (OE) and RNAi plants under LD or after 3 weeks (A), 6 and 12 weeks (B) of SD treatment. Primers PTBF1-ATG and PTBF1-Rev51 were used for PCR amplification. RT-PCR of UBIQ is shown as an equal loading control.
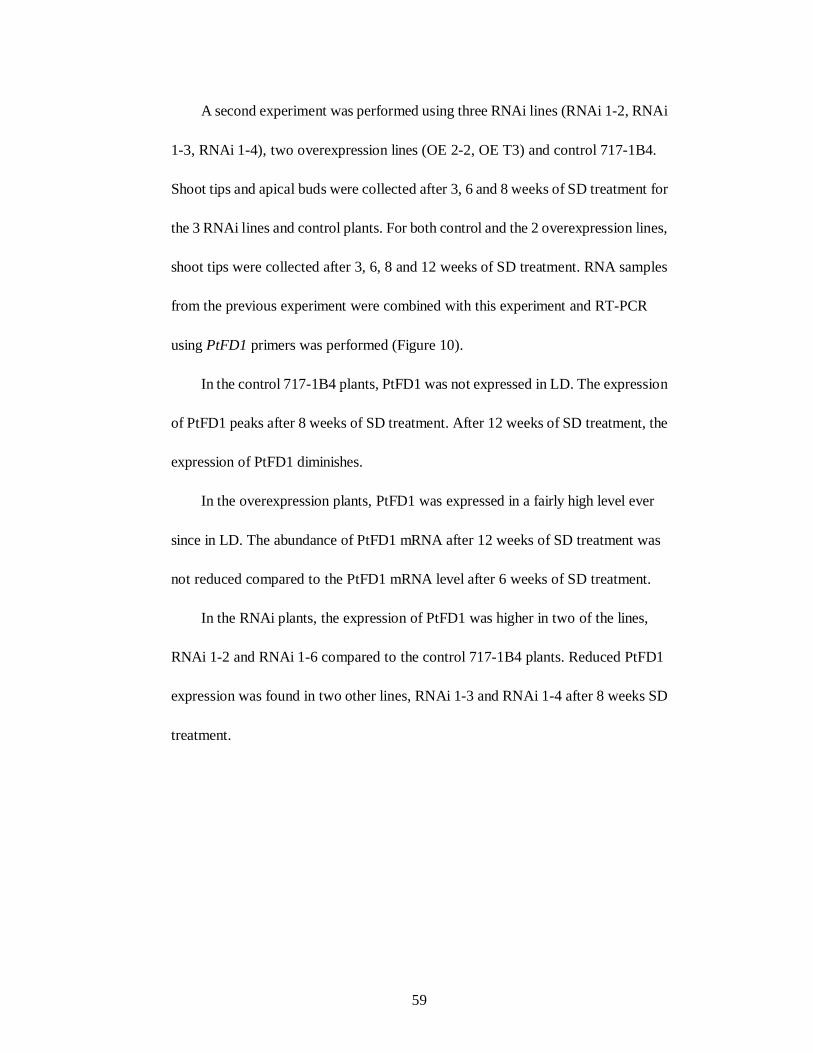
59
A second experiment was performed using three RNAi lines (RNAi 1-2, RNAi
1-3, RNAi 1-4), two overexpression lines (OE 2-2, OE T3) and control 717-1B4.
Shoot tips and apical buds were collected after 3, 6 and 8 weeks of SD treatment for
the 3 RNAi lines and control plants. For both control and the 2 overexpression lines,
shoot tips were collected after 3, 6, 8 and 12 weeks of SD treatment. RNA samples
from the previous experiment were combined with this experiment and RT-PCR
using PtFD1 primers was performed (Figure 10).
In the control 717-1B4 plants, PtFD1 was not expressed in LD. The expression
of PtFD1 peaks after 8 weeks of SD treatment. After 12 weeks of SD treatment, the
expression of PtFD1 diminishes.
In the overexpression plants, PtFD1 was expressed in a fairly high level ever
since in LD. The abundance of PtFD1 mRNA after 12 weeks of SD treatment was
not reduced compared to the PtFD1 mRNA level after 6 weeks of SD treatment.
In the RNAi plants, the expression of PtFD1 was higher in two of the lines,
RNAi 1-2 and RNAi 1-6 compared to the control 717-1B4 plants. Reduced PtFD1
expression was found in two other lines, RNAi 1-3 and RNAi 1-4 after 8 weeks SD
treatment.

60
Figure 10. RT-PCR of PtFD1. RNA was extracted from shoot tips or apical buds of control 717-1B4 (Ø), overexpression (OE) and RNAi plants under LD or after 3, 6, 8 and 12 weeks of SD treatment. Primers PTBF1-ATG and PTBF1-Rev51 were used for PCR amplification. RT-PCR of UBIQ is shown as an equal loading control.

61
B. PtFD1 Expression in other Tissues
RT-PCR was also performed on RNA extracted from the leaves of control and
2 overexpression lines (OE 2-1, OE2-3) growing in LD or after 8 weeks of SD
treatment. In addition, RNA from flower that developed on the overexpression lines
was also analyzed. Primers ptbf1+ATG and ptbf1-Rev51 were used for PT-PCR of
the RNA samples. Figure 11 shows that PtFD1 mRNA was not detected in the
leaves of control plants in LD or after 8 weeks of SD treatment. This is consistent
with earlier reports of PtFD1 mRNA expression (Gnewikow, 2001). PtFD1 mRNA
was detected in the leaves of both overexpression lines in LD and after 8 weeks of
SD treatment. Besides, PtFD1 mRNA was also detected in the flower buds of
overexpression plants.

62
Figure 11. RT-PCR of PtFD1. RNA was either extracted from leaves of control 717-1B4 (Ø), overexpression (OE) and RNAi plants under LD or after 8 weeks of SD treatment or from flower buds of overexpression seedlings in tissue culture. Primers PTBF1-ATG and PTBF1-Rev51 were used for PCR amplification. RT-PCR of UBIQ is shown as an equal loading control.

63
V. Histological Analysis of Transgenic Shoot Tips or Apical Buds
For RNAi plants, shoot tips and apical buds were collected at 5-day intervals
after being transferred to SD for 25 days. For overexpression plants, shoot tips were
collected after 3, 6, 8 and 12 weeks of SD treatment. The tissues were fixed,
dehydrated, infiltrated, embedded and sectioned. Tissue sections were stained with
Safranin O and Fast Green FCF. Safranin O stains lignin, cutin, suberin, chitin,
chromosomes and nucleoli while Fast Green FCF was used as a counterstain to
reveal tissues that were not labeled by Safranin O (Ruzin, 1999).
SD induced apical bud formation was shown to be accelerated in PtFD1 RNAi
plants (Figure 12A). After 15 days of SD treatment, obvious bud scale formation
was observed in PtFD1 RNAi plants compared to control plants. Buds collected
from PtFD1 RNAi plants after 56 days of SD treatment were more compact and
smaller compared to the control plants.
Noteworthy differences occur between the PtFD1 overexpression and control
plants. Bud scales fail to develop after 8 weeks of SD treatment in PtFD1
overexpression plants (Figure 12B).

64
Figure 12.Anatomy of control and transgenic shoot tips or apical buds. (LV=leaves, ST=stipules, BS=bud scales)

65
Discussion
I. Origin of the Study of PtFD1
PtFD1 was first isolated in our lab from the hybrid poplar clone 545-4183
(Populus deltoids X Populus trichocarpa) during attempts to isolate ABI3 from
apical buds (Gnewikow, 2001). Instead of amplifying ABI3 cDNA, a putative bZIP
transcription factor was obtained. It was shown to be related to plant bZIP proteins
and was named PTBF1 (Poplar Terminal Bud Factor-1) (Gnewikow, 2001).
Because of the potential role of signaling and gene activation, PTBF1 was selected
for further study (Schwechheimer et al., 1998).
Sequence analysis shows that this bZIP protein is related closely to two
members of the group A Arabidopsis bZIP transcription factors, AtbZIP14 and
AtbZIP27 (Figure 13). Further alignments revealed PTBF1 a homologue of
AtbZIP14 (Figure 14), which was recently identified as FD in Arabidopsis (Abe et
al., 2005). So PTBF1 was re-named as PtFD1 for consistency.
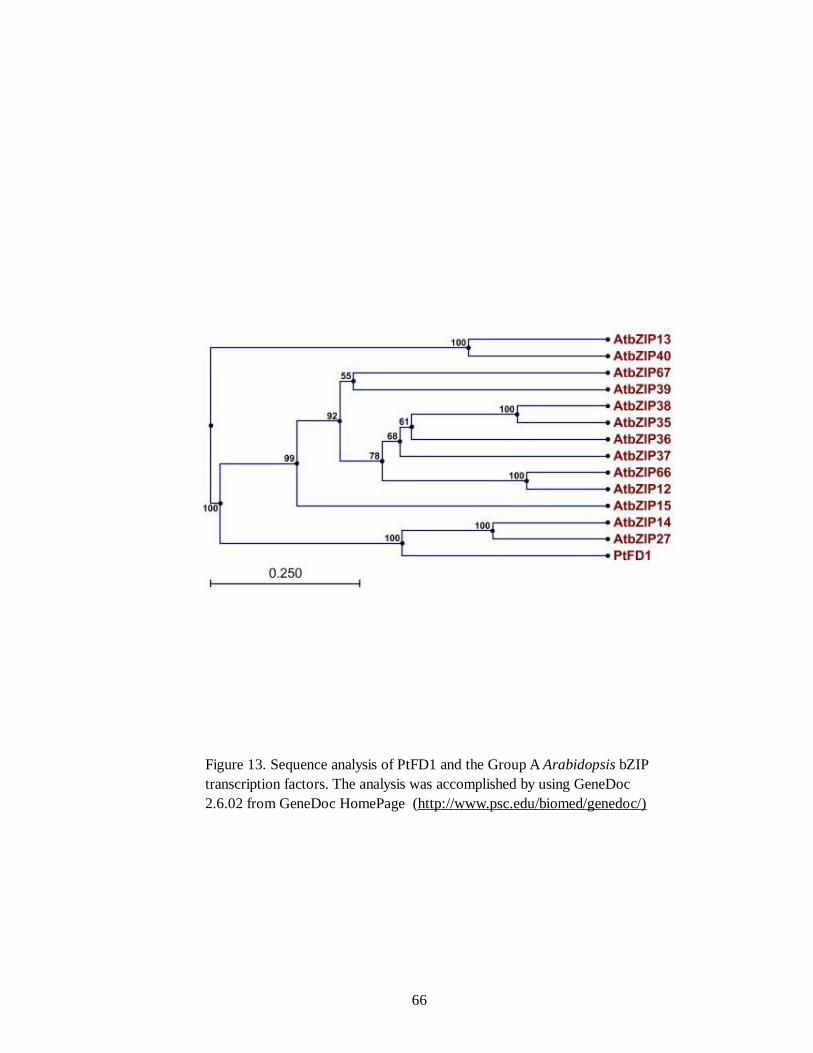
66
Figure 13. Sequence analysis of PtFD1 and the Group A Arabidopsis bZIP transcription factors. The analysis was accomplished by using GeneDoc 2.6.02 from GeneDoc HomePage (http://www.psc.edu/biomed/genedoc/)

67
Figure 14. ClustalW alignment of PtFD1, AtbZIP14 and AtbZIP27 sequences. The alignment was accomplished by using GeneDoc 2.6.02 from GeneDoc HomePage (http://www.psc.edu/biomed/genedoc/). Residues on black, dark gray, and light gray backgrounds indicate 100%, 80%, and 60% amino acid similarity, respectively.

68
II. Sequence Analysis of PtFD1
PtFD1 is composed of 272 amino acids with a predicted molecular weight of
29.5 kDa (Figure 15). It contains a basic domain common to bZIP transcription
factors. Located in the N-terminus of PtFD1 is a proline rich region from amino
acids 35-45, which may function as a transactivation domain.
Among bZIP proteins, the most conserved sequence is the DNA-binding basic
region. It contains several residues that almost locate at the same relative positions
among different bZIP proteins. The conserved residues form a consensus sequence
of (-18) N XXX A A X X(C/S) R (-10) in which the negative number is labeled
according to the +1 leucine (Hurst, 1996). Two amino acids are conserved in most
bZIP proteins, the asparagine (N) at position 211 (of the PtFD1) and the arginine (R)
at position 219. Two other amino acids, serine (S) at position 214 (of the PtFD1)
and alanine (A) at position 215 are also found in most most of the known bZIP
proteins.
The leucine zipper domain of PtFD1 contains three heptad leucine repeats with
the leucines locate at position 229, 236 and 243. Three heptad is thought to be the
minimum number of heptad leucine repeats that can form a zipper although the
heptad repeats can be as many as seven (Landschultz et al., 1988).
bZIP proteins can form both homodimers and heterodimers. Forming dimers
with different bZIP proteins may change protein conformation and DNA binding
affinity, which would allow a combinatorial level of signaling (Alberts et al., 1994).

69
Figure 15. Amino acid sequence of PtFD1 bZIP protein. Regions showing significant homology to conserved motifs are underlined and labeled. The asterisks below the leucine residues indicate the presence of leucine repeats every 7 residues.

70
III. Characterization of PtFD1
A. Involvement of PtFD1 in Bud Formation and Development
The expression of PtFD1 is induced by SD photoperiod and is coincident with
apical bud formation. Prior research showed that PtFD1 mRNA levels are at their
highest in apical buds when plants were exposed to SD and at their lowest when
plants were exposed to SD-NB (Gnewikow, 2001). This expression pattern is
similar in both apical and auxillary buds. Similar results of photoperiod regulation
were observed for poplar genotypes of both 717-1B4 and 545-4183. PtFD1
expression coincides with bud formation and maturation, suggesting an
involvement of PtFD1 in these processes. To test the role of PtFD1 in bud
development, PtFD1 expression was altered in transgenic poplars and any
alterations in bud formation and maturation were observed.
Bud formation is characterized by the presence of bud scales. In poplar, bud
scales develop from leaf-subtending stipules that enlarge to enclose the leaf
primordia (Goffinet and Larson, 1981 & 1982). Bud formation usually occurs after
about 6 weeks of SD treatment, which is also when PtFD1 expression is at its
highest level, after which PtFD1 mRNA levels decline. It has been proposed that
PtFD1 may somehow influence bud scale growth (Gnewikow, 2001). In transgenic
poplars that overexpress PtFD1, apical bud development was inhibited even after a
considerable length of SD treatment. Anatomic studies showed overexpression of
PtFD1 impinged on the formation of bud scales (Figure 12). Besides, poplar

71
homologue of ABI3, PtABI3 also impinges on apical bud formation. Overexpession
of PtABI3 promoted the growth and differentiation of embryonic leaves while
suppressing the development of bud scales (Rohde et al., 2002). This is similar to
the effect of PtFD1 overexpression. This raises the possibility that PtABI3 and
PtFD1 may interact in this process.
For the RNAi transgenic plants, bud formation and development was similar to
that of the control plants. According to the RT-PCR results, the PtFD1 levels in the
RNAi lines (RNAi1-2 and RNAi 1-6) were not significantly reduced compared to
the controls. Among available RNAi transgenic lines, RNAi 1-3 and RNAi 1-4
showed reduced PtFD1 expression than RNAi 1-2 and RNAi 1-6. Regenerating
plants with RNAi chimeric genes was not efficient compared to PtFD1
overexpressing construct, which could indicate the PtFD1 is required for shoot
regeneration. Obtaining strong PtFD1 RNAi lines will probably require an
inducible promoter. This may be why the RNAi transgenic lines in this experiment
did not show significant differences to the wild type plants in bud formation.
B. Involvement of PtFD1 in Flowering
In the annual plant Arabidopsis, flowering is regulated through four major
genetic pathways that mediate responses to either environmental or endogenous
signals (reviewed by Parcy, 2005). These genetic pathways converge on the
activation of a set of floral pathway integrators including LEAFY (LFY),
FLOWERING LOCUS T (FT) and SUPPRESSOR OF CO OVEREXPRESSION
(SOC1). These integrators convert multiple input signals to regulate floral meristem
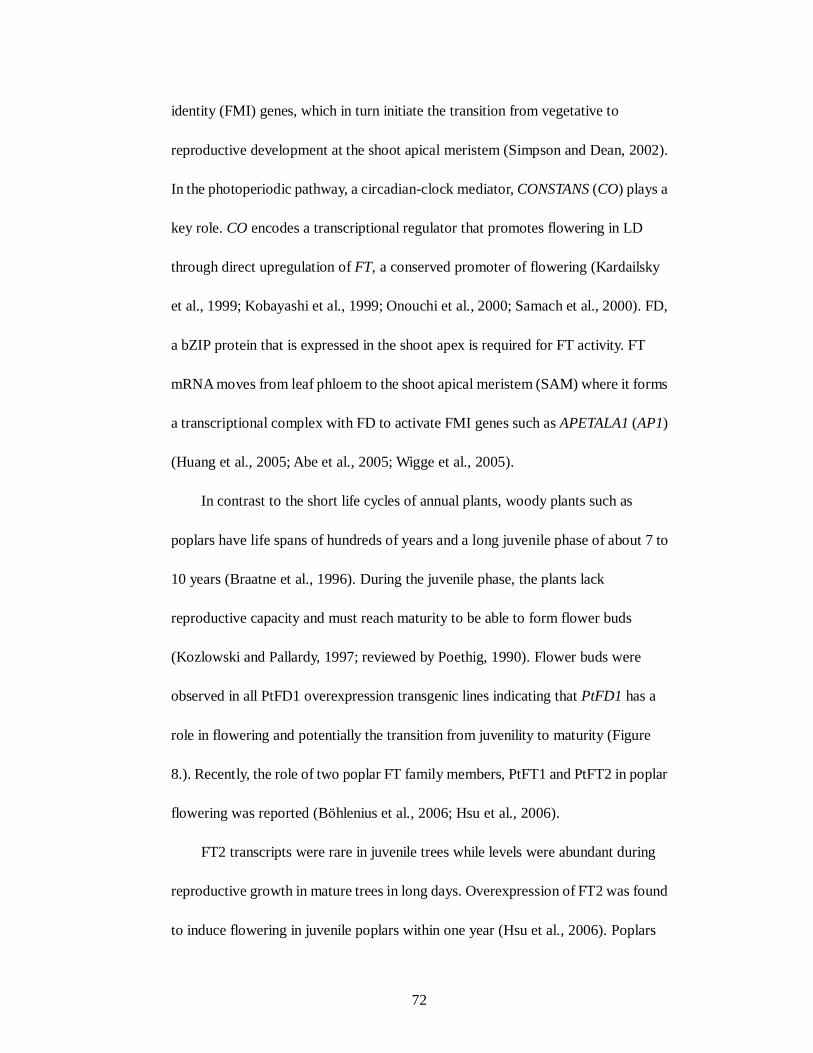
72
identity (FMI) genes, which in turn initiate the transition from vegetative to
reproductive development at the shoot apical meristem (Simpson and Dean, 2002).
In the photoperiodic pathway, a circadian-clock mediator, CONSTANS (CO) plays a
key role. CO encodes a transcriptional regulator that promotes flowering in LD
through direct upregulation of FT, a conserved promoter of flowering (Kardailsky
et al., 1999; Kobayashi et al., 1999; Onouchi et al., 2000; Samach et al., 2000). FD,
a bZIP protein that is expressed in the shoot apex is required for FT activity. FT
mRNA moves from leaf phloem to the shoot apical meristem (SAM) where it forms
a transcriptional complex with FD to activate FMI genes such as APETALA1 (AP1)
(Huang et al., 2005; Abe et al., 2005; Wigge et al., 2005).
In contrast to the short life cycles of annual plants, woody plants such as
poplars have life spans of hundreds of years and a long juvenile phase of about 7 to
10 years (Braatne et al., 1996). During the juvenile phase, the plants lack
reproductive capacity and must reach maturity to be able to form flower buds
(Kozlowski and Pallardy, 1997; reviewed by Poethig, 1990). Flower buds were
observed in all PtFD1 overexpression transgenic lines indicating that PtFD1 has a
role in flowering and potentially the transition from juvenility to maturity (Figure
8.). Recently, the role of two poplar FT family members, PtFT1 and PtFT2 in poplar
flowering was reported (Böhlenius et al., 2006; Hsu et al., 2006).
FT2 transcripts were rare in juvenile trees while levels were abundant during
reproductive growth in mature trees in long days. Overexpression of FT2 was found
to induce flowering in juvenile poplars within one year (Hsu et al., 2006). Poplars

73
transformed with 35S::PtFT1 were found to generate flower-like structures directly
from the Agrobacterium-infected explants. Furthermore, trees overexpressing
PtFT1 did not cease growth when transferred to SD treatment (Böhlenius et al.,
2006). These phenotypes are very similar to what observed for the PtFD1
overexpression poplars. Unlike the PtFD1 RNAi plants, PtFT1 RNAi plants were
reported to be much more sensitive to SD treatment (Böhlenius et al., 2006). Thus it
appears that the CO/FT regulon controls both the flower timing and seasonal
growth cessation and bud set by regulating photoperiod output signal (Böhlenius et
al., 2006). Since similar phenotypes between PtFD1 and PtFT1 plants were
observed, it seems that both flowering and bud development share similar
regulatory features.
It is likely that flowering in poplar was regulated through similar pathways as
those in Arabidopsis. In Arabidopsis, FD mRNA appears to be transported from
leaves to shoot apex where its regulatory role occurs. In poplars, PtFD1 is also
expressed in the shoot apex. High levels of FD1 transcripts occur in both leaves and
shoot apices of PtFD1 overexpression plants. Since flowering occurs in these plants
suggests that FD alone can induce flowering.
C. PtFD1 and ABA Pathways
Arabidopsis Group-A bZIP proteins are thought to play an important role in
ABA signal transduction in both seeds and vegetative tissues (Jakoby et al., 2002).
In poplar, exogenous ABA caused a small increase in PtFD1 expression in shoot
tips (Gnewikow, 2001).

74
The leaves of PtFD1 overexpression lines were smaller than the control plants
and the margins of the leaves showed a curling shape, which usually occur when
plants were in low humidity. This phenotype may represent an altered response to
ABA.
The similar phenotype was observed in aba1 mutants in Arabidopsis. The
ABA deficient mutants showed a semi-dwarf phenotype, leaves of reduced size and
curly leaf margins, which were thought to be related to impaired stomatal closure
(Barrero et al., 2005). This similarity suggests that PtFD1 may be involved in ABA
biosynthesis or act as a component of the ABA signal transduction pathway. The
phenotypes observed in PtFD1 overexpression transgenic plants may be caused by
defects in stomata function. The malfunctions lead to the failure of stomata closure
so that water loss through transpiration is greatly increased. The plants then develop
smaller leaves.
D. Possible Roles of PtFD1
From the morphological and anatomic results, it is clear that PtFD1 plays a
role in suppression of the formation of apical buds. This role appears to be related to
bud scale formation. PtFD1 acts as a negative inhibitor in the processes of bud
formation and maturation. Excessive amount of PtFD1 impairs the plant’s
responses to SD treatment including growth cessation and bud formation. The
signal transduction pathway of growth cessation and bud formation remains
unknown. Poplars overexpressing PtFD1, PtFT1, PtABI3 or PHYA all displayed
defects in growth cessation and bud formation indicating a role for these genes in

75
this pathway. All these factors may be involved in bud formation through one or
multiple pathways.
PtFD1 is also a positive regulator of flowering and overexpression of PtFD1
causes early flowering in juvenile plants. The mechanism is likely to be similar with
that of Arabidopsis. Growth cessation, bud set and flowering may share some
common regulators, including the circadian-clock mediator (CO), bZIP
transcription factor (FD), “florigen” (FT), phytochromes (PHYA).
In Arabidopsis, FT act as an activator of flowering while its homologue
TERMINAL FLOWER1 (TFL1) represses flowering (Shannon and Meeks-Wagner,
1991; Alvarez et al., 1992; Kardailsky et al., 1999; Searle and Coupland, 2004;
Wigge et al., 2005). The antagonistic functions can be converteds by swapping a
single amino acid (Hanzawa et al., 2005). The bZIP transcription factor FD can
interact with both FT and TFL1 (Abe et al., 2005; Wigge et al., 2005).
Accumulation of CO in LD induces the transcription of FT, which converts FD into
a strong activator by forming a complex with FD and bind to the promoter of the
floral identity gene AP1 (Valverde et al., 2004; Wigge et al., 2005; Ahn et al., 2006).
TFL1 competes with FT to react with FD, converts FD into a strong repressor and
delays the transition from the vegetative growth to flowering (Hanzawa et al., 2005;
Ahn et al., 2006). Thus by interacting with different components, FD can change
between activator and repressor. In poplar, it is very likely that the balance between
FT and TFL1 regulates the responses to floral inductive signals (Kardailsky et al.,
1999). During the long juvenile period, a chromatin structure-based repression of

76
PtFT1 prevent the plants from entering reproductive phase too early (Böhlenius et
al., 2006).
IV. Suggestions for Future Study
PtFD1 has been proven to play roles in bud formation, bud maturation,
vegetative growth and flowering. It may also take part in ABA and signal
transduction pathway. How it functions in all of the events remains elusive.
Since PtFD1 is thought to be involved in several genetic regulatory pathways,
its direct targets are very likely to be components of the transduction pathways.
With the available transgenic lines, suppression subtractive hybridization (SSH)
can be used to isolate differentially expressed transcripts. DNA microarray can be
used for gene expression profiling. Isolated genes are candidate components in the
regulation of the physiological events.
Evidence shows that PtFD1 functions by interacting with other factors of the
regulatory pathways, forming either a modulating complex or a dimer. Identifying
these components is another important work that needs to be done. Yeast two hybrid
system can be applied to identify factors that interact with PtFD1, such as PtFT.
This may help to elucidate the networks of the pathways.

77
Appendices
Figure A. 1. The map of over-expression T-DNA binary vector, pB7WG2. (Karimi, M., Inze, D., Depicker, A., Gateway vectors for Agrobacterium-mediated plant transformation. Trends Plant Sci. 2002 May;7(5): 193-195.) Source of the map: http://www.psb.ugent.be/gateway/index.php?NAME=pB7WG2&_app=vector&_act=construct_show&

78
Figure A. 2. The map of RNAi T-DNA binary vector, pB7GWIWG2(II). (Karimi, M., Inze, D., Depicker, A., Gateway vectors for Agrobacterium-mediated plant transformation. Trends Plant Sci. 2002 May;7(5): 193-195.)
Source of the map: http://www.psb.ugent.be/gateway/index.php?NAME=pB7GWIWG2(II)&_app=vector&_act=construct_show&

79
References
Ahn, J. H., Miller, D., Winter, V. J., Banfield, M. J., Lee, J. H., Yoo, S. Y., Henz, S. R., Brady, R. L. and Weigel, D. 2006. A divergent external loop antagonistic activity on floral regulators FT and TFL1. EMBO J. 25:605–614. Abe, M., Kobayashi, Y., Yamamoto, S., Daimon, Y., Yamaguchi, A., Ikeda, Y., Ichinoki, H., Notaguchi, M., Goto, K. and Araki, T. 2005. FD, a bZIP protein mediating signals from the floral pathway integrator FT at the shoot apex. Science. 309: 1052-1056. Alberts, B., Bray, D., Lewis, J., Raff, M., Roberts, K. and Watson, J. 1994. Molecular Biology of the Cell. 3rd Ed. Garland: New York, NY. Alvarez, J., Guli, C. L., Yu, X-H. and Smyth, D. R. 1992. Terminal flower: a gene affecting inflorescence development in Arabidopsis thaliana. Plant J. 2: 103-116. Amling, H. J. and Amling, K. A. 1980. Onset, intensity and dissipation of rest in several pecan cultivars. J. Amer. Soc. Hort. Sci. 105: 536-540. Barney, C. W. 1951. Effects of soil temperature and light intensity on root growth of loblolly pine seedlings. Plant Physiol. 26: 146-163. Barrero, J. M., Piqueras, P., González-Guzmán, M., Serrano, R., Rodríguez, P. L., Ponce, M. R. and Micol, J. L. 2005. A mutational analysis of the ABA1 gene of Arabidopsis thaliana highlights the involvement of ABA in vegetative development. J. Exp. Botany 56(418):2071-2083 Bensmihen, S., Rippa, S., Lambert, G., Jublot, D., Pautot, V., Granier, F., Giraudat, J. and Parcy, F. 2002. The homologous ABI5 and EEL transcription factors function antagonistically to fine-tune gene expression during late embryogenesis. Plant Cell. 14(6): 1391-1403. Bewley, J. D. 1997. Seed germination and dormancy. Plant Cell 9: 1055-1066. Böhlenius, H., Huang, T., Charbonnel-Campaa, L., Brunner, A. M., Jansson, S., Strauss, S. H. and Nilsson, O. 2006. CO/FT regulatory module controls timing of flowering and seasonal growth cessation in trees. Science. 312: 1040-1043.

80
Bonicel, A., Haddad, G. and Gagnaire, J. 1987. Seasonal variation of starch and major soluble sugars in the different organs of young poplars. Plant Physiol. Biochem. 25: 451-459. Braatne, J. H., Rood, S. B. and Heilman, P. E. 1996. Life history, ecology, and conservation of riparian cottonwoods in North America. In Biology of Populus, R.F. Stettler, H.D. Bradshaw, Jr., P.E. Heilman, and T.M. Hincley, eds (Ottawa, Canada: NRC Research Press), pp. 57-85. Brocard, I. M., Lynch, T. J. and Finkelstein, R. R. 2002. Regulation and Role of the Arabidopsis Abscisic Acid-Insensitive 5 Gene in Abscisic Acid, Sugar, and Stress Response. Plant Physiol. 129(4): 1533-1543. Carles, C., Bies-Etheve, N., Aspart, L., Leon-Kloosterziel, K. M., Koornneef, M., Echeverria, M. and Delseny, M. 2002. Regulation of Arabidopsis thaliana Em genes: role of ABI5. Plant J. 30(3): 373-383. Critchfield, W. B. 1960. Leaf dimorphism in Populus trichocarpa. Am. J. Bot. 47. 699-711. Coleman, G. D., Chen, T. H. H. and Fuchigami, L. H. 1992. Complementary DNA cloning of poplar bark storage protein and control of its expression by photoperiod. Plant Physiol. 98: 687-693. Coleman, G. D. and Chen, T. H. H. 1996. Photoperiod-Associated Gene Expression during Dormancy in Woody Perennials. Plant Dormancy. G. Lang (Ed.) 301-307. Dennis, F. G. J. 1996. A physiological comparison of seed and bud dormancy. In Lang G.A. ed. Plant Dormancy: Physiology, Biochemistry and Molecular Biology. Ed 1. CAB International. London. pp 47-56. Dickmann, D. I., and Keathley, D. E. 1996. Linking physiology, molecular genetics, and the Populus ideotype.In Biology of Populus and its implications for management and conservation. Edited by R. F. Stettler, H. D.Bradshaw Jr., P. E. Heilman and T. M. Hinkley. NRC Research Press, National Research Council of Canada,Ottawa, ON. pp. 491-514. Downs, R. J. and Borthwick, H. A. 1956. Effects of photoperiod on growth of trees. Bot. Gaz. 117: 310-326. El-Antably, H. M. M., Wareing, P. F. and Hillman, J. 1967. Some physiological responses to D, L abscisin (dormin). Planta. 73: 74-90.

81
Faust, M., Liu, D., Line, M. J. and Stutte, G. W. 1995. Conversion of bound to free water in endodormant buds of apple is an incremental process. Acta. Hort. 395: 113-118. Faust, M., Erez, A., Rowland, L. J., Wang, S. Y. and Norman, H.A. 1997. Bud dormancy in perennial fruit trees: physiological basis for dormancy induction, maintainance, and release. HortScience. 32 (4): 623-629. Finkelstein, R. R. 1994. Mutations at two new Arabidopsis ABA response loci are similar to the abi3 mutations. The Plant Journal 5: 765-771. Finkelstein, R. R. and Lynch, T. J. 2000. The Arabidopsis abscisic acid response gene ABI5 encodes a basic leucine zipper transcriptional factor. Plant Cell 12: 599-609. Finkelstein, R. R., Gampala, S. S. L. and Rock, C. D. 2002. Abscisic acid signaling in seeds and seedlings. Plant Cell. Supplement: S15-S45. Foster, R., Izawa, T. and Chua, N. H. 1994. Plant bZIP proteins gather at ACGT elements. FASEB. 8: 192-200. Giraudat, J., Hauge, B., Valon, C., Smalle, J., Parcy, F., and Goodman, H. 1992. Isolation of the Arabidopsis ABI3 gene by positional cloning. Plant Cell. 4: 1251-1261. Gnewikow, H. L. 2001. Isolation and characterization of a basic leucine zipper from poplar that is involved in terminal bud formation. Master Thesis. Goffinet, M. C. and Larson, P. R. 1981. Structural changes in Populus deltoides terminal buds and in the vascular transition zone of the stems during dormancy induction. Am. J. Bot. 68: 118–129. Goffinet, M. C. and Larson, P. R. 1982. Lamina abortion in terminal bud-scale leaves of Populus deltoides during dormancy induction. Bot. Gaz. 143: 331–340. Hansen, E., Olsen, J. E. and Junttila, O. 1999. Gibberellins and subapical cell divisions in relation to bud set and bud break in Salix pentandra. J Plant Growth Regul. 18: 167-170. Hanzawa, Y., Money, T. and Bradley, D. 2005. A single amino acid converts a repressor to an activator of flowering. Proc. Natl. Acad. Sci. U. S. A. 102: 7748-7753.

82
Heide, O. M. 1974. Growth and dormancy in Norway spruce ecotypes (Picea abies). I. Interaction of photoperiod and temperature. Physiol. Plant. 30: 1-12. Heide, O. M. and Prestrud, A. K. 2005. Low temperature, but not photoperiod, controls growth cessation and dormancy induction and release in apple and pear. Tree Physiol. 25(1): 109-114. Howe, G., Gardner, G., Hackett, W. and Furnier, G. 1996. Phytochrome control of short-day-induced bud set in black cottonwood. Physiol. Plant. 97: 95-103. Hsu, C-Y., Liu, Y., Luthe, D. S. and Yuceer, C. 2006. Poplar FT2 shortens the juvenile phase and promotes seasonal flowering. Plant Cell. Online Preview. Huang, T., Böhlenius, H., Eriksson, S., Parcy, F. and Nilsson, O. 2005. The mRNA of the Arabidopsis gene FT moves from leaf to shoot apex and induces flowering. Science. 309: 1694-1696. Hummel, R. C., Ascher, P. D. and Pellett, H. M. 1982. Inheritance of the photoperiodically induced cold acclimation response in Cornus sericea. Theor. Appl. Genet. 62: 385-394. Iwasaki, K. and Weaver, R. J. 1977. Effects of chilling, calcium cyanamide, and bud scale removal on bud break, rooting, and inhibitor content of buds of ‘Zinfandel’ grape Vitus vinifera L. J. J. Amer. Soc. Hort. Sci. 102: 584-587. Izawa, T., Foster, R., Chua, N. H. 1993. Plant bZIP protein DNA binding specificity. J. Mol. Biol. 230(4):1131-44. Jackson, S. and Thomas, B. 1997. Photoreceptors and signals in the photoperiodic control of development. Plant Cell Environ. 20: 790-795. Jakoby, M., Weisshaar, B., Dröge-Laser, W., Vicente-Carbajosa, J., Tiedemann, J., Kroj, T. & Parcy, F. 2002. bZIP transcription factors in Arabidopsis. Trends Plant Sci. 7: 106-111. Jian, L-C, Li, P. H., Sun, L-H and Chen, T. H. H. 1997. Alterations in ultrastructure and subcellular localization of Ca2+ in poplar apical bud cells during the induction of dormancy. J. Expt. Bot. 48: 1195-1207. Junttila, O. 1976. Apical growth cessation and shoot tip abscission in Salix. Physiol. Plant. 38: 278-286. Junttila, O. 1980. Effect of photoperiod and temperature on apical growth cessation in two ecotypes of Salix and Betula. Physiol Plant. 48: 347-352.

83
Junttila, O. 1982. The cessation of apical growth in latitudinal eco-types and ecotype crosses of Salix pentandra L. J. Exp. Bot. 33: 1021–1029. Junttila, O. and Kaurin, A. 1990. Environmental control of cold acclimation in Salix pentandra. Scand. J. of For. Res. 5:195-204. Junttila, O., Jensen, E. and Ernstsen, A. 1991. Effects of prohexadione (BX-112) and gibberellins on shoot growth in seedlings of Salix pentandra. Physiol Plant. 83: 17-21. Junttila, O., Nilsen, J. and Igeland, B. 2003. Effect of temperature on the induction of bud dormancy in various ecotypes of Betula pubescens and B. pendula. Scand. J. For. Res. 18:208-217. Kardailsky, I., Shukla, V. K., Ahn, J. H., Dagenais, N., Christensen, S. K., Nguyen, J. T., Chory, J., Harrison, M. J. and Weigel, D. 1999. Activation tagging of the floral inducer FT. Science. 286: 1962-1965. Karimi, M., Inzé, D. and Depicker A. 2002. GATEWAY™ vectors for Agrobacterium-mediated plant transformation. Trends Plant Sci. 7: 193-195. Kerstetter, R. A. and Hake, S. 1997. Shoot meristem formation in vegetative development. Plant Cell. 9: 1001-1010. Kim, S. Y., Ma, J., Perret, P., Li, Z. and Thomas, T. L. 2002 Arabidopsis ABI5 subfamily members have distinct DNA-binding and transcriptional activities. Plant Physiol. 130: 688-697. Kobayashi, Y., Kaya, H., Goto, K., Iwabuchi, M. and Araki T. 1999. A pair of related genes with antagonistic roles in mediating flowering signals. Science. 286: 1960-1962. Koornneef, M., Reuling, G. and Karssen, C. M. 1984. The isolation and characterization of abscisic acid-insensitive mutants of Arabidopsis thaliana. Physiol. Plant. 61:377-383. Kozlowski, T. T. and Pallardy, S. G. 1997. Physiology of Woody Plants. 2nd Ed. Academic Press, Inc., UK. Landschulz, W. H., Johnson, P. F. and McKnight, S. L. 1988. The Leucine Zipper: A hypothetical structure common to a new class of DNA binding proteins. Science. 240: 1759-1764.

84
Lang, G. A. 1987. Dormancy: a new universal terminology. HortScience. 22:817-820. Lavender, D. P., Sweet, G. B., Zaerr, J. B. and Hermann, R. K. 1973. Spring shoot growth in Douglas-fir may be initiated by gibberellins exported from the roots. Science. 182: 838-839. Le Bris, M., Michaux-Ferrière, N., Jacob, Y., Poupet, A., Barthe, P., Guigonis, J-M. and Le Page-Degivry, M-T. 1999. Regulation of bud dormancy by manipulation of ABA in isolated buds of Rosa hybrida cultured in vitro. Austr. J. Plant Physiol. 26: 273-281. Leple, J. C., Brasileiro, A. C. M., Michel, M. F., Delmotte, F. and Jouanin, L. 1992. Transgenic poplars: expression of chimeric genes using four different constructs. Plant Cell Reports 11: 137-141. Leung, J. and Giraudat, J. 1998. Abscisic acid signal transduction. Annu. Rev. Plant Physiol. Plant Mol. Biol. 49: 199-222. Li, P. and Adams, W. T. 1993. Genetic control of bud phenology in pole-size trees and seedlings of coastal Douglas-fir. Can. J. For. Res. 23: 1043–1051. Menkens, A. E., Schindler, U. and Cashmore, A. R. 1995. The G-box: a ubiquitous regulatory DNA element in plants bound by the GBF family of bZIP proteins. Trends Biochem. Sci. 20: 506-510. Meshi, T. and Iwabuchi, M. 1995. Plant transcription factors. Plant Cell Physiol. 36(8): 1405-1420. Meshi, T., Moda, I., Minami, M., Okanami, M. and Iwabuchi, M. 1998. Conserved Ser residues in the basic region of the bZIP-type transcription factor HBF-1a(17): importance in DNA binding and possible targets for phosphorylation. Plant Mol. Biol. 36: 125-136. Nambara, E., Hayama, R., Tsuchiya, Y., Nishimura, M., Kawaide, H., Kamiya, Y. and Naito, S. 2000. The role of ABI3 and FUS3 loci in Arabidopsis thaliana on phase transition from late embryo development to germination. Dev. Biol. 220:412–423. Olsen, J. E., Junttila, O., Moritz, T. 1995. A localized decrease of GA1 in shoot tips of Salix pentandra seedlings precedes cessation of shoot elongation under short photoperiod. Physiol Plant. 95: 627-632.

85
Olsen, J. E., Junttila, O., Nilsen, J., Eriksson, M. E., Martinussen, I., Olsson, O., Sandberg, G. and Moritz, T. 1997. Ectopic expression of oat phytochrome A in hybrid aspen changes critical daylength for growth and prevents cold acclimatization. Plant J. 12: 1339-1350. Olsen, J. E., Jensen, J. B., Mølmann, J., Ernstsen, A. and Junttila, O. 2004. Photoperiodic regulation of apical growth cessation in northern tree species: the role of phytochrome and gibberellin. Journal of Crop Improvement. 10: 77-112. Onouchi, H., Igeño, M. I., Périlleux, C., Graves, K. and Coupland, G. 2000. Mutagenesis of plants overexpressing CONSTANS demonstrates novel interactions among Arabidopsis flowering-time genes. Plant Cell. 12: 885-900. Örvar, B. L., Sangwan, V., Omann, F. and Dhindsa, R. S. 2000. Early steps in cold sensing by plant cells: the role of actin cytoskeleton and membrane fluidity. Plant J. 23: 785-794. Oyama, T., Shimura, Y. and Okada, K. 1997. The Arabidopsis HY5 gene encodes a bZIP protein that regulates stimulus-induced development of root and hypocotyls. Genes Devel. 11: 2983-2995. Parcy, F., Valon, C., Raynal, M., Gaubier, P., Delseny, M. and Giraudat, J. 1994. Regulation of gene expression programs during Arabidopsis seed development : respective roles of the ABI3 locus and of endogenous abscisic acid levels. Plant Cell 6: 1567-1582. Parcy, F. 2005. Flowering: a time for integration. Int. J. Dev. Biol. 49: 585-593. Pathak, D. and Sigler, P. B. 1992. Updating structure-function relationships in the bZip family of transcription factors. Curr. Opin. Struct. Biol. 2: 116-123. Perry, T. O. 1971. Dormancy of Trees in Winter. Science. 171: 29-36. Poethig, R. S. 1990. Phase change and the regulation of shoot morphogenesis in plants. Science. 250: 923-930. Powell, L. E. 1987. Hormonal aspects of bud and seed dormancy in temperate-zone woody plants. HortScience. Vol. 22(5): 845-850. Rinne, P., Saarelainen, A. and Junttila, O. 1994. Growth cessation and bud dormancy in relation to ABA concentration in seedlings and coppice shoots of Betula pubescens as affected by a short photoperiod, water deficit and chilling. Physiologia Plantatrum 90: 451-458.

86
Rinne, P. L. H. and van der Schoot, C. 1998. Symplasmic fields in the tunica of the shoot apical meristem coordinate morphogenetic events. Development. 125: 1477–1485. Rohde, A., Howe, G. T., Olsen, J. E., Moritz, T., Van Montagu, M., Junttila, O. and Boerjan, W. 2000. Molecular Aspects of Bud Dormancy in Trees. Molecular Biology of Woody Plants. Jain and Minocha (Eds) 1:89-134. Kluwer Academic Publishers: Netherlands. Rohde, A., Prinsen, E., De Rycke, R., Engler, G., Van Montagu, M. and Boerjan, W. 2002. PtABI3 impinges on the growth and differentiation of embryonic leaves during bud set in poplar. Plant Cell. 14(8): 1885-1901. Ruzin, S. E. 1999. Plant microtechnique and microscopy. Oxford University Press, Inc. New York. Samach, A., Onouchi, H., Gold, S. E., Ditta, G. S., Schwarz-Sommer, Z., Yanofsky, M. F. and Coupland, G. 2000. Distinct roles of CONSTANS target genes in reproductive development of Arabidopsis. Science. 288: 1613-1616. Sauter, J. J., Wisniewski, M. and Witt, W. 1996. Interrelationships between ultrastructure, sugar levels, and frost hardiness of ray parenchyma cells during frost acclimation and deacclimation in poplar (Populus x canadensis Moench <robusta>) wood. J Plant Physiol. 149: 451-461. Searle, I. and Coupland, G. 2004. Introduction of flowering by seasonal changes in photoperiod. EMBO J. 23: 1217-1222. Schmidt, R. J., Burr, F. A., Aukerman, M. J. and Burr, B. 1990. Maize regulator gene opaque-2 encodes a protein with a ‘leucine zipper’ motif that binds to zein DNA. PNAS. 87: 46-50. Shannon, S. and Meeks-Wagner, D. R. 1991. A mutation in the Arabidopsis TFL1 gene affects inflorescence meristem development. Plant Cell. 3: 877-892. Simpson, G. G. and Dean, C. 2002. Arabidopsis, the rosetta stone of flowering time? Science. 296: 285-289. Suttle, J. and Hultstrand, J. 1994. Role of endogenous abscisic acid in potato microtuber dormancy. Plant. Physiol. 105:891-896. Swartz, H. J., Geyer, A. S., Powell, L. E. and Lin, S. C. 1984. The role of bud scales in the dormancy of apples. J. Amer. Soc. Hort. Sci. 109: 745-749.
87
Taiz, L. and Zeiger, E. 2002. Plant Physiology. 3rd ed. Sinauer Associates, Inc., Publishers. Sunderland, Massachusetts. Taylor, G. 2002. Populus: Arabidopsis for forestry. Do we need a model tree? Annals of Botany 90:681-689. Tinklin, I. G. and Schwabe, W. W. 1970. Lateral bud dormancy in blackcurrant. Ann. Bot. 84: 691-706. Valverde, F., Mouradov, A., Soppe, M., Ravenscroft, D., Samach, A. and Coupland, G. 2004. Photoreceptor regulation of CONSTANS protein in photoperiodic flowering. Science. 303: 1003-1006. Vegis, A. 1964. Dormancy in higher plants. An. Rev. of Plant Phys. L. Machlis (Ed.) 15: 185-224. Villiers, T. A. 1975. Dormancy and the Survival of Plants. The Institute of Biology’s Studies in Biology no. 57. Walsch, J., Waters, C. A. and Freeling, M. 1998. The maize gene liguleless2 encodes a basic leucine zipper protein involved in the establishment of the leaf blade-sheath boundary. Genes Devel. 12: 208-218. Walser, R. H., Walker, D. R. and Seeley, S. D. 1981. Effect of temperature, fall defoliation, and gibberellic acid on the rest period of peach leaf buds. J. Amer. Soc. Hort. Sci. 106: 91-94. Welling, A., Moritz, T., Palva, T. and Junttila, O. 2002. Independent activation of cold acclimation by low temperature and short photoperiod in hybrid aspen. Plant Physiol. 129: 1633-1641. Wigge, P. A., Kim, M. C., Jaeger, K. E., Busch, W., Schmid, M., Lohmann, J. U. and Weigel, D. 2005. Integration of spatial and temporal information during floral induction in Arabidopsis. Science. 30: 1056-1059. Williams, Jr. B. J., Pellett, N. E. and Klein, R. M. 1972. Phytochrome control of growth cessation and initiation of cold acclimation in selected woody plants. Plant Physiol. 50: 262-265. Coleman, G. D. and Chen, T. H. H. 1996. Photoperiod-associated gene expression during dormancy in woody perennials. Plant Dormancy. G. Lang (Ed.) 301-307. Zhu, B. and Coleman, G. 2001. Phytochrome-mediated photoperiod perception, shoot growth, glutamine, Calcium, and protein phosphorylation influence the

88
activity of the poplar bark storage protein promoter (bspA). Plant Physiol. 126:342-351.