Embed Size (px)
Citation preview
APPLiED AND ENVIRONMENTAL MICROBIOLOGY, May 1979, p. 841-8480099-2240/79/05-0841/08$02.00/0
Vol. 37, No. 5
Adenosine 5'-Triphosphate Flux Through the North InletMarsh Systemt
THOMAS H. CHRZANOWSKI,'* L. HAROLD STEVENSON,' AND BJORN KJERFVE2Belle W. Baruch Institute for Marine Biology and Coastal Research and Departments of Biology,' and
Geology,2 University ofSouth Carolina, Columbia, South Carolina 29208
Received for publication 26 February 1979
The distribution, fluctuation, and short-term transport of total microbial bio-mass (measured as adenosine 5'-triphosphate [ATP]) was investigated in a largesalt marsh creek. Hourly samples were collected synoptically for 25 h from 10boats positioned across the 320-m width of the creek. Samples were collectedfrom three depths ranging from 0.2 to 8.0 m. Hourly data obtained from eachstation were graphed, plotting depth against ATP. Subsequently, interpolatedATP values were generated for every one-tenth depth from the surface to thebottom with the use of an 11-point proportional divider. A total of 2,750 valueswere generated, and a mean value of 0.865 mg of ATP per m3 was determined.Maximum levels of ATP were found at high tide and minimal values were foundat low tide. The distribution of ATP concentrations was found to be complex,with no suggestion of vertical stratification; however, horizontal divisions wereapparent. ATP values corrected for direction of flow or velocity indicated twoebb-directed channels; however, when considered in total, there was a net importof ATP through the interface. The total import of ATP for this 25-h samplingperiod was calculated to be 3.58 kg, corresponding to a net transport of 39.8 mgof ATP per s through the cross section. Results suggest that detailed characteri-zation of a creek transect in terms of ATP or any similar parameter requires thesimultaneous measurements of both the concentration of the parameter in ques-tion and the velocity at the time and point from which the sample was taken.
The terrestrial and aquatic components of asalt marsh community interact to make the en-vironment an area of intense biological activity.The processes of primary production, degrada-tion of marsh plants, ground water runoff, excre-ment of terrestrial animals, activity of intertidalorganisms, disruptive action of benthic macro-fauna, and the metabolism of microorganismssurely add to as well as alter the types andamounts of both inanimate organic and inor-ganic materials in the water that periodicallycover the marsh. The fate of materials sus-pended in this water is in doubt. They may betransported or out-welled to pelagic communi-ties of the inner continental shelf (15), or theymay be sedimented in other areas of the marshalong with allochthonous materials of oceanicorigins (19). However, dissolved and inanimatematerials are not the only substances scouredfrom or added to the marsh sediment by tidalaction. Viable microorganisms also represent aclass of materials that can be either drawn fromor deposited in a marsh system through theaction of the tides.
t Contribution no. 266 of the Belle W. Baruch Library inMarine Biology.
The net movement of several classes of ma-terials across a marsh-ocean interface has beeninvestigated. These have included materialssuch as carbon (19, 20), suspended solids, am-monia, nitrate, nitrite, and phosphate (5), chlo-rophyll a (5, 7), detritus (8), and microbial bio-mass (I, 7, 9). Quantification of microbial bio-mass in aquatic systems has proceeded rapidlysince the development of a reliable extractionand assay procedure for adenosine triphosphate(ATP). Despite the fact that ATP has been usedfor the quantification of microbial biomass formore than a decade, few studies using the nu-cleotide as a measure of the net exchange ofmicrobial biomass between marsh and oceanicenvironments have been reported (1, 7, 9). Thestudies utilizing ATP were done in marshes un-der 60 ha and correspondingly small drainagecreeks.The work reported herein involved high-den-
sity sampling at the junction of the AtlanticOcean and a marsh of substantial area. Thiscommunication is intended to enhance the un-derstanding of microbial biomass movementsthrough a marsh-ocean interface by reportingthe levels and fluctuations of ATP at the inter-
841
Dow
nloa
ded
from
http
s://j
ourn
als.
asm
.org
/jour
nal/a
em o
n 19
Dec
embe
r 20
21 b
y 10
3.87
.106
.194
.
842 CHRZANOWSKI, STEVENSON, AND KJERFVE
face as well as transport through the boundry ona short-term basis.
MATERIALS AND METHODSAll samples were collected on 11 and 12 November
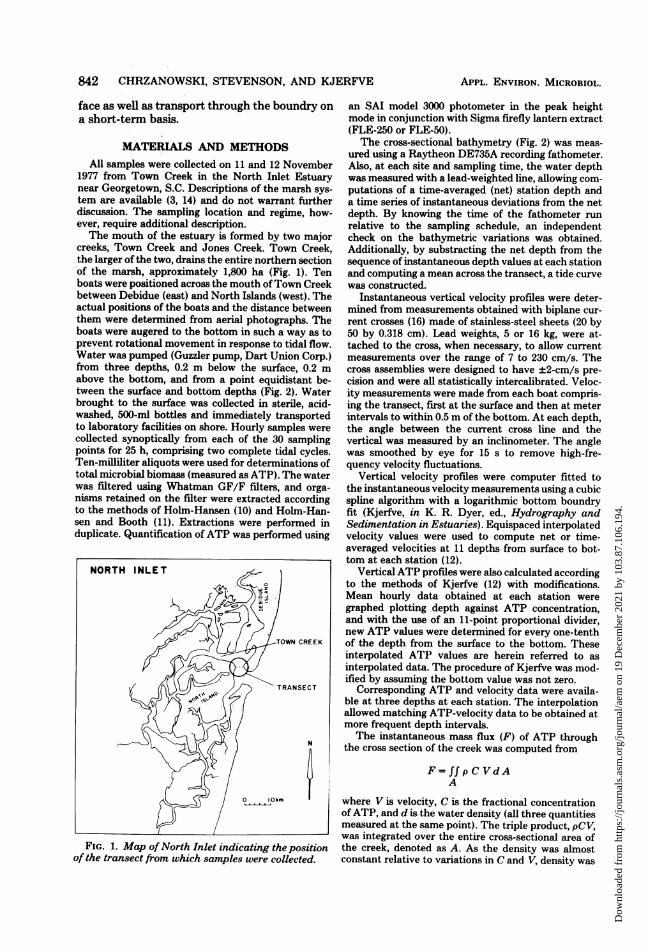
1977 from Town Creek in the North Inlet Estuarynear Georgetown, S.C. Descriptions of the marsh sys-tem are available (3, 14) and do not warrant furtherdiscussion. The sampling location and regime, how-ever, require additional description.The mouth of the estuary is formed by two major
creeks, Town Creek and Jones Creek. Town Creek,the larger of the two, drains the entire northern sectionof the marsh, approximately 1,800 ha (Fig. 1). Tenboats were positioned across the mouth ofTown Creekbetween Debidue (east) and North Islands (west). Theactual positions of the boats and the distance betweenthem were determined from aerial photographs. Theboats were augered to the bottom in such a way as toprevent rotational movement in response to tidal flow.Water was pumped (Guzzler pump, Dart Union Corp.)from three depths, 0.2 m below the surface, 0.2 mabove the bottom, and from a point equidistant be-tween the surface and bottom depths (Fig. 2). Waterbrought to the surface was collected in sterile, acid-washed, 500-ml bottles and immediately transportedto laboratory facilities on shore. Hourly samples werecollected synoptically from each of the 30 samplingpoints for 25 h, comprising two complete tidal cycles.Ten-milliliter aliquots were used for determinations oftotal microbial biomass (measured as ATP). The waterwas filtered using Whatman GF/F filters, and orga-nisms retained on the filter were extracted accordingto the methods of Holm-Hansen (10) and Holm-Han-sen and Booth (11). Extractions were performed induplicate. Quantification of ATP was performed using
FIG. 1. Map ofNorth Inlet indicating the positionof the transect from which samples were collected.
an SAI model 3000 photometer in the peak heightmode in conjunction with Sigma firefly lantern extract(FLE-250 or FLE-50).The cross-sectional bathymetry (Fig. 2) was meas-
ured using a Raytheon DE735A recording fathometer.Also, at each site and sampling time, the water depthwas measured with a lead-weighted line, allowing com-putations of a time-averaged (net) station depth anda time series of instantaneous deviations from the netdepth. By knowing the time of the fathometer runrelative to the sampling schedule, an independentcheck on the bathymetric variations was obtained.Additionally, by substracting the net depth from thesequence of instantaneous depth values at each stationand computing a mean across the transect, a tide curvewas constructed.
Instantaneous vertical velocity profiles were deter-mined from measurements obtained with biplane cur-rent crosses (16) made of stainless-steel sheets (20 by50 by 0.318 cm). Lead weights, 5 or 16 kg, were at-tached to the cross, when necessary, to allow currentmeasurements over the range of 7 to 230 cm/s. Thecross assemblies were designed to have ±2-cm/s pre-cision and were all statistically intercalibrated. Veloc-ity measurements were made from each boat compris-ing the transect, first at the surface and then at meterintervals to within 0.5 m of the bottom. At each depth,the angle between the current cross line and thevertical was measured by an inclinometer. The anglewas smoothed by eye for 15 s to remove high-fre-quency velocity fluctuations.
Vertical velocity profiles were computer fitted tothe instantaneous velocity measurements using a cubicspline algorithm with a logarithmic bottom boundryfit (Kjerfve, in K. R. Dyer, ed., Hydrography andSedimentation in Estuaries). Equispaced interpolatedvelocity values were used to compute net or time-averaged velocities at 11 depths from surface to bot-tom at each station (12).
Vertical ATP profiles were also calculated accordingto the methods of Kjerfve (12) with modifications.Mean hourly data obtained at each station weregraphed plotting depth against ATP concentration,and with the use of an 11-point proportional divider,new ATP values were determined for every one-tenthof the depth from the surface to the bottom. Theseinterpolated ATP values are herein referred to asinterpolated data. The procedure of Kjerfve was mod-ified by assuming the bottom value was not zero.
Corresponding ATP and velocity data were availa-ble at three depths at each station. The interpolationallowed matching ATP-velocity data to be obtained atmore frequent depth intervals.The instantaneous mass flux (F) of ATP through
the cross section of the creek was computed from
F= ff p C VdAA
where V is velocity, C is the fractional concentrationofATP, and d is the water density (all three quantitiesmeasured at the same point). The triple product, pCV,was integrated over the entire cross-sectional area ofthe creek, denoted as A. As the density was almostconstant relative to variations in C and V, density was
APPL. ENVIRON. MICROBIOL.
Dow
nloa
ded
from
http
s://j
ourn
als.
asm
.org
/jour
nal/a
em o
n 19
Dec
embe
r 20
21 b
y 10
3.87
.106
.194
.
ATP FLUX 843
assumed to equal unity since cgs units were used. Thenumerical procedure to evaluate flux has been outlinedin a step-by-step fashion by Kjerfve (in K. R. Dyer,ed., Hydrography and Sedinentation in Estuaries).
Statistical analyses and computer mapping wereperformed by an IBM-370 computer in conjunctionwith programs available in the SAS (2), SYMVU (13),and SYMAP (4) program packages.
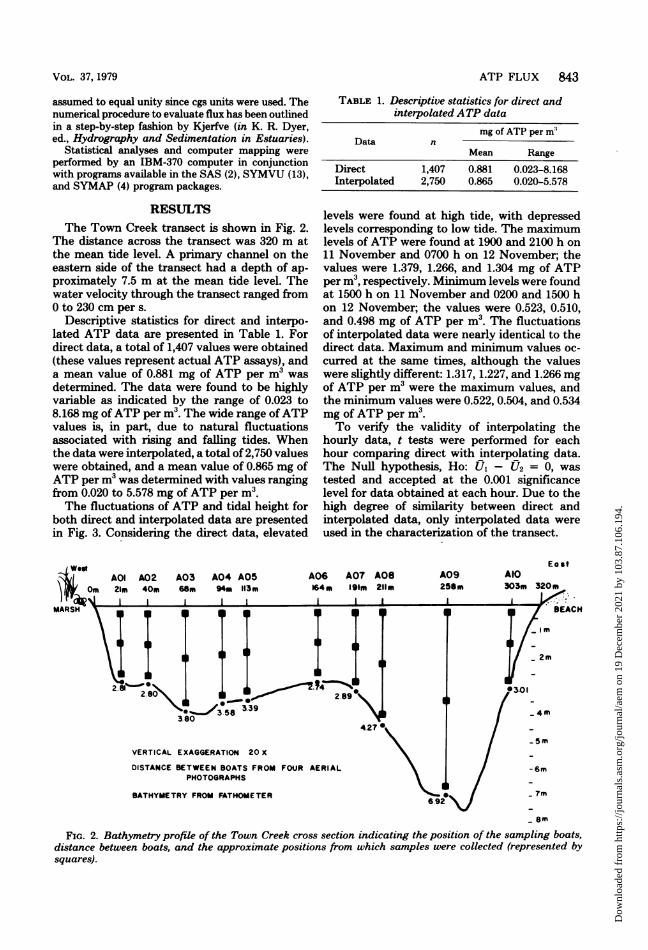
RESULTSThe Town Creek transect is shown in Fig. 2.
The distance across the transect was 320 m atthe mean tide level. A primary channel on theeastern side of the transect had a depth of ap-proximately 7.5 m at the mean tide level. Thewater velocity through the transect ranged from0 to 230 cm per s.
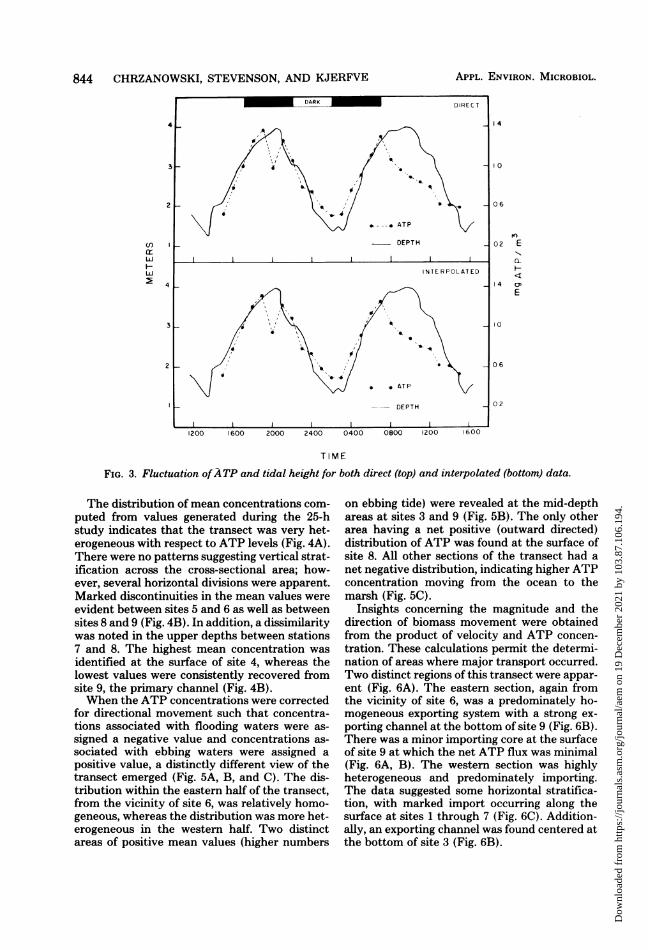
Descriptive statistics for direct and interpo-lated ATP data are presented in Table 1. Fordirect data, a total of 1,407 values were obtained(these values represent actual ATP assays), anda mean value of 0.881 mg of ATP per m3 wasdetermined. The data were found to be highlyvariable as indicated by the range of 0.023 to8.168 mg ofATP per m3. The wide range of ATPvalues is, in part, due to natural fluctuationsassociated with rising and falling tides. Whenthe data were interpolated, a total of 2,750 valueswere obtained, and a mean value of 0.865 mg ofATP per m3 was determined with values rangingfrom 0.020 to 5.578 mg of ATP per m3.The fluctuations of ATP and tidal height for
both direct and interpolated data are presentedin Fig. 3. Considering the direct data, elevated
TABLE 1. Descriptive statistics for direct andinterpolated ATP data
mg of ATP per mi'Data n
Mean Range
Direct 1,407 0.881 0.023-8.168Interpolated 2,750 0.865 0.020-5.578
levels were found at high tide, with depressedlevels corresponding to low tide. The maximumlevels of ATP were found at 1900 and 2100 h on11 November and 0700 h on 12 November; thevalues were 1.379, 1.266, and 1.304 mg of ATPper m3, respectively. Minimum levels were foundat 1500 h on 11 November and 0200 and 1500 hon 12 November; the values were 0.523, 0.510,and 0.498 mg of ATP per m3. The fluctuationsof interpolated data were nearly identical to thedirect data. Maximum and minimum values oc-curred at the same times, although the valueswere slightly different: 1.317, 1.227, and 1.266 mgof ATP per m3 were the maximum values, andthe minimum values were 0.522, 0.504, and 0.534mg of ATP per m3.To verify the validity of interpolating the
hourly data, t tests were performed for eachhour comparing direct with interpolating data.The Null hypothesis, Ho: U1 - U2 = 0, wastested and accepted at the 0.001 significancelevel for data obtained at each hour. Due to thehigh degree of similarity between direct andinterpolated data, only interpolated data wereused in the characterization of the transect.
West EastAOI A02 A03 A04 A05 A06 A07 AOS A09 AIO
0 Om 21m 40m 68m 94m 113m 164m 191m 211m 25Sm 303m 320m
MARS A* * A EACH
PHOTOGRAPHS~~~~~~~~~~~~~~~~~~~~~~~~~~~~~~~~t "I2-ii 0~~~~~~.8 3.01
3.39
4.27'..5m
VERTICAL EXAGGERATION 20X
DISTANCE BETWEEN BOATS FROM FOUR AERIAL -6mPHOTOGRAPHS
BATHYMETRY FROM FATHOMETER 7m692
- am
FIG. 2. Bathymetry profile of the Town Creek cross section indicating the position of the sampling boats,distance between boats, and the approximate positions from which samples were collected (represented bysquares).
VOL. 37, 1979
Dow
nloa
ded
from
http
s://j
ourn
als.
asm
.org
/jour
nal/a
em o
n 19
Dec
embe
r 20
21 b
y 10
3.87
.106
.194
.
844 CHRZANOWSKI, STEVENSON, AND KJERFVE
4
3
2
C/)
LLi
HL
3
2
1200 1600 2000 2400 0400 0800 1200 1600
4
06
K)
E
a-
E
4
I
06
02
TIME
FIG. 3. Fluctuation ofATP and tidal height for both direct (top) and interpolated (bottom) data.
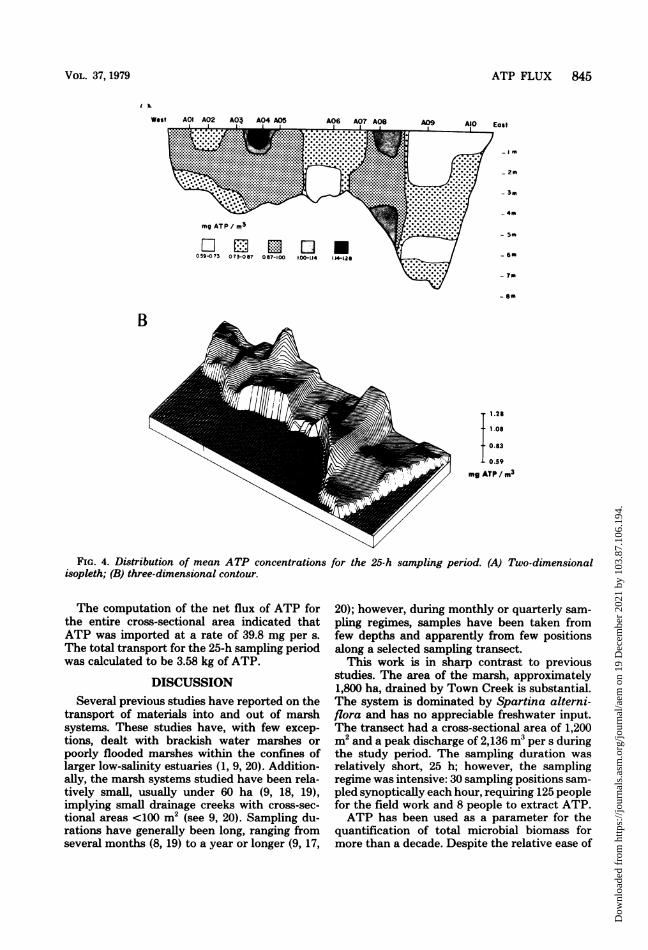
The distribution of mean concentrations com-puted from values generated during the 25-hstudy indicates that the transect was very het-erogeneous with respect to ATP levels (Fig. 4A).There were no patterns suggesting vertical strat-ification across the cross-sectional area; how-ever, several horizontal divisions were apparent.Marked discontinuities in the mean values wereevident between sites 5 and 6 as well as betweensites 8 and 9 (Fig. 4B). In addition, a dissimilaritywas noted in the upper depths between stations7 and 8. The highest mean concentration was
identified at the surface of site 4, whereas thelowest values were consistently recovered fromsite 9, the primary channel (Fig. 4B).When the ATP concentrations were corrected
for directional movement such that concentra-tions associated with flooding waters were as-
signed a negative value and concentrations as-sociated with ebbing waters were assigned a
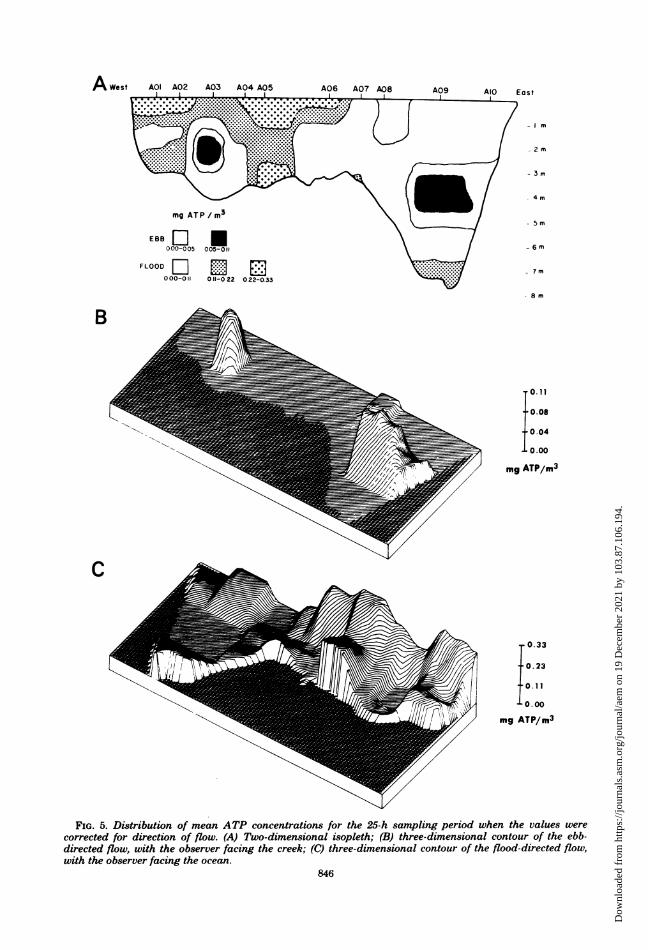
positive value, a distinctly different view of thetransect emerged (Fig. 5A, B, and C). The dis-tribution within the eastern half of the transect,from the vicinity of site 6, was relatively homo-geneous, whereas the distribution was more het-erogeneous in the western half. Two distinctareas of positive mean values (higher numbers
on ebbing tide) were revealed at the mid-depthareas at sites 3 and 9 (Fig. 5B). The only otherarea having a net positive (outward directed)distribution of ATP was found at the surface ofsite 8. All other sections of the transect had a
net negative distribution, indicating higher ATPconcentration moving from the ocean to themarsh (Fig. 50).
Insights concerning the magnitude and thedirection of biomass movement were obtainedfrom the product of velocity and ATP concen-
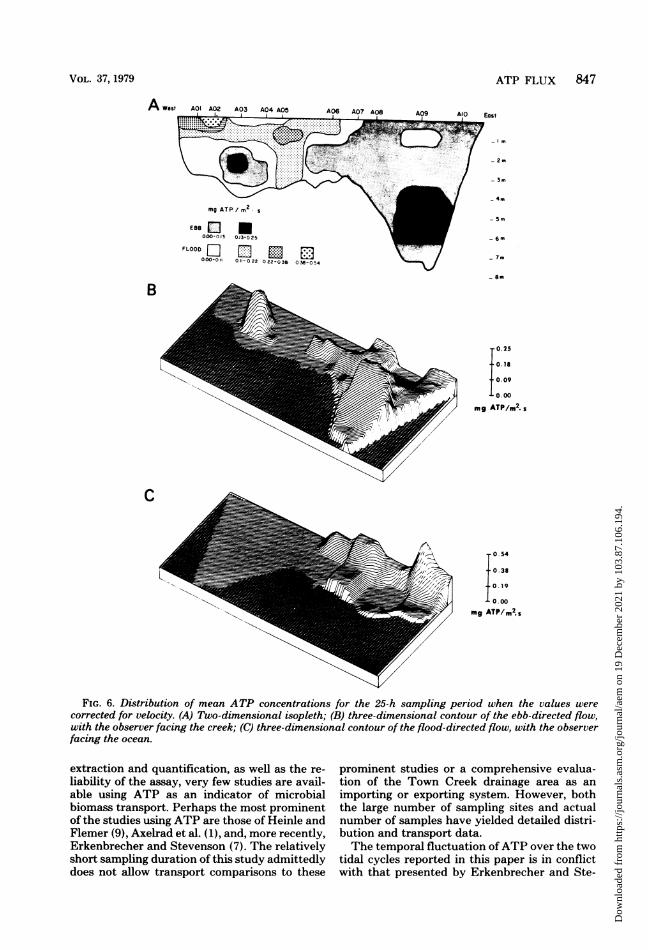
tration. These calculations permit the determi-nation of areas where major transport occurred.Two distinct regions of this transect were appar-ent (Fig. 6A). The eastern section, again fromthe vicinity of site 6, was a predominately ho-mogeneous exporting system with a strong ex-
porting channel at the bottom of site 9 (Fig. 6B).There was a minor importing core at the surfaceof site 9 at which the net ATP flux was minimal(Fig. 6A, B). The western section was highlyheterogeneous and predominately importing.The data suggested some horizontal stratifica-tion, with marked import occurring along thesurface at sites 1 through 7 (Fig. 6C). Addition-ally, an exporting channel was found centered atthe bottom of site 3 (Fig. 6B).
DARK M DIRECT
_ ~~~~~~~~~~~DEPTH
I I lIINTERPOLATED'0--
ATP
DEPTH
__1.1 1 N R A
APPL. ENVIRON. MICROBIOL.
Dow
nloa
ded
from
http
s://j
ourn
als.
asm
.org
/jour
nal/a
em o
n 19
Dec
embe
r 20
21 b
y 10
3.87
.106
.194
.
ATP FLUX 845
Eost
- 2m
- 3m
-4.
- Sm
- 6m
- 7.
- am
B
1.28
-1.08
. 0.83
0.59
mg ATP/m3
FIG. 4. Distribution of mean ATP concentrations for the 25-h sampling period. (A) Two-dimensionalisopleth; (B) three-dimensional contour.
The computation of the net flux of ATP forthe entire cross-sectional area indicated thatATP was imported at a rate of 39.8 mg per s.The total transport for the 25-h sampling periodwas calculated to be 3.58 kg of ATP.
DISCUSSIONSeveral previous studies have reported on the
transport of materials into and out of marshsystems. These studies have, with few excep-tions, dealt with brackish water marshes orpoorly flooded marshes within the confines oflarger low-salinity estuaries (1, 9, 20). Addition-ally, the marsh systems studied have been rela-tively small, usually under 60 ha (9, 18, 19),implying small drainage creeks with cross-sec-tional areas <100 m2 (see 9, 20). Sampling du-rations have generally been long, ranging fromseveral months (8, 19) to a year or longer (9, 17,
20); however, during monthly or quarterly sam-pling regimes, samples have been taken fromfew depths and apparently from few positionsalong a selected sampling transect.This work is in sharp contrast to previous
studies. The area of the marsh, approximately1,800 ha, drained by Town Creek is substantial.The system is dominated by Spartina alterni-flora and has no appreciable freshwater input.The transect had a cross-sectional area of 1,200m2 and a peak discharge of 2,136 m3 per s duringthe study period. The sampling duration wasrelatively short, 25 h; however, the samplingregime was intensive: 30 sampling positions sam-pled synoptically each hour, requiring 125 peoplefor the field work and 8 people to extract ATP.ATP has been used as a parameter for the
quantification of total microbial biomass formore than a decade. Despite the relative ease of
VOL. 37, 1979
Dow
nloa
ded
from
http
s://j
ourn
als.
asm
.org
/jour
nal/a
em o
n 19
Dec
embe
r 20
21 b
y 10
3.87
.106
.194
.
A West East
2 m
33m
4m
mg ATP/m3 \ 025-5m
00-005 005-011 -6m
FLOOD El El'7rm000-011 011-0 22 0-22-0.33
-m
j0.11
-0.08
0.04
0.00
mg ATP/m3
0 33
mg ATP/M3
FIG. 5. Distribution of mean ATP concentrations for the 25-h sampling period when the values werecorrected for direction of flow. (A) Two-dimensional isopleth; (B) three-dimensional contour of the ebb-directed flow, with the observer facing the creek; (C) three-dimensional contour of the flood-directed flow,with the observer facing the ocean.
846
Dow
nloa
ded
from
http
s://j
ourn
als.
asm
.org
/jour
nal/a
em o
n 19
Dec
embe
r 20
21 b
y 10
3.87
.106
.194
.
ATP FLUX 847
A M VA3 AV5 A09 AIO East
0003013: -A-6'l000 00 / _3
0t Ool022 022-o3g 03e-054 7
C
~~=-vltl WC ~~~~~~~mgATP/m2s
FIG. 6. Distribution of mean ATP concentrations for the 25-h sampling period when the values were
corrected for velocity. (A) Two-dimensional isopleth; (B) three-dimensional contour of the ebb-directed flow,
with the observer facing the creek; (C) three-dimensional contour of the flood-directed flow, with the observer
facing the ocean.
extraction and quantification, as well as the re-
liability of the assay, very few studies are avail-able using ATP as an indicator of microbialbiomass transport. Perhaps the most prominentof the studies using ATP are those of Heinle andFlemer (9), Axelrad et al. (1), and, more recently,Erkenbrecher and Stevenson (7). The relativelyshort sampling duration of this study admittedlydoes not allow transport comparisons to these
prominent studies or a comprehensive evalua-tion of the Town Creek drainage area as an
importing or exporting system. However, boththe large number of sampling sites and actualnumber of samples have yielded detailed distri-bution and transport data.The temporal fluctuation ofATP over the two
tidal cycles reported in this paper is in conflictwith that presented by Erkenbrecher and Ste-
VOL. 37, 1979
Dow
nloa
ded
from
http
s://j
ourn
als.
asm
.org
/jour
nal/a
em o
n 19
Dec
embe
r 20
21 b
y 10
3.87
.106
.194
.
848 CHRZANOWSKI, STEVENSON, AND KJERFVE
venson (6). Working at Oyster Landing Creek, ahigh-marsh creek within North Inlet, they foundATP to fluctuate 1800 out ofphase with the tide;ATP concentrations were minimal at high tideand maximal at low tide. These findings areopposite to our findings at Town Creek, whereATP concentrations were minimal at low tideand maximal at high tide. This discrepancy maybe due to seasonal differences or, perhaps more
importantly, they may reflect different popula-tions detected in the water column. At low tidethe sediment at Oyster Landing Creek is almostentirely exposed; the flooding and ebbing watersusually resuspend sediment and attendant mi-crobial populations. ATP extracted from sam-
ples taken from this high-marsh creek was prob-ably associated with sediment populations,whereas ATP extracted from samples taken atTown Creek was associated predominately withoceanic populations. Oyster Landing Creek is inthe uppermost reaches of the marsh system,separated from the Town Creek transect byapproximately 4 km of waterway. The distancebetween the creeks is strong circumstantial evi-dence in support of this proposal.The development of a detailed picture of the
distributions of microbial biomass within thetransect was one of the more valuable results ofthis study. The complex distribution cautionsagainst the random selection of sampling siteswithin such a transect. This was dramaticallyemphasized when data corrected for direction offlow or velocity were compared to concentrationdata. Additionally, data corrected for directionof flow may supply distributional patterns thatdiffer considerably from data intergrated withvelocity. This was clearly demonstrated in thisstudy as data corrected for direction indicated a
majority of the eastern section of the transect tobe inflowing (see Fig. 5A, B, and C); however,when velocity was accounted for, the majorityofthe eastern section ofthe transect was actuallyoutflowing (see Fig. 6A, B, C).A salient point of this study is that detailed
characterization of a creek transect in terms ofATP or any similar parameter requires the si-multaneous measurements of both the concen-
tration of the parameter in question and thevelocity at the time and point from which thesample was taken. It is almost always impossibleto characterize a location from concentrationdata alone and even more so if the concentrationdata are derived from a poorly constructed tran-sect. As is apparent from data presented herein,conclusions based solely on concentration or di-rectionally corrected data will be misleading.
ACKNOWLEDGMENTSThis work was supported by National Science Foundation
grant DEB 76-83010.We thank the 133 students, faculty, and technicians of the
Marine Science Program and Department of Biology for theirassistance in collecting the field data. We are especially grate-ful to Steven Knoche, Charles Wilson, and Jeffrey Proehl forcapable technical assistance.
LITERATURE CITED1. Axelrad, D. M., K. A. Moore, and M. E. Bender. 1976.
Nitrogen, phosphorus and carbon flux in ChesapeakeBay marshes. Bull. 79, Virginia Water Resources Cen-ter, Blacksburg.
2. Barr, A. J., J. H. Goodnight, J. P. Sall, and J. T.Helwig. 1976. A user's guide to SAS 76. Sparks Press,Raleigh, N.C.
3. Dame, R., F. Vernberg, R. Bonnell, and W. Kitchens.1977. The North Inlet marsh-estuarine ecosystem: aconceptual approach. Helgol. Wiss. Meeresunters. 30:343-356.
4. Dougenik, J. A., and D. E. Sheehan. 1976. SYMAPuser's reference manual. Graduate School of Design,Harvard University, Cambridge, Mass.
5. Duedall, I. W., H. B. O'Connors, J. H. Parker, R. E.Wilson, and A. S. Robbins. 1977. The abundances,distribution and flux of nutrients and chlorophyll a inthe New York Bight Apex. Estuarine Coastal Mar. Sci.5:81-105.
6. Erkenbrecher, C. W., and L. H. Stevenson. 1975. Theinfluence of tidal flux on microbial biomass in salt marshcreeks. Limnol. Oceanogr. 20:618-625.
7. Erkenbrecher, C. W., and L. H. Stevenson. 1978. Thetransport of microbial biomass and suspended materialin a high-marsh creek. Can. J. Microbiol. 24:839-846.
8. Haines, E. B. 1977. The origins of detritus in Georgia saltmarsh estuaries. Oikos 29:254-260.
9. Heinle, D. R., and D. A. Flemer. 1976. Flows of materialsbetween poorly flooded tidal marshes and an estuary.Mar. Biol. 35:359-373.
10. Hohm-Hansen, 0. 1973. Determination of total microbialbiomass by measurement of adenosine triphosphate, p.73-89. In L. H. Stevenson and R. R. Colwell (ed.),Estuarine microbial ecology. University of South Car-olina Press, Columbia.
11. Holm-Hansen, O., and C. R. Booth. 1966. The mea-surement of adenosine triphosphate in the ocean andits ecological significance. Limnol. Oceanogr. 11:510-519.
12. Kjerfve, B. 1975. Velocity averaging in estuaries charac-terized by a large tidal range to depth ratio. EstuarineCoastal Mar. Sci. 3:311-323.
13. Laboratory for Computer Graphics and SpatialAnalysis. 1977. SYMVU manual. Graduate School ofDesign, Harvard University, Cambridge, Mass.
14. Lonsdale, D. J., and B. C. Coull. 1977. Composition andseasonality of zooplankton of North Inlet, South Caro-lina. Chesapeake Sci. 18:272-283.
15. Odum, E. P. 1968. A research challenge: evaluating theproductivity of coastal and estuarine water, p. 63-64. InProceedings, Second Sea Grant Conference. GraduateSchool of Oceanography, University of Rhode Island,Newport.
16. Pritchard, D. W., and W. V. Burt. 1951. An inexpensiveand rapid technique for obtaining current profiles inestuarine waters. J. Mar. Res. 10:180-189.
17. Settlemyre, J. L., and L. R. Gardner. 1977. Suspendedsediment flux through a salt marsh drainage basin.Estuarine Coastal Mar. Sci. 5:653-663.
18. Shisler, J. L., and D. M. Jobbins. 1977. Tidal variationsin the movement of organic carbon in New Jersey saltmarshes. Mar. Biol. 40:127-134.
19. van Es, F. B. 1977. A preliminary carbon budget for apart of the Ems estuary: the Dollard. Helgol. Wiss.Meeresunters. 30:283-294.
20. Woodwell, G. M., D. E. Whitney, C. A. S. Hall, and R.A. Houghton. 1977. The flax pond ecosystem study:exchanges of carbon in water between a salt marsh andLong Island Sound. Limnol. Oceanogr. 22:833-838.
APPL. ENVIRON. MICROBIOL.
Dow
nloa
ded
from
http
s://j
ourn
als.
asm
.org
/jour
nal/a
em o
n 19
Dec
embe
r 20
21 b
y 10
3.87
.106
.194
.


![Increased Rate of Adenosine Triphosphate …...(CANCER RESEARCH 55, 4352-4360, October 1, 1995] Increased Rate of Adenosine Triphosphate-dependent Etoposide (VP-16) Efflux in a Murine](https://img.pdfslide.net/doc/110x75/5e7e8d68c5d0407f2447f2a9/increased-rate-of-adenosine-triphosphate-cancer-research-55-4352-4360-october.jpg)