Embed Size (px)
Citation preview
International Journal of Earth and Atmospheric Science | January-March, 2018 | Volume 05 | Issue 01 | Pages 01-12 © 2018 Jakraya
INTERNATIONAL JOURNAL OF EARTH AND ATMOSPHERIC SCIENCE Journal homepage: www.jakraya.com/journal/ijeas
REVIEW ARTICLE
Air Pollution: Why Does It Matter? Valiyaveettil Shamsudheen Semeena1, Swagata Payra2, Atul Kumar Srivastava3* and Jagabandhu Panda4 1Norwegian Meteorological Institute, Oslo, Norway. 2Department of Physics, Birla Institute of Technology Mesra, Jaipur Campus, Rajasthan, India. 3*Indian Institute of Tropical Meteorology (Branch), Prof Ramnath Vij Marg, New Delhi, India. 4Department of Earth and Atmospheric Sciences, National Institute of Technology Rourkela, Odisha, India. *Corresponding Author: Atul Kumar Srivastava Email: [email protected] Submitted: 23/02/2018 Accepted: 25/03/2018
Abstract There has been a series of articles and publications since decades
dealing with the question, “What is air pollution and how does it matter?”. According to the World Health Organisation (WHO, 2016), more than 80% of the people living in urban areas are exposed to much poorer air quality than what WHO limits. These accounts for the regions, which monitor air quality on a regular basis and the actual percentage, can be even worse. As urban air quality declines, the risk of health problems such as stroke, heart disease, lung cancer, chronic and acute respiratory diseases including asthma can increase in people who live in them. This article is a compilation of the results from publications on air pollution and its impacts on human health. This includes articles relating to atmospheric pollution and human health, how air pollution affects the ecosystem, impact of air pollution on climate change and the policies on air pollution. Keywords: Air quality, Pollutants, Human health, Particulate matter, Climate.
1. Introduction
By definition, pollution is a broad term applied to any matter - physical, chemical or biological - that modifies the natural characteristics of the atmosphere and has damaging effects on living things and the environment. Pollutants in the air come from many different sources and they are not always visible. Many forms of atmospheric pollution affect human health and the environment from local to global scale. These contaminants are emitted from diverse sources and many of them react to form new compounds in air, which are even more dangerous to ecosystem. The pollutants that can harm human health and environment include ground level ozone, particulate matter (PM), sulfate, nitrate, ammonia, heavy metals, volatile organic compounds (VOCs) and toxic organic substances like Persistent Organic Pollutants (POPs). PM is divided into small (PM10) and fine (PM2.5) particulate matter and these include pollutants such as sulfate, nitrate and black carbon, which can penetrate deep into the lungs and into the cardiovascular system posing high risks to human health. The WHO ambient air quality guidelines set a limit on pollutant concentration as an annual mean concentration of 10µg/m3 and 25µg/m3 for 24-hour mean in the case of PM2.5 and 20µg/m3 and 50µg/m3 for PM10, respectively.
Scientific studies identify the observed increase in global average temperature since the mid 20th century is mainly due to the increase in anthropogenic greenhouse gas emissions (IPCC, 2007 and the references therein). The fourth assessment report of the Intergovernmental Panel on Climate Change (IPCC, 2007) also indicate that if the emission concentrations of radiatively active gases like carbon dioxide and methane continue to increase, this can have several future adverse effects on the climate system (Hogrefe et al., 2004; Murazaki and Hess, 2006). Air pollutants of concern can have serious effects not only on air quality and human life but also can affect wildlife, vegetation, streams, lakes, soils and even visibility in a polluted area. According to WHO, an estimated 6.5 million deaths were associated with indoor and outdoor air pollution together in 2012. This accounts for 11% of all global deaths. The Clean Air Act of 1970 authorises the U.S. Environmental Protection agency (USEPA) to protect public health by regulating the emissions of these harmful air pollutants. The EU’s air quality directives set pollutant concentration thresholds that shall not be exceeded (OJ of EU, 2004, 2008). 2. Sources of Air Pollution
Semeena et al...Air Pollution: Why Does It Matter?
International Journal of Earth and Atmospheric Science | January-March, 2018 | Volume 05 | Issue 01 | Pages 01-12 © 2018 Jakraya
2
The sources of air pollutants are so vivid that it can be mobile, stationary and natural. Transportation sector is the main mobile source, while power plants, oil refineries, industrial facilities, factories, agricultural areas, cities and wood burning facilities comes under the stationary sources. Forest fires, wind-blown, desert dust and volcanoes are the main natural sources of air pollution. Depending on the region on earth, same pollutants can have different sources.
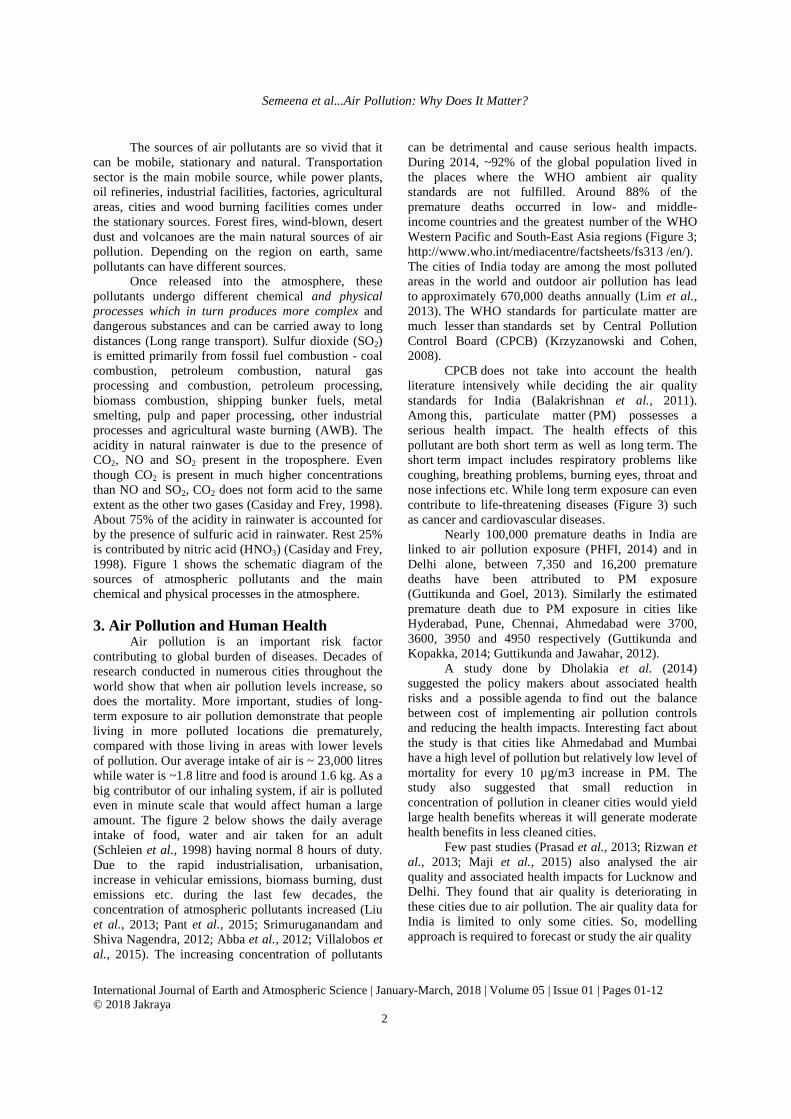
Once released into the atmosphere, these pollutants undergo different chemical and physical processes which in turn produces more complex and dangerous substances and can be carried away to long distances (Long range transport). Sulfur dioxide (SO2) is emitted primarily from fossil fuel combustion - coal combustion, petroleum combustion, natural gas processing and combustion, petroleum processing, biomass combustion, shipping bunker fuels, metal smelting, pulp and paper processing, other industrial processes and agricultural waste burning (AWB). The acidity in natural rainwater is due to the presence of CO2, NO and SO2 present in the troposphere. Even though CO2 is present in much higher concentrations than NO and SO2, CO2 does not form acid to the same extent as the other two gases (Casiday and Frey, 1998). About 75% of the acidity in rainwater is accounted for by the presence of sulfuric acid in rainwater. Rest 25% is contributed by nitric acid (HNO3) (Casiday and Frey, 1998). Figure 1 shows the schematic diagram of the sources of atmospheric pollutants and the main chemical and physical processes in the atmosphere. 3. Air Pollution and Human Health
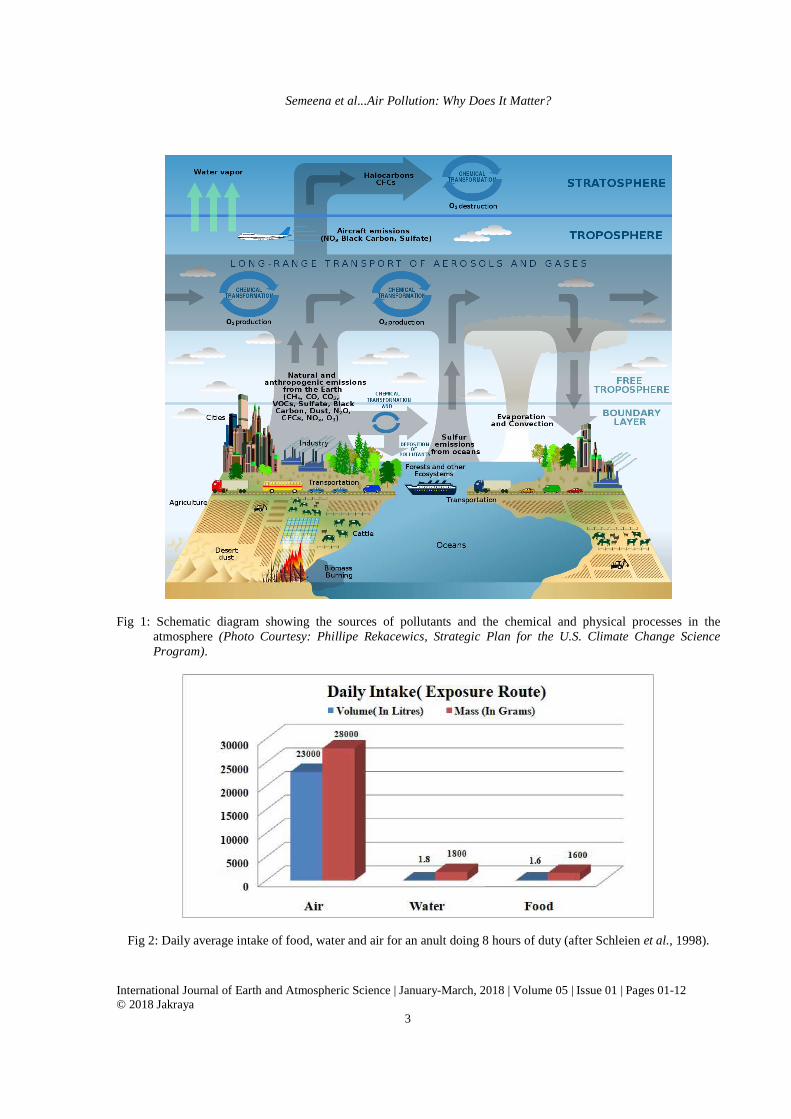
Air pollution is an important risk factor contributing to global burden of diseases. Decades of research conducted in numerous cities throughout the world show that when air pollution levels increase, so does the mortality. More important, studies of long-term exposure to air pollution demonstrate that people living in more polluted locations die prematurely, compared with those living in areas with lower levels of pollution. Our average intake of air is ~ 23,000 litres while water is ~1.8 litre and food is around 1.6 kg. As a big contributor of our inhaling system, if air is polluted even in minute scale that would affect human a large amount. The figure 2 below shows the daily average intake of food, water and air taken for an adult (Schleien et al., 1998) having normal 8 hours of duty. Due to the rapid industrialisation, urbanisation, increase in vehicular emissions, biomass burning, dust emissions etc. during the last few decades, the concentration of atmospheric pollutants increased (Liu et al., 2013; Pant et al., 2015; Srimuruganandam and Shiva Nagendra, 2012; Abba et al., 2012; Villalobos et al., 2015). The increasing concentration of pollutants
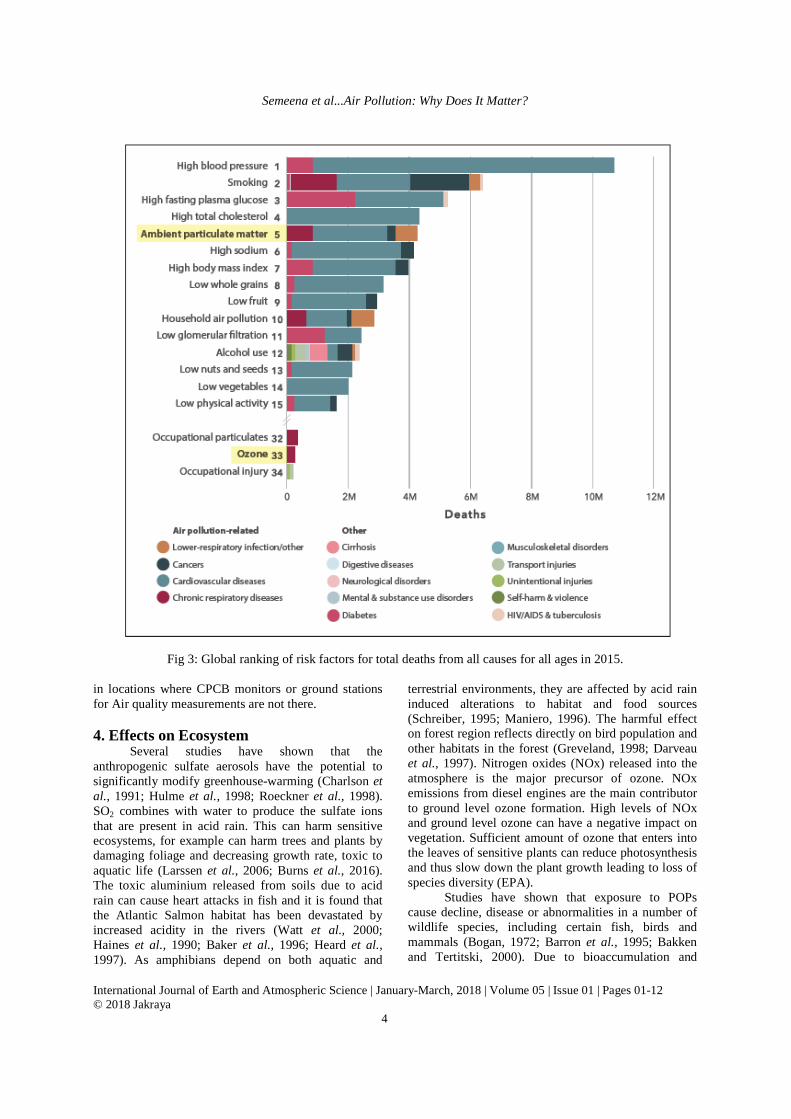
can be detrimental and cause serious health impacts. During 2014, ~92% of the global population lived in the places where the WHO ambient air quality standards are not fulfilled. Around 88% of the premature deaths occurred in low- and middle-income countries and the greatest number of the WHO Western Pacific and South-East Asia regions (Figure 3; http://www.who.int/mediacentre/factsheets/fs313 /en/).The cities of India today are among the most polluted areas in the world and outdoor air pollution has lead to approximately 670,000 deaths annually (Lim et al., 2013). The WHO standards for particulate matter are much lesser than standards set by Central Pollution Control Board (CPCB) (Krzyzanowski and Cohen, 2008).
CPCB does not take into account the health literature intensively while deciding the air quality standards for India (Balakrishnan et al., 2011). Among this, particulate matter (PM) possesses a serious health impact. The health effects of this pollutant are both short term as well as long term. The short term impact includes respiratory problems like coughing, breathing problems, burning eyes, throat and nose infections etc. While long term exposure can even contribute to life-threatening diseases (Figure 3) such as cancer and cardiovascular diseases.
Nearly 100,000 premature deaths in India are linked to air pollution exposure (PHFI, 2014) and in Delhi alone, between 7,350 and 16,200 premature deaths have been attributed to PM exposure (Guttikunda and Goel, 2013). Similarly the estimated premature death due to PM exposure in cities like Hyderabad, Pune, Chennai, Ahmedabad were 3700, 3600, 3950 and 4950 respectively (Guttikunda and Kopakka, 2014; Guttikunda and Jawahar, 2012).
A study done by Dholakia et al. (2014) suggested the policy makers about associated health risks and a possible agenda to find out the balance between cost of implementing air pollution controls and reducing the health impacts. Interesting fact about the study is that cities like Ahmedabad and Mumbai have a high level of pollution but relatively low level of mortality for every 10 µg/m3 increase in PM. The study also suggested that small reduction in concentration of pollution in cleaner cities would yield large health benefits whereas it will generate moderate health benefits in less cleaned cities.
Few past studies (Prasad et al., 2013; Rizwan et al., 2013; Maji et al., 2015) also analysed the air quality and associated health impacts for Lucknow and Delhi. They found that air quality is deteriorating in these cities due to air pollution. The air quality data for India is limited to only some cities. So, modelling approach is required to forecast or study the air quality
Semeena et al...Air Pollution: Why Does It Matter?
International Journal of Earth and Atmospheric Science | January-March, 2018 | Volume 05 | Issue 01 | Pages 01-12 © 2018 Jakraya
3
Fig 1: Schematic diagram showing the sources of pollutants and the chemical and physical processes in the
atmosphere (Photo Courtesy: Phillipe Rekacewics, Strategic Plan for the U.S. Climate Change Science Program).
Fig 2: Daily average intake of food, water and air for an anult doing 8 hours of duty (after Schleien et al., 1998).
Semeena et al...Air Pollution: Why Does It Matter?
International Journal of Earth and Atmospheric Science | January-March, 2018 | Volume 05 | Issue 01 | Pages 01-12 © 2018 Jakraya
4
Fig 3: Global ranking of risk factors for total deaths from all causes for all ages in 2015. in locations where CPCB monitors or ground stations for Air quality measurements are not there. 4. Effects on Ecosystem
Several studies have shown that the anthropogenic sulfate aerosols have the potential to significantly modify greenhouse-warming (Charlson et al., 1991; Hulme et al., 1998; Roeckner et al., 1998). SO2 combines with water to produce the sulfate ions that are present in acid rain. This can harm sensitive ecosystems, for example can harm trees and plants by damaging foliage and decreasing growth rate, toxic to aquatic life (Larssen et al., 2006; Burns et al., 2016). The toxic aluminium released from soils due to acid rain can cause heart attacks in fish and it is found that the Atlantic Salmon habitat has been devastated by increased acidity in the rivers (Watt et al., 2000; Haines et al., 1990; Baker et al., 1996; Heard et al., 1997). As amphibians depend on both aquatic and
terrestrial environments, they are affected by acid rain induced alterations to habitat and food sources (Schreiber, 1995; Maniero, 1996). The harmful effect on forest region reflects directly on bird population and other habitats in the forest (Greveland, 1998; Darveau et al., 1997). Nitrogen oxides (NOx) released into the atmosphere is the major precursor of ozone. NOx emissions from diesel engines are the main contributor to ground level ozone formation. High levels of NOx and ground level ozone can have a negative impact on vegetation. Sufficient amount of ozone that enters into the leaves of sensitive plants can reduce photosynthesis and thus slow down the plant growth leading to loss of species diversity (EPA).
Studies have shown that exposure to POPs cause decline, disease or abnormalities in a number of wildlife species, including certain fish, birds and mammals (Bogan, 1972; Barron et al., 1995; Bakken and Tertitski, 2000). Due to bioaccumulation and
Semeena et al...Air Pollution: Why Does It Matter?
International Journal of Earth and Atmospheric Science | January-March, 2018 | Volume 05 | Issue 01 | Pages 01-12 © 2018 Jakraya
5
biomagnification POPs can reach very high concentrations in predators such as polar bears, arctic fox and glaucous gulls (Wang-Andersen et al., 1993; Gabrielsen et al., 1995; Bernhoft et al., 1997, 2000; Garner et al., 2001; de Wit et al., 2004).
The Atmospheric (Asian) Brown Cloud (here after ABC) which is the result of biomass burning (in rural areas) and fossil fuel combustion (in urban areas) seems to have adverse effects on ecosystem - floods in Bangladesh, Nepal and north-eastern India, but drought in Pakistan and north-western India (Pandve, 2008 and references therein). The ABC is rapidly melting Himalayan and Tibetan glaciers, which results in flooding around the region (Lau et al., 2010). In a long run - as these glaciers disappear - this can lead to drought in the area. The ABC consists of both light-absorbing and light-scattering aerosols. This can contribute to atmospheric solar heating and surface cooling, but the net effect is thought to be negative and thus it reduces the solar radiation reaching the surface of the earth. This can influence the regional climate. Reduction in solar radiation reaching the surface leads to lower surface temperature, which slows the rate of evaporation and in turn reduces the amount of precipitable water in the atmosphere that alters the monsoon system (Lau et al., 2006; Ramanathan et al., 2007). The resulting decline in precipitation can influence the regional hydrological cycle and this can modify agricultural production (Chameides, 1999; Pathak et al., 2003; Peng et al., 2004; Krishnakumar et al., 2004; Ramanathan et al., 2005, 2007; Auffhammer et al., 2006). The whole story is not only of ABC, any pollution in any region of the earth can have adverse effect on the climate and ecosystem of the region (Chameides et al., 1994; Z. Karim et al., 1999). 5. Long Range Transport, Regional Air
Quality and Climate Change Air quality of a region is influenced through
inherent emissions within and those transported into. The latter is called the ‘Long Range Transport (LRT)’ of pollutants. While it is not possible to measure this physically, General Circulation models (or GCMs) and Chemical Transport models (or CTMs) can be used to estimate the LRT across borders. Air pollution has been travelling to the Polar region for nearly 150 years or more (since the beginning of industrial era in 1850s). Pollution export or import from local to global scale is big concern due to several issues, like local air quality and associated health hazard, local and regional climate etc. Numerous observational and modelling studies show that the emissions from upwind countries play major role in altering the atmospheric composition and related impacts in the Northern Hemisphere (Lin et al., 2010 and references there in). PM pollution from China
is transported eastward to Korea, Japan and even to the west coast of the United States (Zhang et al., 2017). Model studies as well as satellite observations show that Asian pollution (mainly fossil fuel emissions) contribute as much as 20% of the ozone during spring time pollution episodes in Western U.S. (Lin et al., 2012 and references there in). Few past studies (e.g. Ramanathan and Feng, 2009) suggest that the ABCs may have played a significant role in the widespread decrease in Indian Summer Monsoon and African Monsoon as well as the retreat in glaciers in Himalaya-Tibetan region.
Hazardous substances like POPs can travel long distance through air and water (Macdonald et al., 2000; AMAP, 2003; Semeena and Lammel, 2004). Arctic is a ‘sink’ for POPs transported into this region, as the special environmental conditions tend to trap them. The cold environment favours their persistence compared to warmer environments. Studies show that climate change, global warming and associated ice melt in the arctic region helps POPs to revolatalise (Hung et al., 2011). These substances are equally harmful to aquatic life and humans (Figure 3; see the previous sections). 6. Air Pollution in India
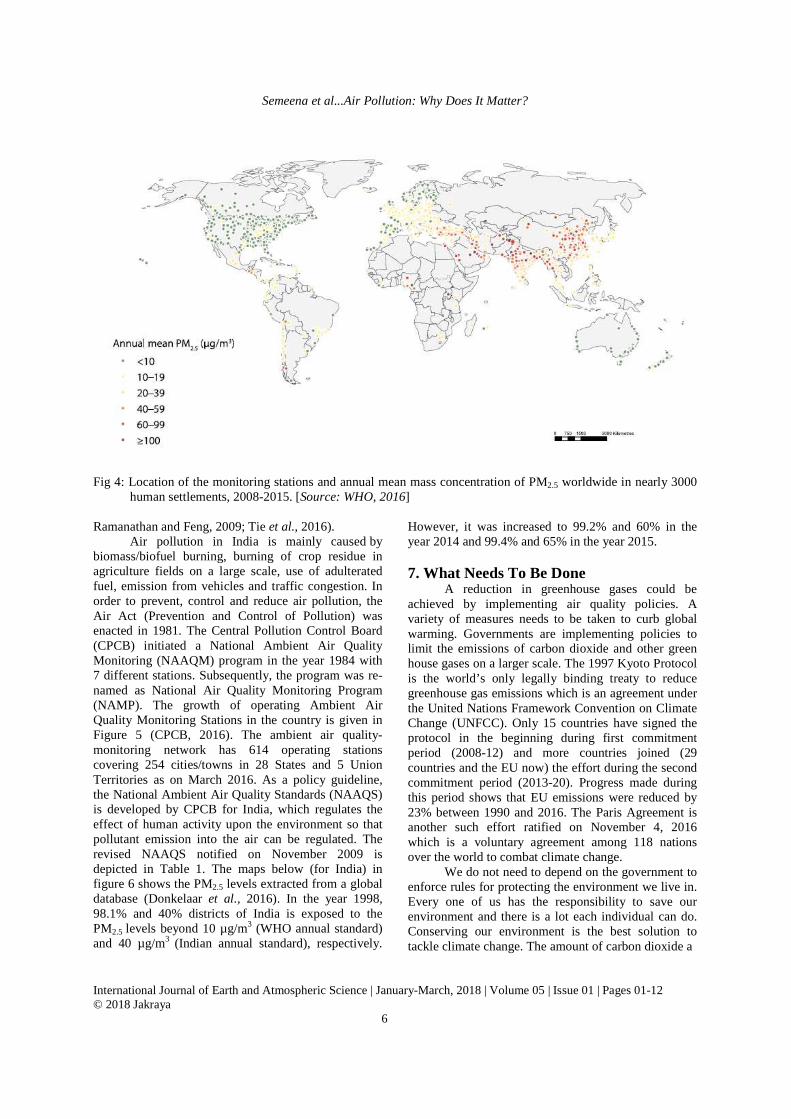
As per the recent survey by the Environmental Performance Index (EPI) in 2016, India ranked as 141 out of 180 countries as far as the air pollution is concerned (https://epi.envirocenter.yale.edu/). According to this report, more than 3.5 billion people, which are half of the world’s population, are exposed to unsafe air quality, which also includes about 75% of India’s population. In the last five years (2010-2015), a rapid increase in the population-weighted PM2.5 mean concentration over India has been observed and attributed as fifth-ranking mortality risk factor (Cohen et al., 2017). Figure 4 clearly exhibits the worldwide monitoring locations and PM2.5 mass concentration in nearly 3000 human settlements during the period from 2008 to 2015. Many Indian cities, especially those over the Indo-Gangetic Plain (IGP), are amongst the most polluted cities in the world where annual mean PM2.5 levels are ≥100 µg/m3.
The region suffers from the intense pressure of urbanization, industrialization and dense population. These potential factors may cause major environmental (i.e. sequential degradation of ambient air quality), climatic and health concerns in recent decades (Srivastava et al., 2012; Gurjar et al., 2016; Chowdhury and Dey, 2016). Additionally, high pollutants concentration may also lead to urban and regional haze, deleterious impacts on regional ecosystem, crop yield and climate change (Krishnakumar et al., 2004; Ramanathan et al., 2007;
Semeena et al...Air Pollution: Why Does It Matter?
International Journal of Earth and Atmospheric Science | January-March, 2018 | Volume 05 | Issue 01 | Pages 01-12 © 2018 Jakraya
6
Fig 4: Location of the monitoring stations and annual mean mass concentration of PM2.5 worldwide in nearly 3000
human settlements, 2008-2015. [Source: WHO, 2016] Ramanathan and Feng, 2009; Tie et al., 2016).
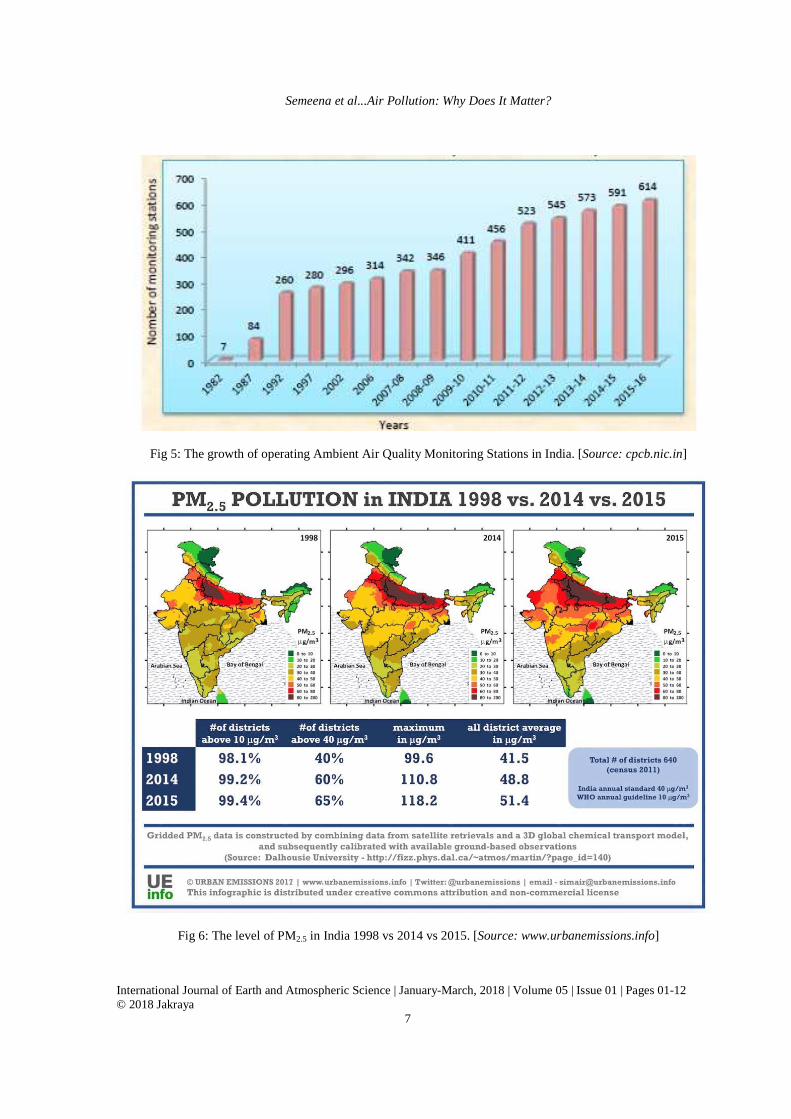
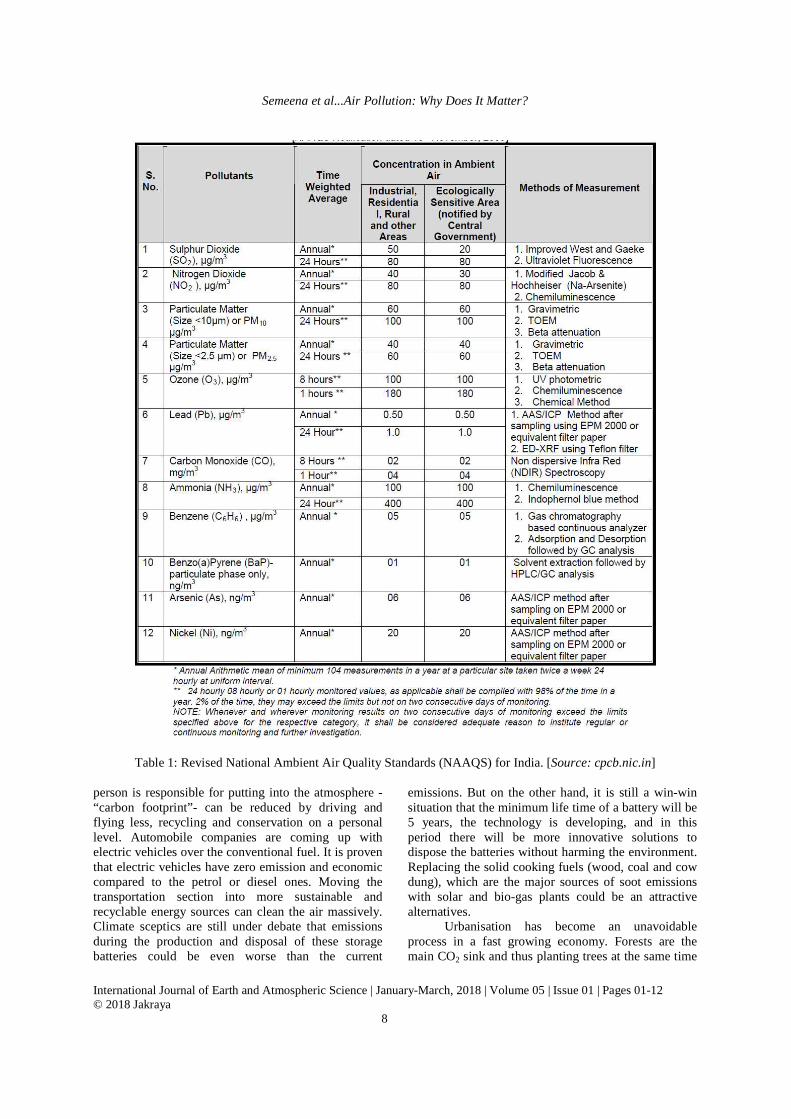
Air pollution in India is mainly caused by biomass/biofuel burning, burning of crop residue in agriculture fields on a large scale, use of adulterated fuel, emission from vehicles and traffic congestion. In order to prevent, control and reduce air pollution, the Air Act (Prevention and Control of Pollution) was enacted in 1981. The Central Pollution Control Board (CPCB) initiated a National Ambient Air Quality Monitoring (NAAQM) program in the year 1984 with 7 different stations. Subsequently, the program was re-named as National Air Quality Monitoring Program (NAMP). The growth of operating Ambient Air Quality Monitoring Stations in the country is given in Figure 5 (CPCB, 2016). The ambient air quality-monitoring network has 614 operating stations covering 254 cities/towns in 28 States and 5 Union Territories as on March 2016. As a policy guideline, the National Ambient Air Quality Standards (NAAQS) is developed by CPCB for India, which regulates the effect of human activity upon the environment so that pollutant emission into the air can be regulated. The revised NAAQS notified on November 2009 is depicted in Table 1. The maps below (for India) in figure 6 shows the PM2.5 levels extracted from a global database (Donkelaar et al., 2016). In the year 1998, 98.1% and 40% districts of India is exposed to the PM2.5 levels beyond 10 µg/m3 (WHO annual standard)
and 40 µg/m3 (Indian annual standard), respectively.
However, it was increased to 99.2% and 60% in the year 2014 and 99.4% and 65% in the year 2015. 7. What Needs To Be Done
A reduction in greenhouse gases could be achieved by implementing air quality policies. A variety of measures needs to be taken to curb global warming. Governments are implementing policies to limit the emissions of carbon dioxide and other green house gases on a larger scale. The 1997 Kyoto Protocol is the world’s only legally binding treaty to reduce greenhouse gas emissions which is an agreement under the United Nations Framework Convention on Climate Change (UNFCC). Only 15 countries have signed the protocol in the beginning during first commitment period (2008-12) and more countries joined (29 countries and the EU now) the effort during the second commitment period (2013-20). Progress made during this period shows that EU emissions were reduced by 23% between 1990 and 2016. The Paris Agreement is another such effort ratified on November 4, 2016 which is a voluntary agreement among 118 nations over the world to combat climate change.
We do not need to depend on the government to enforce rules for protecting the environment we live in. Every one of us has the responsibility to save our environment and there is a lot each individual can do. Conserving our environment is the best solution to tackle climate change. The amount of carbon dioxide a
Semeena et al...Air Pollution: Why Does It Matter?
International Journal of Earth and Atmospheric Science | January-March, 2018 | Volume 05 | Issue 01 | Pages 01-12 © 2018 Jakraya
7
Fig 5: The growth of operating Ambient Air Quality Monitoring Stations in India. [Source: cpcb.nic.in]
Fig 6: The level of PM2.5 in India 1998 vs 2014 vs 2015. [Source: www.urbanemissions.info]
Semeena et al...Air Pollution: Why Does It Matter?
International Journal of Earth and Atmospheric Science | January-March, 2018 | Volume 05 | Issue 01 | Pages 01-12 © 2018 Jakraya
8
Table 1: Revised National Ambient Air Quality Standards (NAAQS) for India. [Source: cpcb.nic.in] person is responsible for putting into the atmosphere - “carbon footprint”- can be reduced by driving and flying less, recycling and conservation on a personal level. Automobile companies are coming up with electric vehicles over the conventional fuel. It is proven that electric vehicles have zero emission and economic compared to the petrol or diesel ones. Moving the transportation section into more sustainable and recyclable energy sources can clean the air massively. Climate sceptics are still under debate that emissions during the production and disposal of these storage batteries could be even worse than the current
emissions. But on the other hand, it is still a win-win situation that the minimum life time of a battery will be 5 years, the technology is developing, and in this period there will be more innovative solutions to dispose the batteries without harming the environment. Replacing the solid cooking fuels (wood, coal and cow dung), which are the major sources of soot emissions with solar and bio-gas plants could be an attractive alternatives.
Urbanisation has become an unavoidable process in a fast growing economy. Forests are the main CO2 sink and thus planting trees at the same time
Semeena et al...Air Pollution: Why Does It Matter?
International Journal of Earth and Atmospheric Science | January-March, 2018 | Volume 05 | Issue 01 | Pages 01-12 © 2018 Jakraya
9
can control the greenhouse warming to some extent. Bhutan - located between India and China, the two most polluted countries in the world -is the best example which is the only carbon negative country in the world. More than 72% of the landmass in Bhutan is covered by forest, which absorbs 6 million tons of carbon annually while it is producing only 1.5% million tons. The government of Bhutan has implemented strict policies to keep the country carbon neutral by banning export logging, that the forest areas of the country should not fall below 60%, and to generate free hydroelectric power from the countries’ many rivers over the environmentally hazardous fossil fuels. It is as simple as that.
Looking at all the aspects considered in this review, it is important for researchers to continue working in different dimensions associated with air pollution. Some of the research works done by different researchers are included in the present issue that contains five technical articles. It covers research works related to aerosols and their characteristics, haze and fog episodes, association of aerosols with extreme
events like floods, droughts and heat waves and related meteorological aspects. The topics covered show the significance of air pollutants and their association with local and regional weather and climate. Although it did not cover health impact related analysis, it is expected to provide readers sufficient amount of understanding regarding current state of research related to air pollution and its association with weather and climate over India and the world. 8. Concluding Remarks
Different aspects mentioned and discussed in sections 2 – 7 motivated the authors to bring out a special issue on air pollution and its effects. The present issue (i.e. issue 1 of volume 5) of the journal addresses some of the challenging issues and considers related research work carried out presently all over the world. The editors and authors expect that readers would find the present issue to be interesting and provide them a good sense on core and applied research on ‘air pollution’.
References Abba EJ, Unnikrishnan S and Kumar R (2012). Chemical
characterization and mass closure of fine aerosol for different land use patterns in Mumbai city. AAQR 12, 61-72.
AMAP: AMAP Assessment (2002). The influence of global change on arctic contaminant pathways to within, and from the arctic. Arctic Monitoring and Assessment Programme (AMAP) Oslo, Norway 65. pp. 2003.
Auffhammer M, Ramanathan V and Vincent JR (2006). Integrated model shows that atmospheric brown clouds and greenhouse gases have reduced rice harvests in India. PNAS, 103(52): 19668-19672.
Baker JP, Van Sickle J, Gagen CJ, DeWalle DR, Sharpe WE, Carline RF, Baldigo BP, Murdoch PS, Bath DW, Kretser WA, Simonin HA and Wigington PJ (1996). Episodic acidification of small streams in the North eastern United States: Effects on fish populations, Ecology Applications, 6(2): 422-437.
Bakken V and Tertitski GM (2000). Glaucous gull (Larus hyperboreus). In; the status of marine birds breeding in the Barents Sea region (eds. Anker-Nilssen T, Bakken V, Bianki V, Golovkein A, Strøm H and Tatarinkova L). Norsk Polarinstitutt Rapportserie, 113: 94-96.
Balakrishnan K, Ramaswamy P, Sambandam S, Thangavel G, Ghosh S, Johnson P and Thanasekaraan V (2011). Air pollution from household solid fuel combustion in India: an overview of exposure and health related information to inform health research priorities. Global Health Action, 4(1): 5638.
Barron MG, Galbraith H and Beltman D (1995). Comparative reproductive and de-velopmental toxicology of PCBs in birds. Comparative Biochemistry and Physiology, 112C: 1-14.
Berggren P, Ishaq R, Zebühr Y, Näf C, Bandh C and Broman D (1999). Pattern and levels of organochlorines (DDTs, PCBs, non-ortho PCBs and PCDD/Fs) in male harbour porpoises (Phocoena phocoena) from the Baltic Sea, the Kat- tegat-Skagerrak Seas and the west coast of Norway. Marine Pollution Bulletin, 38: 1070-1084.
Bernhoft A, Skaare JU, Wiig Ø, Derocher AE and Larsen HJS (2000). Possible immunotoxic effects of organochlorines in polar bears (Ursus maritimus) at Svalbard. Journal of Toxicology and Environmental Health, A, 59: 561-574.
Bernhoft A, Wiig Ø and Skaare JU (1997). Organochlorines in polar bears (Ursus maritimus) at Svalbard. Environmental Pollution, 96: 1-16.
Bogan JA and Bourne WRP (1972). Organochlorine levels in Atlantic seabirds. Nature, 240-358.
Burns DA, Aherne J, Gay DA and Lehman CMB (2016). Acid rain and its environmental effects: Recent scientific advances, Atmosphere Environment, 146: 1-4.
Casiday R and Frey R (1998). Tutorial on Acid Rain - Inorganic Reactions Experiment. Washington University. http://www. chemistry. wustl. edu/∼ edudev/LabTutorials/Water/FreshWater/acidrain.
Chameides WL, Kasibhatla PS, Yienger J and Levy IIH (1994). Growth of continental-scale metro-agro-plexes, regional ozone pollution and world food production, Science, 264(5155): 74-77.
Chameides WL, Yu H, Liu SC, Bergin M, Zhou X, Mearns L, Wang G, Kiang CS, Saylor RD, Luo C, Huang YA Steiner A and Giorgi F (1999). Case study of the effects of atmospheric aerosols and regional haze on agriculture: An opportunity to enhance crop yields in China through emission controls?. PNAS, 96(24): 13626-13633.
Semeena et al...Air Pollution: Why Does It Matter?
International Journal of Earth and Atmospheric Science | January-March, 2018 | Volume 05 | Issue 01 | Pages 01-12 © 2018 Jakraya
10
Charlson RJ, Langner J, Rodhe H, Leovy CB and Warren SG (2005). Perturbation of the Northern Hemisphere radiative balance by backscattering from anthropogenic sulfate aerosols, Tellus, 43AB: 152-163.
Chowdhury, Sourangsu and D Sagnik. Cause-specific premature death from ambient PM2.5 exposure in India: Estimate adjusted for baseline mortality. Environment International, 91(2016): 283-290.
Cohen AJ, Brauer M, Burnett R, Anderson HR, Frostad J, Estep K, Balakrishnan K, Brunekreef B, Dandona L, Dandona R, Feigin V, Freedman G, Hubbell B, Jobling A, Kan H, Knibbs L, Liu Y, Martin R, Morawska L, Pope CA III, Shin H, Straif K, Shaddick G, Thomas M, van Dingenen R, van Donkelaar A, Vos T, Murray CJ L and Forouzanfar MH (2015). Estimates and 25-year trends of the global burden of disease attributable to ambient air pollution: an analysis of data from the Global Burden of Diseases Study 2015. The Lancet 2017, 389(10082): 1907-1918.
CPCB (Central Pollution Control Board), Annual Report-2015-16.
Darveau MJ, Martel J, DesGranges J-L and Maufette Y (1997). Associations between forest decline and bird and insect communities in northern hardwoods, Canad. Journal of Forestry Research, 27: 876-882.
de Wit C, Fisk A, Hobbs K, Muir D, Gabrielsen G, Kallenborn R, Krahn M, Norstrom R and Skaare J (2004). AMAP Assessment 2002. Persistent organic pollutants in the arctic. Arctic Monitoring and Assessment Program report. Oslo, Norway, 310.
Dholakia HH, Bhadra D and Garg A (2014). Short term association between ambient air pollution and mortality and modification by temperature in five Indian cities. Atmospheric Environment, 99: 168-174.
Dinar A, Mendelsohn R, Evenson R, Parikh J, Sanghi A, Kumar K, McKinsey J and Lonergan S (1998). Measuring the Impact of Climate Change on Indian Agriculture (The World Bank, Washington, DC) Technical Paper 402.
Directive 2004/107/EC of the European Parliament and of the Council of 15 December 2004 relating to aresenic, cadmium, mercury, nikel and polycyclic aromatic hydrocarbons in ambient air, Official Journal of the EU, 2004.
Directive 2008/50/EC of the European Parliament and of the Council of 21 May 2008 on ambient air quality and cleaner air for Euorpe, Official Journal of the EU, 2008.
Donkelaar Av, RV Martin, M Brauer, NC Hsu, RA Kahn, RC Levy, A Lyapustin, AM Sayer and DM Winker (2016). Global estimates of fine particulate matter using a combined geophysical-statistical method with information from satellites, models, and monitors, Environment Science Technology, 50(7): 3762-3772.
Gabrielsen GW, Skaare JU, Polder A and Bakken V (1995). Chlorinated hydrocarbon in glaucous gulls (Larus hyperboreus ) in the southern part of Svalbard, Science of the Total Environment, 160/161: 337-346.
Garner GW, Skaare JU and Wiig Ø (2001). Geographic variation of PCB congeners in polar bears (Ursus
maritimus) from Svalbard east to the Chukchi Sea, Polar. Biology, 24: 231-238.
Graveland JR (1998). Effects of acid rain on bird populations, Environmental Reviews, 6: 41-54.
Gurjar BR, Khaiwal R and Nagpure AS (2016). Air pollution trends over Indian megacities and their local-to-global Implications; Atmosphere Environment, 142: 475-495.
Guttikunda SK and Goel R (2013). Health impacts of particulate pollution in a megacity-Delhi, India. Environmental Development, 6: 8-20.
Guttikunda SK and Jawahar P (2012). Application of SIM-air modeling tools to assess air quality in Indian cities. Atmospheric Environment, 62: 551-561.
Guttikunda SK and Kopakka RV (2014). Source emissions and health impacts of urban air pollution in Hyderabad, India. Air Quality, Atmosphere and Health, 7(2): 195-207.
Haines TA, Norton SA, Kahl JS, Fay CW and Pauwels SJ (1990). Intensive studies of stream fish populations in Maine, Ecology Research Series, U.S. Environmental Protection Agency, Washington D.C., 354.
Heard RM, Sharpe WF, Carline RF and Kimmel WG (1997). Episodic acidification and changes in fish diversity in Pennsylvania headwater streams, Transactions of the American Fisheries Society, 126: 977-984.
Hogrefe C, Biswas J, Lynn B, Civerolo K, Ku J-Y, Rosenthal J, Rosenzweig C, Goldberg R and Kinny PL (2004). Simulating regional-scale ozone climatology over the eastern United States: Model evaluation results, Atmosphere Environment, 38: 2627-2638.
Huang H-C, Lin J, Tao Z, Choi H, Patten K, Kunkel K, Xu M, Zhu J, Liang X-Z, Williams a, Caughey M, Wuebbles DJ and Wang J (2008). Impacts of long-range transport of global pollutants and precursor gases on U.S. air quality under future climatic conditions, Journal of Geophysical Research, 113: D19.
Hulme M, Osborn TJ and Johns TC (1998). Precipitation sensitivity to global warming: Comparison of observations with HadCM2 simulations, Geophysical Research Letter, 25(17): 3379-3382.
IDAHO, Criteria Pollutants, Report on Air quality and pollutants, Department of Environmenal Quaity, IDAHO.
Integovernmental panel of climate change, climate change (2007). The physical science basis. Contribution of working group i to the fourth assessment report of the intergovernmental panel on climate change, edite by S. Solomon et al., Cambridge University Press, Cambridge, U.K., 2007.
Karim Z, Hussain SG and Ahmed AU (1999). Climate change vulnerability of crop agriculture. In: Huq S, Karim Z, Asaduzzaman M and Mahtab F (eds) Vulnerability and adaptation to climate change for Bangladesh. Springer, Dordrecht.
Krishna Kumar K, Rupa Kumar K, Ashrit RG, Deshpande NR and Jansen JWH (2004). Climate impacts on Indian agriculture, International Journal of Climatology, 24(11): 1375-1393.
Krzyzanowski M and Cohen A (2008). Update of WHO air quality guidelines. Air Quality, Atmosphere and Health, 1(1): 7-13.
Semeena et al...Air Pollution: Why Does It Matter?
International Journal of Earth and Atmospheric Science | January-March, 2018 | Volume 05 | Issue 01 | Pages 01-12 © 2018 Jakraya
11
Larssen T, Lydersen E, Tang D, He Y, Gao J, Liu H, Duan L, Seip HM, Vogt RD, Mulder J, Shao M, Wang Y, Shang H, Zhang X, Solberg S, Aas W, Okland T, Eilertsen O, Angell V, Li Q, Zhao D, Xiang R, Xiao J and Luo J (2006). Acid Rain in China, Environment Science Technology, 40(2): 418-425.
Lau KM, Kim MK and Kim KM (2006). Asian summer monsoon anomalies induced by aerosol direct forcing: the role of the Tibetan Plateau Climate. Dynamics, 26: 855-64.
Lau KM, Kim MK, Kim KM and Lee WS (2010). Enhanced surface warming and accelerated snow melt in the Himalayas and Tibetan Plateau induced by absorbing aerosols. Environment Research Letter, 5 025204.
Lim SS, Vos T, Flaxman AD, Danaei G, Shibuya K, Adair-Rohani AlMazroa MA, Amann M, Anderson HR, Andrews KG and Aryee M (2013). A comparative risk assessment of burden of disease and injury attributable to 67 risk factors and risk factor clusters in 21 regions, 1990-2010: a systematic analysis for the Global Burden of Disease Study 2010. The Lancet, 380(9859): 2224-2260.
Lin M, Fiore AM, Horowits LW, Cooper OR, Naik V, Holloway J, Johnson BJ, Middlebrook AM, Oltmans SJ, Pollack IB, Ryerson TB, Warner JX, Wiedinmyer C, Wilson J and Wyman B (2012). Transport of Asian ozone pollution into surface air over the western United States in spring, Journal of Geophysical Research, 117.
Lin M, Holloway T, Carmichael GR and Fiore AM (2010). Quantifying pollution inflow and outflow over East Asia in spring with regional and global models, Atmosphere Chemical Physics, 10: 4221-4239.
Liu H, Bartonova A, Schindler M, Sharma M, Behera SN, Katiyar K and Dikshit O (2013). Respiratory disease in relation to outdoor air pollution in Kanpur, India. Archives of Environmental and Occupational Health, 68: 204-217.
Ma J, Hung H, Tian C and Kallenborn R (2011). Revolatalisation of persistent organic pollutants in the Arctic induced by climange change, Nature Climate Change, 1(5): 225-260.
Macdonald RW, Barrie LA, Bidleman TF, Diamond ML, Gregor DJ, Semkin RG, Strachan WMJ, Li YF, Wania F, Alaee M, Alexeeva LB, Backus SM, Bailey R, Bewers JM, Gobeil C, Halsall CJ, Harner T, Hoff JT, Jantunen LMM, Lockhart WL, Mackay D, Muir DCG, Pudykiewicz J, Reimer KJ, Smith JN, Stern GA, Schroeder WH, Wagemann R and Yunker MB (2000). Contaminants in the Canadian Arctic: 5 years of progress in understanding sources occurrence and pathways. Science of the Total Environment, 254: 93-234.
Maji S, Ahmed S and Siddiqui WA (2015). Air quality assessment and its relation to potential health impacts in Delhi, India. Current Science, 109(5): 902-909.
Maniero TG (1996). The effects of air pollutants on wildlife and implications in Class 1 areas, National Park Service Air Resources Division, http://www.aqd.nps.gov/ard/wildl.htm.
Murazaki K and Hess P (2006). How does climate change contribute to surface ozone change over the United States?, Journal of Geophysical Research, 111.
Pandve HT (2008). The Asian Brown Cloud, Indian Journal of Occupational and Environmental Medicine, 12(2): 93-95.
Pathak H, Ladha JK, Aggarwal PK, Peng S, Das D, Singh Y, Singh B, Kamra SK, Mishra B, Sastri ASRAS, Aggarwal HP, Das DK and Gupta RK (2003). Trends of climatic potential and on-farm yields of rice and wheat in the Indo-Gangetic Plains, Field Crops. Research, 80(3): 223-234.
Peng S, Huang J, Sheehy JE, Laza RC, Visperas RM, Zhong X, Centeno GS, Khush GS and Cassman KG (2004). Rice yields decline with higher night temperature from global warming, PNAS, 101(27): 9971-9975.
Prasad D and Sanyal S (2016). A study of air quality and its effect on health: A geographical perspective of Lucknow city. Space and Culture, India, 4(1): 51-64.
Ramanathan V and Feng Y (2009). Air pollution, greenhouse gases and climate change: Global and regional perspectives. Atmosphere Environment, 43: 37-50.
Ramanathan V, Chung C, Kim D, Bettge T, Buja L, Kiehl JT, Washington WM, Fu Q, Sikka DR and Wild M (2005). Atmospheric brown clouds: Impacts on South Asian climate and hydrological cycle. PNAS, 102(15): 5326-5333.
Ramanathan V, Ramana MV, Roberts G, Kim D, Corrigan C, Chung C and Winker D (2007). Warming trends in Asia amplified by brown cloud solar absorption. Nature, 448: 575-578.
Rekacewics P (2003). Strategic Plan for the U.S. Climate Change Science Program.
Rizwan SA, Nongkynrih B and Gupta SK (2013). Air pollution in Delhi: its magnitude and effects on health. Indian journal of community medicine: official publication of Indian Association of Preventive and Social Medicine, 38(1): 4.
Roeckner E, Bengtsson L, Feichter J, Lelieveld J and Rodhe H (1999). Transient climate change simulations with a coupled atmosphere-ocean GCM Including the Tropospheric Sulfur Cycle, Journal Climate, 12(10): 3004-3032.
Schreiber KR (1995). Acidic deposition from our living resources: A report to the nation on the distribution, abundance, and health of U.S. plants, animals and ecosystems, National Biology Service, http://biology.usgs.gov/s+t/noframe/u204.htm.
Srimuruganandam B and Shiva Nagendra SM (2012). Application of positive matrix factorization in characterization of PM10 and PM2.5 emission sources at urban roadside. Chemosphere, 88: 120-130.
Srivastava AK, Singh S, Tiwari S and Bisht DS (2012). Contribution of anthropogenic aerosols in direct radiative forcing and atmospheric heating rate over Delhi in the Indo-Gangetic Basin. Environmental Science and Pollution Research, 19: 1144-1158.
The air (prevention and control of pollution) act, 1981, http://www.moef.nic.in/legis/air/air1.html.
Tie X, Ru-Jin H, Wenting D, Junji C, Xin L, Xiaoli Su, Shuyu Z, Qiyuan W and Guohui Li (2016). Effect
Semeena et al...Air Pollution: Why Does It Matter?
International Journal of Earth and Atmospheric Science | January-March, 2018 | Volume 05 | Issue 01 | Pages 01-12 © 2018 Jakraya
12
of heavy haze and aerosol pollution on rice and wheat productions in China. Scientific Reports, 6: 29612.
United States Environmental Protection Agency (EPA), Ozone pollution, ecosystem effects of ozone pollution.
United States Environmental Protection Agency (EPA), Sulfur Dioxide (SO2) Pollution.
Villalobos AM, Amonov MO, Shafer MM, Devi JJ, Gupta T, Tripathi SN, Rana KS, Mckenzie M, Bergin MH and Schauer JJ (2015). Source apportionment of carbonaceous fine particulate matter (PM2.5) in two contrasting cities across the Indo-Gangetic plain. Atmospheric Pollution Research, 6: 398-405.
Wang-Andersen G, Skaare JU, Prestrud P and Steinnes E (1993). Levels and congener pattern of PCBs in Arctic fox, Alopex lagopus, in Svalbard. Environment Pollution, 82: 269-275.
Watt WD, Scott CD, Zamora PJ and White WJ (2000). Acid toxicity levels in Nova Scotian Rivers have not declined in synchrony with the decline in sulfate levels, Water Air and Soil Pollution, 118(3-4): 203-229.
WHO (2016). World Health Organisation Report on Ambient outdoor air quality in cities.
Zhang J, Reid JS, Alfaro-Contreras R and Xian P (2017). Geophysical Research Letter, 44(6): 2941-2948.
![Mercury in Crematoria Using Atomic Fluorescence …...Using Atomic Fluorescence Spectrometry Cremation No. Mean Gas Phase Concentration [Hg 2+] /µg m-3 [Hg to al] /µg m-3 Max. Oxidised](https://img.pdfslide.net/doc/110x75/60d91b2c60f2d47a6430f3ae/mercury-in-crematoria-using-atomic-fluorescence-using-atomic-fluorescence-spectrometry.jpg)


![Bericht zu PM10-Tagesmittelwerten und Überschreitungen …...28.04.2011 PM10 [µg/m³] 1 58 05.11.2011 PM10 [µg/m³] 5 62 12.11.2011 PM10 [µg/m³] 3 102 23.11.2011 PM10 [µg/m³]](https://img.pdfslide.net/doc/110x75/5feb2fd0c3ceb232dc68d90f/bericht-zu-pm10-tagesmittelwerten-und-oeberschreitungen-28042011-pm10-gm.jpg)