Embed Size (px)
Citation preview
ALDI household expenditure report
1
ALDI household expenditure report How economic pressures and societal
trends are impacting grocery spending November 2017
ALDI household expenditure report
2
Contents
Executive summary 2
1 The Australian household 3
1.2 Household income 4 1.3 Household wealth 5 1.4 Home ownership 6 1.5 Household spending 7
2 Budgetary pressure: Australians feeling the pinch 10
3 Grocery spending on the chopping block 12
3.1 The rise of private labels 13
4 Grocery spending trends 15
4.1 Where do we get our food? 15 4.2 How much do we spend? 18
5 The modern necessities 21
5.1 Catered food 21 5.2 Subscription services 22
References 24
Appendix A : Survey 25
2
Executive summary
2017 is the year of the millionaire in Australia. For the first time, the
average Australian household has more than $1 million in net wealth, and
this wealth is rising.
But are we the poorest millionaires? Much of the recent gain in wealth has
come from rising asset prices. But our incomes have been stagnant; the
average household is only slightly better off in terms of income today than
they were in 2013. Australian households are increasingly asset rich,
but cash poor.
This report discusses what this macroeconomic environment means for
households. It looks at what households consider a necessity, how they are
spending their stretched budgets, and their views on the future.
Our research into household spending, including a new survey of over
1,000 Australian households, explores the spending patterns of
Australian households; how these have evolved over time, what they prefer
to spend on, and how confident they are about paying for their daily needs.
Our research finds that 37% of households are now concerned about
their ability to pay for their expenses, like bills and household costs, up
from 31% two years ago. This is expected to increase to 40% by 2019.
For many households, this budget pressure means that something has to
give. The pressure is expected to intensify – two in five Australian
households expect to be worried about their ability to pay their bills two
years from now. And consumers say that groceries are on the chopping
block. One in three households would fund an increase in day to day
living costs by cutting back on grocery spending, by buying less or
switching to private labels.
These findings are in accordance with broader research, showing that 7.2%
of all Australian households are feeling mortgage stress and 11.5%
are feeling rental stress, according to Census 2016. And the costs of
other necessities are rising. For example, despite the supermarket price
wars, grocery retail prices have seen growth of 2.6% on average over the
last decade1, and most households expect grocery prices to continue rising
over the next two years. In the context of slow wage growth, Australian
households are feeling the pinch now more than ever.
The other part of the story is that spending patterns are changing. For one,
entertainment subscription services are becoming the norm for many.
Netflix was only introduced to Australia in 2015, yet today 39% of survey
respondents subscribe to this and similar services. Spending patterns on
food are also changing: in the past year alone, online spending on
takeaway food has grown by over 30% in the past year. For some,
these new services have become so essential that they would rather cut
back spending on groceries than on these services.
Deloitte Access Economics
1 (Australian Bureau of Statistics (ABS), 2017)
3
1 The Australian household
The Australian economy has experienced an unprecedented period of
prosperity, with over 26 years of continued economic growth.
But despite this economic achievement, many Australian households have
been feeling increased pressure on their weekly budgets in the last few
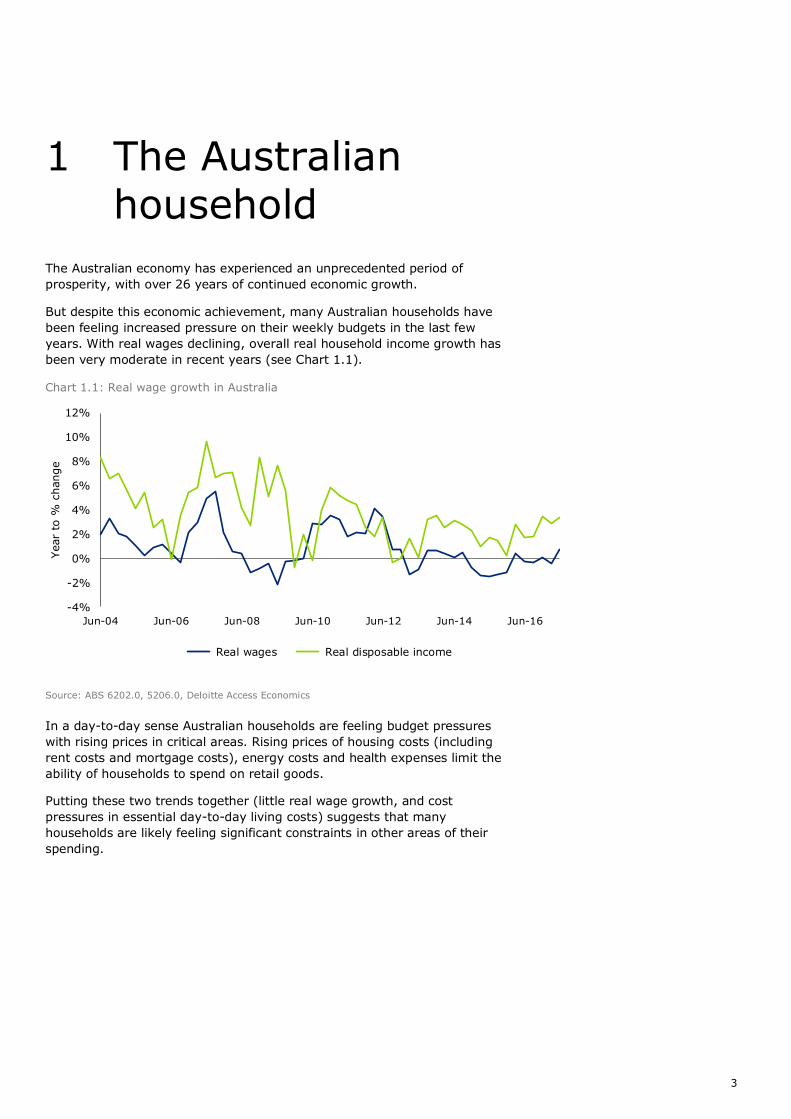
years. With real wages declining, overall real household income growth has
been very moderate in recent years (see Chart 1.1).
Chart 1.1: Real wage growth in Australia
Source: ABS 6202.0, 5206.0, Deloitte Access Economics
In a day-to-day sense Australian households are feeling budget pressures
with rising prices in critical areas. Rising prices of housing costs (including
rent costs and mortgage costs), energy costs and health expenses limit the
ability of households to spend on retail goods.
Putting these two trends together (little real wage growth, and cost
pressures in essential day-to-day living costs) suggests that many
households are likely feeling significant constraints in other areas of their
spending.
-4%
-2%
0%
2%
4%
6%
8%
10%
12%
Jun-04 Jun-06 Jun-08 Jun-10 Jun-12 Jun-14 Jun-16
Year
to %
change
Real wages Real disposable income
4
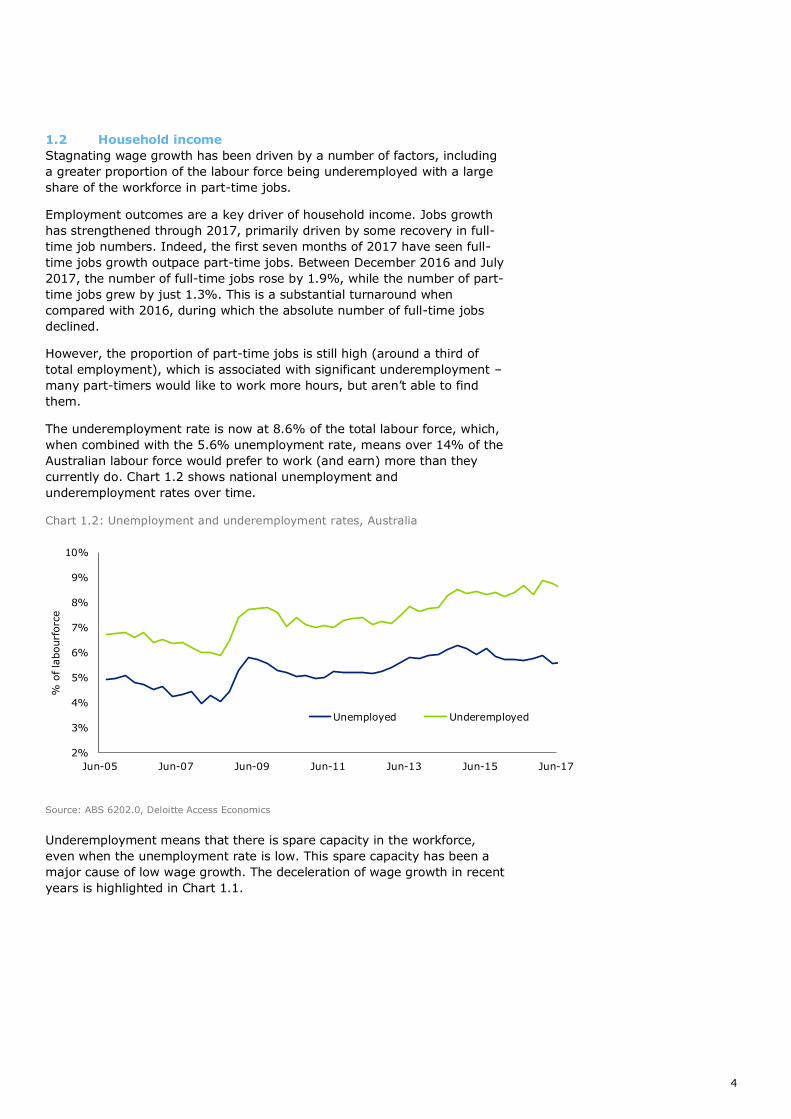
1.2 Household income
Stagnating wage growth has been driven by a number of factors, including
a greater proportion of the labour force being underemployed with a large
share of the workforce in part-time jobs.
Employment outcomes are a key driver of household income. Jobs growth
has strengthened through 2017, primarily driven by some recovery in full-
time job numbers. Indeed, the first seven months of 2017 have seen full-
time jobs growth outpace part-time jobs. Between December 2016 and July
2017, the number of full-time jobs rose by 1.9%, while the number of part-
time jobs grew by just 1.3%. This is a substantial turnaround when
compared with 2016, during which the absolute number of full-time jobs
declined.
However, the proportion of part-time jobs is still high (around a third of
total employment), which is associated with significant underemployment –
many part-timers would like to work more hours, but aren’t able to find
them.
The underemployment rate is now at 8.6% of the total labour force, which,
when combined with the 5.6% unemployment rate, means over 14% of the
Australian labour force would prefer to work (and earn) more than they
currently do. Chart 1.2 shows national unemployment and
underemployment rates over time.
Chart 1.2: Unemployment and underemployment rates, Australia
Source: ABS 6202.0, Deloitte Access Economics
Underemployment means that there is spare capacity in the workforce,
even when the unemployment rate is low. This spare capacity has been a
major cause of low wage growth. The deceleration of wage growth in recent
years is highlighted in Chart 1.1.
2%
3%
4%
5%
6%
7%
8%
9%
10%
Jun-05 Jun-07 Jun-09 Jun-11 Jun-13 Jun-15 Jun-17
% o
f la
bourf
orc
e
Unemployed Underemployed
5
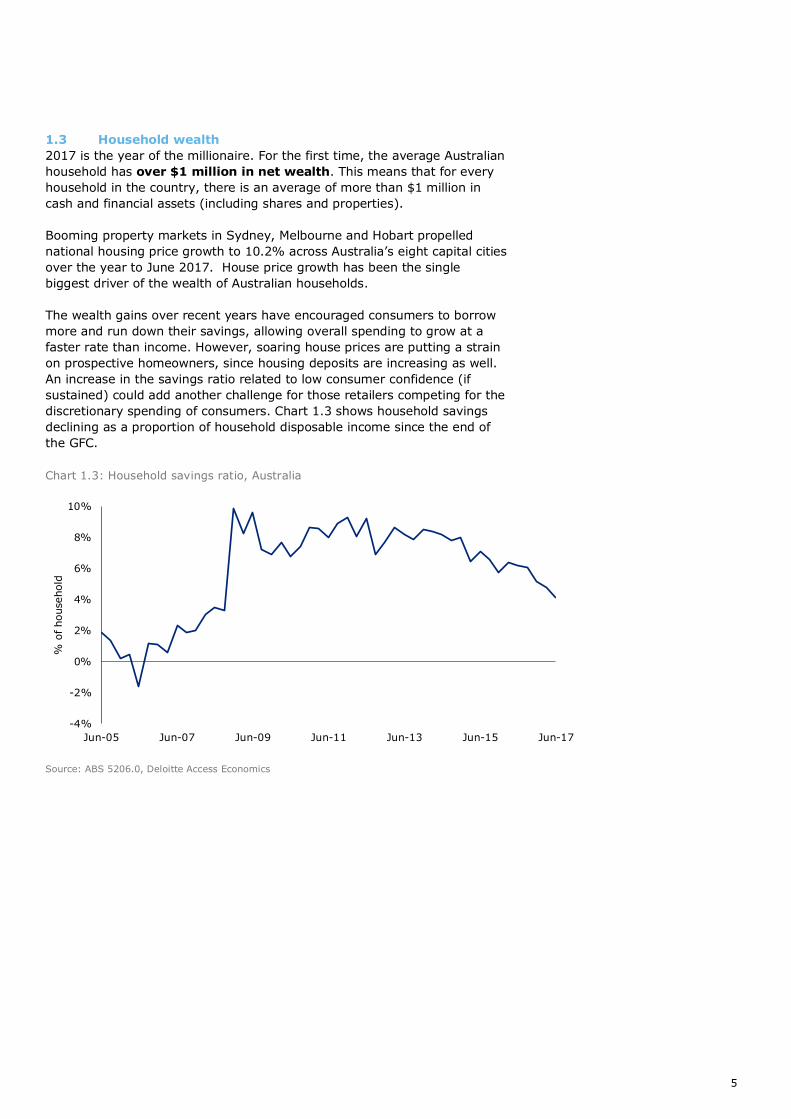
1.3 Household wealth
2017 is the year of the millionaire. For the first time, the average Australian
household has over $1 million in net wealth. This means that for every
household in the country, there is an average of more than $1 million in
cash and financial assets (including shares and properties).
Booming property markets in Sydney, Melbourne and Hobart propelled
national housing price growth to 10.2% across Australia’s eight capital cities
over the year to June 2017. House price growth has been the single
biggest driver of the wealth of Australian households.
The wealth gains over recent years have encouraged consumers to borrow
more and run down their savings, allowing overall spending to grow at a
faster rate than income. However, soaring house prices are putting a strain
on prospective homeowners, since housing deposits are increasing as well.
An increase in the savings ratio related to low consumer confidence (if
sustained) could add another challenge for those retailers competing for the
discretionary spending of consumers. Chart 1.3 shows household savings
declining as a proportion of household disposable income since the end of
the GFC.
Chart 1.3: Household savings ratio, Australia
Source: ABS 5206.0, Deloitte Access Economics
-4%
-2%
0%
2%
4%
6%
8%
10%
Jun-05 Jun-07 Jun-09 Jun-11 Jun-13 Jun-15 Jun-17
% o
f household
6
1.4 Home ownership
From home ownership to renting
Renting is as popular as home ownership now: the 2016 Census reveals
that there are almost as many people living in a rental property (32.2% of
the population) as there are people who own their property outright
(32.1%).
This has not always been the case though. In 25 years since the 1991
Census, those who own a home has fallen by around 10%, while rental
population has increased by around 4%. This transition reflects the housing
booming and the low savings rate, which has resulted in a greater share of
the population renting or paying off mortgages than owning homes.
The downside of the housing boom
As of 2016, there were still many households where the cost of rent was
placing more strain on household budgets than mortgage repayments.
Spending 30% or more of total household income on rent payments or
mortgage repayments can be used as indicators of rental stress and
mortgage stress respectively.
According to data from the 2016 Census, 11.5% of all Australian
households were in rental stress, while 7.2% were in mortgage stress; both
of which represent increases since 2011. On top of rent, prospective
homebuyer incomes are squeezed by the growing deposits required for new
homes. Because house prices have grown so rapidly in recent years, renters
who are looking to move into ownership also have to save more of their
income for a deposit than has been required in the past.
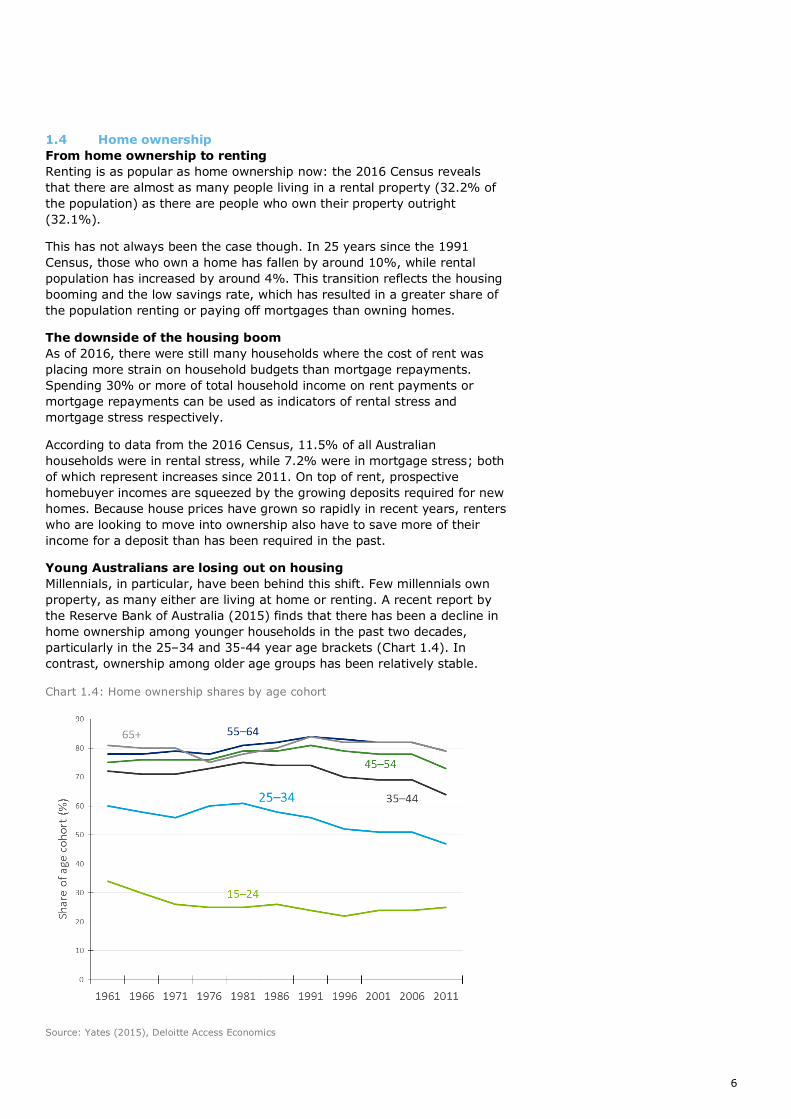
Young Australians are losing out on housing
Millennials, in particular, have been behind this shift. Few millennials own
property, as many either are living at home or renting. A recent report by
the Reserve Bank of Australia (2015) finds that there has been a decline in
home ownership among younger households in the past two decades,
particularly in the 25–34 and 35-44 year age brackets (Chart 1.4). In
contrast, ownership among older age groups has been relatively stable.
Chart 1.4: Home ownership shares by age cohort
Source: Yates (2015), Deloitte Access Economics
7
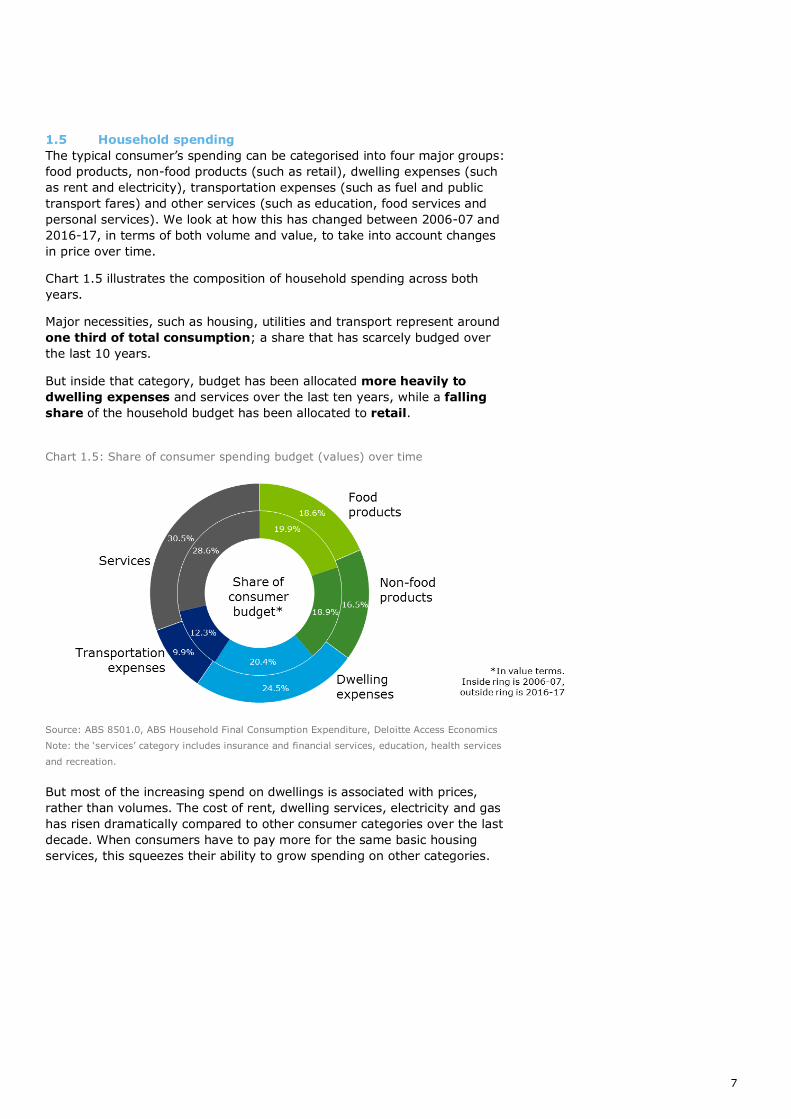
1.5 Household spending
The typical consumer’s spending can be categorised into four major groups:
food products, non-food products (such as retail), dwelling expenses (such
as rent and electricity), transportation expenses (such as fuel and public
transport fares) and other services (such as education, food services and
personal services). We look at how this has changed between 2006-07 and
2016-17, in terms of both volume and value, to take into account changes
in price over time.
Chart 1.5 illustrates the composition of household spending across both
years.
Major necessities, such as housing, utilities and transport represent around
one third of total consumption; a share that has scarcely budged over
the last 10 years.
But inside that category, budget has been allocated more heavily to
dwelling expenses and services over the last ten years, while a falling
share of the household budget has been allocated to retail.
Chart 1.5: Share of consumer spending budget (values) over time
Source: ABS 8501.0, ABS Household Final Consumption Expenditure, Deloitte Access Economics
Note: the ‘services’ category includes insurance and financial services, education, health services
and recreation.
But most of the increasing spend on dwellings is associated with prices,
rather than volumes. The cost of rent, dwelling services, electricity and gas
has risen dramatically compared to other consumer categories over the last
decade. When consumers have to pay more for the same basic housing
services, this squeezes their ability to grow spending on other categories.
8
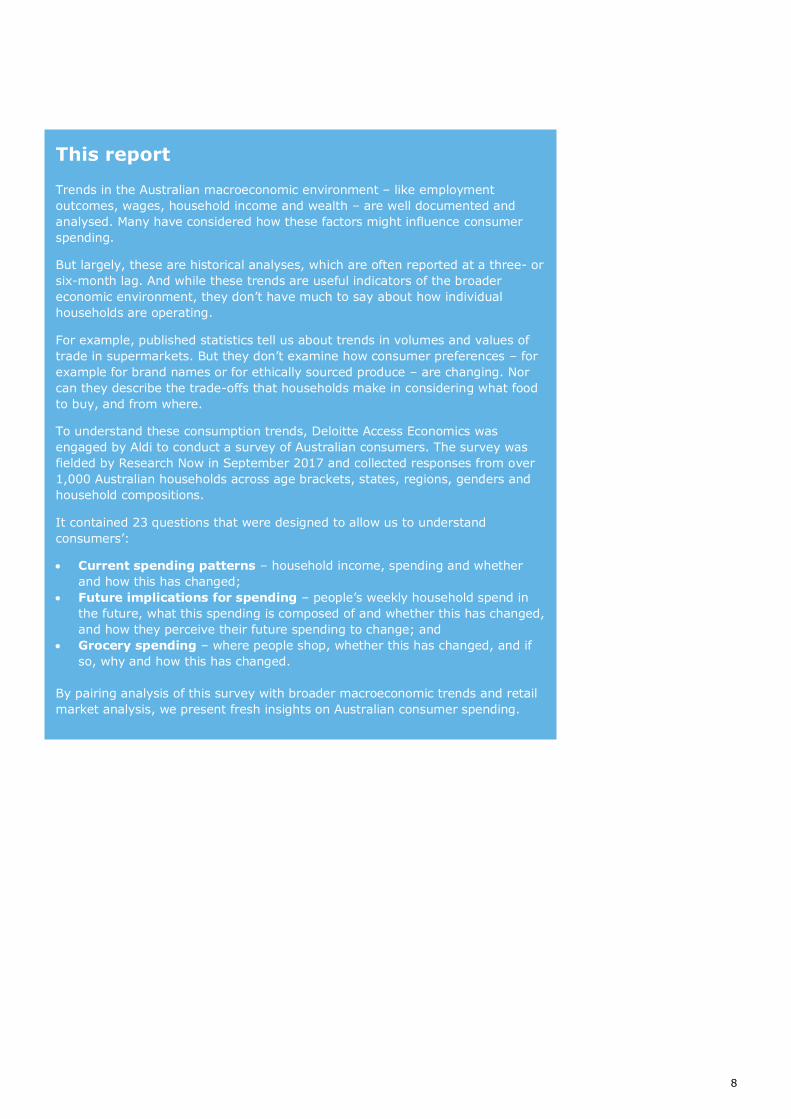
This report
Trends in the Australian macroeconomic environment – like employment
outcomes, wages, household income and wealth – are well documented and
analysed. Many have considered how these factors might influence consumer
spending.
But largely, these are historical analyses, which are often reported at a three- or
six-month lag. And while these trends are useful indicators of the broader
economic environment, they don’t have much to say about how individual
households are operating.
For example, published statistics tell us about trends in volumes and values of
trade in supermarkets. But they don’t examine how consumer preferences – for
example for brand names or for ethically sourced produce – are changing. Nor
can they describe the trade-offs that households make in considering what food
to buy, and from where.
To understand these consumption trends, Deloitte Access Economics was
engaged by Aldi to conduct a survey of Australian consumers. The survey was
fielded by Research Now in September 2017 and collected responses from over
1,000 Australian households across age brackets, states, regions, genders and
household compositions.
It contained 23 questions that were designed to allow us to understand
consumers’:
Current spending patterns – household income, spending and whether
and how this has changed;
Future implications for spending – people’s weekly household spend in
the future, what this spending is composed of and whether this has changed,
and how they perceive their future spending to change; and
Grocery spending – where people shop, whether this has changed, and if
so, why and how this has changed.
By pairing analysis of this survey with broader macroeconomic trends and retail
market analysis, we present fresh insights on Australian consumer spending.
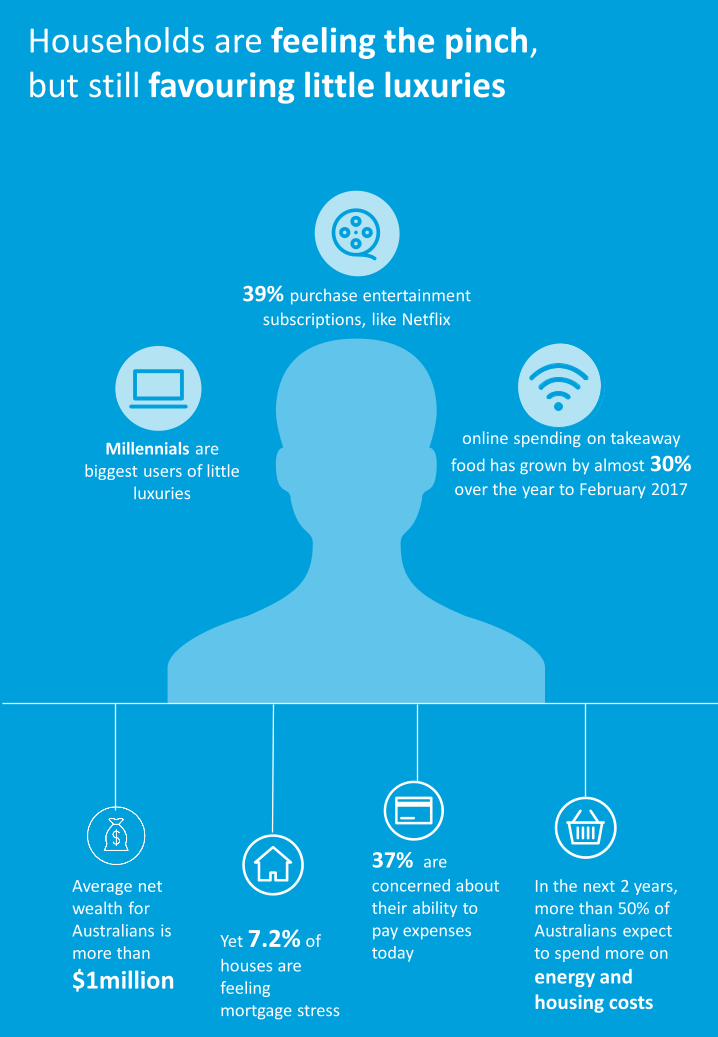
Average net wealth for Australians is more than
$1million
Yet 7.2% of
houses are feeling mortgage stress
37% are
concerned about their ability to pay expenses today
In the next 2 years, more than 50% of Australians expect to spend more on
energy and housing costs
39% purchase entertainment
subscriptions, like Netflix
Millennials are biggest users of little
luxuries
Households are feeling the pinch, but still favouring little luxuries
online spending on takeaway
food has grown by almost 30% over the year to February 2017
10
2 Budgetary pressure:
Australians feeling
the pinch
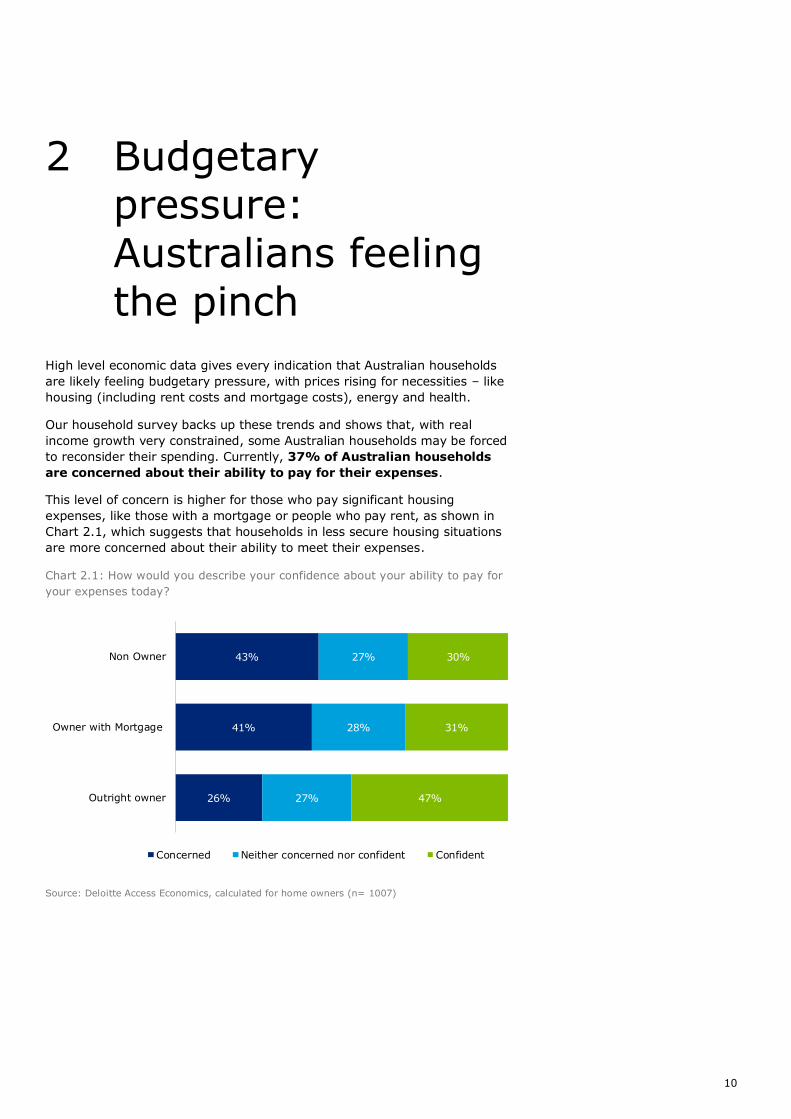
High level economic data gives every indication that Australian households
are likely feeling budgetary pressure, with prices rising for necessities – like
housing (including rent costs and mortgage costs), energy and health.
Our household survey backs up these trends and shows that, with real
income growth very constrained, some Australian households may be forced
to reconsider their spending. Currently, 37% of Australian households
are concerned about their ability to pay for their expenses.
This level of concern is higher for those who pay significant housing
expenses, like those with a mortgage or people who pay rent, as shown in
Chart 2.1, which suggests that households in less secure housing situations
are more concerned about their ability to meet their expenses.
Chart 2.1: How would you describe your confidence about your ability to pay for
your expenses today?
Source: Deloitte Access Economics, calculated for home owners (n= 1007)
26%
41%
43%
27%
28%
27%
47%
31%
30%
Outright owner
Owner with Mortgage
Non Owner
Concerned Neither concerned nor confident Confident
11
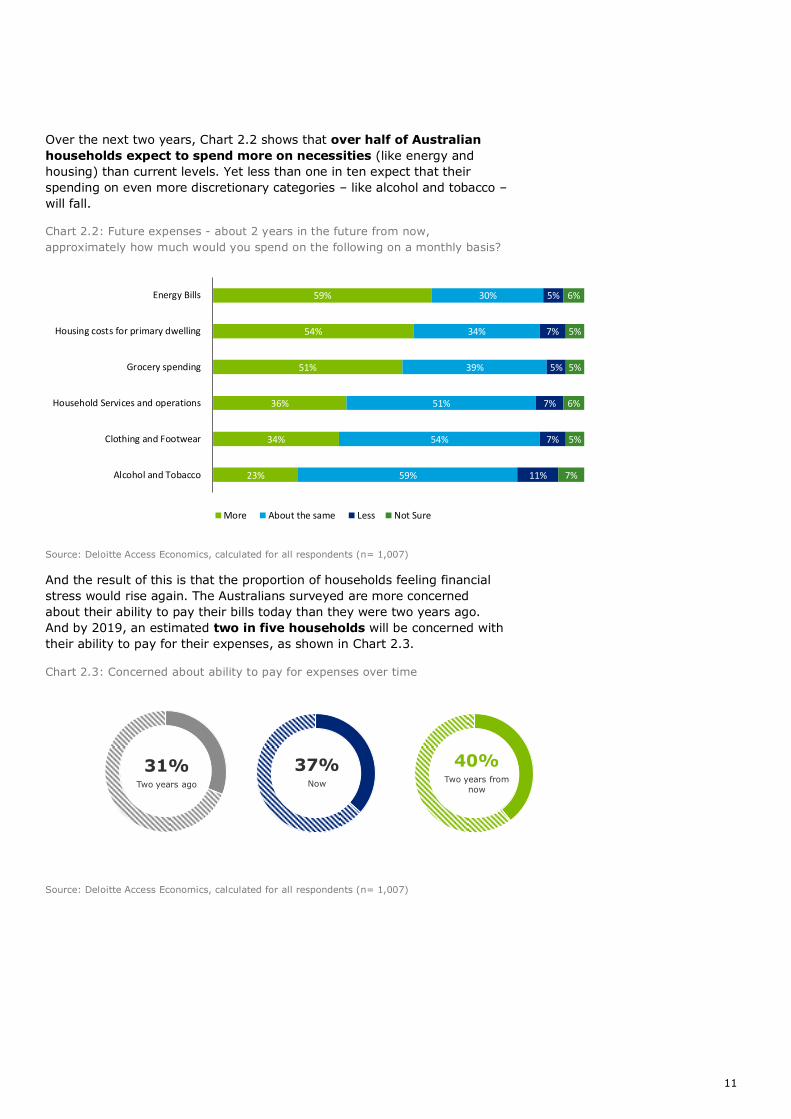
Over the next two years, Chart 2.2 shows that over half of Australian
households expect to spend more on necessities (like energy and
housing) than current levels. Yet less than one in ten expect that their
spending on even more discretionary categories – like alcohol and tobacco –
will fall.
Chart 2.2: Future expenses - about 2 years in the future from now,
approximately how much would you spend on the following on a monthly basis?
Source: Deloitte Access Economics, calculated for all respondents (n= 1,007)
And the result of this is that the proportion of households feeling financial
stress would rise again. The Australians surveyed are more concerned
about their ability to pay their bills today than they were two years ago.
And by 2019, an estimated two in five households will be concerned with
their ability to pay for their expenses, as shown in Chart 2.3.
Chart 2.3: Concerned about ability to pay for expenses over time
Source: Deloitte Access Economics, calculated for all respondents (n= 1,007)
59%
54%
51%
36%
34%
23%
30%
34%
39%
51%
54%
59%
5%
7%
5%
7%
7%
11%
6%
5%
5%
6%
5%
7%
Energy Bills
Housing costs for primary dwelling
Grocery spending
Household Services and operations
Clothing and Footwear
Alcohol and Tobacco
More About the same Less Not Sure
31%Two years ago
37%Now
40%Two years from
now
12
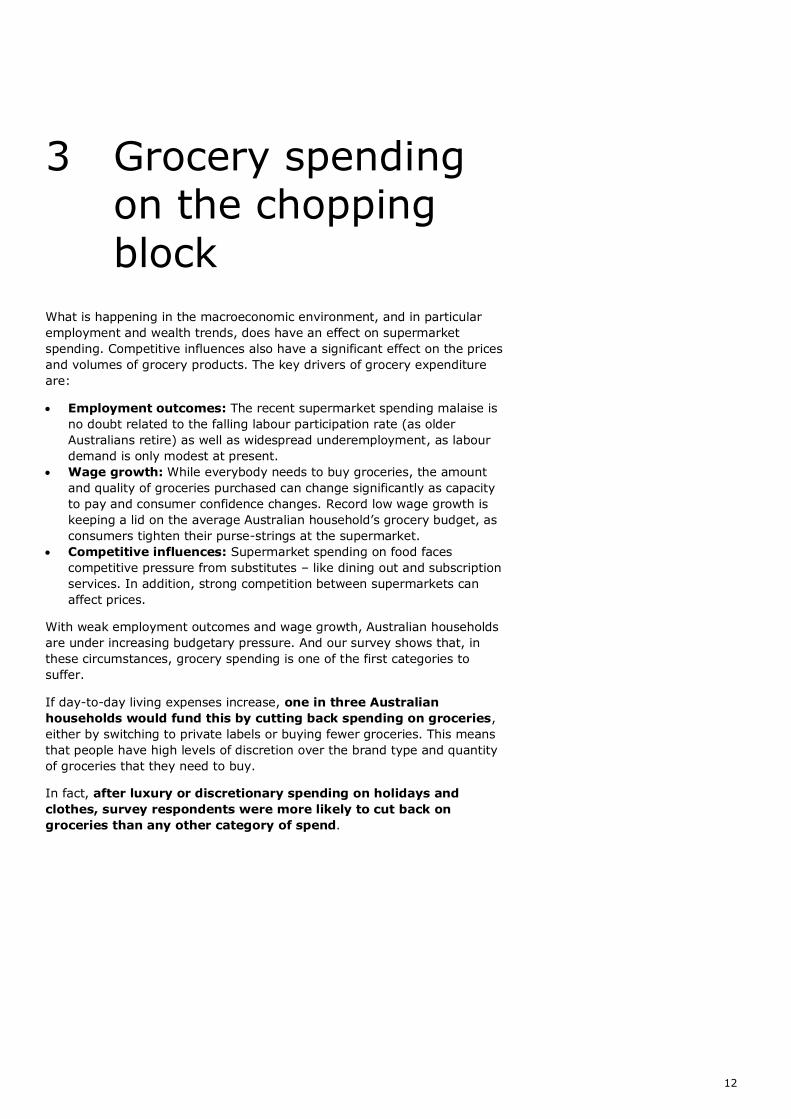
3 Grocery spending on the chopping
block
What is happening in the macroeconomic environment, and in particular
employment and wealth trends, does have an effect on supermarket
spending. Competitive influences also have a significant effect on the prices
and volumes of grocery products. The key drivers of grocery expenditure
are:
Employment outcomes: The recent supermarket spending malaise is
no doubt related to the falling labour participation rate (as older
Australians retire) as well as widespread underemployment, as labour
demand is only modest at present.
Wage growth: While everybody needs to buy groceries, the amount
and quality of groceries purchased can change significantly as capacity
to pay and consumer confidence changes. Record low wage growth is
keeping a lid on the average Australian household’s grocery budget, as
consumers tighten their purse-strings at the supermarket.
Competitive influences: Supermarket spending on food faces
competitive pressure from substitutes – like dining out and subscription
services. In addition, strong competition between supermarkets can
affect prices.
With weak employment outcomes and wage growth, Australian households
are under increasing budgetary pressure. And our survey shows that, in
these circumstances, grocery spending is one of the first categories to
suffer.
If day-to-day living expenses increase, one in three Australian
households would fund this by cutting back spending on groceries,
either by switching to private labels or buying fewer groceries. This means
that people have high levels of discretion over the brand type and quantity
of groceries that they need to buy.
In fact, after luxury or discretionary spending on holidays and
clothes, survey respondents were more likely to cut back on
groceries than any other category of spend.
13
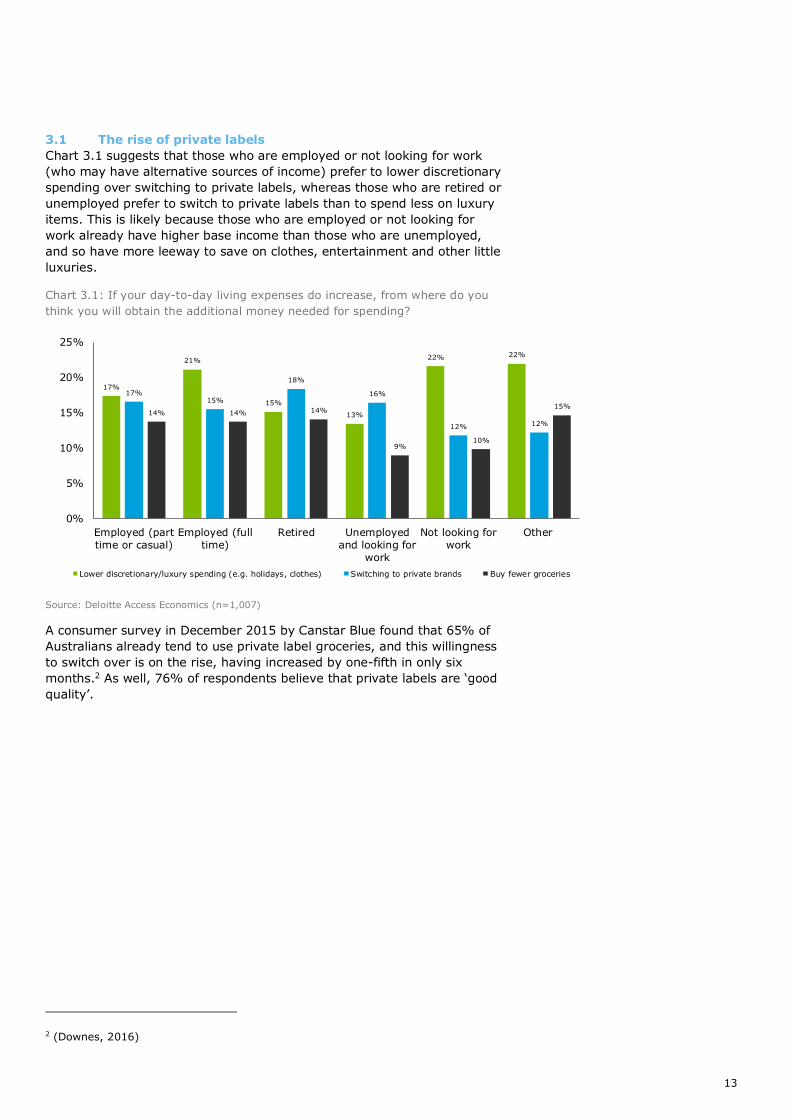
3.1 The rise of private labels
Chart 3.1 suggests that those who are employed or not looking for work
(who may have alternative sources of income) prefer to lower discretionary
spending over switching to private labels, whereas those who are retired or
unemployed prefer to switch to private labels than to spend less on luxury
items. This is likely because those who are employed or not looking for
work already have higher base income than those who are unemployed,
and so have more leeway to save on clothes, entertainment and other little
luxuries.
Chart 3.1: If your day-to-day living expenses do increase, from where do you
think you will obtain the additional money needed for spending?
Source: Deloitte Access Economics (n=1,007)
A consumer survey in December 2015 by Canstar Blue found that 65% of
Australians already tend to use private label groceries, and this willingness
to switch over is on the rise, having increased by one-fifth in only six
months.2 As well, 76% of respondents believe that private labels are ‘good
quality’.
2 (Downes, 2016)
17%
21%
15%
13%
22% 22%
17%15%
18%
16%
12% 12%
14% 14% 14%
9%10%
15%
0%
5%
10%
15%
20%
25%
Employed (part
time or casual)Employed (full
time)Retired Unemployed
and looking for
work
Not looking for
workOther
Lower discretionary/luxury spending (e.g. holidays, clothes) Switching to private brands Buy fewer groceries
14
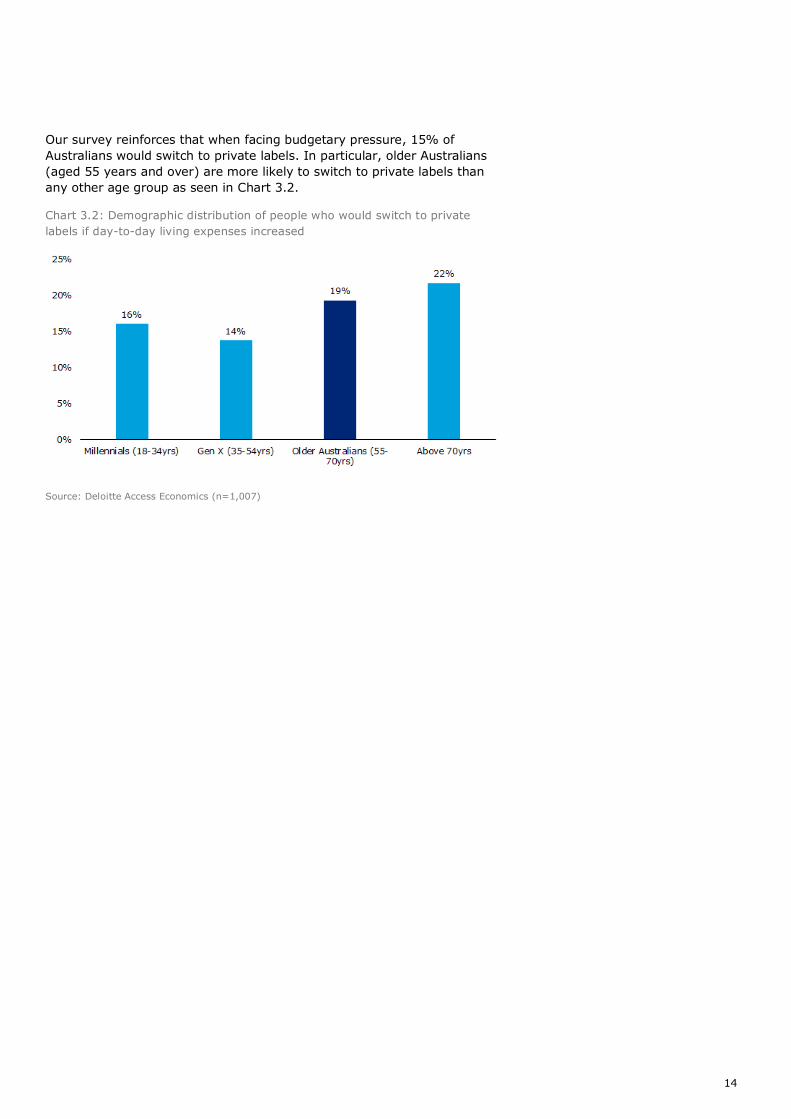
Our survey reinforces that when facing budgetary pressure, 15% of
Australians would switch to private labels. In particular, older Australians
(aged 55 years and over) are more likely to switch to private labels than
any other age group as seen in Chart 3.2.
Chart 3.2: Demographic distribution of people who would switch to private
labels if day-to-day living expenses increased
Source: Deloitte Access Economics (n=1,007)
15
4 Grocery spending trends
More than ever, Australians have access to a range of food options – from
eating out and take-away to subscription services and buying groceries to
cooking at home. All of these services are competing for consumer
spending.
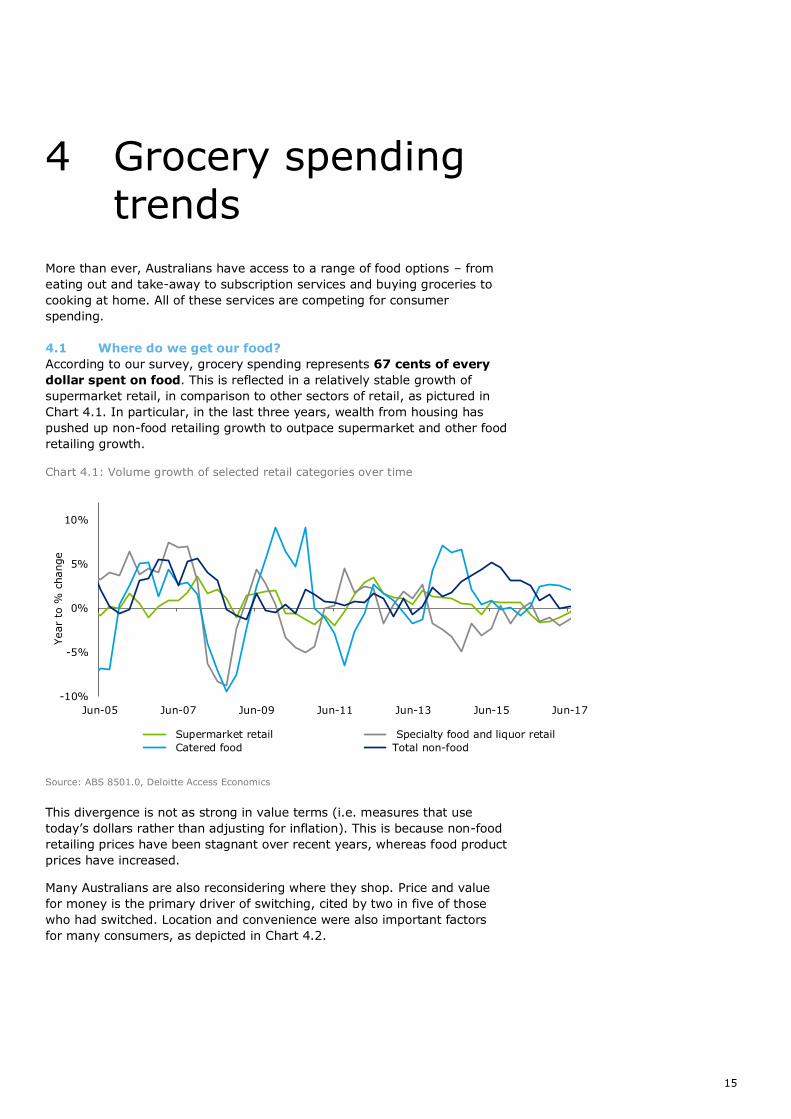
4.1 Where do we get our food?
According to our survey, grocery spending represents 67 cents of every
dollar spent on food. This is reflected in a relatively stable growth of
supermarket retail, in comparison to other sectors of retail, as pictured in
Chart 4.1. In particular, in the last three years, wealth from housing has
pushed up non-food retailing growth to outpace supermarket and other food
retailing growth.
Chart 4.1: Volume growth of selected retail categories over time
Source: ABS 8501.0, Deloitte Access Economics
This divergence is not as strong in value terms (i.e. measures that use
today’s dollars rather than adjusting for inflation). This is because non-food
retailing prices have been stagnant over recent years, whereas food product
prices have increased.
Many Australians are also reconsidering where they shop. Price and value
for money is the primary driver of switching, cited by two in five of those
who had switched. Location and convenience were also important factors
for many consumers, as depicted in Chart 4.2.
-10%
-5%
0%
5%
10%
Jun-05 Jun-07 Jun-09 Jun-11 Jun-13 Jun-15 Jun-17
Year
to %
change
Supermarket retail Specialty food and liquor retail
Catered food Total non-food
16
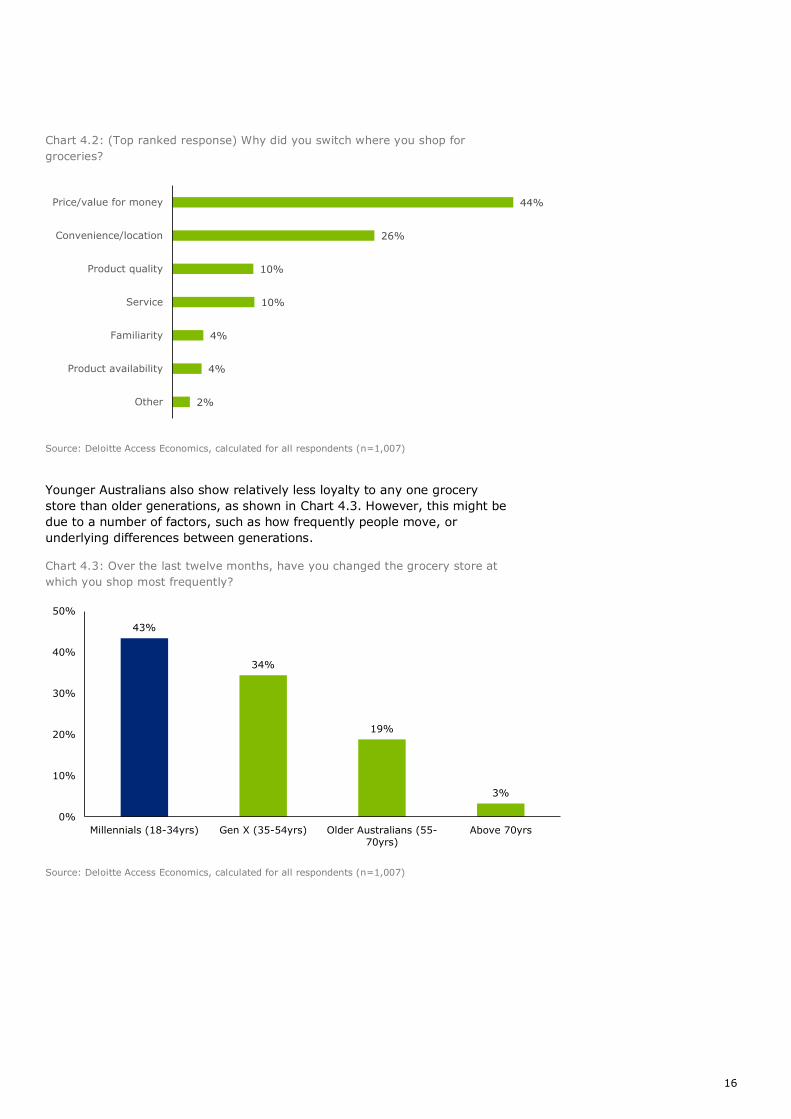
Chart 4.2: (Top ranked response) Why did you switch where you shop for
groceries?
Source: Deloitte Access Economics, calculated for all respondents (n=1,007)
Younger Australians also show relatively less loyalty to any one grocery
store than older generations, as shown in Chart 4.3. However, this might be
due to a number of factors, such as how frequently people move, or
underlying differences between generations.
Chart 4.3: Over the last twelve months, have you changed the grocery store at
which you shop most frequently?
Source: Deloitte Access Economics, calculated for all respondents (n=1,007)
44%
26%
10%
10%
4%
4%
2%
Price/value for money
Convenience/location
Product quality
Service
Familiarity
Product availability
Other
43%
34%
19%
3%
0%
10%
20%
30%
40%
50%
Millennials (18-34yrs) Gen X (35-54yrs) Older Australians (55-
70yrs)
Above 70yrs
17
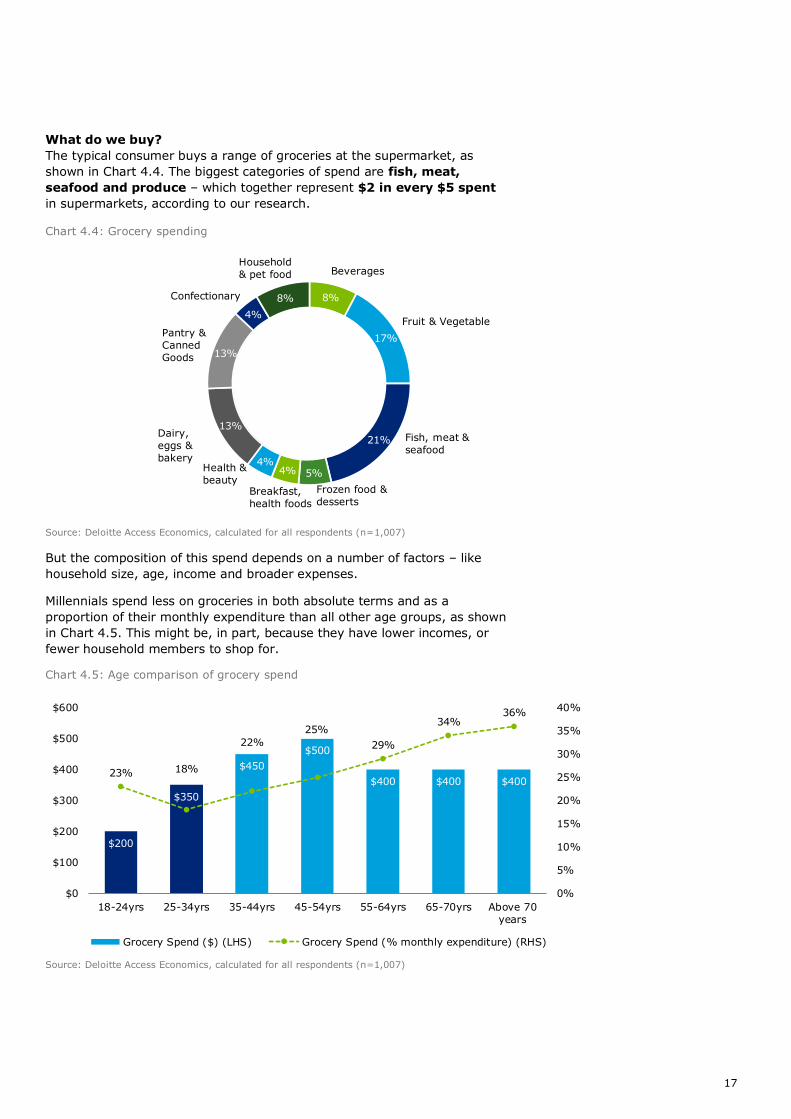
What do we buy?
The typical consumer buys a range of groceries at the supermarket, as
shown in Chart 4.4. The biggest categories of spend are fish, meat,
seafood and produce – which together represent $2 in every $5 spent
in supermarkets, according to our research.
Chart 4.4: Grocery spending
Source: Deloitte Access Economics, calculated for all respondents (n=1,007)
But the composition of this spend depends on a number of factors – like
household size, age, income and broader expenses.
Millennials spend less on groceries in both absolute terms and as a
proportion of their monthly expenditure than all other age groups, as shown
in Chart 4.5. This might be, in part, because they have lower incomes, or
fewer household members to shop for.
Chart 4.5: Age comparison of grocery spend
Source: Deloitte Access Economics, calculated for all respondents (n=1,007)
8%
17%
21%
5%4%4%
13%
13%
4%
8%
Fruit & Vegetable
Fish, meat &
seafood
Frozen food &
desserts
BeveragesHousehold
& pet food
Confectionary
Pantry &
Canned
Goods
Dairy,
eggs &
bakeryHealth &
beautyBreakfast,
health foods
$200
$350
$450
$500
$400 $400 $40023% 18%
22%
25%
29%
34%36%
0%
5%
10%
15%
20%
25%
30%
35%
40%
$0
$100
$200
$300
$400
$500
$600
18-24yrs 25-34yrs 35-44yrs 45-54yrs 55-64yrs 65-70yrs Above 70years
Grocery Spend ($) (LHS) Grocery Spend (% monthly expenditure) (RHS)
18
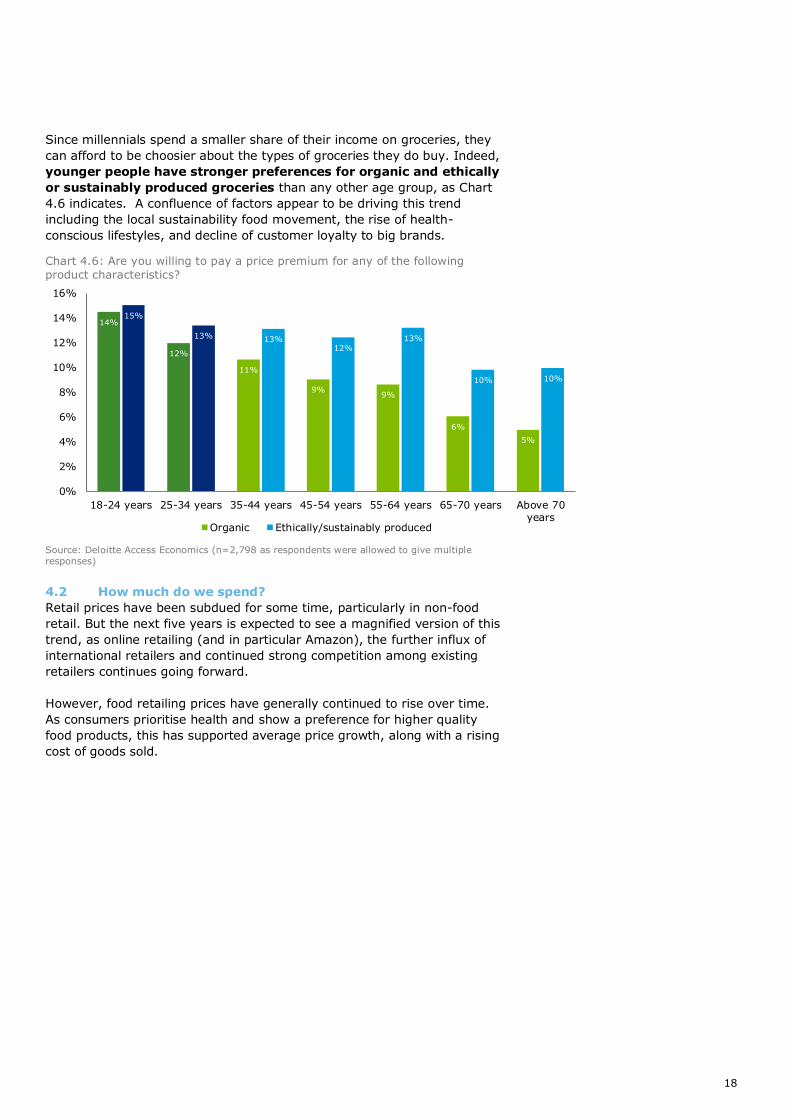
Since millennials spend a smaller share of their income on groceries, they
can afford to be choosier about the types of groceries they do buy. Indeed,
younger people have stronger preferences for organic and ethically
or sustainably produced groceries than any other age group, as Chart
4.6 indicates. A confluence of factors appear to be driving this trend
including the local sustainability food movement, the rise of health-
conscious lifestyles, and decline of customer loyalty to big brands.
Chart 4.6: Are you willing to pay a price premium for any of the following
product characteristics?
Source: Deloitte Access Economics (n=2,798 as respondents were allowed to give multiple responses)
4.2 How much do we spend?
Retail prices have been subdued for some time, particularly in non-food
retail. But the next five years is expected to see a magnified version of this
trend, as online retailing (and in particular Amazon), the further influx of
international retailers and continued strong competition among existing
retailers continues going forward.
However, food retailing prices have generally continued to rise over time.
As consumers prioritise health and show a preference for higher quality
food products, this has supported average price growth, along with a rising
cost of goods sold.
14%
12%
11%
9%9%
6%
5%
15%
13% 13%12%
13%
10% 10%
0%
2%
4%
6%
8%
10%
12%
14%
16%
18-24 years 25-34 years 35-44 years 45-54 years 55-64 years 65-70 years Above 70years
Organic Ethically/sustainably produced
19
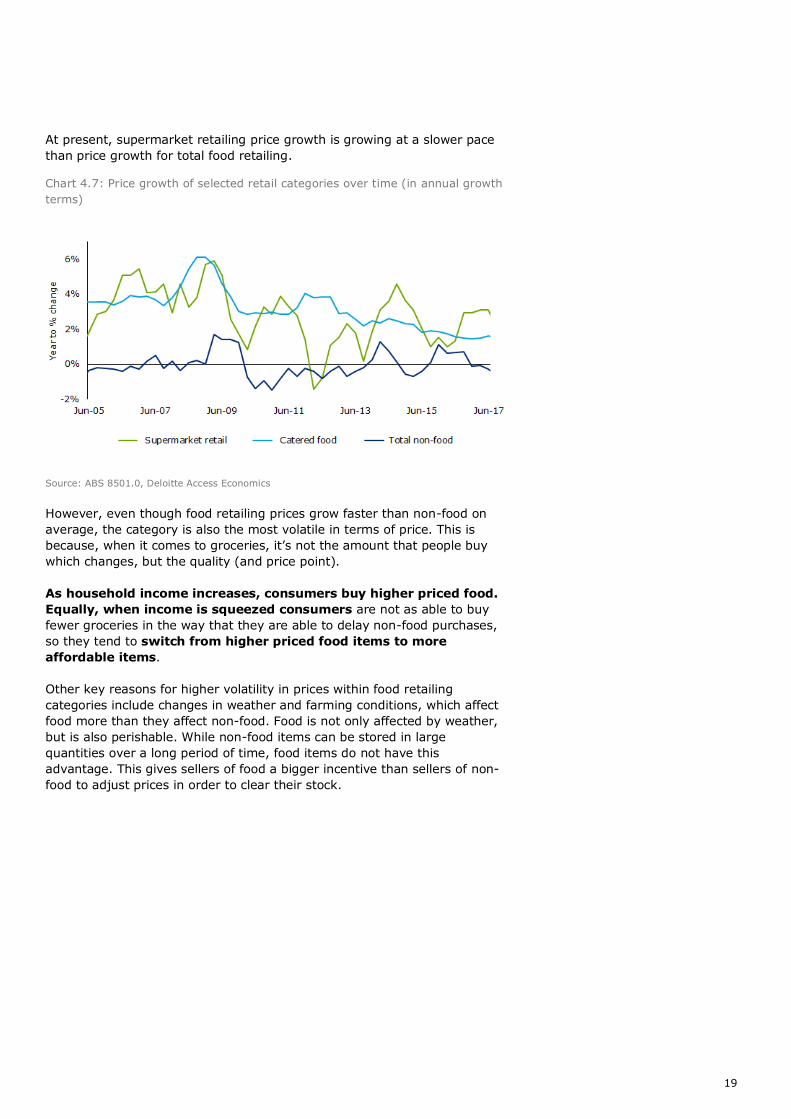
At present, supermarket retailing price growth is growing at a slower pace
than price growth for total food retailing.
Chart 4.7: Price growth of selected retail categories over time (in annual growth
terms)
Source: ABS 8501.0, Deloitte Access Economics
However, even though food retailing prices grow faster than non-food on
average, the category is also the most volatile in terms of price. This is
because, when it comes to groceries, it’s not the amount that people buy
which changes, but the quality (and price point).
As household income increases, consumers buy higher priced food.
Equally, when income is squeezed consumers are not as able to buy
fewer groceries in the way that they are able to delay non-food purchases,
so they tend to switch from higher priced food items to more
affordable items.
Other key reasons for higher volatility in prices within food retailing
categories include changes in weather and farming conditions, which affect
food more than they affect non-food. Food is not only affected by weather,
but is also perishable. While non-food items can be stored in large
quantities over a long period of time, food items do not have this
advantage. This gives sellers of food a bigger incentive than sellers of non-
food to adjust prices in order to clear their stock.
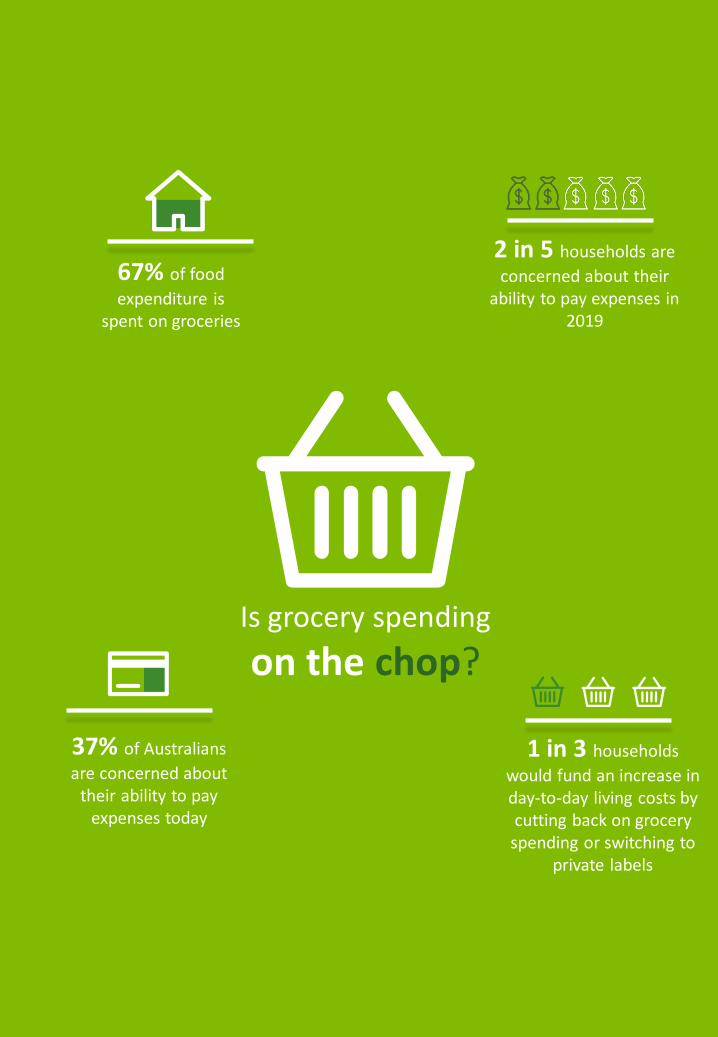
Is grocery spending
on the chop?
37% of Australians
are concerned about their ability to pay
expenses today
67% of food
expenditure is spent on groceries
2 in 5 households are
concerned about their ability to pay expenses in
2019
1 in 3 households
would fund an increase in day-to-day living costs by cutting back on grocery spending or switching to
private labels
21
5 The modern necessities
Even though households are feeling the pinch in term of the day-to-day
budgets and thinking about cutting back expenditure on traditional
necessities like groceries, there are also new things that the modern
consumer now prioritises and values, including digital technology, internet
and fast connectivity.
Consider smartphones; they were introduced only a decade ago, yet today
few Australians could go without one, with 84% owning a smartphone
today.3 In contrast, in the 1990s, nobody would be without a phone at
home; but by the end of 2014, nearly one third (29%) of the adult
population were mobile only.4 As our consumption patterns have shifted, so
too have our budgets.
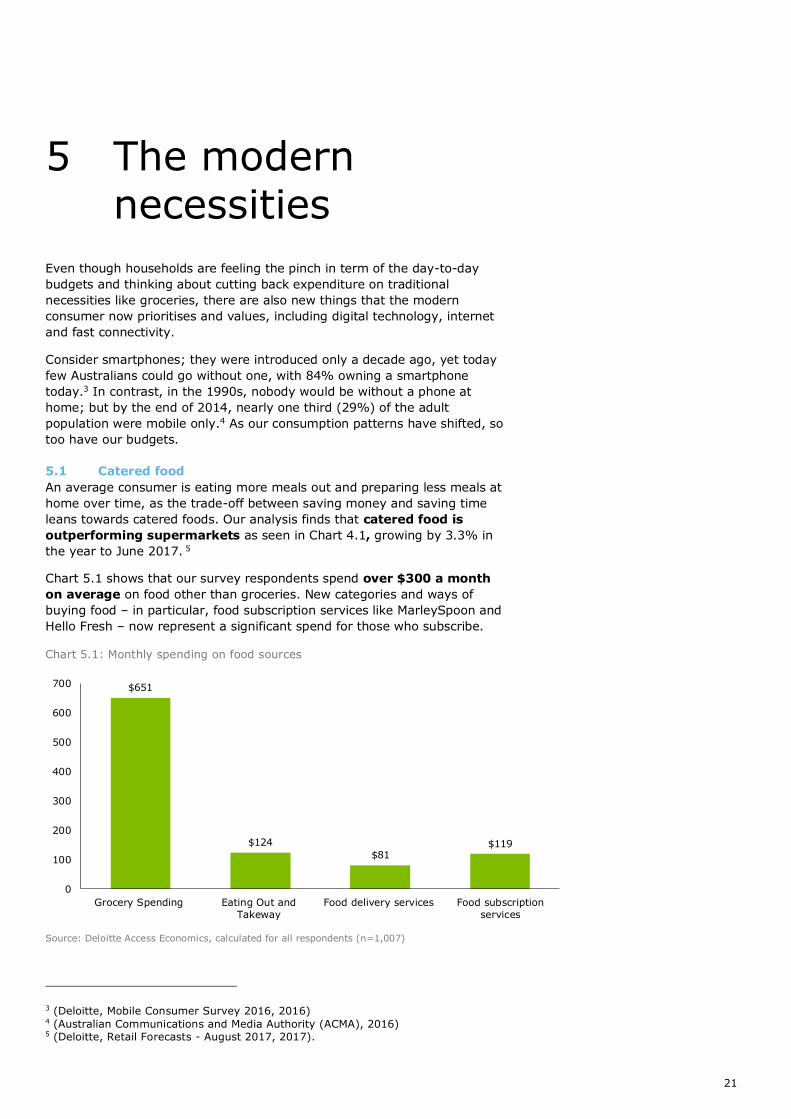
5.1 Catered food
An average consumer is eating more meals out and preparing less meals at
home over time, as the trade-off between saving money and saving time
leans towards catered foods. Our analysis finds that catered food is
outperforming supermarkets as seen in Chart 4.1, growing by 3.3% in
the year to June 2017. 5
Chart 5.1 shows that our survey respondents spend over $300 a month
on average on food other than groceries. New categories and ways of
buying food – in particular, food subscription services like MarleySpoon and
Hello Fresh – now represent a significant spend for those who subscribe.
Chart 5.1: Monthly spending on food sources
Source: Deloitte Access Economics, calculated for all respondents (n=1,007)
3 (Deloitte, Mobile Consumer Survey 2016, 2016) 4 (Australian Communications and Media Authority (ACMA), 2016) 5 (Deloitte, Retail Forecasts - August 2017, 2017).
$651
$124
$81$119
0
100
200
300
400
500
600
700
Grocery Spending Eating Out and
Takeway
Food delivery services Food subscription
services
22
Over the year to February 2017, online spending on takeaway food had
grown by a little over 30%6.
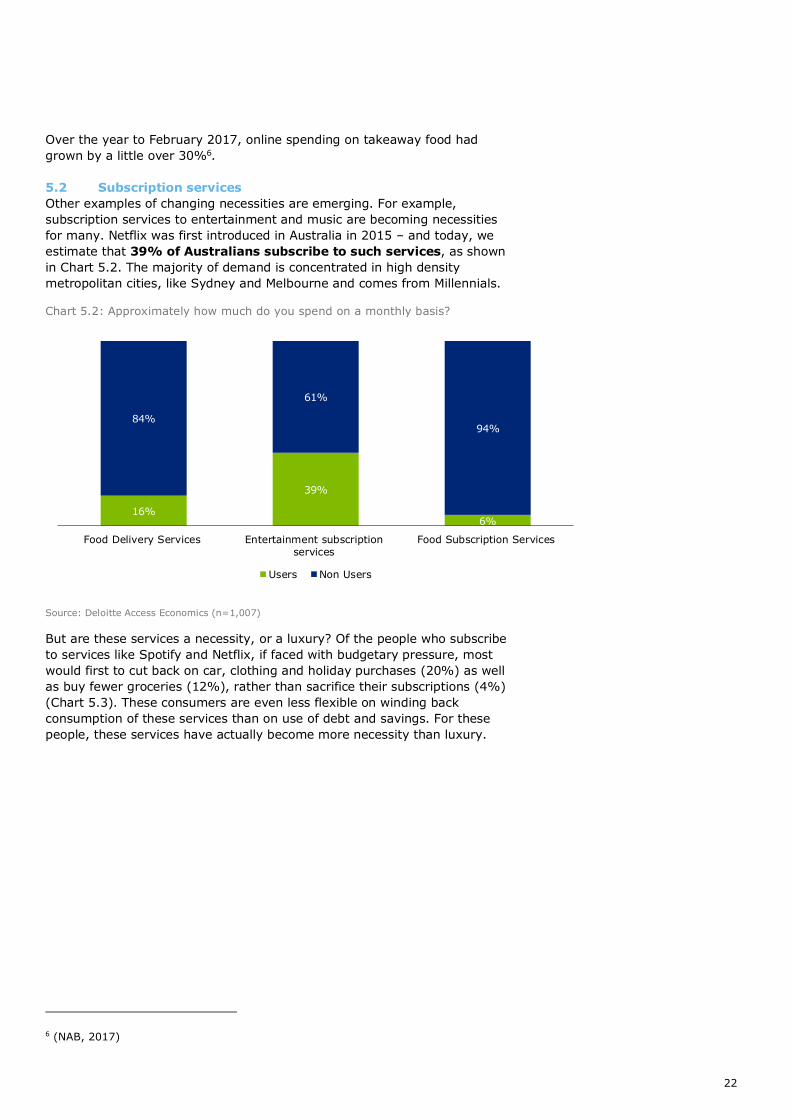
5.2 Subscription services
Other examples of changing necessities are emerging. For example,
subscription services to entertainment and music are becoming necessities
for many. Netflix was first introduced in Australia in 2015 – and today, we
estimate that 39% of Australians subscribe to such services, as shown
in Chart 5.2. The majority of demand is concentrated in high density
metropolitan cities, like Sydney and Melbourne and comes from Millennials.
Chart 5.2: Approximately how much do you spend on a monthly basis?
Source: Deloitte Access Economics (n=1,007)
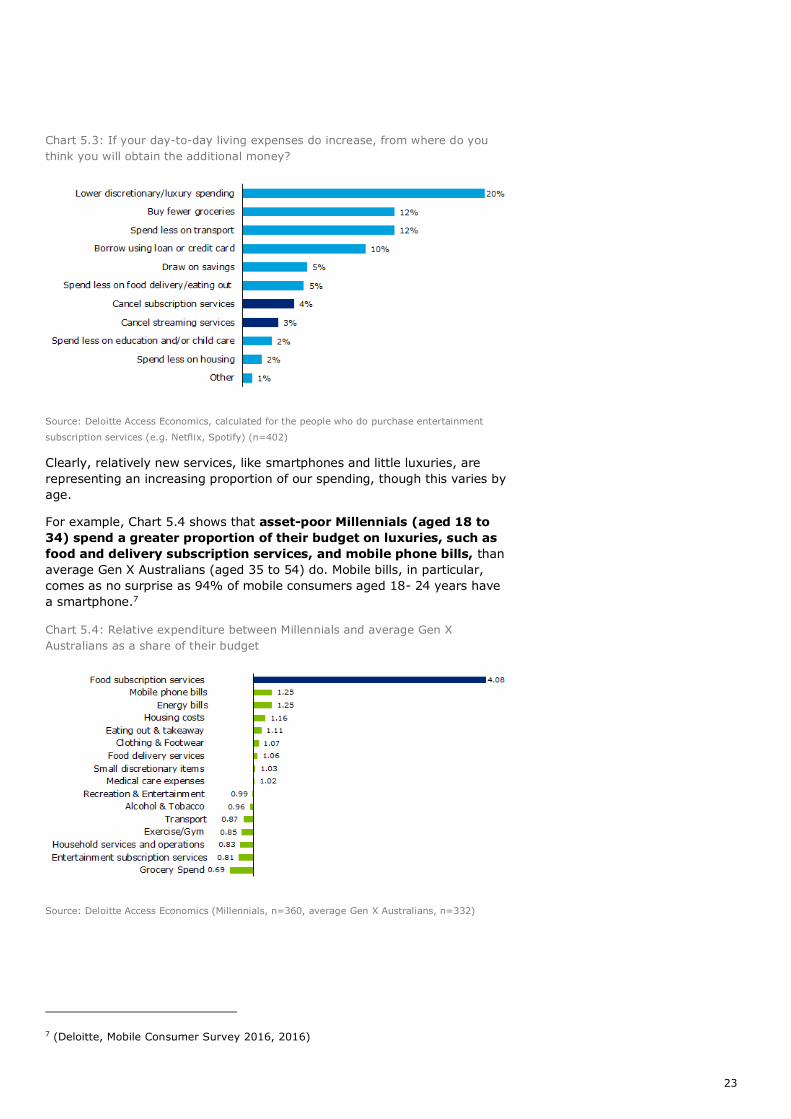
But are these services a necessity, or a luxury? Of the people who subscribe
to services like Spotify and Netflix, if faced with budgetary pressure, most
would first to cut back on car, clothing and holiday purchases (20%) as well
as buy fewer groceries (12%), rather than sacrifice their subscriptions (4%)
(Chart 5.3). These consumers are even less flexible on winding back
consumption of these services than on use of debt and savings. For these
people, these services have actually become more necessity than luxury.
6 (NAB, 2017)
16%
39%
6%
84%
61%
94%
Food Delivery Services Entertainment subscriptionservices
Food Subscription Services
Users Non Users
23
Chart 5.3: If your day-to-day living expenses do increase, from where do you
think you will obtain the additional money?
Source: Deloitte Access Economics, calculated for the people who do purchase entertainment
subscription services (e.g. Netflix, Spotify) (n=402)
Clearly, relatively new services, like smartphones and little luxuries, are
representing an increasing proportion of our spending, though this varies by
age.
For example, Chart 5.4 shows that asset-poor Millennials (aged 18 to
34) spend a greater proportion of their budget on luxuries, such as
food and delivery subscription services, and mobile phone bills, than
average Gen X Australians (aged 35 to 54) do. Mobile bills, in particular,
comes as no surprise as 94% of mobile consumers aged 18- 24 years have
a smartphone.7
Chart 5.4: Relative expenditure between Millennials and average Gen X
Australians as a share of their budget
Source: Deloitte Access Economics (Millennials, n=360, average Gen X Australians, n=332)
7 (Deloitte, Mobile Consumer Survey 2016, 2016)
24
References
Australian Bureau of Statistics (ABS). (2017). 5206.0 - Australian National
Accounts: National Income, Expenditure and Product, Jun 2017, cat.
no. 5206.0. Retrieved from
http://www.abs.gov.au/ausstats/abs%40.nsf/mediareleasesbyCatal
ogue/C9973AC780DDFD3FCA257F690011045C?OpenDocument
Australian Bureau of Statistics (ABS). (2017). 6202.0 - Labour Force,
Australia, Aug 2017, cat. no. 6202.0. Retrieved from
http://www.abs.gov.au/ausstats/[email protected]/mf/6202.0
Australian Bureau of Statistics (ABS). (2017). 8501.0 - Retail Trade,
Australia, Aug 2017, cat. no. 8501.0. Retrieved from
http://www.abs.gov.au/ausstats/[email protected]/mf/8501.0
Australian Communications and Media Authority (ACMA). (2016). Australian
Communications and Media Authority submission: Response to the
Productivity Commission's issues paper. Retrieved from Australian
Communications and Media Authority submission
Deloitte. (2016). Mobile Consumer Survey 2016. Retrieved from
http://landing.deloitte.com.au/rs/761-IBL-328/images/tmt-mobile-
consumer-2016-final-report-101116.pdf
Deloitte. (2017). Retail Forecasts - August 2017. Retrieved from
https://www2.deloitte.com/au/en/pages/media-
releases/articles/retail-forecasts-120917.html
Downes, S. (2016, 1 21). Private labels vs Brand names: The switch is on.
Retrieved from Canstar Blue:
https://www.canstarblue.com.au/food-
drink/stores/supermarkets/private-labels-vs-brand-names/
NAB. (2017). NAB Online Retail Sales Index: In-depth Report - March 2017.
Retrieved from https://business.nab.com.au/wp-
content/uploads/2017/05/norsi-march-2017.pdf
Reserve Bank of Australia. (2015). Submission to the Inquiry into Home
Ownership: House of Representatives Standing Committee on
Economics. Retrieved from
http://www.rba.gov.au/publications/submissions/housing-and-
housing-finance/inquiry-into-home-ownership/pdf/inquiry-into-
home-ownership.pdf
Yates, J. (2015). Trends in home ownership in Australia: causes,
consequences and solutions.
25
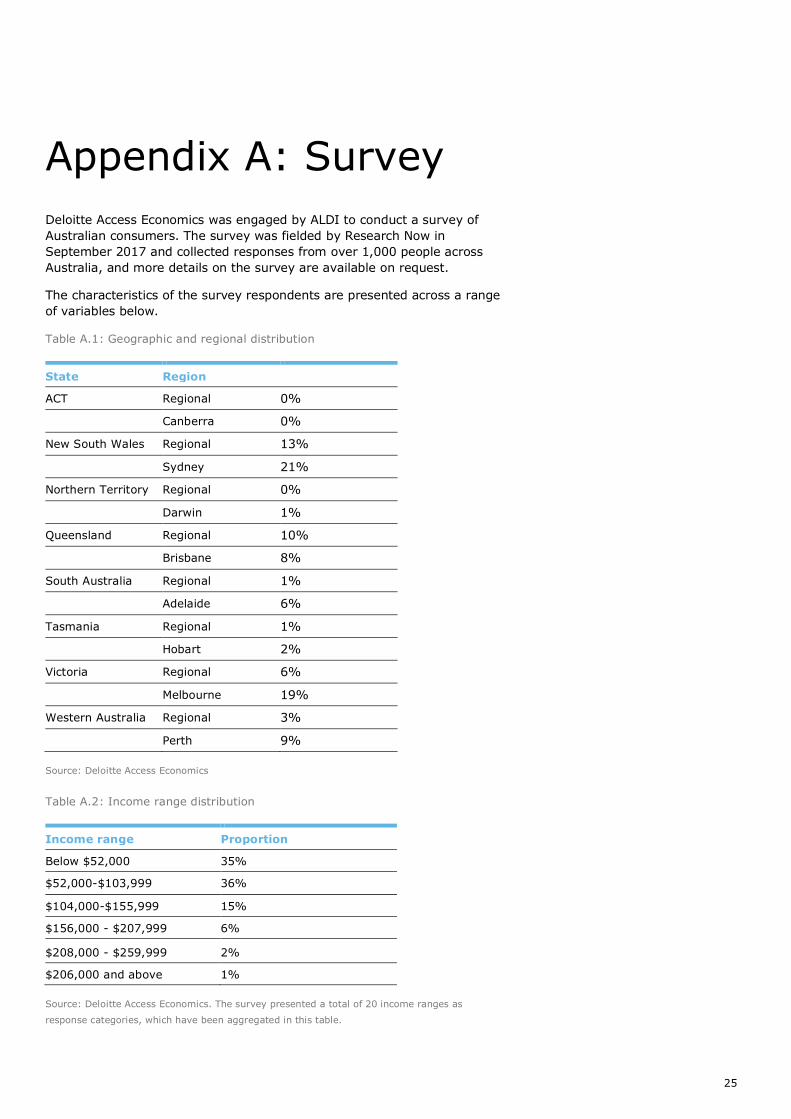
Appendix A: Survey
Deloitte Access Economics was engaged by ALDI to conduct a survey of
Australian consumers. The survey was fielded by Research Now in
September 2017 and collected responses from over 1,000 people across
Australia, and more details on the survey are available on request.
The characteristics of the survey respondents are presented across a range
of variables below.
Table A.1: Geographic and regional distribution
State Region
ACT Regional 0%
Canberra 0%
New South Wales Regional 13%
Sydney 21%
Northern Territory Regional 0%
Darwin 1%
Queensland Regional 10%
Brisbane 8%
South Australia Regional 1%
Adelaide 6%
Tasmania Regional 1%
Hobart 2%
Victoria Regional 6%
Melbourne 19%
Western Australia Regional 3%
Perth 9%
Source: Deloitte Access Economics
Table A.2: Income range distribution
Income range Proportion
Below $52,000 35%
$52,000-$103,999 36%
$104,000-$155,999 15%
$156,000 - $207,999 6%
$208,000 - $259,999 2%
$206,000 and above 1%
Source: Deloitte Access Economics. The survey presented a total of 20 income ranges as
response categories, which have been aggregated in this table.
26
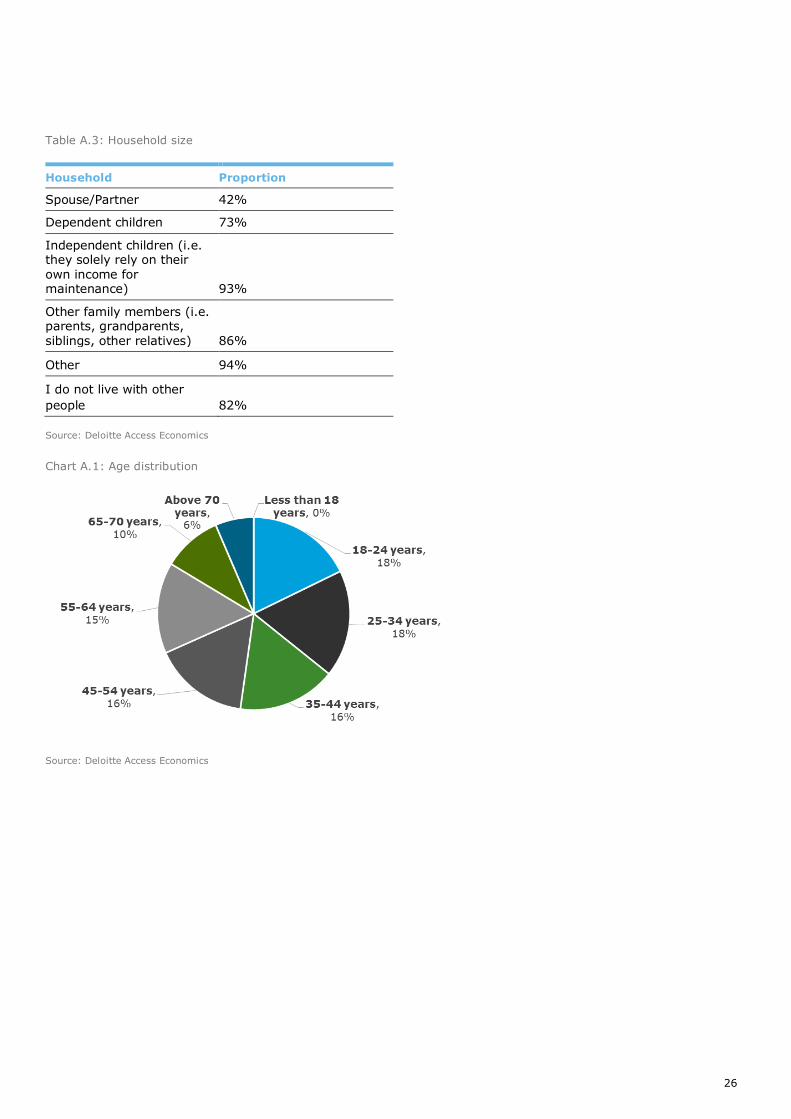
Table A.3: Household size
Household Proportion
Spouse/Partner 42%
Dependent children 73%
Independent children (i.e. they solely rely on their own income for maintenance) 93%
Other family members (i.e. parents, grandparents, siblings, other relatives) 86%
Other 94%
I do not live with other
people 82%
Source: Deloitte Access Economics
Chart A.1: Age distribution
Source: Deloitte Access Economics
27
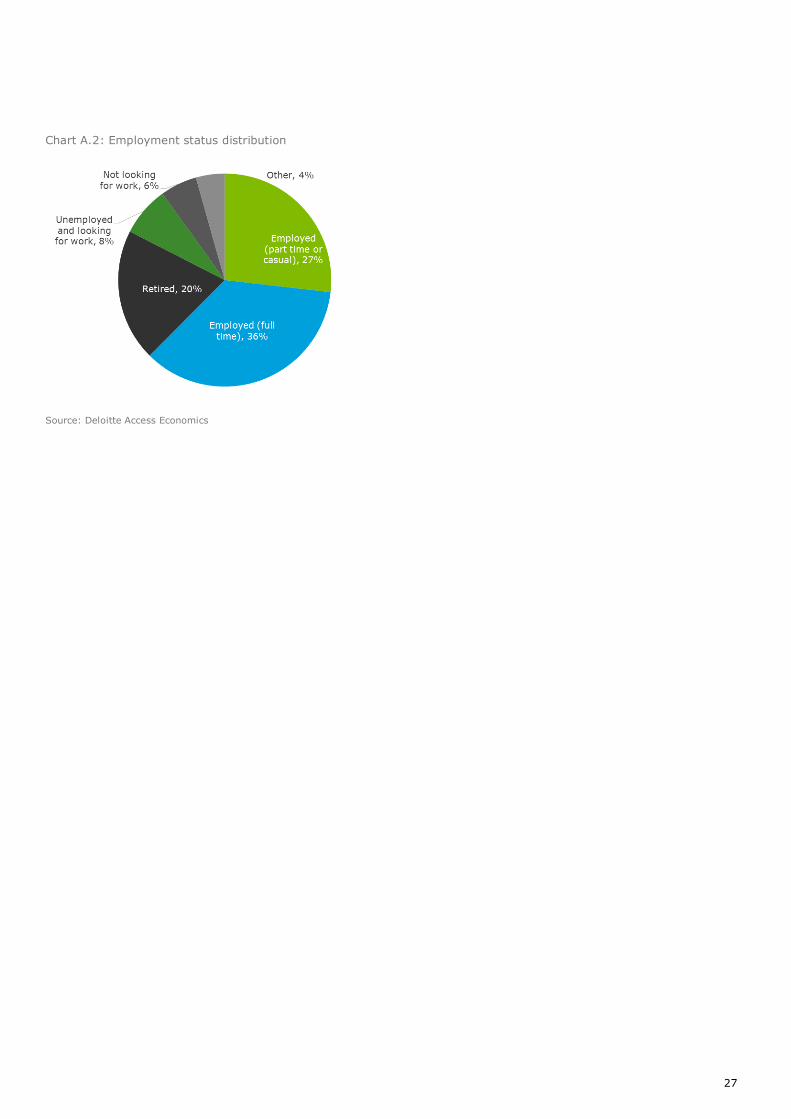
Chart A.2: Employment status distribution
Source: Deloitte Access Economics
28
Limitation of our work
General use restriction
This report is prepared solely for the use of Creation. This report is not
intended to and should not be used or relied upon by anyone else and we
accept no duty of care to any other person or entity. The report has been
prepared for the purpose of set out in our engagement letter dated 12 May
2017. You should not refer to or use our name or the advice for any other
purpose

29
Contact us
David Rumbens Partner Deloitte Access Economics E. [email protected]
Jessica Mizrahi Manager Deloitte Access Economics E. [email protected]
Kathryn Matthews Partner Deloitte Access Economics E. [email protected]
Adelaide Timbrell Senior Analyst Deloitte Access Economics E. [email protected]
Eamon McGinn Director Deloitte Access Economics E. [email protected]
Christine Li Analyst Deloitte Access Economics E. [email protected]
Nalini Agarwal
Research Assistant Deloitte Access Economics E. [email protected]
30
Contact us
Deloitte Access Economics
ACN: 149 633 116
225 George St
Sydney NSW 2000
Tel: +61 2 9322 7000
Fax: +61 2 9322 7001
Deloitte Access Economics is Australia’s pre-eminent economics advisory practice and a member of Deloitte's global economics
group. For more information, please visit our website
www.deloitte.com/au/deloitte-access-economics
Deloitte refers to one or more of Deloitte Touche Tohmatsu Limited, a UK private company limited by guarantee, and its network
of member firms, each of which is a legally separate and independent entity. Please see www.deloitte.com/au/about for a
detailed description of the legal structure of Deloitte Touche Tohmatsu Limited and its member firms.
The entity named herein is a legally separate and independent entity. In providing this document, the author only acts in the
named capacity and does not act in any other capacity. Nothing in this document, nor any related attachments or
communications or services, have any capacity to bind any other entity under the ‘Deloitte’ network of member firms (including
those operating in Australia).
About Deloitte
Deloitte provides audit, tax, consulting, and financial advisory services to public and private clients spanning multiple industries.
With a globally connected network of member firms in more than 150 countries, Deloitte brings world-class capabilities and high-
quality service to clients, delivering the insights they need to address their most complex business challenges. Deloitte's
approximately 200,000 professionals are committed to becoming the standard of excellence.
About Deloitte Australia
In Australia, the member firm is the Australian partnership of Deloitte Touche Tohmatsu. As one of Australia’s leading
professional services firms. Deloitte Touche Tohmatsu and its affiliates provide audit, tax, consulting, and financial advisory
services through approximately 6000 people across the country. Focused on the creation of value and growth, and known as an
employer of choice for innovative human resources programs, we are dedicated to helping our clients and our people excel. For
more information, please visit our web site at www.deloitte.com.au.
Liability limited by a scheme approved under Professional Standards Legislation.
Member of Deloitte Touche Tohmatsu Limited
© 2017 Deloitte Access Economics