Embed Size (px)
Citation preview
Ammonia formation over supported platinum and palladium catalysts
Emma Catherine Adams*a, Magnus Skoglundha, Milica Folicb, Eva Charlotte Bendixenb, Par Gabrielssonb, Per-Anders Carlssona
aCompetence Centre for Catalysis, Chalmers University of Technology, SE-412 96 Goteborg, SwedenbHaldor Topsøe A/S, P.O Box 213, DK-2800 Lyngby, Denmark
*Corresponding author. Tel: +46 31 772 29 07, E-mail address: [email protected],
Abstract
We report experimental results for the formation of ammonia from nitric oxide and hydrogen, and from nitric oxide, water
and carbon monoxide over silica, alumina and titania supported platinum and palladium catalysts. Temperature programmed
reaction experiments in gas flow reactor show a considerable formation of ammonia in the temperature range 200-450 �C, which
is suppressed by the presence of excess oxygen. However, oxygen sweep experiments show that for the titania supported catalysts
minor amounts of oxygen promotes the ammonia formation at low temperatures. In situ DRIFT spectroscopy measurements indicate
that cyanate species on the support play an important role in the ammonia formation mechanism. This work shows that alumina
supported palladium is a promising system for passive selective catalytic reduction applications, exhibiting low-temperature activity
during the water-gas-shift assisted ammonia formation reaction. Conversely, titania supported samples are less active for ammonia
formation as a result of the poor thermal stability of the titania support.
Keywords: Catalytic exhaust aftertreatment, Passive-SCR, NOx reduction, In situ DRIFT spectroscopy, NH3 formation, Pt, Pd
1. Introduction
Combustion of petrol and diesel in vehicles results in the for-
mation of harmful products, including nitrogen oxides (NOx),
which are known to be responsible for various environmental
issues such as photochemical smog and acid rain [1, 2]. At
present, the fuel economy of passenger cars can be improved
by ensuring that the combustion takes place in the presence of
excess oxygen, so-called lean operation [3]. Practically, lean
operation makes it challenging to reduce NOx to N2 over the
conventional three-way catalyst [4]. Thus it is necessary for
new strategies to be developed whereby the fuel economy can
be improved whilst the tailpipe emissions are kept su�ciently
low [5, 6]. Selective catalytic reduction of NOx with ammo-
nia (NH3-SCR) is currently the preferred technology for NOx
abatement from stationary sources and larger vehicles includ-
ing trucks and buses [7]. Ammonia-SCR relies on the ability
of the catalyst to selectively reduce NOx with NH3 to form N2
in the presence of elevated levels of O2 [8, 2]. However, due
to concerns with the safety and toxicity associated with ammo-
nia transportation and storage, the NH3 is stored in the form of
urea-in-water solution on-board the vehicle. Urea solution is in-
jected into the exhaust gas where it thermally decomposes and
hydrolyses to form the ammonia required for NH3-SCR [9, 10].
Although this solution has been accepted for heavy-duty vehi-
cles, di�culties arise when applied to smaller passenger vehi-
cles. Some of the problems encountered are due to extra weight
associated with the need for an additional urea storage tank and
injection system, which is complex, costly and may a↵ect driv-
ing performance negatively, and the risk of creating an NH3 slip
[2, 4, 11]. Ammonia emissions are undesirable since NH3 is a
Preprint submitted to Applied Catalysis B November 2, 2015

toxic air pollutant and is known to contribute to the production
of secondary particulate matter [12, 13].
Passive SCR is a newly developing technology that may con-
tribute to solving some of the aforementioned problems [14].
The concept of this technique is to generate NH3 on-board the
vehicle by utilizing the NOx that is readily available in the ex-
haust stream whilst the engine undergoes rich operation (low
air-to-fuel ratio). The formed NH3 can then be stored on an
SCR catalyst downstream and used to reduce slipped NOx when
the engine is set back to operate under lean conditions. If su�-
cient amounts of NH3 can be produced during the rich periods
and stored for complete reaction with NOx to form N2 during
the subsequent lean periods, an external urea injection system
may not be needed. It is well known that NH3 can be formed
over precious metal catalysts by the reaction between NOx and
H2 provided that the stoichiometric requirement, i.e. H2/NO �
2.5, is fulfilled. The overall reaction follows;
NO +52
H2 ! NH3 + H2O (1)
If the criterion on the H2/NO ratio is not fulfilled, selectivity to
other nitrogen-containing products has been observed [11, 15,
16], for example N2O and N2 by the two reactions:
NO +12
H2 !12
N2O +12
H2O (2)
NO + H2 !12
N2 + H2O (3)
In automotive applications deviations in driving patterns result
in conditions where the concentration of H2 present in the ex-
haust feed does not meet the requirement for ammonia forma-
tion for significant periods. Despite this, passive SCR may play
an important role in NOx abatement provided that a direct sup-
ply of H2 is not necessary. Carbon monoxide and water are also
present in the exhausts during rich operation [17] and H2 can
be formed by the water-gas-shift (WGS) reaction;
CO + H2O! CO2 + H2 (4)
Hence, water could be a viable hydrogen source for the further
formation of NH3.
Previously Okumura et al. showed that SiO2 and Al2O3 sup-
ported Pt and Pd catalysts have high selectivity to form NH3
when in the presence of NO and H2 at temperatures between
400 and 500 �C as compared to the corresponding Ir and Rh
catalysts. In addition, Macleod et al. [2] showed that there
is a synergy between Al2O3 and TiO2 supports, which leads
to further elevated formation of NH3 in the presence of NO,
CO and H2O. This benefit can be ascribed to the hydrolysis
of isocyanate groups, which is an additional well-documented
route for NH3 formation [15, 18, 17]. Although this process
requires a catalytically active site (S) to form the initial surface
isocyanate species (Eqns. 5 and 7), the reaction steps respon-
sible for the formation of NH3 can take place both in the gas
phase (Eqn. 6) and via an adsorbed species on the catalyst sur-
face (Eqn. 8);
S-NCO + H2O! S-OH + HNCO (5)
HNCO + H2O! NH3 + CO2 (6)
S-NCO + H2O! S-NH2 + CO2 (7)
S-NH2 + H2O! S-OH + NH3 (8)
The objective of the present study is to investigate whether or
not NH3 can be formed over a wide temperature window from
NO + H2 and NO + H2O + CO gas mixtures over supported
Pt and Pd catalysts, specifically addressing the role of the sup-
port material. This is carried out by a systematic comparison
of silica, alumina and titania as support materials. Also, the
influence of the presence of O2 on the ammonia formation is
studied.
2

2. Experimental section
2.1. Catalyst preparation and characterisation
Supported Pt and Pd powder catalysts were prepared by in-
cipient wetness impregnation of each of the following support
materials: Al2O3 (Puralox SBa200), SiO2 (Kromasil) and TiO2
(Hombifine). The supports were thermally treated in air at 600
�C to remove impurities and stabilise the structure prior to im-
pregnation. Thereafter, the saturation point of each support was
determined and they were then suspended in the correspond-
ing volume of aqueous solutions of either (NH3)4Pt(NO3)2 or
(NH3)4Pd(NO3)2 to ensure all solution would be taken up by
the support. All prepared catalysts were frozen in liquid N2
and subsequently freeze-dried for approximately twelve hours
to ensure complete sublimation of water. The powder samples
were then calcined at 550 �C in air for one hour.
The powder catalysts were then coated onto cordierite mono-
lith substrates. This was done by preparing solutions consisting
of the powder catalyst, suitable binder materials based on sup-
port composition (Al2O3; Disperal P2, SiO2; Colloidal SiO2
and TiO2; TiO2 sol), water and ethanol. The monolith was
then carefully immersed into the slurry, allowing the catalyst-
containing liquid to be dispersed evenly throughout the chan-
nels by capillary forces. The monolith was then dried in air at
90 �C for two minutes to remove the water and ethanol, before
being briefly calcined in air for a further two minutes at 500
�C and weighed. If necessary, the process was repeated until
the desired mass of catalyst and binder was deposited (200 ± 3
mg). Once coated, the monoliths were calcined in air at 600 �C
for two hours to ensure complete removal of water.
The specific surface area of the prepared samples was mea-
sured by nitrogen physisorption at -196 �C using an ASAP 2010
(Micrometrics) sorptometer. Prior to adsorption, all samples
were dried at 200 �C for two hours under vacuum in order to
remove any residual water. Respective surface areas were then
determined according to the standard Brunauer-Emmet-Teller
(BET) method [19] using P/P0 = 0.05 � 0.20. The specific
surface area of the pure support materials; both fresh and after
calcination in air at 600 �C for one hour was measured to deter-
mine the thermal stability of the supports. The prepared powder
catalysts were characterised directly after calcination.
Transmission electron microscopy (TEM) analysis was car-
ried out to determine the average noble metal particle size for
each catalyst. A small amount of sample was dispersed in
ethanol in an ultrasonic bath for 20 seconds. One drop of the
suspension was then placed onto a Cu-grid coated with lacey
carbon. Between 6 - 14 images of each sample were recorded
at di↵erent magnifications: 36 x 36 - 294 x 294 nm. Addi-
tionally, Energy dispersive spectroscopy (EDS) analyses were
acquired at each position investigated to locate and confirm the
presence and type of metal particles.
Inductively coupled plasma optical emission spectroscopy
(ICP - OES) analysis was used to confirm the noble metal con-
tent of all samples. A mass of 0.1 - 0.15 g of finely ground
sample was digested in a solution containing HNO3 and HCl
at 200 �C for 20 minutes in a Milestone Ethos Plus microwave
digestion unit. The resultant clear sample solution was then
diluted using pure water (18.2 M⌦) and the metal content was
quantified with an Agilent 720 ES ICP - OES instrument. Emis-
sion signals from the sample were compared to the signal from
certified calibration standards containing 0 - 10 mg/l Pd or Pt.
To compliment the afore-mentioned characterisation tech-
niques, powder X-ray di↵raction (XRD) was also performed
using a Bruker XRD D8 Advance instrument with monochro-
matic CuK↵1 radiation. The 2✓ range of interest was 15-85� and
the step size and time employed were 0.041 and 1 s, respec-
tively. The rotation speed of the sample during measurement
was 60 rpm.
3

Table 1: Summary of gas compositions used in the temperature programmedreaction experiments.
NO [ppm] H2 [ppm] CO [ppm] H2O [%]Feed 1 500 1500 - -Feed 2 500 - 1500 2Feed 3 - - 1500 2
2.2. Kinetic measurements in gas flow reactor
Continuous gas flow reactor studies were carried out to de-
termine the activity of the prepared catalysts. The reactor setup
employed in this investigation has previously been described
by Kannisto et al. [20]. The system consists of a quartz tube
surrounded with a heating coil and insulation. It contains two
thermocouples to measure the temperature both 10 mm before
and in the centre of the monolith sample. Two uncoated (blank)
cordierite monoliths were placed on either side of the sample
monolith in the quartz tube in order to reduce otherwise signifi-
cant heat losses and achieve a nearly isothermal sample. The in-
let gas composition was controlled using mass flow controllers
(Bronkhorst Hi-Tech LOW-�P-FLOW) and the outlet gas com-
position was analysed using an FTIR gas-analyzer (MKS 2030
HS). All experiments were carried out with an Ar balance in
order to keep the total gas flow constant at 2000 ml/min, corre-
sponding to a space velocity of 40 000 h�1.
Temperature programmed reaction experiments were carried
out to investigate the temperature region for ammonia forma-
tion over the di↵erent samples. All samples were exposed to
gas mixtures containing 500 ppm NO and either 1500 ppm H2
(Feed 1) or 1500 ppm CO accompanied by 2 % H2O (Feed
2), see Table 1. During exposure to both gas mixtures, the in-
let temperature was varied from 500 to 120 �C at a rate of 6
�C/min. The system was then kept at this temperature for ten
minutes before increasing the temperature to 500 �C at the same
rate. The low ramp rate was chosen as to ensure nearly station-
ary conditions. This scheme was carried out both in the absence
and presence of 2 % O2. An additional experiment was carried
out in order to determine the activity for the water-gas-shift re-
action of the samples, represented by Feed 3 in Table 1.
Steady-state experiments at 250, 350 and 450 �C were carried
out to evaluate the influence of the stoichiometric number, S, of
the feed on the formation of NH3 over the catalysts. The S-
value characterizes the net oxidizing-reducing character of the
inlet feed and is defined as [21];
S =2[O2]+[NO][CO]+[H2]
(9)
Again, the two feed compositions were fed to the reactor though
this time various levels of oxygen were also added. The O2
concentration was varied from 0.105 to 0.015 % (corresponding
to S-values between 1.73 and 0.33) in steps of 150 ppm, each
of which lasted 20 minutes in order to allow steady state to be
reached.
2.3. In situ infrared Fourier transform spectroscopy
Infrared Fourier transform spectroscopy was carried out in
situ in di↵use reflection mode (DRIFTS) to follow the evolution
of surface species during NH3 formation. A Biorad FTS6000
spectrometer equipped with an in situ Harrick Praying Mantis
reaction cell mounted with KBr windows was used. All samples
were pretreated in an Ar flow at 450 �C for 30 minutes, cooled
to 350 �C and a background spectrum was collected. The feed
gas was then 500 ppm NO, 1500 ppm CO and 2 % H2O with
varying concentration of O2 ranging from 900 to 0 ppm (cor-
responding to S-values between 1.53 and 0.33) in steps of 150
ppm. Infrared spectra were recorded between 1200 and 3800
cm�1 after the catalyst had been exposed to each gas compo-
sition for 20 minutes. The spectra displayed in the figures are
di↵erence spectra, i.e., the spectra obtained after background
subtraction, in order to more clearly show the adsorbates as a
function of the gas phase composition.
4

Table 2: BET, ICP-OES and TEM characterization of prepared samples.
Sample Surface Metal Noble metalarea content particle size
[m2/g] [wt. %] range [nm]Fresh TiO2 337 - -Calcineda TiO2 42 - -Pd/TiO2 41 0.37 b
Pt/TiO2 39 0.97 b
Fresh SiO2 322 - -Calcineda SiO2 326 - -Pd/SiO2 329 0.47 1.5 - 7Pt/SiO2 320 0.99 1 - 120Fresh Al2O3 200 - -Calcineda Al2O3 201 - -Pd/Al2O3 192 0.49 b
Pt/Al2O3 188 0.93 2 - 21aAfter calcination in air at 600 �C for one hour.
bSamples in which the location of metal particles is unclear.
3. Results
3.1. Catalyst characterization
The catalysts prepared were characterised with respect to
specific surface area, noble metal content and noble metal par-
ticle size. These results, together with the results for the spe-
cific surface area measurements of the pure support materials
are summarised in Table 2. It can be seen that the surface area
of the Al2O3 and SiO2 supported catalysts remain relatively un-
changed after both thermal treatment and noble metal impreg-
nation. However, a large loss in surface area can be observed
for the TiO2 support when calcined at 600 �C. The metal con-
tent of all Pt containing catalysts was confirmed by ICP-OES
analysis to be 1 wt. % ± 0.07 and that of the Pd series to be 0.5
wt. % ± 0.13.
In Figure 1, the results from the XRD and TEM analysis
of all samples are shown. The X-ray di↵ractograms of the
pure support materials are also displayed as a reference in or-
der to determine whether impregnation of the noble metal re-
sults in well-dispersed or larger particles. The di↵ractogram
for the fresh TiO2 support is also included in the analysis as
a phase-change from anatase to rutile is suspected to be the
explanation for the large decrease in surface area as a result
of thermal treatment, as revealed by the BET analysis. How-
ever, XRD confirms that TiO2 remains present in the form of
anatase but the primary particles of the porous titania support
have grown considerably after calcination at 600 �C. This can
be concluded from the substantial increase in intensity of the
di↵raction peaks. In the case of the Pd impregnated samples,
there appears to be no di↵erence between the di↵ractograms of
the impregnated sample and respective support material. This
indicates that the Pd particles are either very small and well
dispersed or too amorphous to be detected by XRD. However,
a combination of both of these e↵ects could also explain the
absence of di↵raction peaks related to Pd and should not be
ruled out. X-ray di↵raction peaks from metallic Pt (111) are
detected for all supports impregnated with Pt and can be seen
at 2✓ = 40� (indicated in the di↵ractograms by the dashed line)
[22]. The metal particle size range is determined using TEM
imaging. The silica supported noble metal particles are easily
detected during the analysis due to good contrast between the
noble metal and the support. A relatively narrow range of small
particles was observed for the Pd sample (1.5 - 7 nm) whereas
a much wider range is observed for the silica support impreg-
nated with Pt (1 - 120 nm). It was also possible to measure
noble metal particle size for the Pt/Al2O3 sample. Comparing
Pt/SiO2 with Pt/Al2O3, we see a much broader range in size of
noble metal particles on the SiO2 supported sample than that of
the Al2O3 supported sample (2 - 21 nm). From the TEM mi-
crographs for Pd/TiO2, Pt/TiO2 and Pd/Al2O3, it is di�cult to
distinguish individual metal particles (represented in the table
by b). In the case of Al2O3 and TiO2 supported Pd, although
the particles could not be distinguished well enough to deter-
mine their size, their presence was confirmed by EDS.
3.2. Kinetic measurements in gas flow reactor
Figure 2 shows the formation of NH3 over the catalysts in
the presence of NO and H2 (Feed 1) as a function of the in-
5

80706050403020
2Theta (º)
Inte
nsity
(a.
u.)
Pt/TiO2
TiO2
TiO2
Pt/SiO2
SiO2
Pt/Al2O3
Al2O3
g)
h)
i)
80706050403020
2Theta (º)
Inte
nsity
(a.
u.)
a)
b)
c)
Pd/TiO2
TiO2
TiO2
Pd/SiO2
SiO2
Al2O3
Pd/Al2O3
e"
f"
d" j"
k"
l"
a"
b"
c"
g"
i"
h"
50"nm"
50"nm"
50"nm"
50"nm"
50"nm"50"nm"
Figure 1: XRD di↵ractograms of a) Pd/TiO2, b) Pd/SiO2, c) Pd/Al2O3, g) Pt/TiO2, h) Pt/SiO2 and i) Pt/Al2O3. Di↵ractograms of the pure supports are also includedfor reference. TEM images of d) Pd/TiO2, e) Pd/SiO2, f)Pd/Al2O3, j) Pt/TiO2, k) Pt/SiO2 and l) Pt/Al2O3. The dashed line indicates the position of di↵raction fromPt(111). The scale bars measure 50nm.
let gas temperature. The inlet concentration of NO is 500 ppm,
thus the maximum concentration of NH3 that can be achieved at
steady-state is 500 ppm. It can thus be seen that near complete
conversion of NO to NH3 takes place over the SiO2 and Al2O3
supported catalysts between 300 and 425 �C. Below 200 �C, the
catalysts containing Pt show higher activity for NH3 formation
than their Pd containing counterparts. When exposed to this
low-temperature interval, the formation of N2O and N2 are also
observed in small quantities over all samples, as well as a small
decrease in NO conversion (ca. 10 %). At high temperature,
> 400 �C, the type of support appears to have the dominating
e↵ect on the formation of NH3. Neither of the TiO2 supported
catalysts achieve considerable conversion of NO to NH3 when
compared to the corresponding SiO2 and Al2O3 supported sam-
ples. The maximum conversion to NH3 observed over the tita-
nia supported samples is around 50 and 60 % for the Pd and Pt
containing catalysts, respectively. When repeated in the pres-
ence of excess O2, the formation of N2O and NO2 is detected
although the majority of NO remained unreacted. In general,
more NO2 is formed over Pt-containing samples over a broader
temperature range, with a maximum of ca. 150 ppm observed
over Pt/SiO2 centered at a temperature of 300 �C, compared to
ca. 50 ppm formed over Pd/SiO2 at 420 �C. Small amounts
of N2O are again observed at temperatures below 200 �C. The
Pt-containing samples were again found to be more active for
the formation of this undesirable product, with an average pro-
6

500
400
300
200
100
0
NH 3
con
cent
ratio
n (p
pm)
400300200Temperature (°C)
Pd/Al2O3
Pt/Al2O3
Pd/SiO2
Pt/SiO2
Pt/TiO2
Pd/TiO2
Figure 2: Ammonia formation over silica, alumina and titania supported Pt andPd catalysts during temperature programmed reaction using 500 ppm NO and1500 ppm H2 in Ar in the gas feed and a temperature ramp rate of 6 �C/min.The space velocity was 40 000 h�1.
duction of 100 ppm N2O compared to ca. 20 ppm over Pd-
containing products.
Figure 3a and b show the formation of NH3 and CO2 in the
presence of NO, CO and H2O (Feed 2) as a function of inlet gas
temperature for all catalysts whilst Figure 3c shows the corre-
sponding CO2 production in the presence of CO and H2O only
(Feed 3). At temperatures below 275 �C, the formation of H2
is higher over all Pd containing samples as compared to those
catalysts that contain Pt. However, this trend reverses above
this temperature when, with the exception of Pd/Al2O3, the hy-
drogen formation over the Pt containing samples is higher than
over the corresponding Pd catalysts. This corresponds well with
the results in Figure 3a which show that the formation of NH3
generally is higher over the Pd samples below 275 �C and over
the Pt samples when this temperature is exceeded. However,
this e↵ect cannot only be explained by the WGS activity of the
500
400
300
200
100
0
NH3 co
nc. (
ppm
)
400300200Temperature (°C)
1200
900
600
300
0
CO2
conc
. (pp
m)
1200
900
600
300
0 C
O 2 c
onc.
(pp
m)
a)
b)
Pt/SiO2
Pt/Al2O3
Pt/TiO2
c)
Pd/Al2O3
Pd/SiO2 Pd/TiO2
Pd/Al2O3
Pd/SiO2
Pd/TiO2
Pt/Al2O3
Pt/SiO2 Pt/TiO2
Pt/Al2O3
Pd/Al2O3
Pd/SiO2
Pt/SiO2
Pd/TiO2Pt/TiO2
Figure 3: Temperature programmed reaction experiments; formation of a) am-monia b) carbon dioxide during WGS-assisted formation of NH3 using 500ppm NO, 1500 ppm CO and 2 % H2O in Ar in the gas feed. Panel c) showsthe formation of carbon dioxide during WGS conditions feeding 1500 ppm COand 2% H2O in Ar. In all experiments a space velocity of 40 000 h�1 was used
catalysts, since more NH3 is seen to be formed between 200 and
400 �C in Figure 3a than H2 is formed in Figure 3c during the
pure WGS reaction (absence of NO). In fact, the increased CO2
formation observed in 3b may explain this behaviour and is dis-
cussed further in the final section. Unlike in the previous exper-
iment with H2 and NO (Feed 1), the Al2O3 supported catalysts
are now found to be more active than their SiO2 supported coun-
terparts. Interestingly, during the WGS-assisted experiments,
the TiO2 supported catalysts do not appear as inferior for NH3
formation as they do when H2 is available directly in the feed
gas. In fact, both samples are able to form higher amounts of
7

NH3 than the Pd/SiO2 catalyst. With regards to N2O, it is ob-
served that this product is now formed over a much broader
temperature range (200 - 400 �C) than when H2 was directly
available in the gas feed. On average, 40 ppm N2O is produced
over Pd-containing samples whilst around 10 ppm is detected
over their Pt-containing counterparts. Unlike the case when H2
is directly available in the gas feed, no N2 is formed in the low-
temperature interval when CO and H2O are used as reductants.
However, N2 begins to form at temperatures exceeding about
350 �C. When this experiment is repeated in the presence of
excess O2, NO2 is formed in very similar amounts to those de-
scribed for the same reaction with H2 directly available in the
gas mixture. As before, the most of the NO remains unreacted
in the presence of excess O2. However, no N2O is formed over
any sample when using CO and H2O as reductants.
Figure 4 shows the steady-state formation of NH3 from NO
and H2 over the catalysts as a function of the stoichiometric
number of the feed at 250, 350 and 450 �C. The stoichiomet-
ric number is varied by varying the oxygen concentration of
the feed, where S<1 represents a net-reducing feed and S>1 is
net-oxidizing. When the concentration of oxygen fed to the re-
actor is 500 ppm the feed is stoichiometrically balanced and the
S-value is 1.0. For all samples, it can be seen that the NH3 for-
mation starts when the S-value is lower than 1.0 and increases
significantly upon decreasing S-value. With the exception of
Pt/TiO2, altering of the inlet gas temperature has negligible ef-
fect on the NH3 formation over the samples when hydrogen is
included in the feed gas.
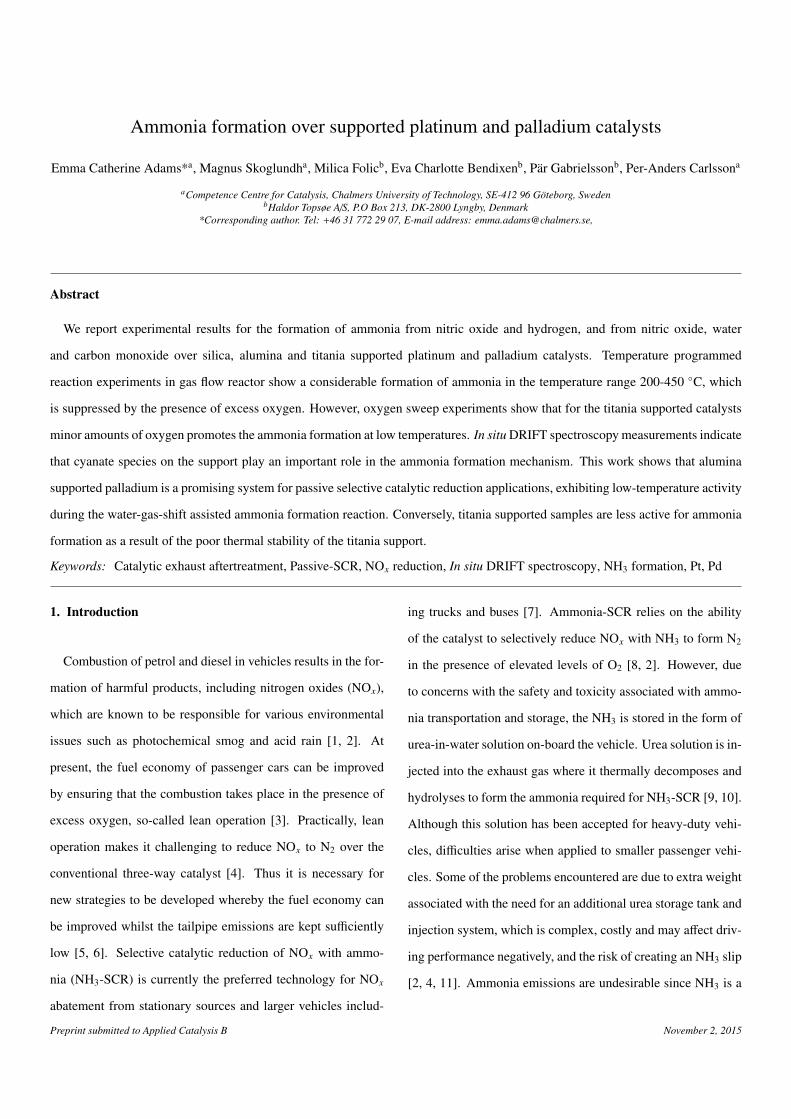
The corresponding experiments for the influence of the S-
value on the WGS-assisted NH3 formation are displayed in Fig-
ure 5. Again we see that the formation of NH3 starts when the
feed becomes net-reducing and increases significantly with de-
creasing S-value. However, in contrast to the corresponding
experiment with H2 and NO, the ammonia formation from the
1.51.00.5
Stoichiometric number, S
400
200
0
400
200
0
NH3
conc
entr
atio
n (p
pm)
400
200
0
1.51.00.5
a) Pd/TiO2 d) Pt/TiO2
c) Pd/Al2O3 f) Pt/Al2O3
b) Pd/SiO2 e) Pt/SiO2
450 ºC 350 ºC 250 ºC
Figure 4: Steady-state formation of NH3 versus oxygen concentration at 250,350 and 450 �C. The gas feed contained 500 ppm NO and 1500 ppm H2 whilethe O2 concentration was varied between 0 and 1050 ppm (S = 0.33 - 1.73) insteps of 150 ppm. Ar was used as balance and space velocity was 40 000 h�1.
feed with H2O, CO and NO is clearly dependent on the tem-
perature. At 250 �C, NH3 is exclusively formed over those cat-
alysts which contain Pd with the exception of silica supported
Pd. However, at higher temperatures, the NH3 formation in-
creases over the Pt containing catalysts. These results further
correlate with the H2 formation trends observed in Figure 2b
where it can be seen that the Pd samples are more active at
low temperatures whereas the Pt samples are more active at
higher temperatures. An interesting observation during both
the hydrogen and the WGS oxygen dependence reactions over
Pt/TiO2 at elevated temperatures (350 and 450 �C), is that the
presence of 150 ppm O2 (S = 0.53) results in higher NH3 for-
mation than complete absence of O2 in the feed.
8
1.51.00.5
Stoichiometric number, S
400
200
0
NH 3
Con
cent
ratio
n (p
pm)
400
200
0
400
200
0
1.51.00.5
450 ºC 350 ºC 250 ºC
a) Pd/TiO2 d) Pt/TiO2
b) Pd/SiO2 e) Pt/SiO2
c) Pd/Al2O3 f) Pt/Al2O3
Figure 5: Steady-state WGS assisted formation of NH3 versus oxygen concen-tration at 250, 350 and 450 �C. The gas feed contained 500 ppm NO, 1500 ppmCO and 2 % H2O while the O2 concentration was varied between 0 and 1050ppm (S = 0.33 - 1.73) in steps of 150 ppm. Ar was used as balance and spacevelocity was 40 000 h�1.
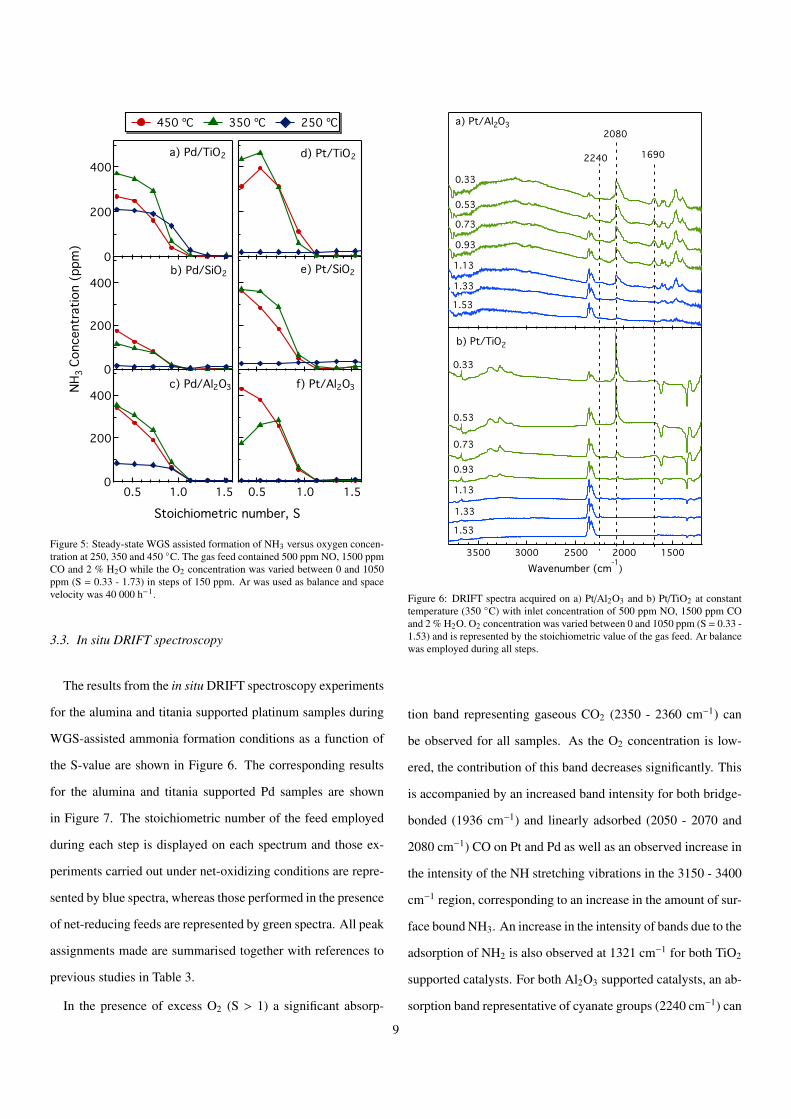
3.3. In situ DRIFT spectroscopy
The results from the in situ DRIFT spectroscopy experiments
for the alumina and titania supported platinum samples during
WGS-assisted ammonia formation conditions as a function of
the S-value are shown in Figure 6. The corresponding results
for the alumina and titania supported Pd samples are shown
in Figure 7. The stoichiometric number of the feed employed
during each step is displayed on each spectrum and those ex-
periments carried out under net-oxidizing conditions are repre-
sented by blue spectra, whereas those performed in the presence
of net-reducing feeds are represented by green spectra. All peak
assignments made are summarised together with references to
previous studies in Table 3.
In the presence of excess O2 (S > 1) a significant absorp-
3500 3000 2500 2000 1500 Wavenumber (cm-1
)
a) Pt/Al2O3
b) Pt/TiO2
1.53
1.53
1.33
1.33
1.13
1.13
0.93
0.93
0.73
0.73
0.53
0.53
0.33
0.33
2240 1690
2080
Figure 6: DRIFT spectra acquired on a) Pt/Al2O3 and b) Pt/TiO2 at constanttemperature (350 �C) with inlet concentration of 500 ppm NO, 1500 ppm COand 2 % H2O. O2 concentration was varied between 0 and 1050 ppm (S = 0.33 -1.53) and is represented by the stoichiometric value of the gas feed. Ar balancewas employed during all steps.
tion band representing gaseous CO2 (2350 - 2360 cm�1) can
be observed for all samples. As the O2 concentration is low-
ered, the contribution of this band decreases significantly. This
is accompanied by an increased band intensity for both bridge-
bonded (1936 cm�1) and linearly adsorbed (2050 - 2070 and
2080 cm�1) CO on Pt and Pd as well as an observed increase in
the intensity of the NH stretching vibrations in the 3150 - 3400
cm�1 region, corresponding to an increase in the amount of sur-
face bound NH3. An increase in the intensity of bands due to the
adsorption of NH2 is also observed at 1321 cm�1 for both TiO2
supported catalysts. For both Al2O3 supported catalysts, an ab-
sorption band representative of cyanate groups (2240 cm�1) can
9
3500 3000 2500 2000 1500 Wavenumber (cm-1
)
a) Pd/Al2O3
b) Pd/TiO2
1.53
1.33
1.13
0.93
0.73
0.53
0.33
0.33
0.53
0.73
0.93
1.13
1.33
1.53
2240
2050
1920
1746
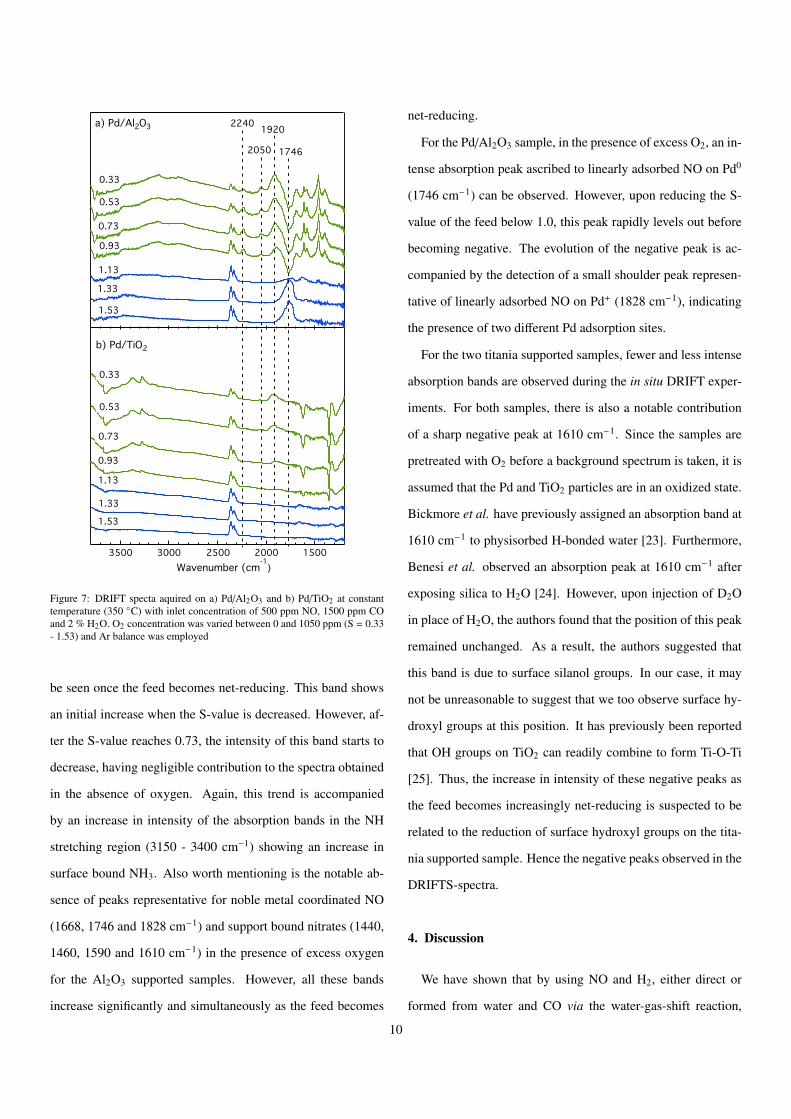
Figure 7: DRIFT specta aquired on a) Pd/Al2O3 and b) Pd/TiO2 at constanttemperature (350 �C) with inlet concentration of 500 ppm NO, 1500 ppm COand 2 % H2O. O2 concentration was varied between 0 and 1050 ppm (S = 0.33- 1.53) and Ar balance was employed
be seen once the feed becomes net-reducing. This band shows
an initial increase when the S-value is decreased. However, af-
ter the S-value reaches 0.73, the intensity of this band starts to
decrease, having negligible contribution to the spectra obtained
in the absence of oxygen. Again, this trend is accompanied
by an increase in intensity of the absorption bands in the NH
stretching region (3150 - 3400 cm�1) showing an increase in
surface bound NH3. Also worth mentioning is the notable ab-
sence of peaks representative for noble metal coordinated NO
(1668, 1746 and 1828 cm�1) and support bound nitrates (1440,
1460, 1590 and 1610 cm�1) in the presence of excess oxygen
for the Al2O3 supported samples. However, all these bands
increase significantly and simultaneously as the feed becomes
net-reducing.
For the Pd/Al2O3 sample, in the presence of excess O2, an in-
tense absorption peak ascribed to linearly adsorbed NO on Pd0
(1746 cm�1) can be observed. However, upon reducing the S-
value of the feed below 1.0, this peak rapidly levels out before
becoming negative. The evolution of the negative peak is ac-
companied by the detection of a small shoulder peak represen-
tative of linearly adsorbed NO on Pd+ (1828 cm�1), indicating
the presence of two di↵erent Pd adsorption sites.
For the two titania supported samples, fewer and less intense
absorption bands are observed during the in situ DRIFT exper-
iments. For both samples, there is also a notable contribution
of a sharp negative peak at 1610 cm�1. Since the samples are
pretreated with O2 before a background spectrum is taken, it is
assumed that the Pd and TiO2 particles are in an oxidized state.
Bickmore et al. have previously assigned an absorption band at
1610 cm�1 to physisorbed H-bonded water [23]. Furthermore,
Benesi et al. observed an absorption peak at 1610 cm�1 after
exposing silica to H2O [24]. However, upon injection of D2O
in place of H2O, the authors found that the position of this peak
remained unchanged. As a result, the authors suggested that
this band is due to surface silanol groups. In our case, it may
not be unreasonable to suggest that we too observe surface hy-
droxyl groups at this position. It has previously been reported
that OH groups on TiO2 can readily combine to form Ti-O-Ti
[25]. Thus, the increase in intensity of these negative peaks as
the feed becomes increasingly net-reducing is suspected to be
related to the reduction of surface hydroxyl groups on the tita-
nia supported sample. Hence the negative peaks observed in the
DRIFTS-spectra.
4. Discussion
We have shown that by using NO and H2, either direct or
formed from water and CO via the water-gas-shift reaction,
10

Table 3: Summary of vibration and species assignments for the in situ DRIFTS experiments. (s) and (as) represent the symmetric and asymmetric stretchingvibrations respectively.
Wavenumber (cm�1) Vibration Species Ref.1321 H-N-H (as) NH2 on TiO2 [26]1440 CO2 (as) Bicarbonate on Al2O3 [27, 28]1460 N=O (s) Linearly bound nitrate on Al2O3 [28]1590 N=O (s) Chelating bidentate nitrate on Al2O3 [28]1610 N=O (s) Bridge-bonded bidentate nitrate on Al2O3 [28]1668 N=O (s) Linearly bound NO on Pt [29]1746 N=O (s) Linearly bound NO on Pd0 [30]1828 N=O (s) Linearly bound NO on Pd+ [30]1936 C=O (s) Bridge-bonded CO on Pd [31]
2050-2070 C=O (s) Linearly bound CO on Pt [32]2080 C=O (s) Linearly bound CO on Pd [6, 31]2260 C=N (s) Isocyanate (-CNO) on Al2O3 [6, 33, 31, 34]
2350-2360 C=O (s) Gaseous CO2 [29, 33, 34]3150-3400 N-H (s)(as) NH3 bound to Lewis acid sites [2, 35, 36]
considerable amounts of ammonia can be formed over silica,
alumina and titania supported platinum and palladium catalysts
in a fairly broad temperature interval ranging from 200 to 450
�C. With the assumption that no significant storage of NH3 on
the catalyst takes place, near complete conversion of NO to
NH3 over the Al2O3 and SiO2 supported catalysts is possible
when H2 is directly available in the feed. The decrease in NH3
formation above 425 �C, with no accompanying change in NO
conversion, indicates that ammonia starts to decompose, form-
ing elemental N2 and H2 at high temperatures [16, 37]. We have
also shown that oxygen is detrimental to the ammonia forma-
tion, however, in some cases a minor oxygen supply may be
beneficial. The results that are obtained point towards a depen-
dence on not only the support material of the catalyst but also
the type of noble metal for adequate production of the desired
NH3. In the following we will discuss the roles of, on one hand,
the noble metals and, on the other hand, the support materials
for the ammonia formation mechanism.
To allow fair comparison of the influence of the noble metal
(Pt or Pd) on the activity for ammonia formation, the molar
amount of noble metal was kept constant during catalyst syn-
thesis, i.e. the platinum catalysts were prepared with a noble
metal loading of 1.0 wt.% whilst the palladium catalysts a load-
ing of 0.5 wt.%. The results from the ICP-OES measurements
confirm the targeted loadings. One should notice, however, that
the same molar amount of noble metal is not the only criterion
for a fair comparison as the precious metal dispersion and/or
particle size distribution may be rather di↵erent between the
di↵erent samples, which of course may influence the catalytic
properties [22]. This is due to varying degree of interaction
between the noble metal and metal oxide support, which is
unique in each case. Generally silica is considered to interact
more weakly with noble metals than alumina and titania [38].
From the TEM analysis this is recognized by relatively large
noble metal particles for the silica samples. Unfortunately we
could not make a proper particle size distribution analysis due
to the inability to distinguish individual noble metal particles in
Pd/Al2O3 and the titania supported samples. This is most likely
due to small and/or oxidized metal particles resulting in too
low contrast/resolution. Interestingly in the case of Pt/TiO2, al-
though the expected Pt content is confirmed via ICP-EOS anal-
ysis, platinum is neither observed by TEM nor EDS analysis.
This may suggest that instead of well-dispersed Pt particles, the
sample consists of larger particles not identified. This is sup-
ported by the presence of the sharp X-ray di↵raction peak from
metallic Pt (111), but is also confirmed by the in situ DRIFTS
11

results showing a very sharp and intense absorption band for
linearly adsorbed CO during oxygen-free conditions (cf. Figure
6), which is expected for extended facets [39]. However, de-
spite these di↵erences between the samples it is still possible to
compare the types of noble metals and support materials from
the point of view of catalyst systems. Furthermore we mention
that experiments (not shown) with significantly lower Pt load-
ing gave nearly the same quantitative result, which supports that
di↵erences in noble metal dispersion of the present samples is
not critical for the conclusions made here. Also, thanks to the
in situ DRIFTS experiments the mechanism behind ammonia
formation can be discussed in more detail.
The kinetic measurements in the flow reactor clearly show
that the type of metal employed in the catalyst formulation has
a significant e↵ect on the NH3 formation. At temperatures be-
low 200 �C, when hydrogen is available in the feed, the Pt con-
taining samples produce significantly more NH3 than their Pd
counterparts (cf. Figure 2). On the contrary, below 250 �C
during WGS-assisted reaction conditions, the trend appears to
switch so that the Pd containing samples show increased activ-
ity as compared to the Pt containing counterparts (cf. Figure 3).
This trend can also be seen in the steady-state experiments in
Figure 5, for which no NH3 is formed over the Pt samples at
250 �C although the TiO2 and Al2O3 supported Pd samples are
active under these conditions. This can partly be explained by
the enhanced low-temperature WGS activity over Pd compared
to that of Pt, and has previously been reported in the literature
[17]. It can also be seen that at higher temperature (300 �C)
higher amounts of NH3 are formed over the Pt samples. These
results are in line with those of Cant et al. [40] who observed
that NO removal over Pt/Al2O3 in the presence of H2 and CO
is only evident above 220 �C. The authors suggested that Pt
and Pd surfaces are more prone to be covered by CO than NO
and that this e↵ect is more pronounced on Pt than Pd. Our in
situ DRIFTS results support this suggestion as the build-up of
linearly adsorbed CO as the S-value is lowered is more pro-
nounced and occurs at higher S-values for the Pt samples than
for the Pd samples. According to Cant et al. [40], this sur-
face coverage is detrimental to NOx reduction since the surface
becomes predominantly covered by CO, which displaces NO
and hinders the dissociative adsorption of H2 required for the
reduction of NO. Once hydrogen is dissociated, the H adatoms
are considered to facilitate the reduction of NO by removal of O
adatoms from dissociated NO or by hydrogen-assisted NO dis-
sociation. Macleod et al. [41] also reported that the presence of
CO has a negative e↵ect on the reduction of NO on Pt, shifting
the activity window for NO reduction towards higher tempera-
tures. Moreover, they also showed that the presence of CO has
a beneficial e↵ect on the reduction of NO with H2 over Pd sys-
tems. This can explain why reduced activity is observed over
Pt-containing samples during the steady-state WGS assisted re-
actions at S=0.33 as compared to when a slight O2 availability
is present (S=0.53). The presence of metallic palladium, Pd0,
in excess oxygen is consistent with previously reported results
by Miller et al. [30]. In their work the authors suggest that this
site is responsible for the oxidation of CO to CO2 and since the
vibration from this species disappeared below the stoichiomet-
ric point for CO oxidation (shifting instead towards Pd+), this
suggestion seems reasonable.
Turning the focus on the role of the support material, it is
clear that alumina and titania generate the most of the discus-
sion in the present study and are probably the most interest-
ing materials for future work. Also, as mentioned in the In-
troduction, Macleod et al. [2] proposed that Al2O3 enhances
the hydrolysis of surface-bound cyanate (-NCO) groups to NH3
whilst TiO2 supports promote the formation of -NCO groups.
Hence, we focused the in situ DRIFTS experiments on the
WGS-assisted NH3 formation over Al2O3 and TiO2 supported
12

catalysts, specifically addressing the influence of the stoichio-
metric number of the feed.
Since it is thought that one route for NH3 formation proceeds
via direct reaction of H2 with adsorbed NO [11, 15], the re-
duced NH3 formation observed over the TiO2 samples when
H2 is available in the feed during the temperature programmed
reaction experiments may be related to the reduced surface area
caused as a result of high-temperature treatment. It is possible
that the loss of surface area of the support results in a lowered
NO adsorption capacity thus resulting in less NO available to
react with H2. Upon observation of the DRIFT spectra obtained
for both the TiO2 samples, the intensity of the observed absorp-
tion bands for the Pd/TiO2 sample is very low. Again, this is
most likely related to the reduced surface area upon calcina-
tion, possibly suggesting that many of the active Pd particles
present in the sample have been engulfed by the support dur-
ing the growth of TiO2 particles. This makes the active sites
increasingly di�cult to reach, reducing the adsorption capacity
for reactant molecules. Another feature of the DRIFT spec-
tra, which supports the explanation that it is the limited adsorp-
tion capacity of this sample which negatively a↵ects its activ-
ity, is the absence of absorption bands representative of cyanate
groups. Since Macleod et al [2] propose that TiO2 promotes the
formation of cyanate groups on its surface, we would have ex-
pected to see a more substantial contribution of these peaks to
the obtained spectra than those on the Al2O3 support. However,
no such peaks were observed at all, indicating a significant loss
of active sites on the sample. From the results in this study, it
can be concluded with some confidence that there is more than
one route possible for NH3 formation using NO, CO and H2O
as reactants since NH3 was detected over the TiO2 supported
samples despite the absence of cyanate groups.
An interesting trend observed for the TiO2 supported samples
is the enhanced activity for NH3 formation when in the presence
of some O2 (S=0.53) as compared to a total absence (0.33).
This can be related to the well recognized strong metal-support
interaction of TiO2 supported noble metal catalysts, which has
been reported extensively in literature [42, 43, 44]. Under re-
ducing conditions at high temperature (> 300 �C), reduced ti-
tania (TiOx) can migrate onto the surface of the noble metal
crystallites thereby strongly modifying or even covering active
sites. This alters the chemisorption properties of the catalyst,
possibly making the adsorption and dissociation of NO a lim-
iting factor for the NH3 formation. In the presence of O2 this
e↵ect is dampened, which promotes formation of ammonia.
During the WGS-assisted experiments, a clear di↵erence in
activity between the Al2O3 and SiO2 supported samples is ob-
served, as compared to the very similar behaviour they exhibit
when hydrogen is available in the feed gas. This di↵erence in
activity can be due to Al2O3 sites that contribute towards rapid
hydrolysis of cyanate groups (-NCO) to NH3 as proposed by
Macleod et al [2] but can also be ascribed to the enhanced H2
formation ability during the WGS reaction itself over Al2O3
compared to SiO2 as observed in Figure 3c. It is of importance
at this point to state that both cyanate hydrolysis and WGS ac-
tivity seem to have an influence on the NH3 formation during
this reaction. The increase in concentration of CO2 observed
in Figure 3b compared to Figure 3c, as a result of the addition
of NO into the gas feed, may be explained by the hydrolysis
of the cyanate groups to form NH3 and CO2 (Eqns 5-8). This
explains the enhanced NH3 formation in the temperature range
200 - 400 �C as compared to the WGS activity of the samples in
this region when the stoichiometric requirement of H2 needed
for NH3 formation (Eqn 3) is not met. The results obtained dur-
ing the in situ DRIFTS experiments over Al2O3 also support
the proposition of NH3 being formed by hydrolysis of cyanates
since, as previously mentioned, an initial increase in intensity
of cyanate vibration followed by a decrease can be observed.
13

The decrease in cyanate intensity is also accompanied by an
increase in the intensity of the NH3 stretching region.
During the steady-state experiments, when the e↵ect of the
stoichiometric number on the formation of NH3 was investi-
gated, 500 ppm O2 was chosen as the most significant concen-
tration to focus the experiment around since it is the stoichio-
metric concentration required for complete oxidation of H2 to
H2O, a factor which was thought to be the limiting factor for the
formation of NH3 in the presence of O2. It can be seen that NH3
formation begins when there is insu�cient O2 available for the
total oxidation of H2, suggesting that this is indeed a limiting
factor in the production of NH3 over the catalysts. It is also ev-
ident that NH3 formation is possible at slightly higher oxygen
concentrations (S-values) when hydrogen is directly available
in the feed as compared to WGS reaction conditions. This may
be explained by the fact that, in the case of the WGS reaction,
there is more than one reductant that can be oxidized over the
catalyst. Due to the presence of CO, it may be even more neces-
sary to limit the presence of O2 in the system since it has such
a strong impeding e↵ect on the production of NH3. The pro-
posal that the oxidation of CO to CO2 and hence limitation of
H2 formation as a result of the presence of oxygen in the feed
being the main cause of NH3 suppression seems viable from the
DRIFT spectra obtained. This can be said because as the inten-
sity of the CO2 vibration decreases, a growth in intensity of the
NH3 stretching region is observed. However, since isocyanate
hydrolysis is an alternative pathway for the formation of NH3
which has led to much discussion in this work, the absence of
peaks representative of adsorbed -CNO whilst in the presence
of excess O2 should not be ignored. This indicates that an ad-
ditional explanation for reduced activity in the presence of ex-
cess O2 is the inhibition of the formation of isocyanate surface
species.
5. Conclusions
This study shows that under oxygen deficient conditions it
is possible to form significant amounts of NH3 from nitric ox-
ide and H2 or water via the WGS reaction over silica, alumina
and titania supported platinum and palladium in the tempera-
ture interval 200-450 �C. However, the formation of ammonia
is considerably supressed in the presence of O2. The Al2O3 sup-
ported Pd stands out as a promising material for passive SCR
applications not only because it is active over a broad tempera-
ture range when H2 is directly available in the gas feed, but also
due to high activity for the WGS assisted reaction, exhibiting a
lower light-o↵ temperature than its Pt-containing counterpart.
In situ DRIFT spectroscopy experiments support that when
water is used as the source of hydrogen, there is more than one
reaction route possible for NH3 formation; direct reaction of
H2 with stored NO but also hydrolysis of cyanate groups. It
also shows that the inhibition of the water-gas-shift reaction due
to the presence of oxygen in the feed is responsible for NH3
suppression over the investigated catalysts.
Concerning the TiO2 samples in this investigation, these need
to be thermally stabilised in order to be suitable for use in au-
tomotive applications as it seems that the formation of large
TiO2 particles leads to low activity. Stabilisation would also be
necessary in order to successfully characterise the mechanisms
behind NH3 formation at high temperature.
6. Acknowledgments
This work was financially supported by the Swedish En-
ergy Administration through the FFI program and the Com-
petence Centre for Catalysis, which is financially supported
by Chalmers University of Technology, the Swedish Energy
Agency and the member companies: AB Volvo, ECAPS AB,
Haldor Topsøe A/S, Volvo Car Corporation, Scania CV AB,
and Wartsila Finland Oy.
14

7. References
[1] M. A. Gomez-Garcıa, V. Pitchon, and A. Kiennemann Environ. Int.,
vol. 31, pp. 445–467, 2005.
[2] N. Macleod, R. Cropley, J. M. Keel, and R. M. Lambert J. Catal., vol. 221,
pp. 20–31, 2004.
[3] Y. Liu, M. P. Harold, and D. Luss Appl. Catal. B: Environ., vol. 121,
pp. 239–251, 2012.
[4] S. M. Park, M.-Y. Kim, E. S. Kim, H.-S. Han, and G. Seo Appl. Catal. A:
Gen., vol. 395, pp. 120–128, 2011.
[5] A. Lindholm, N. Currier, J. Li, A. Yezerets, and L. Olsson J. Catal.,
vol. 258, pp. 273–288, 2008.
[6] N. Macleod and R. M. Lambert Appl. Catal. B: Environ., vol. 46, pp. 483–
495, 2003.
[7] C. Ciardelli, I. Nova, E. Tronconi, D. Chatterdee, T. Burkhardt, and
M. Weibel Chem. Eng. Sci., vol. 62, pp. 5001–5006, 2007.
[8] P. Forzatti, L. Lietti, I. Nova, and E. Tronconi Catal. Today, vol. 151,
pp. 202–211, 2010.
[9] M. Koebel, M. Elsener, and M. Kleemann Catal. Today, vol. 59, pp. 335–
345, 2000.
[10] G. Li, C. Jones, V. Grassian, and S. Larsen J. Catal., vol. 234, pp. 401–
413, 2005.
[11] P. R. Dasari, R. Muncrief, and M. P. Harold Catal. Today, vol. 184,
pp. 43–53, 2012.
[12] N. V. Heeb, A.-M. Forss, S. Bruhlmann, R. Luscher, C. J. Saxer, and
P. Hug Atm. Environ, vol. 40, pp. 5986–5997, 2006.
[13] T. D. Durbin, J. T. Pisano, T. Younglove, C. G. Sauer, S. H. Rhee, T. Huai,
J. W. Miller, G. I. MacKay, A. M. Hochhauser, M. C. Ingham, R. A.
Gorse, L. K. Beard, D. DiCicco, N. Thompson, R. J. Stradling, J. A.
Rutherford, and J. P. Uihlein Atmos. Environ., vol. 38, pp. 2699–2708,
2004.
[14] C. D. DiGulio, J. A. Pihl, J. E. Parks II, M. D. Amiridis, and T. J. Toops
Catal. Today, vol. 231, pp. 33–45, 2014.
[15] F. Can, X. Courtois, S. Royer, G. Blanchard, S. Rousseau, and D. Duprez
Catal. Today, vol. 197, pp. 144–154, 2012.
[16] R. D. Clayton, M. P. Harold, and V. Balakotaiah Appl. Catal. B: Environ,
vol. 81, pp. 161–181, 2008.
[17] N. W. Cant, D. C. Chambers, and I. O. Y. Liu Appl. Catal. B: Environ,
vol. 46, pp. 551–559, 2003.
[18] M. L. Unland Science, vol. 179, pp. 567–569, 1973.
[19] S. Brunauer, P. H. Emmett, and E. Teller J. Am. Chem. Soc., vol. 60,
pp. 309–319, 1938.
[20] H. Kannisto, X. Karatzas, J. Edvardsson, L. J. Pettersson, and H. H. In-
gelston Appl. Catal. B: Environ., vol. 104, pp. 74–83, 2011.
[21] J. C. Summers and K. Baron J. Catal., vol. 57, pp. 380–389, 1979.
[22] S. K. Matam, E. V. Kondratenko, M. H. Aguirre, P. Hug, D. Rentsch,
A. Winkler, A. Weidenka↵, and D. Ferri Appl. Catal. B: Environ.,
vol. 129, pp. 214–224, 2013.
[23] C. R. Bickmore, K. F. Waldner, R. Baranwal, T. Hinklin, D. R. Treadwell,
and R. M. Lain J. Eur. Ceram. Soc., vol. 18, pp. 287–297, 1998.
[24] H. A. Benesi and A. C. Jones J. Phys. Chem., vol. 63, pp. 179–182, 1959.
[25] S. Yamazoe, T. Okumura, Y. Hitomi, S. T, and T. Tanaka J. Phys. Chem.,
vol. 111, pp. 11077–11085, 2007.
[26] S. M. Lee and S. C. Hong Appl. Catal. B: Environ., vol. 163, pp. 30–39,
2015.
[27] C. Morterra and G. Magnacca Catal. Today, vol. 27, pp. 497–532, 1996.
[28] T. J. Toops, D. B. Smith, W. S. Epling, J. E. Parks, and W. P. Partridge
Appl. Catal. B: Environ., vol. 58, pp. 255–264, 2005.
[29] S.-H. Chien, M.-C. Kuo, C.-H. Lu, and K.-N. Lu Catal. Today, vol. 97,
pp. 121 – 127, 2004.
[30] D. D. Miller and S. S. C. Chuang J. Taiwan Inst. Chem. E., vol. 40,
pp. 613–621, 2009.
[31] S. Almusaiteer and S. S. C. Chuang J. Catal., vol. 201, pp. 189–201,
1999.
[32] I. Nova, L. Lietti, P. Forzatti, F. Prinetto, and G. Ghiotti Catal. Today,
vol. 151, pp. 330–337, 2010.
[33] C. Neyertz, D. Volpe, D. Perez, I. Costilla, M. Sanchez, and C. Gigola
Appl. Catal. A: Gen., vol. 368, pp. 146–157, 2009.
[34] Y. Ji, T. J. Toops, J. A. Pihl, and M. Crocker Appl. Catal. B: Environ.,
vol. 91, pp. 329–338, 2009.
[35] T. Nanba, F. Meunier, C. Hardacre, J. P. Breen, R. Burch, S. Masukawa,
J. Uchisawa, and A. Obuchi J. Phys. Chem. C., vol. 112, pp. 18157–
18163, 2008.
[36] L. Castoldi, R. Bonzi, L. Lietti, P. Forzatti, S. Morandi, G. Ghiotti, and
S. Dzwigaj J. Catal., vol. 282, pp. 128–144, 2011.
[37] J. Choi, W. P. Partridge, J. A. Pihl, M.-Y. Kim, P. Koci, and C. S. Daw
Catal. Today, vol. 184, pp. 20–26, 2012.
[38] A. Vazquez-Zavala, J. Garcıa-Gomez, and A. Gomez-Cortes Appl. Surf.
Sci., vol. 167, pp. 177–183, 2000.
[39] A. Priebe, G. Fahsold, and A. Pucci J. Phys. Chem., vol. 108, pp. 18174–
18178, 2004.
[40] N. W. Cant, D. C. Chambers, and I. O. Y. Liu J. Catal., vol. 231, pp. 201–
212, 2005.
[41] N. Macleod and R. M. Lambert Appl. Catal. B: Environ., vol. 35, pp. 269–
279, 2002.
[42] J. C. Colmenares, A. Magdziarz, M. A. Aramendia, A. Marinas, M. J. M,
F. J. Urbano, and J. A. Navio Catal. Commun., vol. 16, pp. 1–6, 2011.
15

[43] M. S. Spencer J. Catal., vol. 93, pp. 216–223, 1985.
[44] O. Dulub, W. Habenstreit, and U. Diebold Phys. Rev. Lett., vol. 84,
pp. 3646–3649, 2000.
16