Embed Size (px)
Citation preview
Report No. 53331-ALB
CLIMATE VULNERABILITY ASSESSMENTS
An Assessment of Climate Change Vulnerability, Risk, and
Adaptation in Albania’s Power Sector
FINAL REPORT
December 2009
Pub
lic D
iscl
osur
e A
utho
rized
Pub
lic D
iscl
osur
e A
utho
rized
Pub
lic D
iscl
osur
e A
utho
rized
Pub
lic D
iscl
osur
e A
utho
rized
Pub
lic D
iscl
osur
e A
utho
rized
Pub
lic D
iscl
osur
e A
utho
rized
Pub
lic D
iscl
osur
e A
utho
rized
Pub
lic D
iscl
osur
e A
utho
rized
Pub
lic D
iscl
osur
e A
utho
rized
Pub
lic D
iscl
osur
e A
utho
rized
Pub
lic D
iscl
osur
e A
utho
rized
Pub
lic D
iscl
osur
e A
utho
rized
Pub
lic D
iscl
osur
e A
utho
rized
Pub
lic D
iscl
osur
e A
utho
rized
Pub
lic D
iscl
osur
e A
utho
rized
Pub
lic D
iscl
osur
e A
utho
rized
Pub
lic D
iscl
osur
e A
utho
rized
Pub
lic D
iscl
osur
e A
utho
rized
Pub
lic D
iscl
osur
e A
utho
rized
Pub
lic D
iscl
osur
e A
utho
rized
Pub
lic D
iscl
osur
e A
utho
rized
Pub
lic D
iscl
osur
e A
utho
rized
Pub
lic D
iscl
osur
e A
utho
rized
Pub
lic D
iscl
osur
e A
utho
rized
Pub
lic D
iscl
osur
e A
utho
rized
Pub
lic D
iscl
osur
e A
utho
rized
Pub
lic D
iscl
osur
e A
utho
rized
Pub
lic D
iscl
osur
e A
utho
rized
Pub
lic D
iscl
osur
e A
utho
rized
Pub
lic D
iscl
osur
e A
utho
rized
Pub
lic D
iscl
osur
e A
utho
rized
Pub
lic D
iscl
osur
e A
utho
rized
Pub
lic D
iscl
osur
e A
utho
rized
Pub
lic D
iscl
osur
e A
utho
rized
Pub
lic D
iscl
osur
e A
utho
rized
Pub
lic D
iscl
osur
e A
utho
rized

i
ESMAP MISSION
The Energy Sector Management Assistance Program (ESMAP) is a global knowledge and technical assistance trust fund
program administered by the World Bank and assists low- and middle-income countries to increase know-how and institutional
capacity to achieve environmentally sustainable energy solutions for poverty reduction and economic growth.
ESMAP COPYRIGHT DISCLAIMER
Energy Sector Management Assistance Program (ESMAP) reports are published to communicate the results of ESMAP‘s work
to the development community with the least possible delay. Some sources cited in this paper may be informal documents that
are not readily available.
The findings, interpretations, and conclusions expressed in this report are entirely those of the author(s) and should not be
attributed in any manner to the World Bank, or its affiliated organizations, or to members of its board of executive directors for
the countries they represent, or to ESMAP. The World Bank and ESMAP do not guarantee the accuracy of the data included in
this publication and accepts no responsibility whatsoever for any consequence of their use. The boundaries, colors,
denominations, other information shown on any map in this volume do not imply on the part of the World Bank Group any
judgment on the legal status of any territory or the endorsement of acceptance of such boundaries.
Vice President: Philippe H Le Houerou
Country Director: Jane Armitage
Sector Director: Peter Thomson
Sector Manager: Ranjit Lamech
Task Team Leader: Jane Ebinger
ii
TABLE OF CONTENTS
SYNOPSIS vi
ACKNOWLEDGMENTS vii
ACRONYMS viii
EXECUTIVE SUMMARY ix
Albania‘s Energy Sector and Climate Change ix
Recommendations for Building Climate Resilience of the Energy Sector xi
PËRMBLEDHJE EKZEKUTIVE xv
Sektori i energjisë në Shqipëri dhe ndryshimet klimatike xv
Rekomandimet për krijimin e elasticitetit klimatik të sektorit energjitik xvii
1. OVERVIEW 1
1.1 Methodological Approach 2
1.2 Structure of this Report 4
2. CONTEXT 5
2.1 Existing Energy Sector Context in Albania 5
2.2 Climate Is Changing 13
2.3 Albania‘s Low Adaptive Capacity 20
3. CLIMATIC VULNERABILITIES, RISKS, AND OPPORTUNITIES FOR ALBANIA‘S ENERGY
SECTOR
24
3.1 Cross-cutting Issues 26
3.2 Large Hydropower Plants (LHPPs) 26
3.3 Small Hydropower Plants (SHPPs) 29
3.4 Thermal Power Plants (TPPs) 31
3.5 Wind Power 32
3.6 Power Transmission and Distribution 33
3.7 Energy Demand 34
3.8 Oil, Gas, and Coal Production 34
4. IDENTIFICATION OF ADAPTATION OPTIONS FOR MANAGING RISKS TO ALBANIA‘S
ENERGY SECTOR
36
5. COST–BENEFIT ANALYSIS OF ADAPTATION OPTIONS 51
5.1 Objective of the Cost–Benefit Analysis 51
5.2 Assessment of Shortfall in Future Power Generation Due to Climate Change 51
5.3 Options to Meet the Projected Power Shortfall Due to Climate Change 55
5.4 Benefit Categories / Parameters Used in the Cost–Benefit Analysis 58
5.5 Results of the Cost–Benefit Analysis 62
5.6 Sensitivity Analysis 64
5.7 Using the Results of the Cost–Benefit Analysis to Support Decisions to Manage
the Albanian Energy Sector in the Face of Climate Change
71
6. NEXT STEPS TO IMPROVE THE CLIMATE RESILIENCE OF ALBANIA‘S ENERGY SECTOR 75
7. REFERENCES, ANNEXES, AND APPENDICES 77
ANNEX 1: METHODOLOGICAL APPROACH TO THE ASSESSMENT 81
A1.1 Analysis of Observed Climatic Conditions and Data on Future Climate Change 81
A1.2 Geographical Information System (GIS) Mapping 81
A1.3 Workshop 1: Hands-on Vulnerability, Risk, and SWOT Analyses with Energy
Sector Stakeholders in Albania
83
A1.4 Analysis of Climate Risks for Regional Energy Markets in South East Europe 85
A1.5 Development of High-level Qualitative and Quantitative Assessments of Climate
Change Risks to Energy Assets
85
A1.6 Workshop 2: Adaptation and Cost–Benefit Analysis with Energy Sector
Stakeholders in Albania
86
A1.7 High-level Cost–Benefit Analysis (CBA) 87
ANNEX 2: RISK ASSESSMENT BACKGROUND AND RATIONALE 88

iii
ANNEX 3: ADAPTATION OPTIONS 91
ANNEX 4: WEATHER / CLIMATE INFORMATION SUPPORT FOR ENERGY SECTOR MANAGEMENT 109
ANNEX 5: FURTHER DETAILS ON APPROACH TO COST–BENEFIT ANALYSIS 112
A5.1 Methodology 112
A5.2 Framing Workshop Parameters Summary 115
A5.3 Financial Assumptions 121
A5.4 Benefits Assessment and Valuation 121
A5.5 Benefit/Disbenefit Valuation 122
A5.6 Results Summary 124
A5.7 Limitations 125
ANNEX 6: FURTHER DETAILS ON OPTIONS TO IMPROVE THE CLIMATE RESILIENCE OF
ALBANIA‘S ENERGY SECTOR
127
ANNEX 7: ALBANIA POWER SUPPLY DEMAND PASSIVE SCENARIO PROJECTIONS
2003 TO 2050
132
ANNEX 8: ESTIMATING IMPACTS OF CLIMATE CHANGE ON LARGE HYDROPOWER PLANTS IN
ALBANIA
140
A8.1 Existing Available Information on LHPPs and Climate Change Impacts 140
A8.2 Albania‘s First National Communication 141
A8.3 Assessment of Climate Change Impacts on the Vjosa Basin 142
A8.4 Assessment of Climate Change Impacts on the Mati River Basin 143
A8.5 Correlation of Annual Average Inflows to Fierze and Electricity Generation 144
A8.6 Verbal Information from the World Bank 146
A8.7 Assessments of LHPPs in Brazil 146
A8.8 Summary 146
ANNEX 9: ESTIMATING IMPACTS OF CLIMATE CHANGE ON ENERGY GENERATION IN ALBANIA,
EXCLUDING LARGE HYDROPOWER PLANTS
148
A9.1 Small Hydropower Plants (SHPPs) 148
A9.2 Thermal Power Plants (TPPs) 148
A9.3 Wind 148
A9.4 Domestic Solar Heaters 148
A9.5 Concentrated Solar Power 149
A9.6 Transmission and Distribution 149
ANNEX 10: GLOSSARY OF KEY TERMS 150
FIGURES
Figure 1: Generation, import, and supply of energy in Albania from 2002 to 2008 x
Figure 2: Net Present Value of diversification options, using base case assumptions xiv
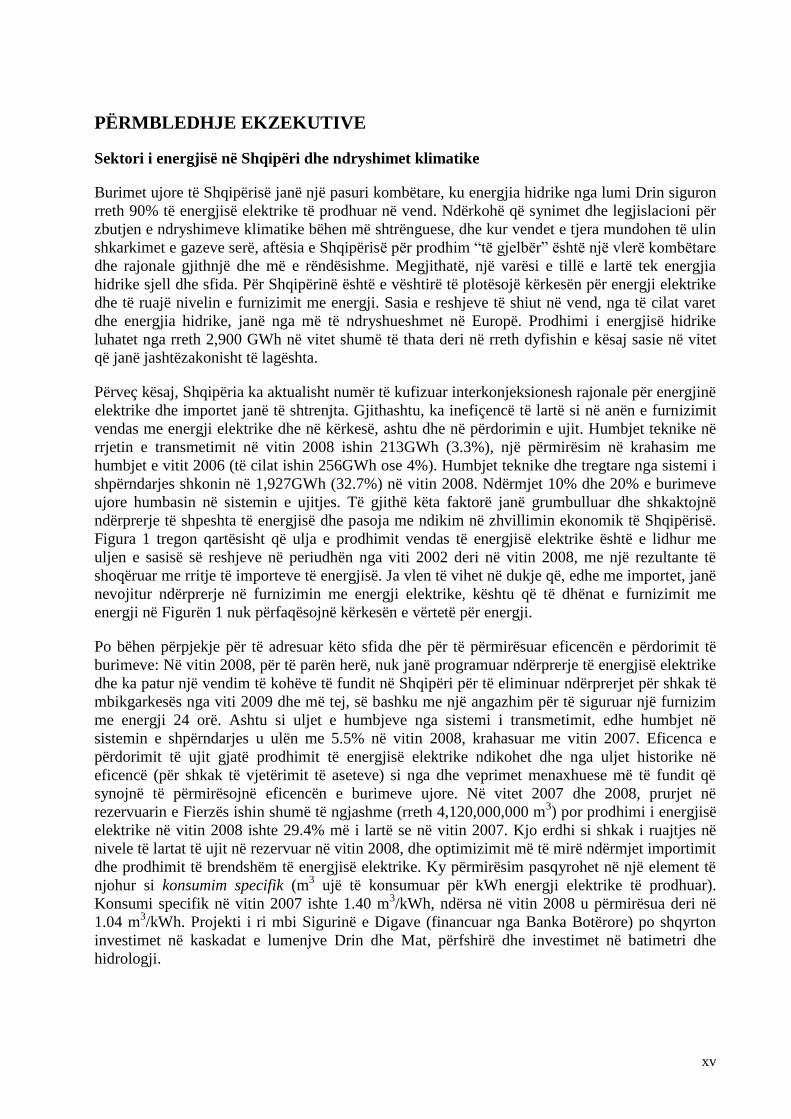
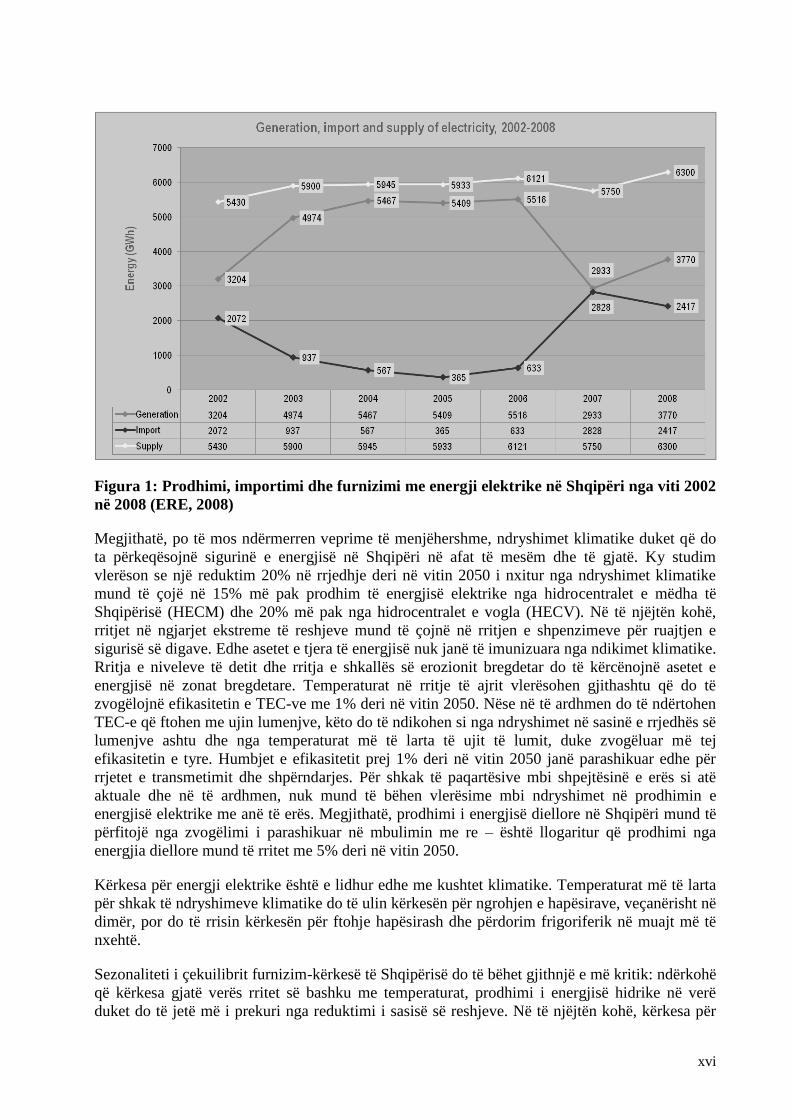
Figura 1: Prodhimi, importimi dhe furnizimi me energji elektrike në Shqipëri nga viti 2002 në
2008
xvi
Figura 2: Vlera e Tanishme Neto e alternativave të diversifikimit, duke përdorur supozimet e
rastit bazë
xx
Figure 3: The UKCIP risk-based decision-making framework for climate change adaptation,
modified for use in this assignment
3
Figure 4: Generation, import, and supply of energy in Albania from 2002 to 2008 6
Figure 5: Locations of the five large hydropower plants that provide about 90 percent of
Albania‘s domestic electricity production
9
Figure 6: Existing and candidate interconnections in the region 12
Figure 7: Increases in concentrations of carbon dioxide in the atmosphere from 10,000 years
before present to the year 2005
13
Figure 8: Observed changes in climate, physical and biological systems 14
Figure 9: Projected increases (averaged across nine IPCC AR4 global climate models) in winter
and summer temperatures across South East Europe by the 2050s compared to the 1961
to 1990 average, under the A2 emissions scenario
15
iv
Figure 10: Man-made emissions of carbon dioxide (CO2), methane (CH4), nitrous oxide (N2O)
and sulphur dioxide (SO2) for six SRES scenarios
16
Figure 11: Projected changes averaged across nine IPCC AR4 global climate models in
summer and winter precipitation (mm/day) across South East Europe by the 2020s and
2050s compared to the 1961 to 1990 average, under the A2 emissions scenario
17
Figure 12: The ECA countries likely to experience the greatest increases in climate extremes by
the end of the twenty-first century 19
Figure 13: The drivers of vulnerability to climate change 20
Figure 14: Impact of natural disasters in ECA, 1990–2008 23
Figure 15: Annual Energy Profile for Albania from 1985 to 2006 in GWh 27
Figure 16: Relationship between Drin River flow and electricity production at Fierze 29
Figure 17: Variation of Fierze inflows and electricity generation, 1999 to 2007 29
Figure 18: Relationship between Mati River flow and electricity production from Ulëza and
Shkopeti HPP
30
Figure 19: Projected electricity supply/demand for Albania from 2010 to 2050 52
Figure 20: Electricity shortage due to climate change 55
Figure 21: NPV using base case assumptions 62
Figure 22: Breakdown of NPV of options by parameter 63
Figure 23: Tornado chart showing sensitivity of NPV for each option to variations in the values
of each parameter
65
Figure 24: Net present value of options under high parameter assumptions 65
Figure 25: Breakdown of costs and benefits, high parameter case 66
Figure 26: Costs vs. benefits for the extreme storm case (1 week per year outages) 67
Figure 27: Costs vs. benefits for the extreme storm case (1 month per year outages) 68
Figure 28: Costs vs. benefits for 50-year duration analysis 68
Figure 29: Sensitivity of options to discount rate 69
Figure 30: Sensitivity of options to carbon dioxide and other GHGs 70
Figure 31: Sensitivity of options to the value placed on water 70
Figure 32: Rainfall and Drin Dam Cascade generation in a wet year (October 2005 to
September 2006)
73
Figure 33: Rainfall and Drin Dam Cascade generation in a wet year (October 2006 to
September 2007)
74
Figure A1.1: Sample GIS output 82
Figure A1.2: Acclimatise Business Risk Pathways Model, adapted for Workshop 1 84
Figure A8.1: Average change in mean runoff according to CCSA for three time horizons: 2025,
2050, 2100
142
Figure A8.2 Projected Climatic Changes to 2100 143
Figure A8.3 Expected changes in runoff, Mati catchment‘s 144
Figure A8.4: Relation of electricity production to river flow, MRCA 145
Figure A8.5: Electricity generation and Fierze inflows, 1999–2007 145
TABLES
Table 1: Electricity production in South Eastern Europe in 2006, as % of total 8
Table 2: Summary of Albanian Scenarios for Changes in Precipitation (compared to 1961 to
1990 baseline) by Number of Global Climate Models
18
Table 3: Summary of Climate Risks before Adaptation 24
Table 4: Number of Risks in Each Risk Severity Category, Before and After Adaptation 38
Table 5: Risk Register 41
Table 6: Base Case and High Case Parameter Value Assumptions 62
v
Table A2.1: Scale for Assessing Likelihood of Occurrence of Hazard 88
Table A2.2: Scale for Assessing Magnitude of Consequence 89
Table A2.3: Risk Mapping (Before Adaptation) 90
Table A2.4: Risk Mapping (After Adaptation) 90
Table A3.1: Adaptation Options that Apply to All Energy Asset Classes 91
Table A3.2: Adaptation Options—Energy Demand and Demand-side Energy Efficiency 95
Table A3.3: Adaptation Options—Large Hydropower Plants (LHPPs) 97
Table A3.4: Adaptation Options—Small Hydropower Plants (SHPPs) 100
Table A3.5 Adaptation Options—Thermal (Fossil Fuel) Power Plants (TPPs) 102
Table A3.6: Adaptation Options—Other Renewable Energy Sources 104
Table A3.7 Adaptation Options—Electricity Transmission and Distribution 105
Table A3.8: Adaptation Options—Fossil Fuel Supply and Transmission / Transportation 107
Table A4.1: Design and Operation of Energy Plants 109
Table A5.1: Private Benefit Categories—Examples 114
Table A5.2: Parameters for the CBA Discussed at Workshops and Meetings 117
Table A5.3: CAPEX and OPEX Summary (U.S. Dollars, 2010) 121
Table A5.4: Monetized Unit Benefit Values (U.S. Dollars) 124
Table A5.5: Benefits Realized by Each Option (U.S. Dollars, 2010) 124
Table A5.6: Base-case Parameters Results (U.S. Dollars, 2010) 126
Table A5.7: High-case Parameters Results (U.S. Dollars, 2010) 126
Table A7.1: Passive Scenario Projections 2030 to 2050 132
Table A7.2: Active Scenario Projections 2030 to 2050 136
Table A8.1 Climate Change Scenarios for Albania 141
Table A8.2: Climate Change Scenarios for Three Time Horizons: 2025, 2050, 2100 142
Table A8.3: Results for Hydropower (Deviation from the Reference Projections) and Relative
Participation of Each Basin in the Brazilian Hydropower System
146
Table A8.4: Projected Changes in Annual Climatic Conditions, Runoff, and Hydropower
Production
147
Table A9.1 Range of Projected Changes Compared to 1961–1990 Baseline 148
BOXES
Box 1: Development and climate change at work 2
Box 2: Regional electricity markets in South Eastern Europe and climate risks 8
Box 3: Climate change modeling and greenhouse gas emissions scenarios 16
Box 4: Climate change, water resources, energy, and food security in Europe and Central Asia
(ECA) 32
Box 5: Categorization of adaptation options for robust decision making under conditions of
high uncertainty, with some examples 37
Box 6: A vital ‗no-regrets‘ option for Albania—improved monitoring and forecasting of
weather and climate 39
Box 7: Weather risk management through weather coverage and insurance instruments 40
Box 8: Active and passive scenarios in the draft National Energy Strategy, 2007 53
vi
SYNOPSIS
Many countries are increasingly vulnerable to destructive weather events—floods, droughts,
windstorms, or other parameters. The vulnerability is driven in part by climate but also by
countries‘ sensitivity to events exacerbated by past practices, socioeconomic conditions, or
legacy issues. The degree to which vulnerability to weather affects the countries‘ economies is
driven by their coping or adaptive capacities.
Seasonal weather patterns, weather variability, and extreme events can affect the production and
supply of energy, impact transmission capacity, disrupt oil and gas production, and impact the
integrity of transmission pipelines and power distribution networks. Climate change also affects
patterns of seasonal energy demand. It is important to explore these vulnerabilities for the energy
sector given its major contribution to economic development, the long life span of energy
infrastructure planning, and the dependence of energy supply and demand on weather.
This report showcases a pilot vulnerability, risk, and adaptation assessment undertaken for
Albania‘s energy sector to raise awareness and initiate dialogue on energy sector adaptation. A
bottom-up, stakeholder-based, qualitative/semi-quantitative risk-assessment approach is used to
discuss and identify risks, adaptation measures, and their costs and benefits. It draws on
experience and published guidance from the United Kingdom and Australia, as well as existing
research and literature. The climate vulnerability assessment framework puts stakeholders at the
heart of the decision-making process and involves:
Climate risk screening of the energy sector to identify and prioritize hazards, current
vulnerabilities, and risks from projected climate changes out to the year 2050.
Identification of adaptation options to reduce overall vulnerability.
A high-level cost benefit analysis of key physical adaptation options.
This pilot assessment demonstrates an approach that can be used to help countries and energy
sector stakeholders develop policies and projects that are robust in the face of climatic
uncertainties, and assist them in managing existing energy concerns as the climate changes. It
identifies key direct risks to energy supply and demand and options for adaptation to establish
where to focus subsequent in-depth analyses. It also identifies additional research needed to
better understand the implications of extreme climatic events for the energy sector as well as
potential indirect impacts—such as possible adaptation actions in the agriculture sector that may
affect energy supply.
vii
ACKNOWLEDGMENTS
This Report has been prepared by a core team led by Jane Ebinger. Team members are Lucy Hancock,
Antonio C. Lim, Magnus Gehringer, Aferdita Ponari (World Bank), Richenda Connell, Nina Raasakka
(Acclimatise), Stuart Arch, Alastair Baglee, Ivaylo Mirchev, Liudmila Nazarkina, Ben Pope
(WorleyParsons), and Besim Islami (consultant). The team was assisted by Ana Gjokutaj, Kozeta
Haxhiaj, and Josephine Kida (World Bank).
The team benefited greatly from a wide range of consultations with stakeholders. Meetings and
workshops were held in Albania with (in alphabetical order): Petrit Ahmeti, Neritan Alibali, Sokol Aliko,
Ramadan Alushi, Ymer Balla, Indrit Baholli, Leonard Bardhoshi, Irma Berdufi, Daniel Berg, Taulant
Bino, Miriam Bogdani, Agim Bregasi, Eglantina Bruci, Kujtime Caci, Eduart Cani, Marjana Coku,
Marialis Çelo, Endri Çili, Leonidha Çobo, Erion Cuni, Engjell Dakli, Stavri Dhima, Luan Dibra, Nazmi
Diku, Dorjan Duka, Eduart Elezi, Lavdosh Ferrunaj, Arben Gazheli, Ilia Gjermani, Ardit Gjeta, Gani
Gjini, Kole Gjoni, Konalsi Gjoka, Edmond Goskolli, Martin Graystone, Lorenc Gura, Sazan Guri, Suzana
Guxholli, Marjola Hamitaj, Skender Hasa, Alfred Hasanaj, Ervin Hatija, Aheron Hizmo, Eida Hoxha,
Fatmir Hoxha, Farudin Hoxha, Zhuljeta Hoxha, Rajmonda Islamaj, Hajri Ismaili, Qerim Ismeni, Marinela
Jazoj, Ilir Kaci, Erion Kalaja, Mirela Kamberi, Shaban Kamberi, Zeki Kaya, Eniana Kociaj, Nevton
Kodheli, Molnar Kolaneci, Lavdie Konjari, Niko Kurila, Hysni Laçi, Artan Leskoviku, Bashkim Lushaj,
Sherif Lushaj, Margarita Lutaj, Bikore Mala, Afrim Malaj, Perparim Mancellari, Robert Manghan, Sokol
Mati, Xhemal Mato, Merita Mansaku-Meksi, Niklas Mattson, Dorina Mehmeti, Olgert Metko, Marieta
Mima, Donald Mishaxhi, Driada Mitrushi, Piro Mitrushi, Arben Mukaj, Alken Myftiu, Genc Myftiu,
Agim Nashi, Bujar Nepravishta, Ndue Preka, Nikolin Prifti, Erikan Proko, Elton Qendro, Eduart Reimani,
Anastas Risha, Kristo Rodi, Daniela Ruci, Mitat Sanxhaku, Alma Saraçi, Denisa Saja, Aleksander Shalsi,
Erlet Shaqe, Sherefedin Shehu, Angjelin Shtjefni, Dritan Shutina, Mimoza Simixhiu, Muharrem Stojku,
Kliti Storja, Konti Tafa, Peter Troste, Fatjon Tugu, Teuta Thimjo, Piro Trebicka, Endrit Tuta, Andi Vila,
Anisa Xhitoni, Lufter Xhuveli, Petrit Zorba.
The work was conducted under the general guidance of Charles Feinstein, Ranjit Lamech, and Camille
Nuamah (World Bank). Ron Hoffer and Demetrios Papathanasiou (World Bank) and Amarquaye Armar
(ESMAP) also provided valuable guidance. Additional input was provided by Drita Dade, Gazmend Daci,
Giuseppe Fantozzi, and Salvador Rivera (World Bank). The report benefited from peer review by
Mohinder Gulati and Walter Vergara (World Bank), Roberto Schaeffer (Federal University of Rio de
Janeiro) and Vladimir Stenek (International Finance Corporation).
The financial and technical support by the Energy Sector Management Assistance Program (ESMAP), the
Trust Fund for Environmentally and Socially Sustainable Development (TFESSD) made available by the
Governments of Finland and Norway, and The World Bank is gratefully acknowledged. ESMAP—a
global knowledge and technical assistance partnership administered by the World Bank and sponsored by
official bilateral donors—assists low- and middle-income countries, its ―clients,‖ to provide modern
energy services for poverty reduction and environmentally sustainable economic development. ESMAP is
governed and funded by a Consultative Group (CG) comprised of official bilateral donors and multilateral
institutions, representing Australia, Austria, Canada, Denmark, Finland, France, Germany, Iceland, the
Netherlands, Norway, Sweden, the United Kingdom, and the World Bank Group.
Finally, the team would like to dedicate this report to Antonio (Tony) Lim who passed away in October
2009. Tony was a tireless campaigner for climate change and carbon finance at the World Bank who
worked diligently to bring better appreciation for and attention to climate issues and challenges,
particularly in the energy sector.
viii
ACRONYMS
AKBN National Agency for Natural Resources
AR4 The Fourth Assessment Report of the IPCC, released in 2007
CAPEX Capital expenditure
CO2 Carbon dioxide
CAT-DDO Catastrophe Risk Deferred Draw-down Option
CBA Cost–benefit analysis
CCGT Combined cycle gas turbine power plant
CCSA Climate change scenario for Albania
CSP Concentrated solar power
ECA Europe and Central Asia
ECMWF European Centre for Medium-range Weather Forecasting
EIA Environmental Impact Assessment
EMI European meteorological institution
EMP Environmental Management Plan
ERE Energy Regulatory Authority
ESIA Environmental and Social Impact Assessment
ESMAP Energy Sector Management Assistance Program
EUCOS EUMetNet Composite Observing System
EUMetSat European Organisation for the Exploitation of Meteorological Satellites
GCM General circulation model / Global climate model
GIS Generation Investment Study
GIS Geographical information system
GHG Greenhouse gas
IEWE Institute of Energy, Water, and Environment
IPCC Intergovernmental Panel on Climate Change
KESH Korporata Energjitike Shqiptare, Albanian Electricity Corporation
LHPP Large hydropower plant
LNG Liquefied natural gas
METE Ministry of Economy, Trade and Energy
NES National Energy Strategy
NHMS National hydrometeorological service
NMS National meteorological Service
OPEX Operating expenditure
OST Transmission System Operator
RCM Regional climate model
REBIS Regional Balkans Infrastructure Study
SEE South Eastern Europe
SHPP Small hydropower plant (less than 15 MW)
SRES Special Report on Emissions Scenarios
SST Sea surface temperature
SWOT Strengths, weaknesses, opportunities and threats analysis
T&D Transmission and distribution
TAP Trans-Adriatic Pipeline
TFESSD Trust Fund for Environmentally and Socially Sustainable Development
TPP Thermal power plant
UKCIP UK Climate Impacts Programme
UNFCCC United Nations Framework Convention on Climate Change
WB World Bank
WBG World Bank Group
WMO World Meteorological Organization
ix
EXECUTIVE SUMMARY
Albania’s Energy Sector and Climate Change
Albania‘s water resources are a national asset, with hydropower from the River Drin currently
providing about 90 percent of domestic electricity. As climate change mitigation targets and
legislation are tightened, and with other countries struggling to reduce their greenhouse gas
emissions, Albania‘s green production capability is an increasingly important national and
regional asset. However, such a high dependence on hydropower also brings challenges. Albania
finds it difficult to meet energy demand and maintain energy supply. The country‘s rainfall, on
which its hydropower depends, is among the most variable in Europe. Hydropower production
varies between about 2,900GWh in very dry years to twice that amount in very wet years.
Coupled with this, Albania has limited regional electricity interconnections at present, and
imports are expensive. There are also significant inefficiencies in domestic energy supply,
demand and water use. Technical losses in the transmission network were 213GWh in 2008 (3.3
percent), an improvement on losses in 2006 (which were 256GWh or 4 percent). Technical and
commercial losses from the distribution system amounted to 1,927GWh (33 percent) in 2008.
From 10 percent to 20 percent of water resources are lost in the irrigation system. All these
factors have compounded to create frequent load shedding and consequent impacts on Albania‘s
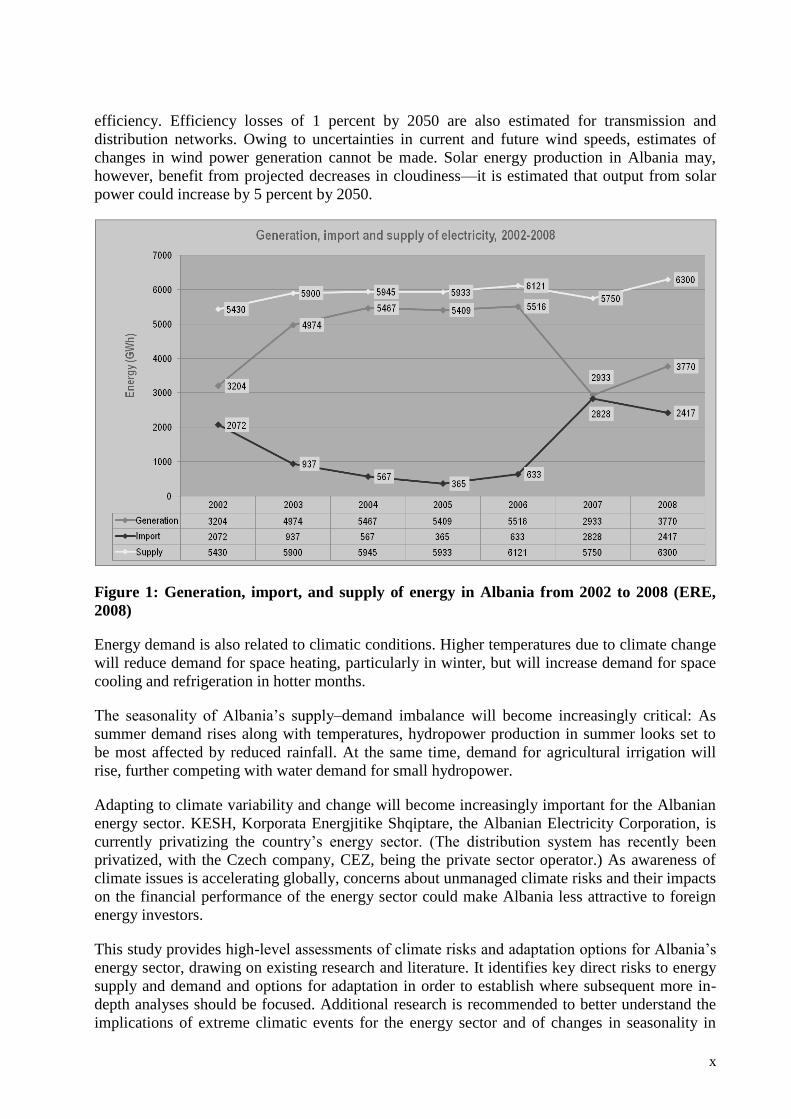
economic development. Figure 1 clearly shows lower domestic power production linked to low
rainfall in the period 2002 to 2008, with resultant associated high energy imports. It is worth
noting that, even with imports, load shedding has still been required, so the energy supply data in
Figure 1 do not represent the true energy demand.
Efforts are underway to address these challenges and improve resource use efficiency: In 2008,
for the first time, no load shedding was programmed and there has been a recent decision in
Albania to eliminate load shedding from 2009 onward, along with a commitment to provide a
24-hour electricity supply. As well as reductions in losses from the transmission system, losses
from the distribution system were reduced by 5.5 percent in 2008 compared to 2007. The
efficiency of water use in energy generation is influenced by long-term reductions in efficiency
(due to aging of assets) and more-recent management actions to improve water use efficiency. In
2007 and 2008, inflows to Fierze Reservoir were similar (approximately 4,120,000,000 m3) but
power generation in 2008 was 29.4 percent higher than in 2007. This was because high water
levels were maintained in the reservoir in 2008, and there was better optimization between
electricity import and domestic production. This improvement is reflected in a metric known as
specific consumption (m3 of water consumed per kWh of electricity generated). Specific
consumption in 2007 was 1.40 m3/kWh, whereas in 2008 it improved to 1.04 m
3/kWh. The new
Dam Safety Project (funded by the World Bank) is reviewing investments in the Drin and Mati
River Cascades, including investments in bathymetry and hydrology.
However, unless prompt action is taken, climate change looks set to worsen Albania‘s energy
security over the medium to long term. This study estimates that a reduction in runoff of 20
percent by 2050 driven by climate change could lead to 15 percent less electricity generation
from Albania‘s large hydropower plants (LHPPs) and 20 percent less from small hydropower
plants (SHPPs). At the same time, increases in extreme precipitation events could lead to
increased costs for maintaining dam security. Other energy assets are not immune from climate
impacts. Rising sea levels and increased rates of coastal erosion will threaten energy assets in the
coastal region. Rising air temperatures are also estimated to reduce the efficiency of TPPs by
about 1 percent by 2050. If river-water cooled TPPs were developed in future, these would be
affected by changes in river flows and higher river temperatures, further reducing their
x
efficiency. Efficiency losses of 1 percent by 2050 are also estimated for transmission and
distribution networks. Owing to uncertainties in current and future wind speeds, estimates of
changes in wind power generation cannot be made. Solar energy production in Albania may,
however, benefit from projected decreases in cloudiness—it is estimated that output from solar
power could increase by 5 percent by 2050.
Figure 1: Generation, import, and supply of energy in Albania from 2002 to 2008 (ERE,
2008)
Energy demand is also related to climatic conditions. Higher temperatures due to climate change
will reduce demand for space heating, particularly in winter, but will increase demand for space
cooling and refrigeration in hotter months.
The seasonality of Albania‘s supply–demand imbalance will become increasingly critical: As
summer demand rises along with temperatures, hydropower production in summer looks set to
be most affected by reduced rainfall. At the same time, demand for agricultural irrigation will
rise, further competing with water demand for small hydropower.
Adapting to climate variability and change will become increasingly important for the Albanian
energy sector. KESH, Korporata Energjitike Shqiptare, the Albanian Electricity Corporation, is
currently privatizing the country‘s energy sector. (The distribution system has recently been
privatized, with the Czech company, CEZ, being the private sector operator.) As awareness of
climate issues is accelerating globally, concerns about unmanaged climate risks and their impacts
on the financial performance of the energy sector could make Albania less attractive to foreign
energy investors.
This study provides high-level assessments of climate risks and adaptation options for Albania‘s
energy sector, drawing on existing research and literature. It identifies key direct risks to energy
supply and demand and options for adaptation in order to establish where subsequent more in-
depth analyses should be focused. Additional research is recommended to better understand the
implications of extreme climatic events for the energy sector and of changes in seasonality in
xi
energy supply and demand, as well as potential indirect impacts—for instance, due to the
adaptation actions that may be taken in the agriculture sector, which may affect energy supply.
Recommendations for Building Climate Resilience of the Energy Sector
Given the challenges above, how could Albania best manage its future security of energy
supply in the face of a changing climate?
Albania‘s recent draft National Energy Strategy (NES) sets out a so-called active scenario,
which aims to improve energy security. It looks out to the medium term (the year 2019) and
describes plans to diversify the energy system, by encouraging development of renewable energy
generation assets (solar, small hydropower plants, wind, and biomass) and thermal power plants.
It does not consider climate change impacts on energy security on these timescales. Yet, as
already described, over the longer time horizons of this study (out to the year 2050) these assets
will be increasingly affected by climate change. The draft NES‘s active scenario notes the
importance of new electricity interconnection lines to facilitate Albania‘s active participation in
the South East Europe energy market. But the wider region will also be affected by climate
change—about one quarter of the region‘s electricity is generated by hydropower plants, and
regional summer energy demand will rise along with temperatures and due to economic
development. This could increase import prices and reduce supply, so these interconnections
may not help Albania maintain energy security unless regionwide coping strategies are devised.
The draft NES active scenario also emphasizes the need for improved energy efficiency through
greater use of domestic solar water heating, improved building standards, lower-energy
appliances, and alternative heating sources other than electricity. These energy-efficiency
measures are increasingly critical as the climate changes, and Albania must provide financial
incentives to promote their uptake. But, based on experience from other countries, implementing
them in a timely manner will be a significant challenge.
Even if the measures in the draft NES active scenario were extrapolated to 2050 and fully
implemented, this study estimates that, due to climate change impacts on supply and demand,
Albania would still have a supply–demand gap. The estimated net shortfall due to climate change
is on the order of 350 GWh per year by 2030, equivalent to power generation from a 50 MW
thermal power plant. By 2050, the shortfall rises to 740 GWh per year (105 MW), or 3 percent of
total demand. As previously noted, this disguises a more significant impact on energy security
due to changing seasonal demand and production, with summer peak demand increasing when
hydropower production is at its lowest.
So, what are the critical actions that Albania could take now to improve energy security now
and in the future?
First, Albania could increase its investment in, and coordination of, meteorological,
hydrometeorological and hydrological monitoring, modeling, and forecasting. These capabilities
have been considerably eroded in recent decades due to lack of investment and poorly
coordinated institutional arrangements. The current poor state of monitoring networks and
forecasting capability prevent optimal use of water resources and operation of hydropower plants
today—though some recent optimization improvements have been made. By exploiting better
data on reservoir use, margins, and changes in rainfall and runoff, it should be possible to
improve further the management of existing reservoirs. Investments in monitoring and
forecasting would have other benefits, helping the agriculture and transportation sectors and the
general population, while building resilience to climate change. Albania could develop (in-
country) or obtain (from elsewhere) weather and climate forecasts appropriate for energy-sector
xii
planning, from short-range forecasts (1 to 3 days ahead) and medium-range forecasts (3 to 10
days ahead), to seasonal forecasts and regional downscaled climate change projections. Short-
range and medium-range forecasts should be made available to decision makers with adequate
lead time to help in optimizing the operation of the energy system. This could be supported by
better interaction between meteorological/hydrometeorological experts and energy-sector
decision makers. Drawing on this information, energy-sector stakeholders could work in
partnership with water users in the agricultural sector to undertake climate risk assessments that
are integrated across these sectors and could devise agreed strategies for managing shared water
resources. Regional cooperation across South East Europe on sharing of monitoring data and
forecasts could also be strengthened, especially in relation to shared watersheds (Drin, Vjosa).
Albania could work in partnership with neighbors on regional studies on climate risks and their
implications for energy security, prices and trade. These studies will help to build understanding
of the extent to which the whole region will be affected in the same way at the same time by
climatic events such as droughts, and how best to manage such regional risks.
Second, there are enormous opportunities for Albania to close its supply–demand gap through
improved energy efficiency and demand-side management. While this is recognized in the draft
NES active scenario, more emphasis and progress could be made on this issue. The large
technical and commercial losses in the distribution system could be reduced and demand-side
management could be improved through, for example, improved bill collection and
establishment of cost-recovery tariffs (amending energy subsidies that are distorting market
signals). Such actions are vital for many reasons—fiscal, economic, and as part of good
governance. The recent privatization of the distribution system provides a driver for this.
Similarly, the losses from the water irrigation system could be tackled and greater emphasis
placed on improving the management of reservoirs, and on coordinating actions for more-
efficient water resource use in every sector. The Ministry of Agriculture, Food and Consumer
Protection has made significant progress recently in reducing irrigation losses from agriculture in
some parts of Albania, and this work could usefully be scaled up across the country. In the face
of climate change, the imperative for efficient and sustainable use of water resources is
increasing.
Thirdly, Albania could review its technical standards and planning/contractual processes for all
energy infrastructure, and upgrade them where needed to ensure that assets can withstand
climate variability and projected climate change impacts over their lifetimes. For new assets,
consideration of climate variability and change could be addressed through site selection
decisions, environmental impact assessments, tariffs, incentives, contracts and public–private
partnerships. Similarly, upgrading and rehabilitation of existing assets could build in assessments
of, and resilience to, climate change impacts. For instance, it may be possible to increase water
storage in existing reservoirs at a reasonable cost, to dampen the effects of seasonal variations in
runoff. Emergency Contingency Plans (ECPs) for hydropower plants could also be reviewed and
upgraded where needed, to take account of expected increases in precipitation intensity due to
climate change. Power producers and local authorities may also need to improve their capacities
to implement ECPs, ensuring that they provide sound mechanisms for monitoring weather and
its influence on river flows and reservoir levels, as well as communication with downstream
communities and contingency plans for evacuation.
Finally, climate change emphasizes the imperative (recognized in the draft National Energy
Strategy active scenario) for Albania to increase the diversity of its energy supplies—both
through increased regional energy trade and through developing a more diverse portfolio of
domestic generation assets, ensuring that these are designed to be resilient to climate change. For
example, Albania could structure Power Purchase Agreements including off-take arrangements
xiii
and power-swap agreements that recognize the complementarities between the different
countries‘ energy systems. For this study, a high-level cost–benefit analysis (CBA) has been
undertaken to estimate the relative costs and benefits to Albania of increased energy trade and
different types of domestic energy generation, to supply the shortfall in Albania‘s electricity that
is attributed to climate change impacts (350 GWh per year by 2030, and 740 GWh per year by
2050) that remains after full implementation of an extrapolated NES active scenario to 2050. The
CBA included the following options:
Import of electricity
Upgrading of existing large hydropower plants
Upgrading of existing small hydropower plants
New large hydropower plants
New small hydropower plants
New thermal power plants
New wind farms
New concentrated solar power plants (CSPs)
The performance of these options has been assessed, using parameters confirmed as important by
energy-sector stakeholders in Albania. As well as financial parameters (capital and operational
costs), environmental factors including water value, greenhouse gas emissions, and other
emissions and ecosystem values were seen as relevant in choice among energy asset options. In
terms of social parameters, disturbance to people and property was also assessed in the CBA.
Using these parameters, the sustainability of the various options was ranked.
Figure 2 presents the net present value (NPV) results in current (2010) U.S. dollar terms for each
of the options tested, under a base case set of assumptions. According to the CBA, the most
economic options for Albania are upgrade of existing LHPPs and SHPPs, followed by
development of new SHPPs and thermal power plants (the latter assumed to be gas-fired and
shown as CCGTs in Figure 2). An alternate thermal power option could be the use of
supercritical pulverized coal technology. While not considered in detail in the CBA, this option
would lead to greater GHG emissions and water usage than a gas-fired thermal power facility,
and would be less sustainable. Nevertheless, it would likely still be the fourth most-sustainable
option.
Sensitivity analyses were undertaken, to test the sensitivity of these options to varying discount
rates and values of greenhouse gas emissions. These confirmed that upgrading existing LHPPs
and SHPPs were the most economic options. For discount rates in the range 2 percent to 20
percent, the relative ranking of the top two options does not change, with the ―Upgrade existing
LHPP‖ option returning the greatest NPV over all discount rates, followed by ―Upgrade existing
SHPP.‖ However, when the discount rate is larger than 16.2 percent, thermal power plants
(CCGTs) become marginally more attractive than ―New SHPP.‖ Thermal power plants have
higher operating costs, but the effects of future operating costs on their NPV are diminished at
higher discount rates. In addition, as the discount rate increases, import of electricity becomes a
relatively more attractive option, though it remains NPV-negative across all discount rates
examined.

xiv
Net Present Value of Options
-200
-100
-
100
200
300
400
IMPORT Enhance
Extg.
LHPP
CCGT Enhance
Extg.
SHPP
New
SHPP
WIND CSP New
LHPP
US
D m
illi
on
s
Figure 2: Net Present Value of diversification options, using base case assumptions
In relation to the effects on the options of varying the price of CO2 and other greenhouse gases
(GHGs), as expected, the economics of the renewable assets are insensitive to this parameter.
Clearly, those options that are sensitive to increasing GHG value are thermal power plants
(CCGTs) and import of electricity (assumed generated using CCGTs). The higher the value
placed on carbon dioxide and other GHGs, the more unfavorable thermal power plants and
electricity imports become in relative terms. However, domestic thermal power plants remain
NPV-positive up to the highest value tested, US$100 per tonne of GHG.
In conclusion, there are several critical actions that Albania could take now—namely, improving
meteorological and hydrometeorological monitoring, modeling, and forecasting, and improving
energy efficiency, demand-side management, and water-use efficiency. These will help manage
existing climate variability better and will build the country‘s resilience to climate change.
Albania is on the brink of a significant adaptation opportunity: major investments in new energy
assets are underway or being planned. Integrating adaptation measures into these can help ensure
their climate resilience. As the electricity system is privatized, it is possible to consider how to
structure incentives for adaptation; there could be opportunities for cost sharing between
government and the private sector. According to the CBA, upgrades to existing LHPPs and
SHPPs are the most economic options for Albania to fill the climate change-induced energy gap
that will emerge over the period 2030 to 2050. For development of new assets and upgrade of
existing assets, the earlier that climate risks and resilience are considered, the greater the
opportunities to identify financially and economically efficient solutions that will build the
robustness of the energy system for coming decades.
xv
PËRMBLEDHJE EKZEKUTIVE
Sektori i energjisë në Shqipëri dhe ndryshimet klimatike
Burimet ujore të Shqipërisë janë një pasuri kombëtare, ku energjia hidrike nga lumi Drin siguron
rreth 90% të energjisë elektrike të prodhuar në vend. Ndërkohë që synimet dhe legjislacioni për
zbutjen e ndryshimeve klimatike bëhen më shtrënguese, dhe kur vendet e tjera mundohen të ulin
shkarkimet e gazeve serë, aftësia e Shqipërisë për prodhim ―të gjelbër‖ është një vlerë kombëtare
dhe rajonale gjithnjë dhe më e rëndësishme. Megjithatë, një varësi e tillë e lartë tek energjia
hidrike sjell dhe sfida. Për Shqipërinë është e vështirë të plotësojë kërkesën për energji elektrike
dhe të ruajë nivelin e furnizimit me energji. Sasia e reshjeve të shiut në vend, nga të cilat varet
dhe energjia hidrike, janë nga më të ndryshueshmet në Europë. Prodhimi i energjisë hidrike
luhatet nga rreth 2,900 GWh në vitet shumë të thata deri në rreth dyfishin e kësaj sasie në vitet
që janë jashtëzakonisht të lagështa.
Përveç kësaj, Shqipëria ka aktualisht numër të kufizuar interkonjeksionesh rajonale për energjinë
elektrike dhe importet janë të shtrenjta. Gjithashtu, ka inefiçencë të lartë si në anën e furnizimit
vendas me energji elektrike dhe në kërkesë, ashtu dhe në përdorimin e ujit. Humbjet teknike në
rrjetin e transmetimit në vitin 2008 ishin 213GWh (3.3%), një përmirësim në krahasim me
humbjet e vitit 2006 (të cilat ishin 256GWh ose 4%). Humbjet teknike dhe tregtare nga sistemi i
shpërndarjes shkonin në 1,927GWh (32.7%) në vitin 2008. Ndërmjet 10% dhe 20% e burimeve
ujore humbasin në sistemin e ujitjes. Të gjithë këta faktorë janë grumbulluar dhe shkaktojnë
ndërprerje të shpeshta të energjisë dhe pasoja me ndikim në zhvillimin ekonomik të Shqipërisë.
Figura 1 tregon qartësisht që ulja e prodhimit vendas të energjisë elektrike është e lidhur me
uljen e sasisë së reshjeve në periudhën nga viti 2002 deri në vitin 2008, me një rezultante të
shoqëruar me rritje të importeve të energjisë. Ja vlen të vihet në dukje që, edhe me importet, janë
nevojitur ndërprerje në furnizimin me energji elektrike, kështu që të dhënat e furnizimit me
energji në Figurën 1 nuk përfaqësojnë kërkesën e vërtetë për energji.
Po bëhen përpjekje për të adresuar këto sfida dhe për të përmirësuar eficencën e përdorimit të
burimeve: Në vitin 2008, për të parën herë, nuk janë programuar ndërprerje të energjisë elektrike
dhe ka patur një vendim të kohëve të fundit në Shqipëri për të eliminuar ndërprerjet për shkak të
mbikgarkesës nga viti 2009 dhe më tej, së bashku me një angazhim për të siguruar një furnizim
me energji 24 orë. Ashtu si uljet e humbjeve nga sistemi i transmetimit, edhe humbjet në
sistemin e shpërndarjes u ulën me 5.5% në vitin 2008, krahasuar me vitin 2007. Eficenca e
përdorimit të ujit gjatë prodhimit të energjisë elektrike ndikohet dhe nga uljet historike në
eficencë (për shkak të vjetërimit të aseteve) si nga dhe veprimet menaxhuese më të fundit që
synojnë të përmirësojnë eficencën e burimeve ujore. Në vitet 2007 dhe 2008, prurjet në
rezervuarin e Fierzës ishin shumë të ngjashme (rreth 4,120,000,000 m3) por prodhimi i energjisë
elektrike në vitin 2008 ishte 29.4% më i lartë se në vitin 2007. Kjo erdhi si shkak i ruajtjes në
nivele të lartat të ujit në rezervuar në vitin 2008, dhe optimizimit më të mirë ndërmjet importimit
dhe prodhimit të brendshëm të energjisë elektrike. Ky përmirësim pasqyrohet në një element të
njohur si konsumim specifik (m3 ujë të konsumuar për kWh energji elektrike të prodhuar).
Konsumi specifik në vitin 2007 ishte 1.40 m3/kWh, ndërsa në vitin 2008 u përmirësua deri në
1.04 m3/kWh. Projekti i ri mbi Sigurinë e Digave (financuar nga Banka Botërore) po shqyrton
investimet në kaskadat e lumenjve Drin dhe Mat, përfshirë dhe investimet në batimetri dhe
hidrologji.
xvi
Figura 1: Prodhimi, importimi dhe furnizimi me energji elektrike në Shqipëri nga viti 2002
në 2008 (ERE, 2008)
Megjithatë, po të mos ndërmerren veprime të menjëhershme, ndryshimet klimatike duket që do
ta përkeqësojnë sigurinë e energjisë në Shqipëri në afat të mesëm dhe të gjatë. Ky studim
vlerëson se një reduktim 20% në rrjedhje deri në vitin 2050 i nxitur nga ndryshimet klimatike
mund të çojë në 15% më pak prodhim të energjisë elektrike nga hidrocentralet e mëdha të
Shqipërisë (HECM) dhe 20% më pak nga hidrocentralet e vogla (HECV). Në të njëjtën kohë,
rritjet në ngjarjet ekstreme të reshjeve mund të çojnë në rritjen e shpenzimeve për ruajtjen e
sigurisë së digave. Edhe asetet e tjera të energjisë nuk janë të imunizuara nga ndikimet klimatike.
Rritja e niveleve të detit dhe rritja e shkallës së erozionit bregdetar do të kërcënojnë asetet e
energjisë në zonat bregdetare. Temperaturat në rritje të ajrit vlerësohen gjithashtu që do të
zvogëlojnë efikasitetin e TEC-ve me 1% deri në vitin 2050. Nëse në të ardhmen do të ndërtohen
TEC-e që ftohen me ujin lumenjve, këto do të ndikohen si nga ndryshimet në sasinë e rrjedhës së
lumenjve ashtu dhe nga temperaturat më të larta të ujit të lumit, duke zvogëluar më tej
efikasitetin e tyre. Humbjet e efikasitetit prej 1% deri në vitin 2050 janë parashikuar edhe për
rrjetet e transmetimit dhe shpërndarjes. Për shkak të paqartësive mbi shpejtësinë e erës si atë
aktuale dhe në të ardhmen, nuk mund të bëhen vlerësime mbi ndryshimet në prodhimin e
energjisë elektrike me anë të erës. Megjithatë, prodhimi i energjisë diellore në Shqipëri mund të
përfitojë nga zvogëlimi i parashikuar në mbulimin me re – është llogaritur që prodhimi nga
energjia diellore mund të rritet me 5% deri në vitin 2050.
Kërkesa për energji elektrike është e lidhur edhe me kushtet klimatike. Temperaturat më të larta
për shkak të ndryshimeve klimatike do të ulin kërkesën për ngrohjen e hapësirave, veçanërisht në
dimër, por do të rrisin kërkesën për ftohje hapësirash dhe përdorim frigoriferik në muajt më të
nxehtë.
Sezonaliteti i çekuilibrit furnizim-kërkesë të Shqipërisë do të bëhet gjithnjë e më kritik: ndërkohë
që kërkesa gjatë verës rritet së bashku me temperaturat, prodhimi i energjisë hidrike në verë
duket do të jetë më i prekuri nga reduktimi i sasisë së reshjeve. Në të njëjtën kohë, kërkesa për
xvii
ujitje në bujqësi do të rritet, duke konkuruar më shumë me kërkesën për ujë të hidrocentraleve të
vogla.
Adaptimi me ndryshueshmërinë dhe ndryshimin e klimës do të bëhet gjithnjë e më i rëndësishëm
për sektorin energjetik shqiptar. KESH-i, Korporata Elektorenergjitike Shqiptare, është
aktualisht duke privatizuar sektorin e energjisë të vendit. (Sistemi i shpërndarjes është privatizuar
kohët e fundit, ku kompania çeke CEZ është operatori privat i sektorit). Ndërkohë që
ndërgjegjësimi mbi kërcënimet e klimës po përshpejtohet në nivel global, shqetësimet në lidhje
me rreziqet e pamenaxhuara të klimës dhe ndikimet e tyre mbi performancën financiare të
sektorit të energjisë mund ta bëjnë Shqipërinë më pak tërheqëse për investitorët e huaj të
energjisë.
Ky studim jep vlerësime të nivelit të lartë mbi rreziqet klimatike dhe mundësitë për tu përshtatur
për sektorin energjitik të Shqipërisë, duke u mbështetur në kërkimet dhe literaturën ekzistuese.
Ai identifikon rreziqet kryesore të drejtpërdrejta për furnizimin dhe kërkesën për energji
elektrike dhe mundësitë për tu përshtatur, si dhe paraqet ku duhet të përqendrohen më shumë
analizat e mëtejshme më të thella. Rekomandohen kërkime shtesë për të kuptuar më mirë
implikimet e ngjarjeve ekstreme klimatike për sektorin e energjisë dhe të ndryshimeve në
sezonalitetin e furnizimit dhe kërkesës për energji elektrike, si dhe ndikimet e mundshme të
tërthorta – për shembull, për shkak të veprimeve përshtatëse që mund të merren në sektorin e
bujqësisë, dhe të cilat mund të ndikojnë në furnizimin me energji.
Rekomandimet për krijimin e elasticitetit klimatik të sektorit energjitik
Duke patur parasysh sfidat e mësipërme, si mund të menaxhojë më mirë Shqipëria në të
ardhmen sigurinë e furnizimit me energji përballë një klime që po ndryshon?
Draft-strategjia e fundit Kombëtare e Energjisë (SKE) e Shqipërisë përcakton një të ashtuquajtur
‗skenar aktiv‘, i cili synon të përmirësojë sigurinë e energjisë. Ai mbulon periudhën afat-mesme
(deri në vitin 2019) dhe përshkruan planet për të diversifikuar sistemin energjitik, duke nxitur
ndërtimin e aseteve për prodhimin e energjisë të rinovueshme (diellore, hidrocentrale të vogla,
era dhe biomasa) dhe termocentraleve. Ajo nuk merr parasysh ndikimet e ndryshimeve klimatike
mbi sigurinë e energjisë në këto periudha kohore. Megjithatë, siç përshkruhet dhe më lart,
përgjatë shtrirjeve më të gjata kohore të këtij studimi (deri në vitin 2050) këto asete do të
ndikohen gjithnjë e më shumë nga ndryshimet klimatike. Skenari aktiv i draft- SKE-së vë në
dukje rëndësinë e linjave të reja të interkonjeksionit të energjisë elektrike për të lehtësuar
pjesëmarrjen aktive të Shqipërisë në tregun e energjisë të Europës Jug-Lindore. Por dhe rajoni
më i gjerë gjithashtu do të ndikohet nga ndryshimet klimatike – rreth një e katërta e energjisë
elektrike të rajonit prodhohet nga hidrocentralet, dhe kërkesa rajonale për energji gjatë verës do
të rritet së bashku me temperaturat dhe për shkak të zhvillimit ekonomik. Kjo mund të rrisë
çmimet e importit dhe të zvogëlojë furnizimin, kështu që këto interkonjeksione mund të mos e
ndihmojnë Shqipërinë të ruajë sigurinë e energjisë nëse nuk hartohen strategji përballuese për
gjithë rajonin. Skenari aktiv i draft SKE-së gjithashtu thekson nevojën për të përmirësuar
efiçencën e energjisë nëpërmjet rritjes së përdorimit më të madh shtëpiak të ngrohjes së ujit me
energji diellore, përmirësimin e standarteve të ndërtimit, përdorimin e pajisjeve shtëpiake që
përdorin pak energji dhe burimet alternative për ngrohje përveç energjisë elektrike. Këto masa të
efiçencës së energjisë janë gjithmonë e më kritike ndërkohë që klima ndryshon, dhe Shqipëria
duhet të ofrojë nxitje financiare për të bërë të mundur përdorimin e këtyre masave. Por, duke u
bazuar në përvojën e vendeve të tjera, zbatimi i tyre në kohë do të jetë një sfidë e rëndësishme.
xviii
Edhe në qoftë se masat në skenarin aktiv të draft SKE-së që shtrihet deri në vitin 2050 do të
zbatohen plotësisht, ky studim vlerëson se, për shkak të ndikimeve të ndryshimeve klimatike mbi
kërkesën dhe ofertën, Shqipëria ende do të ketë një hendek furnizim-kërkesë. Mungesa e
parashikuar neto për shkak të ndryshimit të klimës është rreth 350 GWh në vit deri në vitin 2030,
e barabartë me prodhimin e energjisë nga një termocentral 50 MW. Deri në vitin 2050, mungesa
rritet në 740 GWh në vit (105 MW), ose 3% e kërkesës totale. Siç u theksua dhe më lart, kjo
fsheh një ndikim më të rëndësishëm për sigurimin e energjisë për shkak të ndryshimit të kërkesës
dhe të prodhimit sezonal, me rritjen e kërkesës pik të verës në kohën që prodhimi i energjisë
hidrike është në nivelin e tij më të ulët.
Pra, cilat janë veprimet kritike që Shqipëria mund të ndërmarrë tani për të përmirësuar
sigurinë e energjisë tani dhe në të ardhmen?
Së pari, Shqipëria mund të shtojë investimin e saj, dhe koordinimin e monitorimit, modelimit dhe
parashikimit meteorologjik, hidrometeorologjik dhe hidrologjik. Këto aftësi janë shkatërruar në
mënyrë të konsiderueshme në dekadat e fundit për shkak të mungesës së investimeve dhe
rregullimet institucionale të koordinuara dobët. Gjendja e keqe aktuale e rrjeteve të monitorimit
dhe aftësive parashikuese pengojnë përdorimin optimal të burimeve ujore dhe funksionimin e
hidrocentraleve sot – megjithëse, siç vihet në dukje më lart, janë bërë disa përmirësime të kohëve
të fundit për optimizimin. Duke shfrytëzuar të dhëna më të mira mbi përdorimin e rezervuarëve,
kufijve dhe ndryshimeve në sasinë e reshjeve dhe rrjedhjeve, do të jetë e mundur të përmirësohet
më tej menaxhimi i rezervuarëve ekzistues. Investimet në monitorim dhe parashikim të motit do
të kishin përfitime të tjera, duke ndihmuar edhe sektorët e bujqësisë dhe transportit dhe
popullatën në përgjithësi, si edhe ndërtimin e elasticitetit ndaj ndryshimeve klimatike. Shqipëria
mund të zhvillojë (në vend) ose të marrë (nga vende të tjera) parashikimet e motit dhe klimës të
përshtatshme për planifikim në sektorin e energjisë, duke mbuluar parashikimet në periudhë afat
shkurtër (1-3 ditë përpara), parashikimet në periudhë afat mesme (3-10 ditë), parashikimet
sezonale si dhe parashikimet rajonale të ndryshimit të klimës me shkallë të zvogëluar.
Parashikimet për periudhë afat shkurtër dhe afat mesme duhet të jenë në dispozicion të vendim-
marrësve në kohë reale, për të ndihmuar në optimizimin e funksionimit të sistemit energjitik. Kjo
mund të mbështetet nëpërmjet bashkëveprimit më të mirë ndërmjet ekspertëve
meteorologjikë/hidrometeorologjikë dhe vendim-marrësve në sektorin e energjisë. Duke u
mbështetur në këto të dhëna, palët e interesuara të sektorit të energjisë mund të punojnë në
partneritet me përdoruesit e ujit në sektorin e bujqësisë, për të ndërmarrë vlerësime të rrezikut të
klimës që janë të integruara në të gjithë këta sektorë dhe të hartojnë strategji të pranuara për të
menaxhuar burimet ujore të përbashkëta. Duhet gjithashtu të forcohet bashkëpunimi rajonal në të
gjithë Europën Juglindore për shkëmbimin e të dhënave të monitorimit dhe parashikimeve,
veçanërisht në lidhje me pellgjet ujëmbledhës të përbashkëta (Drin, Vjosa). Shqipëria mund të
punojë në partneritet me fqinjët në studime rajonale mbi rreziqet klimatike dhe implikimet e tyre
për sigurinë, çmimet dhe tregtinë e energjisë. Këto studime do të ndihmojnë për të ndërtuar të
kuptuarit nëse i gjithë rajoni do të ndikohet në të njëjtën mënyrë, e në të njëjtën kohë nga ngjarjet
klimatike të tilla si thatësira, dhe cila është mënyra më e mirë për të menaxhuar rreziqe të tilla
rajonale.
Së dyti, ekzistojnë mundësi shumë të mëdha për Shqipërinë për të mbyllur hendekun e saj
furnizim-kërkesë përmes përmirësimit të efiçencës së energjisë dhe menaxhimit të anës së
kërkesës. Megjithëse kjo është e pranuar në skenarin aktiv të draftit të SKE-së, duhet t‘i vihet më
shumë theksi dhe të bëhet përparim në këtë çështje. Mund të reduktohen humbjet e mëdha
teknike dhe tregtare nga sistemi i shpërndarjes, si dhe mund të përmirësohet menaxhimi i
kërkesës përmes mbledhjes së përmirësuar të faturave dhe vendosjes së tarifave që mbulojnë
kostot (duke ndryshuar subvencionet e energjisë të cilat po deformojnë sinjalet e tregut).

xix
Veprime të tilla janë jetike për shumë arsye – fiskale, ekonomike dhe si pjesë e qeverisjes së
mirë. Privatizimi i fundit i sistemit të shpërndarjes siguron një shtysë për këtë. Në mënyrë të
ngjashme, humbjet nga sistemi i ujitjes mund të trajtohen dhe të vihet më shumë theksi në
përmirësimin e menaxhimit të rezervuarëve, dhe në bashkërendimin e veprimeve për përdorimin
më efiçent të burimeve ujore në çdo sektor. Ministria e Bujqësisë, Ushqimit dhe Mbrojtjes së
Konsumatorit ka bërë përparim të ndjeshëm kohët e fundit në reduktimin e humbjeve gjatë
ujitjes në bujqësi në disa pjesë të Shqipërisë, dhe kjo punë mund të shkallëzohet në mënyrë të
dobishme në të gjithë vendin. Përballë ndryshimeve klimatike, po rritet domosdoshmëria për
përdorim efiçent dhe të qëndrueshëm të burimeve ujore.
Së treti, Shqipëria mund të rishikojë standardet e saj teknike dhe proceset planifikuese/
kontraktuese për të gjithë infrastrukturën energjitike, dhe për t‘i përmirësuar ato ku të jetë e
nevojshme për të siguruar që asetet mund të përballojnë ndryshueshmërinë klimatike dhe
ndikimet e parashikuara të ndryshimeve klimatike gjatë jetës së tyre. Për asetet e reja, shqyrtimi i
ndryshueshmërisë dhe ndryshimeve të klimatike mund të trajtohet përmes vendimeve mbi
përzgjedhjen e vendndodhjes, vlerësimeve të ndikimit në mjedis, tarifave, stimujve, kontratave
dhe partneritetit publik-privat. Në mënyrë të ngjashme, përmirësimi dhe rehabilitimi i aseteve
ekzistuese mund të përfshijë vlerësimet, dhe elasticitetin, ndaj ndikimeve të ndryshimeve
klimatike. Për shembull, mund të jetë e mundur të rritet ruajtja e ujit në rezervuaret ekzistuese
me një kosto të arsyeshme, për të zbutur efektet e variacioneve sezonale në rrjedhje. Planet e
emergjencave të paparashikuara (PEP) për hidrocentralet duhet gjithashtu të shqyrtohen dhe
përmirësohen aty ku është e nevojshme, për të marrë parasysh rritjet e pritshme në intensitetin e
reshjeve si shkak i ndryshimeve klimatike. Prodhuesit e energjisë dhe autoritetet lokale mund të
kenë gjithashtu nevojë për të përmirësuar kapacitetet e tyre për të zbatuar PEP, duke siguruar që
ato japin mekanizma të shëndoshë për monitorimin e motit dhe ndikimin e tij në prurjet e
lumenjve dhe nivelet e rezervuarëve, si dhe komunikim me komunitetet që banojnë poshtë
rrjedhës dhe planet e emergjencës për evakuim.
Së fundmi, ndryshimet klimatike theksojnë domosdoshmërinë (e pranuar në skenarin aktiv të
draftit të Strategjisë Kombëtare të Energjisë) për Shqipërinë, për të rritur diversitetin e
furnizimeve me energji – si nëpërmjet rritjes së tregtisë rajonale të energjisë ashtu dhe nëpërmjet
zhvillimit të një portofoli më të shumëllojshëm të aseteve prodhuese vendase, duke siguruar që
këto të jenë projektuar në mënyrë që të jenë elastikë ndaj ndryshimeve klimatike. Për shembull,
Shqipëria mund të strukturojë Marrëveshjet e Blerjes së Energjisë duke përfshirë edhe
rregullimet e marrjes dhe marrëveshjet e këmbimit të energjisë, të cilat njohin plotësimet
ndërmjet sistemeve të energjisë të vendeve të ndryshme. Për këtë studim, është ndërmarrë një
analizë e nivelit të lartë të kosto-përfitimeve (CBA) për të llogaritur kostot dhe përfitimet relative
për Shqipërinë të tregtisë së rritur të energjisë dhe llojet e ndryshme të prodhimit vendas të
energjisë, për të furnizuar (mbuluar) mungesën e energjisë elektrike të Shqipërisë që i atribuohet
ndikimeve të ndryshimeve klimatike (350 GWh në vit deri në vitin 2030, dhe 740 GWh në vit
deri në vitin 2050) dhe që mbetet pas zbatimit të plotë të skenarit aktiv të SKE të shtrirë
(ekstrapoluar) deri në vitin 2050. CBA përfshin mundësitë e mëposhtme:
përmirësimin e hidrocentraleve të mëdha ekzistuese,
përmirësimin e hidrocentraleve të vogla ekzistuese,
hidrocentrale të reja të mëdha,
hidrocentrale të reja të vogla,
termocentrale të reja,
xx
impiante të reja të erës, dhe
impiantet e reja të energjisë së përqëndruar diellore (CSP).
Performanca e këtyre alternativave është vlerësuar, duke përdorur parametrat që janë konfirmuar
si të rëndësishme nga aktorët kryesorë të sektorit të energjisë në Shqipëri. Ashtu si dhe
parametrat financiare (shpenzimet kapitale dhe operative), faktorët mjedisorë duke përfshirë
vlerën e ujit, gazet me efekt serrë dhe shkarkimet e tjera dhe vlerat e ekosistemit u panë si të
rëndësishëm në zgjedhjen midis alternativave të aseteve të energjisë. Përsa i përket parametrave
sociale, u vlerësua shqetësimi i njerëzve dhe pronës në CBA. Duke përdorur këto parametra, u
rendit qëndrueshmëria e alternativave të ndryshme.
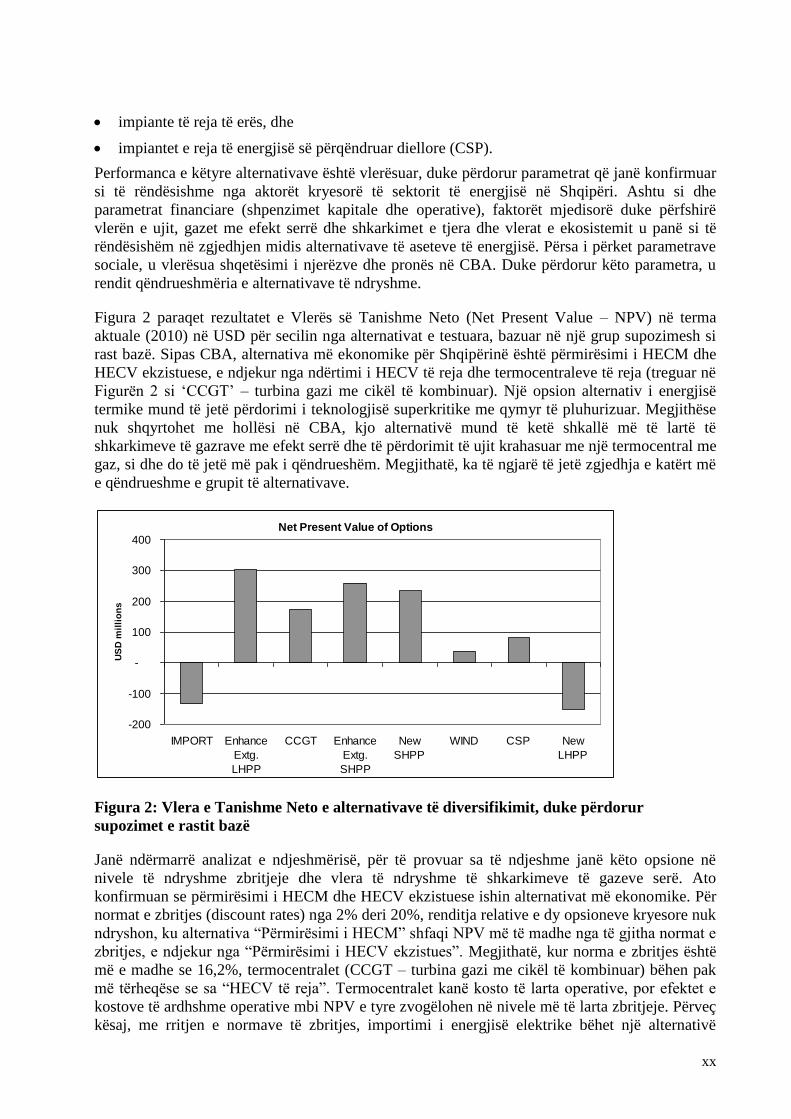
Figura 2 paraqet rezultatet e Vlerës së Tanishme Neto (Net Present Value – NPV) në terma
aktuale (2010) në USD për secilin nga alternativat e testuara, bazuar në një grup supozimesh si
rast bazë. Sipas CBA, alternativa më ekonomike për Shqipërinë është përmirësimi i HECM dhe
HECV ekzistuese, e ndjekur nga ndërtimi i HECV të reja dhe termocentraleve të reja (treguar në
Figurën 2 si ‗CCGT‘ – turbina gazi me cikël të kombinuar). Një opsion alternativ i energjisë
termike mund të jetë përdorimi i teknologjisë superkritike me qymyr të pluhurizuar. Megjithëse
nuk shqyrtohet me hollësi në CBA, kjo alternativë mund të ketë shkallë më të lartë të
shkarkimeve të gazrave me efekt serrë dhe të përdorimit të ujit krahasuar me një termocentral me
gaz, si dhe do të jetë më pak i qëndrueshëm. Megjithatë, ka të ngjarë të jetë zgjedhja e katërt më
e qëndrueshme e grupit të alternativave.
Net Present Value of Options
-200
-100
-
100
200
300
400
IMPORT Enhance
Extg.
LHPP
CCGT Enhance
Extg.
SHPP
New
SHPP
WIND CSP New
LHPP
US
D m
illi
on
s
Figura 2: Vlera e Tanishme Neto e alternativave të diversifikimit, duke përdorur
supozimet e rastit bazë
Janë ndërmarrë analizat e ndjeshmërisë, për të provuar sa të ndjeshme janë këto opsione në
nivele të ndryshme zbritjeje dhe vlera të ndryshme të shkarkimeve të gazeve serë. Ato
konfirmuan se përmirësimi i HECM dhe HECV ekzistuese ishin alternativat më ekonomike. Për
normat e zbritjes (discount rates) nga 2% deri 20%, renditja relative e dy opsioneve kryesore nuk
ndryshon, ku alternativa ―Përmirësimi i HECM‖ shfaqi NPV më të madhe nga të gjitha normat e
zbritjes, e ndjekur nga ―Përmirësimi i HECV ekzistues‖. Megjithatë, kur norma e zbritjes është
më e madhe se 16,2%, termocentralet (CCGT – turbina gazi me cikël të kombinuar) bëhen pak
më tërheqëse se sa ―HECV të reja‖. Termocentralet kanë kosto të larta operative, por efektet e
kostove të ardhshme operative mbi NPV e tyre zvogëlohen në nivele më të larta zbritjeje. Përveç
kësaj, me rritjen e normave të zbritjes, importimi i energjisë elektrike bëhet një alternativë
xxi
relativisht më tërheqëse, edhe pse ai mbetet me NPV negative në të gjitha normat e zbritjes që
janë ekzaminuar.
Në lidhje me ndikimet mbi opsionet e ndryshme të ndryshimit të çmimit të CO2 dhe gazeve të
tjera me efekt serë (GHG), siç pritej, ekonomia e aseteve të rinovueshme është e pandjeshme
ndaj këtij parametri. Është e qartë që ato opsione që janë të ndjeshme ndaj vlerës në rritje të
GHG janë termocentralet (CCGT) dhe importimi (supozohet të jetë prodhuar duke përdorur
CCGT). Sa më e lartë të jetë vlera e vendosur mbi dioksidin e karbonit dhe GHG-të e tjera, aq
më të pafavorshme bëhen termocentralet dhe importimi në terma relative. Megjithatë,
termocentralet vendase mbeten me NPV pozitive deri në vlerën më të lartë të testuar, me 100
USD për ton GHG.
Në përfundim, ekzistojnë disa veprime të rëndësishme që Shqipëria mund të ndërmarrë tani –
përkatësisht, përmirësimin e monitorimit, modelimit dhe parashikimit meteorologjik dhe
hidrometeorologjik, dhe përmirësimin e efiçencës së energjisë, menaxhimin e anës së kërkesës
dhe përdorimin efiçent të ujit. Këto do të ndihmojnë për të menaxhuar më mirë
ndryshueshmërinë ekzistuese të klimës, dhe do të krijojnë elasticitetin e vendit ndaj ndryshimeve
klimatike. Shqipëria është në prag të një mundësie të rëndësishme përshtatshmërie: investime të
mëdha në asetet e reja energjitike janë duke u zhvilluar ose duke u planifikuar. Integrimi i
masave të adaptimit në to mund të ndihmojë sigurimin e elasticitetit të tyre ndaj klimës.
Ndërkohë që sistemi i energjisë elektrike është është privatizuar, është e mundur të shqyrtohet se
si të strukturohen stimujt për adaptim; mund të ketë mundësi për ndarjen e shpenzimeve
ndërmjet qeverisë dhe sektorit privat. Sipas CBA, përmirësimi i HECM dhe HECV ekzistuese
është opsioni më ekonomik për Shqipërinë për të mbushur hendekun e energjisë të shkaktuar nga
ndryshimet klimatike, i cili do të shfaqet gjatë periudhës nga viti 2030 deri në 2050. Për
zhvillimin e aseteve të reja dhe përmirësimin e aseteve ekzistuese, sa më herët të merren në
konsideratë rreziqet dhe elasticiteti klimatik, aq më të mëdha do të jenë mundësitë për të
identifikuar zgjidhje me efiçencë financiare dhe ekonomike që do të krijojnë qëndrueshmërinë e
sistemit të energjisë për dekadat e ardhshme.
1
1. OVERVIEW
Energy security is a key concern in Albania, which relies on hydropower for about 90 percent of
its electricity production. While renewable energy resources like hydropower play a fundamental
role in moving the world towards a low-carbon economy, they are also vulnerable to climatic
conditions. Climate variability already affects Albania‘s energy production to a considerable
extent, and climate change is bringing further challenges.
This report summarizes work conducted in partnership with stakeholders in Albania‘s energy
sector and other closely related sectors. It aimed to build greater understanding of the climate
risks faced by the energy sector and of priority actions that could be taken to reduce
vulnerabilities. It addressed the following question:
“How can Albania best manage its future security of energy supply in the face of a
changing climate?”
Best is defined as ―an optimal balance between financial, environmental and social objectives.‖
The work involved:
Climate-risk screening of the energy sector to identify and prioritize hazards, current
vulnerabilities
Estimating the impacts of projected climate changes on energy supply and demand out to the
year 2050
Identifying adaptation options to reduce overall vulnerability
A high-level cost–benefit analysis of key physical adaptation options
The analysis was intended to raise awareness among stakeholders and provide high-level (semi-
quantitative) assessments of risks and adaptation options for Albania‘s energy sector, drawing on
existing research and literature on climate change and its impacts. It aimed to identify key risk
areas and options for adaptation, to establish where subsequent more in-depth analyses should be
focused. Additional research would help to improve understanding of the implications of
extreme climatic events, which are addressed only briefly in this study. There may also be
significant indirect impacts that could be better understood through integrated cross-sectoral
assessments—for instance, the effects on energy supply of the adaptation actions that may be
taken in the agriculture sector. The recommended next steps to further refine and improve the
evidence base for adaptation planning are described in Section 6.
It is intended that this assessment will help support the Albanian government and other energy-
sector stakeholders in developing policies and projects (future energy assets) that are robust in
the face of climatic uncertainties, and will also assist them in managing existing energy
concerns, as the climate changes.
2
Box 1: Development and climate change at work
The World Bank Group‘s (WBG) operational response to climate change is articulated in Development and
Climate Change: A Strategic Framework for the World Bank Group, a framework prepared at the request of
the Development Committee during the WBG‘s 2007 Annual Meetings and endorsed a year later. Six action
areas are identified to support the specific needs and priorities of World Bank clients:
1. Support climate actions in country-led development processes.
2. Mobilize additional concession and innovative finance.
3. Facilitate the development of market-based financing mechanisms.
4. Leverage private sector resources.
5. Support accelerated development and deployment of new technologies.
6. Step up policy research, knowledge, and capacity building.
Supporting tools for adaptation and actions with mitigation co-benefits are linked to each action area. The
focus is on improving knowledge and capacity, including learning by doing. The framework sets measurable
indicators to track implementation performance over fiscal years 2009 to 2011.
(Adapted from: Development and Climate Change, A Strategic Framework for the World Bank Group, World
Bank, 2008a).
The analysis has been co-funded by the Energy Sector Management Assistance Program
(ESMAP), the Trust Fund for Environmentally and Socially Sustainable Development
(TFESSD) and the World Bank. It fits within the broader context of the World Bank‘s Strategic
Framework on Development and Climate Change (see Box 1).
1.1. METHODOLOGICAL APPROACH
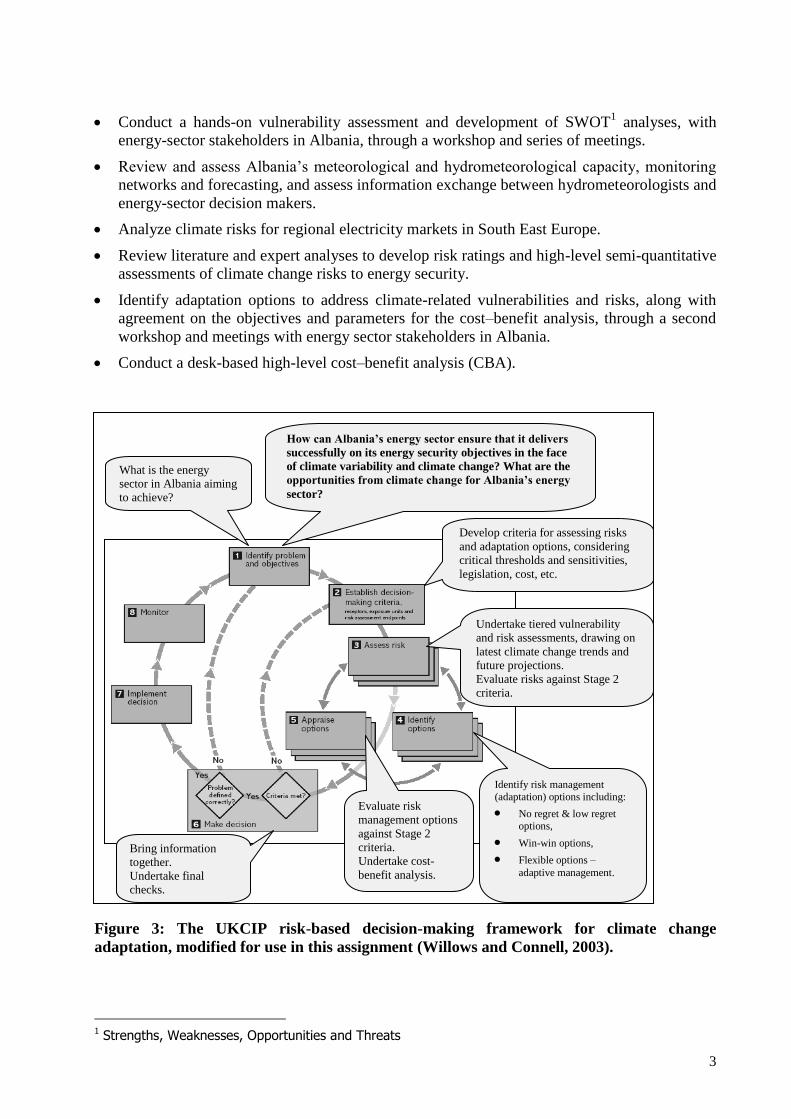
The overall approach for undertaking the analysis followed a risk-based framework for decision-
making on climate change adaptation, applying guidance published in the UK (Willows and
Connell, 2003) and Australia (Broadleaf Capital International and Marsden Jacob Associates,
2006). An annotated version of the framework is shown in Figure 3.
The framework puts stakeholders at the heart of the decision-making process. It starts by
working with stakeholders to define their objectives and success criteria, and maintains their
involvement through the stages of climate vulnerability assessment, risk assessment, and risk
management (adaptation planning).
The assessment was intended to deliver a high-level (semi-quantitative) analysis covering the
entire energy sector. It identifies key issues related to Albania‘s energy security in the face of
climate variability and change, and demonstrates where subsequent in-depth analyses should be
focused.
Delivering the assessment involved the following activities that are described further in Annex 1:
Review Albania‘s energy sector strategies, energy assets and energy demand projections.
Review and build on work conducted for Albania‘s First National Communication to the
United Nations Framework Convention on Climate Change (Islami et al., 2002).
Analyze observed climatic conditions and data on future climate change for Albania.
Use Geographical Information System (GIS) to map Albania‘s energy assets overlaid with
data on climate change.
3
Conduct a hands-on vulnerability assessment and development of SWOT1 analyses, with
energy-sector stakeholders in Albania, through a workshop and series of meetings.
Review and assess Albania‘s meteorological and hydrometeorological capacity, monitoring
networks and forecasting, and assess information exchange between hydrometeorologists and
energy-sector decision makers.
Analyze climate risks for regional electricity markets in South East Europe.
Review literature and expert analyses to develop risk ratings and high-level semi-quantitative
assessments of climate change risks to energy security.
Identify adaptation options to address climate-related vulnerabilities and risks, along with
agreement on the objectives and parameters for the cost–benefit analysis, through a second
workshop and meetings with energy sector stakeholders in Albania.
Conduct a desk-based high-level cost–benefit analysis (CBA).
Figure 3: The UKCIP risk-based decision-making framework for climate change
adaptation, modified for use in this assignment (Willows and Connell, 2003).
1 Strengths, Weaknesses, Opportunities and Threats
What is the energy
sector in Albania aiming
to achieve?
Develop criteria for assessing risks
and adaptation options, considering
critical thresholds and sensitivities,
legislation, cost, etc.
Identify risk management
(adaptation) options including:
No regret & low regret
options,
Win-win options,
Flexible options –
adaptive management.
Evaluate risk
management options
against Stage 2
criteria.
Undertake cost-
benefit analysis.
How can Albania’s energy sector ensure that it delivers
successfully on its energy security objectives in the face
of climate variability and climate change? What are the
opportunities from climate change for Albania’s energy
sector?
Bring information
together.
Undertake final
checks.
Undertake tiered vulnerability
and risk assessments, drawing on
latest climate change trends and
future projections.
Evaluate risks against Stage 2
criteria.
4
1.2. STRUCTURE OF THIS REPORT
This report presents the outcomes of the assessment just described. The remainder of this report
is set out as follows:
Section 2 describes the context for this assessment, covering the Albanian energy sector,
observed and projected climatic conditions and Albania‘s adaptive capacity.
Section 3 outlines the climatic vulnerabilities, risks, and opportunities facing Albania‘s energy
sector.
Section 4 describes the key adaptation options identified for managing climate risks to the
energy sector.
Section 5 provides the cost–benefit analysis of physical adaptation options.
Section 6 sets out next steps for improving the climate resilience of Albania‘s energy sector.
Section 7 includes references and lists of annexes and appendices.
Annex 1 describes the methodological approaches to each stage of the assignment.
Annex 2 provides the background and rationale for the prioritization of climate-related risks.
Annex 3 provides tables of cross-cutting adaptation options, as well as options for each asset
type.
Annex 4 describes the weather and climate information needs for energy sector management,
covering design, operations and maintenance.
Annex 5 gives further details on the approach to the cost–benefit analysis.
Annex 6 gives further details on recommended actions to improve the climate resilience of the
energy sector.
Annex 7 is a spreadsheet providing the scenarios of Albania power supply and demand from
2003 to 2050, which were applied in the cost–benefit analysis.
Annex 8 estimates impacts of climate change on large hydropower plants in Albania.
Annex 9 estimates impacts of climate change on energy generation in Albania, excluding large
hydropower plants.
Annex 10 includes a glossary of key terms.
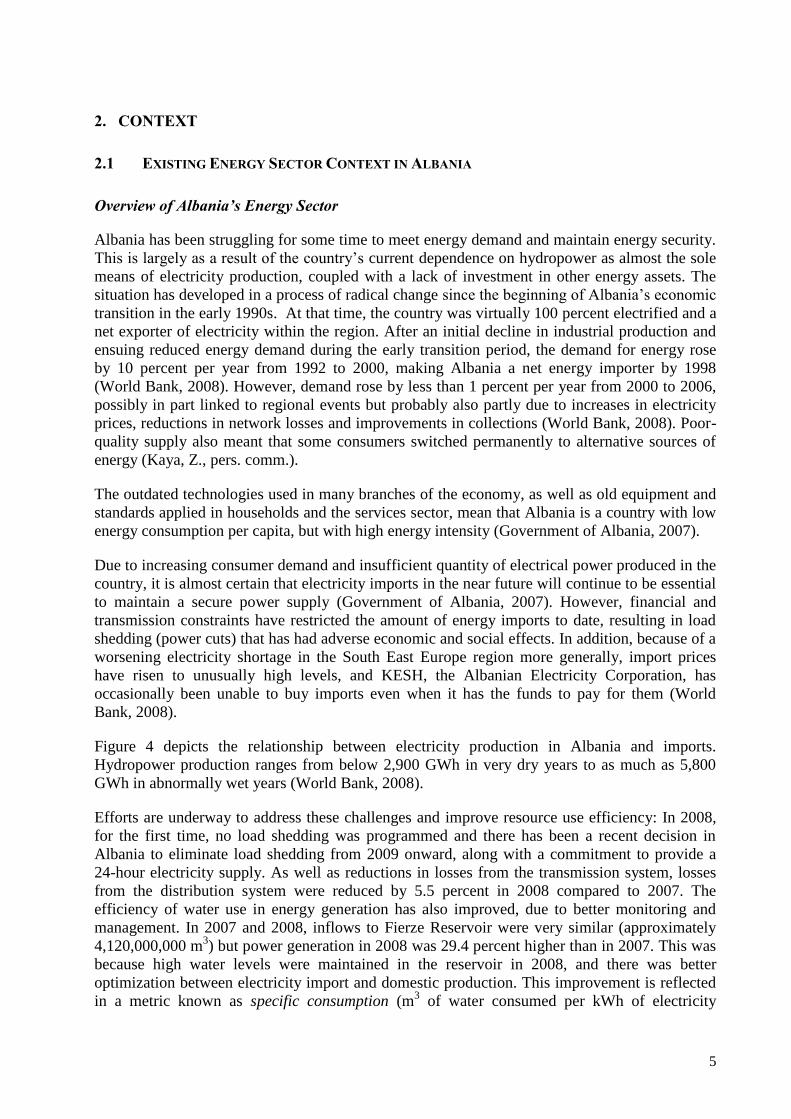
5
2. CONTEXT
2.1 EXISTING ENERGY SECTOR CONTEXT IN ALBANIA
Overview of Albania’s Energy Sector
Albania has been struggling for some time to meet energy demand and maintain energy security.
This is largely as a result of the country‘s current dependence on hydropower as almost the sole
means of electricity production, coupled with a lack of investment in other energy assets. The
situation has developed in a process of radical change since the beginning of Albania‘s economic
transition in the early 1990s. At that time, the country was virtually 100 percent electrified and a
net exporter of electricity within the region. After an initial decline in industrial production and
ensuing reduced energy demand during the early transition period, the demand for energy rose
by 10 percent per year from 1992 to 2000, making Albania a net energy importer by 1998
(World Bank, 2008). However, demand rose by less than 1 percent per year from 2000 to 2006,
possibly in part linked to regional events but probably also partly due to increases in electricity
prices, reductions in network losses and improvements in collections (World Bank, 2008). Poor-
quality supply also meant that some consumers switched permanently to alternative sources of
energy (Kaya, Z., pers. comm.).
The outdated technologies used in many branches of the economy, as well as old equipment and
standards applied in households and the services sector, mean that Albania is a country with low
energy consumption per capita, but with high energy intensity (Government of Albania, 2007).
Due to increasing consumer demand and insufficient quantity of electrical power produced in the
country, it is almost certain that electricity imports in the near future will continue to be essential
to maintain a secure power supply (Government of Albania, 2007). However, financial and
transmission constraints have restricted the amount of energy imports to date, resulting in load
shedding (power cuts) that has had adverse economic and social effects. In addition, because of a
worsening electricity shortage in the South East Europe region more generally, import prices
have risen to unusually high levels, and KESH, the Albanian Electricity Corporation, has
occasionally been unable to buy imports even when it has the funds to pay for them (World
Bank, 2008).
Figure 4 depicts the relationship between electricity production in Albania and imports.
Hydropower production ranges from below 2,900 GWh in very dry years to as much as 5,800
GWh in abnormally wet years (World Bank, 2008).
Efforts are underway to address these challenges and improve resource use efficiency: In 2008,
for the first time, no load shedding was programmed and there has been a recent decision in
Albania to eliminate load shedding from 2009 onward, along with a commitment to provide a
24-hour electricity supply. As well as reductions in losses from the transmission system, losses
from the distribution system were reduced by 5.5 percent in 2008 compared to 2007. The
efficiency of water use in energy generation has also improved, due to better monitoring and
management. In 2007 and 2008, inflows to Fierze Reservoir were very similar (approximately
4,120,000,000 m3) but power generation in 2008 was 29.4 percent higher than in 2007. This was
because high water levels were maintained in the reservoir in 2008, and there was better
optimization between electricity import and domestic production. This improvement is reflected
in a metric known as specific consumption (m3 of water consumed per kWh of electricity
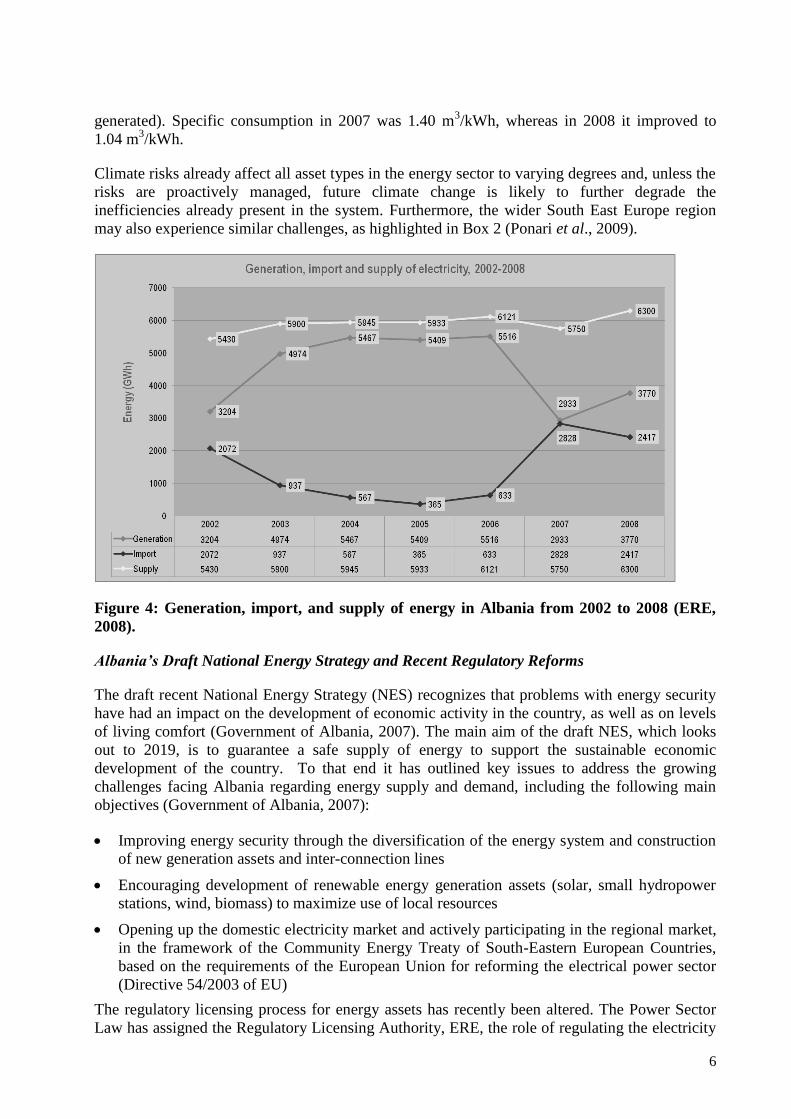
6
generated). Specific consumption in 2007 was 1.40 m3/kWh, whereas in 2008 it improved to
1.04 m3/kWh.
Climate risks already affect all asset types in the energy sector to varying degrees and, unless the
risks are proactively managed, future climate change is likely to further degrade the
inefficiencies already present in the system. Furthermore, the wider South East Europe region
may also experience similar challenges, as highlighted in Box 2 (Ponari et al., 2009).
Figure 4: Generation, import, and supply of energy in Albania from 2002 to 2008 (ERE,
2008).
Albania’s Draft National Energy Strategy and Recent Regulatory Reforms
The draft recent National Energy Strategy (NES) recognizes that problems with energy security
have had an impact on the development of economic activity in the country, as well as on levels
of living comfort (Government of Albania, 2007). The main aim of the draft NES, which looks
out to 2019, is to guarantee a safe supply of energy to support the sustainable economic
development of the country. To that end it has outlined key issues to address the growing
challenges facing Albania regarding energy supply and demand, including the following main
objectives (Government of Albania, 2007):
Improving energy security through the diversification of the energy system and construction
of new generation assets and inter-connection lines
Encouraging development of renewable energy generation assets (solar, small hydropower
stations, wind, biomass) to maximize use of local resources
Opening up the domestic electricity market and actively participating in the regional market,
in the framework of the Community Energy Treaty of South-Eastern European Countries,
based on the requirements of the European Union for reforming the electrical power sector
(Directive 54/2003 of EU)
The regulatory licensing process for energy assets has recently been altered. The Power Sector
Law has assigned the Regulatory Licensing Authority, ERE, the role of regulating the electricity
7
system and issuing licenses for electricity production, while permission to construct new energy
production facilities is granted by the Ministry of Economy, Trade and Energy (METE). In the
past year, regulations have been developed related to the 2008 amendment of the law on
renewables, which aimed to harmonize Albanian practice with EU directives, as well as to speed
up and manage the approval process for renewable concessions. The revised approval process
covers authorization of wind, biomass, other renewables, and thermal power plants. Small
hydropower plants are covered by the Law on Concessions.
Albania’s Energy Assets
A brief overview of the existing and planned energy assets in Albania is useful for understanding
the extent to which high dependence on hydropower, low diversity in the energy system, and
inefficient grid systems constitute the main reasons for Albania‘s poor energy security.
Large Hydropower Plants
Hydropower from three large hydropower plants (LHPPs) on the River Drin account for about
90 percent of electrical power produced within Albania, utilizing the country‘s plentiful water
resources (Government of Albania, 2007). The remaining domestic generation is mainly from
the two LHPPs on the Mati River Cascade. These five LHPPs have a combined installed
capacity of 1.45GW (see Figure 5):
Drin River Cascade:
Fierza—4 125 MW with annual production of about 1,800 GWh, built in the 1970s and
modernization completed in 2006
Koman—4 150 MW, with annual production of about 2,000 GWh, built in the 1980s
Vau i Dejes—5 50 MW, with annual production of about 1,000 GWh, built in the 1960s
Mati River Cascade:
Ulza—25 MW, producing about 120 GWh, commissioned in 1958
Shkopeti—25 MW, producing about 94 GWh per year, commissioned in 1970
A further LHPP is installed on the Bistrica River, with 25MW installed capacity.
Recognizing the importance of the main five LHPPs to Albania and the wider South Eastern
Europe Energy Community, the World Bank has provided credit of US$35.3 million to Albania
for a dam safety project, which will contribute to safeguarding them, improve their operational
efficiency, and enhance the stability of power supply for the regional electricity market (World
Bank, 2008b).
The Ministry of Economy, Trade and Energy (METE) estimates that there is capacity for about
3,200MW of additional hydropower power plants within Albania (Tugu, 2009). A number of
large hydropower plant projects are being considered or are in progress:
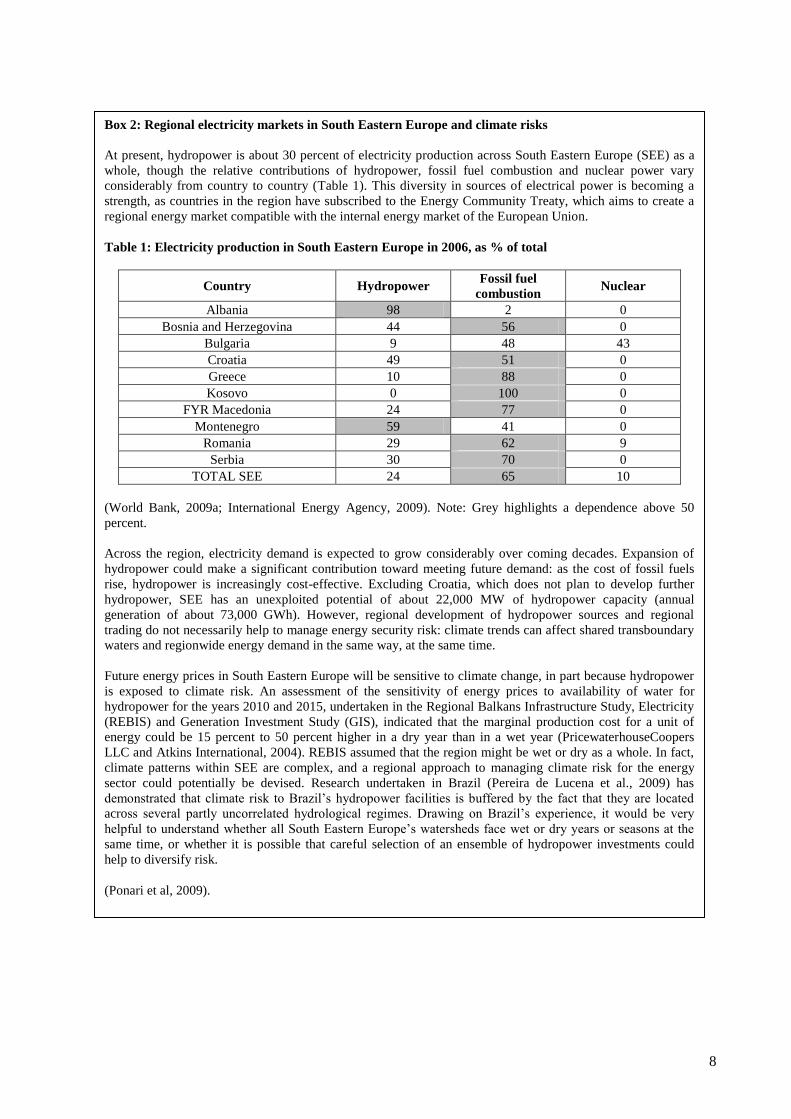
8
Box 2: Regional electricity markets in South Eastern Europe and climate risks
At present, hydropower is about 30 percent of electricity production across South Eastern Europe (SEE) as a
whole, though the relative contributions of hydropower, fossil fuel combustion and nuclear power vary
considerably from country to country (Table 1). This diversity in sources of electrical power is becoming a
strength, as countries in the region have subscribed to the Energy Community Treaty, which aims to create a
regional energy market compatible with the internal energy market of the European Union.
Table 1: Electricity production in South Eastern Europe in 2006, as % of total
Country Hydropower Fossil fuel
combustion Nuclear
Albania 98 2 0
Bosnia and Herzegovina 44 56 0
Bulgaria 9 48 43
Croatia 49 51 0
Greece 10 88 0
Kosovo 0 100 0
FYR Macedonia 24 77 0
Montenegro 59 41 0
Romania 29 62 9
Serbia 30 70 0
TOTAL SEE 24 65 10
(World Bank, 2009a; International Energy Agency, 2009). Note: Grey highlights a dependence above 50
percent.
Across the region, electricity demand is expected to grow considerably over coming decades. Expansion of
hydropower could make a significant contribution toward meeting future demand: as the cost of fossil fuels
rise, hydropower is increasingly cost-effective. Excluding Croatia, which does not plan to develop further
hydropower, SEE has an unexploited potential of about 22,000 MW of hydropower capacity (annual
generation of about 73,000 GWh). However, regional development of hydropower sources and regional
trading do not necessarily help to manage energy security risk: climate trends can affect shared transboundary
waters and regionwide energy demand in the same way, at the same time.
Future energy prices in South Eastern Europe will be sensitive to climate change, in part because hydropower
is exposed to climate risk. An assessment of the sensitivity of energy prices to availability of water for
hydropower for the years 2010 and 2015, undertaken in the Regional Balkans Infrastructure Study, Electricity
(REBIS) and Generation Investment Study (GIS), indicated that the marginal production cost for a unit of
energy could be 15 percent to 50 percent higher in a dry year than in a wet year (PricewaterhouseCoopers
LLC and Atkins International, 2004). REBIS assumed that the region might be wet or dry as a whole. In fact,
climate patterns within SEE are complex, and a regional approach to managing climate risk for the energy
sector could potentially be devised. Research undertaken in Brazil (Pereira de Lucena et al., 2009) has
demonstrated that climate risk to Brazil‘s hydropower facilities is buffered by the fact that they are located
across several partly uncorrelated hydrological regimes. Drawing on Brazil‘s experience, it would be very
helpful to understand whether all South Eastern Europe‘s watersheds face wet or dry years or seasons at the
same time, or whether it is possible that careful selection of an ensemble of hydropower investments could
help to diversify risk.
(Ponari et al, 2009).

9
Vjosa River:
Kalivaci HPP is under construction.
A study on the hydropower potential of the Vjosa is being prepared by KESH and is
expected to lead to further concessions soon.
Drin River Cascade:
Verbund (Austria) have been granted a concession for Ashta HPP and construction is
expected to start shortly.
Scavica HPP is currently under tender.
Devolli River Cascade:
A concession has been granted to EVN (Austria).
Figure 5: Locations of the five large hydropower plants that provide about 90 percent of
Albania’s domestic electricity production (World Bank, 2008b).

10
Small Hydropower Plants (less than 15 MW capacity)
Small hydropower plants (SHPPs) are defined in Albanian law as plants with capacity up to
15MW, in line with EU norms. While there are 84 existing SHPPs, only about 20 privately
owned SHPPs are operating at present. Most of these are in need of rehabilitation.
Since the passage of the General Concession Law on December 18, 2006, by the Albanian
Parliament, an additional 50 new concessions were granted to small hydropower plant (SHPP)
owners in Albania. A feed-in tariff for SHPP is a major incentive for new investments.
Thermal Power Plants
The only thermal power plant (TPP) currently operating in Albania is at Fier. The plant operates
on heavy fuel oil produced by the Ballsh oil refinery, and available capacity has only about
20MW capacity. Due to its low fuel efficiency and associated high operating costs, the plant is
used for only a few days every year (World Bank, 2008). It is currently being rehabilitated.
The commissioning of the 100 MW seawater-cooled Vlore TPP (due to commence full operation
in January 2010) will add about 760 GWh (15 percent) per year of domestic production.
Additional large TPP projects are also being considered or taken forward, including a 250MW
combined cycle gas turbine (CCGT) power plant at Fier as part of the planned LNG terminal and
a coal-fired TPP at Porto Romano (1000MW) that could export some of its electricity to Italy
(Hoxha, 2009).
Renewables
Currently, apart from hydropower, there are no industrial-scale renewable assets in operation in
Albania (World Bank, 2008). The lack of investment in other assets to diversify the energy
system plays an important role in the current challenges Albania is faced with in terms of energy
security.
Several wind projects are under discussion or development, including plans for a joint
wind/biomass project in Lezhe District and close to Vlore (Karaburun Peninsula). Some seven
wind licenses have been issued to date, which would provide 1 million kWh installed capacity
(2-2.2 billion kWh per year of production). These will likely export some of the electricity they
generate to Italy. Solar and geothermal are not currently foreseen for industrial-scale power
generation purposes. However, they are considered useful for heating in the domestic, public,
and services sectors.
Electricity Transmission System
The transmission system consists of 122 km of 400 kV, 1128 km of 220 kV, 34.4 km of 150 kV,
and 1216 km of 110 kV lines. There is a 400 kV interconnection to Greece (Elbasan to Kardia), a
220 kV interconnection to Montenegro (Vau i Dejes to Podgorica) and a 220 kV interconnection
to Kosovo (Fierze to Prizren). There is also a 150 kV interconnection with Greece (Bistrice 1 to
Igumenice). The 220 kV transmission network serves to interconnect the three LHPPs on the
Drin River and the existing Fier TPP, with the major load centers of Tirana-Durres, Elbasan,
Burreli, and Fier (World Bank, 2008). The existing transmission grid does not yet have enough
capacity to allow for full regional energy trade with Albania‘s neighbors, but it is generally in
good condition, as most transmission lines are either new or have been upgraded (Acclimatise et
al., 2009a). The expected completion in 2010 of a 400 kV transmission interconnection between
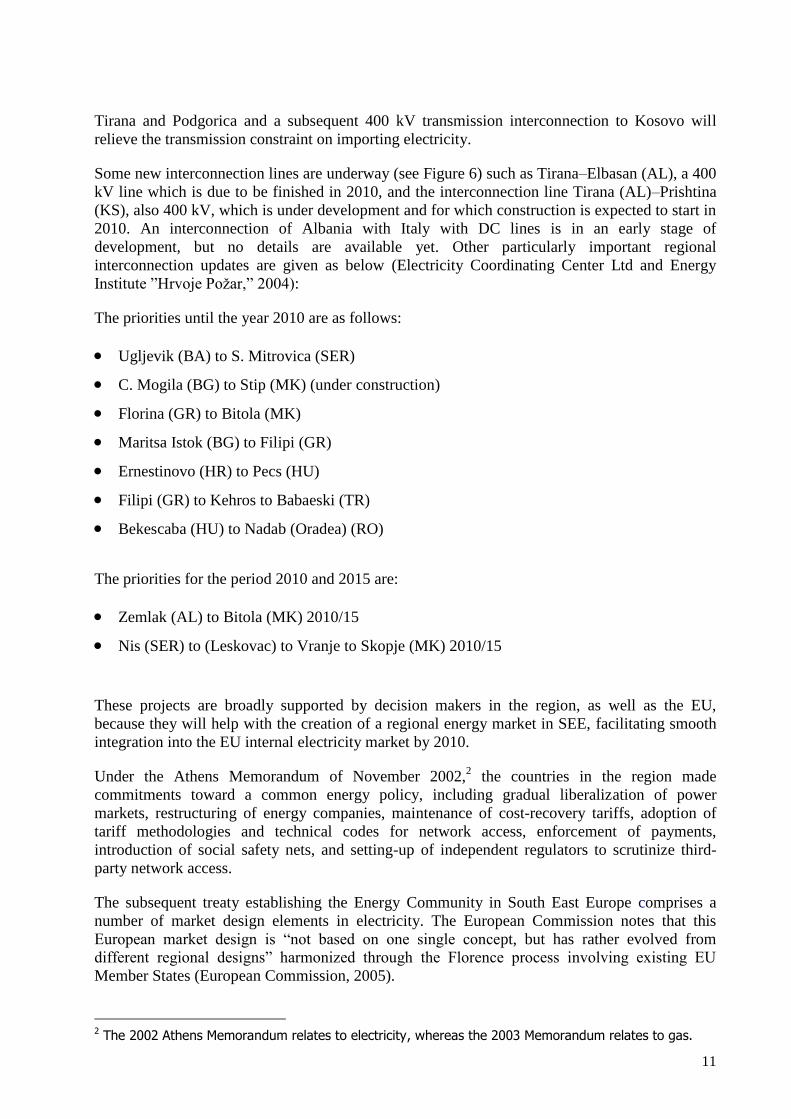
11
Tirana and Podgorica and a subsequent 400 kV transmission interconnection to Kosovo will
relieve the transmission constraint on importing electricity.
Some new interconnection lines are underway (see Figure 6) such as Tirana–Elbasan (AL), a 400
kV line which is due to be finished in 2010, and the interconnection line Tirana (AL)–Prishtina
(KS), also 400 kV, which is under development and for which construction is expected to start in
2010. An interconnection of Albania with Italy with DC lines is in an early stage of
development, but no details are available yet. Other particularly important regional
interconnection updates are given as below (Electricity Coordinating Center Ltd and Energy
Institute ‖Hrvoje Požar,‖ 2004):
The priorities until the year 2010 are as follows:
Ugljevik (BA) to S. Mitrovica (SER)
C. Mogila (BG) to Stip (MK) (under construction)
Florina (GR) to Bitola (MK)
Maritsa Istok (BG) to Filipi (GR)
Ernestinovo (HR) to Pecs (HU)
Filipi (GR) to Kehros to Babaeski (TR)
Bekescaba (HU) to Nadab (Oradea) (RO)
The priorities for the period 2010 and 2015 are:
Zemlak (AL) to Bitola (MK) 2010/15
Nis (SER) to (Leskovac) to Vranje to Skopje (MK) 2010/15
These projects are broadly supported by decision makers in the region, as well as the EU,
because they will help with the creation of a regional energy market in SEE, facilitating smooth
integration into the EU internal electricity market by 2010.
Under the Athens Memorandum of November 2002,2 the countries in the region made
commitments toward a common energy policy, including gradual liberalization of power
markets, restructuring of energy companies, maintenance of cost-recovery tariffs, adoption of
tariff methodologies and technical codes for network access, enforcement of payments,
introduction of social safety nets, and setting-up of independent regulators to scrutinize third-
party network access.
The subsequent treaty establishing the Energy Community in South East Europe comprises a
number of market design elements in electricity. The European Commission notes that this
European market design is ―not based on one single concept, but has rather evolved from
different regional designs‖ harmonized through the Florence process involving existing EU
Member States (European Commission, 2005).
2 The 2002 Athens Memorandum relates to electricity, whereas the 2003 Memorandum relates to gas.
12
Figure 6: Existing and candidate interconnections in the region (Cerepnalkovski et al.,
2002).
Electricity Distribution System
The distribution grid is considerably weaker and more inefficient than the transmission system.
Commercial losses (i.e., electrical power taken from the network illegally) constitute the main
losses from the distribution grid and have led to KESH being unable to invest in maintenance
and rehabilitation of the system (World Bank, 2008). Commercial losses amounted to 760 GWh
(13.4 percent) in 2008 and carry a considerable economic cost to KESH (Government of
Albania, 2007).
Although city distribution networks are generally in good condition, there are significant parts of
the distribution grid that need upgrading, especially those serving rural and mountain
communities, many of which do not have secure energy supplies (Acclimatise et al., 2009a).
The recent privatization of the distribution system to CEZ will see new investment, as well as
efforts to curb total losses from the grid, with targets to reduce total losses (technical and
commercial) to 15 percent at the end of 2014, down from a value of about 33 percent in 2008
(CEZ Regulatory Statement, 2008).
Oil, Gas, and Coal Production Facilities
The main areas where oil is produced are Patoz Marinza, Cakran-Mollaj, Ballsh-Hekal, Gorisht-
Kocul, and Kucova. Bankers Petroleum currently produces about 600kt/yr of oil, about 75
percent of Albania‘s domestic production, approximately half of which is for export markets.
The remainder is mainly produced by Albpetrol. Bankers Petroleum has plans to reactivate some
existing wells, which could more than double national production in the next three to four years.
It should be noted that there is a significant legacy of contaminated land around the oil
production facilities at Patos Marinza, which is recognized by the EU as an environmental
hotspot (UNEP, 2000).
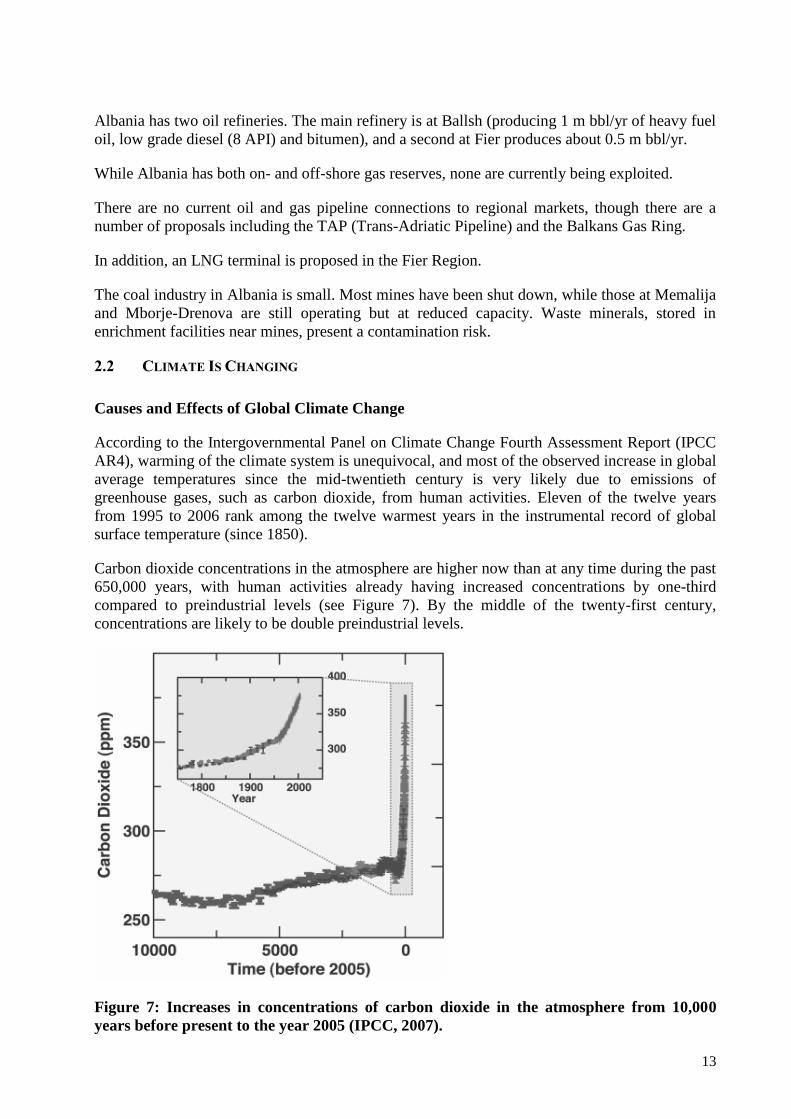
13
Albania has two oil refineries. The main refinery is at Ballsh (producing 1 m bbl/yr of heavy fuel
oil, low grade diesel (8 API) and bitumen), and a second at Fier produces about 0.5 m bbl/yr.
While Albania has both on- and off-shore gas reserves, none are currently being exploited.
There are no current oil and gas pipeline connections to regional markets, though there are a
number of proposals including the TAP (Trans-Adriatic Pipeline) and the Balkans Gas Ring.
In addition, an LNG terminal is proposed in the Fier Region.
The coal industry in Albania is small. Most mines have been shut down, while those at Memalija
and Mborje-Drenova are still operating but at reduced capacity. Waste minerals, stored in
enrichment facilities near mines, present a contamination risk.
2.2 CLIMATE IS CHANGING
Causes and Effects of Global Climate Change
According to the Intergovernmental Panel on Climate Change Fourth Assessment Report (IPCC
AR4), warming of the climate system is unequivocal, and most of the observed increase in global
average temperatures since the mid-twentieth century is very likely due to emissions of
greenhouse gases, such as carbon dioxide, from human activities. Eleven of the twelve years
from 1995 to 2006 rank among the twelve warmest years in the instrumental record of global
surface temperature (since 1850).
Carbon dioxide concentrations in the atmosphere are higher now than at any time during the past
650,000 years, with human activities already having increased concentrations by one-third
compared to preindustrial levels (see Figure 7). By the middle of the twenty-first century,
concentrations are likely to be double preindustrial levels.
Figure 7: Increases in concentrations of carbon dioxide in the atmosphere from 10,000
years before present to the year 2005 (IPCC, 2007).
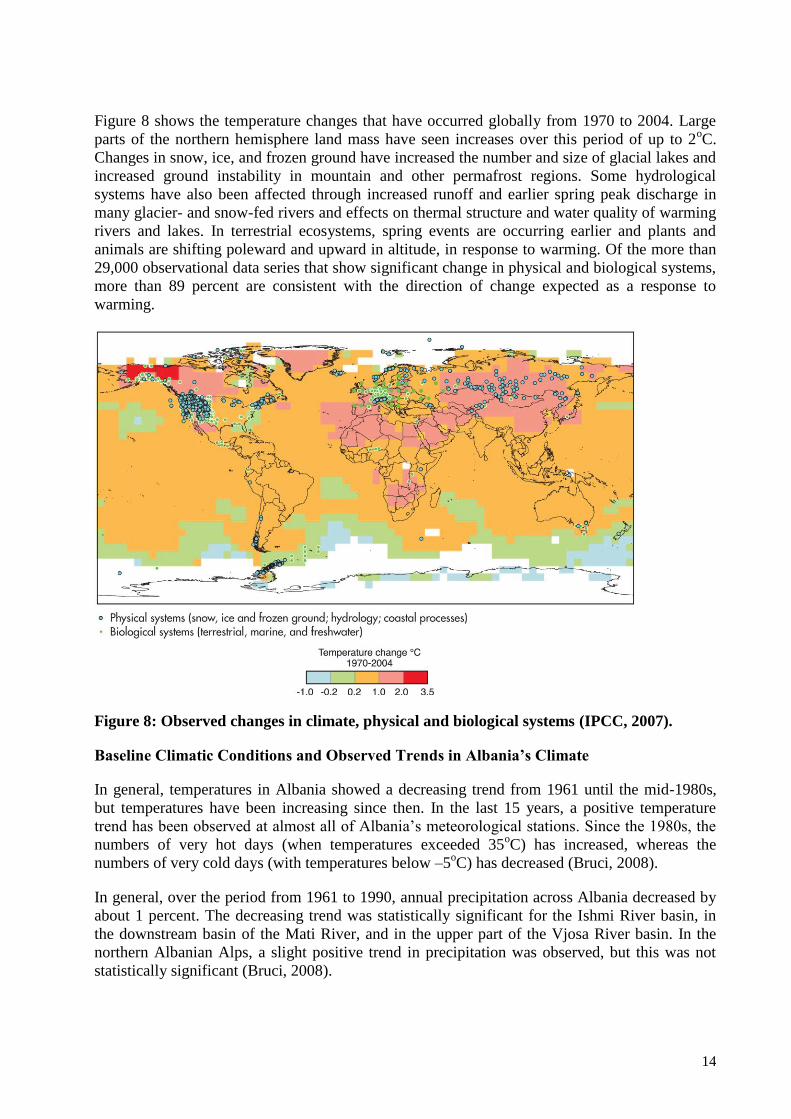
14
Figure 8 shows the temperature changes that have occurred globally from 1970 to 2004. Large
parts of the northern hemisphere land mass have seen increases over this period of up to 2oC.
Changes in snow, ice, and frozen ground have increased the number and size of glacial lakes and
increased ground instability in mountain and other permafrost regions. Some hydrological
systems have also been affected through increased runoff and earlier spring peak discharge in
many glacier- and snow-fed rivers and effects on thermal structure and water quality of warming
rivers and lakes. In terrestrial ecosystems, spring events are occurring earlier and plants and
animals are shifting poleward and upward in altitude, in response to warming. Of the more than
29,000 observational data series that show significant change in physical and biological systems,
more than 89 percent are consistent with the direction of change expected as a response to
warming.
Figure 8: Observed changes in climate, physical and biological systems (IPCC, 2007).
Baseline Climatic Conditions and Observed Trends in Albania’s Climate
In general, temperatures in Albania showed a decreasing trend from 1961 until the mid-1980s,
but temperatures have been increasing since then. In the last 15 years, a positive temperature
trend has been observed at almost all of Albania‘s meteorological stations. Since the 1980s, the
numbers of very hot days (when temperatures exceeded 35oC) has increased, whereas the
numbers of very cold days (with temperatures below –5oC) has decreased (Bruci, 2008).
In general, over the period from 1961 to 1990, annual precipitation across Albania decreased by
about 1 percent. The decreasing trend was statistically significant for the Ishmi River basin, in
the downstream basin of the Mati River, and in the upper part of the Vjosa River basin. In the
northern Albanian Alps, a slight positive trend in precipitation was observed, but this was not
statistically significant (Bruci, 2008).
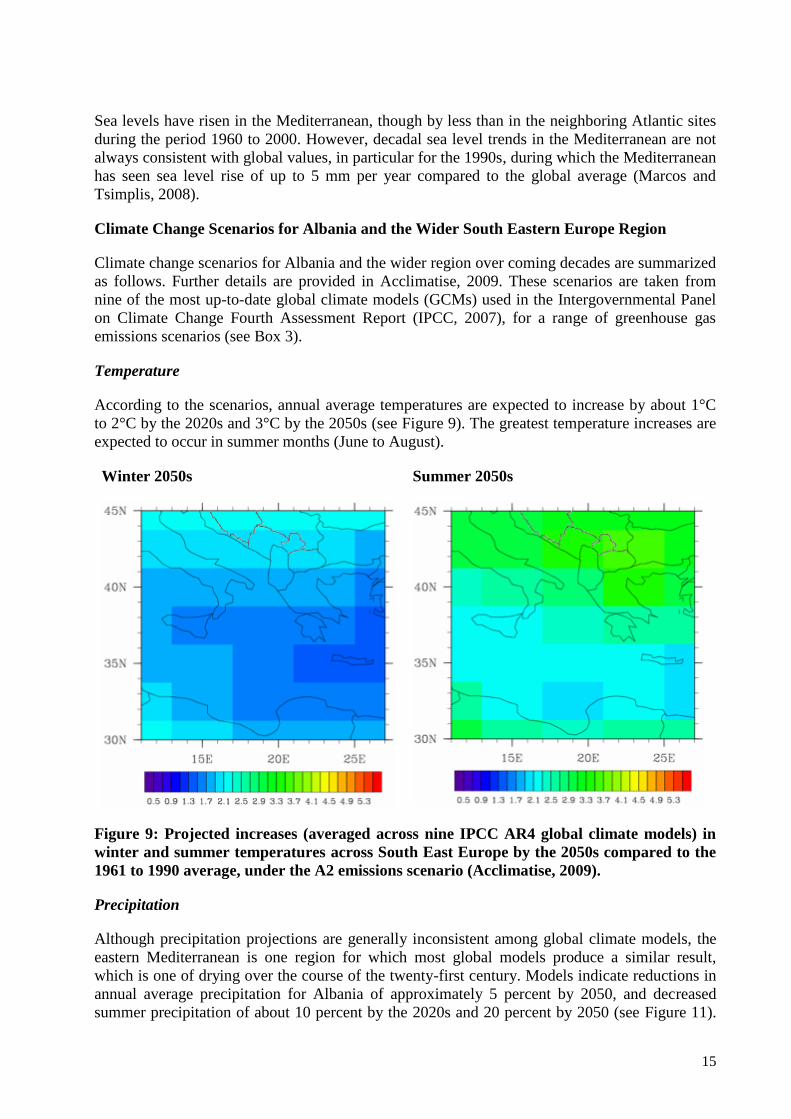
15
Sea levels have risen in the Mediterranean, though by less than in the neighboring Atlantic sites
during the period 1960 to 2000. However, decadal sea level trends in the Mediterranean are not
always consistent with global values, in particular for the 1990s, during which the Mediterranean
has seen sea level rise of up to 5 mm per year compared to the global average (Marcos and
Tsimplis, 2008).
Climate Change Scenarios for Albania and the Wider South Eastern Europe Region
Climate change scenarios for Albania and the wider region over coming decades are summarized
as follows. Further details are provided in Acclimatise, 2009. These scenarios are taken from
nine of the most up-to-date global climate models (GCMs) used in the Intergovernmental Panel
on Climate Change Fourth Assessment Report (IPCC, 2007), for a range of greenhouse gas
emissions scenarios (see Box 3).
Temperature
According to the scenarios, annual average temperatures are expected to increase by about 1°C
to 2°C by the 2020s and 3°C by the 2050s (see Figure 9). The greatest temperature increases are
expected to occur in summer months (June to August).
Winter 2050s
Summer 2050s
Figure 9: Projected increases (averaged across nine IPCC AR4 global climate models) in
winter and summer temperatures across South East Europe by the 2050s compared to the
1961 to 1990 average, under the A2 emissions scenario (Acclimatise, 2009).
Precipitation
Although precipitation projections are generally inconsistent among global climate models, the
eastern Mediterranean is one region for which most global models produce a similar result,
which is one of drying over the course of the twenty-first century. Models indicate reductions in
annual average precipitation for Albania of approximately 5 percent by 2050, and decreased
summer precipitation of about 10 percent by the 2020s and 20 percent by 2050 (see Figure 11).
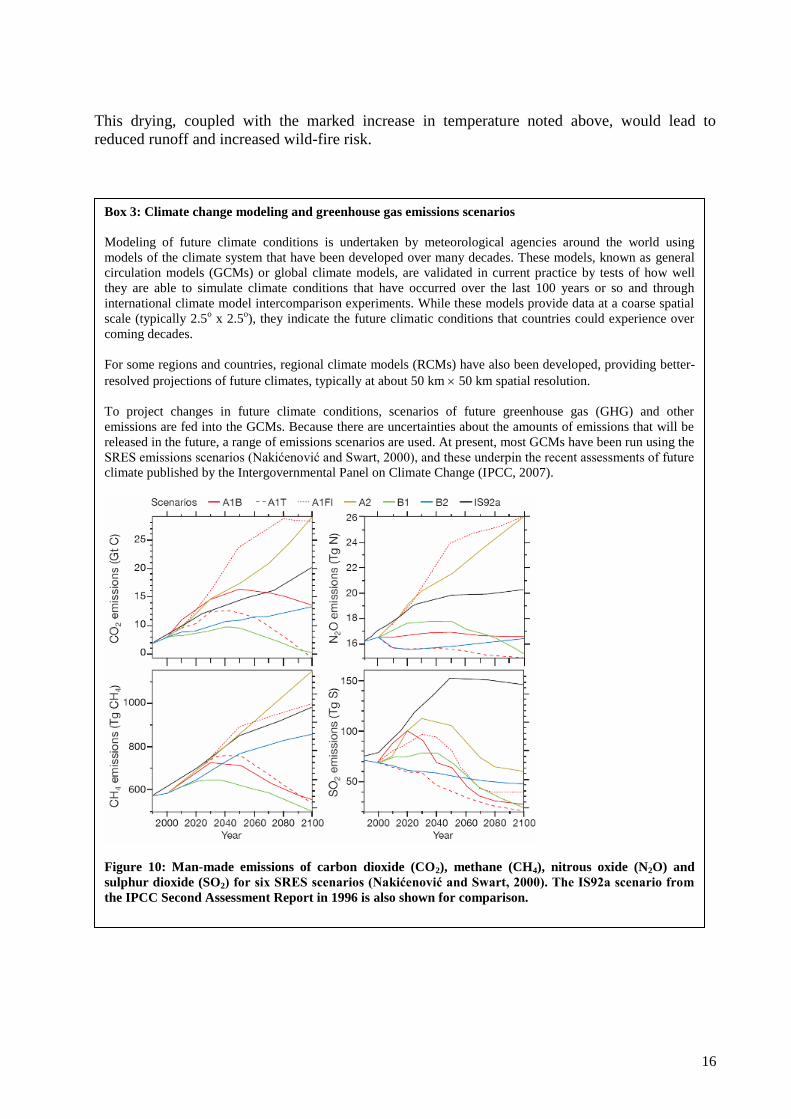
16
This drying, coupled with the marked increase in temperature noted above, would lead to
reduced runoff and increased wild-fire risk.
Box 3: Climate change modeling and greenhouse gas emissions scenarios
Modeling of future climate conditions is undertaken by meteorological agencies around the world using
models of the climate system that have been developed over many decades. These models, known as general
circulation models (GCMs) or global climate models, are validated in current practice by tests of how well
they are able to simulate climate conditions that have occurred over the last 100 years or so and through
international climate model intercomparison experiments. While these models provide data at a coarse spatial
scale (typically 2.5o x 2.5
o), they indicate the future climatic conditions that countries could experience over
coming decades.
For some regions and countries, regional climate models (RCMs) have also been developed, providing better-
resolved projections of future climates, typically at about 50 km 50 km spatial resolution.
To project changes in future climate conditions, scenarios of future greenhouse gas (GHG) and other
emissions are fed into the GCMs. Because there are uncertainties about the amounts of emissions that will be
released in the future, a range of emissions scenarios are used. At present, most GCMs have been run using the
SRES emissions scenarios (Nakićenović and Swart, 2000), and these underpin the recent assessments of future
climate published by the Intergovernmental Panel on Climate Change (IPCC, 2007).
Figure 10: Man-made emissions of carbon dioxide (CO2), methane (CH4), nitrous oxide (N2O) and
sulphur dioxide (SO2) for six SRES scenarios (Nakićenović and Swart, 2000). The IS92a scenario from
the IPCC Second Assessment Report in 1996 is also shown for comparison.
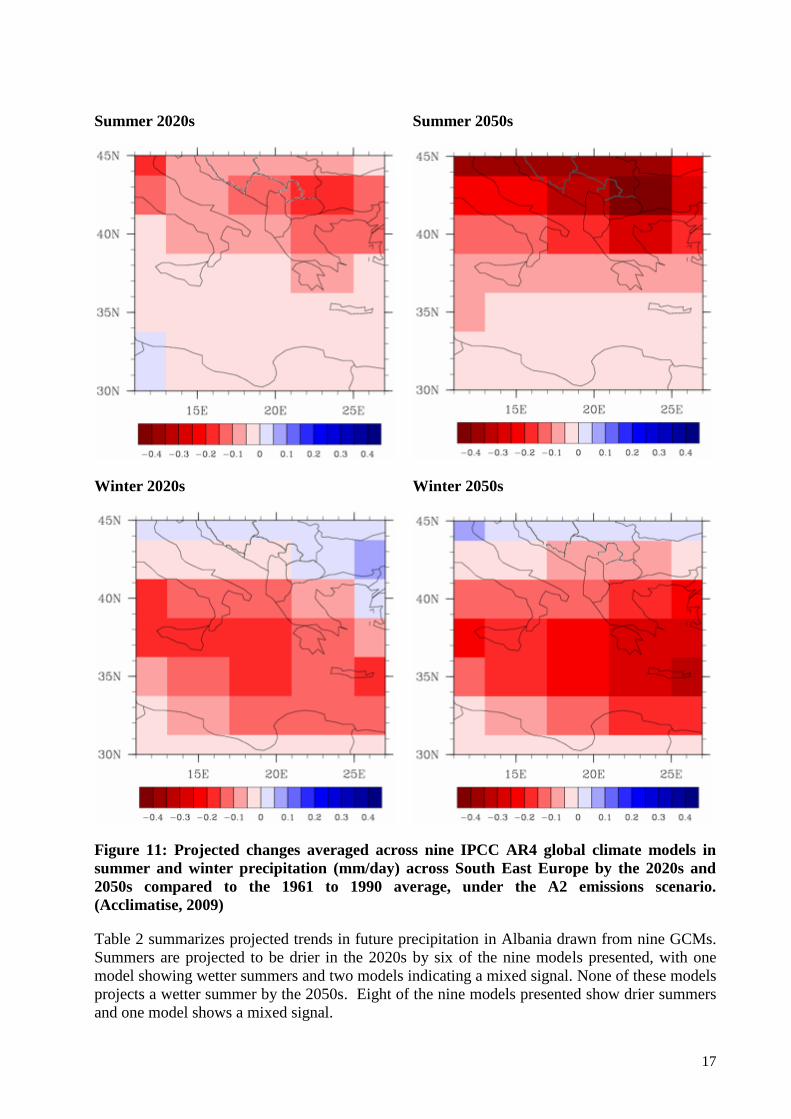
17
Summer 2020s
Summer 2050s
Winter 2020s
Winter 2050s
Figure 11: Projected changes averaged across nine IPCC AR4 global climate models in
summer and winter precipitation (mm/day) across South East Europe by the 2020s and
2050s compared to the 1961 to 1990 average, under the A2 emissions scenario.
(Acclimatise, 2009)
Table 2 summarizes projected trends in future precipitation in Albania drawn from nine GCMs.
Summers are projected to be drier in the 2020s by six of the nine models presented, with one
model showing wetter summers and two models indicating a mixed signal. None of these models
projects a wetter summer by the 2050s. Eight of the nine models presented show drier summers
and one model shows a mixed signal.

18
The nine models show less agreement concerning winter precipitation change: by the 2020s,
four of the nine models indicate drier winters, three show wetter winters and one shows a mixed
signal. A similar situation is seen in the 2050s, where five of the nine models indicate drier
winters and four show wetter winters. The risk of uncertainty is heightened by the consideration
that most of Albania‘s precipitation occurs in the winter months.
Table 2: Summary of Albanian Scenarios for Changes in Precipitation (compared to 1961
to 1990 baseline) by Number of Global Climate Models (Acclimatise, 2009)
Model trend in
future
precipitation
compared to
baseline
Number of models
2020s
summer
2020s
winter
2050s
summer
2050s
winter
Dry 6 4 8 5
Wet 1 3 0 4
Mixed 2 2 1 0
Ensemble mean Dry Dry Dry Dry
Wind Speed, Relative Humidity, Cloudiness
Projections of future changes in wind speed are viewed with low confidence as hindcasts appear
to have weak skill; as it happens the selected climate models show little change in wind speed.
Relative humidity and cloudiness are projected to decrease slightly in future over the year as a
whole, with decreases being greatest in summer, in association with decreased rainfall. Climate
change scenarios indicate a reduction in cloudiness of 6 percent to 8 percent by the 2050s in
summer and a reduction of 0 percent to 3 percent in winter.
Sea Surface Temperature and Sea Level Rise
Sea surface temperatures (SSTs) throughout the eastern Mediterranean are projected to increase
by about 1oC in the 2020s and 2
oC by the 2050s. Sea levels are also projected to rise, due to
thermal expansion of the oceans and melting of ice, leading to increased flood and erosion risks
in coastal areas.
Extreme Events
There has been concern that climate change may bring a change in the frequency of magnitude
of extreme climatic events—for instance, more-intense heavy rainfall events and a lengthening
of dry periods. According to some models, Albania is projected to be highly affected by changes
in extreme events, compared to other countries in Europe and Central Asia (ECA) (World Bank,
2009a). It is second only to Russia in terms of projected increases in extremes, as indicated in
Figure 12.
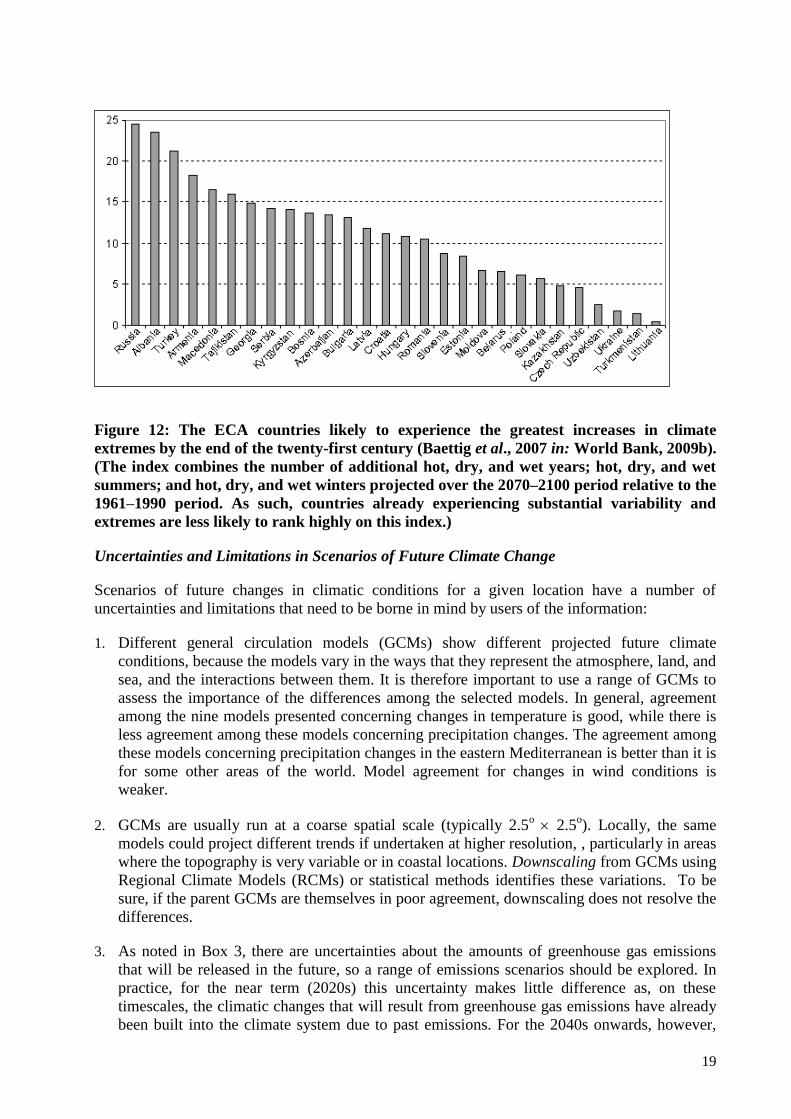
19
Figure 12: The ECA countries likely to experience the greatest increases in climate
extremes by the end of the twenty-first century (Baettig et al., 2007 in: World Bank, 2009b).
(The index combines the number of additional hot, dry, and wet years; hot, dry, and wet
summers; and hot, dry, and wet winters projected over the 2070–2100 period relative to the
1961–1990 period. As such, countries already experiencing substantial variability and
extremes are less likely to rank highly on this index.)
Uncertainties and Limitations in Scenarios of Future Climate Change
Scenarios of future changes in climatic conditions for a given location have a number of
uncertainties and limitations that need to be borne in mind by users of the information:
1. Different general circulation models (GCMs) show different projected future climate
conditions, because the models vary in the ways that they represent the atmosphere, land, and
sea, and the interactions between them. It is therefore important to use a range of GCMs to
assess the importance of the differences among the selected models. In general, agreement
among the nine models presented concerning changes in temperature is good, while there is
less agreement among these models concerning precipitation changes. The agreement among
these models concerning precipitation changes in the eastern Mediterranean is better than it is
for some other areas of the world. Model agreement for changes in wind conditions is
weaker.
2. GCMs are usually run at a coarse spatial scale (typically 2.5o 2.5
o). Locally, the same
models could project different trends if undertaken at higher resolution, , particularly in areas
where the topography is very variable or in coastal locations. Downscaling from GCMs using
Regional Climate Models (RCMs) or statistical methods identifies these variations. To be
sure, if the parent GCMs are themselves in poor agreement, downscaling does not resolve the
differences.
3. As noted in Box 3, there are uncertainties about the amounts of greenhouse gas emissions
that will be released in the future, so a range of emissions scenarios should be explored. In
practice, for the near term (2020s) this uncertainty makes little difference as, on these
timescales, the climatic changes that will result from greenhouse gas emissions have already
been built into the climate system due to past emissions. For the 2040s onwards, however,
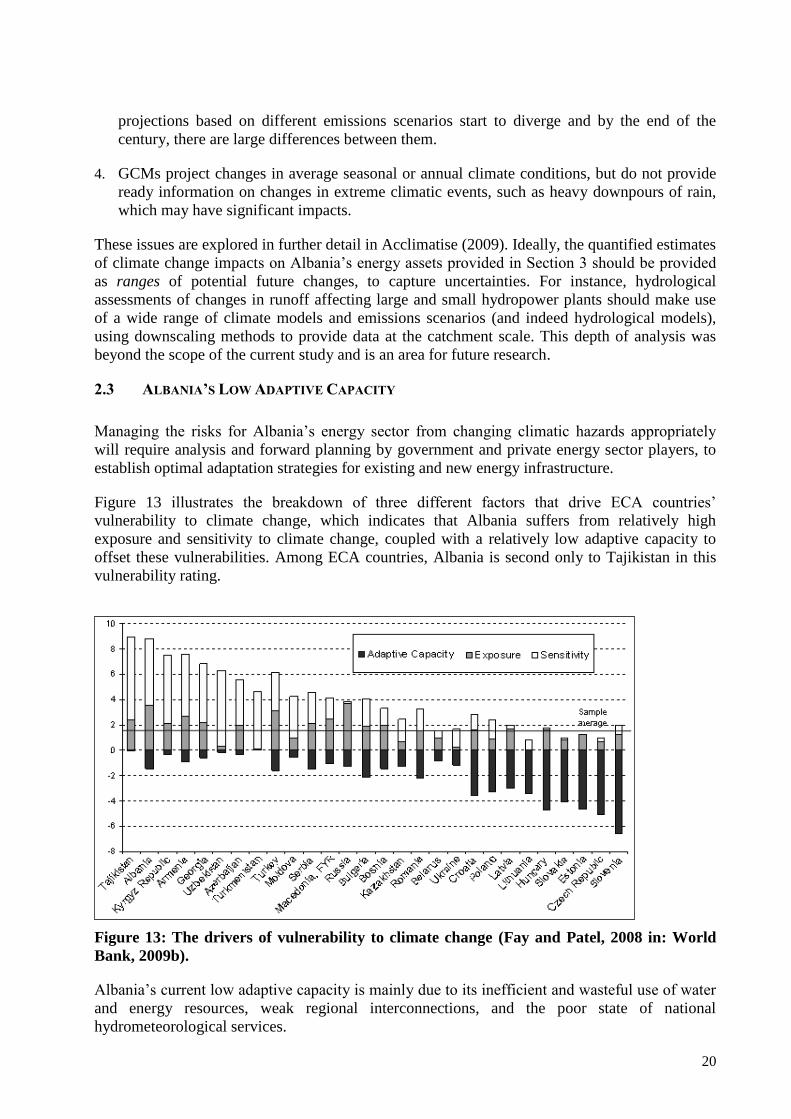
20
projections based on different emissions scenarios start to diverge and by the end of the
century, there are large differences between them.
4. GCMs project changes in average seasonal or annual climate conditions, but do not provide
ready information on changes in extreme climatic events, such as heavy downpours of rain,
which may have significant impacts.
These issues are explored in further detail in Acclimatise (2009). Ideally, the quantified estimates
of climate change impacts on Albania‘s energy assets provided in Section 3 should be provided
as ranges of potential future changes, to capture uncertainties. For instance, hydrological
assessments of changes in runoff affecting large and small hydropower plants should make use
of a wide range of climate models and emissions scenarios (and indeed hydrological models),
using downscaling methods to provide data at the catchment scale. This depth of analysis was
beyond the scope of the current study and is an area for future research.
2.3 ALBANIA’S LOW ADAPTIVE CAPACITY
Managing the risks for Albania‘s energy sector from changing climatic hazards appropriately
will require analysis and forward planning by government and private energy sector players, to
establish optimal adaptation strategies for existing and new energy infrastructure.
Figure 13 illustrates the breakdown of three different factors that drive ECA countries‘
vulnerability to climate change, which indicates that Albania suffers from relatively high
exposure and sensitivity to climate change, coupled with a relatively low adaptive capacity to
offset these vulnerabilities. Among ECA countries, Albania is second only to Tajikistan in this
vulnerability rating.
Figure 13: The drivers of vulnerability to climate change (Fay and Patel, 2008 in: World
Bank, 2009b).
Albania‘s current low adaptive capacity is mainly due to its inefficient and wasteful use of water
and energy resources, weak regional interconnections, and the poor state of national
hydrometeorological services.
21
Inefficient Use of Water Resources
The management of water resources is a key issue for Albania, given its dependency on
hydropower and the use of water for irrigating agriculture. Responsibilities for water resource
management are fragmented; many water bodies are involved in its use and oversight3. Lack of a
comprehensive inventory of water resources and a weak institutional framework for their
management, compounded by climate change, means that the country risks increasing water
crises in the future (World Bank, 2003). It is estimated that some 10 percent to 20 percent of
Albanian water resources are lost in the irrigation system (Fantozzi, 2009). As outlined in
Section 2.1, efforts are underway to change this, and the efficiency of water use in energy
generation has improved recently. Furthermore, some areas of agricultural land in Albania have
been equipped with efficient irrigation systems in the last couple of years.
Weak Regional Interconnections, Technical and Commercial Losses and Inefficient Use of
Energy
As just highlighted, although the power transmission grid has been recently upgraded, the
interconnections between Albania and its neighboring countries are currently weak and constrain
energy import and export. Technical losses in the power transmission network in 2008 were
213GWh (3.3 percent) (ERE, 2008). In 2008, technical and commercial losses from the
distribution system amounted to 33 percent, though there are strong targets to reduce this as part
of the privatization of the distribution system (CEZ Regulatory Statement, 2008). Demand-side
energy efficiency is also currently low, and the draft National Energy Strategy includes
objectives and measures to tackle this issue (Government of Albania, 2007). Increased demand
and insufficient quantity of electrical power produced in the country make it likely that imports
will be essential in the near future to ensure a steady supply of power (Government of Albania,
2007).
Deficiencies in Hydrometeorological Services
The energy sector is one of the economic sectors most affected by weather, and most dependent
on weather and climate information (Ebinger et al., 2009). The currently depreciated and poor
state of the national weather and hydrological monitoring network places a significant constraint
on Albania‘s ability to monitor and forecast in support of secure energy (Hancock and Ebinger,
2009).
Coupled with low funding and the poor state of National Meteorological Services (NMS) and
National Hydrometeorological Services (NMHS) is the high weather dependence of the Albanian
economy—about 65 percent of Albania‘s GDP is estimated to be weather dependent, the highest
among eight ECA countries assessed (IBRD & HMI, 2006; Tsirkunov et al., 2007; Hancock,
Tsirkunov and Smetanina, 2008 in: Ebinger et al., 2009).
Financial constraints are at the heart of the issue behind the poor state of the Albanian national
meteorological services (NMS) and national hydrometeorological services (NHMS) (HMI &
IBRD, 2006; Hancock and Ebinger, 2009; Ebinger et al., 2009). A comparison of Albania with
seven other ECA countries reveals that it has the lowest investment in annual NMS and NHMS
3 Water management is the responsibility of the National Water Council established under Law 8093 on
Water Reserves (March 21, 1996, as amended). Responsibilities are also allocated to River Basin Councils
under a decision of the Council of Ministers Nr 2 “Establishment of River Basin Councils” (June 21, 2006, as amended). Further responsibilities and tasks are allocated to Organizations of Water Users under Law
8518 on “Irrigation and Drainage” (July 30, 1999, as amended).
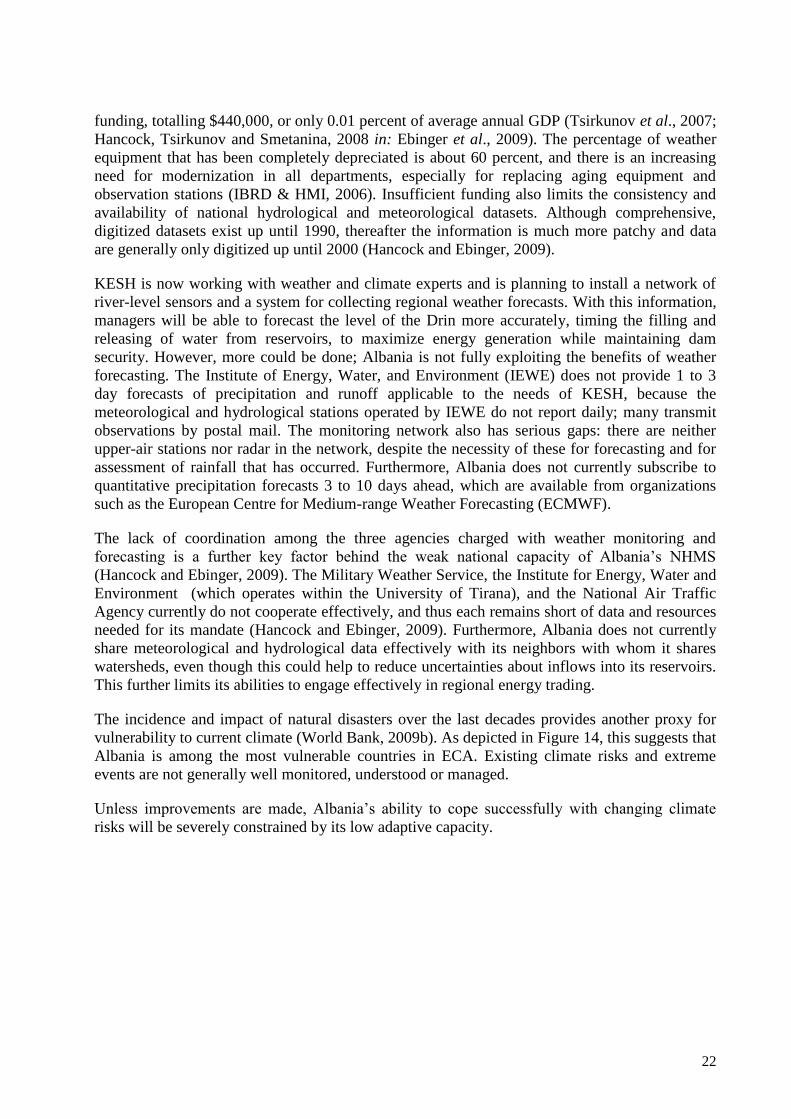
22
funding, totalling $440,000, or only 0.01 percent of average annual GDP (Tsirkunov et al., 2007;
Hancock, Tsirkunov and Smetanina, 2008 in: Ebinger et al., 2009). The percentage of weather
equipment that has been completely depreciated is about 60 percent, and there is an increasing
need for modernization in all departments, especially for replacing aging equipment and
observation stations (IBRD & HMI, 2006). Insufficient funding also limits the consistency and
availability of national hydrological and meteorological datasets. Although comprehensive,
digitized datasets exist up until 1990, thereafter the information is much more patchy and data
are generally only digitized up until 2000 (Hancock and Ebinger, 2009).
KESH is now working with weather and climate experts and is planning to install a network of
river-level sensors and a system for collecting regional weather forecasts. With this information,
managers will be able to forecast the level of the Drin more accurately, timing the filling and
releasing of water from reservoirs, to maximize energy generation while maintaining dam
security. However, more could be done; Albania is not fully exploiting the benefits of weather
forecasting. The Institute of Energy, Water, and Environment (IEWE) does not provide 1 to 3
day forecasts of precipitation and runoff applicable to the needs of KESH, because the
meteorological and hydrological stations operated by IEWE do not report daily; many transmit
observations by postal mail. The monitoring network also has serious gaps: there are neither
upper-air stations nor radar in the network, despite the necessity of these for forecasting and for
assessment of rainfall that has occurred. Furthermore, Albania does not currently subscribe to
quantitative precipitation forecasts 3 to 10 days ahead, which are available from organizations
such as the European Centre for Medium-range Weather Forecasting (ECMWF).
The lack of coordination among the three agencies charged with weather monitoring and
forecasting is a further key factor behind the weak national capacity of Albania‘s NHMS
(Hancock and Ebinger, 2009). The Military Weather Service, the Institute for Energy, Water and
Environment (which operates within the University of Tirana), and the National Air Traffic
Agency currently do not cooperate effectively, and thus each remains short of data and resources
needed for its mandate (Hancock and Ebinger, 2009). Furthermore, Albania does not currently
share meteorological and hydrological data effectively with its neighbors with whom it shares
watersheds, even though this could help to reduce uncertainties about inflows into its reservoirs.
This further limits its abilities to engage effectively in regional energy trading.
The incidence and impact of natural disasters over the last decades provides another proxy for
vulnerability to current climate (World Bank, 2009b). As depicted in Figure 14, this suggests that
Albania is among the most vulnerable countries in ECA. Existing climate risks and extreme
events are not generally well monitored, understood or managed.
Unless improvements are made, Albania‘s ability to cope successfully with changing climate
risks will be severely constrained by its low adaptive capacity.
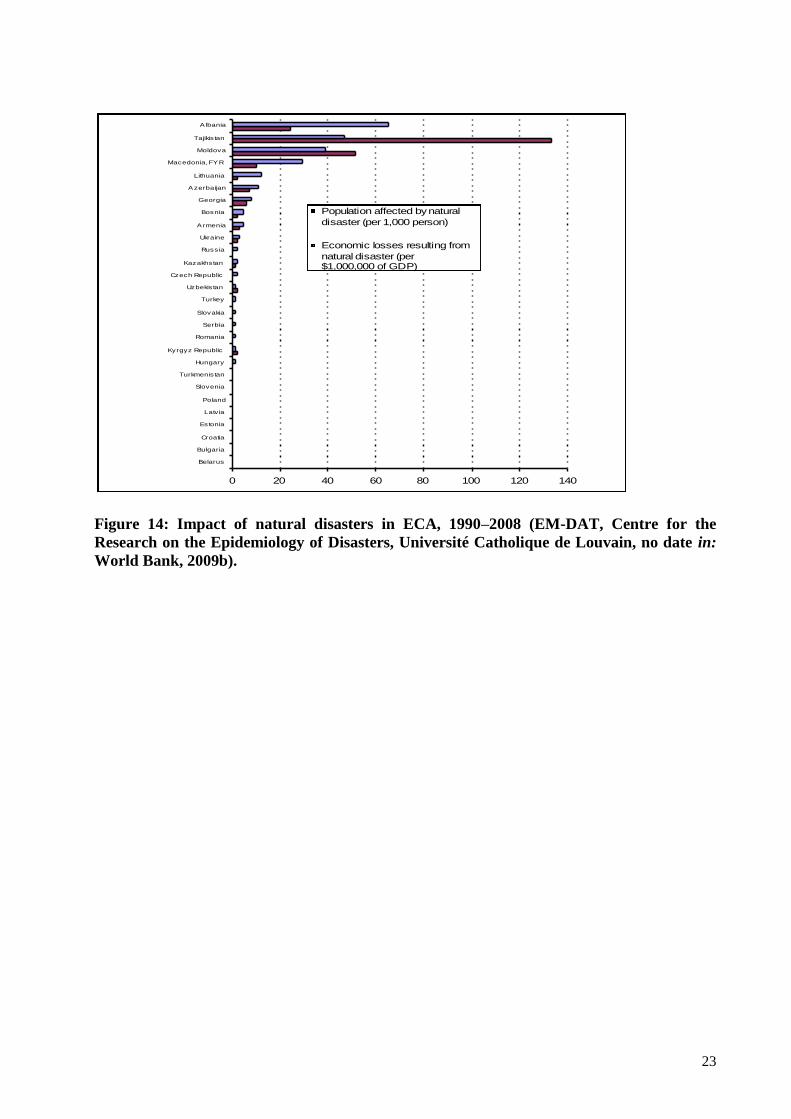
23
0 20 40 60 80 100 120 140
Belarus
Bulgaria
Croatia
Estonia
Latvia
Poland
Slovenia
Turkmenistan
Hungary
Kyrgyz Republic
Romania
Serbia
Slovakia
Turkey
Uzbekistan
Czech Republic
Kazakhstan
Russia
Ukraine
Armenia
Bosnia
Georgia
Azerbaijan
Lithuania
Macedonia, FYR
Moldova
Tajikis tan
A lbania
Population affected by natural
disaster (per 1,000 person)
Economic losses resulting from
natural disaster (per$1,000,000 of GDP)
Figure 14: Impact of natural disasters in ECA, 1990–2008 (EM-DAT, Centre for the
Research on the Epidemiology of Disasters, Université Catholique de Louvain, no date in:
World Bank, 2009b).
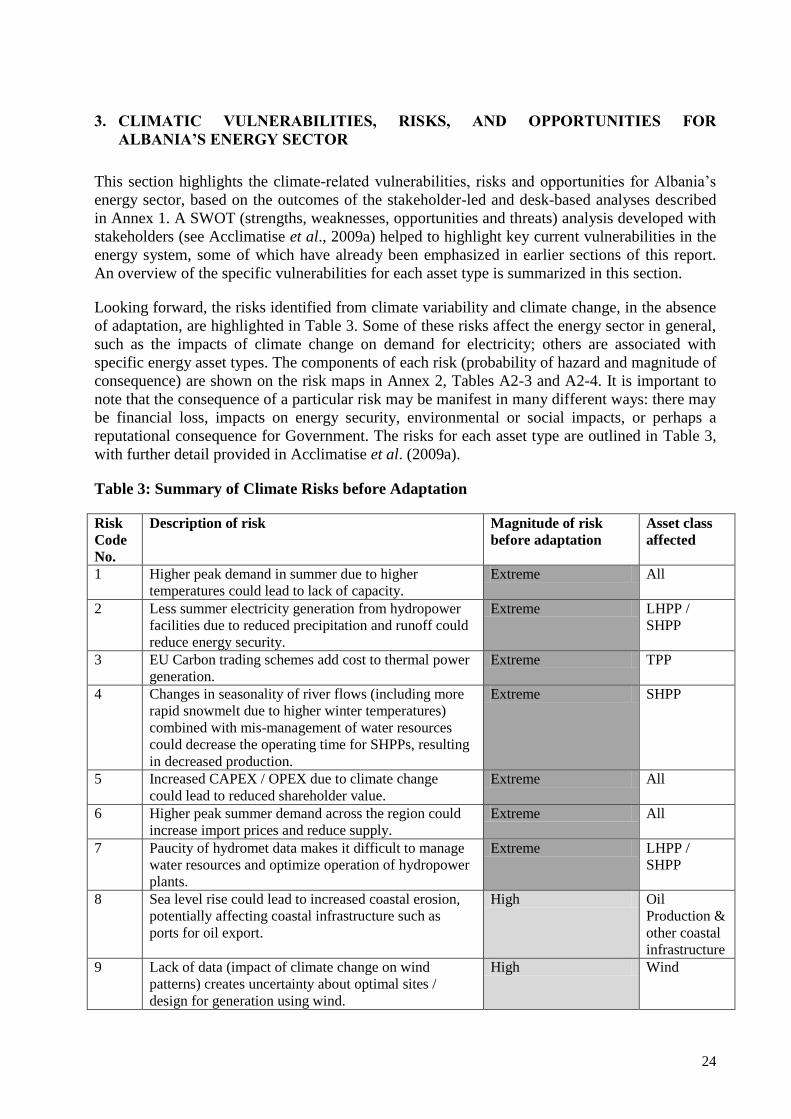
24
3. CLIMATIC VULNERABILITIES, RISKS, AND OPPORTUNITIES FOR
ALBANIA’S ENERGY SECTOR
This section highlights the climate-related vulnerabilities, risks and opportunities for Albania‘s
energy sector, based on the outcomes of the stakeholder-led and desk-based analyses described
in Annex 1. A SWOT (strengths, weaknesses, opportunities and threats) analysis developed with
stakeholders (see Acclimatise et al., 2009a) helped to highlight key current vulnerabilities in the
energy system, some of which have already been emphasized in earlier sections of this report.
An overview of the specific vulnerabilities for each asset type is summarized in this section.
Looking forward, the risks identified from climate variability and climate change, in the absence
of adaptation, are highlighted in Table 3. Some of these risks affect the energy sector in general,
such as the impacts of climate change on demand for electricity; others are associated with
specific energy asset types. The components of each risk (probability of hazard and magnitude of
consequence) are shown on the risk maps in Annex 2, Tables A2-3 and A2-4. It is important to
note that the consequence of a particular risk may be manifest in many different ways: there may
be financial loss, impacts on energy security, environmental or social impacts, or perhaps a
reputational consequence for Government. The risks for each asset type are outlined in Table 3,
with further detail provided in Acclimatise et al. (2009a).
Table 3: Summary of Climate Risks before Adaptation
Risk
Code
No.
Description of risk Magnitude of risk
before adaptation
Asset class
affected
1 Higher peak demand in summer due to higher
temperatures could lead to lack of capacity.
Extreme All
2 Less summer electricity generation from hydropower
facilities due to reduced precipitation and runoff could
reduce energy security.
Extreme LHPP /
SHPP
3 EU Carbon trading schemes add cost to thermal power
generation.
Extreme TPP
4 Changes in seasonality of river flows (including more
rapid snowmelt due to higher winter temperatures)
combined with mis-management of water resources
could decrease the operating time for SHPPs, resulting
in decreased production.
Extreme SHPP
5 Increased CAPEX / OPEX due to climate change
could lead to reduced shareholder value.
Extreme All
6 Higher peak summer demand across the region could
increase import prices and reduce supply.
Extreme All
7 Paucity of hydromet data makes it difficult to manage
water resources and optimize operation of hydropower
plants.
Extreme LHPP /
SHPP
8 Sea level rise could lead to increased coastal erosion,
potentially affecting coastal infrastructure such as
ports for oil export.
High Oil
Production &
other coastal
infrastructure
9 Lack of data (impact of climate change on wind
patterns) creates uncertainty about optimal sites /
design for generation using wind.
High Wind
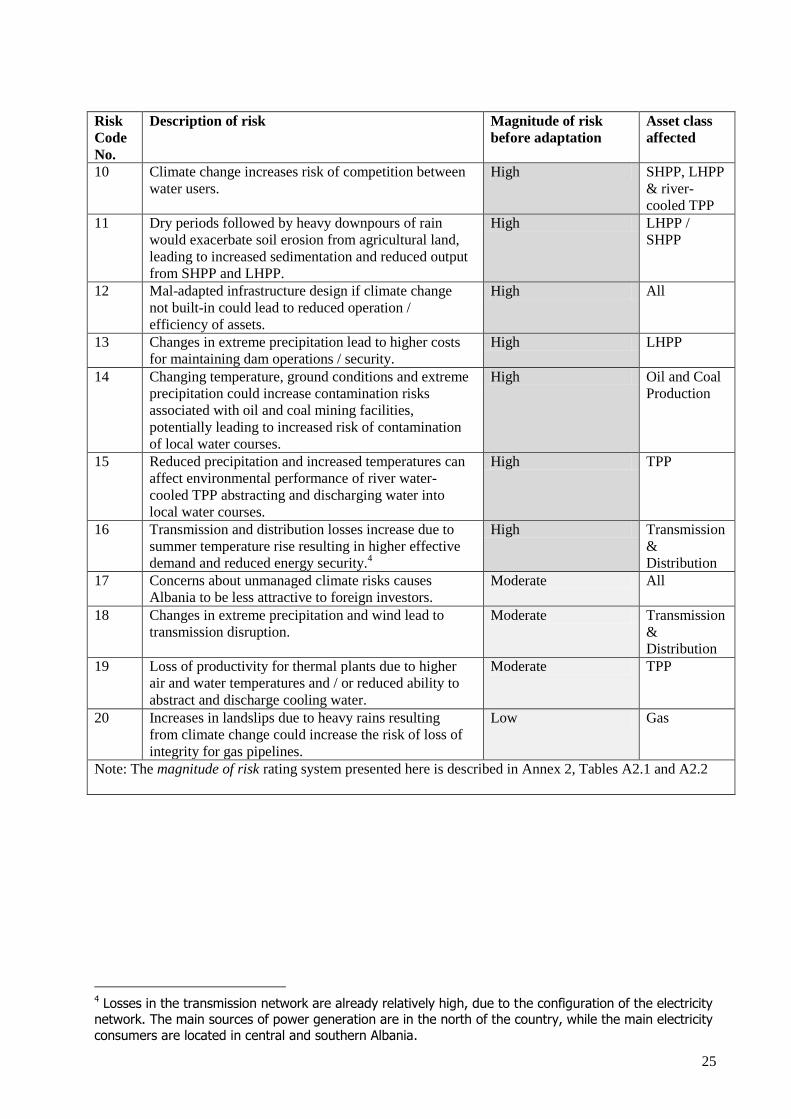
25
Risk
Code
No.
Description of risk Magnitude of risk
before adaptation
Asset class
affected
10 Climate change increases risk of competition between
water users.
High SHPP, LHPP
& river-
cooled TPP
11 Dry periods followed by heavy downpours of rain
would exacerbate soil erosion from agricultural land,
leading to increased sedimentation and reduced output
from SHPP and LHPP.
High LHPP /
SHPP
12 Mal-adapted infrastructure design if climate change
not built-in could lead to reduced operation /
efficiency of assets.
High All
13 Changes in extreme precipitation lead to higher costs
for maintaining dam operations / security.
High LHPP
14 Changing temperature, ground conditions and extreme
precipitation could increase contamination risks
associated with oil and coal mining facilities,
potentially leading to increased risk of contamination
of local water courses.
High Oil and Coal
Production
15 Reduced precipitation and increased temperatures can
affect environmental performance of river water-
cooled TPP abstracting and discharging water into
local water courses.
High TPP
16 Transmission and distribution losses increase due to
summer temperature rise resulting in higher effective
demand and reduced energy security.4
High Transmission
&
Distribution
17 Concerns about unmanaged climate risks causes
Albania to be less attractive to foreign investors.
Moderate All
18 Changes in extreme precipitation and wind lead to
transmission disruption.
Moderate Transmission
&
Distribution
19 Loss of productivity for thermal plants due to higher
air and water temperatures and / or reduced ability to
abstract and discharge cooling water.
Moderate TPP
20 Increases in landslips due to heavy rains resulting
from climate change could increase the risk of loss of
integrity for gas pipelines.
Low Gas
Note: The magnitude of risk rating system presented here is described in Annex 2, Tables A2.1 and A2.2
4 Losses in the transmission network are already relatively high, due to the configuration of the electricity network. The main sources of power generation are in the north of the country, while the main electricity
consumers are located in central and southern Albania.
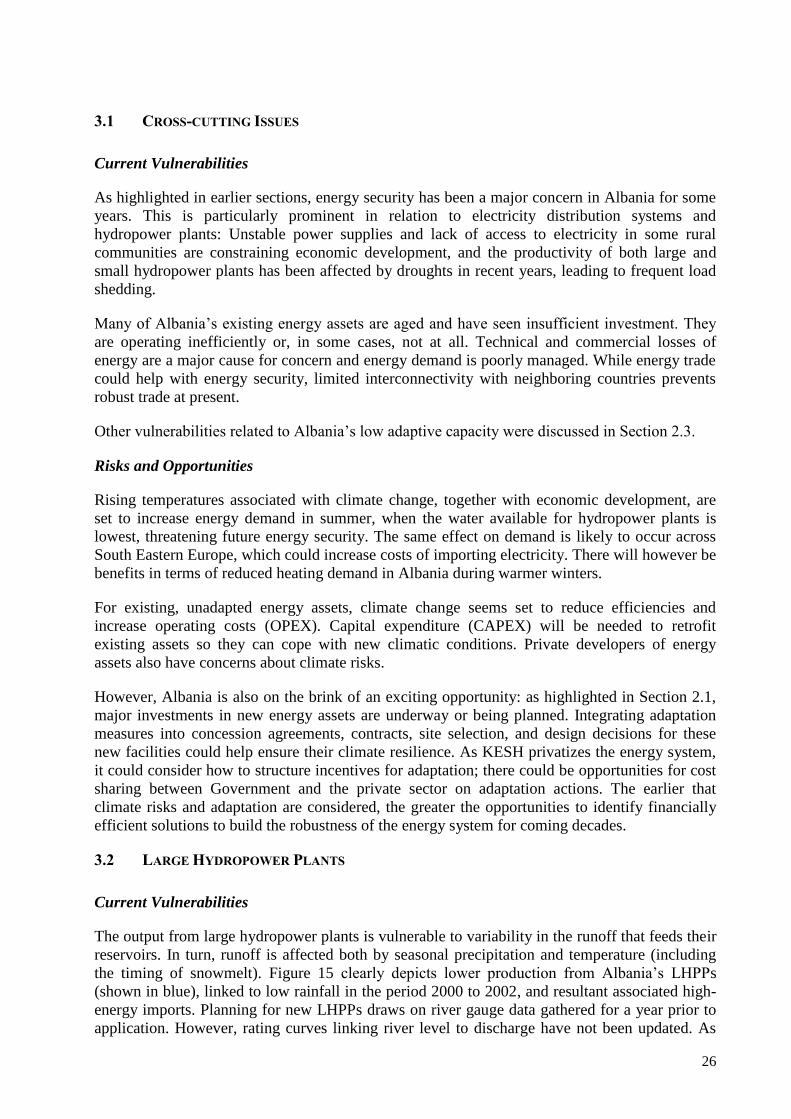
26
3.1 CROSS-CUTTING ISSUES
Current Vulnerabilities
As highlighted in earlier sections, energy security has been a major concern in Albania for some
years. This is particularly prominent in relation to electricity distribution systems and
hydropower plants: Unstable power supplies and lack of access to electricity in some rural
communities are constraining economic development, and the productivity of both large and
small hydropower plants has been affected by droughts in recent years, leading to frequent load
shedding.
Many of Albania‘s existing energy assets are aged and have seen insufficient investment. They
are operating inefficiently or, in some cases, not at all. Technical and commercial losses of
energy are a major cause for concern and energy demand is poorly managed. While energy trade
could help with energy security, limited interconnectivity with neighboring countries prevents
robust trade at present.
Other vulnerabilities related to Albania‘s low adaptive capacity were discussed in Section 2.3.
Risks and Opportunities
Rising temperatures associated with climate change, together with economic development, are
set to increase energy demand in summer, when the water available for hydropower plants is
lowest, threatening future energy security. The same effect on demand is likely to occur across
South Eastern Europe, which could increase costs of importing electricity. There will however be
benefits in terms of reduced heating demand in Albania during warmer winters.
For existing, unadapted energy assets, climate change seems set to reduce efficiencies and
increase operating costs (OPEX). Capital expenditure (CAPEX) will be needed to retrofit
existing assets so they can cope with new climatic conditions. Private developers of energy
assets also have concerns about climate risks.
However, Albania is also on the brink of an exciting opportunity: as highlighted in Section 2.1,
major investments in new energy assets are underway or being planned. Integrating adaptation
measures into concession agreements, contracts, site selection, and design decisions for these
new facilities could help ensure their climate resilience. As KESH privatizes the energy system,
it could consider how to structure incentives for adaptation; there could be opportunities for cost
sharing between Government and the private sector on adaptation actions. The earlier that
climate risks and adaptation are considered, the greater the opportunities to identify financially
efficient solutions to build the robustness of the energy system for coming decades.
3.2 LARGE HYDROPOWER PLANTS
Current Vulnerabilities
The output from large hydropower plants is vulnerable to variability in the runoff that feeds their
reservoirs. In turn, runoff is affected both by seasonal precipitation and temperature (including
the timing of snowmelt). Figure 15 clearly depicts lower production from Albania‘s LHPPs
(shown in blue), linked to low rainfall in the period 2000 to 2002, and resultant associated high-
energy imports. Planning for new LHPPs draws on river gauge data gathered for a year prior to
application. However, rating curves linking river level to discharge have not been updated. As
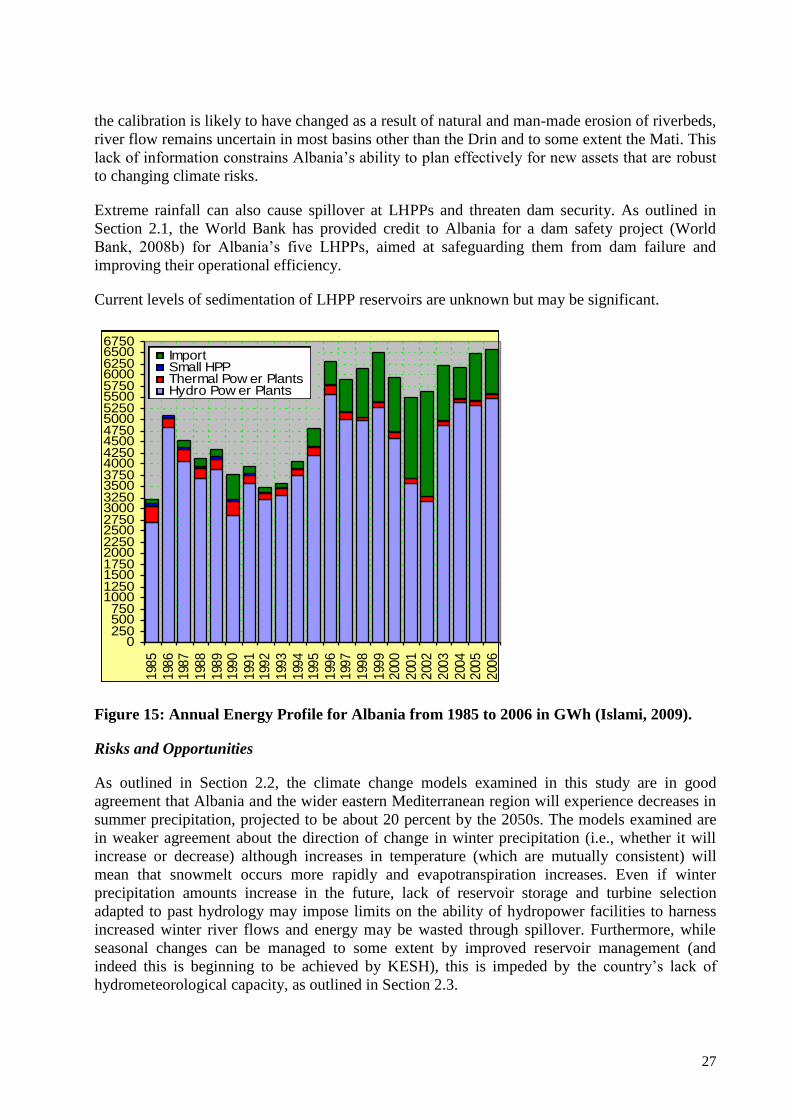
27
the calibration is likely to have changed as a result of natural and man-made erosion of riverbeds,
river flow remains uncertain in most basins other than the Drin and to some extent the Mati. This
lack of information constrains Albania‘s ability to plan effectively for new assets that are robust
to changing climate risks.
Extreme rainfall can also cause spillover at LHPPs and threaten dam security. As outlined in
Section 2.1, the World Bank has provided credit to Albania for a dam safety project (World
Bank, 2008b) for Albania‘s five LHPPs, aimed at safeguarding them from dam failure and
improving their operational efficiency.
Current levels of sedimentation of LHPP reservoirs are unknown but may be significant.
0250500750
100012501500175020002250250027503000325035003750400042504500475050005250550057506000625065006750
198
5
198
6198
7
198
8
198
9199
0
199
1199
2
199
3
199
4199
5
199
6199
7
199
8
199
9200
0
200
1200
2
200
3
200
4200
5
200
6
ImportSmall HPPThermal Pow er Plants Hydro Pow er Plants
Figure 15: Annual Energy Profile for Albania from 1985 to 2006 in GWh (Islami, 2009).
Risks and Opportunities
As outlined in Section 2.2, the climate change models examined in this study are in good
agreement that Albania and the wider eastern Mediterranean region will experience decreases in
summer precipitation, projected to be about 20 percent by the 2050s. The models examined are
in weaker agreement about the direction of change in winter precipitation (i.e., whether it will
increase or decrease) although increases in temperature (which are mutually consistent) will
mean that snowmelt occurs more rapidly and evapotranspiration increases. Even if winter
precipitation amounts increase in the future, lack of reservoir storage and turbine selection
adapted to past hydrology may impose limits on the ability of hydropower facilities to harness
increased winter river flows and energy may be wasted through spillover. Furthermore, while
seasonal changes can be managed to some extent by improved reservoir management (and
indeed this is beginning to be achieved by KESH), this is impeded by the country‘s lack of
hydrometeorological capacity, as outlined in Section 2.3.
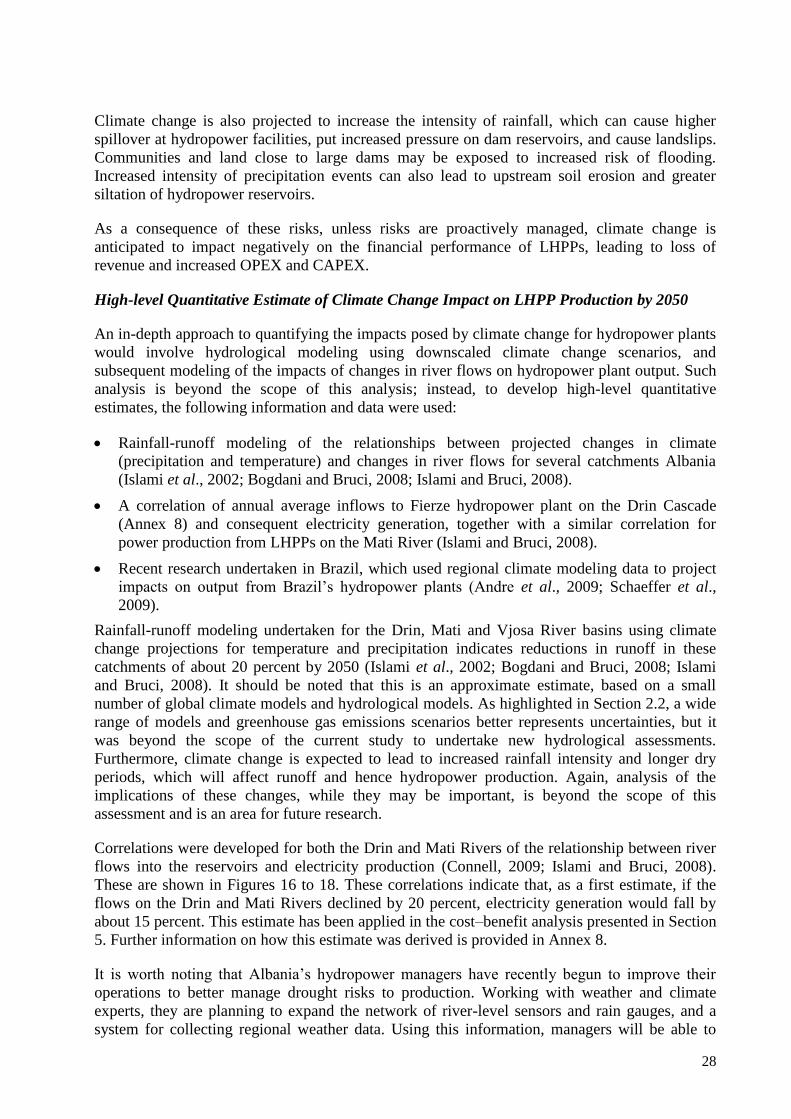
28
Climate change is also projected to increase the intensity of rainfall, which can cause higher
spillover at hydropower facilities, put increased pressure on dam reservoirs, and cause landslips.
Communities and land close to large dams may be exposed to increased risk of flooding.
Increased intensity of precipitation events can also lead to upstream soil erosion and greater
siltation of hydropower reservoirs.
As a consequence of these risks, unless risks are proactively managed, climate change is
anticipated to impact negatively on the financial performance of LHPPs, leading to loss of
revenue and increased OPEX and CAPEX.
High-level Quantitative Estimate of Climate Change Impact on LHPP Production by 2050
An in-depth approach to quantifying the impacts posed by climate change for hydropower plants
would involve hydrological modeling using downscaled climate change scenarios, and
subsequent modeling of the impacts of changes in river flows on hydropower plant output. Such
analysis is beyond the scope of this analysis; instead, to develop high-level quantitative
estimates, the following information and data were used:
Rainfall-runoff modeling of the relationships between projected changes in climate
(precipitation and temperature) and changes in river flows for several catchments Albania
(Islami et al., 2002; Bogdani and Bruci, 2008; Islami and Bruci, 2008).
A correlation of annual average inflows to Fierze hydropower plant on the Drin Cascade
(Annex 8) and consequent electricity generation, together with a similar correlation for
power production from LHPPs on the Mati River (Islami and Bruci, 2008).
Recent research undertaken in Brazil, which used regional climate modeling data to project
impacts on output from Brazil‘s hydropower plants (Andre et al., 2009; Schaeffer et al.,
2009).
Rainfall-runoff modeling undertaken for the Drin, Mati and Vjosa River basins using climate
change projections for temperature and precipitation indicates reductions in runoff in these
catchments of about 20 percent by 2050 (Islami et al., 2002; Bogdani and Bruci, 2008; Islami
and Bruci, 2008). It should be noted that this is an approximate estimate, based on a small
number of global climate models and hydrological models. As highlighted in Section 2.2, a wide
range of models and greenhouse gas emissions scenarios better represents uncertainties, but it
was beyond the scope of the current study to undertake new hydrological assessments.
Furthermore, climate change is expected to lead to increased rainfall intensity and longer dry
periods, which will affect runoff and hence hydropower production. Again, analysis of the
implications of these changes, while they may be important, is beyond the scope of this
assessment and is an area for future research.
Correlations were developed for both the Drin and Mati Rivers of the relationship between river
flows into the reservoirs and electricity production (Connell, 2009; Islami and Bruci, 2008).
These are shown in Figures 16 to 18. These correlations indicate that, as a first estimate, if the
flows on the Drin and Mati Rivers declined by 20 percent, electricity generation would fall by
about 15 percent. This estimate has been applied in the cost–benefit analysis presented in Section
5. Further information on how this estimate was derived is provided in Annex 8.
It is worth noting that Albania‘s hydropower managers have recently begun to improve their
operations to better manage drought risks to production. Working with weather and climate
experts, they are planning to expand the network of river-level sensors and rain gauges, and a
system for collecting regional weather data. Using this information, managers will be able to
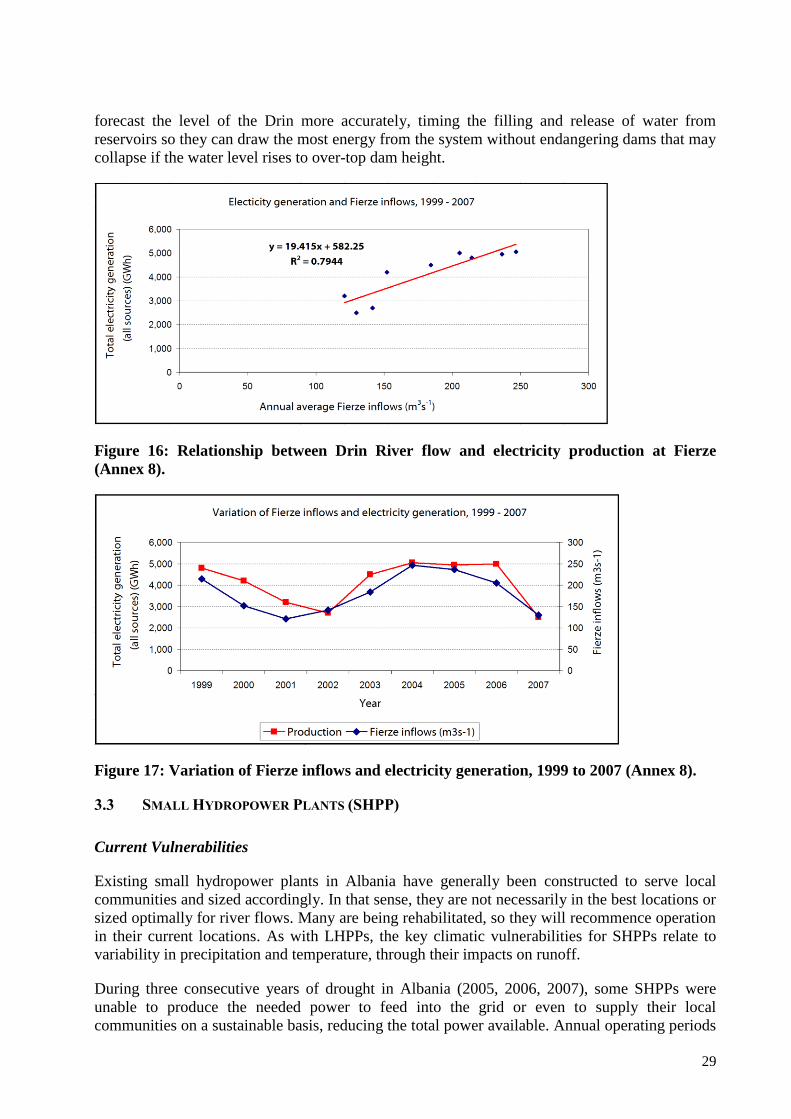
29
forecast the level of the Drin more accurately, timing the filling and release of water from
reservoirs so they can draw the most energy from the system without endangering dams that may
collapse if the water level rises to over-top dam height.
Figure 16: Relationship between Drin River flow and electricity production at Fierze
(Annex 8).
Figure 17: Variation of Fierze inflows and electricity generation, 1999 to 2007 (Annex 8).
3.3 SMALL HYDROPOWER PLANTS (SHPP)
Current Vulnerabilities
Existing small hydropower plants in Albania have generally been constructed to serve local
communities and sized accordingly. In that sense, they are not necessarily in the best locations or
sized optimally for river flows. Many are being rehabilitated, so they will recommence operation
in their current locations. As with LHPPs, the key climatic vulnerabilities for SHPPs relate to
variability in precipitation and temperature, through their impacts on runoff.
During three consecutive years of drought in Albania (2005, 2006, 2007), some SHPPs were
unable to produce the needed power to feed into the grid or even to supply their local
communities on a sustainable basis, reducing the total power available. Annual operating periods

30
of some SHPP facilities have reduced in recent years from 8 months to 4, linked to less snow
(Acclimatise et al., 2009a).
Figure 18: Relationship between Mati River flow and electricity production from Ulëza
and Shkopeti HPP (Islami and Bruci, 2008).
Risks and Opportunities
Because SHPPs do not have reservoirs, their performance is linked essentially to the intensity
and duration of precipitation. They will therefore be affected by any future decreases in annual
average and summer precipitation amounts. Snow affects SHPP production by slowly releasing
stored water as it melts, and consequently SHPPs are particularly sensitive to more-rapid
snowmelt due to higher winter temperatures.
The irrigation needs of agriculture take precedence over energy production in Albania, so SHPPs
could also be affected by farmers‘ adaptation strategies in response to climate change—namely
the need to increase irrigation (World Bank, 2009c). At present, agricultural irrigation is
undertaken for about three to four months per year in summer, often in the daytime, when energy
demand is lower, thus reducing the chance of conflicts over water use. Energy demand is
currently at a maximum in winter. However, as already noted, rising temperatures will cause
shifts to greater energy demand in summer, potentially bringing farmers and SHPP owners into
conflict over water use, unless actions are taken to manage this. The need for agricultural
irrigation in Albania cannot currently be easily forecast before or during the irrigation season,
making forward planning by SHPP owners very difficult. Furthermore, water delivery to farmers
is not organized in automated delivery schemes that follow defined basin modeling so it is not
possible to maximize its effectiveness. However, large areas of agricultural land in Albania have
been equipped with efficient irrigation systems in the last couple of years, which has had a
dramatic effect on reducing water use in these areas.
Additionally, minimum flow requirements are in place to protect river ecology, so potential
lower flows due to climate change could affect the flow available for SHPP utilization. Climate
change is also anticipated to lead to increased risks of siltation for SHPPs, when combined with
deforestation and poor watershed management, affecting asset performance.
31
High-level Quantitative Estimate of Climate Change Impact on SHPP Production by 2050
Assumption of a one-to-one relationship between changes in river flows and SHPP power output
leads to projection of a 20 percent reduction by 2050, according to the projected decrease in
runoff estimated for LHPP generation in the previous section (Annex 9). This estimate has been
applied in the cost–benefit analysis presented in Section 5. It is noted that there could be
significant indirect impacts of climate change on SHPPs, due to the adaptation actions that may
be taken in the agriculture sector. For instance, farmers‘ demands for irrigation water will
increase due to higher temperatures. Hence, the 20 percent reduction may be an underestimate.
Assessments of such indirect impacts were beyond the scope of this assessment but could
usefully be addressed in additional cross-sectoral climate change risk assessments.
Box 4 overleaf summarizes some of the interlinkages between water resources, energy security,
and food security.
3.4 THERMAL POWER PLANTS (TPPS)
Risks and Opportunities
As outlined in Section 2.1, Albania is developing thermal power plants to improve energy
security. Optimal TPP performance is slightly vulnerable to climate change impacts, mostly with
regards to operating efficiency: rising temperatures have a modest impact on gas turbine
performance, and the availability and temperature of cooling water can also affect operations.
Currently, the TPP assets under development or in discussion (at Vlore Port, Fier and Porto
Romano) are to be cooled by sea water. However, if Albania were to consider developing river-
water-cooled TPPs, then the impacts of climate change on river flows and water temperatures
could have significant effects on their operation in warmer, drier months. There could then be
insufficient river flow to meet cooling requirements, and abstractions could be prevented for
periods of time by regulations designed to protect river ecology during low flows. Thermal
power plants in the United States have been subjected to such constraints on a number of
occasions during recent droughts (Karl et al., 2009).
The Vlore TPP is located near Vlore Port. The Vlore plant has raised the elevation of the site by
2 m above sea level due to its proximity to the Vlore floodplain (Maire Engineering, 2008).
Further modifications have been made to equipment installed on site. Nevertheless, it is not
possible to estimate in this assessment how much more frequently, if at all, the site might flood
in the future due to climate impacts due to limited available information on the reason for the site
elevation decision.
In general, coastal energy assets may be significantly affected by rising sea levels and coastal
erosion and this should be an important consideration in the siting of future TPPs.
High-level Quantitative Estimate of Climate Change Impact on TPP Efficiency by 2050
The authors estimated the efficiency (output) reduction for TPP based on engineering expertise
at 1 percent by 2050, associated with the impacts of rising temperatures.
32
3.5 WIND POWER
Risks and opportunities
As outlined in Section 2.1, Albania currently has no industrial wind power generation facilities,
although it is holding discussions about developing them and seven licenses have been issued.
The wind resources of Albania are uncertain. Until recently, the wind field maps available could
draw only on data measured at 10 m height above ground (as per World Meteorological
Organization standards adhered to by Albania‘s national measuring stations), rather than the
height where the turbines would be located. Especially in Albania‘s mountainous terrain, there is
no consensus model for extrapolation from the measured field to the wind field of interest. These
considerations have made wind farm development vulnerable to climate uncertainties that can
affect design and operational parameters. Recognizing this, a Wind Energy Resources
Assessment for Albania has been conducted by the Italian Ministry for the Environment, Land
and Sea, which has resulted in a map of average wind speed for Albania that is an improvement
on past data availability. If changes in wind speed and/or direction were to occur, however,
Box 4: Climate change, water resources, energy, and food security in Europe and Central Asia (ECA)
Rising temperatures and changing hydrology are already affecting forestry and agriculture in many countries in
ECA. The region‘s natural resilience and adaptive capacity have been diminished by the Soviet legacy of
environmental mismanagement and the pursuit of economic growth carried out with blatant disregard to the
environment. This is evident in agriculture where poor management of soil erosion, water resources, pest
control, and nutrient conservation increases the sector‘s vulnerability to climate change. Inadequate capital
investment and watershed management have led to significant water losses and reduced the productivity of
irrigation systems as well as hydropower generation capacity.
Over time, the impact of global warming, other nonclimatic factors (such as inefficient use of water), legacy
issues and the continuing unsustainable demand will exacerbate water stress in Europe and Central Asia. Global
warming will negatively affect water systems in some parts, as reduced precipitation and high evaporation rates
decrease water availability for agriculture and hydropower production alike.
ECA countries are expected to help offset the projected decline in world food production due to decreasing
agriculture yields in lower latitudes due to climate change. However, there are important caveats: the projected
gap between potential and actual yields in ECA is 4.5 times higher than the potential increase in agricultural
production from climate change by 2050. Unless current inefficiencies in the agricultural sector are addressed,
food insecurity in the region will become a major development concern. The inability of Kazakhstan, Russia,
and Ukraine to close the productivity gap and respond to recent crop price increases does not bode well for their
capacity to adapt to and benefit from climate change.
Going forward, improved water resource management and better-performing water utilities and energy systems
will help reduce climate vulnerability. Gains from improved agricultural practices, including adaptation
measures such as better water resource management, could outweigh projected negative impacts. Energy
security considerations will be integral to the long-term investment decisions on water resource allocation.
Albania currently derives 90 percent of its energy from (both large and small) hydropower plants; plants that are
feeling the effect of weather variability and are likely to see further declines in runoff and energy production into
the future (estimated at 15 percent and 20 percent respectively by 2050, as outlined in this section of the report).
It is a complex picture. Agricultural demand for irrigation water is seasonal and subject to significant variability.
Timing is also critical. Today, water demand for agricultural use is low during periods of peak energy demand
(winter and night-time) and high when energy needs drop (summer and daytime). But winter demand for energy
is expected to drop with climate change and daytime summer demand to rise with increasing temperature and
cooling demand.
(World Bank, 2009d)

33
reoptimization of the design and operation of wind energy facilities would be could be needed to
ensure that installed turbines did not slip out of their optimal operating band.
High-level quantitative estimate of climate change impact on wind power by 2050
The climate change projections are very uncertain with respect to wind, and the data that are
available for Albania indicate little or no change. The cost–benefit analysis in Section 5 has
therefore assumed no change.
3.6 POWER TRANSMISSION AND DISTRIBUTION
Current vulnerabilities
As outlined in Section 2.1, the power transmission system was recently upgraded, aligning with
EU standards, and ongoing investments are focusing on improving regional interconnectivity.
Technical losses in the transmission network in 2008 were 213GWh (3.3 percent) (ERE, 2008).
The distribution grid already presents clear climatic vulnerabilities and has high technical and
commercial losses (about 33 percent in 2008). Although city networks are generally in good
condition, there are significant parts of the distribution grid that need upgrading, especially those
serving rural and mountain communities, who already do not have secure energy supplies due to
the deterioration of the grid. In periods of high winter precipitation, snow and ice can cut off
distribution lines. Repair crews have difficulties repairing damaged networks due to difficult
road conditions and local authorities may not always have the resources and expertise to repair
damage quickly. High winds can also cause damage to power lines. The capacity of communities
to cope with interruptions to supply of power (and other services) is highly dependent on the
level of economic development. For instance, small businesses may not have backup generators.
Even if the effect of intermittent power can be managed with the use of backup generators, there
is an additional capital and operating cost in use of such generators.
Risks and opportunities
Owing to the recent technical upgrades of the transmission system, its performance is not
expected to be significantly affected by projected changes in temperature and precipitation.
However, it is worth noting that, at present, EU standards do not account for climate change, and
the technical specifications may require review in the years to come. Indeed, the EU Adaptation
White Paper refers to the need to review and update EU regulations in the light of climate change
projections (European Commission, 2009).
Rising temperatures due to climate change will gradually erode the efficiency of the transmission
and distribution systems, by reducing the ability of transmission lines to lose heat to their
environment.
If climate change leads to increased winter precipitation, damaging events could occur more
frequently unless the distribution grid is upgraded, with consequent worsening social impacts.
Because projections of future changes in wind are highly uncertain, it is not possible to say with
any confidence whether damage to power lines from these events will happen more often.
However, increased intensity of precipitation could lead to greater incidence of landslips,
affecting distribution lines in hill terrain.
34
High-level Quantitative Estimate of Climate Change Impact on Transmission and Distribution
Efficiency by 2050
Using engineering expertise, the efficiency reduction for transmission and distribution has been
estimated as 1 percent by 2050, the consequence of rising temperatures.
3.7 ENERGY DEMAND
Current Vulnerabilities
Energy demand is not managed effectively at present, with old, inefficient equipment and
standards being applied in households and the services sector. Many houses have inadequate
insulation, leading to wasteful use of energy. Furthermore, electrical power is often the main
source of energy for heating. Commercial losses are significant, running at 13.4 percent in 2008
(ERE, 2008).
Risks and Opportunities
The most significant impacts of climate change on energy consumption are likely to be the
effects of higher temperatures on the use of electricity and the direct use of fossil fuels for
heating in Albania. Higher temperatures are likely to affect the following major electric end uses:
Space heating Energy demand for space heating will decline
Air conditioning Energy demand for space cooling will increase
Water heating Energy demand for water heating will decline slightly
Refrigeration Energy demand for refrigeration will increase
Of these end uses, air conditioning and space heating are those most likely to be significantly
affected by climate change in Albania, since both are functions of indoor-outdoor temperature
differences. Compounded by the anticipated reduction in availability of hydropower in summer,
this could exacerbate energy security difficulties. There are opportunities, however: climate
change is expected to shorten the cold season and reduce the severity of cold weather events,
reducing energy demand for heating.
Quantitative estimates of climate change impacts on energy demand are described in Section 5.2.
3.8 OIL, GAS, AND COAL PRODUCTION
Current Vulnerabilities
Although Albania‘s oil production facilities are not considered to be directly vulnerable to
climate risks to any great extent, the ability to import LPG or to export crude oil products
depends on shipping ports. At present, extreme weather can delay ships arriving into Vlore Port
by one to two days, although wider channels being opened at Vlore Port in summer 2009 will
reduce this problem. Furthermore, it is understood that the port has a transgressive geological
structure though current rates of erosion are not well understood (Acclimatise, 2009a).
Oil production facilities at Patoz Marinza are one of five European hotspots for contaminated
land (UNEP, 2000). Pollution carried via drainage channels into the Gjanica River, which is
35
heavily contaminated by oil operations, and contamination pathways are affected by climatic
influences on ground conditions.
The Ballsh oil refinery is vulnerable to electricity disruptions: it relies on the grid, and if a power
cut lasts more than an hour, financial losses estimated at $100,000 or above can occur
(Acclimatise et al., 2009a).
The existing low-pressure gas pipelines from Fier and Ballsh have experienced loss of integrity
in the past, due to landslips at valley crossings after storms and heavy downpours. These risks
are seen as minimal, however, when compared to the risk of sabotage.
Albania‘s coal industry is small, employing only about 200 people at present (Acclimatise et al.,
2009a). Coal is stored outdoors, sometimes on slopes, and is therefore vulnerable to heavy
rainfall, which can lead to loss of product and also ground and water contamination.
Risks and Opportunities
Higher temperatures are not anticipated to affect oil production facilities significantly. Indeed,
there may be a slight positive effect of warming temperatures on their cost profile.
However, unless steps are taken to adapt new and existing port developments, port operators
could face increased risk of flooding and storm damage, with consequent service disruption for
oil producers and increased operating costs. Furthermore, it is not clear whether the new design
for Vlore Port takes into account projections of rising sea levels, but, given the fact that the
coastline is eroding, increased risk of coastal erosion is a potential cause for concern.
The existing problems with contaminated land and watercourses at Patos Marinza could be
exacerbated if, as projected, climate change brings increased summer droughts. The consequent
changes in ground conditions could create new pathways for pollutants, which would then flush
through into water courses during heavy downpours, worsening an already difficult situation.
The low-pressure gas pipelines from Fier and Ballsh could see increased risk of landslips,
associated with projected increased incidence of heavy downpours as a result of climate change.
The main climate change impacts on Albania‘s limited coal facilities are also likely to result
from heavy downpours of rain, which could lead to increased loss of product and increased risks
of ground and water contamination.
As outlined in Section 1, the focus of this assessment is on how Albania can best manage its
future security of energy supply in the face of climate change. Given that oil, gas, and coal
production assets are not key factors in Albania’s energy security, impacts on these assets
were not taken forward as part of the cost–benefit analysis. However, it is clear from the
analysis outlined in this section that oil, gas, and coal production are vulnerable to
changing climate risks, and the issues identified here merit further consideration by the
decision makers responsible for these activities.
36
4. IDENTIFICATION OF ADAPTATION OPTIONS FOR MANAGING RISKS TO
ALBANIA’S ENERGY SECTOR
The key cross-cutting climate risks and opportunities related to energy security identified in the
previous section are that, over time:
Annual energy demand may decline slightly (an estimated reduction approximately 0.1
percent per year, see Section 5.2).
Winter energy demand will reduce and summer peak demand will increase.
Energy supply from existing assets will decline, particularly in summer, leading to a shortage
in supply that would have to be filled to ensure energy security.
Adapting to climate change, to reduce vulnerabilities and risks and take advantage of
opportunities, will be increasingly important for the Albanian energy sector. Stakeholders
provided input on adaptation options applicable to the Albanian energy sector through a
workshop and series of meetings (Acclimatise et al., 2009b).
Detailed descriptions of the potential adaptation options, including cross-cutting actions and
individual actions for each energy asset class, are summarized in Annex 3, Tables A3.1 to A3.8.5
The adaptation option tables highlight which options are no-regret, low-regret, win-win, and
flexible (see Box 5 for definitions of these terms). These kinds of options are particularly useful
in devising decision strategies in the face of uncertainties about the future.
In essence, the adaptation options fall into three main groups:
1. Informational actions including: gathering and sharing additional meteorological and
hydrometeorological data; analysis and modeling of catchments that may be suitable for
hydroelectric power generation; working with neighboring countries to understand regional
risks from climate change and their implications for regional energy trading; further research
on climate change impacts through downscaling of global climate model data; and
researching the impacts of changing seasonal conditions and extreme climate events. Many
of these options are considered to be no-regret options. As such, it is considered that
undertaking these options would prove beneficial for a wide range of reasons, whatever the
extent of future climate change. Stakeholders in Albania should consider the no-regret
options as a priority. No further analysis has been conducted for these options, though further
details on one vital no-regret option, namely improved monitoring and forecasting of weather
and climate, are provided in Box 6, Annex 4 and Hancock and Ebinger (2009).
2. Institutional actions including: reviewing, upgrading, and enforcing design codes to require
new assets to take account of climate change; and reviewing the government prioritisation
policy for resources such as water in the face of climate change. It is anticipated that many of
these adaptation options would be subject to regulatory impact assessment prior to being
introduced. Therefore, no further assessment of these options has been carried out in this
report. However, further details are provided in Box 7, on weather coverage and insurance
instruments that could help mitigate the anticipated losses associated with climate variability
and extreme events.
5 Note that the adaptation options numbers listed in the Risk Register below (Table 5) correspond to the
adaptation option numbers in Tables A3-1 to A3-8.
37
3. Physical/technical actions: A number of potential engineering adaptation options have been
identified, including: amendments to the way existing LHPPs are operated; upgrades of
existing assets to optimize performance and minimize decline in power generation due to
climate change; and construction of new and diversified power generation assets.
The Risk Register presented in Table 5 summarizes the main climate-related risks before and
after adaptation, demonstrating how effective the adaptation actions could be in reducing risks. It
also summarizes the adaptation actions that could help to manage each risk. In developing the
risk-severity ratings after adaptation, it has been assumed that the adaptation actions would be
fully implemented. However, we add a note of caution: as mentioned in Section 2.3, Albania has
low adaptive capacity, which means that implementing these actions would require considerable
effort, coordination and, in some cases, funding.
Some 20 risks are identified in Table 5. The risks falling into each risk severity category before
and after full implementation of adaptation measures are outlined in Table 4. (For further details
on the risk categories, refer to Annex 2, Tables A2.1 and A2.2.)
As can be seen in Annex 2 (Tables A2.3 and A2.4), for a given risk, the adaptation options
considered could lead to a decrease in the likelihood of occurrence of a hazard and/or a decrease
in the magnitude of its consequence.
Box 5: Categorization of adaptation options for robust decision making under conditions of
high uncertainty, with some examples
No regret: Measures that deliver benefits that exceed their costs, whatever the extent of climate
change, e.g.:
Investment in energy demand management
Preparing for questions about adaptation from government, investors, analysts, lenders,
lawyers
Funding baseline climate monitoring and regional climate models
More holistic approaches to water cycle management in water-constrained locations
Low regret: Low cost measures with, potentially large benefits under climate change, e.g.:
Allowing for heavier rainfall when designing new drainage system—make drainage
pipes wider; use Sustainable Drainage Systems which allow rainfall to percolate into the
ground, reducing runoff
Win-win: Measures that contribute to climate adaptation and also deliver other benefits, e.g.:
Creation of salt-marsh habitat provides flood protection for coastal areas and also
contributes to nature conservation objectives
Flexible approaches/’Adaptive management: Keeping open / increasing options that will allow
additional climate adaptation in future, when the need for adaptation and performance of different
adaptation measures is less uncertain, e.g.:
Flood management: Allow for future increases in defence height by making foundations
wider and deeper, but do not build higher defence immediately
Avoid maladaptive actions: Some actions will make it more difficult to cope with climate change
risks, e.g.:
Inappropriate development in a flood risk area

38
Table 4: Number of Risks in Each Risk Severity Category, Before and After Adaptation
Number of Risks in Category
Risk Severity Category Before Adaptation With Full Implementation of
Adaptation Measures
Extreme 7 0
High 9 6
Moderate 3 5
Low 1 9
For most of the ―extreme‖ risks, the key adaptation options include: diversification of energy
into other forms of generation than hydroelectric power, working with neighboring countries to
understand regional risks and implications for regional energy trading, and improved data
collection and modeling to enable hydropower plant design and operation to be optimized.
Diversification of assets was also seen by most stakeholders engaged during this assessment as a
critical step for the Albanian energy sector. With this in mind, the high-level cost–benefit
analysis element of this assessment, presented in Section 5, has focused on looking at a diverse
range of asset classes that may be utilized to adapt to climate risks to supply and demand. The
economic cost–benefit analysis presented here is thus an example of a process that Albania could
use as it evaluates adaptation options. A more in-depth analysis, appropriate for the magnitude
and costs of the challenges presented by climate change, would consider a larger variety of
options and explore the costs and benefits in greater detail.
39
Box 6: A vital ‘no-regrets’ option for Albania—improved monitoring and forecasting of weather and
climate
As outlined in previous sections, hydropower provides about 90 percent of domestic electricity in Albania.
This buffers national economic development from fossil fuel price shocks and will help Europe as a whole to
meet its targets for reduction of greenhouse gas emissions. However, Albania‘s dependence on renewable
energy sources makes it vulnerable to the weather, especially because the rainfall on which Albania‘s
hydropower depends is among the most variable in Europe. Albania‘s vulnerability has been highlighted in
recent drought years (e.g., 2002 and 2007).
Improved weather monitoring and forecasting could bolster Albania‘s energy security, enabling planning for
water shortages, guiding the optimal tradeoffs among various water users in times of shortage, and supporting
management of reservoirs to extract the largest amount of energy per unit of flow. However, Albania‘s
national weather-monitoring network was damaged in the civil struggles of the 1990s and has been only partly
rehabilitated. Many stations and hydroposts are heavily depreciated, and telecoms do not support the data
reporting frequency that efficient management of hydropower requires. As a result, the network that records
rainfall, temperatures, and river levels is sparse and reports very little information in real time. Rainfall and
runoff could be qualitatively forecast to three days if modest resources were invested in obtaining and tuning
models; but in part because computing capacity is extremely weak, Albania uses the model output of
neighboring countries, which is not verified in detail nor continuously re-tuned to Albania‘s conditions.
Longer lead-time forecasts to seven days could be obtained from the European Centre for Medium-range
Weather Forecasting to support national forecasts and planning; although these are low-resolution they would
provide valuable guidance on regional water availability. Currently, Albania is not a full subscriber and has
only limited access. Seasonal forecasting via statistical models is having increasing success in some regions of
the world, but good success in Albania would need to draw on digitized historical data, which is not available
because much of Albania‘s historical data is not in digital form. Watershed models and maps of national
climate could be updated to support planning for the future, but today they provide only weak guidance
because they are out of date.
Wind farms, also of potential interest to Albania, are also weather-dependent. Their optimal design depends on
knowledge of the distribution of wind speeds; currently, a verified map of the wind resource for Albania does
not exist. Management of the transmission and distribution system can also be made more robust. Power is
generated in the Drin cascades of northern Albania while most consumers are concentrated in the south, so the
country‘s transmission and distribution system necessarily involves long transmission lines, exposed to severe
weather. Repairs of inevitable occasional damage would be more rapid if Albania were able to monitor severe
weather, pinpointing lightning strikes, heavy winds, and the other sources of damage. Finally, better weather
forecasting would enable Albania to make the most of its natural resources by improving the accuracy of
demand forecasts that build on knowledge of upcoming temperature and cloudiness to assess demand for
electricity.
As outlined in Section 2.2, climate projections from a range of climate models are in good agreement about
the extent of future increases in temperature for the South Eastern Europe region and they are also in general
agreement that future summer precipitation would decrease. They are valuable as a source of qualitative
information about the patterns of regional climate trends but further downscaling would provide more
localised data for energy asset management. It would be helpful to determine whether several more-robust
projections of changes in Albania‘s precipitation could be identified through a review of correlation of
modeled baseline climates against observed historical precipitation patterns, and to focus on downscaling an
ensemble of these.
All these functions are very weak in Albania today: monitoring, modeling, and forecasting. Albania‘s former
strengths in this area could be revived and expanded to bolster its energy security, which is so strongly linked
to its variable climate. As the climate changes, Albania is likely to see changes in the availability of renewable
energy sources. Increased skill in monitoring and forecasting the weather that measures out these resources
would enable Albania to adapt flexibly and rapidly to trends on all time scales.
(Further insights on this topic are provided in Annex 4 and Hancock and Ebinger (2009).
40
Box 7: Weather risk management through weather coverage and insurance instruments
Albania‘s economy is weather sensitive and vulnerable to man-made and natural disasters; some avoidable. In
the past 33 years, 62 percent of disasters were hydrometeorological in origin and in the past decade alone there
have been 2 significant periods of drought, 45 major landslips, and 3,767 forest fires. Projected changes in
climate—rising temperatures and reduced precipitation—could compound already adverse impacts on fiscal
stability and macroeconomic performance, businesses, and households.
Albania is taking steps to address its vulnerability through a US$9.16 million (equivalent) Disaster Risk
Management and Adaptation Project approved by the World Bank‘s Board in May 2008 (effective June 2009).
This project supports:
Capacity building for emergency response and strengthening of disaster risk mitigation planning
Provision of accurate, tailored hydrometeorological forecasts and services to weather sensitive sectors
(agriculture, energy, water resource management etc.)
Development of building codes that address seismic risk
Development of private catastrophe risk insurance for households, small and medium enterprises
Lending and technical assistance programs could be complemented by weather coverage and insurance
instruments that could help mitigate the anticipated losses associated with climate variability and extreme
events. Weather coverage is an emerging market instrument that pays on the basis of a measurable weather event
and does not require individualized loss assessment (as in the case of more traditional insurance). Customized
weather coverage is being used by hydroelectric utilities in Australia, the United States, India, and Canada to do
the following (WeatherBill 2009):
Stabilize revenues and protect against income loss due to precipitation or temperature fluctuations affecting
power generation.
Control costs associated with power purchases to address supply shortages arising from weather related
events (e.g., below average precipitation).
Manage cash reserves, for example to ensure that reserve funds are not required to cover operating costs
when budgets are stressed due to successive drought years.
Such instruments can be accessed on the insurance market. The World Bank Group (WBG) also offers a range
of services to mitigate the impacts of disasters and weather events:
Catastrophe Risk Deferred Draw-down Option (CAT DDO), a deferred development policy loan
offering IBRD eligible countries immediate liquidity up to US$500 million or 0.25% of GDP (whichever is
less) if they suffer a natural disaster.
Sovereign Budget Insurance, advisory services to help countries access the international catastrophe
reinsurance markets on competitive terms; currently used by 16 Caribbean countries as parametric insurance
against major hurricanes and earthquakes.
Insurance Linked Securities, a multi-country catastrophe bond to poll the risks of several countries and
transfer the diversified risk to capital markets is under development. WBG has experience in working with
Mexico to transfer earthquake risk to investors through such mechanisms (2006).
Catastrophe Property Insurance, to create competitive insurance markets and increase catastrophe
insurance penetration.
Indexed Based Weather Derivatives. In Malawi the World Bank provided intermediation services on an
index-based weather derivative. If precipitation falls below a certain level, a rainfall index reflects the
projected loss in maize production, and payout is made when production falls significantly below historic
averages.
(World Bank, 2008a; World Bank; 2009b; WeatherBill Inc, March 27, 2009.)

41
Table 5: Risk Register (For details on the rating system presented here (labeled 1 to 5 and A to E), see Annex 2, Tables A2.1 and A2.2)
Ran
k
Risk
Description,
Event and
Consequence
Risk Severity Before Adaptation
Adaptation Actions
Risk Severity After Adaptation
Consequence
Likelihood
Risk Level
Before
Adaptation
Consequence
Likelihood
Risk Level
After
Adaptation
1
Higher peak
demand in
summer due to
higher
temperatures
could lead to
lack of
capacity.
5 Catastrophic A Almost
Certain Extreme
Develop shared understanding of
region-wide climate risks to
energy security; increase energy
trade; supply diversification;
supply and demand side
management / efficiency; optimize
current generation; make new
energy assets climate resilient
(Adaptation Options: 1, 7, 10 to
15).
2 Minor D Unlikely Low
2
Less summer
electricity
generation
from
hydropower
facilities due
to reduced
precipitation
and runoff
could reduce
energy
security.
5 Catastrophic A Almost
Certain Extreme
Optimize current water and power
generation management system,
implement engineering adaptations
as part of dam rehabilitation,
amend and implement design
standards to take account of
climate change, diversify power
generation, contingency planning
such as insurance back-up and / or
regional trading (Adaptation
Options: 7, 16 to 23).
3 Moderate C Moderate High
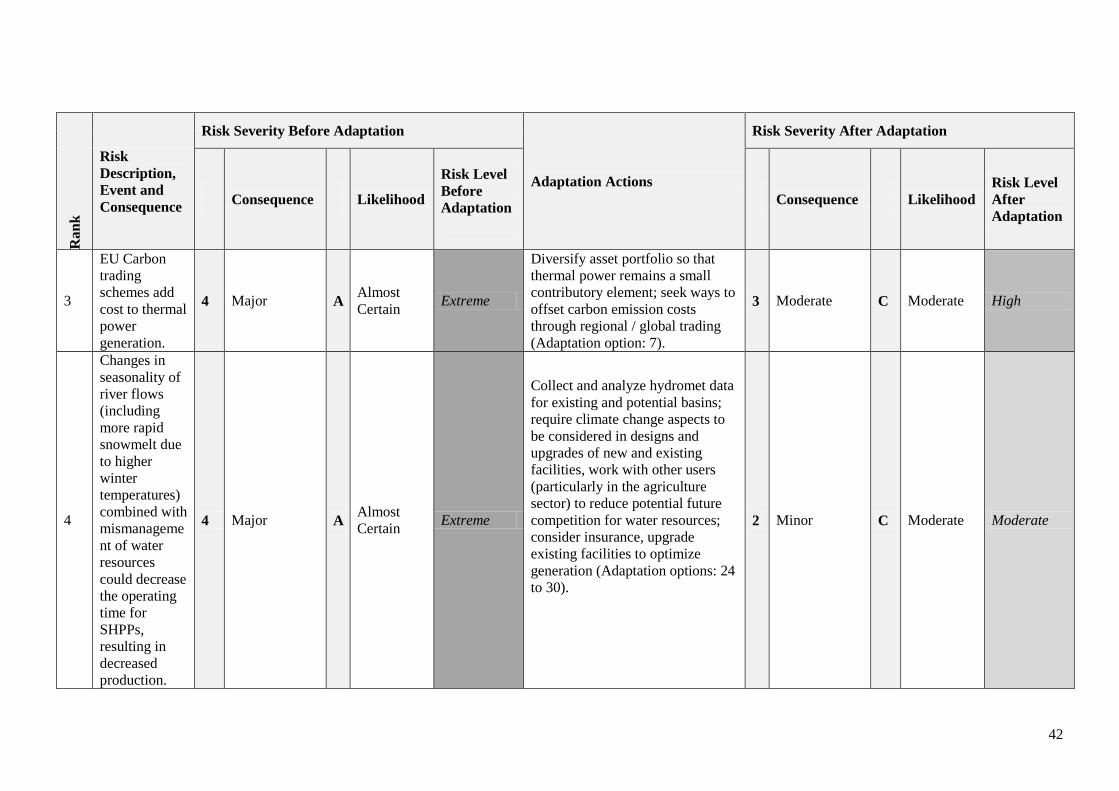
42
Ran
k
Risk
Description,
Event and
Consequence
Risk Severity Before Adaptation
Adaptation Actions
Risk Severity After Adaptation
Consequence
Likelihood
Risk Level
Before
Adaptation
Consequence
Likelihood
Risk Level
After
Adaptation
3
EU Carbon
trading
schemes add
cost to thermal
power
generation.
4 Major A Almost
Certain Extreme
Diversify asset portfolio so that
thermal power remains a small
contributory element; seek ways to
offset carbon emission costs
through regional / global trading
(Adaptation option: 7).
3 Moderate C Moderate High
4
Changes in
seasonality of
river flows
(including
more rapid
snowmelt due
to higher
winter
temperatures)
combined with
mismanageme
nt of water
resources
could decrease
the operating
time for
SHPPs,
resulting in
decreased
production.
4 Major A Almost
Certain Extreme
Collect and analyze hydromet data
for existing and potential basins;
require climate change aspects to
be considered in designs and
upgrades of new and existing
facilities, work with other users
(particularly in the agriculture
sector) to reduce potential future
competition for water resources;
consider insurance, upgrade
existing facilities to optimize
generation (Adaptation options: 24
to 30).
2 Minor C Moderate Moderate
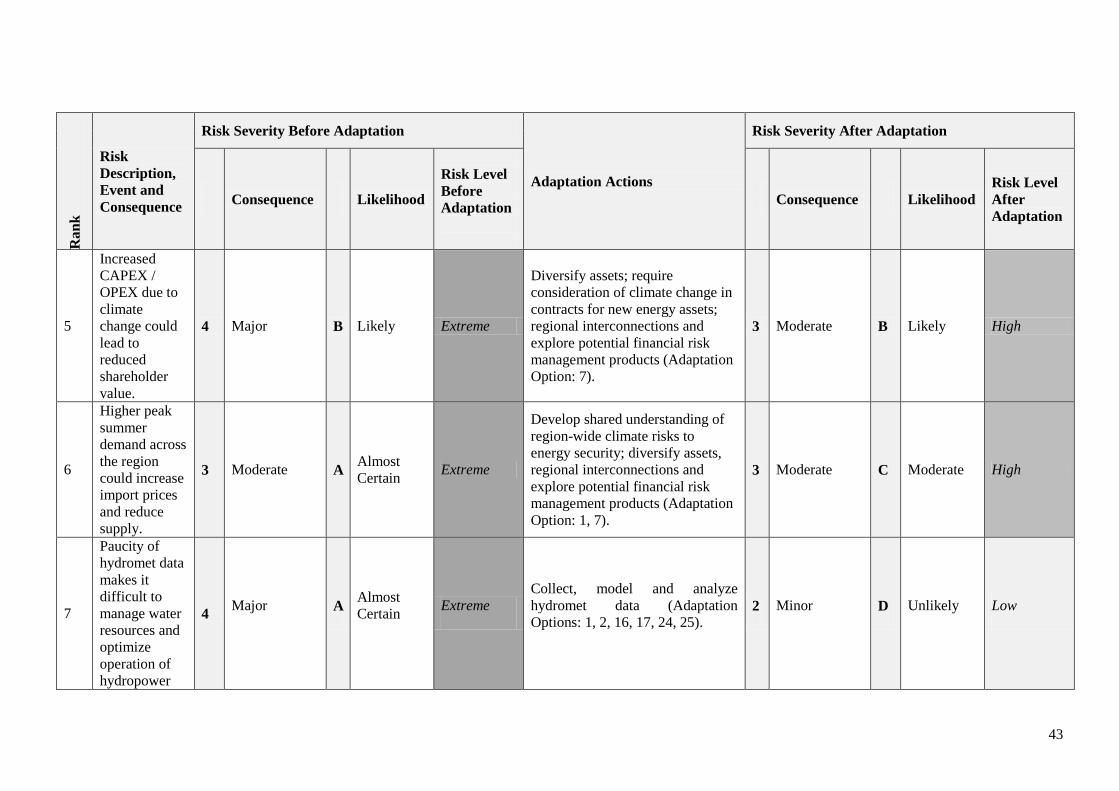
43
Ran
k
Risk
Description,
Event and
Consequence
Risk Severity Before Adaptation
Adaptation Actions
Risk Severity After Adaptation
Consequence
Likelihood
Risk Level
Before
Adaptation
Consequence
Likelihood
Risk Level
After
Adaptation
5
Increased
CAPEX /
OPEX due to
climate
change could
lead to
reduced
shareholder
value.
4 Major B Likely Extreme
Diversify assets; require
consideration of climate change in
contracts for new energy assets;
regional interconnections and
explore potential financial risk
management products (Adaptation
Option: 7).
3 Moderate B Likely High
6
Higher peak
summer
demand across
the region
could increase
import prices
and reduce
supply.
3 Moderate A Almost
Certain Extreme
Develop shared understanding of
region-wide climate risks to
energy security; diversify assets,
regional interconnections and
explore potential financial risk
management products (Adaptation
Option: 1, 7).
3 Moderate C Moderate High
7
Paucity of
hydromet data
makes it
difficult to
manage water
resources and
optimize
operation of
hydropower
4 Major A
Almost
Certain Extreme
Collect, model and analyze
hydromet data (Adaptation
Options: 1, 2, 16, 17, 24, 25). 2 Minor D Unlikely Low
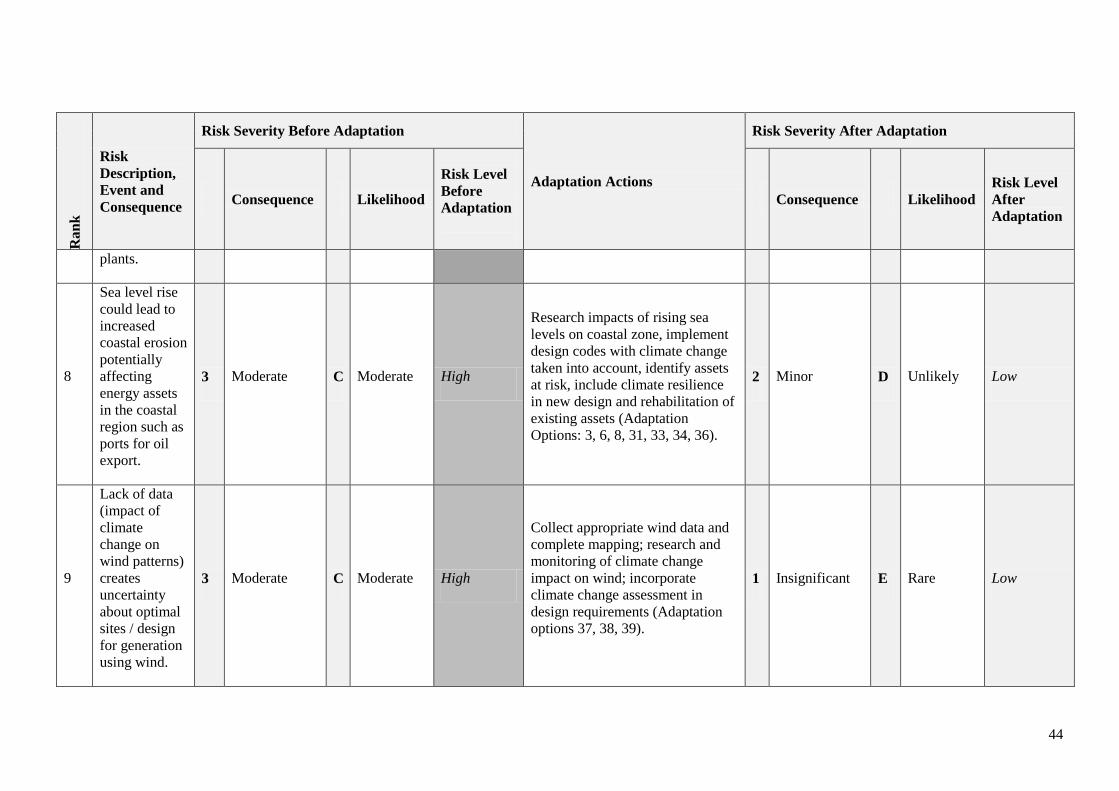
44
Ran
k
Risk
Description,
Event and
Consequence
Risk Severity Before Adaptation
Adaptation Actions
Risk Severity After Adaptation
Consequence
Likelihood
Risk Level
Before
Adaptation
Consequence
Likelihood
Risk Level
After
Adaptation
plants.
8
Sea level rise
could lead to
increased
coastal erosion
potentially
affecting
energy assets
in the coastal
region such as
ports for oil
export.
3 Moderate C Moderate High
Research impacts of rising sea
levels on coastal zone, implement
design codes with climate change
taken into account, identify assets
at risk, include climate resilience
in new design and rehabilitation of
existing assets (Adaptation
Options: 3, 6, 8, 31, 33, 34, 36).
2 Minor D Unlikely Low
9
Lack of data
(impact of
climate
change on
wind patterns)
creates
uncertainty
about optimal
sites / design
for generation
using wind.
3 Moderate C Moderate High
Collect appropriate wind data and
complete mapping; research and
monitoring of climate change
impact on wind; incorporate
climate change assessment in
design requirements (Adaptation
options 37, 38, 39).
1 Insignificant E Rare Low
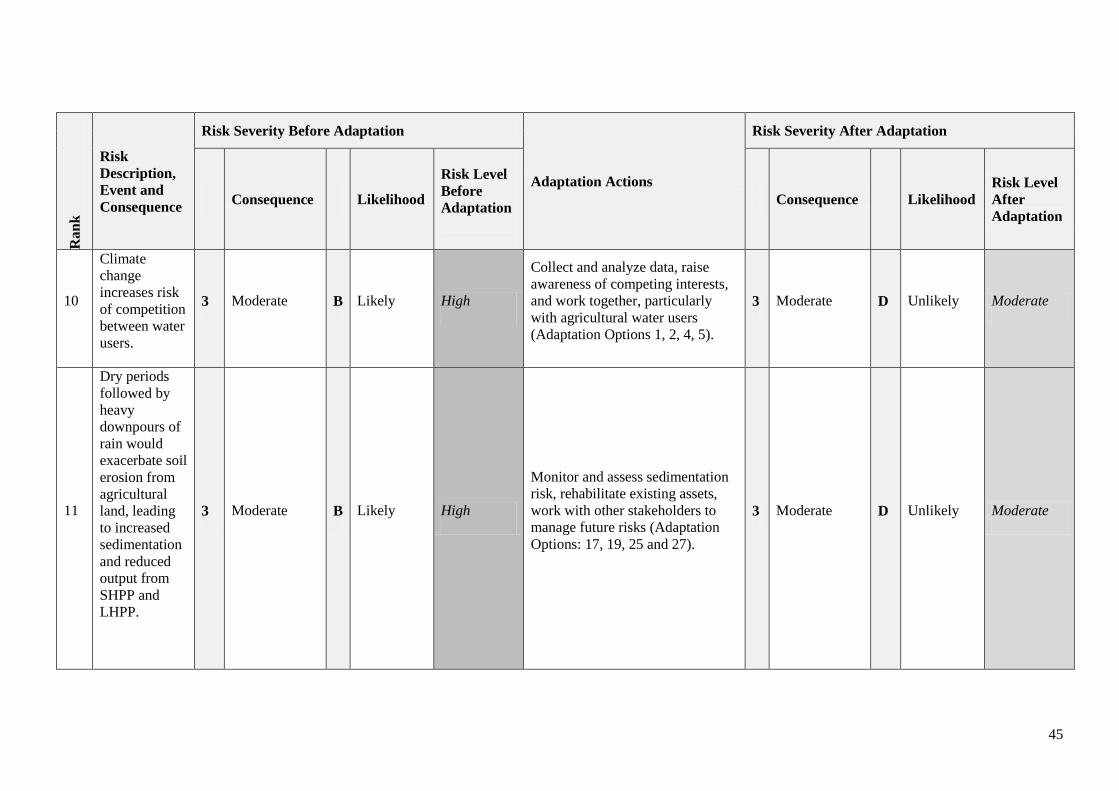
45
Ran
k
Risk
Description,
Event and
Consequence
Risk Severity Before Adaptation
Adaptation Actions
Risk Severity After Adaptation
Consequence
Likelihood
Risk Level
Before
Adaptation
Consequence
Likelihood
Risk Level
After
Adaptation
10
Climate
change
increases risk
of competition
between water
users.
3 Moderate B Likely High
Collect and analyze data, raise
awareness of competing interests,
and work together, particularly
with agricultural water users
(Adaptation Options 1, 2, 4, 5).
3 Moderate D Unlikely Moderate
11
Dry periods
followed by
heavy
downpours of
rain would
exacerbate soil
erosion from
agricultural
land, leading
to increased
sedimentation
and reduced
output from
SHPP and
LHPP.
3 Moderate B Likely High
Monitor and assess sedimentation
risk, rehabilitate existing assets,
work with other stakeholders to
manage future risks (Adaptation
Options: 17, 19, 25 and 27).
3 Moderate D Unlikely Moderate
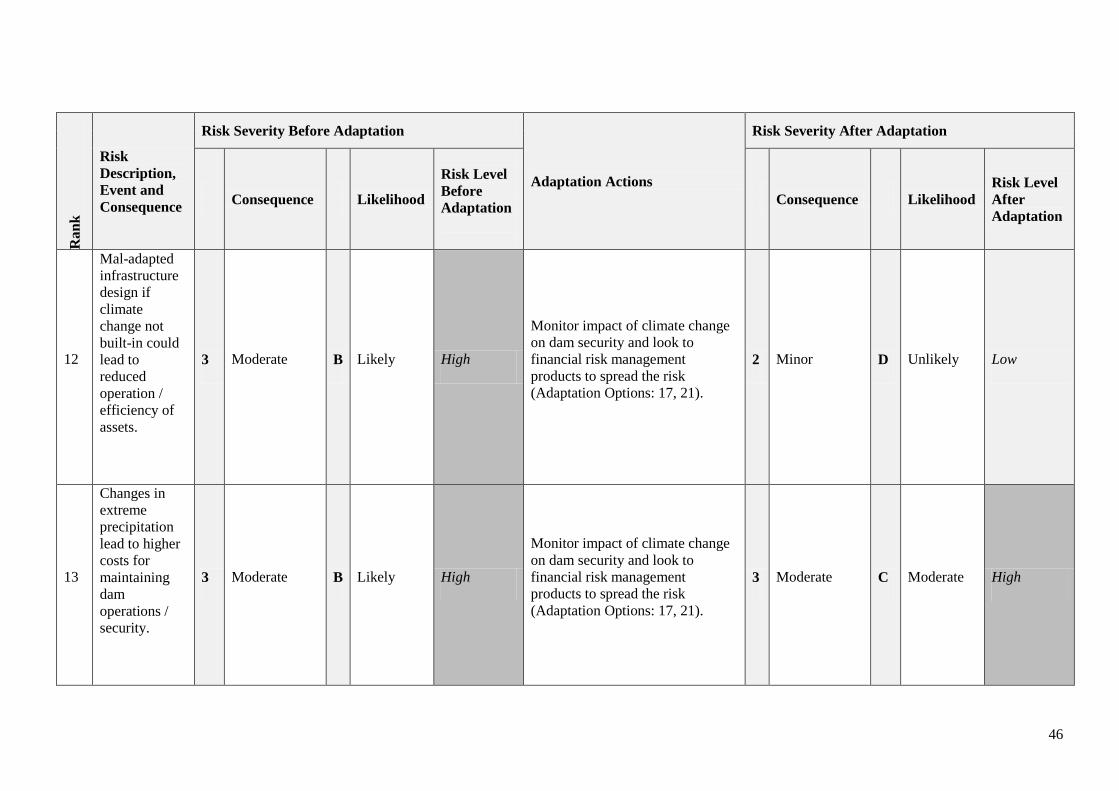
46
Ran
k
Risk
Description,
Event and
Consequence
Risk Severity Before Adaptation
Adaptation Actions
Risk Severity After Adaptation
Consequence
Likelihood
Risk Level
Before
Adaptation
Consequence
Likelihood
Risk Level
After
Adaptation
12
Mal-adapted
infrastructure
design if
climate
change not
built-in could
lead to
reduced
operation /
efficiency of
assets.
3 Moderate B Likely High
Monitor impact of climate change
on dam security and look to
financial risk management
products to spread the risk
(Adaptation Options: 17, 21).
2 Minor D Unlikely Low
13
Changes in
extreme
precipitation
lead to higher
costs for
maintaining
dam
operations /
security.
3 Moderate B Likely High
Monitor impact of climate change
on dam security and look to
financial risk management
products to spread the risk
(Adaptation Options: 17, 21).
3 Moderate C Moderate High
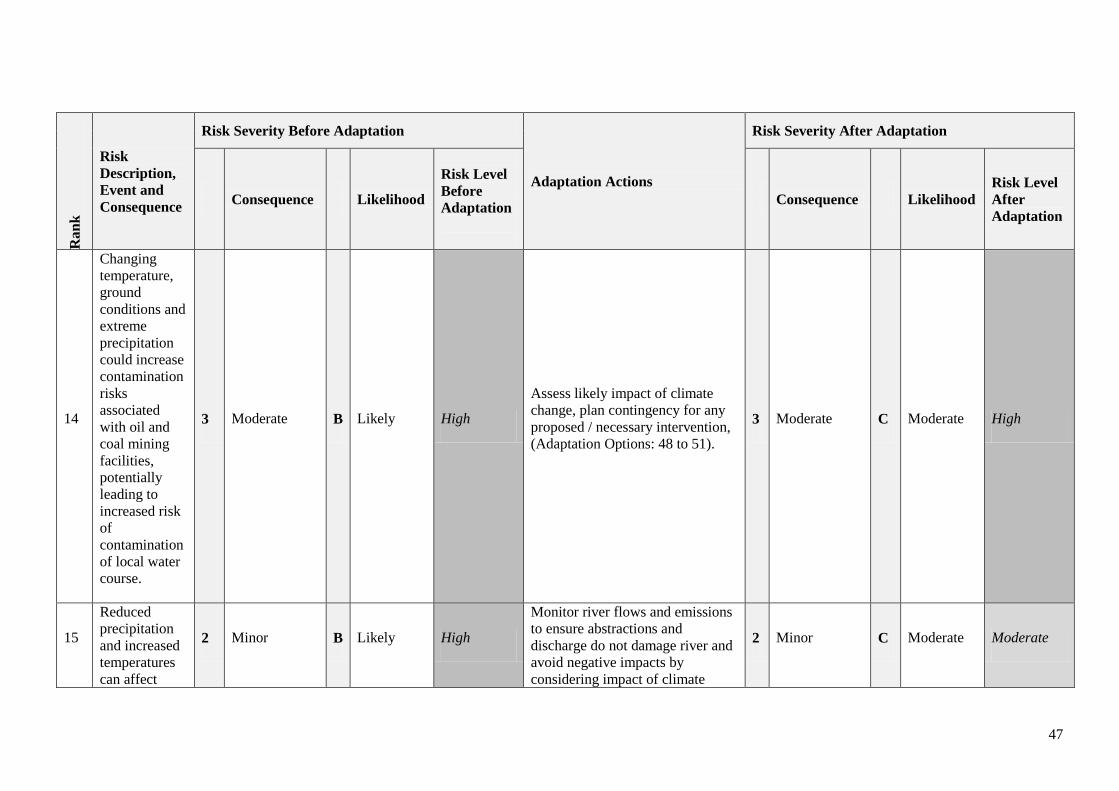
47
Ran
k
Risk
Description,
Event and
Consequence
Risk Severity Before Adaptation
Adaptation Actions
Risk Severity After Adaptation
Consequence
Likelihood
Risk Level
Before
Adaptation
Consequence
Likelihood
Risk Level
After
Adaptation
14
Changing
temperature,
ground
conditions and
extreme
precipitation
could increase
contamination
risks
associated
with oil and
coal mining
facilities,
potentially
leading to
increased risk
of
contamination
of local water
course.
3 Moderate B Likely High
Assess likely impact of climate
change, plan contingency for any
proposed / necessary intervention,
(Adaptation Options: 48 to 51).
3 Moderate C Moderate High
15
Reduced
precipitation
and increased
temperatures
can affect
2 Minor B Likely High
Monitor river flows and emissions
to ensure abstractions and
discharge do not damage river and
avoid negative impacts by
considering impact of climate
2 Minor C Moderate Moderate
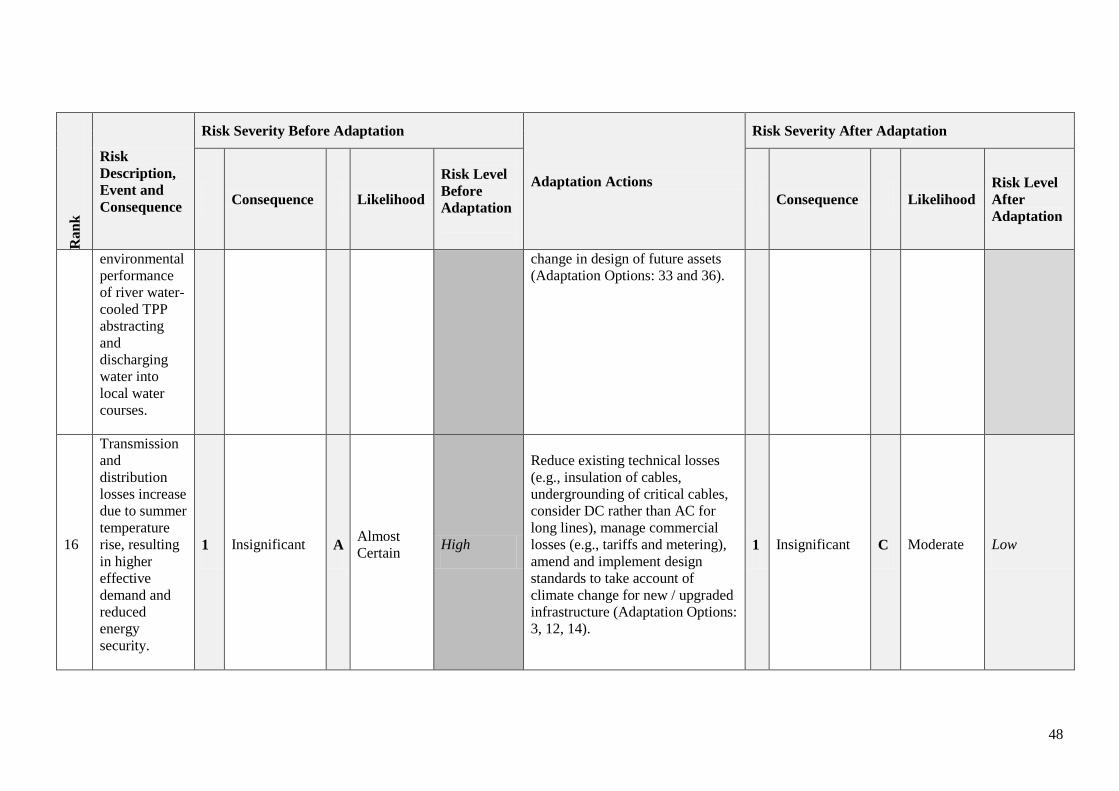
48
Ran
k
Risk
Description,
Event and
Consequence
Risk Severity Before Adaptation
Adaptation Actions
Risk Severity After Adaptation
Consequence
Likelihood
Risk Level
Before
Adaptation
Consequence
Likelihood
Risk Level
After
Adaptation
environmental
performance
of river water-
cooled TPP
abstracting
and
discharging
water into
local water
courses.
change in design of future assets
(Adaptation Options: 33 and 36).
16
Transmission
and
distribution
losses increase
due to summer
temperature
rise, resulting
in higher
effective
demand and
reduced
energy
security.
1 Insignificant A Almost
Certain High
Reduce existing technical losses
(e.g., insulation of cables,
undergrounding of critical cables,
consider DC rather than AC for
long lines), manage commercial
losses (e.g., tariffs and metering),
amend and implement design
standards to take account of
climate change for new / upgraded
infrastructure (Adaptation Options:
3, 12, 14).
1 Insignificant C Moderate Low
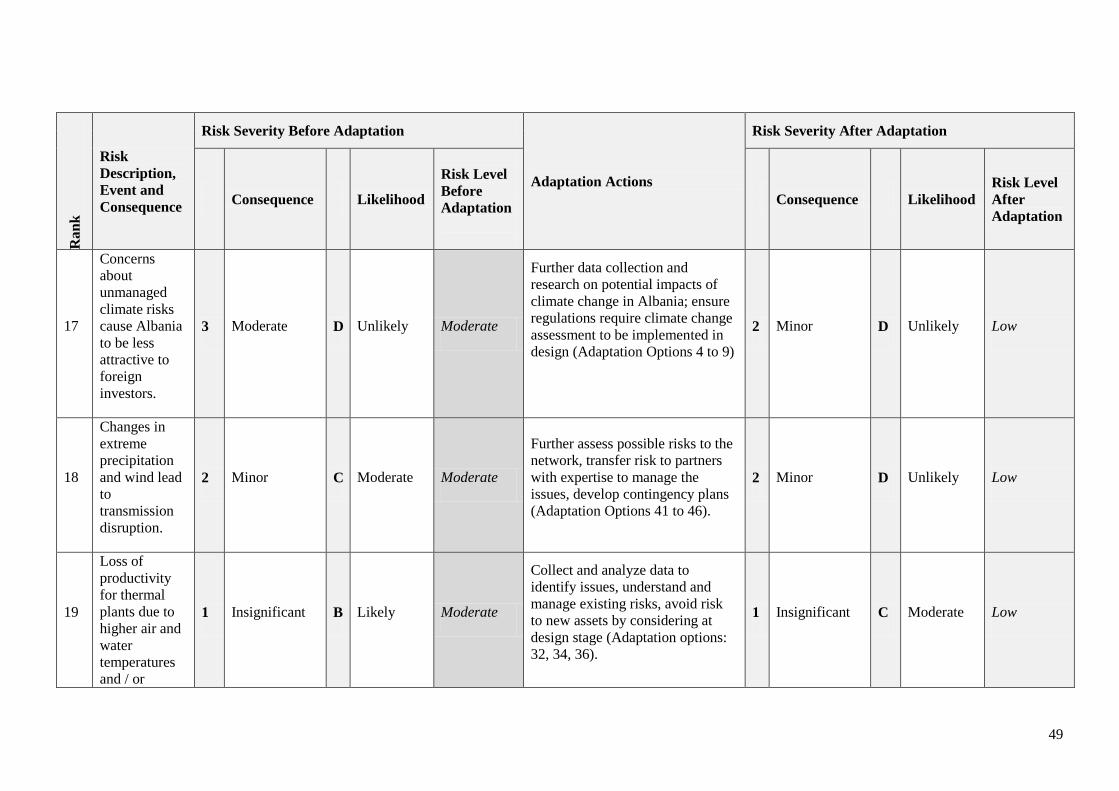
49
Ran
k
Risk
Description,
Event and
Consequence
Risk Severity Before Adaptation
Adaptation Actions
Risk Severity After Adaptation
Consequence
Likelihood
Risk Level
Before
Adaptation
Consequence
Likelihood
Risk Level
After
Adaptation
17
Concerns
about
unmanaged
climate risks
cause Albania
to be less
attractive to
foreign
investors.
3 Moderate D Unlikely Moderate
Further data collection and
research on potential impacts of
climate change in Albania; ensure
regulations require climate change
assessment to be implemented in
design (Adaptation Options 4 to 9)
2 Minor D Unlikely Low
18
Changes in
extreme
precipitation
and wind lead
to
transmission
disruption.
2 Minor C Moderate Moderate
Further assess possible risks to the
network, transfer risk to partners
with expertise to manage the
issues, develop contingency plans
(Adaptation Options 41 to 46).
2 Minor D Unlikely Low
19
Loss of
productivity
for thermal
plants due to
higher air and
water
temperatures
and / or
1 Insignificant B Likely Moderate
Collect and analyze data to
identify issues, understand and
manage existing risks, avoid risk
to new assets by considering at
design stage (Adaptation options:
32, 34, 36).
1 Insignificant C Moderate Low
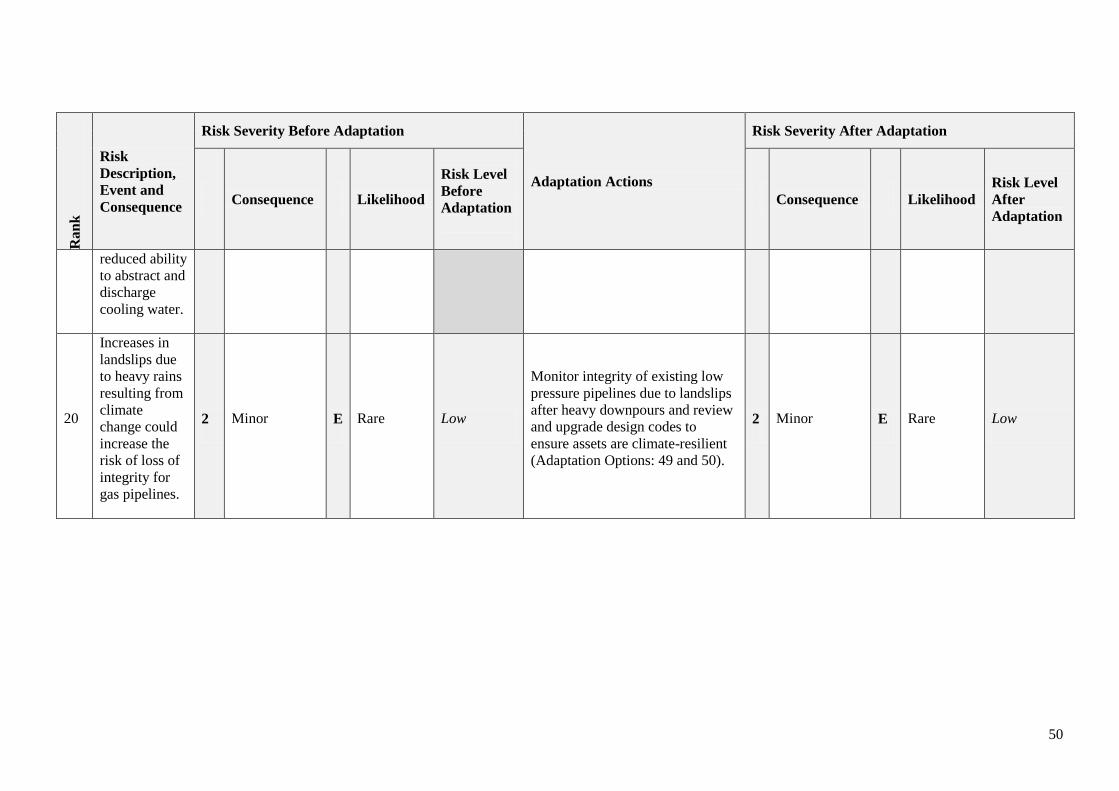
50
Ran
k
Risk
Description,
Event and
Consequence
Risk Severity Before Adaptation
Adaptation Actions
Risk Severity After Adaptation
Consequence
Likelihood
Risk Level
Before
Adaptation
Consequence
Likelihood
Risk Level
After
Adaptation
reduced ability
to abstract and
discharge
cooling water.
20
Increases in
landslips due
to heavy rains
resulting from
climate
change could
increase the
risk of loss of
integrity for
gas pipelines.
2 Minor E Rare Low
Monitor integrity of existing low
pressure pipelines due to landslips
after heavy downpours and review
and upgrade design codes to
ensure assets are climate-resilient
(Adaptation Options: 49 and 50).
2 Minor E Rare Low
51
5. COST–BENEFIT ANALYSIS OF ADAPTATION OPTIONS
5.1 OBJECTIVE OF THE COST–BENEFIT ANALYSIS
Based on discussions with stakeholders it was agreed that a high-level economic cost–benefit
analysis would be an appropriate method of examining options to manage the risks and
vulnerabilities to Albania‘s energy security in the face of climate change. Having subsequently
considered the impacts of climate change on energy security further, and given that
diversification of power generation assets was identified as a key adaptation option, stakeholders
agreed that the objective for the cost–benefit analysis be refined to address the following
question:
―What is the optimal technology (power generation asset) to supply the shortfall in
electricity that is directly caused by climate change?‖
Implicit in the word optimal in this question is the delivery of sustainable development. Also
implicit is the time period over which options should be considered. During discussions with
stakeholders, it was suggested that a 30-year period should be considered, however this was later
refined to 40 years (up to 2050) to tie in with climate modeling timeframes and a notable
threshold date.
5.2 ASSESSMENT OF SHORTFALL IN FUTURE POWER GENERATION DUE TO CLIMATE
CHANGE
To assess the range of energy generation technologies that could be used, it is first necessary to
identify what shortfall in power generation may result from climate change in Albania. The
calculations and projections below use as their starting point the most recent draft National
Energy Strategy (NES, Government of Albania, 2007). The draft National Energy Strategy
presents two scenarios, passive and active (described in Box 8 overleaf), and considers the
medium-term period out to the year 2019. Since the present assessment has a longer time horizon
than the draft NES, extending out to 2050, a number of assumptions have been made to build
supply and demand projections beyond the timescales of the NES. These assumptions are
detailed in Annex 8.
Step 1. Supply–Demand Projections Excluding Climate Change
In discussions undertaken during the workshops and subsequent meetings, stakeholders
highlighted that it was important to assess the impacts of climate change over a long planning
horizon; therefore, a time period from 2010 to 2050 was selected. But the draft NES for Albania
only provides projections for power supply and demand for the medium-term, from 2003 to
2019.
Therefore, as part of this assessment, the projected power demand described in the draft NES
was extrapolated beyond 2019 for each of the two demand-side scenarios that the draft NES
presents:
The passive scenario, which involves no energy demand control or energy efficiency
measures)

52
The active scenario, which includes implementation of energy efficiency measures such as
residential property insulation standards and installation of domestic solar water heating
The extrapolation of demand projections beyond the timeframe of the draft NES was based on
Albanian energy-expert opinion (Islami, 2009) and corresponds to annual growth rates in
demand of 2.8 percent initially, declining to 2.1 percent by 2050, in the passive projections; and
2.2 percent declining to 1.8 percent in the active projections. These demand growth projections
are illustrated in Figure 19 and are detailed in full in Annex 8.
From these demand projections, potential energy supply curves were generated that would meet
demand. Electricity typically cannot be stored but, rather, is produced instantaneously; in that
sense, supply and demand projections are the same line. Reconciliation is achieved as follows:
detailed supply projections are based on known potential energy assets included within the draft
NES, plus additional energy assets known to be under discussion within the Albanian energy
sector, plus energy imports at the level that achieves demand–supply balance without load
shedding (after 2013, when the draft NES predicts load shedding will cease). The use of
imported energy represents the demand that cannot be addressed with domestic sources.
0
5,000
10,000
15,000
20,000
25,000
30,000
2010
2012
2014
2016
2018
2020
2022
2024
2026
2028
2030
2032
2034
2036
2038
2040
2042
2044
2046
2048
2050
Year
GW
h
Baseline Supply/Demand Active Supply/Demand
Figure 19: Projected electricity supply/demand for Albania from 2010 to 2050
Step 2. Superimposing the Impacts of Climate Change on Supply–Demand Projections
Based on the climate change risks identified for Albania (see Section 3, Annex 8 and Annex 9),
the active-scenario projections of supply and demand were modified. Section 3 highlighted the
anticipated impacts of climate change:
Demand side:
o Summer cooling of residential and commercial properties will increase due to rising
summer temperatures.
o Winter heating of residential and commercial properties will decrease as winter
temperatures rise.
53
o Based on analysis of the above effects and combining these two phenomena results in
an estimated net effect of a reduction in annual demand of approximately 0.1 percent
per year. It is noted that this annual decrease may disguise a more significant impact
on energy security due to changing seasonal demand, with the summer peak demand
increasing and potentially becoming a greater controlling factor than current winter
peak demand (see Section 5.7 for more information on seasonality of impacts).
Supply side:
o Reduce annual precipitation and increases in temperature, leading to lower runoff and
less hydropower generation. As outlined in Section 3, the impact of climate change
on large hydropower plants is estimated as reduction of their generation by 15 percent
by 2050. For small hydropower plans, the reduction is estimated as 20 percent by
2050.
Box 8: Active and passive scenarios in the draft National Energy Strategy, 2007
The draft National Energy Strategy uses two future scenarios (passive and active) to project Albania‘s electricity
supply and demand up until 2019. Both projections are based on economic growth in Albania of +5 percent GDP
per year.
The passive-scenario projection assumes the preservation and development of the present situation in terms of
supply and demand for energy in all sectors of the local economy. It projects continuation of electrical power
consumption as the dominating source of energy for space heating and water heating in the households and
services sector. This projection assumes that a considerable part of the future demand for electrical power shall be
covered by extension of the thermal generating capacities (based on marine petroleum, solar, fuel oil, and
imported natural gas) and hydropower energy.
The active-scenario projection assumes efforts to address the supply–demand imbalance that is expected to arise
under a passive scenario. It assumes the following objectives:
Improving supply security
Improving energy efficiency
Diversification of energy resources
Use of renewable resources
Real pricing of electrical power
Implementation of the regional electricity market
Environment protection
The active-scenario projection assumes a focus on improving energy efficiency through:
Greater use of domestic solar water heating
Improved building standards (insulation, windows etc.)
Lower energy appliances
Alternative heating sources other than use of electricity
Although the active scenario envisions efforts intended to address current energy security concerns, many
of the actions included in the active scenario would also help to build resilience to the impacts of climate
change. The projections made underthe active scenario are dependent on the successful implementation of
the measures outlined above, which will be challenging. For the elements of the cost–benefit analysis
involving the active-scenario projections, it has been assumed that these measures are implemented as
described in the draft NES.
(Government of Albania, 2007)
54
o Reduce efficiency of thermal power plants and also transmission and distribution
networks. The efficiency reduction has been estimated as 1 percent for TPPs by 2050,
associated with rising temperatures. This estimate does not take into account any
impact on efficiency of thermal power plant operations due to environmental
management associated with cooling water discharge. Vlore TPP will be cooled using
seawater, and it is considered unlikely that its operations would need to change for
discharge to the marine environment. (However, if Albania develops river- or lake-
cooled TPPs in the future, these risks could be significant.) Losses from transmission
and distribution networks are also estimated as 1 percent by 2050.
o The projected reduction in cloudiness would mean that the output of solar power
plants would increase in the future. As outlined in Section 3, it is estimated that an
increase of 5 percent would occur by 2050.
The resulting predicted net reductions in supply (shortfall in power generation) due to climate
change are on the order of 580 to 740 GWhrs/annum (2 percent to 3 percent of total power
demand) by 2050, based on the extrapolated passive- and active-scenario projections
respectively. Interestingly, the shortfall caused by climate change in the active-scenario
projection is greater than that in the passive-scenario projection. This is because the active-
scenario projection assumes greater demand-side efficiency measures, less reliance on GHG-
emitting thermal plants, and a greater share of generation burden placed on hydropower plants,
which are more affected by climate change than other sources of electricity. However, an aspect
that should not be overlooked is the fact that many of the actions proposed as part of the active
scenario represent adaptation options: energy efficiency measures, diversification of assets, and
regulatory reform. Ensuring implementation of these measures would be an important part of a
strategy for Albania to manage climate-related risks and vulnerabilities to the energy sector. As
climate change impacts take effect in Albania, these ―adaptive-active‖ scenario options will have
increasing value. However, the benefits evident in the active-scenario projection are predicated
on successful implementation of energy efficiency measures, asset diversification, and other
measures mentioned in the draft NES.
As can be seen in Figure 20, the active- and passive-scenario projections track together over the
time period considered, with the energy shortage due to climate change slightly higher in the
active scenario than that in the passive scenario. As already mentioned, the draft National Energy
Strategy projections end at 2019. From 2020 onward, the shortage is projected using a different
methodology and a number of technologies are assumed either to come online or increase output.
This is the reason for the inflection in the active scenario line at 2020. (See Annex 7 for further
details.)

55
(100)
-
100
200
300
400
500
600
700
800
2010
2012
2014
2016
2018
2020
2022
2024
2026
2028
2030
2032
2034
2036
2038
2040
2042
2044
2046
2048
2050
Sh
ort
ag
e (
GW
h)
Passive Scenario Shortage Active Scenario Shortage
Figure 20: Electricity shortage due to climate change
Superimposing the impacts of climate change on the annual supply–demand projections reflects
only part of the potential threat that Albania‘s energy sector faces from climate change. There is
a question regarding how the energy system will work during critical periods (very hot or dry
periods) and whether more-significant impacts may emerge under some circumstances that are
beyond the annual-average shortfall projected in Figure 20. For example, the shortfall projected
does not take account of the limited capacity for storage of water in reservoirs that serve LHPP
assets. If, due to climate change, runoff that fills the reservoirs comes in shorter, more-extreme
periods of wet weather that requires water to be spilled, followed by long dry periods and
shortage of water, the power generation from LHPPs could be less than projected above. This
issue is discussed further in Section 5.7. A recent study in Brazil indicated that where power
production was calculated based on projected annual-average rainfall/runoff data, climate change
would result in a 3 percent drop in power generation. When the same analysis was conducted
using more detailed seasonal data, it was projected that the drop in firm power production could
be as much as 30 percent (Schaeffer et al., 2009). At this stage, there are insufficient
hydrometeorological and climatological data available for Albania to enable an estimate of
future subannual rainfall and power-generation relationships. However, this could be researched
further by policy makers and technical managers.
5.3 OPTIONS TO MEET THE PROJECTED POWER SHORTFALL DUE TO CLIMATE CHANGE
IMPACTS
Having identified potential future shortfall in electricity supply due to climate change, and noting
that some measures that contribute to building climate resilience are already contained within the
active-scenario projection, this assessment looks at the costs and benefits of options for
diversification of Albania‘s electricity supply.
Before discussing these options, it is worth noting briefly the significant benefits of improving
energy efficiency. The Asian Development Bank estimates that if 1 million incandescent light
bulbs were replaced with compact fluorescent lamps (CFLs) at a cost of about $1.5 million,
electricity demand would be reduced by about 50 MW. It estimates that the cost of building a
56
new 50 MW power station would be at least $50 million, and that operating costs would add
another $2 million to $3 million per year. This demonstrates how cost-effective energy
efficiency measures can be, and further strengthens the argument for ensuring that the energy
efficiency measures in the draft NES are implemented.
For the cost–benefit analysis, eight reasonable and practicable technology-based options (asset
types) for filling the electricity shortfall were identified during the workshops. These selected
options are described in order of increasing estimated capital cost. Assumptions relating to the
parameters that were used to assess each option in the CBA are also outlined:
1. Import. The import of electricity from neighboring countries is considered to be a realistic
potential option. There is a premium associated with the cost of this power and prices
fluctuate on a daily basis. To assess the environmental and social effects associated with this
option in the CBA, only those global impacts that could potentially affect Albania were
considered. Water usage and emissions for this option were considered to be the same as for
the combined cycle gas turbine option. Impacts on ecosystems and disturbances to people
and property were not considered, as it was assumed that the regulatory authority in the
generating country has already taken these into account. It has been assumed that all
imported electricity is produced using combined cycle gas turbine (CCGT) technology,
although it is recognized that a range of electricity generation technologies are used in South
Eastern Europe (see Box 2, Section 2.1), including nuclear power, hydropower, other
renewables, and GHG-emitting thermal plants fueled by coal.
2. Use combined cycle gas turbine (CCGT) technology. A new-build CCGT-based power
plant would use natural gas, which is cleaner than coal but has several disadvantages, such as
dependence on foreign sources of fuel and relatively high GHG emissions in comparison
with renewable technologies such as hydropower. Supercritical pulverized coal technology
was not considered in detail in the CBA, but if supercritical pulverized coal technology were
used instead of a gas-fired CCGT, it would have different environmental costs: it has
approximately 200 percent of the water usage and 220 percent of the GHG emissions of
CCGT. CCGT is clearly the more sustainable thermal option in spite of costing
approximately 10 percent more than coal on a levelized basis.
3. Improve/update existing large hydropower plants (LHPPs). There is some capacity for
improvement in existing large hydropower assets, including actions such as optimizing data
collection and usage, reservoir/dam maintenance and reservoir management.
4. Improve/update existing small hydropower plants (SHPPs). Many of the small
hydropower assets in Albania are old, and technology and design have improved
considerably since they were installed. In many cases, improvements such as optimizing
turbine operation with respect to varying river flow regimes, widening intake and outfall
channels, resizing turbines/plant, and improving connections to the transmission network are
possible.
5. Install new small hydropower plants (SHPPs). There are a number of unexploited sites
where new run-of-river hydropower plants could be sited. These smaller plants generally
serve smaller communities and could be connected to local distribution networks as well as
the national transmission grid.
6. Develop wind power. At this stage, there is no wind-power electricity generation in Albania,
although, as outlined in Section 2, a number of potential projects are currently under
consideration in Albania‘s coastal areas.
57
7. Use concentrated solar power. Concentrated solar power (CSP) captures solar energy
through a large array of mirrors, directing light toward a brine solution or other thermal
receptor that converts the solar energy into electricity. There are currently no CSP plants in
Albania. However, there are several located in the Mediterranean region in areas with similar
solar characteristics to those of Albania.
8. Install new large hydropower plant (LHPP). This option represents the building of a
completely new dam and reservoir to exploit the remaining generation potential in Albania‘s
hydrological system.
In undertaking the CBA, potential constraints on the implementation of technologies have been
considered:
It is considered that, subject to approval, there are no physical constraints on the number of
thermal power plants that could be installed.
With respect to wind power, there are insufficient data at present on wind speeds in Albania
at turbine operating heights. However, it is assumed that there is adequate wind potential for
the purposes of the CBA.
In the case of CSP, technology is developing in this area and a number of stakeholders felt
that this technology might become more feasible in the future, perhaps by 2040 and beyond.
Aspects considered in relation to current use of CSP were:
I. The technology is relatively new.
II. The capital costs are higher compared to other technologies.
III. There is not enough operating experience accrued worldwide to provide real data for
operating and maintenance costs.
IV. It involves higher technological, schedule and financial risks.
It is expected that by 2040 the capital costs for CSP would be comparable with other
technologies and sufficient experience worldwide would be developed that would reduce the
current risks associated with CSP. For the purposes of the CBA, best estimates of technology
costs (CAPEX and OPEX) have been used in the analysis, though it is recognized these may
be reduced if/when the technology advances.
With respect to hydropower, much more data are available. METE stated during meetings
that the current estimate of Albania‘s hydropower generation capacity is 3,200MW total for
LHPP and SHPP (Tugu, 2009). Of this, there is currently 1,445MW of LHPP and 15MW
SHPP installed capacity. The future supply projections developed in this assessment are
based on development of a further 1,150MW LHPP and 390MW SHPP, thus giving a total
installed capacity of 3,000MW by 2050. These values are estimated before the impact of
climate change has been taken into account, which it is predicted would reduce hydropower
potential in Albania. Therefore, there may be a significant physical constraint on further
potential capacity for hydropower generation, beyond those facilities already included in the
future projections. However, given the uncertainty surrounding total potential for
hydropower generation in Albania, and that estimates may be substantially modified if
additional basin hydrometeorological data and modeling were available, further development
of both LHPPs and SHPPs have been considered for the purposes of the CBA.
58
Importantly, to compare the costs and benefits of all the different assets on a like-for-like basis, a
quantity of power was chosen, 350 GWh, which could meet the estimated climate change-
induced shortage for 20 years. All of the generation capacity is not required at once, but rather
the need increases over the assessment period. Some assets would probably not be able to fill the
entire gap from beginning to end. Additionally, the assets under study have different expected
periods of service. Twenty years represents a period of time for which energy needs could be met
by the technologies under consideration. For the second 20 years to 2050 (the timescale under
consideration for climate change risks in this assessment), the additional generation needs could
be reexamined. This analysis thus considers what could be done in the immediate future,
providing guidance as to what may be good options.
It is important to note that the use of a normalized quantum of a particular asset that could
provide 350 GWh per year is hypothetical and a simplification, in the sense that installing this
amount of capacity may be unrealistic in most cases. For instance, economies of scale dictate
that a 50 MW thermal plant (which would provide about 350 GWh) would generally be less
feasible on a financial basis than a larger unit. Furthermore, to complete a high-level CBA, it has
been necessary to make broad assumptions about the specific locations where future assets may
be sited and also of the various options, their costs, and their impacts on society and the
environment. In addition, it should be noted that the options would themselves be susceptible to
climate change. The most notable impacts would be on the SHPP and LHPP options, as these are
most sensitive to climate change (see Sections 3.3 and 3.2), though the efficiency of TPP is also
slightly reduced as temperatures rise (see Section 3.4). In contrast, there may be benefits for
future solar power production due to reduced cloud cover in summer in the future (see Section
2.2). Since the available cost and benefit data are relatively high-level, further analysis of these
impacts on the options is not included in the scope of the CBA. Thus, the options considered in
this assessment are generic and indicative rather than definitive. However, it is considered useful
and informative to undertake a high-level CBA for these technologies, to provide an indication
of what the key issues are, and to identify where further data could be used to reduce uncertainty
or confirm a chosen course of action.
The eight power technology options were evaluated on the basis of eight parameters that were
determined based on the outcome of workshops and discussions with stakeholders. Parameters
were chosen that reflect sustainable-development performance aspects—that is, financial, social,
and environmental aspects of the different options. The parameters selected are detailed next.
5.4 BENEFIT CATEGORIES/PARAMETERS USED IN THE COST–BENEFIT ANALYSIS
In a complete economic analysis, the benefits of a given course of action are compared to the
cost. Actions that result in a net overall positive benefit to society as a whole are deemed
economic and sustainable.
The approach for this analysis is to attempt to capture the maximum likely benefits and dis-
benefits (i.e., costs) that would accrue to both the power producers (private benefits/dis-benefits)
and to society (external benefits/dis-benefits), for each of the various alternatives being assessed.
To do this, a conservative approach (from the economic point of view) has been adopted, with
each external (societal) monetizable benefit valued using a method that would tend to overstate
(rather than understate) the benefits. In addition, a qualitative examination of some likely
nonmonetizable benefits is also included. Thus, in the CBA, likely costs are compared with
conservatively high benefits, or disbenefits, as the case may be. In adopting this approach, the
report is biasing the economic analysis toward the societal position. This is advantageous
59
because it assures that the external perspective is fully considered and valued, and helps to
deflect any possible criticism that the analysis favours the proponent.
The parameters/potential benefits considered are summarized next and described in more detail
in Annex 5.
Financial Parameters
Financial parameters reflect a number of key issues identified at the workshops. An obvious
issue is the cost per unit of electricity produced. Although social and environmental aspects are
also important, the cost of producing electricity plays heavily on the viability of a given asset
type. Loss of production is also reflected in the financial parameters, specifically revenue from
electricity sold. The possibility that an asset type may not be able to fill the electricity shortage is
included in the model by virtue that it would have lower associated electricity revenue.
1. Capital Expenditure. Capital expenditure is the financial expense required during the
construction of the plant. It represents investment in the fixed assets that are used to generate
electricity. The value of land is also included in capital expenditure figures.
2. Operating Expenditure. Once the plant has been built, ongoing expenditure is required to
keep the plant operating. These costs comprise spares, maintenance, fuel, and other ongoing
costs required to keep the plant operating. Operating expenses vary depending on asset type
and depend on factors such as the location of the asset (more isolated assets are more
expensive to supply) and the age of the technology (newer technologies are often more
expensive to maintain).
3. Electricity Revenue. The revenue received through the sale of produced electricity
represents both the value of the production of the electricity and its contribution to
macroeconomic activity. Electricity revenue is based on the stated market price of 8.23 Lek
per kWh (USD 0.085 per kWh) (Tugu, 200). This parameter also represents a portion of the
benefits to the economy through a contribution to GDP.
Environmental Parameters
In the workshops environmental parameters were also identified as high priority issues to be
taken into account when deciding which type of power assets to build. Greenhouse gases, other
emissions, water and ecosystems were included as parameters in the CBA. In addition to
determining a base case monetary value for these parameters, a potentially realistic maximum
(high case) monetary value for these parameters was also determined, as shown in Table 6.
1. Value of water. Water in many forms (as a resource, in precipitation, in storms) is a key
factor in the risks associated with climate change. In Albania especially, where a large
proportion of electricity generation is based on water flows, it is important to account for
water usage and availability when looking at the different generation options. In this
economic CBA, the base value of water was based on the rate charged to an enterprise
consumer in Albania, 90 Lek per m3 (USD 0.93 per m
3). This price is based on information
from Tirana Municipality (2006). It is noted that, other than for concession costs for new
small hydropower plants, hydropower generators do not currently have to pay for water that
they use. However, inclusion of this value in the analysis takes account of the fact that there
may be cost in the future, as water becomes more highly valued by society.
2. Carbon dioxide and other greenhouse gases (GHGs). CO2 is the well-known greenhouse
gas that is traded in markets around the world. The base value used in this analysis was based
60
on the European Trading Scheme market spot price, €15.80 per tonne (USD 21.55 per tonne)
(11 May 2009). Other studies, such as the Stern Review (Stern, 2006), use detailed models to
project the cumulative economic impact of additional units of GHG, called the social cost of
carbon (SCC), estimated at approximately USD 75 per tonne CO2-e. This value was used in
the evaluation of the high case (see Table 6). Other emissions that were considered were
particulate emissions and NOx. After research, none of the generation asset types were
determined to have significant emissions of particulate matter, so it was not monetized or
explicitly included in the model. There are limited emissions of NOx from the CCGT plant
option, and these emissions were valued at USD 62 per tonne based on the U.S. EPA auction
of NOx emissions permits. Due to the limited scope of the study, some GHG emissions were
not included. The GHG emissions caused by the decomposition of organic matter during the
creation of a reservoir for a large hydropower plant and emissions during transportation of
materials for construction of the various generation assets are two examples.
3. Value of ecosystems (loss of ecological services). Building a power plant on a greenfield
site destroys or converts ecosystems to other uses. For the CBA, it was assumed that
hydropower plants were built in mountainous ecosystems and all other asset types were
constructed in coastal ecosystems. Based on published studies, the ecosystem services for the
mountains were valued at USD 30 per hectare (UNEP, 2001) and coastal ecosystems were
valued at USD 117 per hectare (Department of Natural Resources, 2004). The analysis
included loss of ecological resources, specifically the loss of mountainous or coastal
ecosystems, due to clearing associated with activities directly related to the power generation
options being considered.
Social Parameters
The economic CBA takes into account an aspect of social concerns through a parameter that
describes the overall disturbance to people and property caused by new constructions. There
were several other social aspects identified as important in the workshops that could not be
generalized and therefore were not included within the scope of this high level analysis;
examples are impacts on tourism, recreational benefits of some asset types (e.g., reservoirs) and
political implications of constructing a new power asset in a region or area where public
dissatisfaction is high.
1. Disturbance of people and property. This aspect has been valued using an approach that
has been previously widely used for assessing the disturbance from wind farms (Ladenberg,
2001). This value was pro-rated for the other asset types based on the population density of
the area and the footprint of the asset at hand. It is clear that there are other disturbances,
such as recreational benefits, and importantly for Albania, impacts on tourism. This is an area
for further study when more information about specific proposals is available. Other
important aspects are mentioned below.
2. Discount rate. In economics, it is common to assume that having something now is worth
more than getting it in the future. This is the basis for interest on bank accounts. To account
for the fact that expenditure today precludes other uses of the money, a discount is applied to
future cash flows. The amount of this discount rate has an effect on the present value of
future cash flows. In this assessment, a base discount rate of 4.5 percent has been used. This
discount rate has been adopted as the base value following discussion with the World Bank‘s
energy economist in Albania. The value is higher than the social discount rate used in other
developed European economies (e.g., the United Kingdom uses 3.5 percent) and reflects the
higher potential growth rates that a developing economy, such as Albania‘s, may experience.
61
The choice of discount rate can be contentious, especially in the context of environmental
and social benefits that occur many years in the future. Whereas environmental benefits for
future generations may not be considered as less valuable than the same benefits for the
current generation, in the context of purely financial investments, such as savings accounts,
benefits now are much more highly valued than later benefits. This causes a divide between
the discount rate used for public projects and the private discount rate used by investors when
making investment choices. The power sector necessarily combines a number of stakeholders
with interests in both the private financial and the public social/environmental performance
of investments. A project that is attractive from a purely private financial point of view may
not be interesting from a public point of view (or vice versa). Therefore, for this assessment
the impact of discount rate on the outcome of the CBA is explored through sensitivity
analysis, to understand the effects that discount rate assumptions may have on the relative
performance of different options.
Important Aspects for Further Study
As many parameters as feasible have been included within the scope of the high-level CBA
assessment. However, it is important to note that there are several important aspects that either
could not be included or were not included to the full extent possible in principle.
Water, by nature of its multiple forms and uses, is a particularly complicated aspect to consider
in policy decision making. In future studies, the alternative possible uses of water (e.g.,
irrigation) should be considered. There are also nonuse and ecological values to consider. Not
every use of water accrues all of these values. For instance, using water to cool a turbine through
evaporation precludes its use for irrigation, whereas water that has passed through a hydropower
turbine may still be available of downstream irrigation.
Each asset type will have a different impact on the surrounding ecosystems. Furthermore,
different locations will have different types of ecosystems of different values. Outside a highly-
general study, greater ecosystem impact information is required to consider properly the full
costs and benefits of various options.
Broader economic impacts are also important. Again, across various assets, the exact impact that
constructing a given facility will have on gross domestic product and employment will depend
on the number of people that particular facility takes to operate, the type of training required and
the legal structure of the operating company. Although these effects could only be superficially
covered in this assessment, they are suited for inclusion in a more detailed and specific future
study.
Vulnerability to natural disasters and increased climatic vulnerabilities is another parameter that
was identified as important at the workshops, but has only been incorporated in the CBA through
sensitivity testing (see Section 5.6). Further study could expose potentially-critical hidden
vulnerabilities that would need to be incorporated into policy decisions.
A summary of the base case and high case parameter values used in the CBA is presented in
Table 6.
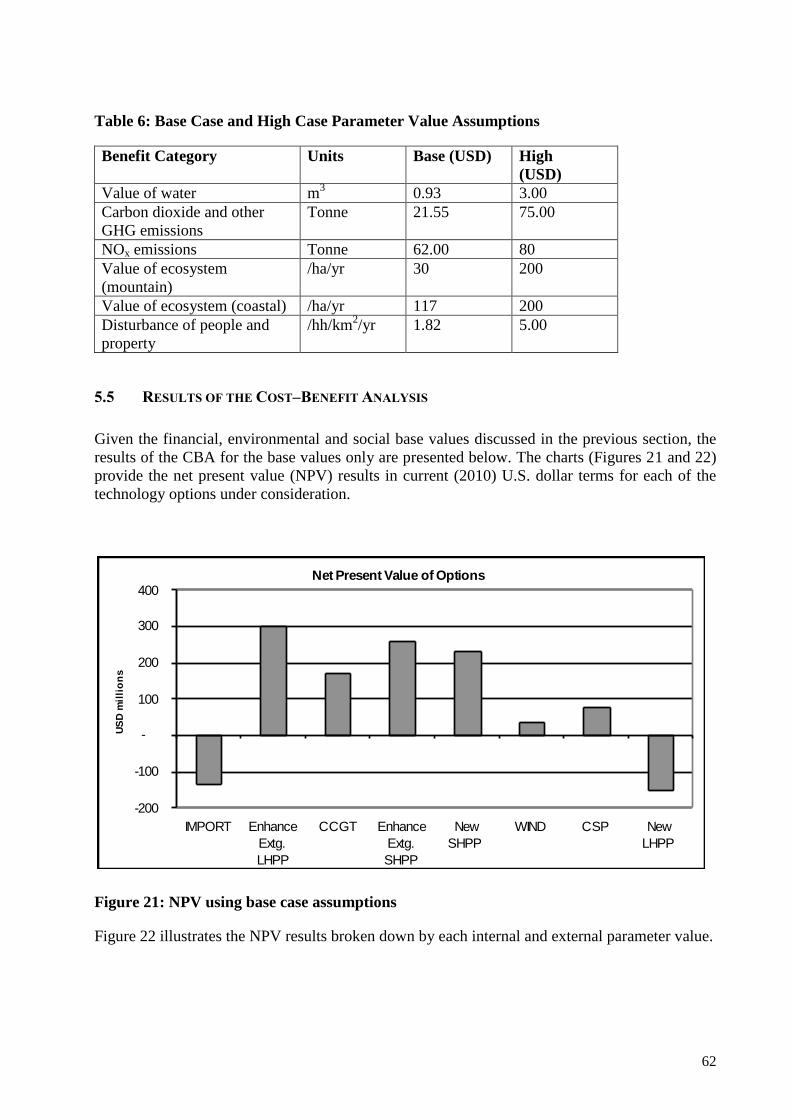
62
Table 6: Base Case and High Case Parameter Value Assumptions
Benefit Category Units Base (USD) High
(USD)
Value of water m3 0.93 3.00
Carbon dioxide and other
GHG emissions
Tonne 21.55 75.00
NOx emissions Tonne 62.00 80
Value of ecosystem
(mountain)
/ha/yr 30 200
Value of ecosystem (coastal) /ha/yr 117 200
Disturbance of people and
property
/hh/km2/yr 1.82 5.00
5.5 RESULTS OF THE COST–BENEFIT ANALYSIS
Given the financial, environmental and social base values discussed in the previous section, the
results of the CBA for the base values only are presented below. The charts (Figures 21 and 22)
provide the net present value (NPV) results in current (2010) U.S. dollar terms for each of the
technology options under consideration.
Net Present Value of Options
-200
-100
-
100
200
300
400
IMPORT Enhance
Extg.
LHPP
CCGT Enhance
Extg.
SHPP
New
SHPP
WIND CSP New
LHPP
US
D m
illi
on
s
Figure 21: NPV using base case assumptions
Figure 22 illustrates the NPV results broken down by each internal and external parameter value.
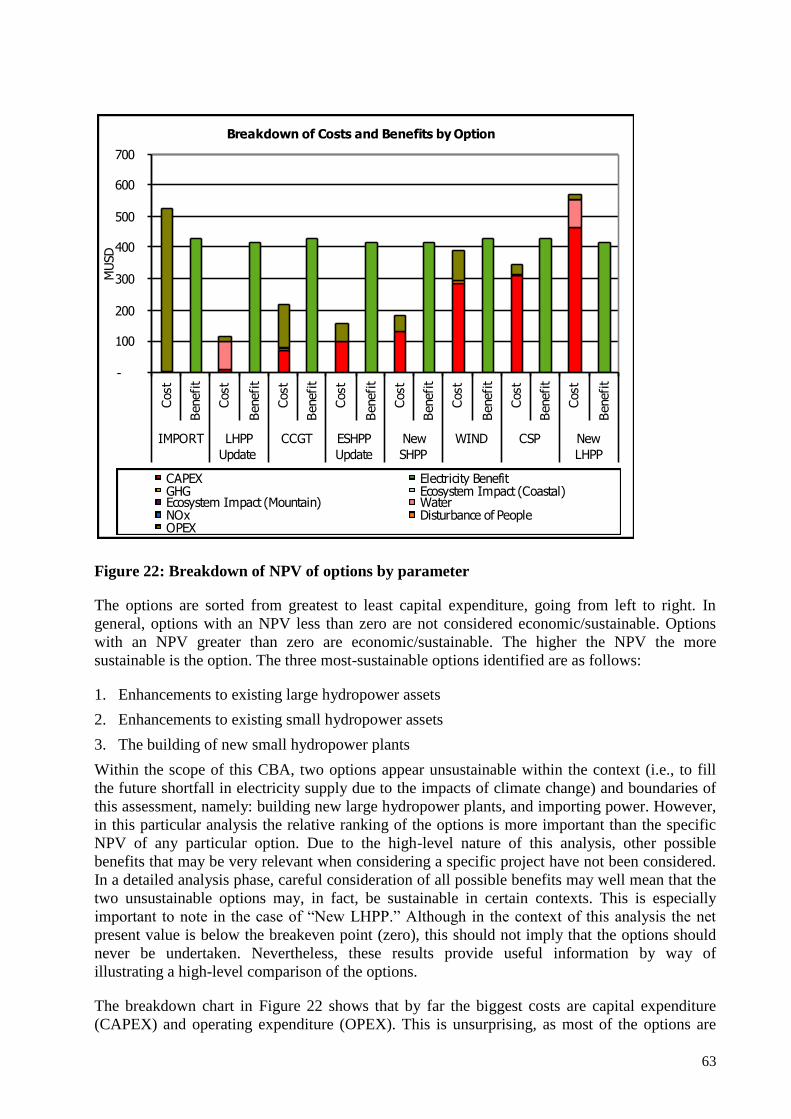
63
Breakdown of Costs and Benefits by Option
-
100
200
300
400
500
600
700Cost
Benefit
Cost
Benefit
Cost
Benefit
Cost
Benefit
Cost
Benefit
Cost
Benefit
Cost
Benefit
Cost
Benefit
IMPORT LHPP
Update
CCGT ESHPP
Update
New
SHPP
WIND CSP New
LHPP
Option
MUSD
CAPEX Electricity BenefitGHG Ecosystem Impact (Coastal)Ecosystem Impact (Mountain) WaterNOx Disturbance of PeopleOPEX
Figure 22: Breakdown of NPV of options by parameter
The options are sorted from greatest to least capital expenditure, going from left to right. In
general, options with an NPV less than zero are not considered economic/sustainable. Options
with an NPV greater than zero are economic/sustainable. The higher the NPV the more
sustainable is the option. The three most-sustainable options identified are as follows:
1. Enhancements to existing large hydropower assets
2. Enhancements to existing small hydropower assets
3. The building of new small hydropower plants
Within the scope of this CBA, two options appear unsustainable within the context (i.e., to fill
the future shortfall in electricity supply due to the impacts of climate change) and boundaries of
this assessment, namely: building new large hydropower plants, and importing power. However,
in this particular analysis the relative ranking of the options is more important than the specific
NPV of any particular option. Due to the high-level nature of this analysis, other possible
benefits that may be very relevant when considering a specific project have not been considered.
In a detailed analysis phase, careful consideration of all possible benefits may well mean that the
two unsustainable options may, in fact, be sustainable in certain contexts. This is especially
important to note in the case of ―New LHPP.‖ Although in the context of this analysis the net
present value is below the breakeven point (zero), this should not imply that the options should
never be undertaken. Nevertheless, these results provide useful information by way of
illustrating a high-level comparison of the options.
The breakdown chart in Figure 22 shows that by far the biggest costs are capital expenditure
(CAPEX) and operating expenditure (OPEX). This is unsurprising, as most of the options are
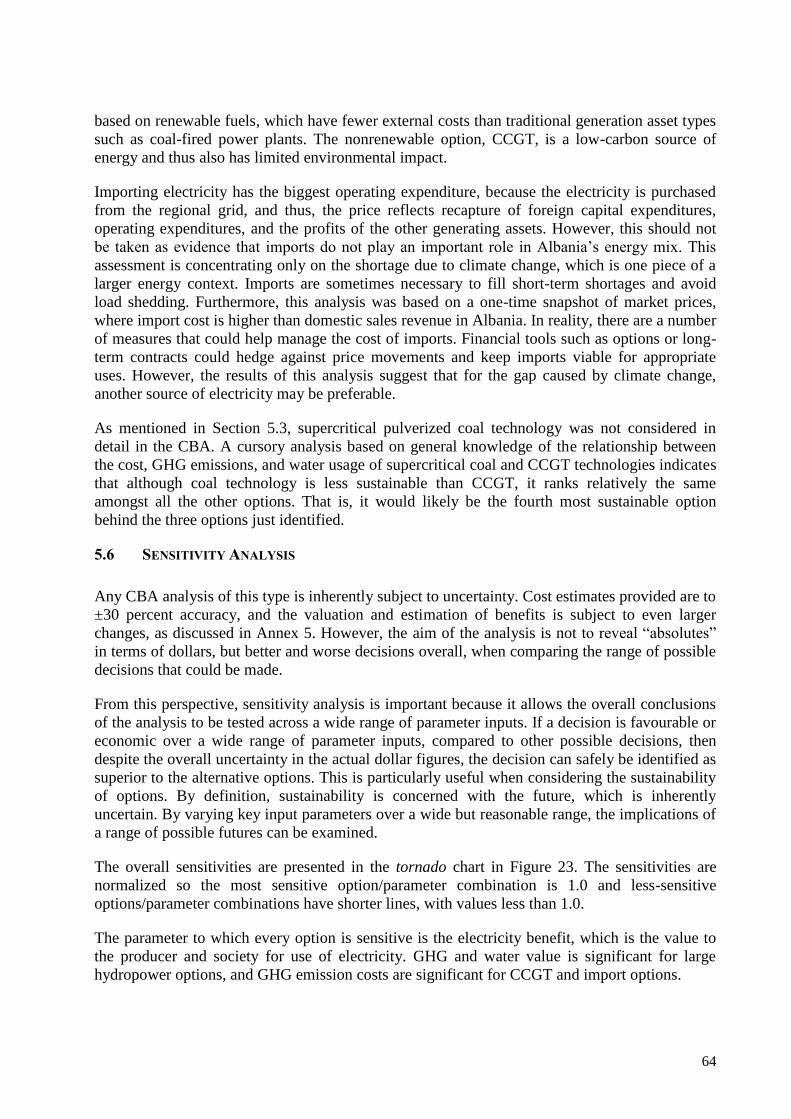
64
based on renewable fuels, which have fewer external costs than traditional generation asset types
such as coal-fired power plants. The nonrenewable option, CCGT, is a low-carbon source of
energy and thus also has limited environmental impact.
Importing electricity has the biggest operating expenditure, because the electricity is purchased
from the regional grid, and thus, the price reflects recapture of foreign capital expenditures,
operating expenditures, and the profits of the other generating assets. However, this should not
be taken as evidence that imports do not play an important role in Albania‘s energy mix. This
assessment is concentrating only on the shortage due to climate change, which is one piece of a
larger energy context. Imports are sometimes necessary to fill short-term shortages and avoid
load shedding. Furthermore, this analysis was based on a one-time snapshot of market prices,
where import cost is higher than domestic sales revenue in Albania. In reality, there are a number
of measures that could help manage the cost of imports. Financial tools such as options or long-
term contracts could hedge against price movements and keep imports viable for appropriate
uses. However, the results of this analysis suggest that for the gap caused by climate change,
another source of electricity may be preferable.
As mentioned in Section 5.3, supercritical pulverized coal technology was not considered in
detail in the CBA. A cursory analysis based on general knowledge of the relationship between
the cost, GHG emissions, and water usage of supercritical coal and CCGT technologies indicates
that although coal technology is less sustainable than CCGT, it ranks relatively the same
amongst all the other options. That is, it would likely be the fourth most sustainable option
behind the three options just identified.
5.6 SENSITIVITY ANALYSIS
Any CBA analysis of this type is inherently subject to uncertainty. Cost estimates provided are to
±30 percent accuracy, and the valuation and estimation of benefits is subject to even larger
changes, as discussed in Annex 5. However, the aim of the analysis is not to reveal ―absolutes‖
in terms of dollars, but better and worse decisions overall, when comparing the range of possible
decisions that could be made.
From this perspective, sensitivity analysis is important because it allows the overall conclusions
of the analysis to be tested across a wide range of parameter inputs. If a decision is favourable or
economic over a wide range of parameter inputs, compared to other possible decisions, then
despite the overall uncertainty in the actual dollar figures, the decision can safely be identified as
superior to the alternative options. This is particularly useful when considering the sustainability
of options. By definition, sustainability is concerned with the future, which is inherently
uncertain. By varying key input parameters over a wide but reasonable range, the implications of
a range of possible futures can be examined.
The overall sensitivities are presented in the tornado chart in Figure 23. The sensitivities are
normalized so the most sensitive option/parameter combination is 1.0 and less-sensitive
options/parameter combinations have shorter lines, with values less than 1.0.
The parameter to which every option is sensitive is the electricity benefit, which is the value to
the producer and society for use of electricity. GHG and water value is significant for large
hydropower options, and GHG emission costs are significant for CCGT and import options.
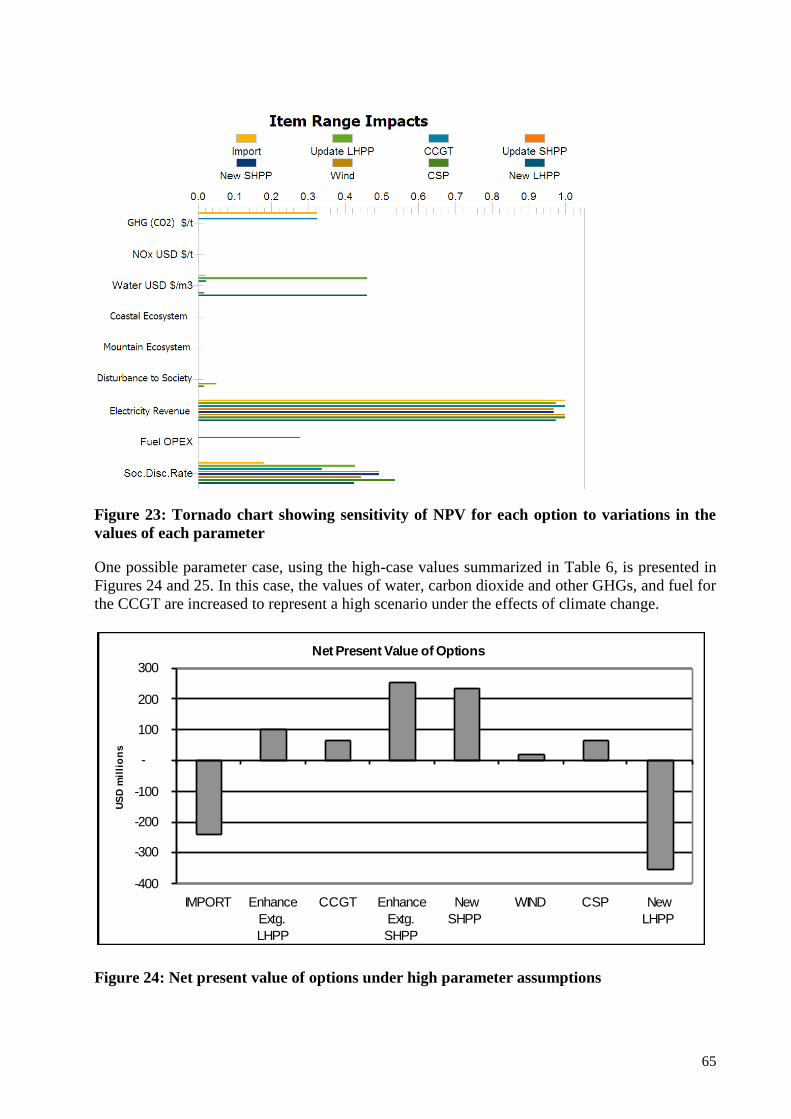
65
Figure 23: Tornado chart showing sensitivity of NPV for each option to variations in the
values of each parameter
One possible parameter case, using the high-case values summarized in Table 6, is presented in
Figures 24 and 25. In this case, the values of water, carbon dioxide and other GHGs, and fuel for
the CCGT are increased to represent a high scenario under the effects of climate change.
Net Present Value of Options
-400
-300
-200
-100
-
100
200
300
IMPORT Enhance
Extg.
LHPP
CCGT Enhance
Extg.
SHPP
New
SHPP
WIND CSP New
LHPP
US
D m
illi
on
s
Figure 24: Net present value of options under high parameter assumptions
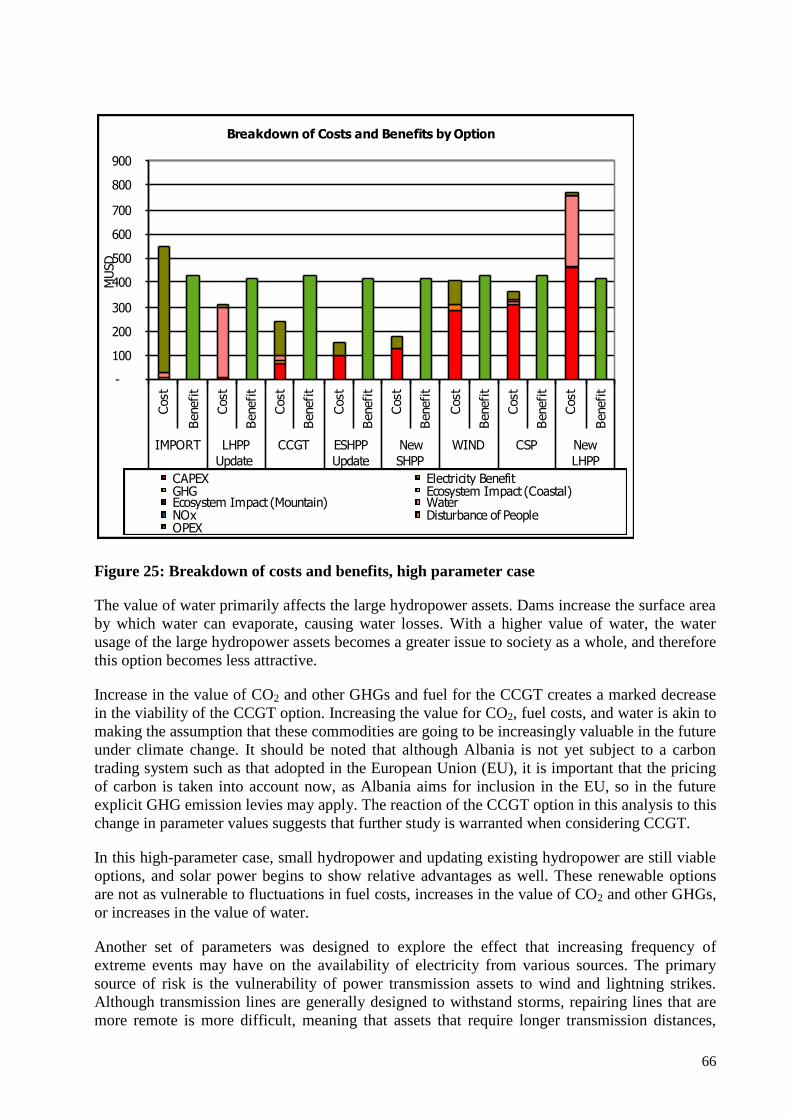
66
Breakdown of Costs and Benefits by Option
-
100
200
300
400
500
600
700
800
900Cost
Benefit
Cost
Benefit
Cost
Benefit
Cost
Benefit
Cost
Benefit
Cost
Benefit
Cost
Benefit
Cost
Benefit
IMPORT LHPP
Update
CCGT ESHPP
Update
New
SHPP
WIND CSP New
LHPP
Option
MUSD
CAPEX Electricity BenefitGHG Ecosystem Impact (Coastal)Ecosystem Impact (Mountain) WaterNOx Disturbance of PeopleOPEX
Figure 25: Breakdown of costs and benefits, high parameter case
The value of water primarily affects the large hydropower assets. Dams increase the surface area
by which water can evaporate, causing water losses. With a higher value of water, the water
usage of the large hydropower assets becomes a greater issue to society as a whole, and therefore
this option becomes less attractive.
Increase in the value of CO2 and other GHGs and fuel for the CCGT creates a marked decrease
in the viability of the CCGT option. Increasing the value for CO2, fuel costs, and water is akin to
making the assumption that these commodities are going to be increasingly valuable in the future
under climate change. It should be noted that although Albania is not yet subject to a carbon
trading system such as that adopted in the European Union (EU), it is important that the pricing
of carbon is taken into account now, as Albania aims for inclusion in the EU, so in the future
explicit GHG emission levies may apply. The reaction of the CCGT option in this analysis to this
change in parameter values suggests that further study is warranted when considering CCGT.
In this high-parameter case, small hydropower and updating existing hydropower are still viable
options, and solar power begins to show relative advantages as well. These renewable options
are not as vulnerable to fluctuations in fuel costs, increases in the value of CO2 and other GHGs,
or increases in the value of water.
Another set of parameters was designed to explore the effect that increasing frequency of
extreme events may have on the availability of electricity from various sources. The primary
source of risk is the vulnerability of power transmission assets to wind and lightning strikes.
Although transmission lines are generally designed to withstand storms, repairing lines that are
more remote is more difficult, meaning that assets that require longer transmission distances,
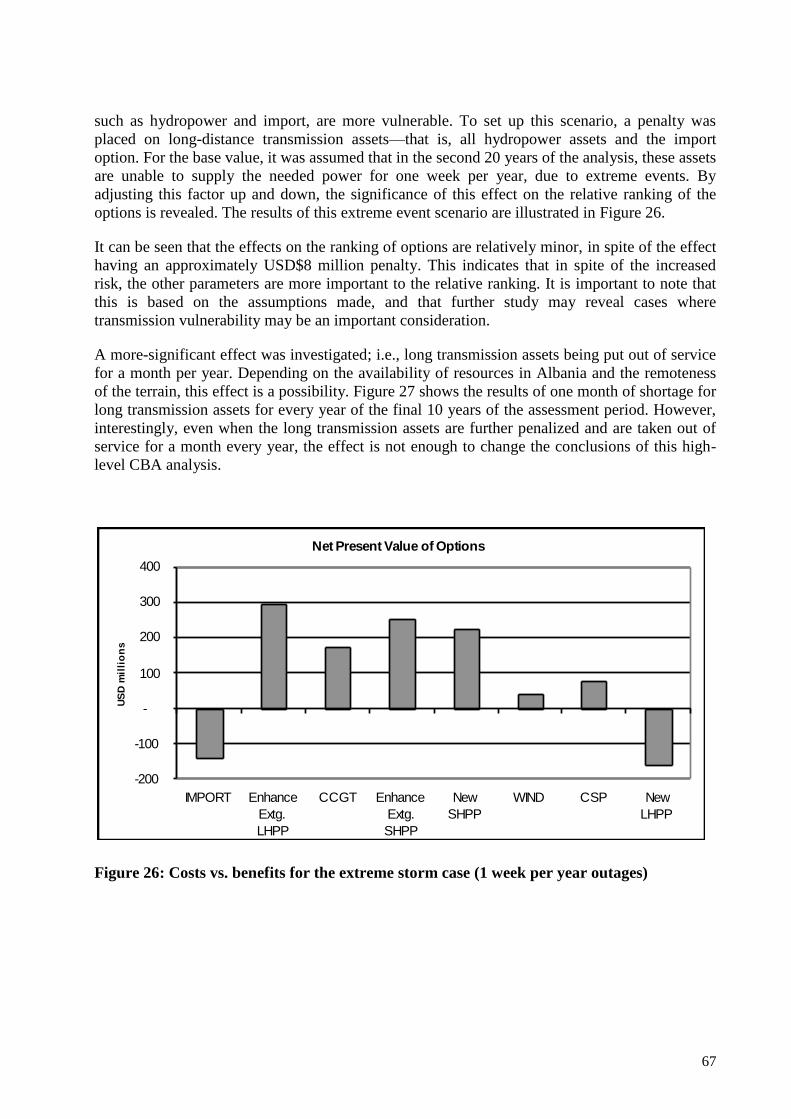
67
such as hydropower and import, are more vulnerable. To set up this scenario, a penalty was
placed on long-distance transmission assets—that is, all hydropower assets and the import
option. For the base value, it was assumed that in the second 20 years of the analysis, these assets
are unable to supply the needed power for one week per year, due to extreme events. By
adjusting this factor up and down, the significance of this effect on the relative ranking of the
options is revealed. The results of this extreme event scenario are illustrated in Figure 26.
It can be seen that the effects on the ranking of options are relatively minor, in spite of the effect
having an approximately USD$8 million penalty. This indicates that in spite of the increased
risk, the other parameters are more important to the relative ranking. It is important to note that
this is based on the assumptions made, and that further study may reveal cases where
transmission vulnerability may be an important consideration.
A more-significant effect was investigated; i.e., long transmission assets being put out of service
for a month per year. Depending on the availability of resources in Albania and the remoteness
of the terrain, this effect is a possibility. Figure 27 shows the results of one month of shortage for
long transmission assets for every year of the final 10 years of the assessment period. However,
interestingly, even when the long transmission assets are further penalized and are taken out of
service for a month every year, the effect is not enough to change the conclusions of this high-
level CBA analysis.
Net Present Value of Options
-200
-100
-
100
200
300
400
IMPORT Enhance
Extg.
LHPP
CCGT Enhance
Extg.
SHPP
New
SHPP
WIND CSP New
LHPP
US
D m
illi
on
s
Figure 26: Costs vs. benefits for the extreme storm case (1 week per year outages)
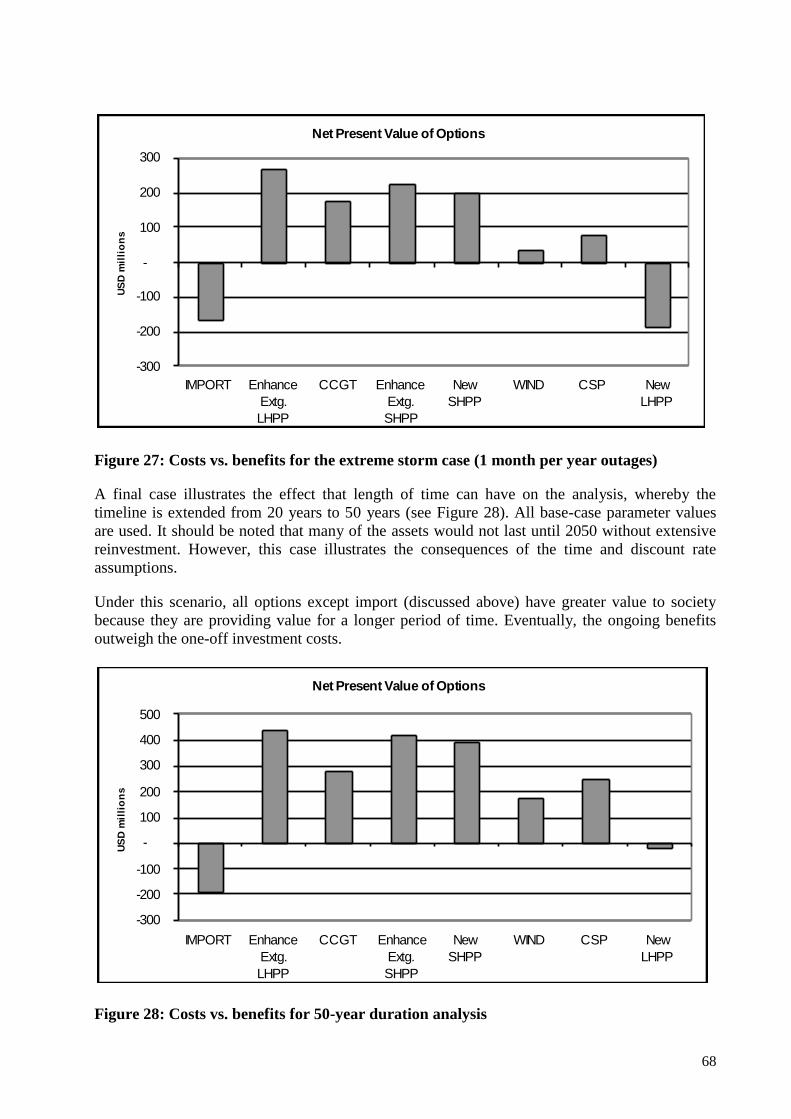
68
Net Present Value of Options
-300
-200
-100
-
100
200
300
IMPORT Enhance
Extg.
LHPP
CCGT Enhance
Extg.
SHPP
New
SHPP
WIND CSP New
LHPP
US
D m
illi
on
s
Figure 27: Costs vs. benefits for the extreme storm case (1 month per year outages)
A final case illustrates the effect that length of time can have on the analysis, whereby the
timeline is extended from 20 years to 50 years (see Figure 28). All base-case parameter values
are used. It should be noted that many of the assets would not last until 2050 without extensive
reinvestment. However, this case illustrates the consequences of the time and discount rate
assumptions.
Under this scenario, all options except import (discussed above) have greater value to society
because they are providing value for a longer period of time. Eventually, the ongoing benefits
outweigh the one-off investment costs.
Net Present Value of Options
-300
-200
-100
-
100
200
300
400
500
IMPORT Enhance
Extg.
LHPP
CCGT Enhance
Extg.
SHPP
New
SHPP
WIND CSP New
LHPP
US
D m
illi
on
s
Figure 28: Costs vs. benefits for 50-year duration analysis
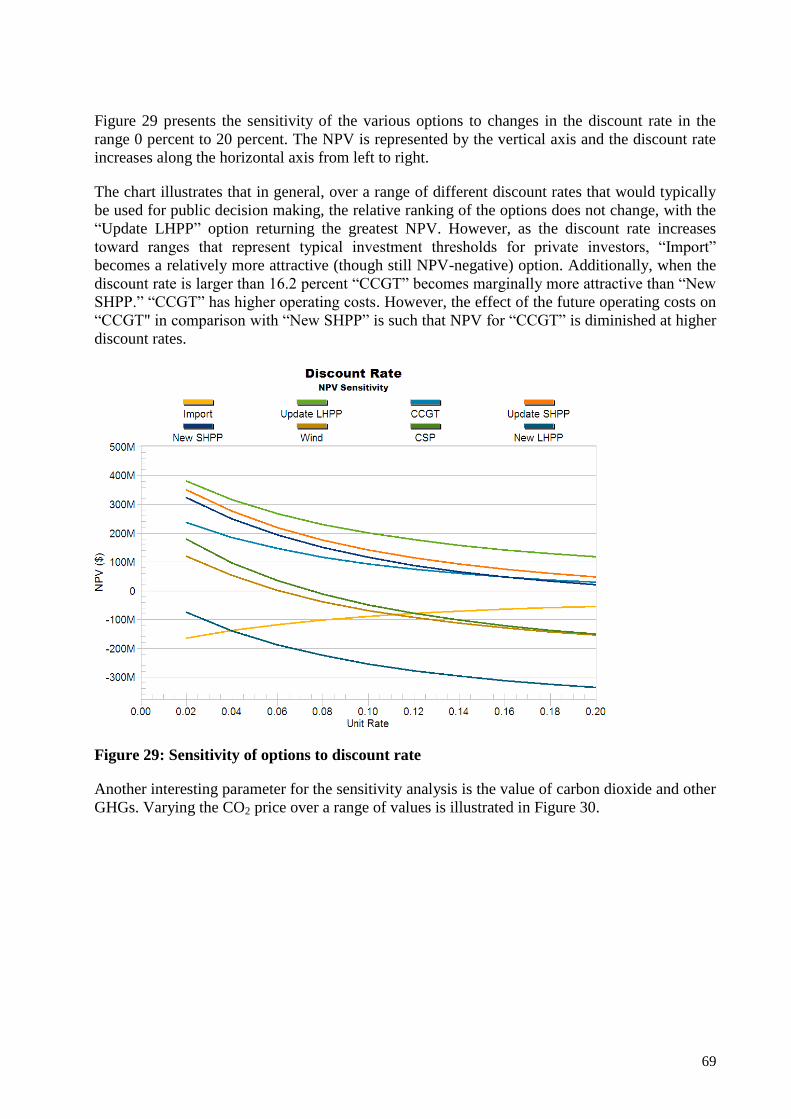
69
Figure 29 presents the sensitivity of the various options to changes in the discount rate in the
range 0 percent to 20 percent. The NPV is represented by the vertical axis and the discount rate
increases along the horizontal axis from left to right.
The chart illustrates that in general, over a range of different discount rates that would typically
be used for public decision making, the relative ranking of the options does not change, with the
―Update LHPP‖ option returning the greatest NPV. However, as the discount rate increases
toward ranges that represent typical investment thresholds for private investors, ―Import‖
becomes a relatively more attractive (though still NPV-negative) option. Additionally, when the
discount rate is larger than 16.2 percent ―CCGT‖ becomes marginally more attractive than ―New
SHPP.‖ ―CCGT‖ has higher operating costs. However, the effect of the future operating costs on
―CCGT" in comparison with ―New SHPP‖ is such that NPV for ―CCGT‖ is diminished at higher
discount rates.
Figure 29: Sensitivity of options to discount rate
Another interesting parameter for the sensitivity analysis is the value of carbon dioxide and other
GHGs. Varying the CO2 price over a range of values is illustrated in Figure 30.
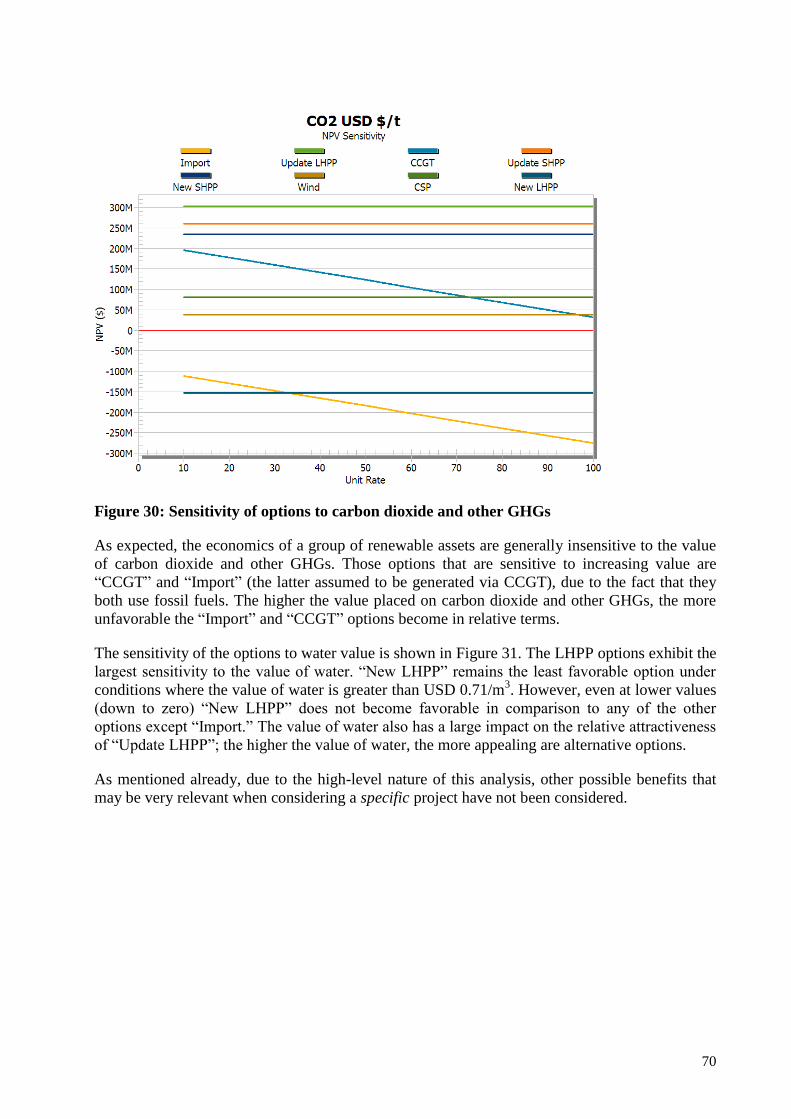
70
Figure 30: Sensitivity of options to carbon dioxide and other GHGs
As expected, the economics of a group of renewable assets are generally insensitive to the value
of carbon dioxide and other GHGs. Those options that are sensitive to increasing value are
―CCGT‖ and ―Import‖ (the latter assumed to be generated via CCGT), due to the fact that they
both use fossil fuels. The higher the value placed on carbon dioxide and other GHGs, the more
unfavorable the ―Import‖ and ―CCGT‖ options become in relative terms.
The sensitivity of the options to water value is shown in Figure 31. The LHPP options exhibit the
largest sensitivity to the value of water. ―New LHPP‖ remains the least favorable option under
conditions where the value of water is greater than USD 0.71/m3. However, even at lower values
(down to zero) ―New LHPP‖ does not become favorable in comparison to any of the other
options except ―Import.‖ The value of water also has a large impact on the relative attractiveness
of ―Update LHPP‖; the higher the value of water, the more appealing are alternative options.
As mentioned already, due to the high-level nature of this analysis, other possible benefits that
may be very relevant when considering a specific project have not been considered.
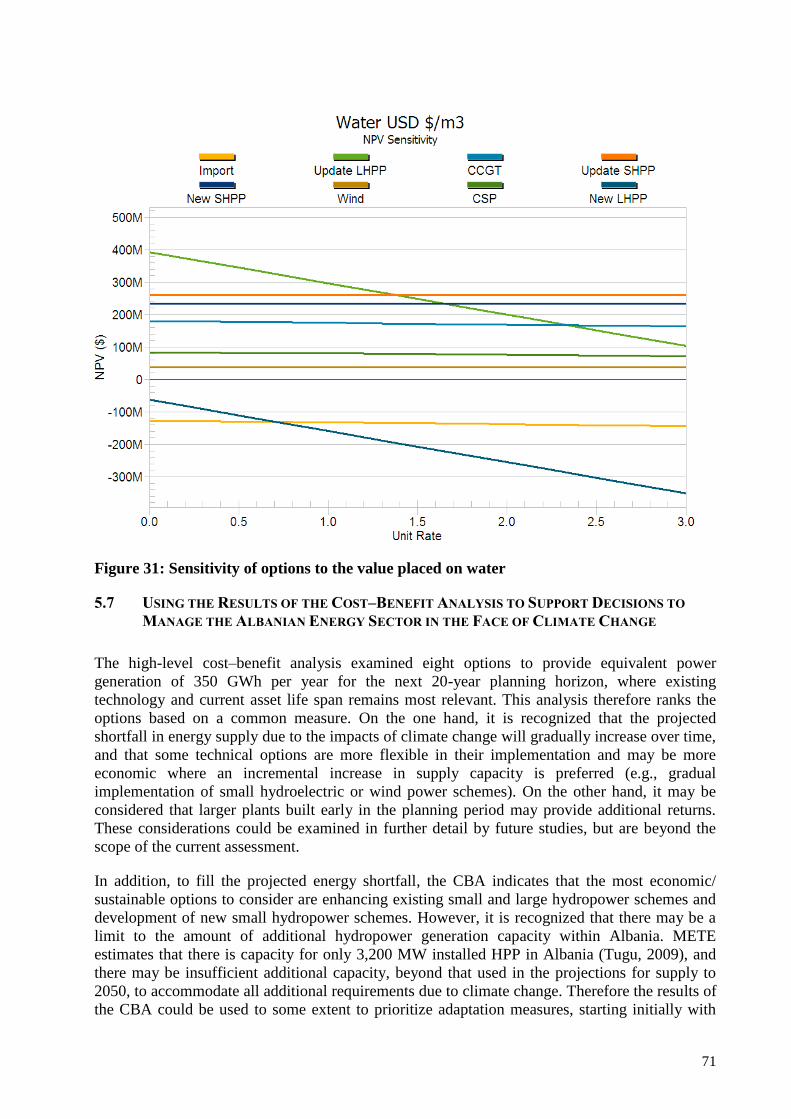
71
Figure 31: Sensitivity of options to the value placed on water
5.7 USING THE RESULTS OF THE COST–BENEFIT ANALYSIS TO SUPPORT DECISIONS TO
MANAGE THE ALBANIAN ENERGY SECTOR IN THE FACE OF CLIMATE CHANGE
The high-level cost–benefit analysis examined eight options to provide equivalent power
generation of 350 GWh per year for the next 20-year planning horizon, where existing
technology and current asset life span remains most relevant. This analysis therefore ranks the
options based on a common measure. On the one hand, it is recognized that the projected
shortfall in energy supply due to the impacts of climate change will gradually increase over time,
and that some technical options are more flexible in their implementation and may be more
economic where an incremental increase in supply capacity is preferred (e.g., gradual
implementation of small hydroelectric or wind power schemes). On the other hand, it may be
considered that larger plants built early in the planning period may provide additional returns.
These considerations could be examined in further detail by future studies, but are beyond the
scope of the current assessment.
In addition, to fill the projected energy shortfall, the CBA indicates that the most economic/
sustainable options to consider are enhancing existing small and large hydropower schemes and
development of new small hydropower schemes. However, it is recognized that there may be a
limit to the amount of additional hydropower generation capacity within Albania. METE
estimates that there is capacity for only 3,200 MW installed HPP in Albania (Tugu, 2009), and
there may be insufficient additional capacity, beyond that used in the projections for supply to
2050, to accommodate all additional requirements due to climate change. Therefore the results of
the CBA could be used to some extent to prioritize adaptation measures, starting initially with

72
upgrading existing facilities, moving on to exploiting remaining small hydroelectric power
opportunities, before consideration of other assets that may be less economic/sustainable.
Important Notes
As noted above, this analysis addresses only a small part of the larger context of the effects of
climate change on Albania‘s energy sector. Additionally the high-level nature of the assessment
means that in specific situations the results of a CBA could be different. Several constraints and
limitations on the CBA are worth mentioning.
First, the environmental and social effects of the construction phase for energy assets were not
considered; only the financial aspects. Although the construction of a power plant is a resource-
intensive undertaking, it is difficult to make a general qualification about social and
environmental impacts without studying a specific project. For instance, in some cases the
construction of an equivalent capacity hydropower facility may cause more CO2 emissions than
constructing a thermal power plant, especially during the construction of a dam. However, in
other cases—for instance, if a thermal plant were sited in an environmentally valuable area—its
construction may have the greater impact.
Another issue that is not addressed directly in this economic cost–benefit assessment, but that
would need to be addressed in further analysis, is the political and business climate in Albania.
This includes factors such as Albania‘s ability to attract investment funds and obtain necessary
permitting.
Many of the effects of climate change are seasonal in nature, though this analysis does not
account for this, as the available data on seasonal water flows and energy production are sparse.
However, it is worth noting the range of effects climate change may have on seasonal
performance of energy assets, in particular HPPs. Not only may climate change affect the
quantity of precipitation at any given period of the year, climate change may also influence the
timing of changes. For instance, it was noted by Albanian energy sector stakeholders that
existing SHPPs rely on runoff generated by spring and summer melting of the snow pack in the
mountains. This runoff extends the period that the SHPP are able to operate. Although
insufficient data were available for this assessment to determine the possible changes in
snowmelt, it is anticipated that the timing and rate of spring melt may increase runoff and the
risk of spillover of LHPP dams, which means that less water would be available for power
generation if reservoirs were not sized adequately.
To provide some illustration of the seasonal effects associated with power generation in Albania,
historical monthly river flow rates into the Fierze Reservoir on the Drin River and power
generation in the Drin Cascade were reviewed. Seasonal variations were examined for a
relatively wet year (2006, Figure 32) and a relatively dry year (2007, Figure 33), from datasets
provided by KESH. It should be noted that the flow rate presented on the graphs is the rate of
inflow into Fierze reservoir and that the power generation—Drin total is the combined power
generation for Fierze, Koman, and Vau i Dejes hydropower plants. The demand data presented
are the demand that was met, and not necessarily the demand that may have existed if there had
been unrestricted supply (i.e., had there been no load shedding, demand might have been
greater).
Although it is recognized that operation of dams and power generation from hydropower plants
is potentially complex, a number of observations about the potential impacts of seasonality and
possible future climate change impacts can be made based on these data.
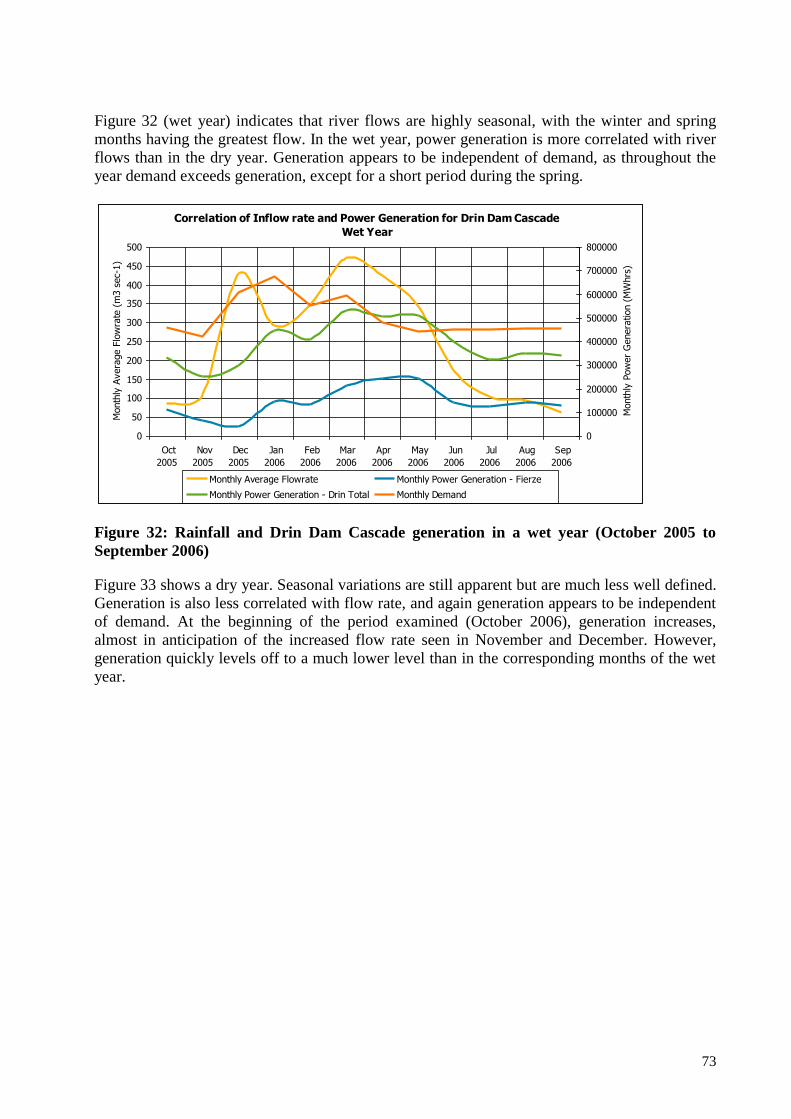
73
Figure 32 (wet year) indicates that river flows are highly seasonal, with the winter and spring
months having the greatest flow. In the wet year, power generation is more correlated with river
flows than in the dry year. Generation appears to be independent of demand, as throughout the
year demand exceeds generation, except for a short period during the spring.
Correlation of Inflow rate and Power Generation for Drin Dam Cascade
Wet Year
0
50
100
150
200
250
300
350
400
450
500
Oct
2005
Nov
2005
Dec
2005
Jan
2006
Feb
2006
Mar
2006
Apr
2006
May
2006
Jun
2006
Jul
2006
Aug
2006
Sep
2006
Month
ly A
vera
ge F
low
rate
(m
3 s
ec-
1)
0
100000
200000
300000
400000
500000
600000
700000
800000
Month
ly P
ow
er
Genera
tion (
MW
hrs
)
Monthly Average Flowrate Monthly Power Generation - Fierze
Monthly Power Generation - Drin Total Monthly Demand
Figure 32: Rainfall and Drin Dam Cascade generation in a wet year (October 2005 to
September 2006)
Figure 33 shows a dry year. Seasonal variations are still apparent but are much less well defined.
Generation is also less correlated with flow rate, and again generation appears to be independent
of demand. At the beginning of the period examined (October 2006), generation increases,
almost in anticipation of the increased flow rate seen in November and December. However,
generation quickly levels off to a much lower level than in the corresponding months of the wet
year.
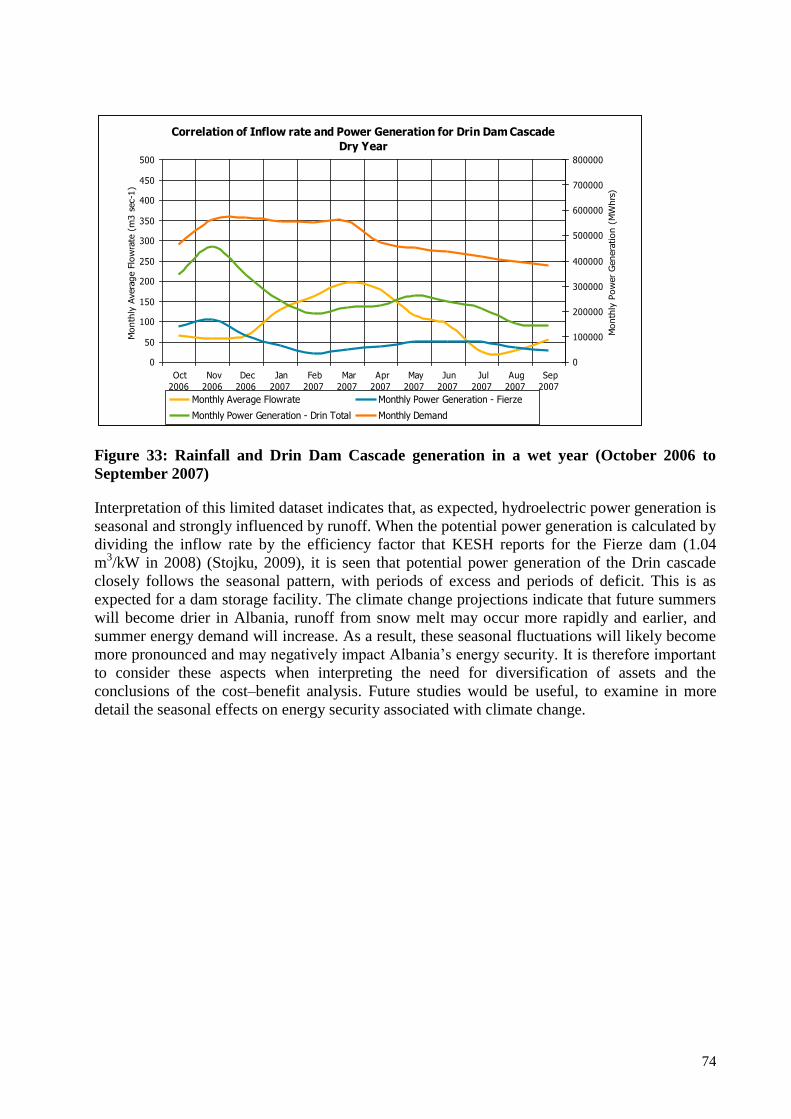
74
Correlation of Inflow rate and Power Generation for Drin Dam Cascade
Dry Year
0
50
100
150
200
250
300
350
400
450
500
Oct
2006
Nov
2006
Dec
2006
Jan
2007
Feb
2007
Mar
2007
Apr
2007
May
2007
Jun
2007
Jul
2007
Aug
2007
Sep
2007
Month
ly A
vera
ge F
low
rate
(m
3 s
ec-1
)
0
100000
200000
300000
400000
500000
600000
700000
800000
Month
ly P
ow
er
Genera
tion (
MW
hrs
)
Monthly Average Flowrate Monthly Power Generation - Fierze
Monthly Power Generation - Drin Total Monthly Demand
Figure 33: Rainfall and Drin Dam Cascade generation in a wet year (October 2006 to
September 2007)
Interpretation of this limited dataset indicates that, as expected, hydroelectric power generation is
seasonal and strongly influenced by runoff. When the potential power generation is calculated by
dividing the inflow rate by the efficiency factor that KESH reports for the Fierze dam (1.04
m3/kW in 2008) (Stojku, 2009), it is seen that potential power generation of the Drin cascade
closely follows the seasonal pattern, with periods of excess and periods of deficit. This is as
expected for a dam storage facility. The climate change projections indicate that future summers
will become drier in Albania, runoff from snow melt may occur more rapidly and earlier, and
summer energy demand will increase. As a result, these seasonal fluctuations will likely become
more pronounced and may negatively impact Albania‘s energy security. It is therefore important
to consider these aspects when interpreting the need for diversification of assets and the
conclusions of the cost–benefit analysis. Future studies would be useful, to examine in more
detail the seasonal effects on energy security associated with climate change.
75
6. NEXT STEPS TO IMPROVE THE CLIMATE RESILIENCE OF ALBANIA’S
ENERGY SECTOR
Given the risks and adaptation actions highlighted in the previous sections, there are a number of
steps that could be considered to build the resilience of Albania‘s energy sector to cope with
climatic variability and change. Many of these are no-regrets actions that would improve
Albania‘s energy security even without climate change, and some are included in the draft
National Energy Strategy active scenario. Many others are generally low cost, though clearly
where financial resources are constrained, even low-cost measures could be difficult to fund.
They fall into the three categories outlined in Section 4:
1. Informational
2. Institutional
3. Physical / technical
The steps, along with suggested timescales for commencing them, are as outlined next. Further
details on these actions are provided in Annex 6. The annex highlights which actions are no-
regrets and which are already included in the draft National Energy Strategy active scenario.
In Year 1, Albania could consider:
Improving meteorological and hydrometeorological monitoring, modeling and forecasting
capabilities, and communicating that information effectively to energy sector stakeholders, to
support energy sector planning and management
Further research on climate change impacts on the energy sector, through downscaling of
global climate model outputs, and researching the impacts of changes in seasonal climate
conditions and extreme climatic events
Initiating dialogue and research with partners in South Eastern Europe to develop a shared
understanding of regional risks from climate change to energy security, and to discuss the
implications for energy prices and trade
Mapping out detailed plans to address issues in Years 2 to 5 and onward
In Year 2, emphasis could be placed on beginning to develop policy, regulatory and other
management options to manage climate risks, including:
Improving and exploiting data on reservoir use, margins and changes in rainfall and runoff,
to improve operational management of existing reservoirs
Developing incentives for energy efficiency measures to reduce demand
Enforcing measures to reduce technical and commercial water and energy losses
Engaging with water users in the agricultural sector, to devise agreed strategies for managing
shared water resources
Incorporating assessments and management of climate risks into energy sector contracts,
environmental impact assessments and other policy instruments for new facilities
Developing tariffs and incentives to promote climate resilience of energy assets
76
Structuring Power Purchase Agreements with neighboring countries that take account of
climate change risks
Reviewing and upgrading Emergency Contingency Plans
Investigating weather coverage and insurance instruments
In Year 5, progress could be made in the following areas:
Ensuring that new energy investments and rehabilitation of existing assets are building in
resilience for projected climate changes
Diversifying energy asset types, taking account of climate change
Reducing technical and commercial losses from the transmission and distribution network
Demonstrating progress on demand-side energy efficiency
Having improved regional interconnections in place, and ensuring that regional partners have
a shared plan in place for regional energy security in the face of climate change
Testing Emergency Contingency Plans
Ensuring that the measures commenced in Years 1 and 2 are making progress and being
implemented successfully
As noted, a number of these actions are already recognized by the government or identified for
action, and are described in the draft National Energy Strategy‘s ―active‖ scenario (Government
of Albania, 2007). Nevertheless, they have been highlighted here because they contribute to
improving climate resilience.
77
7. REFERENCES, ANNEXES, AND APPENDICES
Acclimatise. (2009). Climate change projections for Albania. Acclimatise, UK.
Acclimatise, WorleyParsons, and World Bank. (2009a). World Bank workshop on climate risks
and vulnerabilities of Albania's energy sector: Workshop 1 Report. 10 March 2009, Tirana
International Hotel, Tirana, Albania.
Acclimatise, WorleyParsons, and World Bank. (2009b). World Bank workshop on climate
change vulnerability and adaptation assessment of Albania‘s energy infrastructure: Workshop 2
Report. 21-23 April 2009, Tirana International Hotel, Tirana, Albania.
Bogdani Ndini, M., and Bruci, E. (2008). Assessment of climate change impacts on water
resources in the Vjosa Basin, Institute of Energy, Water and Environment. Tirana, Albania.
Broadleaf Capital International and Marsden Jacob Associates. (2006). Climate Change Impacts
& Risk Management A Guide for Business and Government. Australian Greenhouse Office,
Department of the Environment and Heritage, Australian Government, Canberra, Australia.
Bruci, E. (2008). Climate variability and trends in Albania. IWE, Tirana Polytechnic University,
Tirana, Albania.
Bruci, E. (2009). Climate variability and expected changes in Albania. Presentation at World
Bank workshop on climate risks and vulnerabilities of Albania's energy sector. 10 March 2009,
Tirana International Hotel, Tirana, Albania.
Cerepnalkovski, T., Miller, P., Bajs, D., Majstrovic, G., Mijailovic, S., Vukovic, M., Rusanov,
N. and Gamov, N. (2002). SECI Regional Transmission Planning Study.
CEZ and OSHH. (2009). Annex 11: Regulatory Statement (English).
Department of Natural Resources and Parks, King County, Washington. (2004). Ecological
Economic Evaluation: Maury Island, King County, Washington.
Ebinger, J., Hancock, L., and Tsirkunov, V. (2009). Weather/Climate Services in Europe and
Central Asia: A key tool for energy sector adaptation to climate change. In: Troccoli, A. (ed),
Management of Weather and Climate Risk in the Energy Industry, NATO Science Series,
Springer Academic Publisher, forthcoming.
Electricity Coordinating Center Ltd. and Energy Institute ‖Hrvoje Požar.― (2004). Generation
Investment Study: Transmission network checking, Draft Report, Zagreb.
Energy Regulator of Albania (ERE). (2008). Annual report. Situation of Energy Sector and
activity of ERE for 2008.
European Commission. (2005). South East Europe Electricity options paper, 5 December 2005.
European Commission. (2009). White Paper. Adapting to climate change: Towards a European
framework for action. Brussels, Belgium.
E.U. (2006). European Market Price, 5 Feb 2006. www.pointcarbon.com.
78
Fantozzi, G. pers. comm. (2009). World Bank, Washington, D.C., USA.
Greenley, D. A., Walsh, R. G., and Young, R. A. (1982). Option Value: Empirical Evidence
from a Case Study of Recreation and Water Quality: Reply. Quarterly Journal of Economics,
100 (1): 294–299.
Government of Albania, National Energy Strategy (Draft), 2007.
hHancock, L., and Ebinger, J. (2009). Weather/climate data and the energy sector in Albania.
World Bank, Washington, D.C., USA.
Hardisty, P. E. (2005). The Economics of Environmental Protection: A Middle East Oil and Gas
Industry Perspective. Middle East Economic Survey, 48 (28): 26–30.
Hardisty, P. E., and Ozdemiroglu, E. (2005). The Economics of Groundwater Remediation and
Protection. New York: CRC Press.
Hoxha, F., KESH. pers. comm. (2009). Meetings held as follow-up to Workshop 2 on Climate
Change Vulnerability and Adaptation Assessment of Albania‘s Energy Infrastructure, April
2009.
International Bank for Reconstruction and Development and Hydrometeorological Institute.
(2006). Annex 5.5: Assessment of Economic Benefits of Hydrometeorological Services in
Albania (Interim Report).
International Energy Agency. (2009). Statistical database at www.iea.org.
IPCC. (2007). Climate Change 2007: The Physical Science Basis. Contribution of Working
Group I to the Fourth Assessment Report of the Intergovernmental Panel on Climate Change.
Solomon, S., D. Qin, M. Manning, Z. Chen, M. Marquis, K.B. Averyt, M. Tignor and H.L.
Miller (eds.). Cambridge and New York: Cambridge University Press, 996 pp.
Islami, B., Kamberi, M., Demiraj, E., Fida, E. (2002). The First National Communication of the
Republic of Albania to the United Nations Framework Convention on Climate Change
(UNFCCC). Ministry of Environment, Republic of Albania.
Islami, B., and Bruci, E. (2008). Impacts of Climate Change to the Power Sector and
Identification of the Adaptation Response Measures in the Mati River Catchment‘s Area.
Islami, B. (2009). Current understanding of vulnerabilities of Albania‘s power sector (demand
and supply sides) to climate risks. Presentation at World Bank workshop on climate risks and
vulnerabilities of Albania's energy sector. 10 March 2009, Tirana International Hotel, Tirana,
Albania.
Karagiannis, Ioannic, Petros, C., and Soldatos, G. (2008). Water desalination cost literature:
review and assessment. Desalination, 223, pp 448–456.
Karl, T. R., Melillo, J. M., and Peterson, T.C. (eds.). (2009). Global Climate Change Impacts in
the United States. Cambridge: Cambridge University Press.
79
Kaya, Z. Kurum International. pers. comm. (2009). Meetings held as follow-up to Workshop 2
on Climate Change Vulnerability and Adaptation Assessment of Albania‘s Energy Infrastructure,
April 2009.
KESH, pers. comm. (2008). Meeting at KESH headquarters within scope of project preparation.
Ladenburg, J., and Dubgaard, A. (2007). Willingness to pay for reduced visual disamenities from
offshore wind farms in Denmark. Energy Policy, Elsevier, 35 (8), pp 4059–4071.
Le Goffe, P. (1995). The Benefits of Improvements in Coastal Water Quality: A Contingent
Approach, Journal of Environmental Management 45 (4), pp. 305–317.
Maire Engineering. (2008). EPC of a Combined Cycle Power Plant at Vlore: Environmental
Protection Plan (EPP).
Marcos, M., and Tsimplis, M. N. (2008). Coastal sea level trends in Southern Europe.
Geophysical Journal International, 175, 70–82.
Nakićenović, N., and Swart, R. (eds.). (2000). Special Report on Emissions Scenarios. A Special
Report of Working Group III of the Intergovernmental Panel on Climate Change. Cambridge
University Press, Cambridge, United Kingdom and New York, NY, USA, 599 pp.
Pereira de Lucena, A. F., Szklo, A. S., Salem, A., Schaeffer, R. de Souza, R. R., Borba, B. S. M.
C., da Costa, I.V.L, Junior, A.O.P., da Cunha, S. H. F. (2009). The vulnerability of renewable
energy to climate change in Brazil, Energy Policy, 37: 879–889.
Ponari, A., Ebinger, J., Lim, A. C., and Hancock, L. (2009). Regional Electricity Markets in
South Eastern Europe: Weather and Climate Risk. World Bank, Washington, D.C., USA.
PricewaterhouseCoopers LLC and Atkins International. (2004). Regional Balkans Infrastructure
Study (REBIS)—South East European Generation Investment Study (GIS). Undertaken for the
European Commission within the scope of the European Union‘s CARDS programme—Contract
No. 52276.
Schaeffer, R. de Souza, Szklo, A. S., and Lucena, A. (2009). Climate Change and Energy
Security in Brazil: Understanding the Impact of Climate Change on the Energy Sector.
Presentation at World Bank Energy Week 2009.
Stojku M., KESH. pers. comm. (2009). Meetings held as follow-up to Workshop 1 on Climate
Risks and Vulnerabilities of Albania's Energy Sector, March 2009.
Stern, N. (2006). Review on the Economics of Climate Change, H.M. Treasury, UK.
http://www.sternreview.org.uk.
Sutherland, R. J., and Walsh, R. G. (1985). Effect of Distance on the Preservation Value of
Water Quality. Land Economics.
Tugu, F., METE. pers. comm. (2009). Meetings held and information sent related to Workshop 2
on Climate Change Vulnerability and Adaptation Assessment of Albania‘s Energy Infrastructure,
April 2009.
Tirana Municipality. (2006). Water Supply Services Brochure. www.tirana.gov.al.
80
UK Environment Agency. (2000). Research and Development Paper P279.
UNEP. (2000). Post-conflict environmental assessment—Albania. United Nations Environment
Programme, Switzerland.
UNEP. (2001). The Value of Forest Ecosystems.
Wade, N. M. (2001). Distillation Plant Development and Cost Update. Desalination, 136, pp 3-
12.
WeatherBill Inc. (2009). Protecting Profits with Weather Coverage, New Solutions for
Hydroelectric Companies and Water Districts, March 27, 2009.
Willows, R. I., and Connell, R.K. (eds.) (2003). Climate adaptation: Risk, uncertainty and
decision-making. UKCIP Technical Report. UKCIP, Oxford, UK.
World Bank. (2003). Water Resources in Europe and Central Asia: Volume II. Country and
Water Notes and Selected Transboundary Basins. Washington, D.C., USA.
World Bank. (2008a). Development and Climate Change, A Strategic Framework for the World
Bank Group.
World Bank. (2008b). Project Appraisal Document on a Proposed Credit in the amount of SDR
21.7 million (US$35.3 million equivalent) to Albania for a Dam Safety Project (Phase 5) in
support of the South East Europe APL Program. World Bank.
World Bank. (2008c). The World Bank Group‘s Catastrophe Risk Financing Products and
Services, July 2008.
World Bank. (2009a).World Development Indicators. World Bank, Washington, D.C., USA.
World Bank. (2009b). Project Appraisal Document on a Proposed Loan in the Amount of Eur
2.0 million (US$3.0 million equivalent) and a Proposed credit in the amount of SDR 3.8 million
(US$6.16 million equivalent) to Albania for a Disaster Risk Mitigation and Adaptation Project,
May 23, 2009, Report No. 43380-AL.
World Bank. (2009c). Climate Change and Agriculture: Albania Country Note (Draft for
Discussion). Washington, D.C., USA.
World Bank. (2009d). Adapting to Climate Change in Europe and Central Asia. Washington,
D.C., USA.
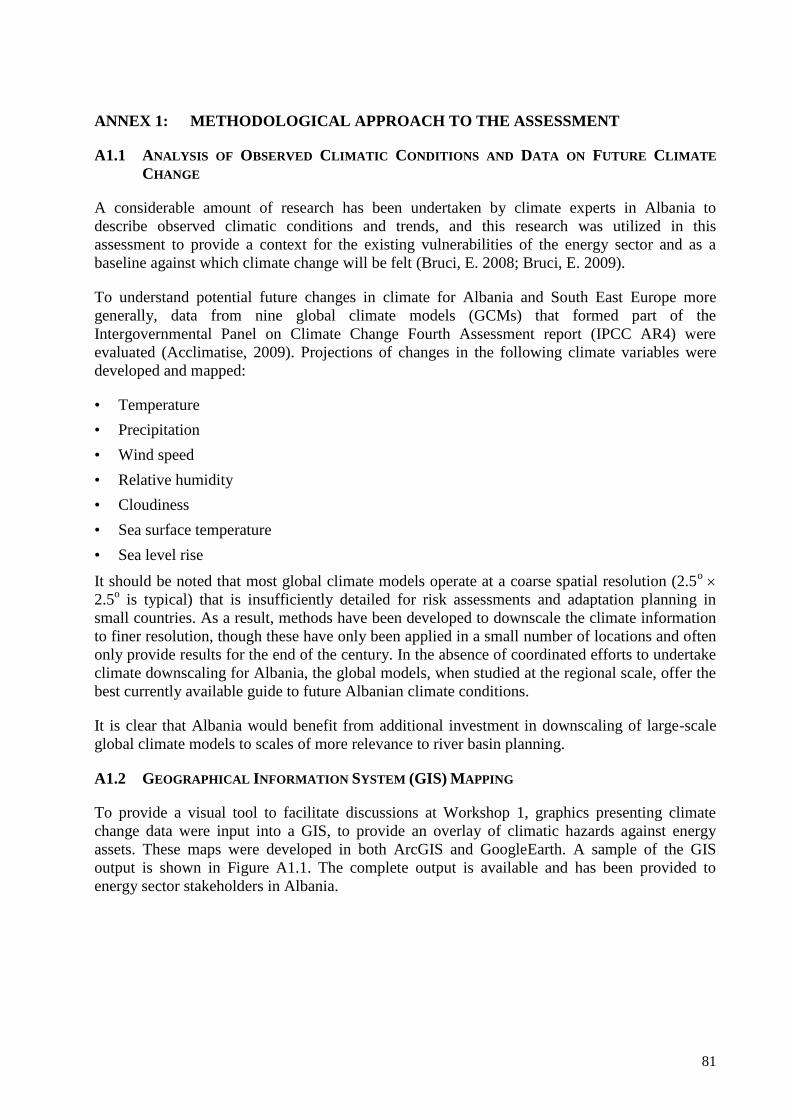
81
ANNEX 1: METHODOLOGICAL APPROACH TO THE ASSESSMENT
A1.1 ANALYSIS OF OBSERVED CLIMATIC CONDITIONS AND DATA ON FUTURE CLIMATE
CHANGE
A considerable amount of research has been undertaken by climate experts in Albania to
describe observed climatic conditions and trends, and this research was utilized in this
assessment to provide a context for the existing vulnerabilities of the energy sector and as a
baseline against which climate change will be felt (Bruci, E. 2008; Bruci, E. 2009).
To understand potential future changes in climate for Albania and South East Europe more
generally, data from nine global climate models (GCMs) that formed part of the
Intergovernmental Panel on Climate Change Fourth Assessment report (IPCC AR4) were
evaluated (Acclimatise, 2009). Projections of changes in the following climate variables were
developed and mapped:
• Temperature
• Precipitation
• Wind speed
• Relative humidity
• Cloudiness
• Sea surface temperature
• Sea level rise
It should be noted that most global climate models operate at a coarse spatial resolution (2.5o
2.5o is typical) that is insufficiently detailed for risk assessments and adaptation planning in
small countries. As a result, methods have been developed to downscale the climate information
to finer resolution, though these have only been applied in a small number of locations and often
only provide results for the end of the century. In the absence of coordinated efforts to undertake
climate downscaling for Albania, the global models, when studied at the regional scale, offer the
best currently available guide to future Albanian climate conditions.
It is clear that Albania would benefit from additional investment in downscaling of large-scale
global climate models to scales of more relevance to river basin planning.
A1.2 GEOGRAPHICAL INFORMATION SYSTEM (GIS) MAPPING
To provide a visual tool to facilitate discussions at Workshop 1, graphics presenting climate
change data were input into a GIS, to provide an overlay of climatic hazards against energy
assets. These maps were developed in both ArcGIS and GoogleEarth. A sample of the GIS
output is shown in Figure A1.1. The complete output is available and has been provided to
energy sector stakeholders in Albania.
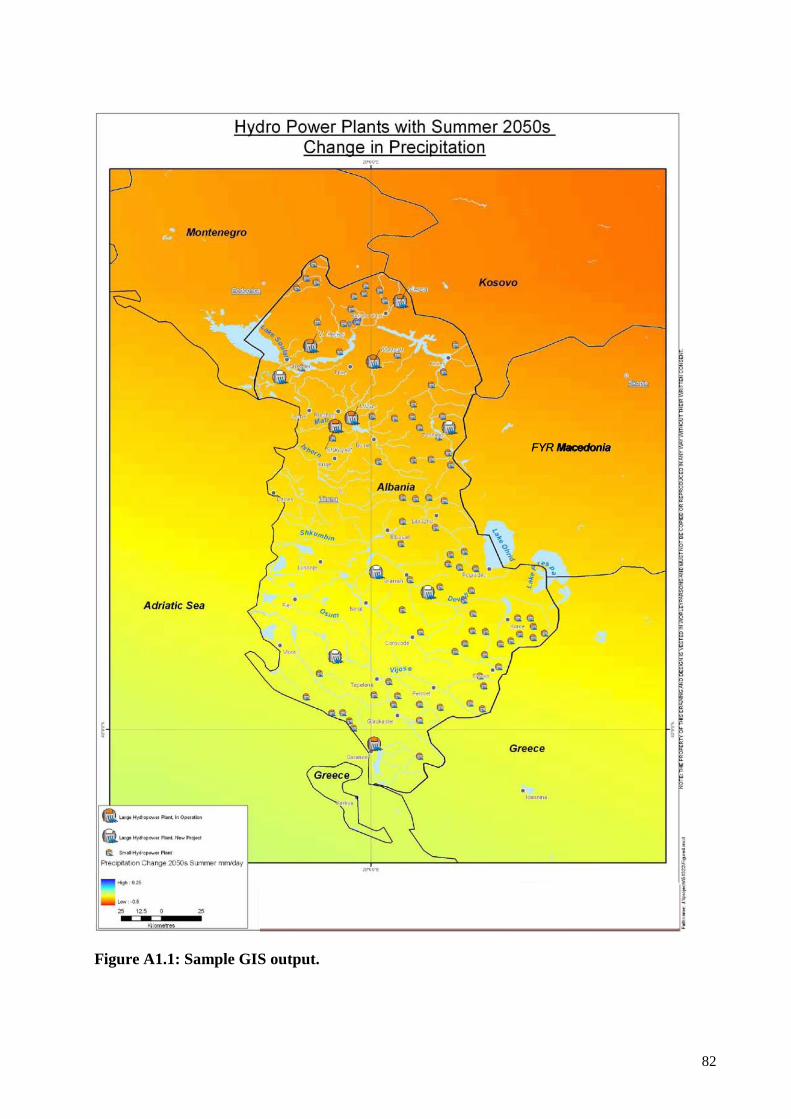
82
Figure A1.1: Sample GIS output.

83
A1.3 WORKSHOP 1: HANDS-ON VULNERABILITY, RISK, AND SWOT ANALYSES WITH
ENERGY SECTOR STAKEHOLDERS IN ALBANIA
A first workshop discussed climate risks and vulnerabilities of Albania‘s energy sector, leading
to the development of SWOT (strengths, weaknesses, opportunities and threats) analyses
(Acclimatise et al., 2009a). It was held on March 10, 2009, and brought together more than 60
key stakeholders in Albania‘s energy sector, including government ministries and agencies,
utilities and corporations, private companies, expert consultants, university academics and
NGOs, as well as energy sector experts from the World Bank and other international
organizations. The objective of the workshop was to develop a shared understanding among
these stakeholders of the climate risks and vulnerabilities of Albania‘s energy sector.
The workshop was opened by Ms. Camille Nuamah (World Bank), Dr. Suzana Guxholli
(Council of Ministers), and H. E. Lufter Xhuvelli (Minister of Environment, Forests and Water
Administration).
Plenary sessions were followed by four breakout group discussions on various aspects of
Albania‘s energy sector that could be vulnerable to climate risks:
1. Hydropower plants and energy demand
2. Other forms of energy generation: thermal power plants and renewable energy
3. Electricity transmission and distribution and small hydropower plants
4. Fossil fuel supply and transmission / transportation
Each of these working groups focused their discussions around three key areas:
1. Overall strategies and objectives for Albania‘s energy sector
2. Climatic vulnerabilities of existing and planned energy sector assets
3. Climate change risks
A Business Risk Pathways Model was used in the workshop to help facilitate working group
discussions. This took the form of a diagram presenting the linkages between changing climate
hazards and their consequences for the performance of the energy sector (Figure A1.2). This tool
was subsequently used to provide the criteria for assessing the significance of climate change
risks to the energy sector (see Annex 2 for further details). Building on the outcomes of the
workshop and meetings, SWOT analyses were developed for each of the breakout group themes.
Directly after the first workshop, meetings were held with energy-sector experts from
government, the private sector, research and academic institutions and NGOs, at which the risks
and vulnerabilities identified during the workshop were discussed in greater depth.
84
Figure A1.2: Acclimatise Business Risk Pathways Model, adapted for Workshop 1.
85
A1.4 ANALYSIS OF CLIMATE RISKS FOR REGIONAL ENERGY MARKETS IN SOUTH EAST
EUROPE
Albania‘s draft National Energy Strategy (2007) places emphasis on Albania increasing energy
trade with its neighbors in South East Europe as a way of helping with security of energy supply.
Hydropower is widely used throughout the region, and the climate change projections indicate
that the whole region could experience higher temperatures and reduced summer precipitation in
future. However, it is not clear that all parts of the region would experience wet or dry seasons or
years at the same time. A brief analysis of energy generation types across the region was
undertaken, considering how climate risks could affect them and questioning whether careful
selection of an ensemble of hydropower investments could help to diversify risk (Ponari et al.,
2009).
A1.5 DEVELOPMENT OF HIGH-LEVEL QUALITATIVE AND QUANTITATIVE ASSESSMENTS OF
CLIMATE CHANGE RISKS TO ENERGY ASSETS
While the first workshop and associated meetings were helpful in identifying the key risks and
vulnerabilities of the energy sector, it was not possible within the time available at the
workshops and meetings to develop high-level quantitative estimates of the risks to each energy
asset type, nor was it achievable to evaluate the significance of each of the risks. These estimates
were required as input to the CBA. Instead, high-level quantitative estimates of risk and risk
ratings were developed based on engineering expertise and a review of relevant literature.
Estimating climate change impacts on hydropower plants and other energy assets
An in-depth approach to quantifying the impacts posed by climate change for large hydropower
plants (LHPP) would involve hydrological modeling using downscaled climate change scenarios,
and subsequent modeling of the impacts of changes in river flows on hydropower plant output.
However, this approach would take considerable research effort and time, which is beyond the
scope of this high-level assessment. Instead, quantitative estimates were developed drawing on
the following information and data:
Modeling of the relationships between changes in climate (precipitation and temperature) and
changes in river flows for several catchments Albania (Islami et al., 2002; Bogdani and
Bruci, 2008; Islami and Bruci, 2008)
A correlation undertaken of annual average inflows to Fierze hydropower plant on the Drin
Cascade (Annex 8) and consequent electricity generation, together with a similar correlation
for power production from LHPP on the Mati River (Islami and Bruci, 2008)
Recent research undertaken in Brazil, which used regional climate modeling data to project
impacts on output from Brazil‘s hydropower plants (Pereira de Lucena et al., 2009; Schaeffer
et al., 2009)
These information sources were analyzed and a paper was produced, providing a high-level
estimate of climate change impacts on generation from LHPP (Annex 8). This estimate was
subsequently used in the cost–benefit analysis.
Estimates of the climate change impacts on other energy assets were developed drawing on
climatological and engineering expertise and on the relationships between climatic factors and
asset performance (Annex 9). In some cases, the relationships between average climatic
86
conditions and energy assets are straightforward and well-established in the engineering sector
(e.g., impacts of increases in temperature on efficiencies of gas turbines).
It is worth noting again that it is not the purpose of this analysis to assess in detail all of the
impacts of climate change on Albania‘s energy sector. Instead, this analysis provides high-level
(semi-quantitative) assessments to identify key risk areas where subsequent more in-depth
analyses could be focused. In particular, data are not available on future changes in extreme
climatic events, which could have significant consequences for the sector. Furthermore,
knowledge and data on the detailed design characteristics of Albania‘s energy assets, particularly
in relation to proposed new assets, would be needed.
Evaluating the Significance of Risks
The significance of a risk is rated according to the probability of a hazard occurring and the
magnitude of its consequence. A risk rating system for Albania‘s energy sector was developed
using the tool presented in Figure A1.2. This rating system is detailed in Annex 2, Tables A2.1
and A2.2.
Drawing on the quantitative estimates described, and using expert judgement, a desk-based
exercise was undertaken to assign a rating to each of the risks. These ratings were tested and
revised in collaboration with stakeholders during the second workshop. The resultant risk maps
are presented in Annex 2, Tables A2.3 and A2.4. Further detail is provided in Sections 3 and 4.
A1.6 WORKSHOP 2: ADAPTATION AND COST–BENEFIT ANALYSIS WITH ENERGY SECTOR
STAKEHOLDERS IN ALBANIA
A second workshop and associated meetings, held on April 21–23, 2009, discussed adaptation
measures to address the potential risks and vulnerabilities identified in the first workshop, and set
out the framework for an assessment of their costs and benefits (Acclimatise et al., 2009b).
Workshop participants included a cross-section of more than 25 stakeholders from the
government, key agencies and institutions, academia, the private sector and NGOs.
The second workshop involved five steps:
1. Agreeing the objective for the cost–benefit analysis of the energy sector
2. Confirming the key risks posed by climate change
3. Agreeing the boundaries / limits and constraints of the CBA
4. Identifying adaptation options to meet the objective
5. Discussing the range of parameters to be used to evaluate the performance of adaptation
options in the CBA
The workshop agreed that the objective of the high-level CBA was to address the following
question:
―How can we best manage Albania’s future security of energy supply in the face of a
changing climate?‖
87
Best was defined as ―an optimal balance between financial, environmental and social
objectives.‖
The workshop also agreed on the key adaptation option to be assessed as part of the CBA,
namely, diversification of power generation assets. It was confirmed that the CBA would be a
high-level assessment, utilizing readily available data and international normative valuations for
selected aspects. Additional detailed study of external costs and benefits was excluded from the
scope. Constraints associated with implementation of possible adaptation options were also
discussed, such as the limits of potential capacity for additional hydropower in Albania and
availability of fuel for thermal power plants, as well as key parameters that should be considered
when undertaking the CBA, including costs of carbon dioxide emissions and economic value of
water.
Directly after the workshop, further meetings were held with energy sector stakeholders from
government, the private sector, research and academic institutions, and NGOs, during which the
parameters for evaluating the adaptation options in the CBA were prioritized, and data on costs
and benefits were obtained. In addition, a meeting was held with a group of engineering students,
to consult on the assessment and hear their opinions about the most important parameters for the
cost–benefit analysis.
Following from the workshop and meetings, the CBA approach and options to be assessed were
further refined to provide the most value as an output from this assessment.
A1.7 HIGH-LEVEL COST–BENEFIT ANALYSIS (CBA)
As already outlined, during the second workshop, stakeholders discussed how the Albanian
energy sector could be adapted to manage the potential risks to energy security from a changing
climate. The CBA aimed to assess key sustainable development aspects (i.e., financial, social,
and environmental aspects) that could be considered when assessing the optimal way in which
adaptation could be implemented.
An economic model for assessing the benefits of environmental and social protection has been
presented in Hardisty and Ozdemiroglu (2005). The WorleyParsons EcoNomics™ process that is
based on this method was used. It explicitly describes and measures sustainability aspects in
economic terms, by monetizing external costs and benefits and adding these to the conventional
internal or private costs and benefits of a proposed project or action. Economic theory was then
used to calculate the net present value (dollar value in today‘s money) of options that incur costs
and benefits over a period of time (the planning horizon). This cost–benefit analysis approach is
the basis upon which analyses of the adaptation options have been carried out (see Section 5).
While the WorleyParsons EcoNomics™ process was used for this assessment, the approach is
repeatable using standard methods.
A more detailed explanation of the CBA process is provided in Annex 5.

88
ANNEX 2 RISK ASSESSMENT BACKGROUND AND RATIONALE
Table A2.1: Scale for Assessing Likelihood of Occurrence of Hazard
Likelihood Category
E D C B A
Rare Unlikely Moderate Likely Almost certain
Highly unlikely
to occur
Given current
practices and
procedures, this
incident is
unlikely to
occur
Incident has
occurred in a
similar country
/ setting
Incident is
likely to occur
Incident is very
likely to occur,
possibly several
times
OR
5% chance of
occurring per
year
20% chance of
occurring per
year
50% chance of
occurring per
year
80% chance of
occurring per
year
95% chance of
occurring per
year
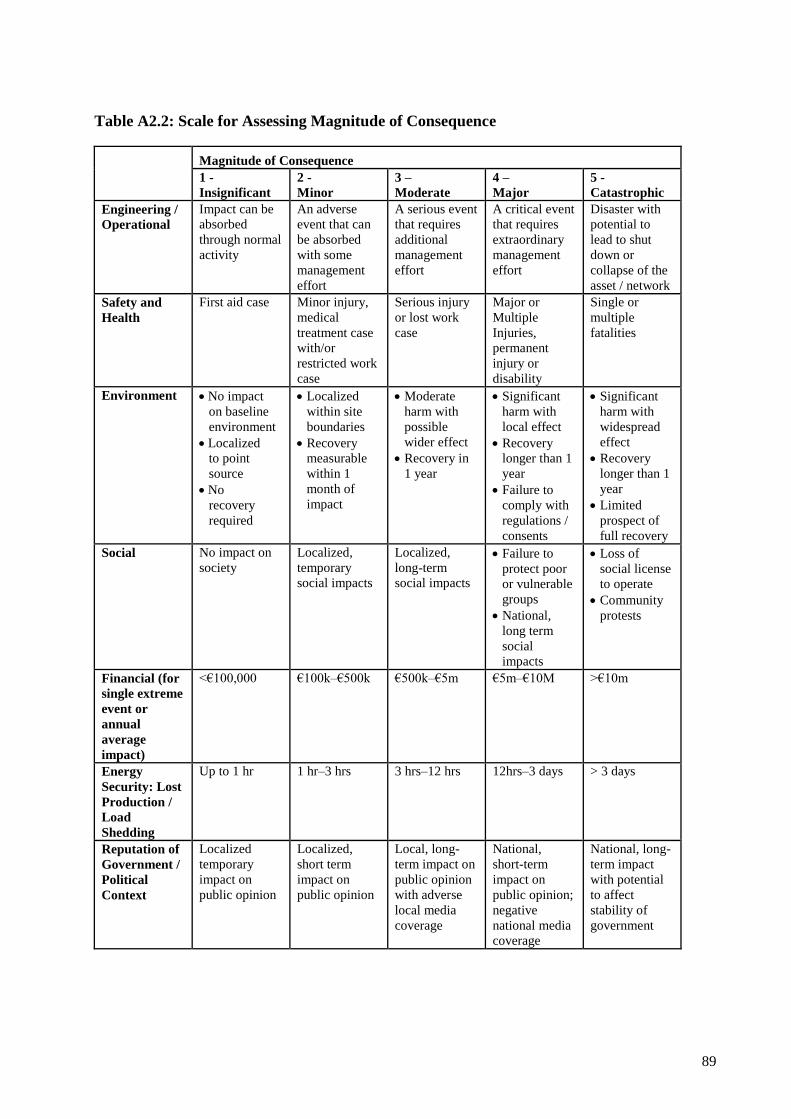
89
Table A2.2: Scale for Assessing Magnitude of Consequence
Magnitude of Consequence
1 -
Insignificant
2 -
Minor
3 –
Moderate
4 –
Major
5 -
Catastrophic
Engineering /
Operational
Impact can be
absorbed
through normal
activity
An adverse
event that can
be absorbed
with some
management
effort
A serious event
that requires
additional
management
effort
A critical event
that requires
extraordinary
management
effort
Disaster with
potential to
lead to shut
down or
collapse of the
asset / network
Safety and
Health
First aid case Minor injury,
medical
treatment case
with/or
restricted work
case
Serious injury
or lost work
case
Major or
Multiple
Injuries,
permanent
injury or
disability
Single or
multiple
fatalities
Environment No impact
on baseline
environment
Localized
to point
source
No
recovery
required
Localized
within site
boundaries
Recovery
measurable
within 1
month of
impact
Moderate
harm with
possible
wider effect
Recovery in
1 year
Significant
harm with
local effect
Recovery
longer than 1
year
Failure to
comply with
regulations /
consents
Significant
harm with
widespread
effect
Recovery
longer than 1
year
Limited
prospect of
full recovery
Social No impact on
society
Localized,
temporary
social impacts
Localized,
long-term
social impacts
Failure to
protect poor
or vulnerable
groups
National,
long term
social
impacts
Loss of
social license
to operate
Community
protests
Financial (for
single extreme
event or
annual
average
impact)
<€100,000 €100k–€500k €500k–€5m €5m–€10M >€10m
Energy
Security: Lost
Production /
Load
Shedding
Up to 1 hr 1 hr–3 hrs 3 hrs–12 hrs 12hrs–3 days > 3 days
Reputation of
Government /
Political
Context
Localized
temporary
impact on
public opinion
Localized,
short term
impact on
public opinion
Local, long-
term impact on
public opinion
with adverse
local media
coverage
National,
short-term
impact on
public opinion;
negative
national media
coverage
National, long-
term impact
with potential
to affect
stability of
government

90
Table A2.3: Risk Mapping (Before Adaptation)
Consequence
Insignificant Minor Moderate Major Catastrophic
1 2 3 4 5
Lik
elih
oo
d
A Almost
Certain 95%
16 6 3 4 7 1 2
B Likely 80%
19 15 10 11 12
13 14
5
C Moderate 50%
18 8 9
D Unlikely 20%
17
E Rare 5%
20
Table A2.4: Risk Mapping (After Adaptation)
Consequence
Insignificant Minor Moderate Major Catastrophic
1 2 3 4 5
Lik
elih
oo
d
A Almost
Certain 95%
B Likely 80%
5
C Moderate 50%
16 19 4 15 2 3 6 13
14
D Unlikely 20%
1 7 8 12
17 18
10 11
E Rare 5%
9 20
Note: The risks are presented in the maps above using the ―Risk Code No.‖ noted on Table 3.
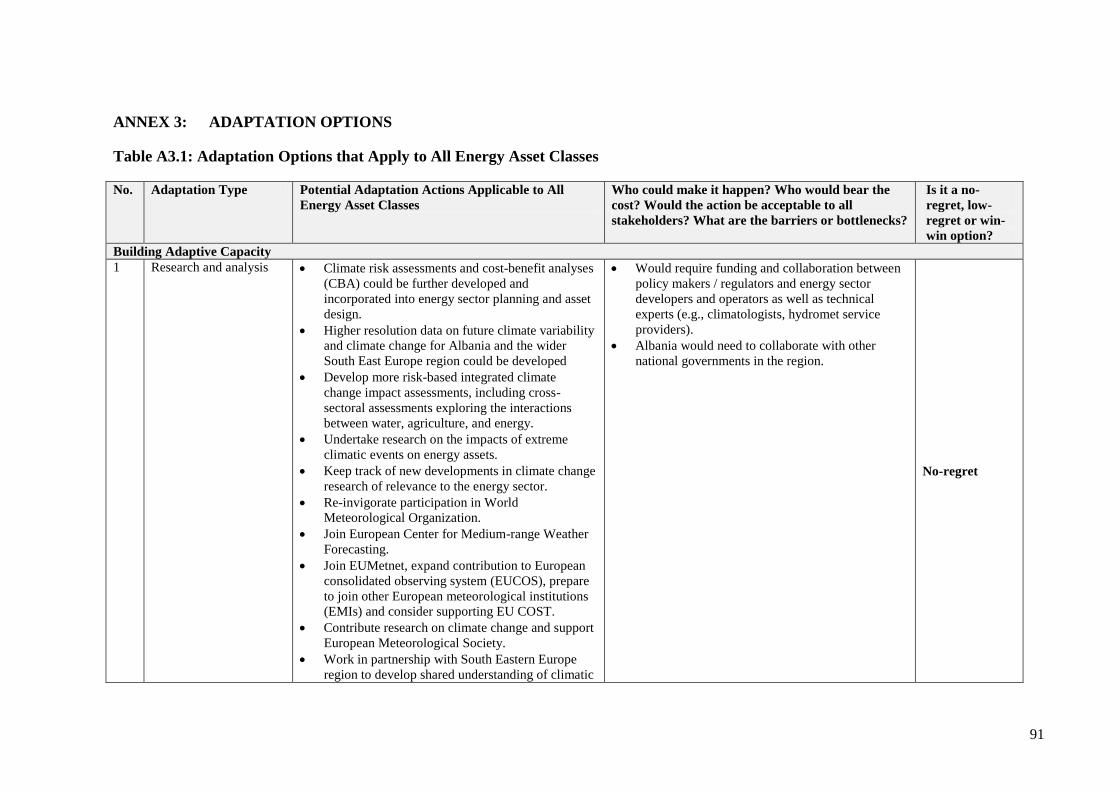
91
ANNEX 3: ADAPTATION OPTIONS
Table A3.1: Adaptation Options that Apply to All Energy Asset Classes
No. Adaptation Type Potential Adaptation Actions Applicable to All
Energy Asset Classes
Who could make it happen? Who would bear the
cost? Would the action be acceptable to all
stakeholders? What are the barriers or bottlenecks?
Is it a no-
regret, low-
regret or win-
win option?
Building Adaptive Capacity
1 Research and analysis Climate risk assessments and cost-benefit analyses
(CBA) could be further developed and
incorporated into energy sector planning and asset
design.
Higher resolution data on future climate variability
and climate change for Albania and the wider
South East Europe region could be developed
Develop more risk-based integrated climate
change impact assessments, including cross-
sectoral assessments exploring the interactions
between water, agriculture, and energy.
Undertake research on the impacts of extreme
climatic events on energy assets.
Keep track of new developments in climate change
research of relevance to the energy sector.
Re-invigorate participation in World
Meteorological Organization.
Join European Center for Medium-range Weather
Forecasting.
Join EUMetnet, expand contribution to European
consolidated observing system (EUCOS), prepare
to join other European meteorological institutions
(EMIs) and consider supporting EU COST.
Contribute research on climate change and support
European Meteorological Society.
Work in partnership with South Eastern Europe
region to develop shared understanding of climatic
Would require funding and collaboration between
policy makers / regulators and energy sector
developers and operators as well as technical
experts (e.g., climatologists, hydromet service
providers).
Albania would need to collaborate with other
national governments in the region.
No-regret

92
No. Adaptation Type Potential Adaptation Actions Applicable to All
Energy Asset Classes
Who could make it happen? Who would bear the
cost? Would the action be acceptable to all
stakeholders? What are the barriers or bottlenecks?
Is it a no-
regret, low-
regret or win-
win option?
vulnerabilities and risks, and their implications for
regional energy security, pricing and trade.
2 Data collection and
monitoring Monitor impacts of climatic factors on energy
sector performance.
Continuously monitor and update regional weather
and water resource availability.
Monitor and forecast regional energy demand and
availability of shared energy from regional
sources, and hydropower available within Albania
that draws on shared resources (e.g., Lake Ohrid)
that could be affected by upstream energy users.
Share weather monitoring and forecasting data
between Institute or Energy, Water and the
Environment, Military Weather Services and the
National Air Traffic Agency.
Repair and adapt existing automated climate
stations to provide continuous reporting, using for
example solar panels to power them.
Share data regionally in return for regional
information exchange. Data on precipitation and
runoff could be shared with regional neighbors,
given that Albania‘s rivers are shared with Greece,
Macedonia and Kosovo.
Reestablish monitoring and analysis of the
watersheds. At the moment, seasonality of the flow
and its trends are unclear. Contingency planning
could be less expensive if this information were
available.
Government (including Ministry of Environment),
KESH and hydromet service providers.
Would require collaboration internationally.
Would need funding for participation in regional
meteorological collaborative efforts, membership
in, for instance, ECMWF, EUMetsat, EUMetnet
and ICEED.
Funding would be a potential barrier, together with
loss of hydromet capacity
No-regret
3 Changing or developing
regulations, standards,
codes, etc.
Consider amending regulations to require
developers to consider climate change in proposals
and energy sector contracts
Develop tariffs and incentives to promote climate
resilience of energy sector.
METE, Ministry of Environment and ERE.
Barriers: would require developers to have access
to information on climate change (above), and to
be able to interpret this data (i.e. must be tailored
to users); it would require regulators to be
Low-regret
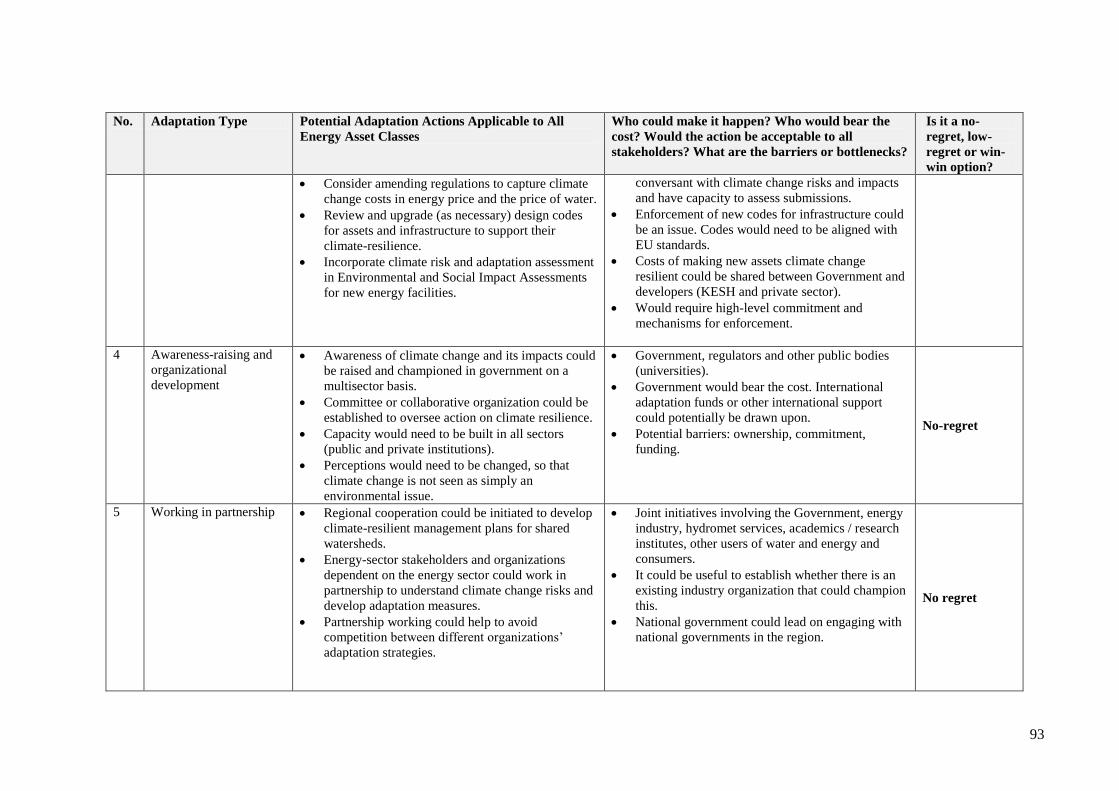
93
No. Adaptation Type Potential Adaptation Actions Applicable to All
Energy Asset Classes
Who could make it happen? Who would bear the
cost? Would the action be acceptable to all
stakeholders? What are the barriers or bottlenecks?
Is it a no-
regret, low-
regret or win-
win option?
Consider amending regulations to capture climate
change costs in energy price and the price of water.
Review and upgrade (as necessary) design codes
for assets and infrastructure to support their
climate-resilience.
Incorporate climate risk and adaptation assessment
in Environmental and Social Impact Assessments
for new energy facilities.
conversant with climate change risks and impacts
and have capacity to assess submissions.
Enforcement of new codes for infrastructure could
be an issue. Codes would need to be aligned with
EU standards.
Costs of making new assets climate change
resilient could be shared between Government and
developers (KESH and private sector).
Would require high-level commitment and
mechanisms for enforcement.
4 Awareness-raising and
organizational
development
Awareness of climate change and its impacts could
be raised and championed in government on a
multisector basis.
Committee or collaborative organization could be
established to oversee action on climate resilience.
Capacity would need to be built in all sectors
(public and private institutions).
Perceptions would need to be changed, so that
climate change is not seen as simply an
environmental issue.
Government, regulators and other public bodies
(universities).
Government would bear the cost. International
adaptation funds or other international support
could potentially be drawn upon.
Potential barriers: ownership, commitment,
funding.
No-regret
5 Working in partnership Regional cooperation could be initiated to develop
climate-resilient management plans for shared
watersheds.
Energy-sector stakeholders and organizations
dependent on the energy sector could work in
partnership to understand climate change risks and
develop adaptation measures.
Partnership working could help to avoid
competition between different organizations‘
adaptation strategies.
Joint initiatives involving the Government, energy
industry, hydromet services, academics / research
institutes, other users of water and energy and
consumers.
It could be useful to establish whether there is an
existing industry organization that could champion
this.
National government could lead on engaging with
national governments in the region.
No regret
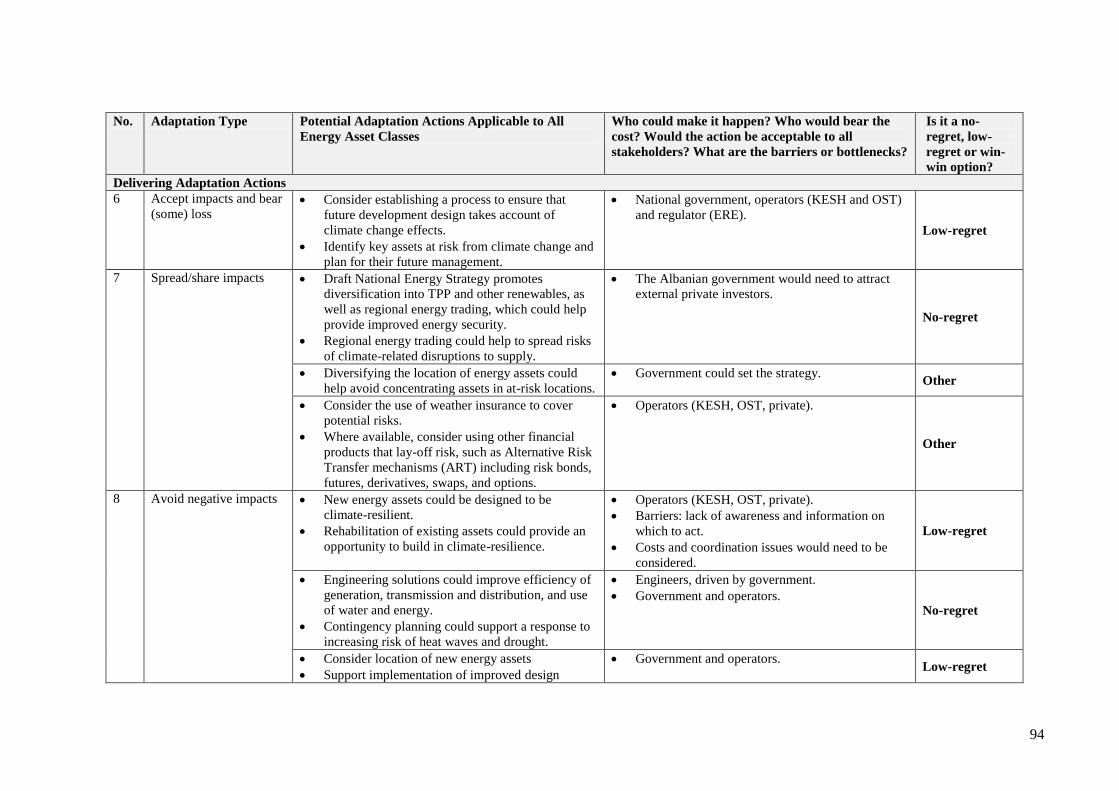
94
No. Adaptation Type Potential Adaptation Actions Applicable to All
Energy Asset Classes
Who could make it happen? Who would bear the
cost? Would the action be acceptable to all
stakeholders? What are the barriers or bottlenecks?
Is it a no-
regret, low-
regret or win-
win option?
Delivering Adaptation Actions
6 Accept impacts and bear
(some) loss
Consider establishing a process to ensure that
future development design takes account of
climate change effects.
Identify key assets at risk from climate change and
plan for their future management.
National government, operators (KESH and OST)
and regulator (ERE).
Low-regret
7 Spread/share impacts
Draft National Energy Strategy promotes
diversification into TPP and other renewables, as
well as regional energy trading, which could help
provide improved energy security.
Regional energy trading could help to spread risks
of climate-related disruptions to supply.
The Albanian government would need to attract
external private investors.
No-regret
Diversifying the location of energy assets could
help avoid concentrating assets in at-risk locations.
Government could set the strategy. Other
Consider the use of weather insurance to cover
potential risks.
Where available, consider using other financial
products that lay-off risk, such as Alternative Risk
Transfer mechanisms (ART) including risk bonds,
futures, derivatives, swaps, and options.
Operators (KESH, OST, private).
Other
8 Avoid negative impacts
New energy assets could be designed to be
climate-resilient.
Rehabilitation of existing assets could provide an
opportunity to build in climate-resilience.
Operators (KESH, OST, private).
Barriers: lack of awareness and information on
which to act.
Costs and coordination issues would need to be
considered.
Low-regret
Engineering solutions could improve efficiency of
generation, transmission and distribution, and use
of water and energy.
Contingency planning could support a response to
increasing risk of heat waves and drought.
Engineers, driven by government.
Government and operators. No-regret
Consider location of new energy assets
Support implementation of improved design
Government and operators. Low-regret

95
No. Adaptation Type Potential Adaptation Actions Applicable to All
Energy Asset Classes
Who could make it happen? Who would bear the
cost? Would the action be acceptable to all
stakeholders? What are the barriers or bottlenecks?
Is it a no-
regret, low-
regret or win-
win option?
standards for new assets
Continue the existing efforts to improve efficient
use of water resources in the agriculture sector,
and reduce technical and commercial water losses.
Government and farmers.
Win-win
9 Exploit opportunities
Climate models are generally in good agreement
over Albania regarding changes in temperature and
summer precipitation, providing a useful basis for
analysis of sensitivities of energy assets and
development of climate resilience.
There is significant potential to improve energy
efficiency (demand and supply side).
Government could set standards for energy
efficiency.
Barriers: funding and enforcement. No-regret
Identify and consider developing energy
technologies that are favored by future climate
change conditions, e.g., increased solar potential
due to increased sunshine hours.
Asset developers (KESH and private sector.
Low-regret
TPP are not as climatically vulnerable as many
other forms of energy generation.
Government could set the strategy.
Delivered by operators (KESH and private). Other
Table A3.2: Adaptation options—Energy Demand and Demand-side Energy Efficiency
No. Adaptation Type Potential Adaptation Actions for Energy Demand
and Demand-Side Efficiency
Who could make it happen? Who would bear the
cost? Would the action be acceptable to all
stakeholders? What are the barriers or bottlenecks?
Is it a no-regret,
low-regret or
win-win option?
Building Adaptive Capacity
10 Research and analysis Develop better understanding of the relationships
between climate-related factors and energy
demand.
Develop better understanding of the change in
demand and change in residential and
nonresidential sectors due to climate change.
Undertake cost–benefit analyses of adaptation
Energy sector experts work with met / hydromet
service providers.
No-regret
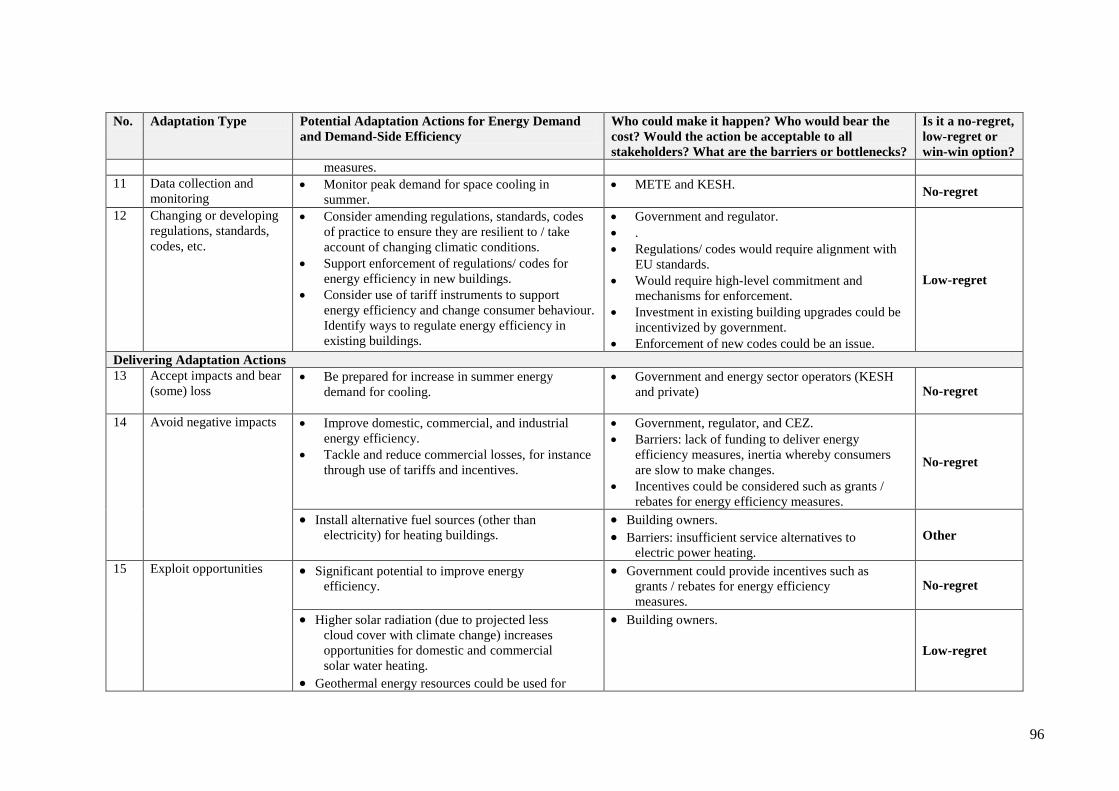
96
No. Adaptation Type Potential Adaptation Actions for Energy Demand
and Demand-Side Efficiency
Who could make it happen? Who would bear the
cost? Would the action be acceptable to all
stakeholders? What are the barriers or bottlenecks?
Is it a no-regret,
low-regret or
win-win option?
measures.
11 Data collection and
monitoring Monitor peak demand for space cooling in
summer.
METE and KESH. No-regret
12 Changing or developing
regulations, standards,
codes, etc.
Consider amending regulations, standards, codes
of practice to ensure they are resilient to / take
account of changing climatic conditions.
Support enforcement of regulations/ codes for
energy efficiency in new buildings.
Consider use of tariff instruments to support
energy efficiency and change consumer behaviour.
Identify ways to regulate energy efficiency in
existing buildings.
Government and regulator.
.
Regulations/ codes would require alignment with
EU standards.
Would require high-level commitment and
mechanisms for enforcement.
Investment in existing building upgrades could be
incentivized by government.
Enforcement of new codes could be an issue.
Low-regret
Delivering Adaptation Actions
13 Accept impacts and bear
(some) loss
Be prepared for increase in summer energy
demand for cooling.
Government and energy sector operators (KESH
and private) No-regret
14 Avoid negative impacts
Improve domestic, commercial, and industrial
energy efficiency.
Tackle and reduce commercial losses, for instance
through use of tariffs and incentives.
Government, regulator, and CEZ.
Barriers: lack of funding to deliver energy
efficiency measures, inertia whereby consumers
are slow to make changes.
Incentives could be considered such as grants /
rebates for energy efficiency measures.
No-regret
Install alternative fuel sources (other than
electricity) for heating buildings.
Building owners.
Barriers: insufficient service alternatives to
electric power heating.
Other
15 Exploit opportunities
Significant potential to improve energy
efficiency.
Government could provide incentives such as
grants / rebates for energy efficiency
measures.
No-regret
Higher solar radiation (due to projected less
cloud cover with climate change) increases
opportunities for domestic and commercial
solar water heating.
Geothermal energy resources could be used for
Building owners.
Low-regret
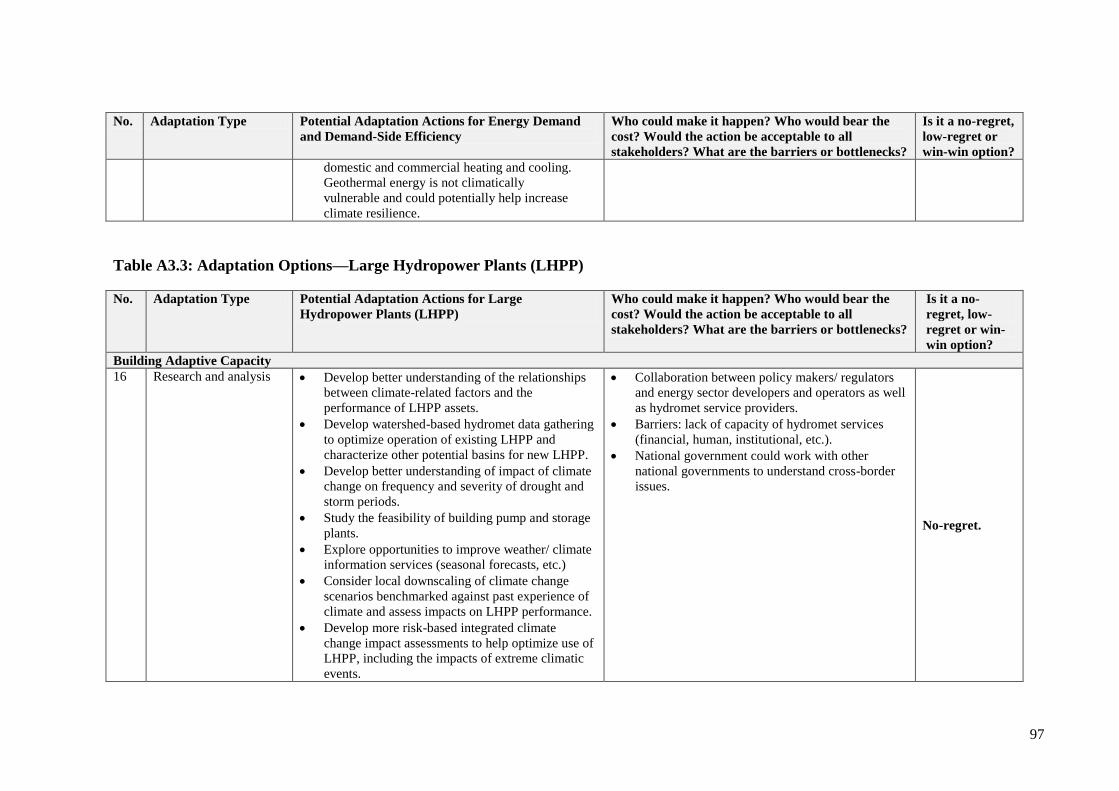
97
No. Adaptation Type Potential Adaptation Actions for Energy Demand
and Demand-Side Efficiency
Who could make it happen? Who would bear the
cost? Would the action be acceptable to all
stakeholders? What are the barriers or bottlenecks?
Is it a no-regret,
low-regret or
win-win option?
domestic and commercial heating and cooling.
Geothermal energy is not climatically
vulnerable and could potentially help increase
climate resilience.
Table A3.3: Adaptation Options—Large Hydropower Plants (LHPP)
No. Adaptation Type Potential Adaptation Actions for Large
Hydropower Plants (LHPP)
Who could make it happen? Who would bear the
cost? Would the action be acceptable to all
stakeholders? What are the barriers or bottlenecks?
Is it a no-
regret, low-
regret or win-
win option?
Building Adaptive Capacity
16 Research and analysis Develop better understanding of the relationships
between climate-related factors and the
performance of LHPP assets.
Develop watershed-based hydromet data gathering
to optimize operation of existing LHPP and
characterize other potential basins for new LHPP.
Develop better understanding of impact of climate
change on frequency and severity of drought and
storm periods.
Study the feasibility of building pump and storage
plants.
Explore opportunities to improve weather/ climate
information services (seasonal forecasts, etc.)
Consider local downscaling of climate change
scenarios benchmarked against past experience of
climate and assess impacts on LHPP performance.
Develop more risk-based integrated climate
change impact assessments to help optimize use of
LHPP, including the impacts of extreme climatic
events.
Collaboration between policy makers/ regulators
and energy sector developers and operators as well
as hydromet service providers.
Barriers: lack of capacity of hydromet services
(financial, human, institutional, etc.).
National government could work with other
national governments to understand cross-border
issues.
No-regret.
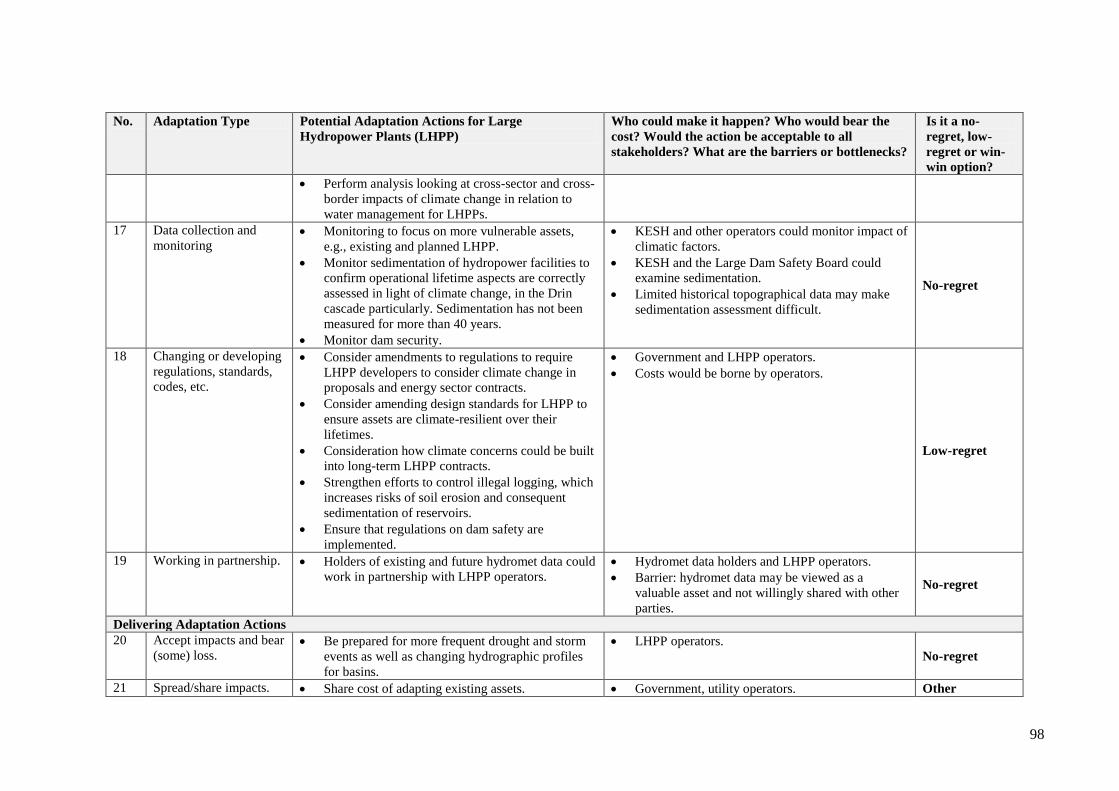
98
No. Adaptation Type Potential Adaptation Actions for Large
Hydropower Plants (LHPP)
Who could make it happen? Who would bear the
cost? Would the action be acceptable to all
stakeholders? What are the barriers or bottlenecks?
Is it a no-
regret, low-
regret or win-
win option?
Perform analysis looking at cross-sector and cross-
border impacts of climate change in relation to
water management for LHPPs.
17 Data collection and
monitoring Monitoring to focus on more vulnerable assets,
e.g., existing and planned LHPP.
Monitor sedimentation of hydropower facilities to
confirm operational lifetime aspects are correctly
assessed in light of climate change, in the Drin
cascade particularly. Sedimentation has not been
measured for more than 40 years.
Monitor dam security.
KESH and other operators could monitor impact of
climatic factors.
KESH and the Large Dam Safety Board could
examine sedimentation.
Limited historical topographical data may make
sedimentation assessment difficult.
No-regret
18 Changing or developing
regulations, standards,
codes, etc.
Consider amendments to regulations to require
LHPP developers to consider climate change in
proposals and energy sector contracts.
Consider amending design standards for LHPP to
ensure assets are climate-resilient over their
lifetimes.
Consideration how climate concerns could be built
into long-term LHPP contracts.
Strengthen efforts to control illegal logging, which
increases risks of soil erosion and consequent
sedimentation of reservoirs.
Ensure that regulations on dam safety are
implemented.
Government and LHPP operators.
Costs would be borne by operators.
Low-regret
19 Working in partnership. Holders of existing and future hydromet data could
work in partnership with LHPP operators.
Hydromet data holders and LHPP operators.
Barrier: hydromet data may be viewed as a
valuable asset and not willingly shared with other
parties.
No-regret
Delivering Adaptation Actions
20 Accept impacts and bear
(some) loss.
Be prepared for more frequent drought and storm
events as well as changing hydrographic profiles
for basins.
LHPP operators.
No-regret
21 Spread/share impacts. Share cost of adapting existing assets. Government, utility operators. Other

99
No. Adaptation Type Potential Adaptation Actions for Large
Hydropower Plants (LHPP)
Who could make it happen? Who would bear the
cost? Would the action be acceptable to all
stakeholders? What are the barriers or bottlenecks?
Is it a no-
regret, low-
regret or win-
win option?
22 Avoid negative impacts.
Increase LHPP-installed capacity, ensuring that
new assets are designed to be climate change-
resilient.
Consider raising the dam crest on Fierze.
Consider increasing the capacity of spillways on
Fierze and Komani dams.
Consider development of a pump storage scheme
on Drin river cascade.
Government, utilities.
Barriers: lack of awareness and information on
which to act, costs, coordination.
Feasibility studies would be needed for all
engineering adaptation options.
Other
Establish whether proposed locations for new
LHPP would be sustainable in the face of climate
change risks to water resources.
Improve existing asset efficiency through measure
such as: clear / redesign trash racks, upgrade
turbines and generators, replace equipment to
reduce water losses (shut-off valves), improve
apron below dams to reduce erosion, use improved
hydromet data to optimize operation.
Strengthen contingency planning for operation
during periods of extreme drought
Government, utilities, and private developers.
No-regret
23 Exploit opportunities
Rehabilitation of existing dams (options noted
above).
Government and utilities. No-regret
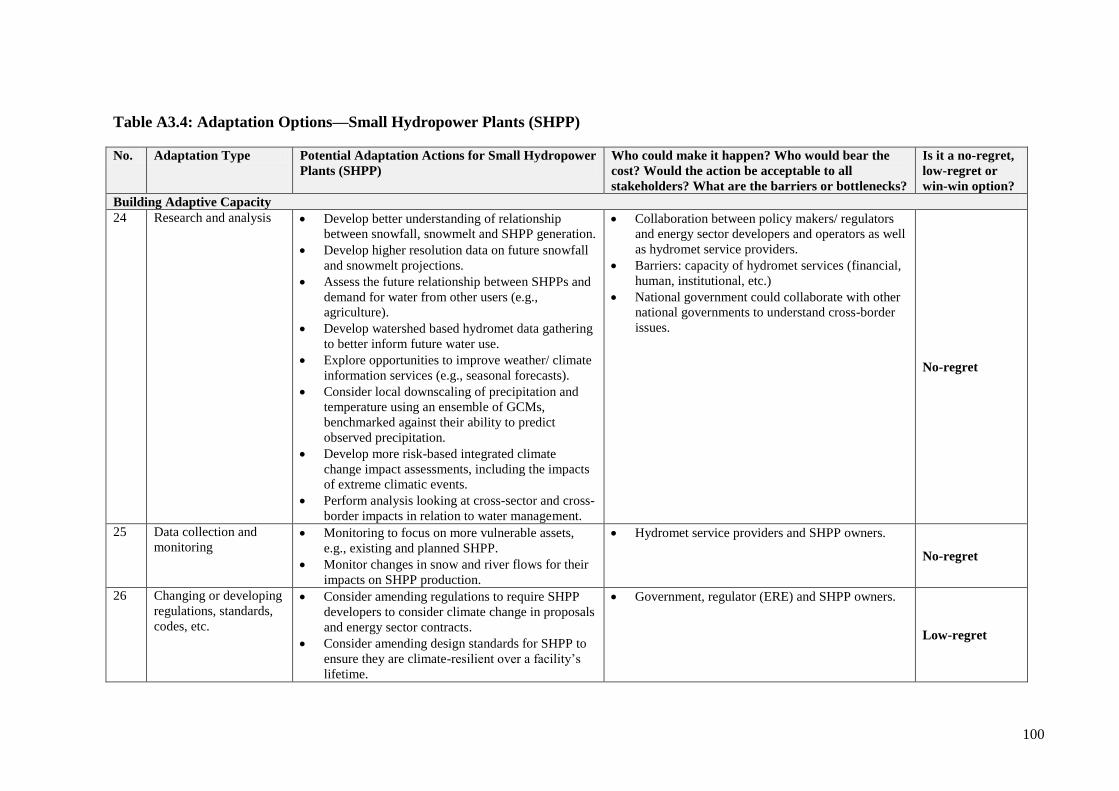
100
Table A3.4: Adaptation Options—Small Hydropower Plants (SHPP)
No. Adaptation Type Potential Adaptation Actions for Small Hydropower
Plants (SHPP)
Who could make it happen? Who would bear the
cost? Would the action be acceptable to all
stakeholders? What are the barriers or bottlenecks?
Is it a no-regret,
low-regret or
win-win option?
Building Adaptive Capacity
24 Research and analysis Develop better understanding of relationship
between snowfall, snowmelt and SHPP generation.
Develop higher resolution data on future snowfall
and snowmelt projections.
Assess the future relationship between SHPPs and
demand for water from other users (e.g.,
agriculture).
Develop watershed based hydromet data gathering
to better inform future water use.
Explore opportunities to improve weather/ climate
information services (e.g., seasonal forecasts).
Consider local downscaling of precipitation and
temperature using an ensemble of GCMs,
benchmarked against their ability to predict
observed precipitation.
Develop more risk-based integrated climate
change impact assessments, including the impacts
of extreme climatic events.
Perform analysis looking at cross-sector and cross-
border impacts in relation to water management.
Collaboration between policy makers/ regulators
and energy sector developers and operators as well
as hydromet service providers.
Barriers: capacity of hydromet services (financial,
human, institutional, etc.)
National government could collaborate with other
national governments to understand cross-border
issues.
No-regret
25 Data collection and
monitoring Monitoring to focus on more vulnerable assets,
e.g., existing and planned SHPP.
Monitor changes in snow and river flows for their
impacts on SHPP production.
Hydromet service providers and SHPP owners.
No-regret
26 Changing or developing
regulations, standards,
codes, etc.
Consider amending regulations to require SHPP
developers to consider climate change in proposals
and energy sector contracts.
Consider amending design standards for SHPP to
ensure they are climate-resilient over a facility‘s
lifetime.
Government, regulator (ERE) and SHPP owners.
Low-regret
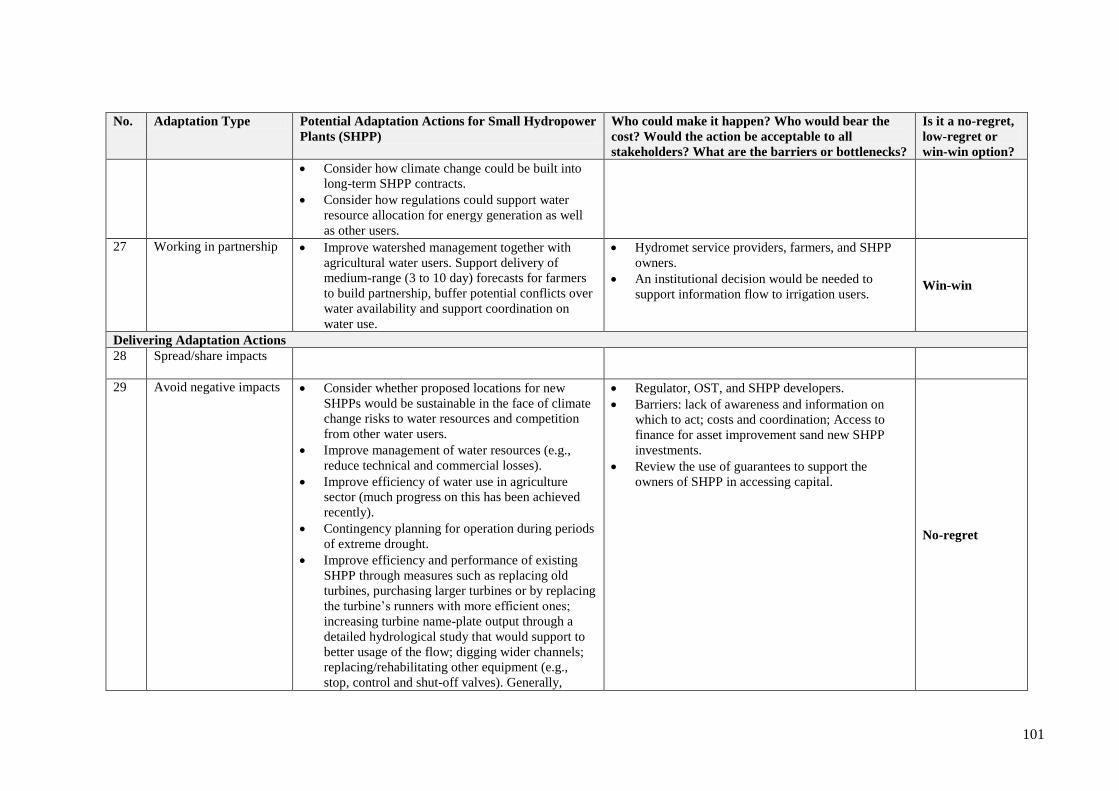
101
No. Adaptation Type Potential Adaptation Actions for Small Hydropower
Plants (SHPP)
Who could make it happen? Who would bear the
cost? Would the action be acceptable to all
stakeholders? What are the barriers or bottlenecks?
Is it a no-regret,
low-regret or
win-win option?
Consider how climate change could be built into
long-term SHPP contracts.
Consider how regulations could support water
resource allocation for energy generation as well
as other users.
27 Working in partnership Improve watershed management together with
agricultural water users. Support delivery of
medium-range (3 to 10 day) forecasts for farmers
to build partnership, buffer potential conflicts over
water availability and support coordination on
water use.
Hydromet service providers, farmers, and SHPP
owners.
An institutional decision would be needed to
support information flow to irrigation users. Win-win
Delivering Adaptation Actions
28 Spread/share impacts
29 Avoid negative impacts
Consider whether proposed locations for new
SHPPs would be sustainable in the face of climate
change risks to water resources and competition
from other water users.
Improve management of water resources (e.g.,
reduce technical and commercial losses).
Improve efficiency of water use in agriculture
sector (much progress on this has been achieved
recently).
Contingency planning for operation during periods
of extreme drought.
Improve efficiency and performance of existing
SHPP through measures such as replacing old
turbines, purchasing larger turbines or by replacing
the turbine‘s runners with more efficient ones;
increasing turbine name-plate output through a
detailed hydrological study that would support to
better usage of the flow; digging wider channels;
replacing/rehabilitating other equipment (e.g.,
stop, control and shut-off valves). Generally,
Regulator, OST, and SHPP developers.
Barriers: lack of awareness and information on
which to act; costs and coordination; Access to
finance for asset improvement sand new SHPP
investments.
Review the use of guarantees to support the
owners of SHPP in accessing capital.
No-regret
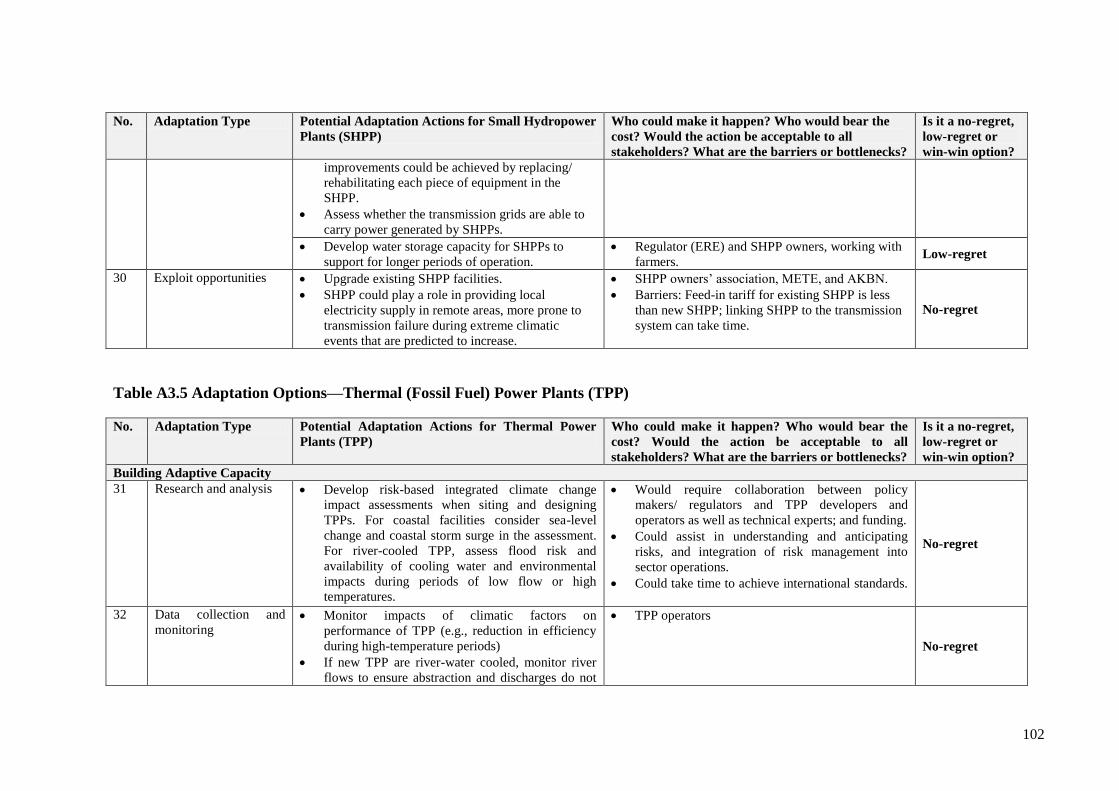
102
No. Adaptation Type Potential Adaptation Actions for Small Hydropower
Plants (SHPP)
Who could make it happen? Who would bear the
cost? Would the action be acceptable to all
stakeholders? What are the barriers or bottlenecks?
Is it a no-regret,
low-regret or
win-win option?
improvements could be achieved by replacing/
rehabilitating each piece of equipment in the
SHPP.
Assess whether the transmission grids are able to
carry power generated by SHPPs.
Develop water storage capacity for SHPPs to
support for longer periods of operation.
Regulator (ERE) and SHPP owners, working with
farmers. Low-regret
30 Exploit opportunities
Upgrade existing SHPP facilities.
SHPP could play a role in providing local
electricity supply in remote areas, more prone to
transmission failure during extreme climatic
events that are predicted to increase.
SHPP owners‘ association, METE, and AKBN.
Barriers: Feed-in tariff for existing SHPP is less
than new SHPP; linking SHPP to the transmission
system can take time.
No-regret
Table A3.5 Adaptation Options—Thermal (Fossil Fuel) Power Plants (TPP)
No. Adaptation Type Potential Adaptation Actions for Thermal Power
Plants (TPP)
Who could make it happen? Who would bear the
cost? Would the action be acceptable to all
stakeholders? What are the barriers or bottlenecks?
Is it a no-regret,
low-regret or
win-win option?
Building Adaptive Capacity
31 Research and analysis Develop risk-based integrated climate change
impact assessments when siting and designing
TPPs. For coastal facilities consider sea-level
change and coastal storm surge in the assessment.
For river-cooled TPP, assess flood risk and
availability of cooling water and environmental
impacts during periods of low flow or high
temperatures.
Would require collaboration between policy
makers/ regulators and TPP developers and
operators as well as technical experts; and funding.
Could assist in understanding and anticipating
risks, and integration of risk management into
sector operations.
Could take time to achieve international standards.
No-regret
32 Data collection and
monitoring Monitor impacts of climatic factors on
performance of TPP (e.g., reduction in efficiency
during high-temperature periods)
If new TPP are river-water cooled, monitor river
flows to ensure abstraction and discharges do not
TPP operators
No-regret
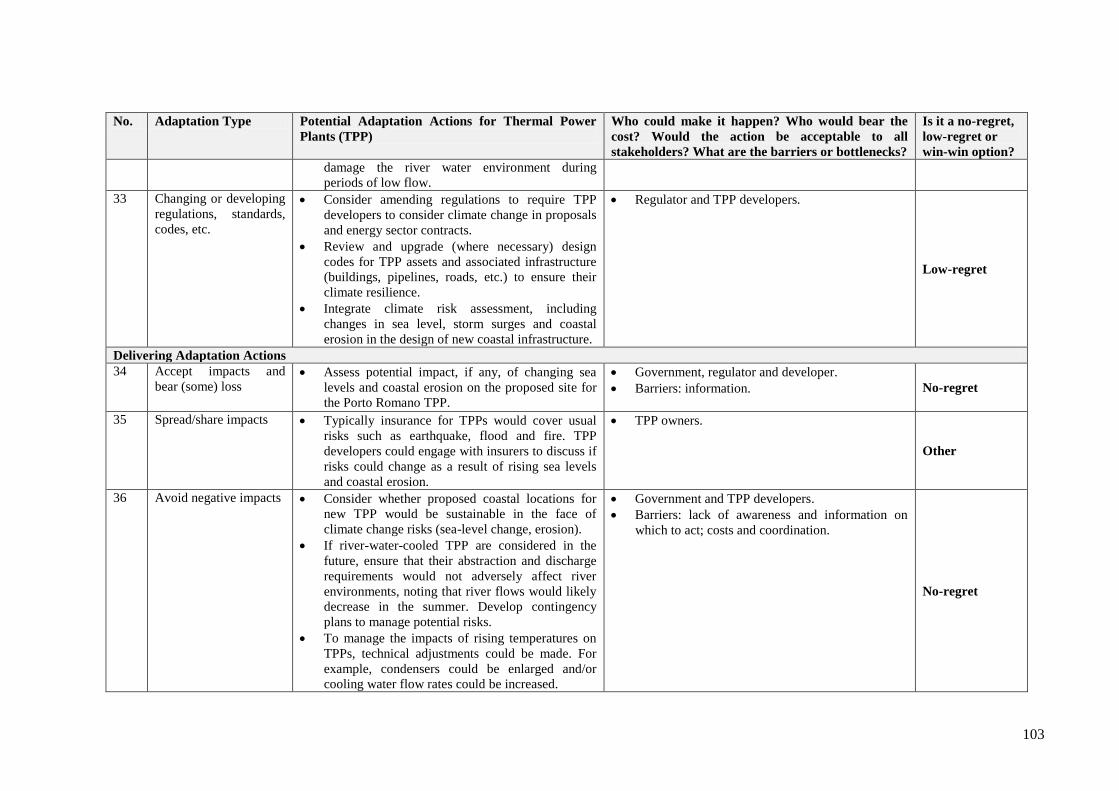
103
No. Adaptation Type Potential Adaptation Actions for Thermal Power
Plants (TPP)
Who could make it happen? Who would bear the
cost? Would the action be acceptable to all
stakeholders? What are the barriers or bottlenecks?
Is it a no-regret,
low-regret or
win-win option?
damage the river water environment during
periods of low flow.
33 Changing or developing
regulations, standards,
codes, etc.
Consider amending regulations to require TPP
developers to consider climate change in proposals
and energy sector contracts.
Review and upgrade (where necessary) design
codes for TPP assets and associated infrastructure
(buildings, pipelines, roads, etc.) to ensure their
climate resilience.
Integrate climate risk assessment, including
changes in sea level, storm surges and coastal
erosion in the design of new coastal infrastructure.
Regulator and TPP developers.
Low-regret
Delivering Adaptation Actions
34 Accept impacts and
bear (some) loss
Assess potential impact, if any, of changing sea
levels and coastal erosion on the proposed site for
the Porto Romano TPP.
Government, regulator and developer.
Barriers: information.
No-regret
35 Spread/share impacts
Typically insurance for TPPs would cover usual
risks such as earthquake, flood and fire. TPP
developers could engage with insurers to discuss if
risks could change as a result of rising sea levels
and coastal erosion.
TPP owners.
Other
36 Avoid negative impacts
Consider whether proposed coastal locations for
new TPP would be sustainable in the face of
climate change risks (sea-level change, erosion).
If river-water-cooled TPP are considered in the
future, ensure that their abstraction and discharge
requirements would not adversely affect river
environments, noting that river flows would likely
decrease in the summer. Develop contingency
plans to manage potential risks.
To manage the impacts of rising temperatures on
TPPs, technical adjustments could be made. For
example, condensers could be enlarged and/or
cooling water flow rates could be increased.
Government and TPP developers.
Barriers: lack of awareness and information on
which to act; costs and coordination.
No-regret
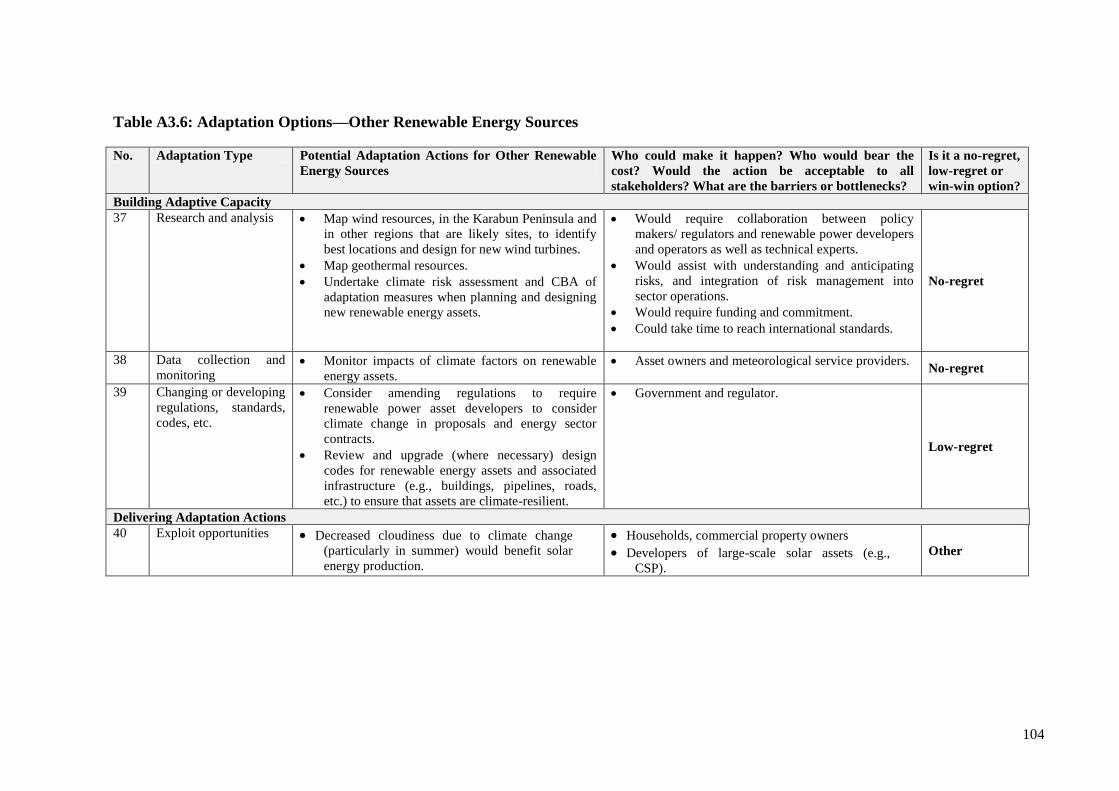
104
Table A3.6: Adaptation Options—Other Renewable Energy Sources
No. Adaptation Type Potential Adaptation Actions for Other Renewable
Energy Sources
Who could make it happen? Who would bear the
cost? Would the action be acceptable to all
stakeholders? What are the barriers or bottlenecks?
Is it a no-regret,
low-regret or
win-win option?
Building Adaptive Capacity
37 Research and analysis Map wind resources, in the Karabun Peninsula and
in other regions that are likely sites, to identify
best locations and design for new wind turbines.
Map geothermal resources.
Undertake climate risk assessment and CBA of
adaptation measures when planning and designing
new renewable energy assets.
Would require collaboration between policy
makers/ regulators and renewable power developers
and operators as well as technical experts.
Would assist with understanding and anticipating
risks, and integration of risk management into
sector operations.
Would require funding and commitment.
Could take time to reach international standards.
No-regret
38 Data collection and
monitoring Monitor impacts of climate factors on renewable
energy assets.
Asset owners and meteorological service providers. No-regret
39 Changing or developing
regulations, standards,
codes, etc.
Consider amending regulations to require
renewable power asset developers to consider
climate change in proposals and energy sector
contracts.
Review and upgrade (where necessary) design
codes for renewable energy assets and associated
infrastructure (e.g., buildings, pipelines, roads,
etc.) to ensure that assets are climate-resilient.
Government and regulator.
Low-regret
Delivering Adaptation Actions
40 Exploit opportunities
Decreased cloudiness due to climate change
(particularly in summer) would benefit solar
energy production.
Households, commercial property owners
Developers of large-scale solar assets (e.g.,
CSP).
Other
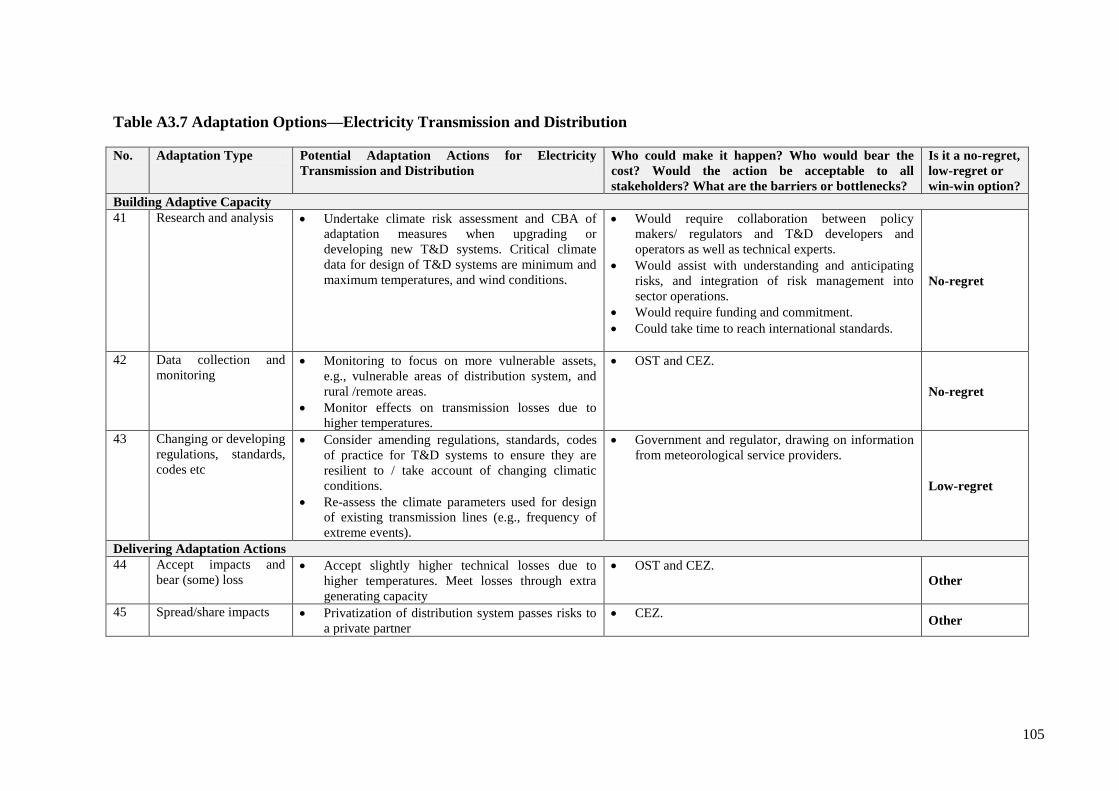
105
Table A3.7 Adaptation Options—Electricity Transmission and Distribution
No. Adaptation Type Potential Adaptation Actions for Electricity
Transmission and Distribution
Who could make it happen? Who would bear the
cost? Would the action be acceptable to all
stakeholders? What are the barriers or bottlenecks?
Is it a no-regret,
low-regret or
win-win option?
Building Adaptive Capacity
41 Research and analysis Undertake climate risk assessment and CBA of
adaptation measures when upgrading or
developing new T&D systems. Critical climate
data for design of T&D systems are minimum and
maximum temperatures, and wind conditions.
Would require collaboration between policy
makers/ regulators and T&D developers and
operators as well as technical experts.
Would assist with understanding and anticipating
risks, and integration of risk management into
sector operations.
Would require funding and commitment.
Could take time to reach international standards.
No-regret
42 Data collection and
monitoring Monitoring to focus on more vulnerable assets,
e.g., vulnerable areas of distribution system, and
rural /remote areas.
Monitor effects on transmission losses due to
higher temperatures.
OST and CEZ.
No-regret
43 Changing or developing
regulations, standards,
codes etc
Consider amending regulations, standards, codes
of practice for T&D systems to ensure they are
resilient to / take account of changing climatic
conditions.
Re-assess the climate parameters used for design
of existing transmission lines (e.g., frequency of
extreme events).
Government and regulator, drawing on information
from meteorological service providers.
Low-regret
Delivering Adaptation Actions
44 Accept impacts and
bear (some) loss
Accept slightly higher technical losses due to
higher temperatures. Meet losses through extra
generating capacity
OST and CEZ.
Other
45 Spread/share impacts
Privatization of distribution system passes risks to
a private partner
CEZ. Other
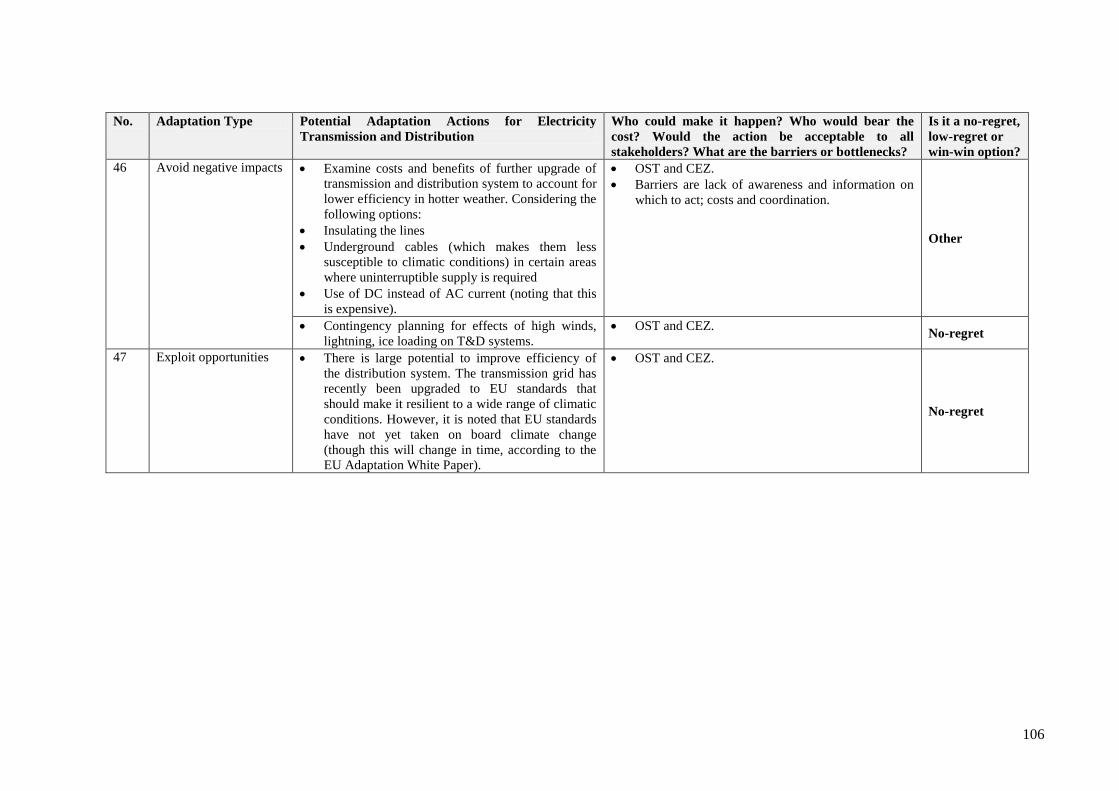
106
No. Adaptation Type Potential Adaptation Actions for Electricity
Transmission and Distribution
Who could make it happen? Who would bear the
cost? Would the action be acceptable to all
stakeholders? What are the barriers or bottlenecks?
Is it a no-regret,
low-regret or
win-win option?
46 Avoid negative impacts
Examine costs and benefits of further upgrade of
transmission and distribution system to account for
lower efficiency in hotter weather. Considering the
following options:
Insulating the lines
Underground cables (which makes them less
susceptible to climatic conditions) in certain areas
where uninterruptible supply is required
Use of DC instead of AC current (noting that this
is expensive).
OST and CEZ.
Barriers are lack of awareness and information on
which to act; costs and coordination.
Other
Contingency planning for effects of high winds,
lightning, ice loading on T&D systems.
OST and CEZ. No-regret
47 Exploit opportunities There is large potential to improve efficiency of
the distribution system. The transmission grid has
recently been upgraded to EU standards that
should make it resilient to a wide range of climatic
conditions. However, it is noted that EU standards
have not yet taken on board climate change
(though this will change in time, according to the
EU Adaptation White Paper).
OST and CEZ.
No-regret
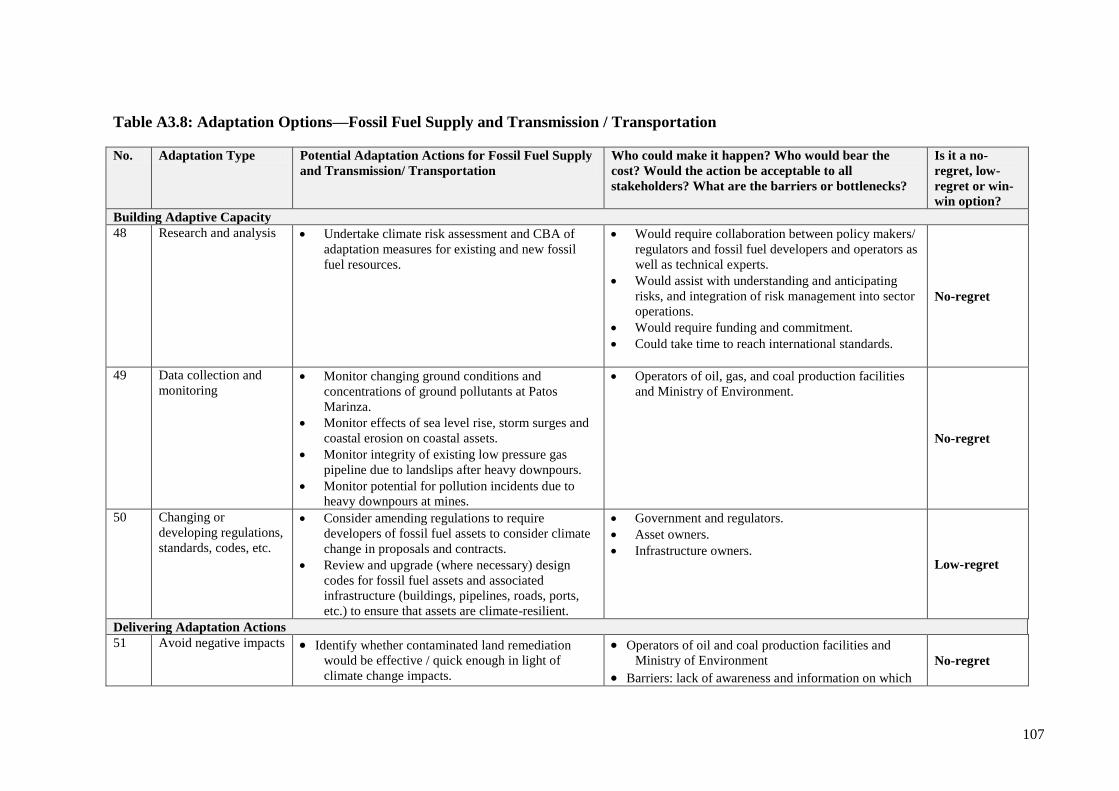
107
Table A3.8: Adaptation Options—Fossil Fuel Supply and Transmission / Transportation
No. Adaptation Type Potential Adaptation Actions for Fossil Fuel Supply
and Transmission/ Transportation
Who could make it happen? Who would bear the
cost? Would the action be acceptable to all
stakeholders? What are the barriers or bottlenecks?
Is it a no-
regret, low-
regret or win-
win option?
Building Adaptive Capacity
48 Research and analysis Undertake climate risk assessment and CBA of
adaptation measures for existing and new fossil
fuel resources.
Would require collaboration between policy makers/
regulators and fossil fuel developers and operators as
well as technical experts.
Would assist with understanding and anticipating
risks, and integration of risk management into sector
operations.
Would require funding and commitment.
Could take time to reach international standards.
No-regret
49 Data collection and
monitoring Monitor changing ground conditions and
concentrations of ground pollutants at Patos
Marinza.
Monitor effects of sea level rise, storm surges and
coastal erosion on coastal assets.
Monitor integrity of existing low pressure gas
pipeline due to landslips after heavy downpours.
Monitor potential for pollution incidents due to
heavy downpours at mines.
Operators of oil, gas, and coal production facilities
and Ministry of Environment.
No-regret
50 Changing or
developing regulations,
standards, codes, etc.
Consider amending regulations to require
developers of fossil fuel assets to consider climate
change in proposals and contracts.
Review and upgrade (where necessary) design
codes for fossil fuel assets and associated
infrastructure (buildings, pipelines, roads, ports,
etc.) to ensure that assets are climate-resilient.
Government and regulators.
Asset owners.
Infrastructure owners. Low-regret
Delivering Adaptation Actions
51 Avoid negative impacts
Identify whether contaminated land remediation
would be effective / quick enough in light of
climate change impacts.
Operators of oil and coal production facilities and
Ministry of Environment
Barriers: lack of awareness and information on which
No-regret
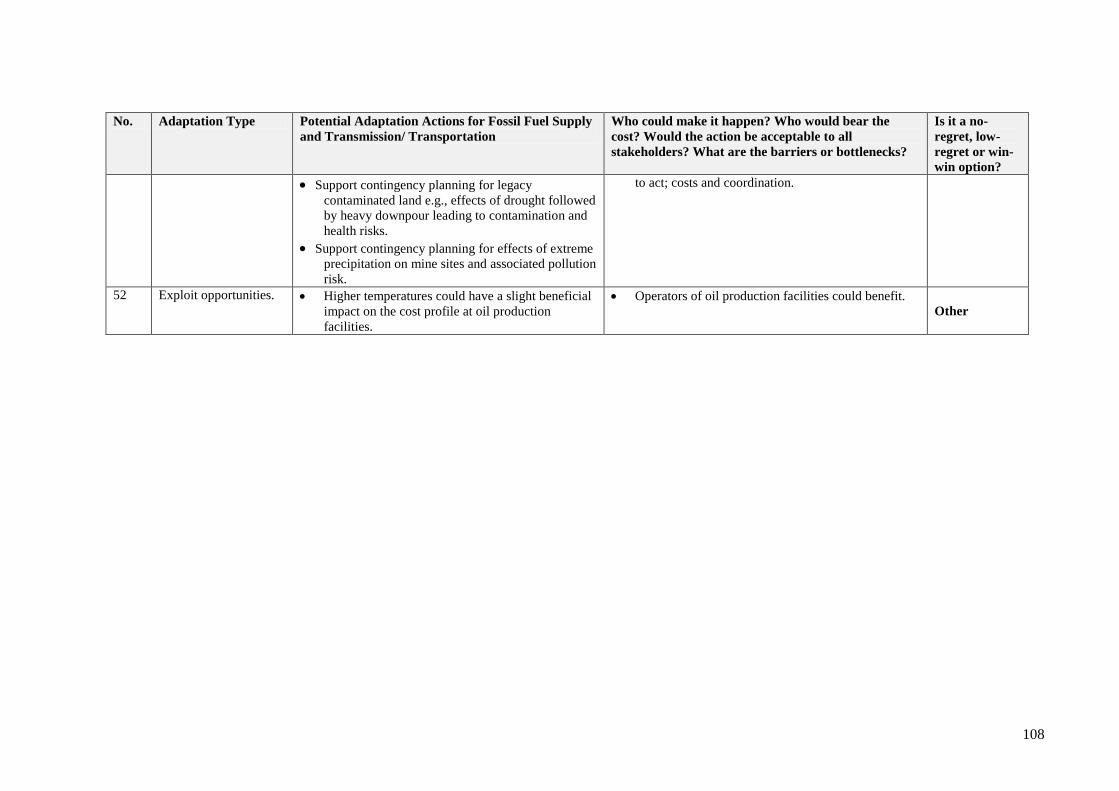
108
No. Adaptation Type Potential Adaptation Actions for Fossil Fuel Supply
and Transmission/ Transportation
Who could make it happen? Who would bear the
cost? Would the action be acceptable to all
stakeholders? What are the barriers or bottlenecks?
Is it a no-
regret, low-
regret or win-
win option?
Support contingency planning for legacy
contaminated land e.g., effects of drought followed
by heavy downpour leading to contamination and
health risks.
Support contingency planning for effects of extreme
precipitation on mine sites and associated pollution
risk.
to act; costs and coordination.
52 Exploit opportunities. Higher temperatures could have a slight beneficial
impact on the cost profile at oil production
facilities.
Operators of oil production facilities could benefit.
Other
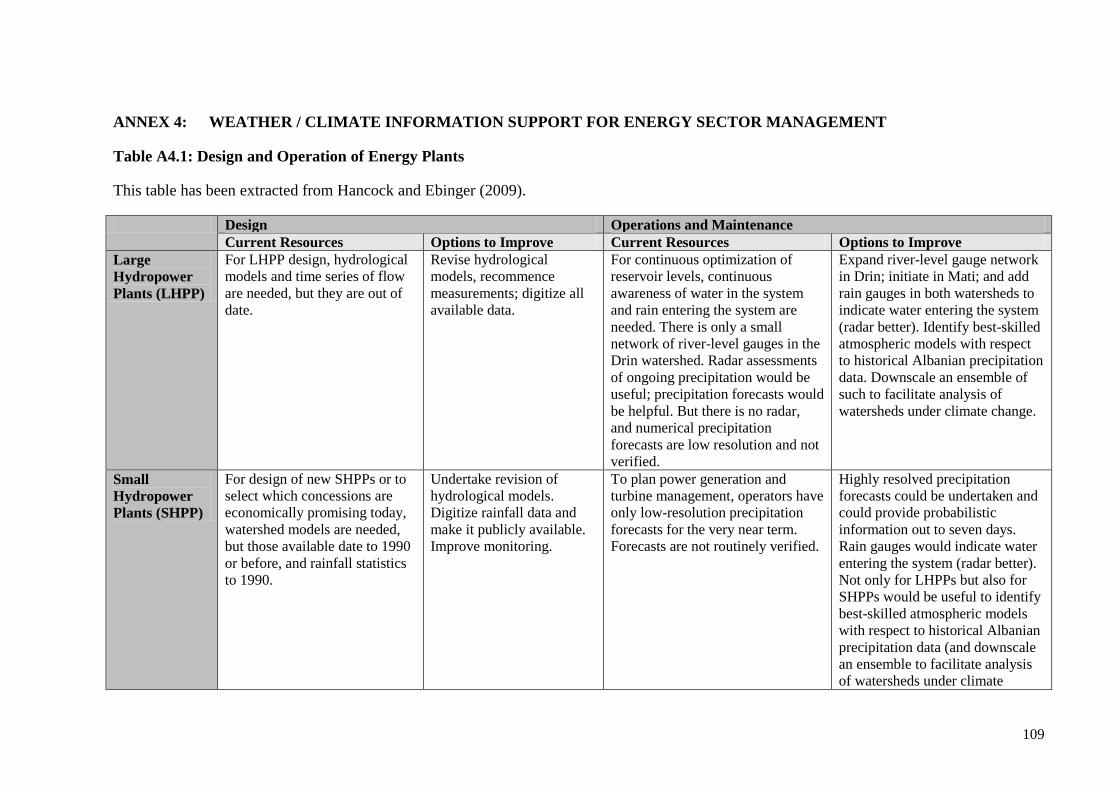
109
ANNEX 4: WEATHER / CLIMATE INFORMATION SUPPORT FOR ENERGY SECTOR MANAGEMENT
Table A4.1: Design and Operation of Energy Plants
This table has been extracted from Hancock and Ebinger (2009).
Design Operations and Maintenance
Current Resources Options to Improve Current Resources Options to Improve
Large
Hydropower
Plants (LHPP)
For LHPP design, hydrological
models and time series of flow
are needed, but they are out of
date.
Revise hydrological
models, recommence
measurements; digitize all
available data.
For continuous optimization of
reservoir levels, continuous
awareness of water in the system
and rain entering the system are
needed. There is only a small
network of river-level gauges in the
Drin watershed. Radar assessments
of ongoing precipitation would be
useful; precipitation forecasts would
be helpful. But there is no radar,
and numerical precipitation
forecasts are low resolution and not
verified.
Expand river-level gauge network
in Drin; initiate in Mati; and add
rain gauges in both watersheds to
indicate water entering the system
(radar better). Identify best-skilled
atmospheric models with respect
to historical Albanian precipitation
data. Downscale an ensemble of
such to facilitate analysis of
watersheds under climate change.
Small
Hydropower
Plants (SHPP)
For design of new SHPPs or to
select which concessions are
economically promising today,
watershed models are needed,
but those available date to 1990
or before, and rainfall statistics
to 1990.
Undertake revision of
hydrological models.
Digitize rainfall data and
make it publicly available.
Improve monitoring.
To plan power generation and
turbine management, operators have
only low-resolution precipitation
forecasts for the very near term.
Forecasts are not routinely verified.
Highly resolved precipitation
forecasts could be undertaken and
could provide probabilistic
information out to seven days.
Rain gauges would indicate water
entering the system (radar better).
Not only for LHPPs but also for
SHPPs would be useful to identify
best-skilled atmospheric models
with respect to historical Albanian
precipitation data (and downscale
an ensemble to facilitate analysis
of watersheds under climate

110
Design Operations and Maintenance
Current Resources Options to Improve Current Resources Options to Improve
change).
Power
Transmission
and
Distribution
(T&D)
To devise distribution network
protected against severe
weather, climate data (minimum
and maximum temperature and
wind conditions) are needed,
but what exists is old and much
is not digitized.
Digitize the climate data
and make it available
publicly; strengthen
monitoring.
To anticipate risks to network and
undertake rapid repairs, storm
forecasts and lightning detection are
needed. But severe storms are not
reliably forecast; no lightning
detection network in place; no
radar.
Initiate highly resolved
probabilistic weather forecasts
with verification to tune accuracy;
initiate lightning detection to
speed network repairs; undertake
weather and radar monitoring to
assess storms underway.
Thermal
Power Plants
(TPP)
To assess availability of cooling
water for river or lake cooled
TPPs, water temperatures,
ambient air temperatures, and
climate data are needed. Data up
to 1990 are available; beyond
that, data set is incomplete and
hydrological models are old.
Revise hydrological models
to show availability of
cooling water; expand
monitoring of rainfall to
support ongoing revisions.
To assess adequacy and temperature
of cooling water and ambient air
temperatures, assessment of stream
levels and rainfall entering the
system are needed, but lacking. No
radar. Forecasts needed, but these
are low resolution and risky to use
as they do not provide probabilistic
information and are not verified.
Monitor rainfall entering the
system to provide cooling water
(radar, rainfall, stream levels);
improve resolution of weather
forecasts and provide probabilistic
information.
Wind To site and design wind
generation plants, knowledge of
wind speed distributions at
turbine height is needed. But
little data are available. Maps
have been undertaken at low
resolution, but their accuracy at
turbine height is not known;
data at turbine height have been
taken in a few places but not
long term.
Improve resolution of wind
maps; add monitoring of
wind at turbine height.
To anticipate wind extremes and
assure security of infrastructure,
wind forecasts are needed. But
forecasts are at very low resolution,
lack probabilistic information and
are not verified.
Improve resolution of forecasts;
add monitoring of wind at key
altitudes; calibrate the forecasts.
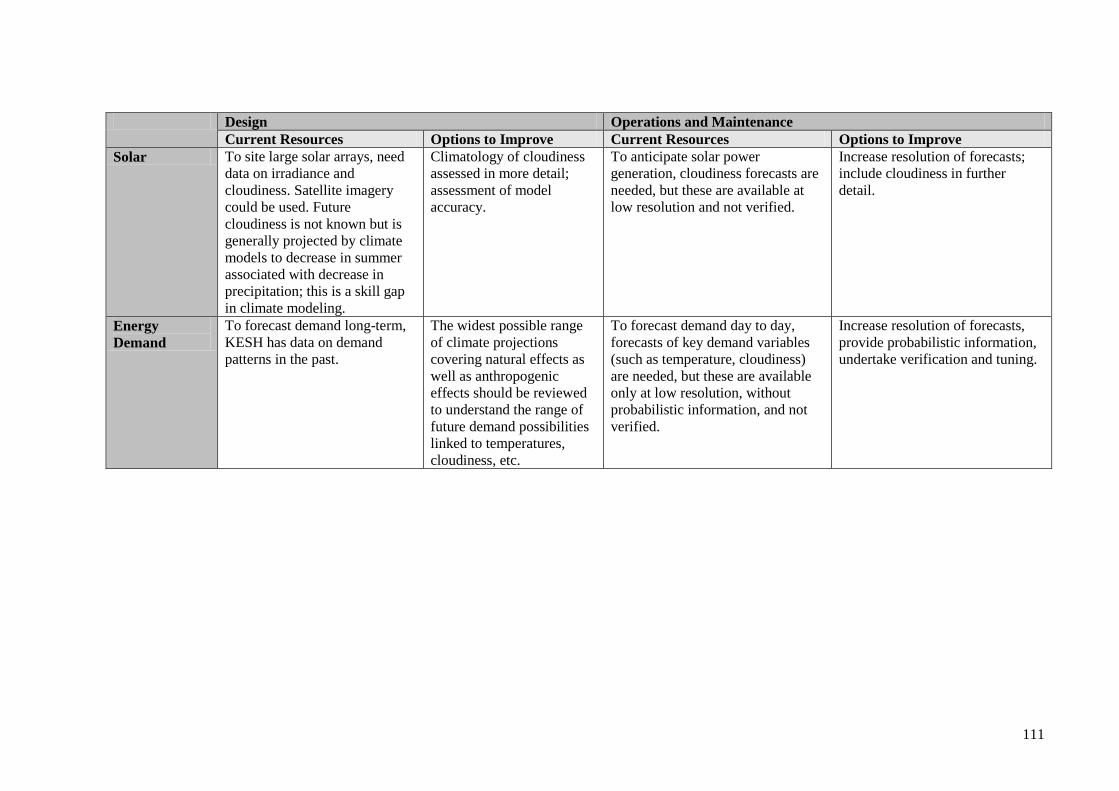
111
Design Operations and Maintenance
Current Resources Options to Improve Current Resources Options to Improve
Solar To site large solar arrays, need
data on irradiance and
cloudiness. Satellite imagery
could be used. Future
cloudiness is not known but is
generally projected by climate
models to decrease in summer
associated with decrease in
precipitation; this is a skill gap
in climate modeling.
Climatology of cloudiness
assessed in more detail;
assessment of model
accuracy.
To anticipate solar power
generation, cloudiness forecasts are
needed, but these are available at
low resolution and not verified.
Increase resolution of forecasts;
include cloudiness in further
detail.
Energy
Demand
To forecast demand long-term,
KESH has data on demand
patterns in the past.
The widest possible range
of climate projections
covering natural effects as
well as anthropogenic
effects should be reviewed
to understand the range of
future demand possibilities
linked to temperatures,
cloudiness, etc.
To forecast demand day to day,
forecasts of key demand variables
(such as temperature, cloudiness)
are needed, but these are available
only at low resolution, without
probabilistic information, and not
verified.
Increase resolution of forecasts,
provide probabilistic information,
undertake verification and tuning.
112
ANNEX 5: FURTHER DETAILS ON APPROACH TO COST–BENEFIT
ANALYSIS
This annex contains supplementary information to the cost–benefit analysis (CBA), outlined
in Section 5. It includes the following sections:
Methodology
Framing workshop parameters summary
Financial assumptions
Benefits assessment and valuation
Results summary
Limitations
A5.1 METHODOLOGY
Assessment Process Overview
A structured process has been used to evaluate ways to address the shortage of energy
generation predicted to be caused by climate change. This process involved the following
steps:
1. Identify the issue or dilemma requiring assessment, followed by background data review
and discussions.
2. Conduct a formalized workshop process, carried out with stakeholders to frame the
assessment overall.
3. Collect data and pursue consultation.
4. Conduct economic CBA modeling.
5. Present results.
The key steps in this process are discussed in more detail next.
Theoretical Basis for the Assessment
An economic model for assessing the benefits of environmental and social protection has
been presented in Hardisty and Ozdemiroglu (2005). Based on this CBA method, it is
possible to explicitly monetize a number of relevant external costs and benefits, thereby
allowing these costs and benefits to be added into the conventional internal or private
(company or developer) costs and benefits of a proposed project or action. This model,
described below in more detail, is the basis upon which the analysis of options has been
carried out.
Benefits
Objective setting must consider the benefits of achieving a given objective. In economics, the
overall objective of any decision is assumed to be the maximisation of human welfare over
time. To compare the different benefit and cost streams over time, the process of discounting
is used and amounts over time are expressed as present values. Economic analysis
recommends the decision with the maximum net present value (NPV) (present value of net
113
benefits, or benefits minus costs, over time) or the highest benefit cost ratio (BCR) (ratio of
the present value of benefits to the present value of costs). Benefits of environmental
protection can effectively be expressed as the ―damages avoided‖ by undertaking that action.
Net Benefits
What is important in a decision-making process is the overall comparison of the costs of
action, with the benefits of action; hence the term cost–benefit analysis. To find net benefits,
we deduct the flow of costs from the flow of benefits.
Thus, the present value of the net benefits (NPV) (benefits minus costs) of the selected
project or action in any year, t, is given by:
T
T
xpxp
r
CCBBNPV
0 )1(
)()(
Where NPV is the total social NPV of project p, Bp and Cp are the private or internal costs
and benefits of the project, Bx and Cx are the external benefits and costs of the project
respectively and r is the discount rate.
Valuation of Benefits
For the equation to be calculated, both the costs and benefits of each adaptation option must
be estimated in a common unit. Economic analysis uses money as this common unit, based
on what individuals are willing to pay, and what one would have to spend on the actions to
supplement the shortfall in energy generation due to climate change.
The value of the environment or natural resources includes: as an input to production or
consumption (direct use value); its role in the functioning of ecosystems (indirect use value);
or its potential future uses (option value). In the case of water, for instance (a key
consideration in this study), people may also value water and be willing to pay for its
protection unrelated to their own use of the resource (nonuse values) but because of its
benefits to others (altruistic value), for future generations (bequest value) and for its own
sake (existence value). The sum of these different types of economic benefits or values is
referred to as total economic value (TEV) in economic literature.
Private Benefits
If the analysis is undertaken from the perspective of the problem holder, only the costs and
benefits that accrue to the problem holder are considered. This approach, which is a financial
(as opposed to economic) analysis, uses market prices of costs and benefits, which include
subsidies or taxes. Private discount rates are used, which are determined by the cost of capital
or rates of return from alternative investments in the private sector. Private discount rates are
generally higher than social discount rates. Financial analysis does not deal with
environmental or other external social impacts. Table A5-1 presents a selection of typical
private benefit categories.
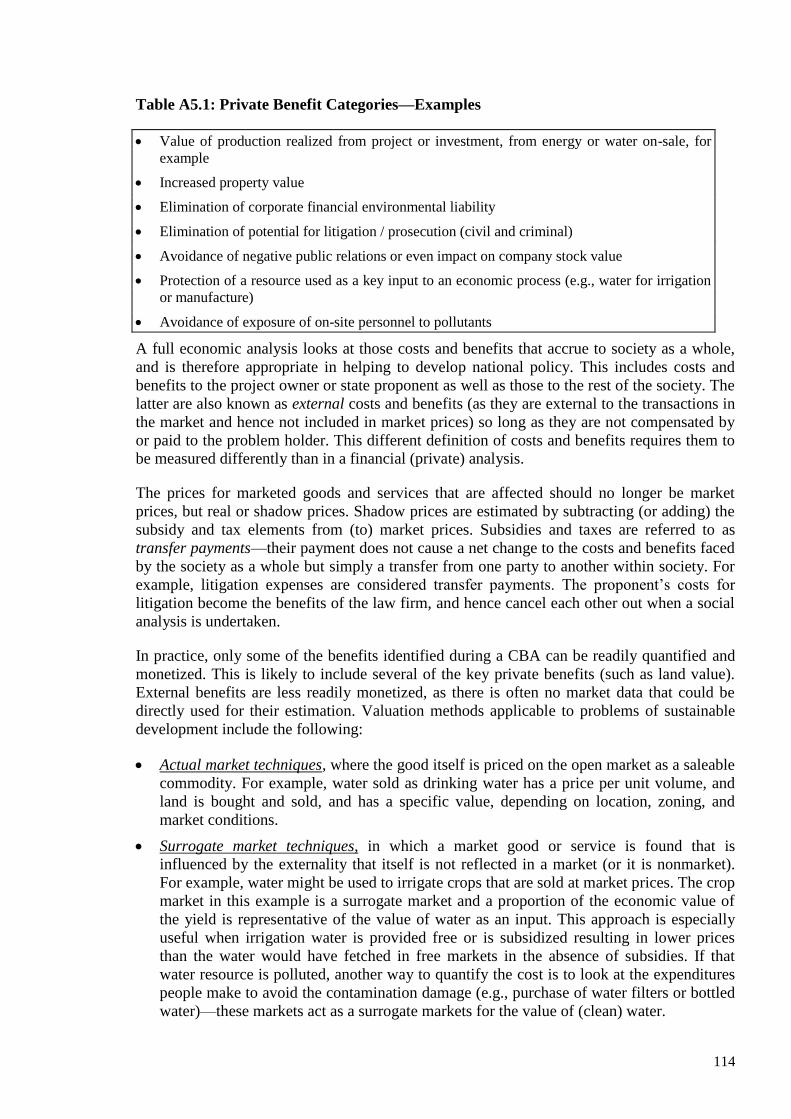
114
Table A5.1: Private Benefit Categories—Examples
Value of production realized from project or investment, from energy or water on-sale, for
example
Increased property value
Elimination of corporate financial environmental liability
Elimination of potential for litigation / prosecution (civil and criminal)
Avoidance of negative public relations or even impact on company stock value
Protection of a resource used as a key input to an economic process (e.g., water for irrigation
or manufacture)
Avoidance of exposure of on-site personnel to pollutants
A full economic analysis looks at those costs and benefits that accrue to society as a whole,
and is therefore appropriate in helping to develop national policy. This includes costs and
benefits to the project owner or state proponent as well as those to the rest of the society. The
latter are also known as external costs and benefits (as they are external to the transactions in
the market and hence not included in market prices) so long as they are not compensated by
or paid to the problem holder. This different definition of costs and benefits requires them to
be measured differently than in a financial (private) analysis.
The prices for marketed goods and services that are affected should no longer be market
prices, but real or shadow prices. Shadow prices are estimated by subtracting (or adding) the
subsidy and tax elements from (to) market prices. Subsidies and taxes are referred to as
transfer payments—their payment does not cause a net change to the costs and benefits faced
by the society as a whole but simply a transfer from one party to another within society. For
example, litigation expenses are considered transfer payments. The proponent‘s costs for
litigation become the benefits of the law firm, and hence cancel each other out when a social
analysis is undertaken.
In practice, only some of the benefits identified during a CBA can be readily quantified and
monetized. This is likely to include several of the key private benefits (such as land value).
External benefits are less readily monetized, as there is often no market data that could be
directly used for their estimation. Valuation methods applicable to problems of sustainable
development include the following:
Actual market techniques, where the good itself is priced on the open market as a saleable
commodity. For example, water sold as drinking water has a price per unit volume, and
land is bought and sold, and has a specific value, depending on location, zoning, and
market conditions.
Surrogate market techniques, in which a market good or service is found that is
influenced by the externality that itself is not reflected in a market (or it is nonmarket).
For example, water might be used to irrigate crops that are sold at market prices. The crop
market in this example is a surrogate market and a proportion of the economic value of
the yield is representative of the value of water as an input. This approach is especially
useful when irrigation water is provided free or is subsidized resulting in lower prices
than the water would have fetched in free markets in the absence of subsidies. If that
water resource is polluted, another way to quantify the cost is to look at the expenditures
people make to avoid the contamination damage (e.g., purchase of water filters or bottled
water)—these markets act as a surrogate markets for the value of (clean) water.
115
Hypothetical market techniques create hypothetical markets via structured questionnaires,
which elicit individuals‘ willingness to pay (WTP) to secure a beneficial outcome or to
avoid a loss, or their willingness to accept compensation (WTA) to forgo a beneficial
outcome or to tolerate a loss. Among these stated preference techniques are contingent
valuation and choice modeling.
WTP is a standard method used worldwide for estimating the economic value for goods and
services for which no direct market exists. Economic valuations, transferred from a specific
test group, location and subject and applied to other projects, are a common economic
practice, known as Benefits Transfer, and a standard practice within WTP surveys.
In the process of undertaking a beneficial action, it is sometimes possible that secondary
environmental impacts are produced by those actions, despite best attempts at mitigation. The
economic value of these impacts should be included in the overall economic assessment. The
costs of dealing with these effects (as a lower bound estimate), or the value of the damages
that they cause, which are not borne by the problem holder, are termed external costs of
action (Hardisty and Ozdemiroglu, 2005).
External costs of action (X) can be divided into two categories:
1. Planned or process-related external costs that cannot be mitigated against (Xp)
2. Unplanned or inadvertent external costs (Xup), such that:
X = Xp + (P Xup)
where P is the probability that the unplanned external cost will occur.
External costs of action could include production of greenhouse gases from energy-intensive
solutions, production of other airborne pollutants such as NOx and SOx, and secondary
impacts on water quality, biodiversity, or community.
Modeling
The CBA modeling is based on published methodologies (Hardisty and Ozdemiroglu, 2005;
UK Environment Agency, 1999), and follows conceptual approaches espoused and approved
by a number of government organisations worldwide.
A5.2 FRAMING WORKSHOP PARAMETERS SUMMARY
Table A5.2 presents the parameters that were identified in Workshop 2, their importance to
stakeholders in Albania, and how they were or were not incorporated into the CBA.
The average ranking for each parameter is presented based on the opinions of workshop
attendees and discussions with other stakeholders during meetings including: an industrial
consumer, an academic, engineering students, and a World Bank economist. The rationale for
inclusion or exclusion from the CBA is also noted.
A number of parameters were identified as areas for further study: value of water, value of
ecosystems, disturbance of people and properties, impacts on tourism, GDP impacts, and
vulnerability to natural disasters. In these cases, parameters could not be fully integrated into
the study (typically because of a lack of data at the appropriate level of abstraction) but may

116
be important for future policy making. One example is tourism. In the absence of a good
basis for quantifying the benefits or dis-benefits that might arise in a ―typical‖ power
generation setting in Albania, the tourism parameter was not included in the current analysis.
However, tourism is very important to the local economy, and it would enhance the value of
the study if the impact on tourism of a particular policy choice were captured.
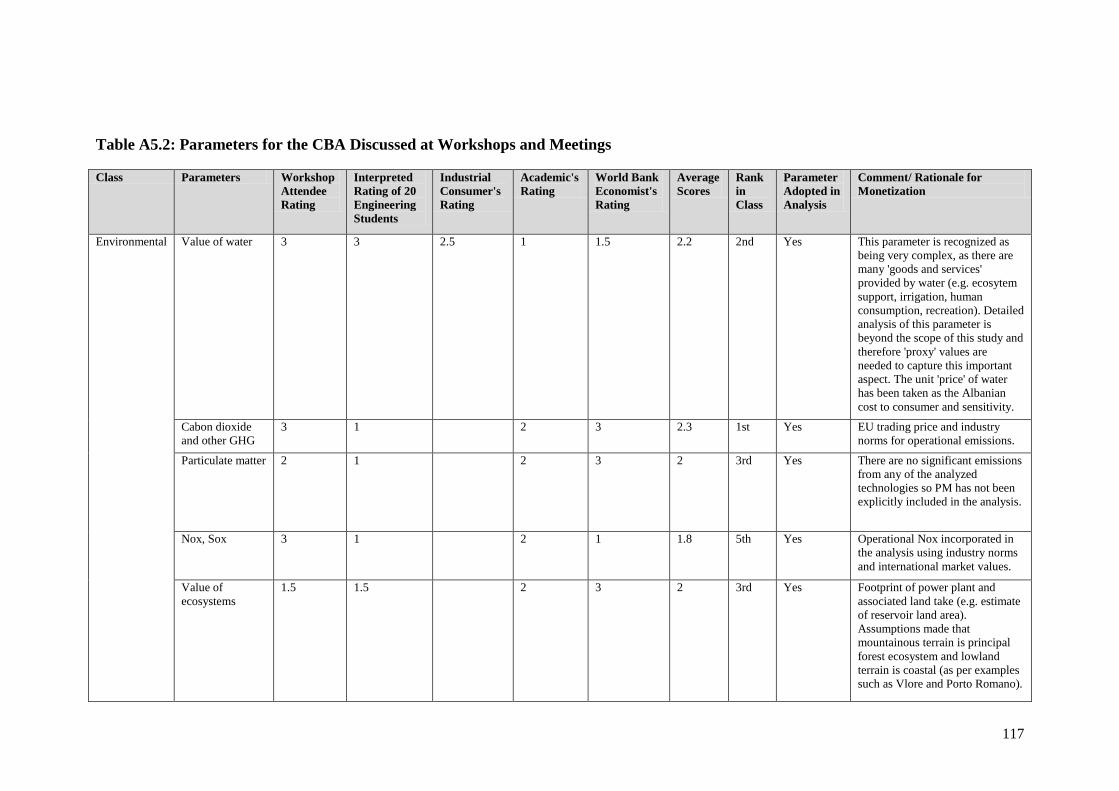
117
Table A5.2: Parameters for the CBA Discussed at Workshops and Meetings
Class Parameters Workshop
Attendee
Rating
Interpreted
Rating of 20
Engineering
Students
Industrial
Consumer's
Rating
Academic's
Rating
World Bank
Economist's
Rating
Average
Scores
Rank
in
Class
Parameter
Adopted in
Analysis
Comment/ Rationale for
Monetization
Environmental Value of water 3 3 2.5 1 1.5 2.2 2nd Yes This parameter is recognized as
being very complex, as there are
many 'goods and services'
provided by water (e.g. ecosytem
support, irrigation, human
consumption, recreation). Detailed
analysis of this parameter is
beyond the scope of this study and
therefore 'proxy' values are
needed to capture this important
aspect. The unit 'price' of water
has been taken as the Albanian
cost to consumer and sensitivity.
Cabon dioxide
and other GHG
3 1 2 3 2.3 1st Yes EU trading price and industry
norms for operational emissions.
Particulate matter 2 1 2 3 2 3rd Yes There are no significant emissions
from any of the analyzed
technologies so PM has not been
explicitly included in the analysis.
Nox, Sox 3 1 2 1 1.8 5th Yes Operational Nox incorporated in
the analysis using industry norms
and international market values.
Value of
ecosystems
1.5 1.5 2 3 2 3rd Yes Footprint of power plant and
associated land take (e.g. estimate
of reservoir land area).
Assumptions made that
mountainous terrain is principal
forest ecosystem and lowland
terrain is coastal (as per examples
such as Vlore and Porto Romano).

118
Class Parameters Workshop
Attendee
Rating
Interpreted
Rating of 20
Engineering
Students
Industrial
Consumer's
Rating
Academic's
Rating
World Bank
Economist's
Rating
Average
Scores
Rank
in
Class
Parameter
Adopted in
Analysis
Comment/ Rationale for
Monetization
Non-use values 1 0.5 1 0.8 6th No This parameter is difficult to
monetize without in depth study
that is beyond the scope of this
study.
Social Recreation
benefits
1 0 1 0.7 6th No Low priority and complex to
analyze. Assessment considered to
be beyond the scope of this study.
Impacts on
tourism
2 2 2 2nd No Although this was seem as a
priority by stakeholders, there is
insufficient information regarding
the likely impacts of energy
generation on tourism in Albania
to enable meaningful analysis in
this study. Further study could be
undertaken to quantify and
monetize this parameter.
Disturbance of
people and
property
3 1 3 1 2 2nd Yes It is clear that there are other
disturban ces such as community
relocation. The necessary data to
make a detailed assessment is
lacking at this stage so a proxy
has been used to approximate part
of this aspect.
Overall number
of employees per
MW generated/
job creation
1 1.5 1.3 5th No Low priority and partially
accounted for in OPEX and GDP
parameters.
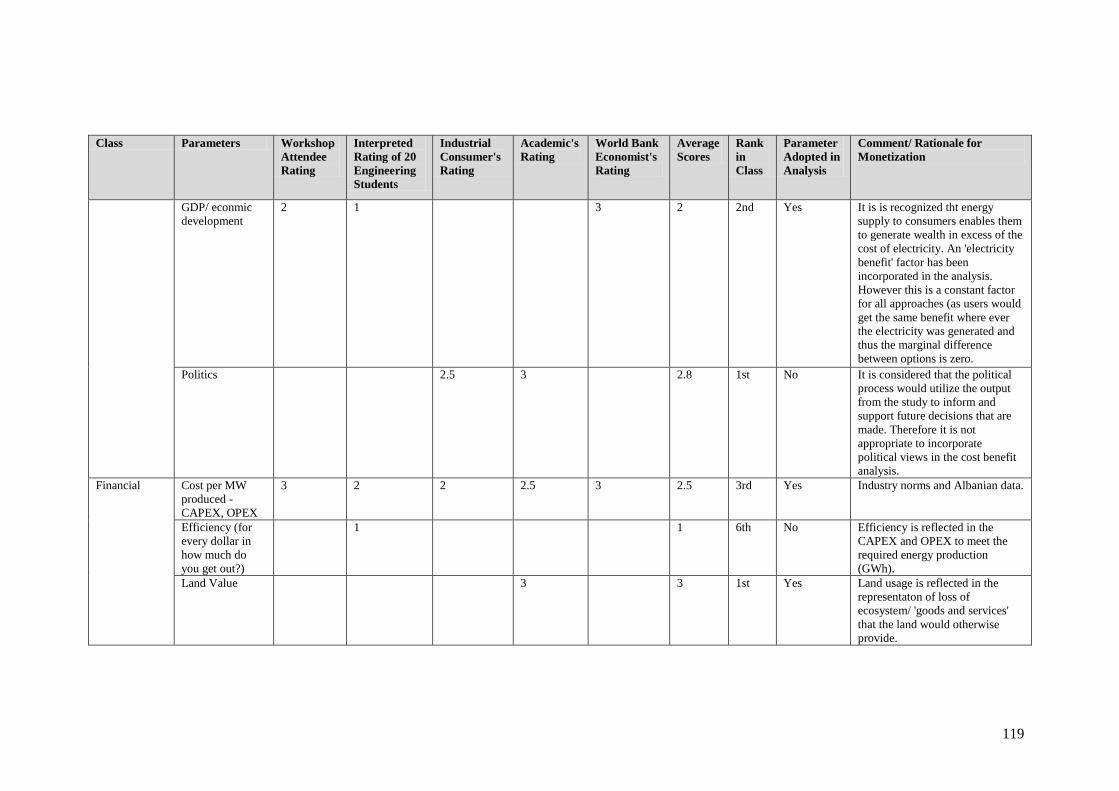
119
Class Parameters Workshop
Attendee
Rating
Interpreted
Rating of 20
Engineering
Students
Industrial
Consumer's
Rating
Academic's
Rating
World Bank
Economist's
Rating
Average
Scores
Rank
in
Class
Parameter
Adopted in
Analysis
Comment/ Rationale for
Monetization
GDP/ econmic
development
2 1 3 2 2nd Yes It is is recognized tht energy
supply to consumers enables them
to generate wealth in excess of the
cost of electricity. An 'electricity
benefit' factor has been
incorporated in the analysis.
However this is a constant factor
for all approaches (as users would
get the same benefit where ever
the electricity was generated and
thus the marginal difference
between options is zero.
Politics 2.5 3 2.8 1st No It is considered that the political
process would utilize the output
from the study to inform and
support future decisions that are
made. Therefore it is not
appropriate to incorporate
political views in the cost benefit
analysis.
Financial Cost per MW
produced -
CAPEX, OPEX
3 2 2 2.5 3 2.5 3rd Yes Industry norms and Albanian data.
Efficiency (for
every dollar in
how much do
you get out?)
1 1 6th No Efficiency is reflected in the
CAPEX and OPEX to meet the
required energy production
(GWh).
Land Value 3 3 1st Yes Land usage is reflected in the
representaton of loss of
ecosystem/ 'goods and services'
that the land would otherwise
provide.
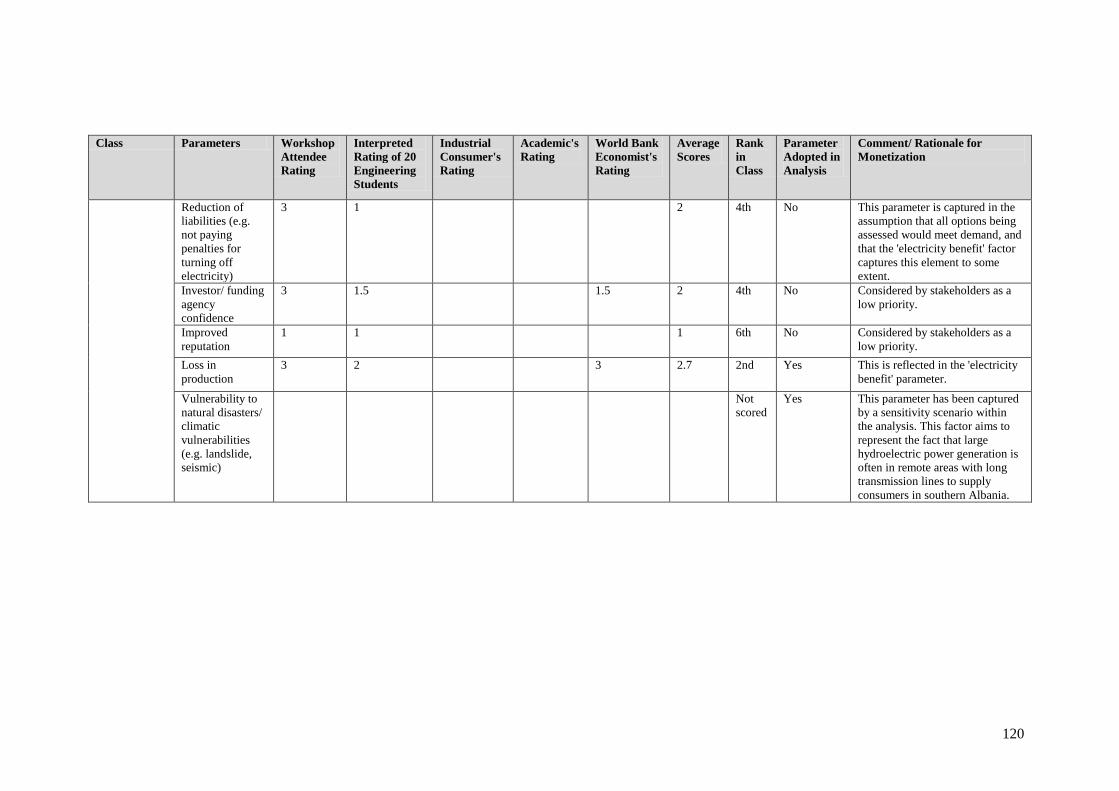
120
Class Parameters Workshop
Attendee
Rating
Interpreted
Rating of 20
Engineering
Students
Industrial
Consumer's
Rating
Academic's
Rating
World Bank
Economist's
Rating
Average
Scores
Rank
in
Class
Parameter
Adopted in
Analysis
Comment/ Rationale for
Monetization
Reduction of
liabilities (e.g.
not paying
penalties for
turning off
electricity)
3 1 2 4th No This parameter is captured in the
assumption that all options being
assessed would meet demand, and
that the 'electricity benefit' factor
captures this element to some
extent.
Investor/ funding
agency
confidence
3 1.5 1.5 2 4th No Considered by stakeholders as a
low priority.
Improved
reputation
1 1 1 6th No Considered by stakeholders as a
low priority.
Loss in
production
3 2 3 2.7 2nd Yes This is reflected in the 'electricity
benefit' parameter.
Vulnerability to
natural disasters/
climatic
vulnerabilities
(e.g. landslide,
seismic)
Not
scored
Yes This parameter has been captured
by a sensitivity scenario within
the analysis. This factor aims to
represent the fact that large
hydroelectric power generation is
often in remote areas with long
transmission lines to supply
consumers in southern Albania.
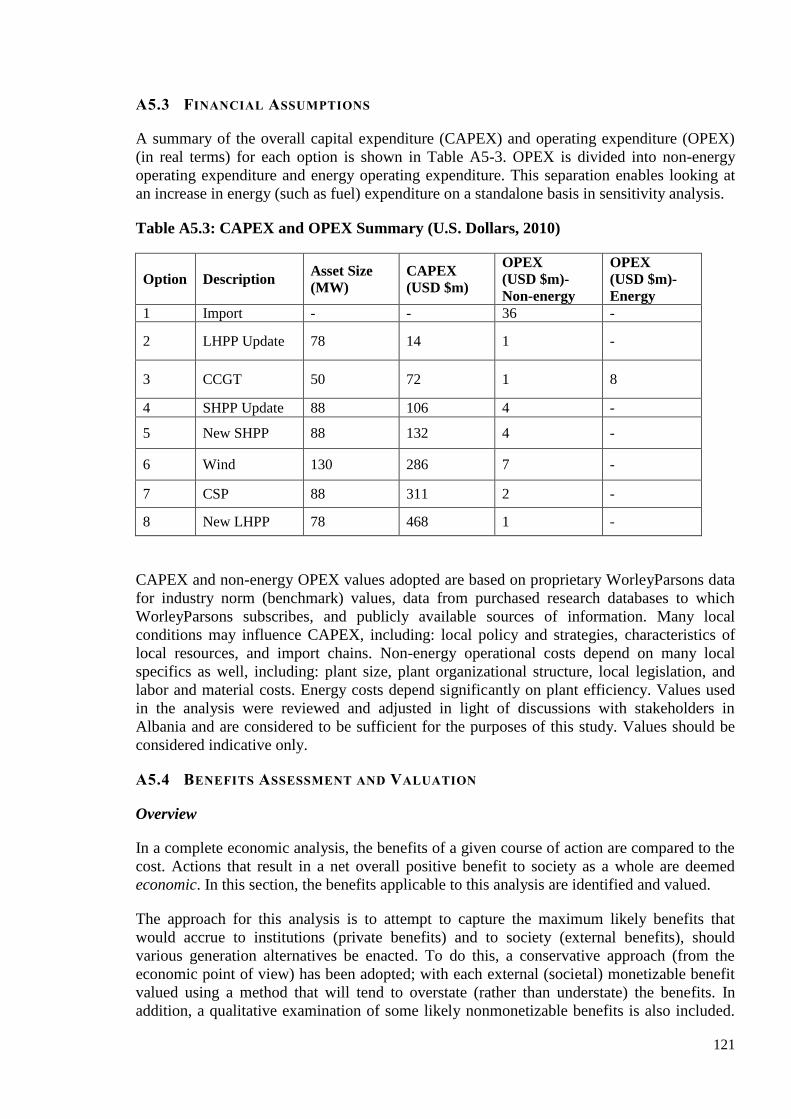
121
A5.3 FINANCIAL ASSUMPTIONS
A summary of the overall capital expenditure (CAPEX) and operating expenditure (OPEX)
(in real terms) for each option is shown in Table A5-3. OPEX is divided into non-energy
operating expenditure and energy operating expenditure. This separation enables looking at
an increase in energy (such as fuel) expenditure on a standalone basis in sensitivity analysis.
Table A5.3: CAPEX and OPEX Summary (U.S. Dollars, 2010)
Option Description Asset Size
(MW)
CAPEX
(USD $m)
OPEX
(USD $m)-
Non-energy
OPEX
(USD $m)-
Energy
1 Import - - 36 -
2 LHPP Update 78 14 1 -
3 CCGT 50 72 1 8
4 SHPP Update 88 106 4 -
5 New SHPP 88 132 4 -
6 Wind 130 286 7 -
7 CSP 88 311 2 -
8 New LHPP 78 468 1 -
CAPEX and non-energy OPEX values adopted are based on proprietary WorleyParsons data
for industry norm (benchmark) values, data from purchased research databases to which
WorleyParsons subscribes, and publicly available sources of information. Many local
conditions may influence CAPEX, including: local policy and strategies, characteristics of
local resources, and import chains. Non-energy operational costs depend on many local
specifics as well, including: plant size, plant organizational structure, local legislation, and
labor and material costs. Energy costs depend significantly on plant efficiency. Values used
in the analysis were reviewed and adjusted in light of discussions with stakeholders in
Albania and are considered to be sufficient for the purposes of this study. Values should be
considered indicative only.
A5.4 BENEFITS ASSESSMENT AND VALUATION
Overview
In a complete economic analysis, the benefits of a given course of action are compared to the
cost. Actions that result in a net overall positive benefit to society as a whole are deemed
economic. In this section, the benefits applicable to this analysis are identified and valued.
The approach for this analysis is to attempt to capture the maximum likely benefits that
would accrue to institutions (private benefits) and to society (external benefits), should
various generation alternatives be enacted. To do this, a conservative approach (from the
economic point of view) has been adopted; with each external (societal) monetizable benefit
valued using a method that will tend to overstate (rather than understate) the benefits. In
addition, a qualitative examination of some likely nonmonetizable benefits is also included.
122
Thus, in the CBA, likely costs are compared with conservatively high benefits, or disbenefits,
as the case may be. In adopting this approach, the report is biasing the economic analysis
towards the societal position. This is advantageous because it assures that the external
perspective is fully considered and valued, and helps to deflect any possible criticism that the
analysis favors the project proponent.
Scope and Basis of the Analysis
This analysis considers only the costs and benefits associated with the various options
designed to provide enough electricity to supplement the expected supply shortfall caused by
climate change. If an external asset is damaged by implementation of a particular option, this
damage appears as a disbenefit (negative benefit). If the value of the asset is maintained as it
is (undamaged), then there is no effect, and no benefit or disbenefit is created. So, for
example, if a water resource is left intact, in place, the current ecological support and option
values of the water remain, and there is no benefit or disbenefit included in the analysis. If
forest, as another example, is cleared, a negative benefit (disbenefit) is included.
A5.5 BENEFIT/DISBENEFIT VALUATION
The following benefit categories have been considered in the analysis. These benefits are
directly related to the Albanian energy sector and were included in the analysis based on the
workshop proceedings.
Carbon Dioxide and Other Greenhouse Gases (GHGs)
Owing to concerns about the effects of greenhouse gas emissions on the Earth‘s climate, caps
have been set on the total amount of GHG emissions in given areas, such as the EU. Permits,
which are permissions to emit a portion of the total allowable GHG emissions, are traded like
other commodities in open markets. The market price represents the value of the emissions
based on supply (the cap is initially set based on current scientific knowledge) and demand
(the desired amount of emission reductions); a balance between the interests of the people as
a whole and the individuals or groups who wish to emit GHG. A spot value from the
European market was used in the analysis, a value for GHG at USD $21.55 per tonne of CO2–
e (European Market Price, 11 May 2009). Other studies, such as the Stern Review (Stern,
2005), use detailed models to project the cumulative economic impact of additional unit of
GHG, called the social cost of carbon (SCC), estimated at approximately USD$75/t CO2-e.
This has been chosen as the ‗high case‘ cost for this analysis. Firms may also strategically set
an internal offset price based on their view of current markets and regulatory frameworks.
The analysis calculated the GHG emissions associated with each option, and includes these
costs over the range identified above.
Value of Water
The total economic value (TEV) of water can be broken down into three components: the
direct use-value (used or potentially useable by humans); the ecological support value, and
the option value (value to society from having the resource available at some time in the
future to be used). Each option realizes different components, dependent on the final state of
the water. In addition, the extent to which they are realized is dependent on the relative
quality of the water resulting from the treatment level for each option. Within the sensitivity
analysis, therefore, the TEV of water is varied around a base estimate of the value of water
sold to enterprise users of USD$0.93 / m3 (90 Lek / m
3) (Tirana Municipality, 2006).
123
Given the scarcity of readily accessible water that could develop under climate change, the
high unit value of water can be taken to be the cost of replacing a similar amount of fresh
water. The replacement value of fresh water is considered to be equivalent to the current cost
of desalination by conventional means, with a premium added for the external costs
associated with GHG emissions resulting from the desalination process. Wade (2004) has
reported that the cost of desalination varies between about US$0.70/m3 and US$5.30/m
3,
depending on the scale of the facility (larger capacity facilities produce water at lower unit
costs). Karagiannis (2008) indicated costs from US$1.60 for 2.70/m3, with oil at US$23/bbl.
Costs in the order of US$1.10/m3 are typically used by government bodies and commercial
operations. However, given the current high costs of fuel, for the capacity that would be
required to replace the volumes of water discussed in this analysis, a value of US$3.00/m3
has been chosen.
Loss of Ecological Resources
Any options that involve significant land clearing to make way for power plants will cause
direct ecological damage. For this analysis, it is assumed that these habitats would not
otherwise have been destroyed or damaged. Valuation estimates for the surface ecology in
the project area are provided by several sources, which provide estimates of the willingness-
to-pay (see hypothetical market techniques in Section 5.1 of this Annex) for preservation of
similar native vegetation (UNEP, 2001) of US$30 ha/yr for mountain ecosystems and
US$117 per ha/yr (Ladenberg et al., 2007) for coastal ecosystems. For each option that
involves land clearing, estimated impacted areas have been calculated.
Disturbance of People and Property
Construction of power plants can affect people and property in a negative way. For instance,
given two houses that are exactly the same except that one is closer to a power plant, the one
in the vicinity of a power plant will generally be cheaper. This reflects the value that people
place on the possible health troubles (real or imagined), and the general preference for a
natural view rather than neighboring a large industrial facility. The base value of this
disbenefit was US $1.82 /hh/ha/pa (Ladenburg, 2001). This value was prorated for the other
asset types based on the population density of the area and the footprint of the asset at hand.
Electricity Financial Benefit
The revenue received through the sale of produced electricity represents both the value of the
production of the electricity and its contribution to macroeconomic activity. The electricity
revenue is based on the stated average energy price, to all consumers, of 8.23 Lek per kWh
(US$0.085 per kWh) (Tugu, 2009). To account for the fact that the climate change
projections indicate that there will be less water available for hydropower electricity
production, the electricity revenue from hydropower assets has been adjusted downwards as
time progresses. The hydropower was adjusted downward on the basis of a total of a 15
percent decrease in generation capacity over the next 40 years, which is consistent with the
projections based on climate modeling (Annex 8). It is applied on a cumulative yearly basis,
with approximately 0.4 percent less capacity each year than the year before.
Benefits Summary
Based on information provided in Section 5, the range of expected values for each of the
major benefit categories is provided below in Table A5.4. Each of the values in the table is
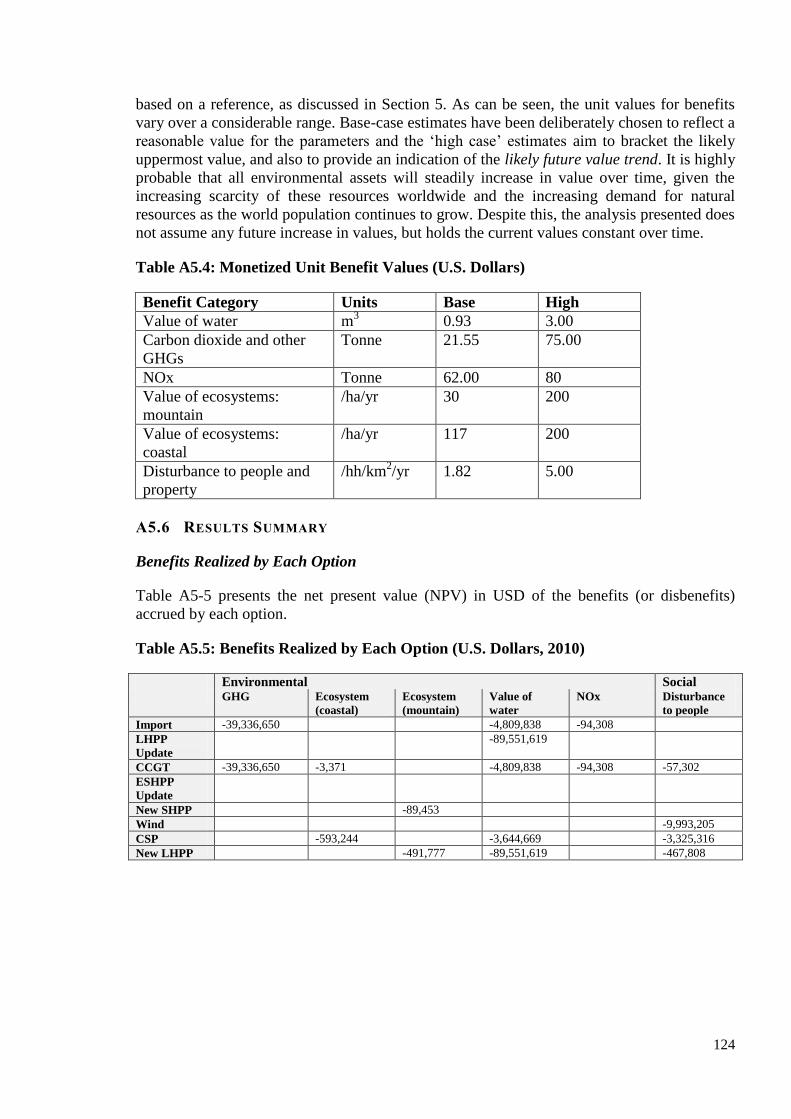
124
based on a reference, as discussed in Section 5. As can be seen, the unit values for benefits
vary over a considerable range. Base-case estimates have been deliberately chosen to reflect a
reasonable value for the parameters and the ‗high case‘ estimates aim to bracket the likely
uppermost value, and also to provide an indication of the likely future value trend. It is highly
probable that all environmental assets will steadily increase in value over time, given the
increasing scarcity of these resources worldwide and the increasing demand for natural
resources as the world population continues to grow. Despite this, the analysis presented does
not assume any future increase in values, but holds the current values constant over time.
Table A5.4: Monetized Unit Benefit Values (U.S. Dollars)
Benefit Category Units Base High
Value of water m3 0.93 3.00
Carbon dioxide and other
GHGs
Tonne 21.55 75.00
NOx Tonne 62.00 80
Value of ecosystems:
mountain
/ha/yr 30 200
Value of ecosystems:
coastal
/ha/yr 117 200
Disturbance to people and
property
/hh/km2/yr 1.82 5.00
A5.6 RESULTS SUMMARY
Benefits Realized by Each Option
Table A5-5 presents the net present value (NPV) in USD of the benefits (or disbenefits)
accrued by each option.
Table A5.5: Benefits Realized by Each Option (U.S. Dollars, 2010)
Environmental Social GHG Ecosystem
(coastal)
Ecosystem
(mountain)
Value of
water
NOx Disturbance
to people
Import -39,336,650 -4,809,838 -94,308
LHPP
Update
-89,551,619
CCGT -39,336,650 -3,371 -4,809,838 -94,308 -57,302
ESHPP
Update
New SHPP -89,453
Wind -9,993,205
CSP -593,244 -3,644,669 -3,325,316
New LHPP -491,777 -89,551,619 -467,808
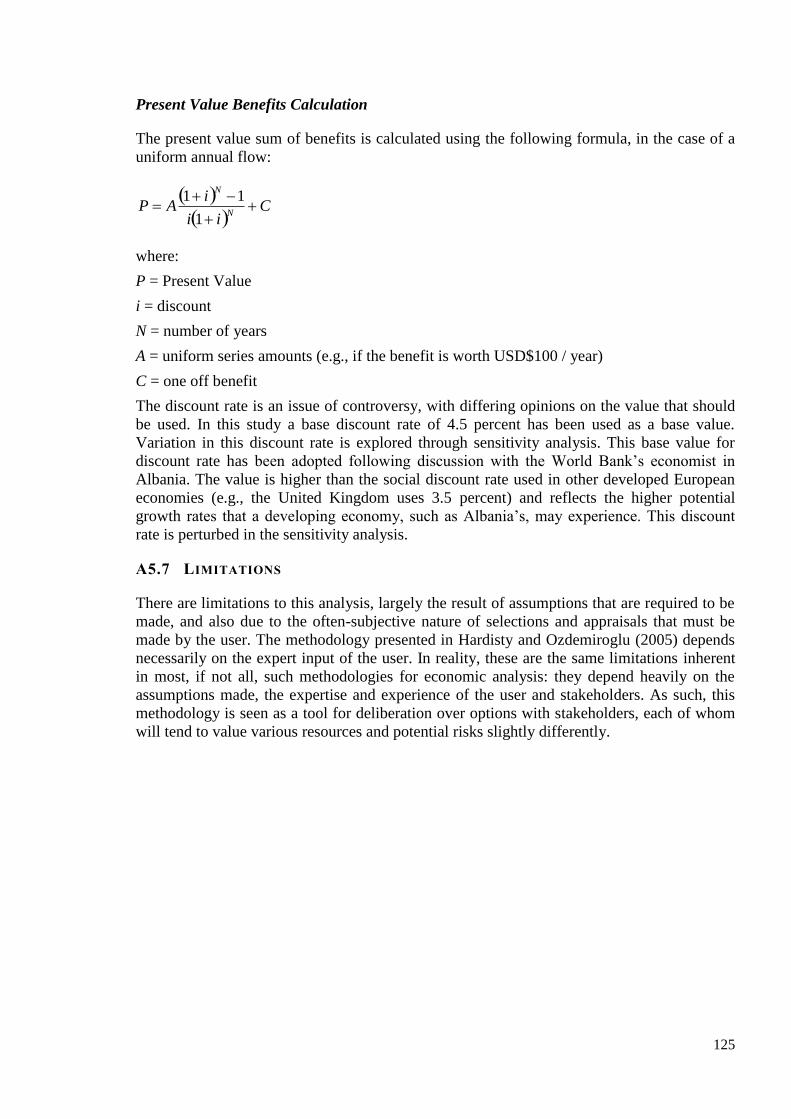
125
Present Value Benefits Calculation
The present value sum of benefits is calculated using the following formula, in the case of a
uniform annual flow:
Cii
iAP
N
N
1
11
where:
P = Present Value
i = discount
N = number of years
A = uniform series amounts (e.g., if the benefit is worth USD$100 / year)
C = one off benefit
The discount rate is an issue of controversy, with differing opinions on the value that should
be used. In this study a base discount rate of 4.5 percent has been used as a base value.
Variation in this discount rate is explored through sensitivity analysis. This base value for
discount rate has been adopted following discussion with the World Bank‘s economist in
Albania. The value is higher than the social discount rate used in other developed European
economies (e.g., the United Kingdom uses 3.5 percent) and reflects the higher potential
growth rates that a developing economy, such as Albania‘s, may experience. This discount
rate is perturbed in the sensitivity analysis.
A5.7 LIMITATIONS
There are limitations to this analysis, largely the result of assumptions that are required to be
made, and also due to the often-subjective nature of selections and appraisals that must be
made by the user. The methodology presented in Hardisty and Ozdemiroglu (2005) depends
necessarily on the expert input of the user. In reality, these are the same limitations inherent
in most, if not all, such methodologies for economic analysis: they depend heavily on the
assumptions made, the expertise and experience of the user and stakeholders. As such, this
methodology is seen as a tool for deliberation over options with stakeholders, each of whom
will tend to value various resources and potential risks slightly differently.
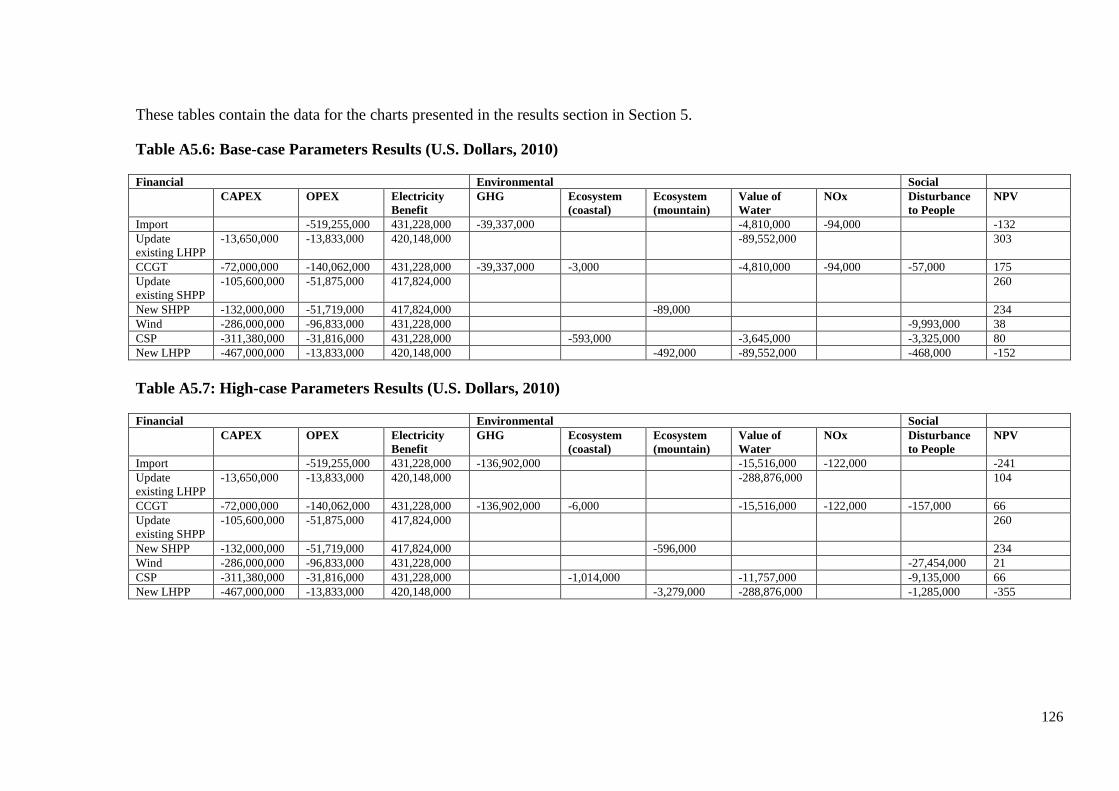
126
These tables contain the data for the charts presented in the results section in Section 5.
Table A5.6: Base-case Parameters Results (U.S. Dollars, 2010)
Financial Environmental Social
CAPEX OPEX Electricity
Benefit
GHG Ecosystem
(coastal)
Ecosystem
(mountain)
Value of
Water
NOx Disturbance
to People
NPV
Import -519,255,000 431,228,000 -39,337,000 -4,810,000 -94,000 -132
Update
existing LHPP
-13,650,000 -13,833,000 420,148,000 -89,552,000 303
CCGT -72,000,000 -140,062,000 431,228,000 -39,337,000 -3,000 -4,810,000 -94,000 -57,000 175
Update
existing SHPP
-105,600,000 -51,875,000 417,824,000 260
New SHPP -132,000,000 -51,719,000 417,824,000 -89,000 234
Wind -286,000,000 -96,833,000 431,228,000 -9,993,000 38
CSP -311,380,000 -31,816,000 431,228,000 -593,000 -3,645,000 -3,325,000 80
New LHPP -467,000,000 -13,833,000 420,148,000 -492,000 -89,552,000 -468,000 -152
Table A5.7: High-case Parameters Results (U.S. Dollars, 2010)
Financial Environmental Social
CAPEX OPEX Electricity
Benefit
GHG Ecosystem
(coastal)
Ecosystem
(mountain)
Value of
Water
NOx Disturbance
to People
NPV
Import -519,255,000 431,228,000 -136,902,000 -15,516,000 -122,000 -241
Update
existing LHPP
-13,650,000 -13,833,000 420,148,000 -288,876,000 104
CCGT -72,000,000 -140,062,000 431,228,000 -136,902,000 -6,000 -15,516,000 -122,000 -157,000 66
Update
existing SHPP
-105,600,000 -51,875,000 417,824,000 260
New SHPP -132,000,000 -51,719,000 417,824,000 -596,000 234
Wind -286,000,000 -96,833,000 431,228,000 -27,454,000 21
CSP -311,380,000 -31,816,000 431,228,000 -1,014,000 -11,757,000 -9,135,000 66
New LHPP -467,000,000 -13,833,000 420,148,000 -3,279,000 -288,876,000 -1,285,000 -355

127
ANNEX 6: FURTHER DETAILS ON OPTIONS TO IMPROVE THE CLIMATE
RESILIENCE OF ALBANIA’S ENERGY SECTOR
Next steps
Actions marked with an asterisk (*) are no-regrets actions that could improve Albania‘s energy
security even without climate change. Those marked with a cross (†) are included in the draft NES
active scenario.
Informational
* Compile digital databases on historic and observed climatological and hydrological conditions.
Provide free access on the Web to these data.
* Improve coordination of Albania‘s forecasting agencies (the Military Weather Services, Institute of
Energy, Water and Environment and the National Air Traffic Agency), by sharing data, expertise, and
financial strength to support better quality forecasting. These organizations could collectively engage
with energy-sector stakeholders to understand their data needs to support management of the energy /
climate interface.
* Upgrade Albania‘s weather and hydrological monitoring network, focusing most urgently on the
Drin basin:
Monitoring sites could be equipped with automatic devices able to record and transmit in real-
time the key weather variables (rainfall, runoff, temperature, sunshine hours, wind speed,
reservoir head, evaporation, turbidity, water equivalent of snow).
Measure sedimentation in reservoirs, which has not been measured for 40 years.
The data above could be collected by KESH and used in managing reservoirs for safety and
energy production.
Wind data are also required, measured at the height of wind turbines (80 to 100 m) to ensure
wind farms are designed appropriately and will operate efficiently. Once these data are
available, explore whether high wind speeds coincide with periods of lower rainfall, in which
case wind power could provide a useful resource when generation from hydropower facilities
is lower.
* Develop in-country or obtain weather and climate forecasts appropriate for energy-sector planning
needs:
Short-range forecasts (1 to 3 days ahead) could be provided by IEWE—including weather
products for energy demand forecasting (temperature, cloudiness), reservoir management
(rainfall), safety and disaster management (heavy rainfall, high winds, lightning strikes)
* Medium-range forecasts (3 to 10 days ahead) could be obtained by subscribing, for example,
to the European Centre for Medium-range Weather Forecasting regional forecasts—
particularly for use by KESH—to facilitate effective management of water reserves for
hydropower generation
* Seasonal forecasts (several months ahead) could be developed by IEWE from statistical
models of teleconnections, using observed and historical data for application to energy-sector
planning
Climate change scenarios (years and decades ahead):
o These should be at a spatial resolution suitable for river basin planning (e.g., 50 km
50 km)
o They should be developed by downscaling ensembles of outputs from global climate
models (GCMs), which are provided by Met Agencies around the world, coordinated
through the World Meteorological Organization.
o The GCMs to be included in the ensemble should be those that are best able to
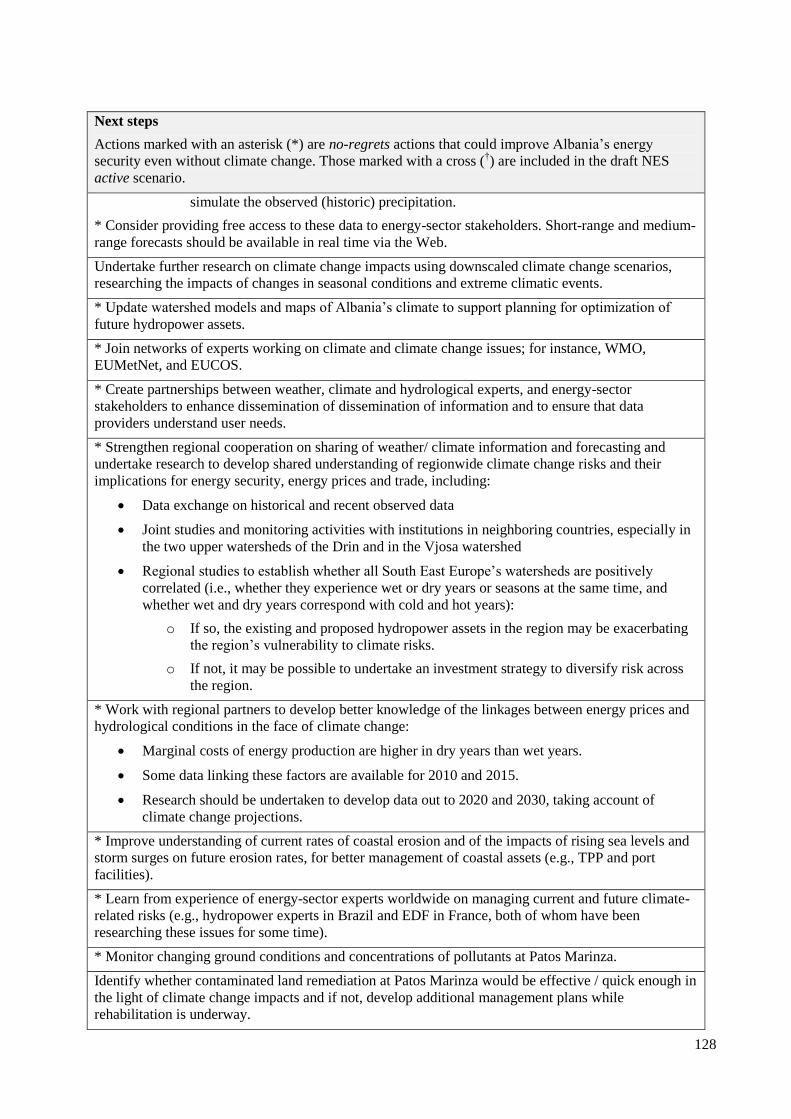
128
Next steps
Actions marked with an asterisk (*) are no-regrets actions that could improve Albania‘s energy
security even without climate change. Those marked with a cross (†) are included in the draft NES
active scenario.
simulate the observed (historic) precipitation.
* Consider providing free access to these data to energy-sector stakeholders. Short-range and medium-
range forecasts should be available in real time via the Web.
Undertake further research on climate change impacts using downscaled climate change scenarios,
researching the impacts of changes in seasonal conditions and extreme climatic events.
* Update watershed models and maps of Albania‘s climate to support planning for optimization of
future hydropower assets.
* Join networks of experts working on climate and climate change issues; for instance, WMO,
EUMetNet, and EUCOS.
* Create partnerships between weather, climate and hydrological experts, and energy-sector
stakeholders to enhance dissemination of dissemination of information and to ensure that data
providers understand user needs.
* Strengthen regional cooperation on sharing of weather/ climate information and forecasting and
undertake research to develop shared understanding of regionwide climate change risks and their
implications for energy security, energy prices and trade, including:
Data exchange on historical and recent observed data
Joint studies and monitoring activities with institutions in neighboring countries, especially in
the two upper watersheds of the Drin and in the Vjosa watershed
Regional studies to establish whether all South East Europe‘s watersheds are positively
correlated (i.e., whether they experience wet or dry years or seasons at the same time, and
whether wet and dry years correspond with cold and hot years):
o If so, the existing and proposed hydropower assets in the region may be exacerbating
the region‘s vulnerability to climate risks.
o If not, it may be possible to undertake an investment strategy to diversify risk across
the region.
* Work with regional partners to develop better knowledge of the linkages between energy prices and
hydrological conditions in the face of climate change:
Marginal costs of energy production are higher in dry years than wet years.
Some data linking these factors are available for 2010 and 2015.
Research should be undertaken to develop data out to 2020 and 2030, taking account of
climate change projections.
* Improve understanding of current rates of coastal erosion and of the impacts of rising sea levels and
storm surges on future erosion rates, for better management of coastal assets (e.g., TPP and port
facilities).
* Learn from experience of energy-sector experts worldwide on managing current and future climate-
related risks (e.g., hydropower experts in Brazil and EDF in France, both of whom have been
researching these issues for some time).
* Monitor changing ground conditions and concentrations of pollutants at Patos Marinza.
Identify whether contaminated land remediation at Patos Marinza would be effective / quick enough in
the light of climate change impacts and if not, develop additional management plans while
rehabilitation is underway.
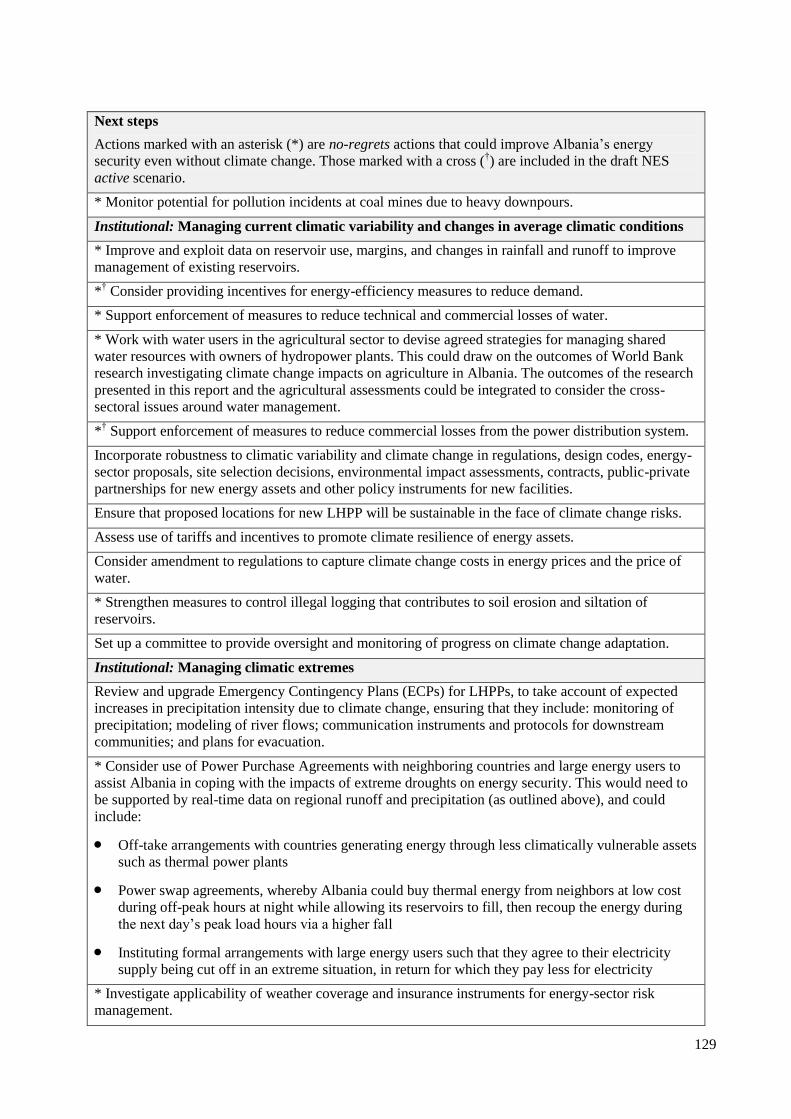
129
Next steps
Actions marked with an asterisk (*) are no-regrets actions that could improve Albania‘s energy
security even without climate change. Those marked with a cross (†) are included in the draft NES
active scenario.
* Monitor potential for pollution incidents at coal mines due to heavy downpours.
Institutional: Managing current climatic variability and changes in average climatic conditions
* Improve and exploit data on reservoir use, margins, and changes in rainfall and runoff to improve
management of existing reservoirs.
*† Consider providing incentives for energy-efficiency measures to reduce demand.
* Support enforcement of measures to reduce technical and commercial losses of water.
* Work with water users in the agricultural sector to devise agreed strategies for managing shared
water resources with owners of hydropower plants. This could draw on the outcomes of World Bank
research investigating climate change impacts on agriculture in Albania. The outcomes of the research
presented in this report and the agricultural assessments could be integrated to consider the cross-
sectoral issues around water management.
*† Support enforcement of measures to reduce commercial losses from the power distribution system.
Incorporate robustness to climatic variability and climate change in regulations, design codes, energy-
sector proposals, site selection decisions, environmental impact assessments, contracts, public-private
partnerships for new energy assets and other policy instruments for new facilities.
Ensure that proposed locations for new LHPP will be sustainable in the face of climate change risks.
Assess use of tariffs and incentives to promote climate resilience of energy assets.
Consider amendment to regulations to capture climate change costs in energy prices and the price of
water.
* Strengthen measures to control illegal logging that contributes to soil erosion and siltation of
reservoirs.
Set up a committee to provide oversight and monitoring of progress on climate change adaptation.
Institutional: Managing climatic extremes
Review and upgrade Emergency Contingency Plans (ECPs) for LHPPs, to take account of expected
increases in precipitation intensity due to climate change, ensuring that they include: monitoring of
precipitation; modeling of river flows; communication instruments and protocols for downstream
communities; and plans for evacuation.
* Consider use of Power Purchase Agreements with neighboring countries and large energy users to
assist Albania in coping with the impacts of extreme droughts on energy security. This would need to
be supported by real-time data on regional runoff and precipitation (as outlined above), and could
include:
Off-take arrangements with countries generating energy through less climatically vulnerable assets
such as thermal power plants
Power swap agreements, whereby Albania could buy thermal energy from neighbors at low cost
during off-peak hours at night while allowing its reservoirs to fill, then recoup the energy during
the next day‘s peak load hours via a higher fall
Instituting formal arrangements with large energy users such that they agree to their electricity
supply being cut off in an extreme situation, in return for which they pay less for electricity
* Investigate applicability of weather coverage and insurance instruments for energy-sector risk
management.

130
Next steps
Actions marked with an asterisk (*) are no-regrets actions that could improve Albania‘s energy
security even without climate change. Those marked with a cross (†) are included in the draft NES
active scenario.
* Support development of contingency plans in collaboration with stakeholders for better management
of extreme climatic events and ensure that resources could be mobilized effectively to respond to
them.
* Ensure that regulations on dam security are enforced.
Physical / technical
Optimize existing energy assets:
* Improve maintenance of existing assets, many of which were designed and constructed several
decades ago.
Check that the sizing of existing assets is robust to climate variability and projected changes in
average climatic conditions and explore whether water storage could be increased at reasonable
cost to help manage seasonal variations.
Review old and/or inefficient equipment and identify cost-effective measures to improve
efficiencies, such as:
o Clearing / redesigning trash racks
o Upgrading turbines and generators
o Replacing equipment to reduce water losses (e.g., shut-off valves)
o Improving aprons below dams to reduce erosion
o Raising dam crest on Fierze
o Increasing capacity of spillways on Fierze and Komani dams
o Developing pump storage scheme on Drin river cascade
o Digging wider channels for SHPPs
* Reduce losses:
Reduce electricity transmission losses.
Reduce losses of water—hold dialogues with stakeholders sharing watersheds to discuss losses
and establish how best to work together to reduce them.
† Improve demand-side energy efficiency through incentives (e.g., for insulation and energy
efficient appliances) and enforcement.
Ensure new assets are resilient:
For new assets at the design stage, review the robustness of design and site locations to climatic
variability and projected climate change—including design of energy generation assets as well as
associated infrastructure, such as port facilities.
*† Diversify energy generation asset types into non-hydropower renewables and thermal power plants,
ensuring that site selection and design are resilient to climate change.
† Increase hydropower installed capacity, ensuring that new facilities are designed to cope with
changing climate risks.
*† Provide better interconnections to facilitate regional energy trade.
*† Reduce energy demand and improve energy efficiency through greater use of domestic solar water
heating, improved building standards, use of lower energy appliances, and use of alternative heating

131
Next steps
Actions marked with an asterisk (*) are no-regrets actions that could improve Albania‘s energy
security even without climate change. Those marked with a cross (†) are included in the draft NES
active scenario.
sources other than electricity.
Optimize transmission and distribution by reducing technical losses (e.g., insulation of cables, under
grounding of critical cables, consider DC rather than AC for long lines).
*† Install alternative fuel sources (other than electricity) for heating buildings, such as solar water
heaters, geothermal.
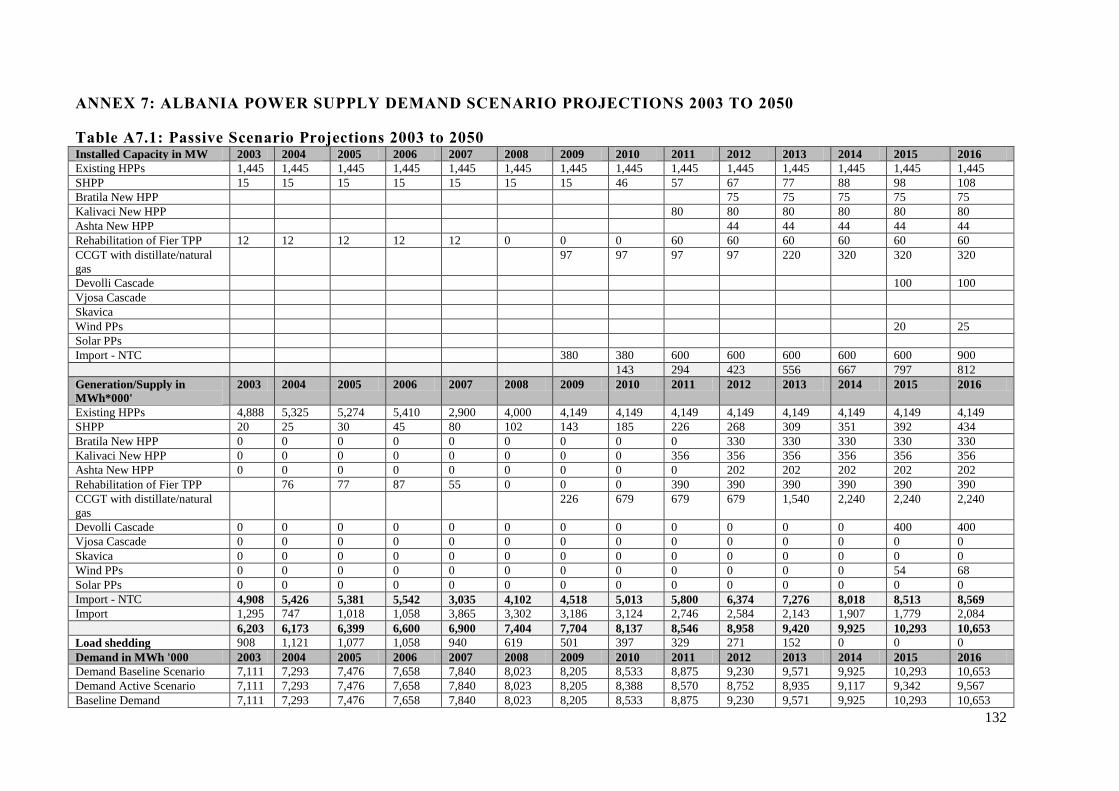
132
ANNEX 7: ALBANIA POWER SUPPLY DEMAND SCENARIO PROJECTIONS 2003 TO 2050
Table A7.1: Passive Scenario Projections 2003 to 2050 Installed Capacity in MW 2003 2004 2005 2006 2007 2008 2009 2010 2011 2012 2013 2014 2015 2016
Existing HPPs 1,445 1,445 1,445 1,445 1,445 1,445 1,445 1,445 1,445 1,445 1,445 1,445 1,445 1,445
SHPP 15 15 15 15 15 15 15 46 57 67 77 88 98 108
Bratila New HPP 75 75 75 75 75
Kalivaci New HPP 80 80 80 80 80 80
Ashta New HPP 44 44 44 44 44
Rehabilitation of Fier TPP 12 12 12 12 12 0 0 0 60 60 60 60 60 60
CCGT with distillate/natural
gas
97 97 97 97 220 320 320 320
Devolli Cascade 100 100
Vjosa Cascade
Skavica
Wind PPs 20 25
Solar PPs
Import - NTC 380 380 600 600 600 600 600 900
143 294 423 556 667 797 812
Generation/Supply in
MWh*000'
2003 2004 2005 2006 2007 2008 2009 2010 2011 2012 2013 2014 2015 2016
Existing HPPs 4,888 5,325 5,274 5,410 2,900 4,000 4,149 4,149 4,149 4,149 4,149 4,149 4,149 4,149
SHPP 20 25 30 45 80 102 143 185 226 268 309 351 392 434
Bratila New HPP 0 0 0 0 0 0 0 0 0 330 330 330 330 330
Kalivaci New HPP 0 0 0 0 0 0 0 0 356 356 356 356 356 356
Ashta New HPP 0 0 0 0 0 0 0 0 0 202 202 202 202 202
Rehabilitation of Fier TPP 76 77 87 55 0 0 0 390 390 390 390 390 390
CCGT with distillate/natural
gas
226 679 679 679 1,540 2,240 2,240 2,240
Devolli Cascade 0 0 0 0 0 0 0 0 0 0 0 0 400 400
Vjosa Cascade 0 0 0 0 0 0 0 0 0 0 0 0 0 0
Skavica 0 0 0 0 0 0 0 0 0 0 0 0 0 0
Wind PPs 0 0 0 0 0 0 0 0 0 0 0 0 54 68
Solar PPs 0 0 0 0 0 0 0 0 0 0 0 0 0 0
Import - NTC 4,908 5,426 5,381 5,542 3,035 4,102 4,518 5,013 5,800 6,374 7,276 8,018 8,513 8,569
Import 1,295 747 1,018 1,058 3,865 3,302 3,186 3,124 2,746 2,584 2,143 1,907 1,779 2,084
6,203 6,173 6,399 6,600 6,900 7,404 7,704 8,137 8,546 8,958 9,420 9,925 10,293 10,653
Load shedding 908 1,121 1,077 1,058 940 619 501 397 329 271 152 0 0 0
Demand in MWh '000 2003 2004 2005 2006 2007 2008 2009 2010 2011 2012 2013 2014 2015 2016
Demand Baseline Scenario 7,111 7,293 7,476 7,658 7,840 8,023 8,205 8,533 8,875 9,230 9,571 9,925 10,293 10,653
Demand Active Scenario 7,111 7,293 7,476 7,658 7,840 8,023 8,205 8,388 8,570 8,752 8,935 9,117 9,342 9,567
Baseline Demand 7,111 7,293 7,476 7,658 7,840 8,023 8,205 8,533 8,875 9,230 9,571 9,925 10,293 10,653

133
Installed Capacity in MW 2017 2018 2019 2020 2021 2022 2023 2024 2025 2026 2027 2028 2029 2030
Existing HPPs 1,445 1,445 1,445 1,445 1,445 1,445 1,445 1,445 1,445 1,445 1,445 1,445 1,445 1,445
SHPP 119 129 140 150 165 180 195 210 225 240 255 270 285 300
Bratila New HPP 75 75 75 75 75 75 75 75 75 75 75 75 75 75
Kalivaci New HPP 80 80 80 80 80 80 80 80 80 80 80 80 80 80
Ashta New HPP 44 44 44 44 44 44 44 44 44 44 44 44 44 44
Rehabilitation of Fier TPP 60 60 60 60 60 60 60 60 60 60 60 60 60 60
CCGT with distillate/natural gas 420 420 420 420 520 520 620 620 620 620 620 620 750 750
Devolli Cascade 100 100 100 200 200 200 200 200 200 200 200 200 200 300
Vjosa Cascade 100 100 100 100 200 200 200 200 200 200 200 200 200 200
Skavica 150 150 150 150 350 350 350 350 350 350
Wind PPs 30 35 40 45 60 60 60 60 60 80 90 100 110 120
Solar PPs
Import - NTC 900 900 900 900 900 900 900 900 900 1,200 1,200 1,200 1,200 1,200
1028 1043 1059 1174 1554 1569 1684 1699 1914 1949 1974 1999 2154 2279
Generation/Supply in
MWh*000'
2017 2018 2019 2020 2021 2022 2023 2024 2025 2026 2027 2028 2029 2030
Existing HPPs 4,149 4,149 4,149 4,149 4,149 4,149 4,149 4,149 4,149 4,149 4,149 4,149 4,149 4,149
SHPP 475 517 558 600 660 720 780 840 900 960 1,020 1,080 1,140 1,200
Bratila New HPP 330 330 330 330 330 330 330 330 330 330 330 330 330 330
Kalivaci New HPP 356 356 356 356 356 356 356 356 356 356 356 356 356 356
Ashta New HPP 202 202 202 202 202 202 202 202 202 202 202 202 202 202
Rehabilitation of Fier TPP 390 390 390 390 390 390 390 390 390 390 390 390 390 390
CCGT with distillate/natural gas 2,940 2,940 2,940 2,940 3,640 3,640 4,340 4,340 4,030 4,340 4,340 4,340 5,250 5,250
Devolli Cascade 400 400 400 800 800 800 800 800 800 800 800 800 800 1,200
Vjosa Cascade 410 410 410 410 820 820 820 820 820 820 820 820 820 820
Skavica 0 0 0 0 600 600 600 600 1,400 1,400 1,400 1,400 1,400 1,400
Wind PPs 81 95 108 122 162 162 162 162 162 216 243 270 297 324
Solar PPs 0 0 0 0 0 0 0 0 0 0 0 0 0 0
Import - NTC 9,733 9,789 9,843 10,299 12,109 12,169 12,929 12,989 13,539 13,963 14,050 14,137 15,134 15,621
Import 1,292 1,568 1,854 1,726 252 501 58 322 105 63 369 686 104 43
11,026 11,356 11,697 12,025 12,361 12,670 12,987 13,312 13,645 14,027 14,419 14,823 15,238 15,665
Load shedding 0 0 0 0 0 0 0 0 0 0 0 0 0 0
Demand in MWh '000 2017 2018 2019 2020 2021 2022 2023 2024 2025 2026 2027 2028 2029 2030
Demand Baseline Scenario 11,026 11,356 11,697 12,025 12,361 12,670 12,987 13,312 13,645 14,027 14,419 14,823 15,238 15,665
Demand Active Scenario 9,792 10,017 10,242 10,467 10,697 10,932 11,172 11,418 11,668 11,925 12,187 12,454 12,728 13,008
Baseline Demand 11,026 11,356 11,697 12,025 12,361 12,670 12,987 13,312 13,645 14,027 14,419 14,823 15,238 15,665
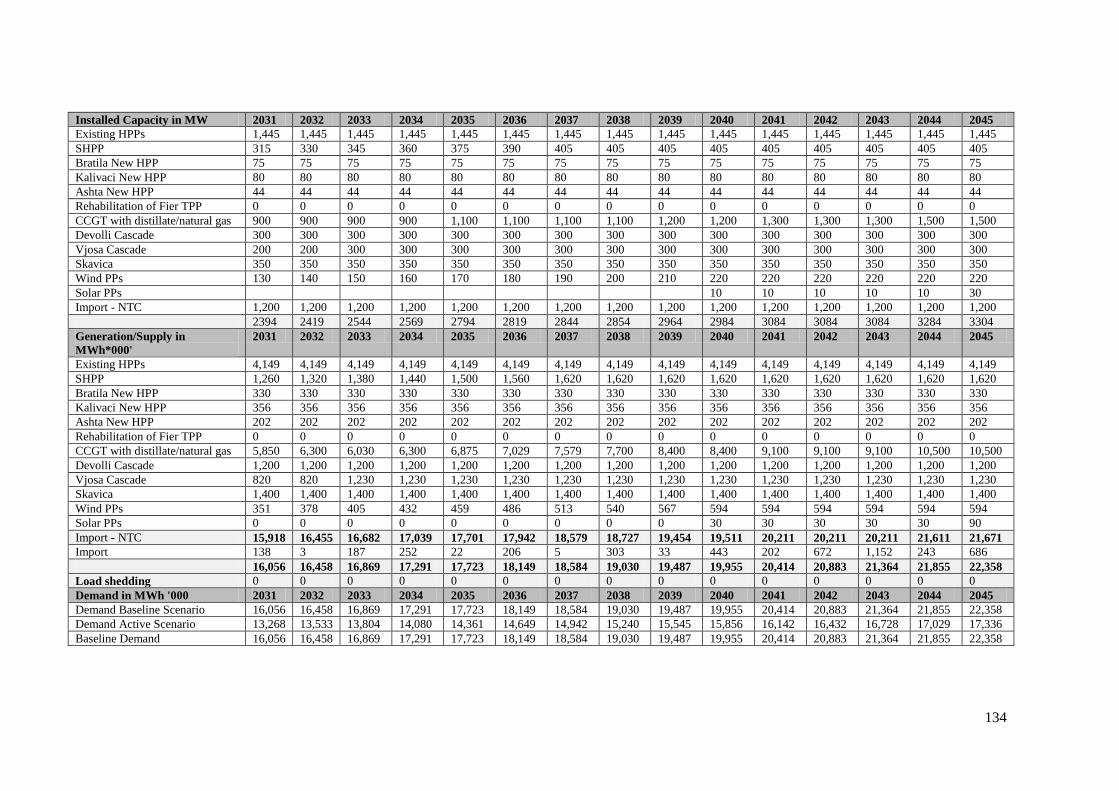
134
Installed Capacity in MW 2031 2032 2033 2034 2035 2036 2037 2038 2039 2040 2041 2042 2043 2044 2045
Existing HPPs 1,445 1,445 1,445 1,445 1,445 1,445 1,445 1,445 1,445 1,445 1,445 1,445 1,445 1,445 1,445
SHPP 315 330 345 360 375 390 405 405 405 405 405 405 405 405 405
Bratila New HPP 75 75 75 75 75 75 75 75 75 75 75 75 75 75 75
Kalivaci New HPP 80 80 80 80 80 80 80 80 80 80 80 80 80 80 80
Ashta New HPP 44 44 44 44 44 44 44 44 44 44 44 44 44 44 44
Rehabilitation of Fier TPP 0 0 0 0 0 0 0 0 0 0 0 0 0 0 0
CCGT with distillate/natural gas 900 900 900 900 1,100 1,100 1,100 1,100 1,200 1,200 1,300 1,300 1,300 1,500 1,500
Devolli Cascade 300 300 300 300 300 300 300 300 300 300 300 300 300 300 300
Vjosa Cascade 200 200 300 300 300 300 300 300 300 300 300 300 300 300 300
Skavica 350 350 350 350 350 350 350 350 350 350 350 350 350 350 350
Wind PPs 130 140 150 160 170 180 190 200 210 220 220 220 220 220 220
Solar PPs 10 10 10 10 10 30
Import - NTC 1,200 1,200 1,200 1,200 1,200 1,200 1,200 1,200 1,200 1,200 1,200 1,200 1,200 1,200 1,200
2394 2419 2544 2569 2794 2819 2844 2854 2964 2984 3084 3084 3084 3284 3304
Generation/Supply in
MWh*000'
2031 2032 2033 2034 2035 2036 2037 2038 2039 2040 2041 2042 2043 2044 2045
Existing HPPs 4,149 4,149 4,149 4,149 4,149 4,149 4,149 4,149 4,149 4,149 4,149 4,149 4,149 4,149 4,149
SHPP 1,260 1,320 1,380 1,440 1,500 1,560 1,620 1,620 1,620 1,620 1,620 1,620 1,620 1,620 1,620
Bratila New HPP 330 330 330 330 330 330 330 330 330 330 330 330 330 330 330
Kalivaci New HPP 356 356 356 356 356 356 356 356 356 356 356 356 356 356 356
Ashta New HPP 202 202 202 202 202 202 202 202 202 202 202 202 202 202 202
Rehabilitation of Fier TPP 0 0 0 0 0 0 0 0 0 0 0 0 0 0 0
CCGT with distillate/natural gas 5,850 6,300 6,030 6,300 6,875 7,029 7,579 7,700 8,400 8,400 9,100 9,100 9,100 10,500 10,500
Devolli Cascade 1,200 1,200 1,200 1,200 1,200 1,200 1,200 1,200 1,200 1,200 1,200 1,200 1,200 1,200 1,200
Vjosa Cascade 820 820 1,230 1,230 1,230 1,230 1,230 1,230 1,230 1,230 1,230 1,230 1,230 1,230 1,230
Skavica 1,400 1,400 1,400 1,400 1,400 1,400 1,400 1,400 1,400 1,400 1,400 1,400 1,400 1,400 1,400
Wind PPs 351 378 405 432 459 486 513 540 567 594 594 594 594 594 594
Solar PPs 0 0 0 0 0 0 0 0 0 30 30 30 30 30 90
Import - NTC 15,918 16,455 16,682 17,039 17,701 17,942 18,579 18,727 19,454 19,511 20,211 20,211 20,211 21,611 21,671
Import 138 3 187 252 22 206 5 303 33 443 202 672 1,152 243 686
16,056 16,458 16,869 17,291 17,723 18,149 18,584 19,030 19,487 19,955 20,414 20,883 21,364 21,855 22,358
Load shedding 0 0 0 0 0 0 0 0 0 0 0 0 0 0 0
Demand in MWh '000 2031 2032 2033 2034 2035 2036 2037 2038 2039 2040 2041 2042 2043 2044 2045
Demand Baseline Scenario 16,056 16,458 16,869 17,291 17,723 18,149 18,584 19,030 19,487 19,955 20,414 20,883 21,364 21,855 22,358
Demand Active Scenario 13,268 13,533 13,804 14,080 14,361 14,649 14,942 15,240 15,545 15,856 16,142 16,432 16,728 17,029 17,336
Baseline Demand 16,056 16,458 16,869 17,291 17,723 18,149 18,584 19,030 19,487 19,955 20,414 20,883 21,364 21,855 22,358
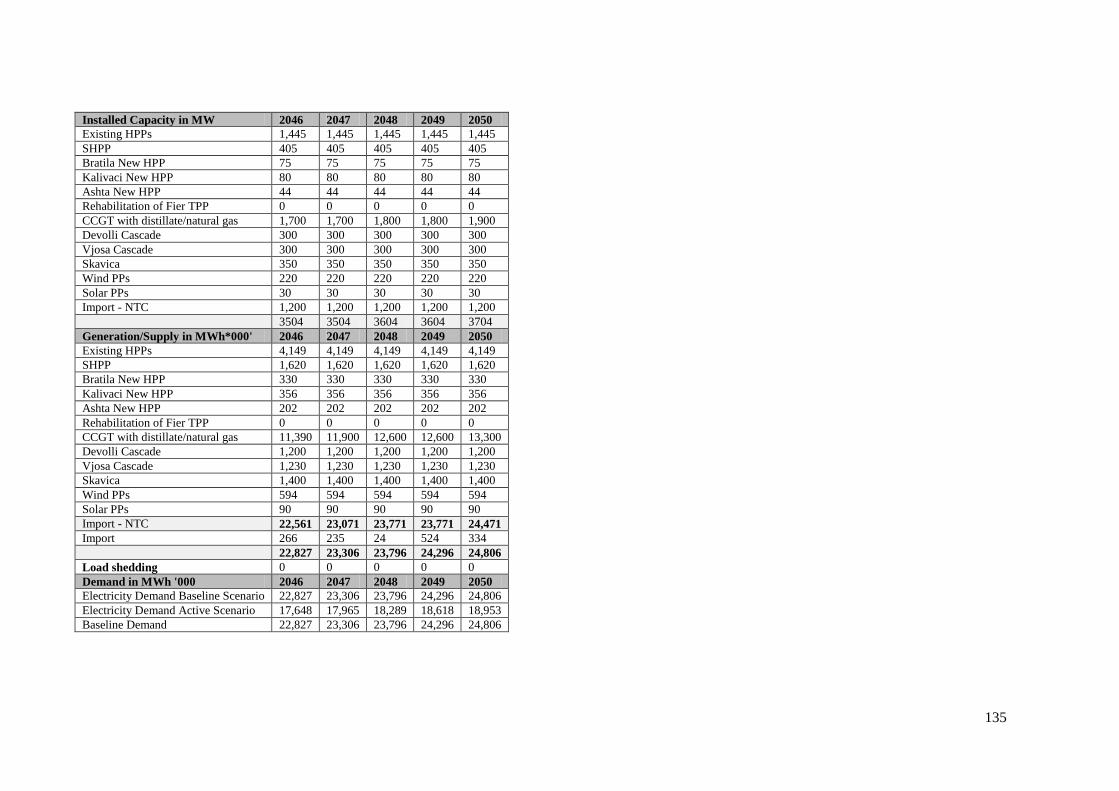
135
Installed Capacity in MW 2046 2047 2048 2049 2050
Existing HPPs 1,445 1,445 1,445 1,445 1,445
SHPP 405 405 405 405 405
Bratila New HPP 75 75 75 75 75
Kalivaci New HPP 80 80 80 80 80
Ashta New HPP 44 44 44 44 44
Rehabilitation of Fier TPP 0 0 0 0 0
CCGT with distillate/natural gas 1,700 1,700 1,800 1,800 1,900
Devolli Cascade 300 300 300 300 300
Vjosa Cascade 300 300 300 300 300
Skavica 350 350 350 350 350
Wind PPs 220 220 220 220 220
Solar PPs 30 30 30 30 30
Import - NTC 1,200 1,200 1,200 1,200 1,200
3504 3504 3604 3604 3704
Generation/Supply in MWh*000' 2046 2047 2048 2049 2050
Existing HPPs 4,149 4,149 4,149 4,149 4,149
SHPP 1,620 1,620 1,620 1,620 1,620
Bratila New HPP 330 330 330 330 330
Kalivaci New HPP 356 356 356 356 356
Ashta New HPP 202 202 202 202 202
Rehabilitation of Fier TPP 0 0 0 0 0
CCGT with distillate/natural gas 11,390 11,900 12,600 12,600 13,300
Devolli Cascade 1,200 1,200 1,200 1,200 1,200
Vjosa Cascade 1,230 1,230 1,230 1,230 1,230
Skavica 1,400 1,400 1,400 1,400 1,400
Wind PPs 594 594 594 594 594
Solar PPs 90 90 90 90 90
Import - NTC 22,561 23,071 23,771 23,771 24,471
Import 266 235 24 524 334
22,827 23,306 23,796 24,296 24,806
Load shedding 0 0 0 0 0
Demand in MWh '000 2046 2047 2048 2049 2050
Electricity Demand Baseline Scenario 22,827 23,306 23,796 24,296 24,806
Electricity Demand Active Scenario 17,648 17,965 18,289 18,618 18,953
Baseline Demand 22,827 23,306 23,796 24,296 24,806

136
Table A7.2: Active Scenario Projections 2003 to 2050
Installed Capacity in MW 2003 2004 2005 2006 2007 2008 2009 2010 2011 2012 2013 2014 2015 2016
Existing HPPs 1,445 1,445 1,445 1,445 1,445 1,445 1,445 1,445 1,445 1,445 1,445 1,445 1,445 1,445
SHPP 15 15 15 15 15 15 15 46 57 67 77 88 98 108
Bratila New HPP 75 75 75 75 75
Kalivaci New HPP 80 80 80 80 80 80
Ashta New HPP 44 44 44 44 44
Rehabilitation of Fier TPP 12 12 12 12 12 0 0 0 60 60 60 60 60 60
CCGT with distillate/natural
gas
97 97 97 97 220 220 220 220
Devolli Cascade 100 100
Vjosa Cascade
Skavica
Wind PPs 20 25
Solar PPs
Import - NTC 380 380 600 600 600 600 600 900
TOTAL 143 294 423 556 567 697 712
Generation/ Supply in MWh
‘000
Installed Capacity in MW 2003 2004 2005 2006 2007 2008 2009 2010 2011 2012 2013 2014 2015 2016
Existing HPPs 4,888 5,325 5,274 5,410 2,900 4,000 4,149 4,149 4,149 4,149 4,149 4,149 4,149 4,149
SHPP 20 25 30 45 80 102 143 185 226 268 309 351 392 434
Bratila New HPP 0 0 0 0 0 0 0 0 0 330 330 330 330 330
Kalivaci New HPP 0 0 0 0 0 0 0 0 356 356 356 356 356 356
Ashta New HPP 0 0 0 0 0 0 0 0 0 202 202 202 202 202
Rehabilitation of Fier TPP 76 77 87 55 0 0 0 390 390 390 390 390 390
CCGT with distillate/natural
gas
226 679 679 679 1,540 1,540 1,540 1,540
Devolli Cascade 0 0 0 0 0 0 0 0 0 0 0 0 400 400
Vjosa Cascade 0 0 0 0 0 0 0 0 0 0 0 0 0 0
Skavica 0 0 0 0 0 0 0 0 0 0 0 0 0 0
Wind PPs 0 0 0 0 0 0 0 0 0 0 0 0 54 68
Solar PPs 0 0 0 0 0 0 0 0 0 0 0 0 0 0
Supply from IC 4,908 5,426 5,381 5,542 3,035 4,102 4,518 5,013 5,800 6,374 7,276 7,318 7,813 7,869
Import 1,295 747 1,018 1,058 3,865 3,302 3,186 2,978 2,441 2,107 1,507 1,799 1,529 1,698
Total Supply 6,203 6,173 6,399 6,600 6,900 7,404 7,704 7,991 8,241 8,481 8,783 9,117 9,342 9,567
Load Shedding 908 1,121 1,077 1,058 940 619 501 397 329 271 152 0 0 0
Demand in MWh ‘000
Total Demand 7,111 7,293 7,476 7,658 7,840 8,023 8,205 8,388 8,570 8,752 8,935 9,117 9,342 9,567
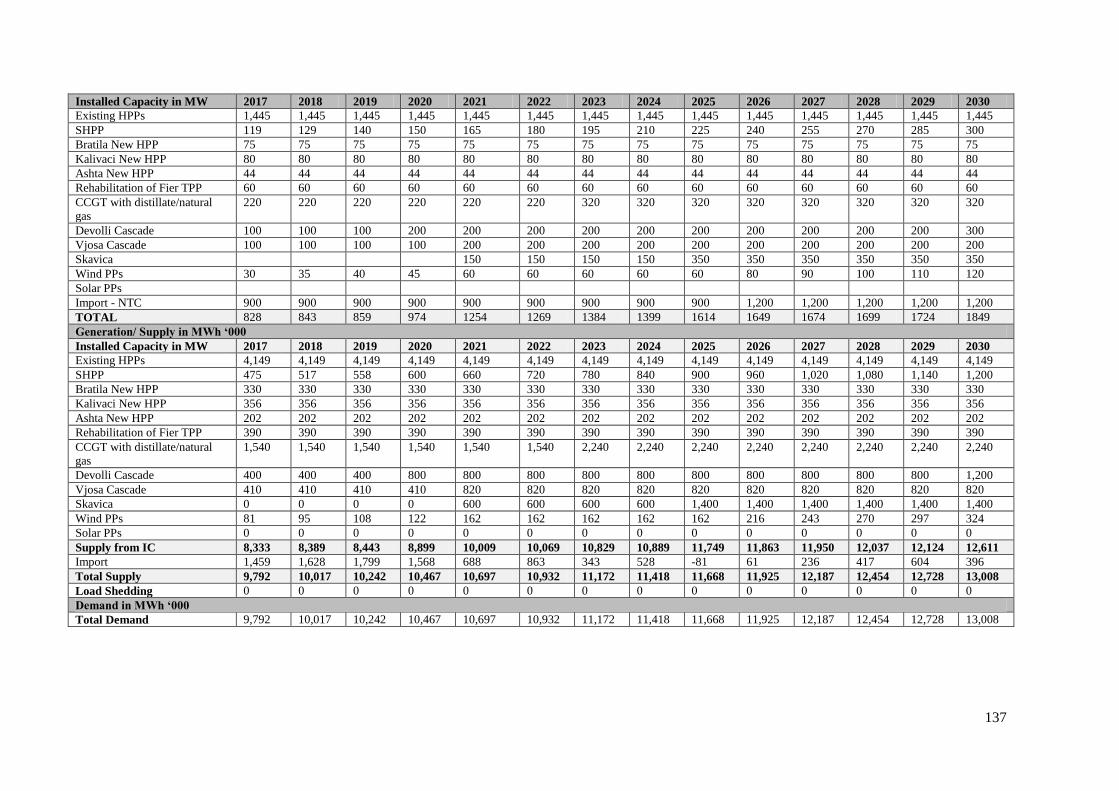
137
Installed Capacity in MW 2017 2018 2019 2020 2021 2022 2023 2024 2025 2026 2027 2028 2029 2030
Existing HPPs 1,445 1,445 1,445 1,445 1,445 1,445 1,445 1,445 1,445 1,445 1,445 1,445 1,445 1,445
SHPP 119 129 140 150 165 180 195 210 225 240 255 270 285 300
Bratila New HPP 75 75 75 75 75 75 75 75 75 75 75 75 75 75
Kalivaci New HPP 80 80 80 80 80 80 80 80 80 80 80 80 80 80
Ashta New HPP 44 44 44 44 44 44 44 44 44 44 44 44 44 44
Rehabilitation of Fier TPP 60 60 60 60 60 60 60 60 60 60 60 60 60 60
CCGT with distillate/natural
gas
220 220 220 220 220 220 320 320 320 320 320 320 320 320
Devolli Cascade 100 100 100 200 200 200 200 200 200 200 200 200 200 300
Vjosa Cascade 100 100 100 100 200 200 200 200 200 200 200 200 200 200
Skavica 150 150 150 150 350 350 350 350 350 350
Wind PPs 30 35 40 45 60 60 60 60 60 80 90 100 110 120
Solar PPs
Import - NTC 900 900 900 900 900 900 900 900 900 1,200 1,200 1,200 1,200 1,200
TOTAL 828 843 859 974 1254 1269 1384 1399 1614 1649 1674 1699 1724 1849
Generation/ Supply in MWh ‘000
Installed Capacity in MW 2017 2018 2019 2020 2021 2022 2023 2024 2025 2026 2027 2028 2029 2030
Existing HPPs 4,149 4,149 4,149 4,149 4,149 4,149 4,149 4,149 4,149 4,149 4,149 4,149 4,149 4,149
SHPP 475 517 558 600 660 720 780 840 900 960 1,020 1,080 1,140 1,200
Bratila New HPP 330 330 330 330 330 330 330 330 330 330 330 330 330 330
Kalivaci New HPP 356 356 356 356 356 356 356 356 356 356 356 356 356 356
Ashta New HPP 202 202 202 202 202 202 202 202 202 202 202 202 202 202
Rehabilitation of Fier TPP 390 390 390 390 390 390 390 390 390 390 390 390 390 390
CCGT with distillate/natural
gas
1,540 1,540 1,540 1,540 1,540 1,540 2,240 2,240 2,240 2,240 2,240 2,240 2,240 2,240
Devolli Cascade 400 400 400 800 800 800 800 800 800 800 800 800 800 1,200
Vjosa Cascade 410 410 410 410 820 820 820 820 820 820 820 820 820 820
Skavica 0 0 0 0 600 600 600 600 1,400 1,400 1,400 1,400 1,400 1,400
Wind PPs 81 95 108 122 162 162 162 162 162 216 243 270 297 324
Solar PPs 0 0 0 0 0 0 0 0 0 0 0 0 0 0
Supply from IC 8,333 8,389 8,443 8,899 10,009 10,069 10,829 10,889 11,749 11,863 11,950 12,037 12,124 12,611
Import 1,459 1,628 1,799 1,568 688 863 343 528 -81 61 236 417 604 396
Total Supply 9,792 10,017 10,242 10,467 10,697 10,932 11,172 11,418 11,668 11,925 12,187 12,454 12,728 13,008
Load Shedding 0 0 0 0 0 0 0 0 0 0 0 0 0 0
Demand in MWh ‘000
Total Demand 9,792 10,017 10,242 10,467 10,697 10,932 11,172 11,418 11,668 11,925 12,187 12,454 12,728 13,008
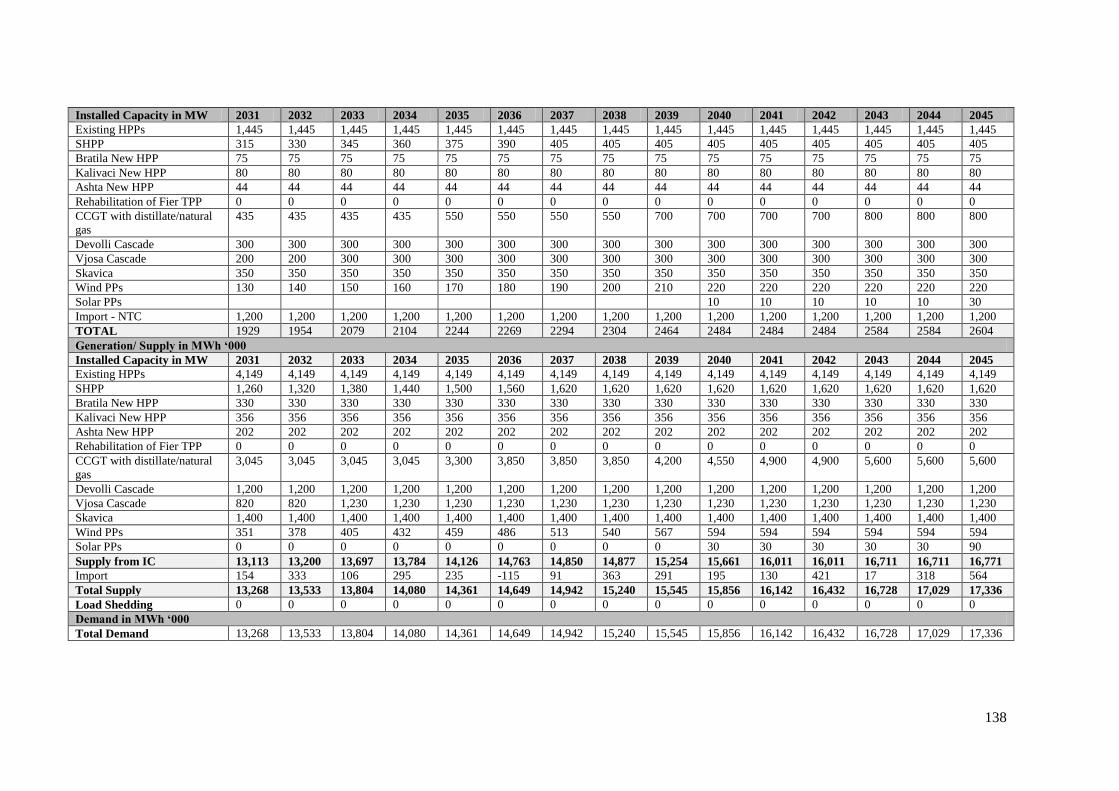
138
Installed Capacity in MW 2031 2032 2033 2034 2035 2036 2037 2038 2039 2040 2041 2042 2043 2044 2045
Existing HPPs 1,445 1,445 1,445 1,445 1,445 1,445 1,445 1,445 1,445 1,445 1,445 1,445 1,445 1,445 1,445
SHPP 315 330 345 360 375 390 405 405 405 405 405 405 405 405 405
Bratila New HPP 75 75 75 75 75 75 75 75 75 75 75 75 75 75 75
Kalivaci New HPP 80 80 80 80 80 80 80 80 80 80 80 80 80 80 80
Ashta New HPP 44 44 44 44 44 44 44 44 44 44 44 44 44 44 44
Rehabilitation of Fier TPP 0 0 0 0 0 0 0 0 0 0 0 0 0 0 0
CCGT with distillate/natural
gas
435 435 435 435 550 550 550 550 700 700 700 700 800 800 800
Devolli Cascade 300 300 300 300 300 300 300 300 300 300 300 300 300 300 300
Vjosa Cascade 200 200 300 300 300 300 300 300 300 300 300 300 300 300 300
Skavica 350 350 350 350 350 350 350 350 350 350 350 350 350 350 350
Wind PPs 130 140 150 160 170 180 190 200 210 220 220 220 220 220 220
Solar PPs 10 10 10 10 10 30
Import - NTC 1,200 1,200 1,200 1,200 1,200 1,200 1,200 1,200 1,200 1,200 1,200 1,200 1,200 1,200 1,200
TOTAL 1929 1954 2079 2104 2244 2269 2294 2304 2464 2484 2484 2484 2584 2584 2604
Generation/ Supply in MWh ‘000
Installed Capacity in MW 2031 2032 2033 2034 2035 2036 2037 2038 2039 2040 2041 2042 2043 2044 2045
Existing HPPs 4,149 4,149 4,149 4,149 4,149 4,149 4,149 4,149 4,149 4,149 4,149 4,149 4,149 4,149 4,149
SHPP 1,260 1,320 1,380 1,440 1,500 1,560 1,620 1,620 1,620 1,620 1,620 1,620 1,620 1,620 1,620
Bratila New HPP 330 330 330 330 330 330 330 330 330 330 330 330 330 330 330
Kalivaci New HPP 356 356 356 356 356 356 356 356 356 356 356 356 356 356 356
Ashta New HPP 202 202 202 202 202 202 202 202 202 202 202 202 202 202 202
Rehabilitation of Fier TPP 0 0 0 0 0 0 0 0 0 0 0 0 0 0 0
CCGT with distillate/natural
gas
3,045 3,045 3,045 3,045 3,300 3,850 3,850 3,850 4,200 4,550 4,900 4,900 5,600 5,600 5,600
Devolli Cascade 1,200 1,200 1,200 1,200 1,200 1,200 1,200 1,200 1,200 1,200 1,200 1,200 1,200 1,200 1,200
Vjosa Cascade 820 820 1,230 1,230 1,230 1,230 1,230 1,230 1,230 1,230 1,230 1,230 1,230 1,230 1,230
Skavica 1,400 1,400 1,400 1,400 1,400 1,400 1,400 1,400 1,400 1,400 1,400 1,400 1,400 1,400 1,400
Wind PPs 351 378 405 432 459 486 513 540 567 594 594 594 594 594 594
Solar PPs 0 0 0 0 0 0 0 0 0 30 30 30 30 30 90
Supply from IC 13,113 13,200 13,697 13,784 14,126 14,763 14,850 14,877 15,254 15,661 16,011 16,011 16,711 16,711 16,771
Import 154 333 106 295 235 -115 91 363 291 195 130 421 17 318 564
Total Supply 13,268 13,533 13,804 14,080 14,361 14,649 14,942 15,240 15,545 15,856 16,142 16,432 16,728 17,029 17,336
Load Shedding 0 0 0 0 0 0 0 0 0 0 0 0 0 0 0
Demand in MWh ‘000
Total Demand 13,268 13,533 13,804 14,080 14,361 14,649 14,942 15,240 15,545 15,856 16,142 16,432 16,728 17,029 17,336
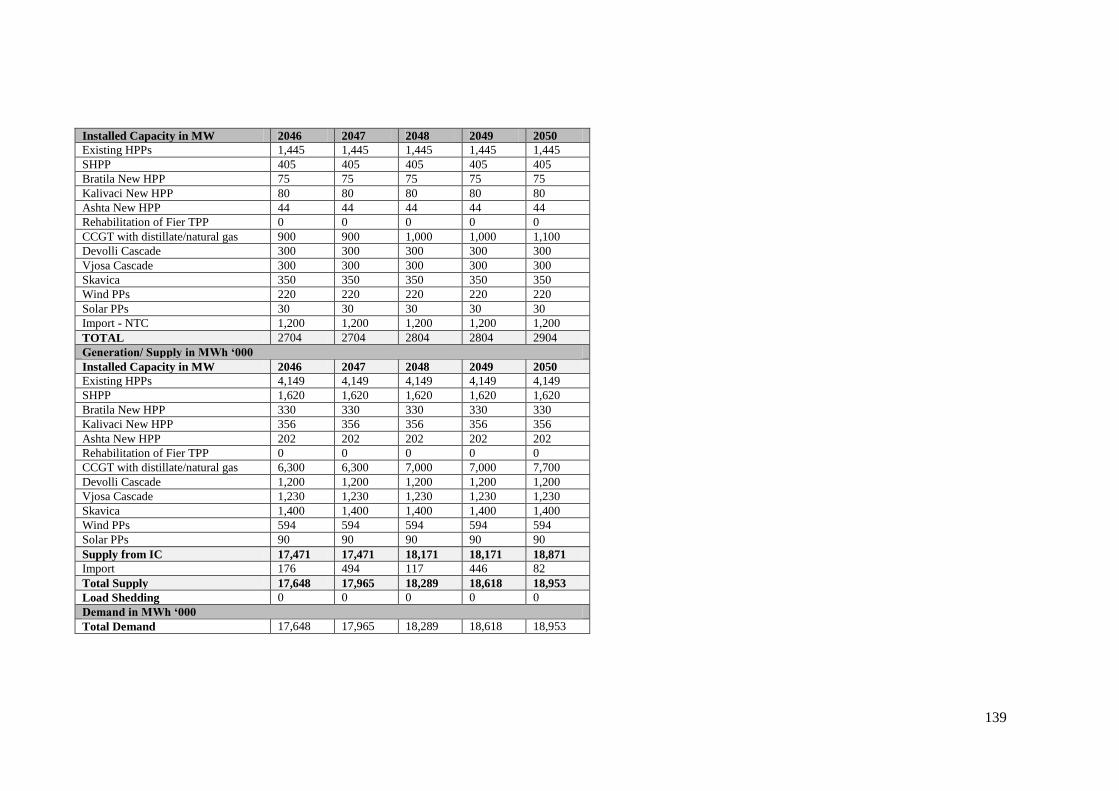
139
Installed Capacity in MW 2046 2047 2048 2049 2050
Existing HPPs 1,445 1,445 1,445 1,445 1,445
SHPP 405 405 405 405 405
Bratila New HPP 75 75 75 75 75
Kalivaci New HPP 80 80 80 80 80
Ashta New HPP 44 44 44 44 44
Rehabilitation of Fier TPP 0 0 0 0 0
CCGT with distillate/natural gas 900 900 1,000 1,000 1,100
Devolli Cascade 300 300 300 300 300
Vjosa Cascade 300 300 300 300 300
Skavica 350 350 350 350 350
Wind PPs 220 220 220 220 220
Solar PPs 30 30 30 30 30
Import - NTC 1,200 1,200 1,200 1,200 1,200
TOTAL 2704 2704 2804 2804 2904
Generation/ Supply in MWh ‘000
Installed Capacity in MW 2046 2047 2048 2049 2050
Existing HPPs 4,149 4,149 4,149 4,149 4,149
SHPP 1,620 1,620 1,620 1,620 1,620
Bratila New HPP 330 330 330 330 330
Kalivaci New HPP 356 356 356 356 356
Ashta New HPP 202 202 202 202 202
Rehabilitation of Fier TPP 0 0 0 0 0
CCGT with distillate/natural gas 6,300 6,300 7,000 7,000 7,700
Devolli Cascade 1,200 1,200 1,200 1,200 1,200
Vjosa Cascade 1,230 1,230 1,230 1,230 1,230
Skavica 1,400 1,400 1,400 1,400 1,400
Wind PPs 594 594 594 594 594
Solar PPs 90 90 90 90 90
Supply from IC 17,471 17,471 18,171 18,171 18,871
Import 176 494 117 446 82
Total Supply 17,648 17,965 18,289 18,618 18,953
Load Shedding 0 0 0 0 0
Demand in MWh ‘000
Total Demand 17,648 17,965 18,289 18,618 18,953
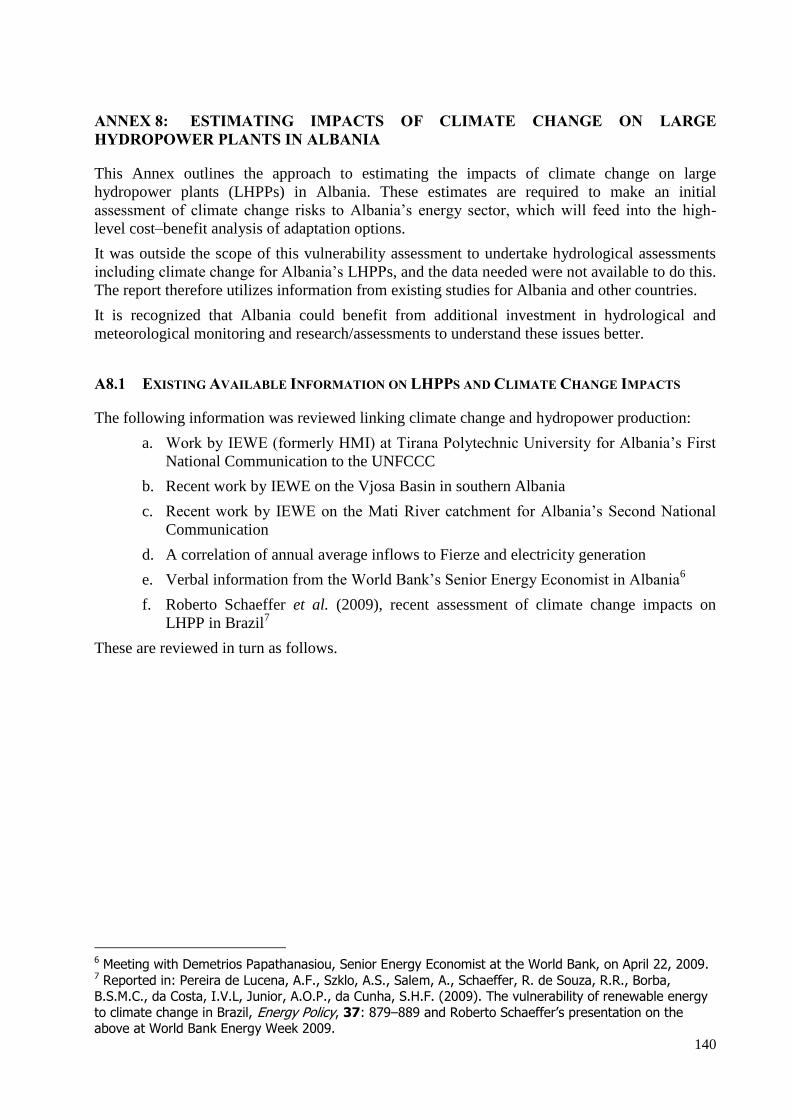
140
ANNEX 8: ESTIMATING IMPACTS OF CLIMATE CHANGE ON LARGE
HYDROPOWER PLANTS IN ALBANIA
This Annex outlines the approach to estimating the impacts of climate change on large
hydropower plants (LHPPs) in Albania. These estimates are required to make an initial
assessment of climate change risks to Albania‘s energy sector, which will feed into the high-
level cost–benefit analysis of adaptation options.
It was outside the scope of this vulnerability assessment to undertake hydrological assessments
including climate change for Albania‘s LHPPs, and the data needed were not available to do this.
The report therefore utilizes information from existing studies for Albania and other countries.
It is recognized that Albania could benefit from additional investment in hydrological and
meteorological monitoring and research/assessments to understand these issues better.
A8.1 EXISTING AVAILABLE INFORMATION ON LHPPS AND CLIMATE CHANGE IMPACTS
The following information was reviewed linking climate change and hydropower production:
a. Work by IEWE (formerly HMI) at Tirana Polytechnic University for Albania‘s First
National Communication to the UNFCCC
b. Recent work by IEWE on the Vjosa Basin in southern Albania
c. Recent work by IEWE on the Mati River catchment for Albania‘s Second National
Communication
d. A correlation of annual average inflows to Fierze and electricity generation
e. Verbal information from the World Bank‘s Senior Energy Economist in Albania6
f. Roberto Schaeffer et al. (2009), recent assessment of climate change impacts on
LHPP in Brazil7
These are reviewed in turn as follows.
6 Meeting with Demetrios Papathanasiou, Senior Energy Economist at the World Bank, on April 22, 2009. 7 Reported in: Pereira de Lucena, A.F., Szklo, A.S., Salem, A., Schaeffer, R. de Souza, R.R., Borba, B.S.M.C., da Costa, I.V.L, Junior, A.O.P., da Cunha, S.H.F. (2009). The vulnerability of renewable energy
to climate change in Brazil, Energy Policy, 37: 879–889 and Roberto Schaeffer’s presentation on the above at World Bank Energy Week 2009.

141
A8.2 ALBANIA’S FIRST NATIONAL COMMUNICATION
The range of projected climate changes for Albania presented in the 1NC8 is shown in Table
A8.1
Table A8.1 Climate Change Scenarios for Albania (CCSA)
Scenarios for Albania Time Horizon
2025 2050 2100
Annual Temperature (oC) 0.8+1 1.2+1.8 2.1+3.6
Precipitation (%) -3.8+-2.4 -6.1+-3.8 -12.5+-6
Winter Temperature (oC) 0.8+1.0 1.3+1.8 2.13.7
Precipitation (%) -1.6+0 -1.8+0 -3.7+0
Spring Temperature (oC) 0.7+0.9 1.0+1.5 1.8+3.0
Precipitation (%) -2.7+-1.3 -3.6+-2.1 -7.4+-3.4
Summer Temperature (oC) 0.9+1.2 1.2+2.0 2.3+4.1
Precipitation (%) -0.8+-5.6 -20.0+-9.1 -27.0+-14.4
Autumn Temperature (oC) 0.9+1.1 1.1+2.0 2.1+3.8
Precipitation (%) -4.3+-3.4 -11.2+-2.1 -16.2+-8.6
Sea Level (cm) 20-24 48-61
Cloud Cover (%) -1.3+-1.5 -2.6+-2.0 -4.6+-3.1
Wind Speed (%) 0.7 1+1.3 1.6+2.3
To assess the impact of climate change on the mean annual runoff, two models that relate runoff
forming factors (annual sum of precipitation and mean annual evapotranspiration) to the long
term mean annual runoff were used.
The 1NC states that: ―The models forecast a decrease in the long term mean annual runoff,
respectively from –9.8 percent to –13.6 percent and from –6.3 percent to –9.1 percent, for 2025‖
(see the black line in Figure A8.1).
According to Figure A8.1:
a. The projected climatic changes for 2050—that is, decreases in annual
precipitation of –6.1 percent to –3.8 percent and temperature increases of +1.2
deg C to +1.8 deg C—translate into a decrease in annual runoff of about –15
percent by 2050.
b. The projected climatic changes for 2100—i.e. decreases in annual precipitation of
–12 percent to –6 percent and temperature increases of +2.1 deg C to +3.6 deg
C—result in a decrease in annual runoff of about –35 percent by 2100.
8 Islami, B., Kamberi, M., Demiraj, E., Fida, E. (2002). The First National Communication of the Republic
of Albania to the United Nations Framework Convention on Climate Change (UNFCCC). Ministry of Environment, Republic of Albania.

142
Figure A8.1: Average change in mean runoff according to CCSA for three time horizons:
2025, 2050, 2100
A8.3 ASSESSMENT OF CLIMATE CHANGE IMPACTS ON THE VJOSA BASIN
The assessment of climate change impacts on the Vjosa Basin9 presented a slightly different set
of climate change scenarios, with larger changes for Albania than the 1NC, as shown in Table
A8.2.
Table A8.2: Climate Change Scenarios for Three Time Horizons: 2025, 2050, 2100
Scenarios for Albania Time Horizon
2025 2050 2100
Annual Temperature (oC) 0.8 to 1.1 1.7 to 2.3 2.9 to 5.3
Precipitation (%) -3.4 to -2.6 -6.9 to -5.3 -16.2 to -8.8
Winter Temperature (oC) 0.7 to 0.9 1.5 to 1.9 2.4 to 4.5
Precipitation (%) -1.8 to -1.3 -3.6 to -2.8 -8.4 to -4.6
Spring Temperature (oC) 0.7 to 0.9 1.4 to 1.8 2.3 to 4.2
Precipitation (%) -1.2 to -0.9 -2.5 to -1.9 -5.8 to -3.2
Summer Temperature (oC) 1.2 to 1.5 2.4 to 3.1 4.0 to 7.3
Precipitation (%) -11.5 to -8.7 -23.2 to -17.8 -54.1 to -29.5
Autumn Temperature (oC) 0.8 to 1.1 1.7 to 2.2 2.9 to 5.2
Precipitation (%) -3.0 to -2.3 -6.1 to -4.7 -14.2 to -7.7
A rainfall-runoff model was used to assess the impacts of these changes on Vjosa River runoff.
The projected changes in runoff are shown in Figure A8.2.
The paper notes that during winter, precipitation feeding the Vjosa River falls as snow and that
the presence of deep karst aquifers ―assure an abundant underground supply during the dry
season.‖
According to Figure A8.2 which presents data drawn from that paper:
a. The projected climatic changes for 2050—that is, decreases in annual
precipitation of –6.9 percent to –5.3 percent and temperature increases of +1.7
9 M. Bogdani Ndini and E. Demiraj Bruci, 2008
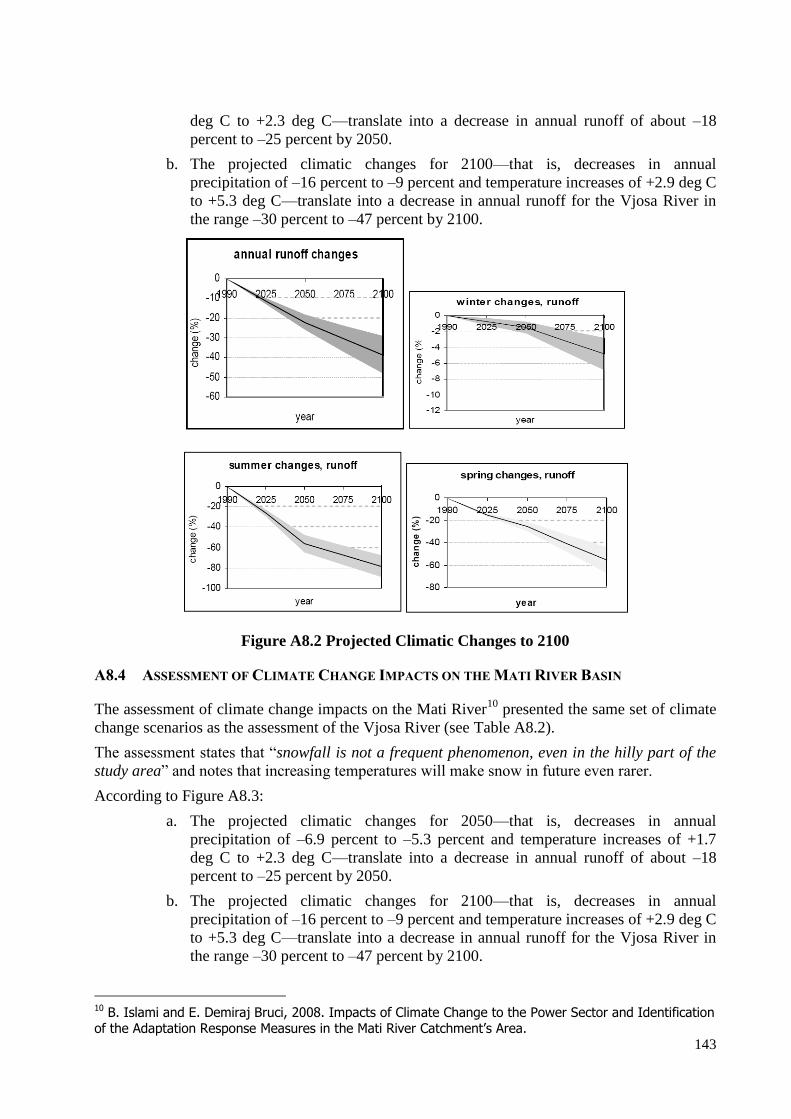
143
deg C to +2.3 deg C—translate into a decrease in annual runoff of about –18
percent to –25 percent by 2050.
b. The projected climatic changes for 2100—that is, decreases in annual
precipitation of –16 percent to –9 percent and temperature increases of +2.9 deg C
to +5.3 deg C—translate into a decrease in annual runoff for the Vjosa River in
the range –30 percent to –47 percent by 2100.
Figure A8.2 Projected Climatic Changes to 2100
A8.4 ASSESSMENT OF CLIMATE CHANGE IMPACTS ON THE MATI RIVER BASIN
The assessment of climate change impacts on the Mati River10
presented the same set of climate
change scenarios as the assessment of the Vjosa River (see Table A8.2).
The assessment states that ―snowfall is not a frequent phenomenon, even in the hilly part of the
study area‖ and notes that increasing temperatures will make snow in future even rarer.
According to Figure A8.3:
a. The projected climatic changes for 2050—that is, decreases in annual
precipitation of –6.9 percent to –5.3 percent and temperature increases of +1.7
deg C to +2.3 deg C—translate into a decrease in annual runoff of about –18
percent to –25 percent by 2050.
b. The projected climatic changes for 2100—that is, decreases in annual
precipitation of –16 percent to –9 percent and temperature increases of +2.9 deg C
to +5.3 deg C—translate into a decrease in annual runoff for the Vjosa River in
the range –30 percent to –47 percent by 2100.
10 B. Islami and E. Demiraj Bruci, 2008. Impacts of Climate Change to the Power Sector and Identification of the Adaptation Response Measures in the Mati River Catchment’s Area.
144
Note that these are the same graphs as were presented above for the Vjosa River study.
Figure A8.3 Expected changes in runoff, Mati catchment’s area
This report states that there is a strong correlation between Mati River flow and power
production from Ulëza and Shkopeti HPP, as shown in Figure A8.4 (taken from the report).
This graph implies that if the flow of the Mati River declined by 20 percent, electricity
generation would fall by about 15 percent.
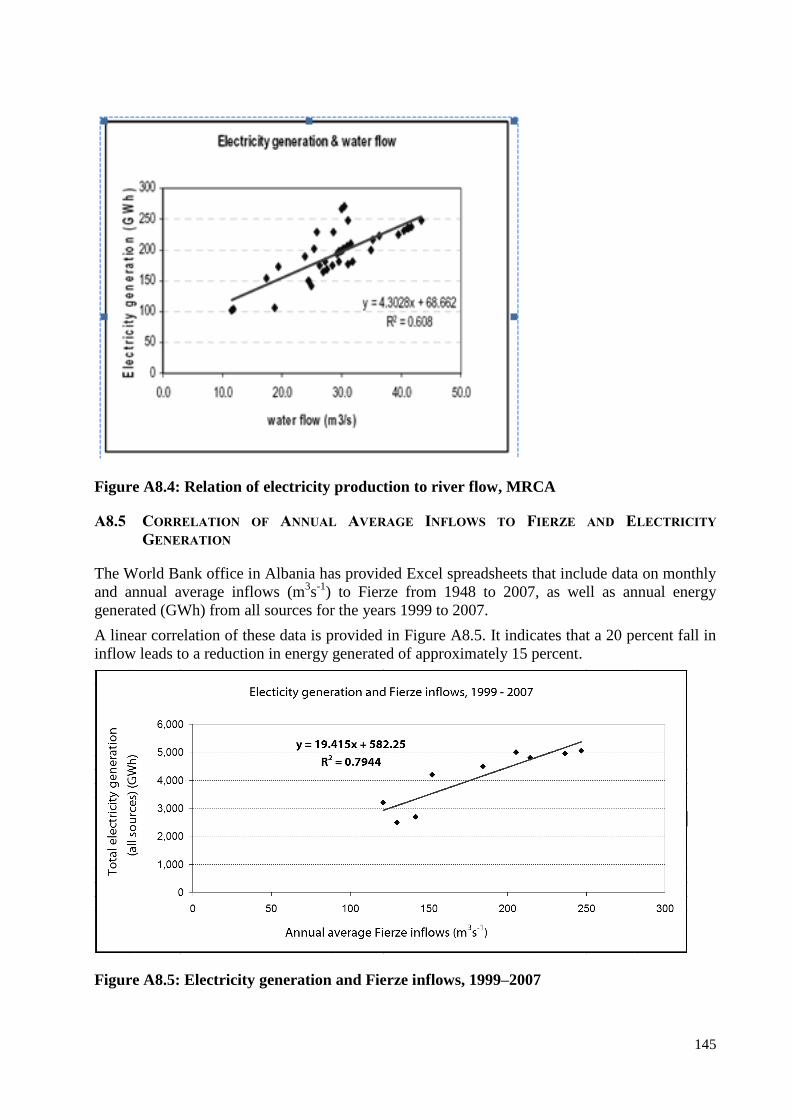
145
Figure A8.4: Relation of electricity production to river flow, MRCA
A8.5 CORRELATION OF ANNUAL AVERAGE INFLOWS TO FIERZE AND ELECTRICITY
GENERATION
The World Bank office in Albania has provided Excel spreadsheets that include data on monthly
and annual average inflows (m3s
-1) to Fierze from 1948 to 2007, as well as annual energy
generated (GWh) from all sources for the years 1999 to 2007.
A linear correlation of these data is provided in Figure A8.5. It indicates that a 20 percent fall in
inflow leads to a reduction in energy generated of approximately 15 percent.
Figure A8.5: Electricity generation and Fierze inflows, 1999–2007
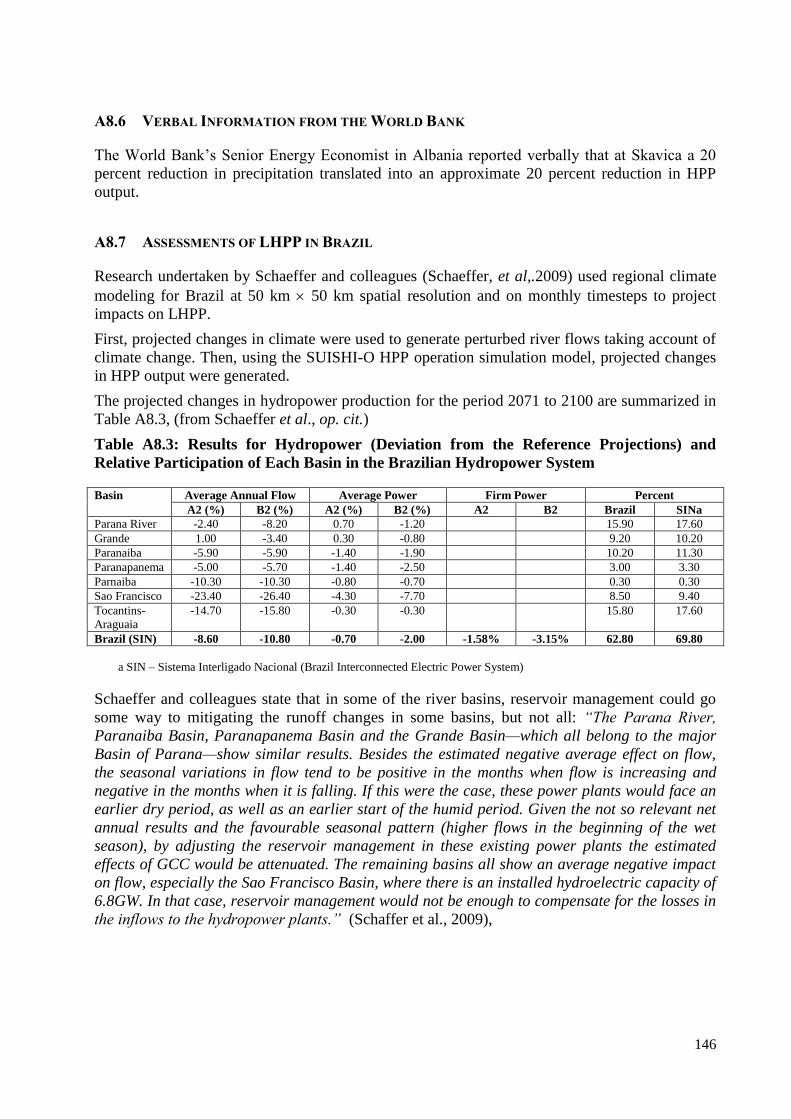
146
A8.6 VERBAL INFORMATION FROM THE WORLD BANK
The World Bank‘s Senior Energy Economist in Albania reported verbally that at Skavica a 20
percent reduction in precipitation translated into an approximate 20 percent reduction in HPP
output.
A8.7 ASSESSMENTS OF LHPP IN BRAZIL
Research undertaken by Schaeffer and colleagues (Schaeffer, et al,.2009) used regional climate
modeling for Brazil at 50 km 50 km spatial resolution and on monthly timesteps to project
impacts on LHPP.
First, projected changes in climate were used to generate perturbed river flows taking account of
climate change. Then, using the SUISHI-O HPP operation simulation model, projected changes
in HPP output were generated.
The projected changes in hydropower production for the period 2071 to 2100 are summarized in
Table A8.3, (from Schaeffer et al., op. cit.)
Table A8.3: Results for Hydropower (Deviation from the Reference Projections) and
Relative Participation of Each Basin in the Brazilian Hydropower System
Basin Average Annual Flow Average Power Firm Power Percent
A2 (%) B2 (%) A2 (%) B2 (%) A2 B2 Brazil SINa
Parana River -2.40 -8.20 0.70 -1.20 15.90 17.60
Grande 1.00 -3.40 0.30 -0.80 9.20 10.20
Paranaiba -5.90 -5.90 -1.40 -1.90 10.20 11.30
Paranapanema -5.00 -5.70 -1.40 -2.50 3.00 3.30
Parnaiba -10.30 -10.30 -0.80 -0.70 0.30 0.30
Sao Francisco -23.40 -26.40 -4.30 -7.70 8.50 9.40
Tocantins-
Araguaia
-14.70 -15.80 -0.30 -0.30 15.80 17.60
Brazil (SIN) -8.60 -10.80 -0.70 -2.00 -1.58% -3.15% 62.80 69.80
a SIN – Sistema Interligado Nacional (Brazil Interconnected Electric Power System)
Schaeffer and colleagues state that in some of the river basins, reservoir management could go
some way to mitigating the runoff changes in some basins, but not all: ―The Parana River,
Paranaiba Basin, Paranapanema Basin and the Grande Basin—which all belong to the major
Basin of Parana—show similar results. Besides the estimated negative average effect on flow,
the seasonal variations in flow tend to be positive in the months when flow is increasing and
negative in the months when it is falling. If this were the case, these power plants would face an
earlier dry period, as well as an earlier start of the humid period. Given the not so relevant net
annual results and the favourable seasonal pattern (higher flows in the beginning of the wet
season), by adjusting the reservoir management in these existing power plants the estimated
effects of GCC would be attenuated. The remaining basins all show an average negative impact
on flow, especially the Sao Francisco Basin, where there is an installed hydroelectric capacity of
6.8GW. In that case, reservoir management would not be enough to compensate for the losses in
the inflows to the hydropower plants.‖ (Schaffer et al., 2009),

147
A8.8 SUMMARY
The range of projected changes in annual climatic conditions, runoff, and hydropower
production from the above studies are summarized in Table A8.4.
The research in Brazil indicates less severe impacts than the analyses above suggest for Albania,
and Schaeffer and colleagues state that in Brazil reservoir management can compensate to some
extent for reduced river flows.
According to this analysis, the high-level cost–benefit analysis for Albania uses an estimated
decrease in annual hydropower output of 15 percent by 2050, associated with an average annual
decrease of 20 percent in runoff. In addition, if possible, the CBA should test the sensitivity of
these results to changes in annual power output in the range –20 percent to –5 percent.
Table A8.4: Projected Changes in Annual Climatic Conditions, Runoff, and Hydropower
Production
Study Change in annual average
climatic conditions by 2050
Change in annual
runoff by 2050 (%)
Change in annual
hydropower output
(%)
First National
Communication
Precipitation: –6.1% to –3.8%
Temperature: +1.2oC to +1.8
oC
–15%
Vjosa River Precipitation: –6.9% to –5.3%
Temperature: increases of
+1.7oC to +2.3
oC
–18% to –25%
Mati River Precipitation: –6.9% to –5.3%
Temperature: increases of
+1.7oC to +2.3
oC
–18% to –25% Figure A8.4 indicates
that a 20% reduction in
runoff would cause a
reduction of 15% in
power generation
Correlation of
Fierze inflows
and energy
generation
A 20% reduction in
inflows to Fierze is
associated with a 15%
reduction in power
generation
Verbal
information
from World
Bank
―20% reduction in
precipitation translates
into a 20% reduction in
HPP output‖
Schaeffer et al. Parana River (2071–
2100) –8.2% to –
2.4%
Sao Francisco (2071–
2100) –26.4% to –
23.4%
–1.2% to +0.7%
–7.7% to –4.3%

148
ANNEX 9: ESTIMATING IMPACTS OF CLIMATE CHANGE ON ENERGY
GENERATION IN ALBANIA, EXCLUDING LARGE HYDROPOWER PLANTS
This Annex outlines the estimates of climate change impacts on Albania‘s energy assets,
excluding large hydropower plants11
, to be used in the cost–benefit analysis. It has been
developed by considering the climate change projections for Albania and drawing on the
authors‘ engineering expertise of the relationships between climatic factors and asset
performance.
A9.1 SMALL HYDROPOWER PLANTS (SHPPS)
Assume a 1 to 1 relationship between reduced river flows and SHPP production, that is, a 20
percent reduction by 205012
.
A9.2 THERMAL POWER PLANTS (TPPS)
Estimate a 0.5 percent reduction in TPP output associated with higher temperatures in 2020,
rising to 1 percent in 2050.
A9.3 WIND
The climate change scenarios‘13
projections of changes in wind are low confidence and show
little or no change. The report therefore assumes no change.
A9.4 DOMESTIC SOLAR HEATERS
The climate change scenarios14
indicate a reduction in cloudiness as shown in Table A9.1.
Table A9.1 Range of Projected Changes Compared to 1961–1990 Baseline
Range of projected changes compared to 1961–1990 baseline
2020s 2050s
Climate
variable
Annual Summer
Winter Annual Summer
Winter
Cloudiness
(%)
–4 to –1 –5 to –2 –2 to 0 –5 to –2 –8 to –6 –3 to 0
In summer, domestic solar heaters already provide all the required energy for water heating, so
decreases in summer cloud cover will not act to reduce energy demand for water heating. In
winter, however, this is not the case, so the report assumes that the winter water heating demand,
taking account of climate change, should be reduced by 1 percent by the 2020s and 2 percent by
the 2050s. For autumn and spring we suggest reduced demand of 1.5 percent by the 2020s and
3.0 percent by the 2050s.
11
For LHPP estimates see Annex 8. 12
See Annex 8. 13
Acclimatise. (2009). Climate change projections for Albania. Acclimatise, United Kingdom. (Jane, is this the elusive “CCSA”? If so the word here would be Scenarios? not projections) 14
Ibid.

149
A9.5 CONCENTRATED SOLAR POWER
The report uses the data on decreases in cloudiness to estimate equivalent increases in output
from concentrated solar power.
A9.6 TRANSMISSION AND DISTRIBUTION
The efficiency reduction for transmission and distribution is estimated as 1 percent by 2050,
associated with rising temperatures.
150
ANNEX 10: GLOSSARY OF KEY TERMS
Adaptation Actions to reduce the vulnerability of natural and human systems to climate change
effects. For instance, an adaptation action that can be taken to reduce the damaging effects of
rising sea levels is to build higher sea defences. Various types of adaptation exist, e.g.,
anticipatory and reactive, private and public, and autonomous and planned.
Adaptive capacity The ability of a system to adjust to climate change (including climate
variability and extremes) to moderate potential damages, to take advantage of opportunities, or to
cope with the consequences.
Baseline The reference against which change is measured, e.g., baseline climate is normally
defined as the period 1961–1990.
Carbon dioxide (CO2) CO2 is a naturally occurring gas, and a byproduct of burning fossil fuels
or biomass, of land-use changes and of industrial processes. It is the main greenhouse gas
produced by man that is driving climate change.
CEZ CEZ Group, a privately owned Czech energy production group that has recently taken over
management of Albania‘s power distribution system.
Climate change Climate change refers to any change in climate that lasts for an extended
period, typically decades or longer, whether due to natural variability or as a result of human
activity.
Climate hazards Climate variables that have consequences for the system being studied (in this
case, Albania‘s energy sector). The main climate hazards to be discussed at the workshop are
temperature, precipitation, relative humidity, sunshine, winds, sea level rise and extreme events
such as storms.
Climate impacts The effects that climate hazards have on a given system (in this case, Albania‘s
energy sector), such as reductions in rainfall have impacts on hydropower generation.
Climate variability Climate variability refers to variations in the average state of climate.
Rainfall, for instance, has high natural variability, which makes it difficult to detect a climate
change signal.
GCM General Circulation Model / Global Climate Model A computer-based numerical model
of the climate system. GCMs are developed and run by climate modeling centers around the
world and are used to project changes in climate.
Greenhouse Gases (GHGs) Greenhouse gases absorb and emit infrared radiation. This property
causes the greenhouse effect. Water vapour (H2O), carbon dioxide (CO2), nitrous oxide (N2O),
methane (CH4) and ozone (O3) are the primary greenhouse gases in the earth‘s atmosphere.
Intergovernmental Panel on Climate Change (IPCC) The Intergovernmental Panel on Climate
Change was formed in 1988 by the World Meteorological Organization (WMO) and the United
Nations Environment Programme (UNEP), and is the international advisory body on climate
change.
Mitigation Actions to reduce man-made effects on the climate system. These include actions to
reduce emissions of greenhouse gases (such as energy efficiency measures or the use of

151
renewable energy resources), as well as actions to increase greenhouse gas sinks (such as
planting forests).
Risk Risk is the product of the likelihood (or probability) of an event occurring and the
magnitude of its consequence.
Scenario A plausible description of how the future may develop. Scenarios are not predictions or
forecasts, but are useful to provide a view of the implications of actions.
Sensitivity Sensitivity is the amount by which a system is affected, either adversely or
beneficially, by climate variability or climate change. For instance, the efficiency of gas turbines
is sensitive to temperature. As temperatures rise, efficiency falls.
Special Report on Emissions Scenarios (SRES) To provide a basis for estimating future climate
change, the IPCC prepared the Special Report on Emissions Scenarios in 2000. It provides 40
greenhouse gas and sulphate aerosol emission scenarios based on different assumptions about
demographic, economic and technological factors. The emissions scenarios are fed into Global
Climate Models, to project future changes in climate.
Threshold A property of a system where the relationship between the input and the output
changes suddenly. For example, the height of a flood defence represents a critical threshold—if
water levels exceed the defence height, flooding will occur. It is important to identify climate-
related thresholds, as they indicate rapid changes in the level of risk.
Timeslice Projections of climate change are usually given for three timeslices—the 2020s,
2050s, and the 2080s. The projections are a 30-year average, centered on each of the given
timeslices, (i.e., the 2020s is 2010–2039). Climate models cannot predict what the specific
climate will be in any given year, due in part to the interannual variability of climate variables,
so the projections are 30-year averages of future climate.
Uncertainty An expression of the degree to which a value is unknown (e.g., the future state of
the climate system). Uncertainty can result from lack of information or from disagreement about
what is known or even knowable.