Embed Size (px)
Citation preview

11
desarro. soc. 71, primer semestre de 2013, pp. x-xx, issn 0120-3584
Revista Desarrollo y Sociedad
80Primer semestre 2018
PP. 11-51, issn 0120-3584e-issn 1900-7760
An exploratory assessment of the relationship between multidimensional poverty and armed conflict: The case of Antioquia, Colombia
Un análisis exploratorio de la relación entre pobreza multidimensional y conflicto armado: el caso de Antioquia en Colombia
Osmar Leandro Loaiza Quintero1, Guberney Muñetón Santa2, Juan Gabriel Vanegas López3
DOI: 10.29263/dys.80.1
Abstract
This paper analyses the relationship between poverty and armed conflict in Antioquia, Colombia. The poverty analysis it uses is framed according to Sen’s capability approach, which constitutes the conceptual basis for the Multidi-mensional Poverty Index (MPI) subsequently developed by Alkire and Foster. The MPI is measured employing data from the government database SISBEN, which is used by the Colombian authorities to identify beneficiaries of social assistance programmes. The paper considers three poverty dimensions: liv-ing standards, health, and education. Armed conflict is measured using count data on violent events recorded for every municipality in the Department of
1 Msc. Investigador. Universidad de Antioquia. Cl. 67 #53 - 108, Medellín, Antioquia. Email: [email protected].
2 Msc. Investigador y Docente. Recursos estratégicos, región y dinámicas socioambientales Rerdsa, Ins-tituto de Estudios Regionales, Universidad de Antioquia UdeA, Calle 70 No. 52-2, Medellín, Colombia. E-mail: [email protected].
3 Msc. Investigador y Docente, Research and Enterprise Development (R.E.D.), Tecnológico de Antioquia I.U. Email: [email protected].
Este artículo fue recibido el 2 de junio del 2016, evaluado el 14 de febrero del 2017 y finalmente aceptado el 15 de marzo del 2017.

An exploratory assessment of the relationship between multidimensional12
desarro. soc. no. 80, bogotá, primer semestre 2018, pp. 11-51, issn 0120-3584, e-issn 1900-7760, doi: 10.29263/dYs.80.1
Antioquia between 1996 and 2010. The relationship between poverty and armed conflict is then analysed using exploratory and non-parametric meth-ods such as kernel distributions. Results suggest that the MPI is robust when compared multidimensional cutoffs. The MPI box-plot maps suggest that poor people are located in Antioquia’s peripheral areas. Kernel distributions show that areas most affected by conflict tend to show higher levels of multidi-mensional poverty.
Key words by author: Multidimensional Poverty Index, Capability Approach, Armed Conflict, Exploratory data analysis, Colombia, Poverty.
JEL Classification: O15, H56, D62.
Resumen
Este artículo analiza la relación entre pobreza y conflicto armado en Antio-quia, Colombia. El análisis de la pobreza está enmarcado en el enfoque de las capacidades de Sen, el cual conforma la base conceptual del índice de pobreza multidimensional (IPM) desarrollado por Alkire y Foster. El IPM es calculado con información derivada de la base de datos Sisbén, la cual se utiliza para seleccionar la población atendida por los programas de asistencia social del Gobierno colombiano. Este artículo consideró tres dimensiones de pobreza: estándares de vida, salud, y educación. El conflicto armado fue medido por medio de datos de conteo acerca de la ocurrencia de eventos de violencia registrados entre 1996 y 2010 en cada municipalidad de Antioquia. Luego, la relación entre la pobreza y el conflicto armado se analizó mediante métodos exploratorios y no paramétricos como las distribuciones kernel. Los resulta-dos sugieren que el IPM es robusto con respecto a la elección del umbral de pobreza multidimensional. Los mapas de caja y bigotes sugieren que los pobres están localizados en las regiones periféricas de Antioquia. Las distribuciones kernel muestran que las áreas más afectadas por el conflicto, usualmente, tienen altos niveles de pobreza multidimensional.
Palabras clave del autor: índice de pobreza multidimensional, enfoque de las capacidades, conflicto armado, análisis exploratorio de datos, Colombia, pobreza.
Clasificación JEL: O15, H56, D62.
Osmar Leandro Loaiza Quintero et al. 13
desarro. soc. no. 80, bogotá, primer semestre 2018, pp. 11-51, issn 0120-3584, e-issn 1900-7760, doi: 10.29263/dYs.80.1
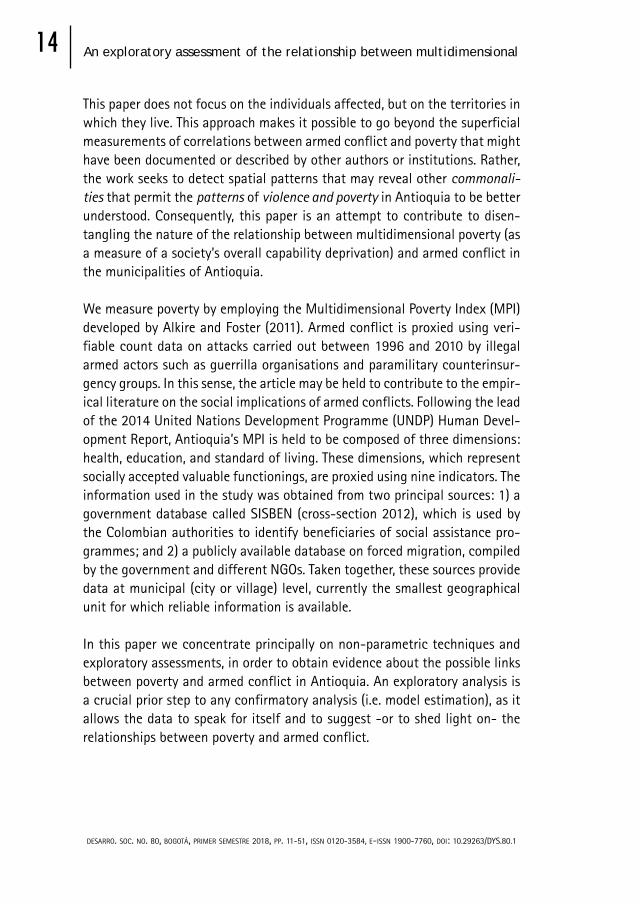
Introduction
Usually, itIt is generally believed that poverty is a problem that stems from a resource constraint, either because individuals lack the material basis to lead a dignified life, or because Nation States lack the resources required to pro-vide services and investments that are conducive to economic development. However, evidence has emerged to suggest that violence is in fact the key obstacle to economic development and poverty reduction. While countries free of armed conflicts have gradually found routes out of poverty (World Bank, 2011), those countries with civil conflicts, ethnic confrontations, or organised crime lag behind (The Economist, 2011).
The presence of armed conflict in a specific region may gradually, or eventually, degrade its social capital. A society’s ability to transform available resources into valuable functionings4 may consequently become limited or hampered (Sen, 2009). Moreover, from birth onwards, staying alive is the most basic functioning to which any individual is entitled Thus, an important feature of human development is the generation of conditions that provide people with the capability of living decent, prosperous, and long lives. However, armed con-flicts deprive people of their most basic functionings. In fact, they endanger people’s most valuable functioning –that is, being alive- and limit their chances of living dignified lives. It is unnecessary to explain what armed conflicts mean in terms of capability deprivation, it being enough simply to mention some of the forms of violence used by armed groups to advance their purposes: mas-sacres, sexual assault, forced displacement, torture, public scorn, land dispos-session, and looting. All of these actions result in the deprivation of freedom or of functionings. In Colombia, the ongoing armed conflict caused the death of some 220,000 people between January 1 1958 and December 31 2012; 81.5% of victims were civilians and the remaining 18.5% combatants (GMH, 2013).
Research in Colombia has focused on direct individual victims, in an attempt to contribute to governmental programmes intended to provide a guiding frame-work for their compensation and the management of post-conflict agreements. Attention has focused on the populations inhabiting the affected territories.
4 Functionings may be interpreted as a vector that lists all things a person regards as worth ‘doing’ or ‘being’. The capabilities an individual possesses may be seen as the set of available or achievable functionings between which a given individual is effectively able to choose.
An exploratory assessment of the relationship between multidimensional14
desarro. soc. no. 80, bogotá, primer semestre 2018, pp. 11-51, issn 0120-3584, e-issn 1900-7760, doi: 10.29263/dYs.80.1
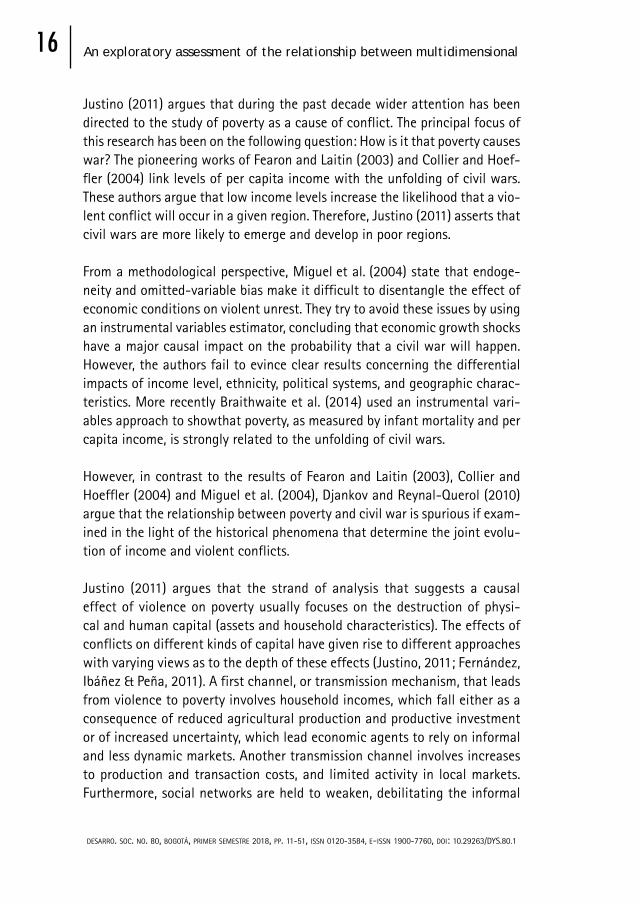
This paper does not focus on the individuals affected, but on the territories in which they live. This approach makes it possible to go beyond the superficial measurements of correlations between armed conflict and poverty that might have been documented or described by other authors or institutions. Rather, the work seeks to detect spatial patterns that may reveal other commonali-ties that permit the patterns of violence and poverty in Antioquia to be better understood. Consequently, this paper is an attempt to contribute to disen-tangling the nature of the relationship between multidimensional poverty (as a measure of a society’s overall capability deprivation) and armed conflict in the municipalities of Antioquia.
We measure poverty by employing the Multidimensional Poverty Index (MPI) developed by Alkire and Foster (2011). Armed conflict is proxied using veri-fiable count data on attacks carried out between 1996 and 2010 by illegal armed actors such as guerrilla organisations and paramilitary counterinsur-gency groups. In this sense, the article may be held to contribute to the empir-ical literature on the social implications of armed conflicts. Following the lead of the 2014 United Nations Development Programme (UNDP) Human Devel-opment Report, Antioquia’s MPI is held to be composed of three dimensions: health, education, and standard of living. These dimensions, which represent socially accepted valuable functionings, are proxied using nine indicators. The information used in the study was obtained from two principal sources: 1) a government database called SISBEN (cross-section 2012), which is used by the Colombian authorities to identify beneficiaries of social assistance pro-grammes; and 2) a publicly available database on forced migration, compiled by the government and different NGOs. Taken together, these sources provide data at municipal (city or village) level, currently the smallest geographical unit for which reliable information is available.
In this paper we concentrate principally on non-parametric techniques and exploratory assessments, in order to obtain evidence about the possible links between poverty and armed conflict in Antioquia. An exploratory analysis is a crucial prior step to any confirmatory analysis (i.e. model estimation), as it allows the data to speak for itself and to suggest -or to shed light on- the relationships between poverty and armed conflict.

Osmar Leandro Loaiza Quintero et al. 15
desarro. soc. no. 80, bogotá, primer semestre 2018, pp. 11-51, issn 0120-3584, e-issn 1900-7760, doi: 10.29263/dYs.80.1
I. Literature Review
A. The Capability Approach
In this paper, the concept of poverty is grounded in the capability approach (CA) framework pioneered by Amartya Sen. CA is a normative theory that evaluates the quality of life of individuals according to the choices available to them. Sen (1985, 1996) suggests that an individual’s quality of life can be evaluated by analysing the capabilities they have at hand to achieve valuable functionings such as state of health or education, participation in political deliberations, avoiding avoidable morbidity, or being happy. This evaluation occurs within the “capability space”, in which “capability represents various combinations of functionings (beings and doings) that the person can achieve” (Sen, 1992, p.40). However, when a capability set is restricted by externalities (such as armed conflicts), individuals face a smaller range of choices, leading to a restriction in the range of achievable functionings, and ultimately reduc-ing their chances of achieving a dignified life (Nussbaum, 2011).
Seen through this lens, poverty is a problem of capability-deprivation (Sen, 1999). Furthermore, as the capability set indirectly reflects the freedom of choice a particular person enjoys, poverty can also be interpreted as the result of a lack of the freedom required to achieve valuable functionings (Sen, 1988). Since these functionings represent different states of being and doing, it is clear that the capability approach calls for a multidimensional measurement of poverty centred on the human being.
B. Armed Conflict vs. Poverty
International Overview. Although it is probably true that feedback relations between violence and poverty exist, the literature on the matter may be clas-sified into two main strands, according to the causality link observed. Some studies consider poverty to be a trigger of conflict, while others maintain that this Although it is probably true that feedback relations between violence and poverty exist, the literature on the matter may be classified into two main strands, according to the causality link observed. relationship is reversed.
An exploratory assessment of the relationship between multidimensional16
desarro. soc. no. 80, bogotá, primer semestre 2018, pp. 11-51, issn 0120-3584, e-issn 1900-7760, doi: 10.29263/dYs.80.1
Justino (2011) argues that during the past decade wider attention has been directed to the study of poverty as a cause of conflict. The principal focus of this research has been on the following question: How is it that poverty causes war? The pioneering works of Fearon and Laitin (2003) and Collier and Hoef-fler (2004) link levels of per capita income with the unfolding of civil wars. These authors argue that low income levels increase the likelihood that a vio-lent conflict will occur in a given region. Therefore, Justino (2011) asserts that civil wars are more likely to emerge and develop in poor regions.
From a methodological perspective, Miguel et al. (2004) state that endoge-neity and omitted-variable bias make it difficult to disentangle the effect of economic conditions on violent unrest. They try to avoid these issues by using an instrumental variables estimator, concluding that economic growth shocks have a major causal impact on the probability that a civil war will happen. However, the authors fail to evince clear results concerning the differential impacts of income level, ethnicity, political systems, and geographic charac-teristics. More recently Braithwaite et al. (2014) used an instrumental vari-ables approach to showthat poverty, as measured by infant mortality and per capita income, is strongly related to the unfolding of civil wars.
However, in contrast to the results of Fearon and Laitin (2003), Collier and Hoeffler (2004) and Miguel et al. (2004), Djankov and Reynal-Querol (2010) argue that the relationship between poverty and civil war is spurious if exam-ined in the light of the historical phenomena that determine the joint evolu-tion of income and violent conflicts.
Justino (2011) argues that the strand of analysis that suggests a causal effect of violence on poverty usually focuses on the destruction of physi-cal and human capital (assets and household characteristics). The effects of conflicts on different kinds of capital have given rise to different approaches with varying views as to the depth of these effects (Justino, 2011; Fernández, Ibáñez & Peña, 2011). A first channel, or transmission mechanism, that leads from violence to poverty involves household incomes, which fall either as a consequence of reduced agricultural production and productive investment or of increased uncertainty, which lead economic agents to rely on informal and less dynamic markets. Another transmission channel involves increases to production and transaction costs, and limited activity in local markets. Furthermore, social networks are held to weaken, debilitating the informal
Osmar Leandro Loaiza Quintero et al. 17
desarro. soc. no. 80, bogotá, primer semestre 2018, pp. 11-51, issn 0120-3584, e-issn 1900-7760, doi: 10.29263/dYs.80.1
mechanisms of insurance against risks. As a result, the alternatives available to households decrease, and with them potential ways to mitigate the eco-nomic cost of conflict.
The effects of conflict comprise a complex set of conditions and factors that impact on individuals, households, and communities simultaneously. Although the destruction of physical and human capital is undeniable, new opportuni-ties arise from deep local institutional transformations, in which peace, order, and violence intermingle in new quotidian realities. Ganepola and Thalayasin-gam (2004) argue that the negative connotation of the term ‘conflict’ must be questioned since most social changes, including those considered to be posi-tive, involve the interaction between two ideas that are in competition with each other within one social framework. This questioning of conflict should be taken into account in any analysis of the relationship between poverty and conflict. Not only are social and political conflicts recurrent in the evolution of societies, but they also serve as a catalyst to achieving desirable social changes. Nevertheless, formal peace agreements do not necessarily represent the end of violence, and sources of instability tend to persist after their celebration, or as new post-conflict scenarios emerge (Justino et al., 2013).
However, it is probably the case that efforts to single out poverty as a cause of violence, or to identify violence as a cause of poverty, are misplaced. As Dube and Vargas (2013) argue, the income-conflict relationship is theoreti-cally ambiguous. Indeed, using a general equilibrium model, Dal Bo and Dal Bo (2011), show that the effects of a positive economic shock on conflict is dependent upon the capital-labour ratio. For example, a positive shock to labour intensive industries (i.e. those with a low capital-labour ratio) will tend to reduce conflict, as increased wages would make it relatively more costly for individuals to engage in illicit activities. Conversely, a positive shock to cap-ital-intensive industries would increase conflict, as low-wage workers might consider it more attractive to plunder the additional available wealth. So, in the words of Dube and Vargas (2013) it might be said that a positive shock results in an opportunity cost effect and a rapacity effect. According to this perspective, the link between poverty and armed conflict would not be a the-oretical question, but an empirical one.
The Case of Colombia. While economic analyses of Colombia’s armed conflict are recent, internationally there has been enormous academic interest in the

An exploratory assessment of the relationship between multidimensional18
desarro. soc. no. 80, bogotá, primer semestre 2018, pp. 11-51, issn 0120-3584, e-issn 1900-7760, doi: 10.29263/dYs.80.1
matter for over fifty years (Valencia, 2006). In the last decades of the Twen-tieth Century, the literature on the relationship between armed conflict and poverty reflected several different hypotheses about the causes of Colombia’s armed conflict. The issue was highlighted in the 1987 report of the Commis-sion for Studies on Violence (CSV). This report challenged the established view that violence in Colombia was mainly of the political variety, as it argued that there were other forms of violence with precise causes and solutions (Bonilla, 2009). More importantly, the report highlighted the role of living conditions and social relationships as triggers of violent conflict, factors that later came to be known as the objective causes5 of the emergence and development of Colombia’s armed conflict.
Although the CSV report provided an important and unchallenged framework for explaining and understanding armed conflict in Colombia for several years, a study by Gaitán and Deas (1995) shifted the approach to the relationship between poverty and armed conflict. These authors placed less emphasis on the multi-causal and multidimensional view of the phenomenon and intro-duced econometric methods in order to test alternative theories and expla-nations of violence, which they attributed to the judicial system’s inefficiency and to high levels of impunity (Bonilla, 2009; Yaffe, 2011).
These new interpretations of the armed conflict were related to three new trends in Colombia: 1) the incursion in the 1990s of economists into the study of armed conflict and violence (Valencia, 2006; Bonilla, 2009; Valenzuela, 2002); 2) the changes in the dynamics of the internal armed conflict -such as the surge of drug trafficking, the cities as new scenarios of the armed con-flict, and new rent-seeking strategies pursued by illegal groups (Valenzuela, 2002); and 3) a tendency in academia to overlook multi-causal explanations of conflict and to question the incidence of the objective causes of the conflict (Galindo, Restrepo, and Sánchez, 2009; Bonilla, 2009). This shift is consistent with the views of Gutiérrez and Sánchez (2006), Ramírez (2006), and Pizarro and Gómez (2004), who argue that during the 1990s political motivations lost ground in Colombia’s internal armed conflict to criminal and economic factors.
5 The “objective causes” hypothesis broke an old mould by defying the view that violence had a political origin. Instead, it puts forward that violence stems from harsh living conditions and social exclusion (Bonilla, 2009).

Osmar Leandro Loaiza Quintero et al. 19
desarro. soc. no. 80, bogotá, primer semestre 2018, pp. 11-51, issn 0120-3584, e-issn 1900-7760, doi: 10.29263/dYs.80.1
Some authors of this new academic consensus, such as Echandía (1997), Cubides (1998) and Sánchez (2007), downplayed the relevance of structural conditions as causes of the armed conflict, all three arguing, for instance, that municipalities with high homicide rates are also likely to be amongst the rich-est. This viewpoint was grounded in empirical assessments based on munic-ipal-level data, and was intended to show that violence was not randomly distributed across space (Bonilla, 2009). Within this strand of analysis, Gaitán (1995), Beltrán and Salcedo (2006), Rubio (1999, 2002), Sánchez and Núñez (2001) and Sánchez, Solimano, and Formisano (2005) argued that violence is unrelated to objective causes -such as poverty and exclusion- but is associated instead with the presence in a given territory of organised crime.
In this regard, Gómez (2001) argues for the existence of a correlation between inequality and violent conflict, but that there is no causal link between the two, since there are countries with similar income distribution patterns to Colombia that do not face the challenge of an armed insurgency. It therefore appears to be the case that explanations emphasising greed as well as politi-cal and institutional factors might be the most useful to understanding armed conflict in Colombia,.
Thus, a strand of literature emerged in Colombia that moved away from attrib-uting armed conflict to poverty, inequality and exclusion and explained it instead with reference to economic interests and institutional weaknesses. This was a move that Bonilla (2009) considered to be consistent with the changes then occurring in the nature of the problem. For Valencia (2006) the surge in economically-focused studies of armed conflict might be explained by the increasingly important role played by economic incentives in the Colombian conflict after the 1980s.
In this regard, Pizarro and Gómez (2004) argued that the activities of guerrilla groups had become increasingly associated with the control both of centres of illicit drug production and of territories rich in natural resources (including gold, oil, coal, cattle, coffee and bananas). As Valencia (2006), Salazar (2005), Bottia (2003), Rubio (2002), and Echandía (1999) all show, violent attempts to gain control of economic resources have attracted a great deal of attention among authors whose writing focuses on economic matters.
An exploratory assessment of the relationship between multidimensional20
desarro. soc. no. 80, bogotá, primer semestre 2018, pp. 11-51, issn 0120-3584, e-issn 1900-7760, doi: 10.29263/dYs.80.1
While these studies are significant in the current context -as they have pro-vided new interpretations that are consistent with the mutations that have marked the Colombian armed conflict- they also have equivalents in the writ-ings of others who have argued for the return of multidimensional, multi-causal perspectives in analyses of armed conflict and poverty (Yaffe, 2011; Galindo et al., 2009; Valenzuela, 2002).
Authors who have reinstated a multi-causal interpretation of the conflict argue that the focus is not inconsistent with other explanations of violence, but complementary to them, and that it aids understanding of the different phases in the development of the country’s internal armed conflict (Yaffe, 2011). For Galindo et al., (2009), works that explain conflict in terms of the opportu-nities to appropriate rents and resources without taking into account social injustice, exclusion and poverty are short-sighted, and incapable of explain-ing violent conflicts at the national and subnational levels, as they fail to take into account the complexities surrounding violence between armed groups, political representation issues and institutional heterogeneity. However, Yaffe (2011) argues that while objective conditions –such as poverty, inequality and social injustice- help explain the origins of the conflict, its later stages are best understood in terms of greed for control over natural resources and other rent-seeking behaviour.
Discussions of the causes of Colombia’s internal armed conflict had their international counterpart in the well-known debate between greed and griev-ance. However, other approaches to the causes of conflict exist. For example, Gómez (2001) argues that some contemporary studies have shown that the “objective causes” hypothesis may not explain the origins and persistence of the Colombian armed conflict, and proposes an alternative hypothesis, namely that it is neither harsh living conditions nor social exclusion that cause vio-lence, but that violence is the principal cause of inequality. This view brings to the fore an issue that has been examined much less, but on which there is greater theoretical agreement: that armed conflict impacts on poverty and living conditions (Valencia, 2006). Thus, redirecting the emphasis of the dis-cussions shifts focus from the causes of conflict to its costs.
Valencia (2006) warns that analyses that focus on measuring the costs of armed conflict may show limitations when they examine the correlations between homicidal violence and economic growth and when comparing the economic

Osmar Leandro Loaiza Quintero et al. 21
desarro. soc. no. 80, bogotá, primer semestre 2018, pp. 11-51, issn 0120-3584, e-issn 1900-7760, doi: 10.29263/dYs.80.1
performance of countries with and without armed conflicts. In consequence, their results may potentially lead to inconclusive results. Thus, Valencia (2006) argues that there is a shortage of studies addressing how armed conflict affects poverty, investment, and growth. However, authors including Rubio (1997), Trujillo and Badel (1997), Londoño (1998), Echeverri, Salazar and Navas (2000), Gómez (2001), Sánchez and Díaz (2005), and Arias, Camacho, Ibañez, Mejía and Rodriguez (2014) have used economics to examine the costs of conflict in Colombia. In general terms, there is consensus that armed conflicts worsen poverty conditions.
Galindo et al. (2009) point to some other costs -such as the stagnation of social development- that are clearly evinced in the drop in school enrolment rates, impoverishment associated with the destruction of infrastructure, reduced access to healthcare, and higher infant mortality rates.
To sum up, the literature displays an interest in examining the links between armed conflict and poverty. On the one hand, a large number of studies belong-ing to one strand of analysis is devoted to studying poverty as a cause of con-flict, though many of these fail to advance conclusive evidence. On the other hand, another group of studies argues that conflict is a cause of poverty, and employ evidence directed principally at estimating its economic and human costs. Moreover, it is apparent that a significant number of studies of the Colombian case suggest that armed conflict does not necessarily occur in poor areas. In fact, illegal groups look for regions that are rich enough for there to be wealth that can be appropriated and used to finance military activities: by doing so, they deny a large section of society enjoyment of its economic and political rights.
Methodology
A. Poverty Measurement
Antioquia is a Department (or province) located in the central northwestern region of Colombia. In terms of its contribution to GDP (around 13% in 2012, according to official statistics) it is second in importance only to Bogotá. Recent estimates by Colombia’s National Statistical Office, the Departamento Administrativo Nacional de Estadística (DANE), suggest that the population of

An exploratory assessment of the relationship between multidimensional22
desarro. soc. no. 80, bogotá, primer semestre 2018, pp. 11-51, issn 0120-3584, e-issn 1900-7760, doi: 10.29263/dYs.80.1
the Department is close to 6,500,000, distributed across 125 municipalities; more than half of its population lives in nine municipalities in the Metropolitan Area of Medellín, in the Valle de Aburrá. For administrative purposes Antio-quia’s municipalities are grouped into nine regions Readers may find it useful to refer to the map of the regional subdivision of Antioquia that is provided in the Appendix, as it is referred to in the Results section.
This study uses data on armed actions perpetrated by both illegal and legal groups in Antioquia between 1996 and 2010, and on forced internal migration (displacement) of persons expelled from their lands during the same period. The data was gathered by the Vice Presidency’s Observatorio de Derechos Huma-nos (Human Rights Observatory) and by the Noche y Niebla database main-tained by the Jesuit NGO CINEP. Poverty was measured at household level for each municipality of Antioquia using the multidimensional poverty index (MPI), with the information being drawn from the government’s SISBEN data-base (cross-section 2012), which is used by several Colombian institutions as an instrument to target social assistance programs. Subsequently we provide a poverty measure for each municipality in Antioquia that is closer to Sen’s capability approach.
The MPI, first proposed by Alkire and Foster (2011), provides a measure based on the capability approach. In the parlance of the MPI, each functioning is called a dimension. In a sense, the MPI is not new: the direct method of pov-erty measurement,6 which “shows whether people satisfy a set of specified basic needs, rights, or –in line with Sen’s capability approach– functionings (Alkire and Foster, 2013, p. 5)”, has been widely implemented in Latin Amer-ica by governments seeking to measure Unsatisfied Basic Needs (Feres and Mancero, 2001).
Direct methods of poverty measurement rely on the dual cutoff method to identify the poor. First, direct methods determine the deprivations suffered by the population, namely the basic needs or rights that remain unsatisfied. Sec-ond, the poor are identified among the group of individuals who display any form of deprivation. Traditional direct poverty measurements generally rely either on the union or on the intersection identification methods. The union
6 Indirect methods, on the contrary, are not based on the living conditions, but on the available resources of the individual or household (Boltvinik, 1999).

Osmar Leandro Loaiza Quintero et al. 23
desarro. soc. no. 80, bogotá, primer semestre 2018, pp. 11-51, issn 0120-3584, e-issn 1900-7760, doi: 10.29263/dYs.80.1
method regards as poor individuals with at least one deprivation or unsat-isfied need, while the intersection approach categorises as poor individuals who experience deprivations across all dimensions. Thus, a key contribution of Alkire and Foster’s MPI (2011) resides in the development of a new docu-mentation procedure that “identifies the poor by counting the dimensions in which a person is deprived” (Alkire and Foster, 2009, p. 1). Moreover, the MPI satisfies the property of dimensional monotonicity, which states that “if a poor person becomes newly deprived in an additional dimension, then overall poverty should increase” (Alkire and Foster, 2009, p. 12).
Following the method developed by the 2014 UNDP Human Development Report, the approach to MPI used in this paper is comprised of three dimensions: health, education, and standard of living, which represent socially accepted valuable functionings and are proxied by nine indicators. These indicators do not necessarily reflect specific functionings, but do at least reflect circum-stances conducive to the realisation of a given UNDP functioning. Moreover, data limitations largely explain why it was only possible to consider three dimensions and to proxy them using a small number of indicators. The depriva-tion cutoffs were based on those used by the UNDP (2014) or by the National Statistical Office, DANE, to compute the Basic Unmet Needs indicator. More-over, all dimensions were given equal importance; in other words, each was assigned a weight of one third (1/3).
The Living Standards dimension considers access to Electricity, Water, Sanita-tion, Household Assets (i.e. electrical appliances), and Housing Materials. The Health dimension considers access to Health and Permanent Disability Insur-ance for all household members. Finally, the Education dimension includes School Attainment by adult household members and School Attendance by children belonging to the household. For more details on each indicator and its cutoff (namely, its deprivation thresholds) please refer to the methodologi-cal Appendix A1.
After identifying the deprived households identified by each indicator, a depri-vation share (or score) was computed for each one. Next, in order to identify the multidimensionally poor, a multidimensional cutoff was chosen, which was used to filter households according to their deprivation share. Any household with a deprivation share above the one given by the multidimensional cut-off was regarded as poor. Finally, the MPI for Antioquia’s municipalities was

An exploratory assessment of the relationship between multidimensional24
desarro. soc. no. 80, bogotá, primer semestre 2018, pp. 11-51, issn 0120-3584, e-issn 1900-7760, doi: 10.29263/dYs.80.1
computed. The MPI or -to use the term coined by Alkire and Foster (2011)- the M0, is the product of the average deprivation share and the headcount ratio.7 The headcount ratio is the share of households within each municipal-ity regarded as multidimensionally poor. The average deprivation share is the deprivation share of the typical household, in other words the average of the deprivation share.
Finally, in order to assess the robustness of the MPI in relation to the multi-dimensional cutoff, we computed the MPI using different cutoff values. The resulting orderings were then compared using three correlation measures: standard Pearson correlation coefficients, Kendall rank correlations, and Spear-man rank correlations.
B. The MPI vs. the Armed Conflict
To understand the relationship between poverty and armed conflict in Antio-quia, the study employed exploratory data analysis tools. First, we displayed the spatial distribution of the MPI and violence associated with the armed conflict using choropleth maps. In particular, we employed box maps to por-tray the spatial distribution of the variables of interest, classifying the sample into six groups, identical with the ranges that would have been portrayed in a standard boxplot. As the box map groupings were the same as those used in a boxplot, it was easy to spot spatial outliers in each one. A comparison of the resulting spatial patterns for the variables of interest might suggest the existence of spatial relationships in the data analysed.
Second, a set of kernel distributions was estimated, portraying the empirical distribution function of the MPI in the absence and presence of illegal armed groups. This allowed us to determine whether the distribution of poverty dif-fers under the presence or absence of such groups.
7 The MPI can also be seen as the weighted average of the censored dimensional headcount ratios.

Osmar Leandro Loaiza Quintero et al. 25
desarro. soc. no. 80, bogotá, primer semestre 2018, pp. 11-51, issn 0120-3584, e-issn 1900-7760, doi: 10.29263/dYs.80.1
III. Results
The study considered several deprivation cutoffs for addressing the sensitivity of the poverty measure to the different multidimensional cutoffs. Following the application of intermediate multidimensional thresholds, Pearson corre-lations were high for all the MPIs computed. However, when MPIs with cut-offs below 6 were compared with those with higher cutoffs, correlations were slightly lower. After applying a multidimensional cutoff below 6 (66.6%), the Kendall and Spearman rank correlation coefficients also showed high correla-tions between the MPIs obtained. These results suggest that the MPI is fairly robust to the multidimensional cutoff.
Table 1 shows that the Pearson correlation between M0_3 and M0_4 was high, and close to one (0.9856). M0_3 refers to the MPI obtained after apply-ing a multidimensional cutoff of one third (3/9) or 33.3%. This means that it is possible to identify as poor any household with three or more deprivations or, equivalently, with a deprivation share above 33.3%. Similarly, M0_4 refers to the MPI obtained after applying a multidimensional cutoff of 44.4% (4/9), which identifies as poor any household with a deprivation share above 44.4%, namely, that is deprived in at least four dimensions. Kendall and Spearman cor-relations displayed similar behaviour (see Tables A1 and A2 in the Appendix).
Although the MPI was calculated for different multidimensional cutoffs, the relative robustness of the measure led us to concentrate on the MPI obtained from intermediate multidimensional cutoffs.
This should not, however, be a source of concern, as high values for the mul-tidimensional cutoff place the MPI in a field closer to the traditional intersec-tion-identification approach. In fact, when the multidimensional cutoff equals nine -equivalent to 100%- the approach is equivalent to the intersection-identification method. However, as mentioned above, a key feature of the Alkire and Foster method (2011) for the MPI is that the identification proce-dure lies halfway between the traditional union and intersection approaches.

An exploratory assessment of the relationship between multidimensional26
desarro. soc. no. 80, bogotá, primer semestre 2018, pp. 11-51, issn 0120-3584, e-issn 1900-7760, doi: 10.29263/dYs.80.1
Table 1. Pearson Correlations bBetween MPI Measures
M0_1 M0_2 M0_3 M0_4 M0_5 M0_6 M0_7 M0_8 M0_9
M0_1 1.000
M0_2 0.999 1.000
M0_3 0.986 0.983 1.000
M0_4 0.967 0.965 0.986 1.000
M0_5 0.927 0.925 0.961 0.975 1.000
M0_6 0.874 0.872 0.911 0.936 0.950 1.000
M0_7 0.698 0.700 0.723 0.763 0.763 0.900 1.000
M0_8 0.754 0.759 0.777 0.784 0.827 0.865 0.792 1.000
M0_9 0.362 0.362 0.379 0.425 0.462 0.641 0.804 0.696 1.000
Figure 1a shows a box map of the headcount ratio for the multidimensionally poor in at least three indicators (k=3/9). It is apparent that higher headcount ratios are found in Antioquia’s periphery, in which over half of the municipal population is classified as multidimensionally poor. Although it is certainly the case that, as the multidimensional threshold increases, the share of the population identified as poor diminishes, the spatial patterns exhibited by the headcount ratio remain roughly the same (see Graphs 1b, 1c and 1d). This result is in line with the high degrees of correlation between the different MPIs. However, for multidimensional thresholds above 55.5% (5/9), the share of the population identified as multidimensionally poor diminishes significantly, with fewer than 30% of the municipal population classified as poor. This is not surprising, as high cutoff values place the MPI close to the interception approach. Hereafter, we focus our analysis on the MPI for multidimensional thresholds between 3/9 and 4/9.
The average deprivation share, illustrated in Figure 2, follows a similar spa-tial pattern to the headcount ratio in Figure 1. Again, the average deprivation share is higher in the northern regions of Antioquia, and lower in the central region, around the Metropolitan Area. For example, for a multidimensional cutoff of 33.3% (or 3/9), the average deprivation share of poor households in the northern region is about 50%, which means that a poor household is on average deprived in 4 or 5 indicators.

Osmar Leandro Loaiza Quintero et al. 27
desarro. soc. no. 80, bogotá, primer semestre 2018, pp. 11-51, issn 0120-3584, e-issn 1900-7760, doi: 10.29263/dYs.80.1
Figure 1. Headcount Ratios for Multidimensional Thresholds - Box Maps
Head Count Ratio
k = 3/9
[10.2 - 10.2) (0)[10.2 - 25.8) (31)[25.8 - 35.6) (31)[35.6 - 49.3) (31)[49.3 - 72.4) (31)[72.4 - 72.4) (1)
Head Count Ratio
k = 4/9[2 - 2) (0)[2 - 9) (31)[9 - 14.2) (31)[14.9 - 23.8) (31)[23.8 - 42.9) (31)[42.9 - 42.9) (1)
a) k = 3/9 b) k = 4/9
Head Count Ratio Head Count Ratio
c) k = 5/9 d) k = 6/9
k = 5/9
[0.2 - 0.2) (0)[0.2 - 2.4) (31)[2.4 - 5) (31)[5 - 9.9) (31)[9.9 - 19.7) (25)[19.7 - 28.9) (7)
k = 6/9
[0.1 - 0.1) (0)[0.1 - 0.6) (31)[0.6 - 1.5) (31)[1.5 - 3.2) (31)[3.2 - 7) (25)[7 - 11.8) (7)

An exploratory assessment of the relationship between multidimensional28
desarro. soc. no. 80, bogotá, primer semestre 2018, pp. 11-51, issn 0120-3584, e-issn 1900-7760, doi: 10.29263/dYs.80.1
Figure 2. Average Deprivation Share for Different Multidimensional Thresholds - Box Maps
Average Deprivation Share
k = 3/9
[36 - 36) (0)[36 - 42.3) (31)[42.3 - 44.7) (31)[44.7 - 47.1) (31)[47.1 - 51.8) (31)[51.8 - 51.8) (1)
Average Deprivation Share
k = 4/9[48.6 - 48.6) (0)[48.6 - 52.6) (31)[52.6 - 54.1) (31)[54.1 - 56.2) (31)[56.2 - 59.4) (31)[59.4 - 59.4) (1)
a) k=3/9 b) k = 4/9
It should be borne in mind that the MPI can be seen as the product of the two previous indices. That is, the MPI is composed of the frequency among the poor of poverty (the headcount ratio) times the average breadth of depriva-tion (the average deprivation share) or, in other words, “the aggregate depri-vations experienced by the poor as a share of the maximum possible range of deprivations across society (Alkire and Foster, 2009, p. 25)”. Given the clear cut spatial patterns exhibited by the headcount ratio and the average depri-vation share, it is not surprising that the MPI replicates such patterns. In fact, it provides a sharp picture of the regional development gaps in Antioquia (see Figure 3), in which the Medellin Metropolitan Area is, by a wide margin, ahead of most municipalities in Antioquia.8 Thus, the Medellín Metropolitan Area, and with it the eastern region of Antioquia, exhibits the lowest levels of mul-tidimensional poverty in the province. Conversely, the Bajo Cauca, Nordeste
8 Accounts of regional disparities in Antioquia can be found in Loaiza and Moncada (2013), Pérez, 2005; Muñetón and Vanegas, 2014.

Osmar Leandro Loaiza Quintero et al. 29
desarro. soc. no. 80, bogotá, primer semestre 2018, pp. 11-51, issn 0120-3584, e-issn 1900-7760, doi: 10.29263/dYs.80.1
and Urabá regions in the north of the Department are marked by high levels of multidimensional poverty. However, it is worth mentioning that Apartadó and Carepa, in Urabá, have low poverty levels compared to other municipalities in the region, as does Caucasia in the Bajo Cauca although, as will be seen, these municipalities are not exempt from the hardships of Colombia’s armed conflict.
Figure 3. Multidimensional Poverty Index - Box Maps
Multidimensional Poverty Index or M0
k = 3/9
[4 - 4) (0)[4 - 10.9) (31)[10.9 - 15.9) (31)[15.9 - 23.1) (31)[23.1 - 37.5) (31)[37.5 - 37.5) (1)
Multidimensional Poverty Index or M0
k = 4/9[1 - 1) (0)[1 - 4.8) (31)[4.8 - 7.8) (31)[7.8 - 13.3) (31)[13.3 - 25.5) (31)[25.5 - 25.5) (1)
a) k=3/9 b) k = 4/9
It should be borne in mind that the eastern region of Antioquia is connected to the Medellín Metropolitan Area by a major road link, while the north-ern zone, comprising regions like Urabá and the Bajo Cauca, is further from Medellín and is connected with it by a deficient road network. To illustrate this, Figure 4 shows the closeness index. The higher the closeness index, the easier it is to communicate with other municipalities using the road network. It is clear that the Medellín Metropolitan Area, along with some towns in the eastern region, make up the most connected region in Antioquia in terms of road infrastructure.

An exploratory assessment of the relationship between multidimensional30
desarro. soc. no. 80, bogotá, primer semestre 2018, pp. 11-51, issn 0120-3584, e-issn 1900-7760, doi: 10.29263/dYs.80.1
Figure 4. Closeness Index
Closeness Index
[0.4 - 0.4) (0)[0.4 - 0.7) (76)[0.7 - 0.8) (76)[0.8 - 0.9) (76)[0.9 - 1) (75)[1 - 1) (1)
Figure 5 illustrates the kernel distribution (or empirical distribution function) of the MPI for two different cutoff values, as an alternative means of illus-trating the dual nature of Antioquia’s development in terms of the MPI. It is evident from the figure that the MPI distribution is multimodal, indicating that municipalities cluster around two groups of multidimensional poverty.
Figure 5. MPI Kernel Distribution
a) k=3/9 b) k = 4/9
M0 - cut off: 3/9
5
4
3
2
1
0
0.0 0.1 0.2 0.3 0.4
Den
sity
6
4
2
0
0.0 0.1 0.2 0.3
Den
sity
MPI
M0 - cut off: 4/9
MPI

Osmar Leandro Loaiza Quintero et al. 31
desarro. soc. no. 80, bogotá, primer semestre 2018, pp. 11-51, issn 0120-3584, e-issn 1900-7760, doi: 10.29263/dYs.80.1
A. Conflict Areas and High Poverty Areas Overlap
Figure 6a presents the total number of armed attacks by illegal groups for the period 1996-2010, showing that the zones most affected by attacks by illegal groups were located in Antioquia’s north and southeast. Figure 6b also shows that the FARC guerrilla maintained a significant presence in the north during the period, including in the Urabá region, as well as in the west and southeast of the Department. The ELN guerrilla organisation also had a presence in the southeast, where at times they entered into conflict with the FARC. However, the ELN’s principal presence was in the northeastern region, where they were the dominant force. Finally, Figure 6d shows that the number of armed attacks by paramilitary groups was very low. This aspect has two potential explanations: 1) it is likely that there is an underreporting of paramilitary activities, as it is well known that these forces cooperated tacitly with the security forces in their offensive against guerrillas (Dube and Vargas, 2013; Acemoglu, Robinson, & Santos-Villagran, 2013), and 2) paramilitary forces used quite different strategies from those of the guer-rilla groups in their quest for territorial control. In subsequent paragraphs, we will elaborate on these hypotheses further.
A comparison of Figure 6 and Figure 3 suggests a fair amount of coincidence between areas with high levels of multidimensional poverty, and those hit hardest by Colombia’s armed conflict. Moreover, a comparison of Figures 6 and 4 also suggests that illegal groups prefer to locate in less accessible areas. However, against this general trend, Medellín and some municipalities in the east should be given special treatment: although they exhibit low levels of poverty, they were also the scenario of armed actions committed by differ-ent groups. Also bucking the general trend, the northernmost municipalities in Urabá, which are among the poorest, have experienced a low incidence of armed attacks.

An exploratory assessment of the relationship between multidimensional32
desarro. soc. no. 80, bogotá, primer semestre 2018, pp. 11-51, issn 0120-3584, e-issn 1900-7760, doi: 10.29263/dYs.80.1
Figure 6. Armed Actions, 1996-2010
Armed Attacks: Illegal Armed Groups 1996-2010
[0 - 1) (20)[1 - 2) (20)[2 - 7) (32)[7 - 17) (27)[17 - 389] (26)
a) All Illegal groups b) FARC Guerrilla
Armed Attacks: ELN 1996-2010 Armed Attacks: AUC 1996-2010
c) ELN Guerrilla d) Paramilitary groups
Armed Attacks: FARC 1996-2010
[0 - 0) (0)[0 - 1) (43)[1 - 2) (23)[2 - 6) (29)[6 - 32] (30)
[0 - 0) (0)[0 - 0) (0)[0 - 1) (73)[1 - 2.3) (27)[2.3 - 43] (25)
[-0.5 - 0.5) (112)[0.5 - 1.5) (10)[1.5 - 2.5) (1)[2.5 - 3.5] (2)
Figure 7 illustrates an additional aspect of the armed conflict, showing the expulsion and reception rates of internal forced migrants. Specifically, it shows

Osmar Leandro Loaiza Quintero et al. 33
desarro. soc. no. 80, bogotá, primer semestre 2018, pp. 11-51, issn 0120-3584, e-issn 1900-7760, doi: 10.29263/dYs.80.1
maximum municipal expulsion and reception rates between 1996 and 2010. It is fairly clear that the expulsion rate of forced migrants in the Medellín Met-ropolitan Area has been relatively low (Figure 7a). Indeed, Medellín has prin-cipally been a receptor of forced migrants (Figure 7b). The areas of Antioquia most heavily affected by armed conflict and that generated most forced dis-placement are the far western region, the southeast, and Urabá in the north. According to Figure 3, all these areas show a high MPI.
Figure 7. Forced Displacement: Maximum Expulsion and Reception Rates (x 100,000 inhabitants): 1996-2010
Forced migrants expulsion rate
[7 - 494.2) (25)[494.2 - 1414.9) (25)[1414.9 - 3669.5) (25)[3669.5 - 11027.7) (25)[11027.7 - 80820.3] (25)
a) Expulsion of forcibly displaced persons b) Reception of forcibly displaced persons
Forced migrants reception rate
[0 - 285.3) (25)[285.3 - 746.1) (25)[746.1 - 2468.9) (25)[2468.9 - 9253.4) (25)[9253.4 - 79099.4] (25)
Counteracting these general trends, at this point it is worth noting 1) that Urabá’s northernmost municipalities are among the poorest in Antioquia, whereas Apartadó is the wealthiest city in region; 2) that despite this, and as is apparent from Figures 6a and 6b, Urabá’s northernmost municipalities expe-rienced few armed attacks compared to other municipalities in Antioquia and in the region, though Apartadó itself was a frequent target of armed groups; and 3) that Urabá’s northern municipalities showed high rates of expulsion of forced migrants, whereas Apartadó was a net receiver.

An exploratory assessment of the relationship between multidimensional34
desarro. soc. no. 80, bogotá, primer semestre 2018, pp. 11-51, issn 0120-3584, e-issn 1900-7760, doi: 10.29263/dYs.80.1
This finding is consistent with Gómez, Sánchez-Ayala and Vargas, (2015), who show that forced displacement has often occurred in the absence of clashes or attacks by armed groups. These facts could be interpreted as a sign of the strategies used by paramilitary groups in their strongholds. Although prior to 1995 Urabá was under the control of the FARC, it later came to be dominated by paramilitary groups, who made the region one of their strongholds. It is well documented that paramilitary groups emerged in Urabá under the auspices of landlords –particularly cattle ranchers but also banana growers- and drug lords, and that they colluded with the state’s armed forces to expel the FARC (Dube and Naidu, 2010). This meant that, after securing control over Urabá, the paramilitaries granted themselves a virtual monopoly over violence in the region, acting with the support and complicity of a significant proportion of the local business and political elites. They then took advantage of their posi-tion to grab land by forcibly displacing the population, with the complicity of corrupt officials and notaries (Gómez et al., 2015). The land they seized was subsequently sold, or used for the pursuit of legal agribusiness activities. In this way, the illegal activities of the paramilitary groups became intertwined with legal activities, all under the auspices of local elites and state officials.
A more prototypical example of armed conflict is provided by Antioquia’s southeastern region (the Suroriente). Figure 3 shows that this region has suf-fered low to intermediate levels of multidimensional conflict. Simultaneously, Figures 6 and 7 show that this region experienced frequent armed attacks by ELN and FARC guerrillas, and was also the scenario of an important outflow of forced migrants. It may then be said that in the Suroriente the armed con-flict manifested as a collision between two opposing groups for the control of the illegal rents in the region, which derived principally from extortion and kidnappings (“FARC contra ELN”, 2007).
As a method for collecting further evidence about the possible relationship between poverty and the armed conflict in Antioquia, the MPI distribution is conditioned by the presence or absence of illegal groups. That is, the conditional density function of the MPI is estimated. In Figure 8 the dashed lines represent the hypothetical distribution of the given MPI in the absence of illegal groups, while the solid line shows the opposite situation. It is apparent that the dis-tribution of the MPI when illegal groups are present is flat and wide, with its distribution mass -i.e. its peak- located to the right of the distribution mass of the dashed line. Hence, we can hypothesise that armed groups tend to avoid

Osmar Leandro Loaiza Quintero et al. 35
desarro. soc. no. 80, bogotá, primer semestre 2018, pp. 11-51, issn 0120-3584, e-issn 1900-7760, doi: 10.29263/dYs.80.1
the richest areas, in favour of slightly poorer ones. This might be explained by the unequal spatial distribution of state institutions and services, which in Colombia tend to be concentrated in the principal urban centres, which also happen to be wealthier than their surroundings. Therefore, notwithstanding the presence of armed gangs, it might be expected that better law enforce-ment in urban areas, such as the Medellín Metropolitan Area, would make it costlier for armed groups to operate openly in such places.
However, it should also be noted that the right tail of the solid line is thin-ner than that of the dashed line, leading us to hypothesise that armed groups prefer to avoid very poor areas, probably because the available resources are insufficient to generate looting opportunities or finance their activities. It seems, then, that armed groups prefer to operate in a species of middle ground, preferring municipalities that are not so poor that they do not have enough resources to finance illegal activities, but that at the same time are not so rich as to pose obstacles to their illegal activities in the form of law enforce-ment or other mechanisms.
Figure 8. MPI Distribution Conditioned On the Presence of Illegal Groups
k=3/9
8
6
4
2
0
0.0 0.1 0.2 0.3 0.4
Den
sity
MPI k = 3/9
Conditioned kernels: Illegal Groups
Illegal Groups: absent
Illegal Groups: present
Figure 9 shows the MPI distribution conditioned by the presence of FARC, the ELN, paramilitary counter-insurgency groups, and common criminality. The MPI kernel distribution conditioned by the presence or absence of the FARC guerrilla (figure 9a) is similar to the one described above. Taking the dashed

An exploratory assessment of the relationship between multidimensional36
desarro. soc. no. 80, bogotá, primer semestre 2018, pp. 11-51, issn 0120-3584, e-issn 1900-7760, doi: 10.29263/dYs.80.1
line as a reference, the solid line indicating the presence of the FARC shows a flatter kernel distribution, which appears to shift towards the right. This sug-gests that the presence of this group tended to be associated with high poverty levels, in contrast with the situation prevailing in some of the municipalities in which the group did not establish itself. However, it is also apparent that the dashed line exhibits a thicker right tail. Thus, the FARC also avoided the extremely poor municipalities.
Regarding the presence of paramilitary counter-insurgency groups (figure 9c), it is found that the right tail of the solid line is thicker and gives a higher prob-ability mass to the MPI values to the part of the dashed line furthest to the right, suggesting that the presence of the paramilitary may be related to extreme poverty. Thus, unlike the FARC, the paramilitary groups do not appear to have avoided extremely poor municipalities. At the same time, although it is found that the peak of the solid line is lower than the dashed one, both peaks are located on almost precisely the same point of the horizontal axis. Indeed, the left tail of the solid line is slightly thicker, suggesting that paramilitary groups, unlike the FARC, did not avoid the richest municipalities. This result is also consistent with the documented affinity between the Colombian security forces and the paramilitary counter-insurgency groups (Dube and Naidu, 2010), which permitted paramilitary groups to move freely, even in urban areas, and could help explain the underreporting of paramilitary-led attacks, particularly in Urabá and the Bajo Cauca and their core cities of Apartadó and Caucasia.
In the case of the ELN, Figure 9b shows that the right tail of the dashed line is thicker than the right tail of the solid line, allowing it to be said that the ELN has also tried to avoid extremely poor municipalities. However, as the solid line peak is slightly to the left of its dashed line counterpart, it appears that the ELN guerrilla is not afraid of assuming a presence in rich municipalities. This result could be related to the relative strength, historically, of the ELN in grassroots activity (Navarrete, 2014), which even gave them an edge in urban areas (Vélez, 2001), in contrast to the FARC, whose strategy was focused prin-cipally on seizing military control of vast tracts of territory and of small towns in rural areas. Also, it should be borne in mind that the ELN has, historically, been smaller and more nimble than the FARC. Therefore, the ELN developed an edge in using covert tactics that avoided direct clashes with the security forces, eschewed going for big targets, preferred to scatter its armed units,

Osmar Leandro Loaiza Quintero et al. 37
desarro. soc. no. 80, bogotá, primer semestre 2018, pp. 11-51, issn 0120-3584, e-issn 1900-7760, doi: 10.29263/dYs.80.1
and relied heavily on civilian support (Vélez, 2001). In contrast, the FARC acted more like an army. In the words of one detained ELN commander -alias Byron- who fought unsuccessfully against the FARC in Antioquia’s Suroriente, “the FARC is an army of occupation” (“FARC contra ELN”, 2007). Indeed, at the height of its military power in the first decade of the 21st Century, the FARC was not afraid of directly defying the army.
These differences in tactics mean it was harder for the FARC to forge a pres-ence in rich urban centres, whereas the grassroots tactics of the ELN granted it access to those centres without a need to exert complete territorial con-trol. This implies that the ELN faced fewer obstacles to gaining a foothold in richer municipalities.
Finally, as Figure 9d shows, criminal activity is present across the entire range of the MPI, so that crime can be associated with both high and low levels of multidimensional poverty. However, compared with the guerrilla and para-military groups, criminal organisations appear to display a slight preference for rich, low poverty municipalities. This is probably consistent with the wide-spread presence of criminal gangs in urban centres.
Figure 9. MPI Distribution Conditioned by the Presence of the FARC, ELN, Paramili-taries, and Criminal Organisations
a) k=3/9 b) k = 4/9
M0 - cut off: 3/9
5
4
3
2
1
0
0.0 0.1 0.2 0.3 0.4
Den
sity
M0 - cut off: 4/9
MPI k=3/9
6
7 FARC: absent
FARC: present5
4
3
2
1
0
0.0 0.1 0.2 0.3 0.4
Den
sity
MPI k=3/9
ELN: absent
ELN: present

An exploratory assessment of the relationship between multidimensional38
desarro. soc. no. 80, bogotá, primer semestre 2018, pp. 11-51, issn 0120-3584, e-issn 1900-7760, doi: 10.29263/dYs.80.1
IV. Conclusions and Future Study
The analysis presented here suggests a complex relationship between poverty and armed conflict in Antioquia. The choropleth maps presented in Figures 1 to 7 suggest that the MPI and the number of armed attacks by illegal groups follow similar spatial patterns. In other words, there is definitely an overlap between areas of high multidimensional poverty and areas that have been hit hard by the armed conflict. Indeed, the MPI conditional kernel distribu-tions show that multidimensional poverty tends to be higher in those areas in which any armed group has had a presence, whatever its identity. However, this relationship is not linear, as there are some exceptions that do not fit into the hypothesised direct link between the phenomena under examination. For instance, some towns in Antioquia’s southeastern region exhibit low levels of poverty, but have been hit hard by armed actions and forced displacement. Also, the conditional distribution of the MPI shows that the presence of the ELN cannot be associated with high levels of multidimensional poverty. Per-haps the mining resources present in the northeastern region, where the ELN presence was been strong, in particular between 1996 and 2001, may help explain this fact, as might the grassroots tactics that granted them access to urban centres where the state had no strong military presence.
Moreover, it is clear from the conditional kernels that both the ELN and the FARC tried to avoid extremely poor municipalities, a result that is consistent with other studies that have pointed to the importance of the economic incen-tives in shaping the military goals pursued by armed groups (Sánchez, 2007; Dube and Vargas, 2013). For example, the FARC was highly interested in con-trolling the production and distribution of illicit drugs. This is why it disputed control of Antioquia’s southeastern region with the ELN, as there it could find lands suitable for coca growing and with easy access to distribution routes in the Magdalena River valley (Díaz and Sanchez, 2004, p. 17). Furthermore, although the FARC was expelled from Urabá by paramilitary forces, it managed to retain control of the Nudo de Paramillo to the south of Urabá, as this was a key route for the distribution of drugs (Muñetón and Maya, 2016). By contrast, the ELN had historically been more reticent about entering the illegal drugs trade (Velez, 2001; “ FARC contra ELN”, 2007), preferring other financing strat-egies such as kidnapping and the extortion of oil, gold and coal mining inter-ests. Hence, even today the ELN maintains a presence in Antioquia’s Nordeste and Bajo Cauca, currently the site of gold mining activities (Restrepo, 2017).

Osmar Leandro Loaiza Quintero et al. 39
desarro. soc. no. 80, bogotá, primer semestre 2018, pp. 11-51, issn 0120-3584, e-issn 1900-7760, doi: 10.29263/dYs.80.1
For their part, from their inception the paramilitary groups were associated with the drug trade, as some of its sponsors were drugs traffickers. But because of their relationship with landlords, paramilitary groups have also been involved in systematic land grabs. Both these activities converged in Urabá, where illicit crops are grown, which is the location of export routes for drugs, and where there are found large landholdings that came under the control of paramili-tary commanders, or that were later resold to other landlords or to agribusi-ness interests (Macías, 2013; Gómez et al., 2015).
It should be noted that it is not possible to infer from the previous analysis the extent to which armed conflict has tended to increase levels of multidimen-sional poverty for each municipality. It is clear that armed conflict is related in some way to increased poverty, but not necessarily with its most extreme expressions. Though it is apparent from Figure 8 that municipalities affected by armed groups were poor, they were not necessarily amongst the poorest. There are even authors, such as Cramer (2006), who posit that armed conflict is not incompatible with economic growth. In a similar vein Gonzalez and Kal-manovitz (2010) speculate that in as much as the armed conflict acted as “a cover for land expropriation” (Dube and Vargas, 2013), it also fostered a vio-lent transition from small scale farming to capitalist agriculture that might have boosted productivity. In this regard, however, at the very least it may be said that conflict contributed to increased inequality as a result of forced dis-placement and land dispossession. Also, since armed groups sought to avoid extremely poor municipalities, it may be hypothesised that for Antioquia at least it is likely that poverty is not the real trigger of conflict.
Finally, some caveats come to mind. Further attention should be devoted to complementary data, as this study relates a cross-sectional measure of poverty to count data on armed attacks and forced displacement for the 1996-2010 period. An additional cross-sectional measure of multidimensional poverty for a previous period might make it easier to understand the temporal dimension of the data set employed to proxy armed conflict in Antioquia. In turn this might provide insights into the chronological evolution of multidimensional poverty as a consequence of armed conflict. Additionally, further avenues of research on this topic might involve the quantification of the balance of incentives associated with the armed conflict in Antioquia, in order to confirm whether it is poverty or economic incentives shaped by weak institutions in Antioquia’s periphery that are the real trigger of violence.
An exploratory assessment of the relationship between multidimensional40
desarro. soc. no. 80, bogotá, primer semestre 2018, pp. 11-51, issn 0120-3584, e-issn 1900-7760, doi: 10.29263/dYs.80.1
Acknowledgments
The results presented in this paper are a part of the research project “La relación de la pobreza y el conflicto armado en el departamento de Antioquia-Colombia”. We are grateful to Universidad de Antioquia, which provided funding to this research project, through the research grant No. 670 approved in November of 2013 by the Committee for Research Development (CODI). We also thank the Vice-rector of the Research Office at Universidad de Antioquia and its strat-egy of sustainability of groups for the development of research.
References
1. Acemoglu, D., Robinson, J. A., & Santos-Villagran, R. J. (2013). The monopoly of violence: Evidence from Colombia. Journal of the European Economic Association., 11, 5-44.
2. Alkire, S., & Foster, J. (2009). Counting and multidimensional poverty measurement. (OPHI Working Paper 32).
3. Alkire, S., & Foster, J. (2011). Counting and multidimensional poverty measurement counting and multidimensional poverty measurement. Journal of Public Economics., 95(7-8), 476-487.
4. Alkire, S., & Foster, J. (2011b). Understandings and misunderstandings of multidimensional poverty measurement (OPHI Working Paper 43).
5. Arias, M., Camacho, A., Ibañez, A., Mejía, D., & Rodriguez, C. (2014) (Comp). Costos económicos y sociales del conflicto en Colombia: ¿cómo construir un postconflicto sostenible? Bogotá: Universidad de los Andes, Facultad de Economía.
6. Beltran, I., & Salcedo, E. (2006). ¿Por qué no hay una relación entre crimen y distribución del ingreso en Colombia? Una explicación para el período 1976-1997 a partir de la evolución de la actividad criminal. In A. Martinez (Ed.) Violencia y crimen ensayos en memoria de Fernando Gaitán Daza. Bogotá: Universidad Externado de Colombia.

Osmar Leandro Loaiza Quintero et al. 41
desarro. soc. no. 80, bogotá, primer semestre 2018, pp. 11-51, issn 0120-3584, e-issn 1900-7760, doi: 10.29263/dYs.80.1
7. Boltvinik, J. (1999). Métodos de medición de la pobreza. Conceptos y tipología. Socialis: Revista Latinoamericana de Política Social. Univer-sidad de Buenos Aires, Universidad Nacional de Rosario, FLACSO, 1, 35-74.
8. Bonilla, L. (2009). Revisión de la literatura económica reciente sobre las causas de la violencia homicida en Colombia (Serie Documentos de Trabajo sobre Economía Regional 114). Cartagena: Banco de la República.
9. Bottia, M. (2003). La presencia y expansión municipal de las FARC: es avaricia y contagio, más que ausencia estatal (Documento CEDE 2003-03). Bogotá.
10. Collier, P., & Hoeffler, A. (2004). Greed and grievance in civil war. Oxford Economic Papers, 56(4), 563-595.
11. Cramer, C. (2006). Civil war is not a stupid thing. London: Hurst.
12. Cubides, F., Olaya, A.C., & Ortiz, C.M. (1998). La violencia y el munic-ipio Colombiano 1980-1997. Bogotá: Facultad de Ciencias Humanas, Universidad Nacional de Colombia.
13. Dal Bó, e., & Dal Bó, p. (2011). Workers, warriors and criminals: Social conflict in general equilibrium. Journal of the European Economic Asso-ciation, 9, 646-677.
14. Díaz, A. M., & Sanchez, F. (2004). Geografía de los cultivos ilícitos y conflictos armado en Colombia (Documento CEDE, 2004-18). Universidad de los Andes. Facultad de Economía.
15. Dube, O. & Naidu, S. (2010). Bases, bullets and ballots: The effect of U.S. military aid on political conflict in Colombia (Working Paper 197). Center for Global Development.
16. Dube, O., & Vargas, J. F. (2013). Commodity price shocks and civil conflict: Evidence from Colombia. Review of Economic Studies, 80, 1384-1421.
An exploratory assessment of the relationship between multidimensional42
desarro. soc. no. 80, bogotá, primer semestre 2018, pp. 11-51, issn 0120-3584, e-issn 1900-7760, doi: 10.29263/dYs.80.1
17. Echandía, C. (1999). El conflicto armado y las manifestaciones de violencia en las regiones de Colombia. Bogotá: Presidencia de la Repú-blica, Oficina del Alto Comisionado para la Paz.
18. FARC contra ELN. (2007, February 2). Revista Semana.
19. Fearon, J. D., & Laitin, D. D. (2003). Ethnicity, insurgency, and civil war. American Political Science Review, 97(01), 75-90.
20. Feres, J., & Mancero, X. (2001). El método de necesidades básicas insat-isfechas (NBI) y sus aplicaciones en América Latina. Santiago de Chile: ECLAC.
21. Fernández, M., Ibáñez, A., & Peña, X. (2011). Adjusting the labor supply to mitigate violent shocks: Evidence from Rural Colombia (World Bank Working Paper Series 5684).
22. Gaitán, D. F., & Deas, M. (1995). Dos ensayos especulativos sobre la violencia en Colombia. Bogotá: Tercer Mundo.
23. Galindo, H., Restrepo, J., & Sánchez, F. (2009). Conflicto y pobreza en Colombia: un enfoque institucionalista. In J. A., Restrepo, & Aponte, D. (Eds.), Guerra y violencias en Colombia: herramientas e interpretaciones (pp. 315-351). Bogotá: Editorial Pontificia Universidad Javeriana.
24. Ganepola, V., & Thalayasingam, P. (2004). Poverty and conflict: A review of literature (Centre for Poverty Analysis Working Paper Series 1). National Library of Sri Lanka. Retrieved from http://www.cepa.lk/uploads/a8a885d9ebac670a8e1e5a44677292c1-Poverty---Conflict---01.pdf
25. GMH (2013). ¡Basta ya! Colombia: memorias de guerra y dignidad. Bogotá: Imprenta Nacional.
26. Gómez, C; Sánchez-Ayala L., &and Vargas, G. A. (2015). Armed conflict, land grabs and primitive accumulation in Colombia: Micro processes, macro trends and the puzzles in between. Journal of Peasant Studies, 42(2), 255-274.
Osmar Leandro Loaiza Quintero et al. 43
desarro. soc. no. 80, bogotá, primer semestre 2018, pp. 11-51, issn 0120-3584, e-issn 1900-7760, doi: 10.29263/dYs.80.1
27. Gómez, C. M. (2001). Economía y violencia en Colombia. In A. Martinez (Ed.), Economía, crimen y conflicto (pp. 41-58). Bogotá: Universidad Nacional de Colombia.
28. Gonzalez, C., & S. Kalmanovitz. (2010). Unidades agrícolas familiares, tenencia y abandono forzado de tierras en Colombia. Bogota: Acción Social.
29. Goodhand, J. (2001). Violent conflict, poverty and chronic poverty (Working Paper 6). Chronic Poverty Research Centre.
30. Gutiérrez, F., & Sánchez, G. (2006). Prólogo, Nuestra guerra sin nombre. Instituto de Estudios Políticos y Relaciones Internacionales (Iepri). Nuestra guerra sin nombre. Transformaciones del conflicto en Colombia. Bogotá: Norma.
31. Justino, P. (2011). Conflict traps: How does poverty cause war, and how does war cause poverty? MICROCON. Retrieved from http://www.ids.ac.uk/news/conflict-traps-how-does-poverty-cause-war-and-how-does-war-cause-poverty - http://www.ids.ac.uk/news/conflict-traps-how-does-poverty-cause-war-and-how-does-war-cause-poverty
32. Justino, P., Brück, T., & Verwimp, P. (2013). Micro-level dynamics of conflict, violence, and development: A new analytical framework (HiCN Working Paper 138). 3 Retrieved from http://www.ids.ac.uk/publication/micro-level-dynamics-of-conflict-violence-and-development-a-new-analytical-framework - HiCN Working Paper 138. Retrieved from http://www.ids.ac.uk/publication/micro-level-dynamics-of-conflict-violence-an
33. Loaiza, Q. O., & Moncada, J. (2013). Un estudio sobre las disparidades regionales en Colombia a través del análisis exploratorio y confirmatorio de datos espaciales, 1985-2010 (MPRA Paper 47735). Munich: University Library of Munich.
34. Macías, J. L. (2013, March 2). Urabá, la tierra de las disputas eternas. Diario El Colombiano.
An exploratory assessment of the relationship between multidimensional44
desarro. soc. no. 80, bogotá, primer semestre 2018, pp. 11-51, issn 0120-3584, e-issn 1900-7760, doi: 10.29263/dYs.80.1
35. Muñetón, G., & Maya, M. (2016). Sobre la relación entre el conflicto armado y la pobreza. Apuntes teóricos en Colombia y expresiones espa-ciales en Antioquia. Unpublished Draft.
36. Muñetón, G., & Vanegas, G. (2014). Análisis espacial de la pobreza en Antioquia, Colombia. Equidad & Desarrollo, 21. Bogotá: Universidad de la Salle.
37. Navarrete, S. (2014, July 10). Tan cerca y tan lejos: diferencias entre las FARC y el ELN. Diario El Espectador.
38. Nussbaum, M. (2011). Creating capabilities: The human development approach. Harvard University Press: Cambridge, Massachusets, and London, England.
39. Nussbaum, M., & Sen, A. K. (eds). (1993). The quality of life. Oxford: Clarendon Press.
40. Pérez, G. J. (2005). La dimensión espacial de la pobreza. Ensayos sobre política económica, 48, 234-293.
41. Pizarro, L., & Gómez, E. (2004). Una democracia asediada: balance y perspectiva del conflicto armado en Colombia. Bogotá: Norma.
42. Ramírez, S. (2006). Actores europeos ante el conflicto colombiano. Insti-tuto de Estudios Políticos y Relaciones Internacionales (Iepri). Nuestra guerra sin nombre. Transformaciones del conflicto en Colombia. Bogotá: Norma.
43. Restrepo, V. (2017, January 17). Ejército capturó a cinco guerrilleros del ELN en Antioquia. Diario El Colombiano.
44. Rubio, M. (1999). Crimen e impunidad: precisiones sobre la violencia. Bogotá: TM Editores – CEDE.
45. Rubio, M. (2002). Conflicto y finanzas públicas municipales. Documento CEDE, No. 2002-17. Bogotá: CEDE – Universidad de los Andes.
Osmar Leandro Loaiza Quintero et al. 45
desarro. soc. no. 80, bogotá, primer semestre 2018, pp. 11-51, issn 0120-3584, e-issn 1900-7760, doi: 10.29263/dYs.80.1
46. Salazar, J. (2005). La financiación de las FARC: un resultado de su estra-tegia guerrillera, Tesis de maestría para optar al título de Magíster en Economía, Facultad de Economía. Bogotá: Universidad de los Andes.
47. Sánchez, F. (2007). Las cuentas de la violencia. Bogotá: Universidad de los Andes.
48. Sánchez, F. & Chacón, M. (2005). Conflicto, estado y descentralización: del progreso social a la disputa armada por el control local 1974-2002 (Documentos CEDE 2005-33). Bogotá: CEDE - Universidad de los Andes.
49. Sánchez, F. Solimano, A., & Formisano, M. (2005). Conflict, violence and crime in Colombia. In P. Collier & N. Sambanis (Eds.), Understanding civil war: Evidence and analysis (vol. II.). Washington D. C: The World Bank.
50. Sanchez, F., & Nunez, J. (2001). Determinantes del crimen violento en un país altamente violento: el caso de Colombia. Coyuntura Económica, 31(1), 91-116. Retrieved from: http://www.repository.fedesarrollo.org.co/handle/11445/2098.
51. Sen, A. (1988). The concept of development. In Edited by H. Chenery and& T. N. Srinivasan (Ed.s.), Handbook of Development Economics (vol. I).
52. Sen, A. (1992). Inequality re-examined. Oxford: Clarendon Press.
53. Sen, A. (1999). Development as freedom. New York: Knopf, Oxford University Press.
54. Sen, A. (2009). La idea de la justicia. Bogotá: Taurus.
55. UNDP (2014). Human development repor. Sustaining human progress: Reducing vulnerabilities and building resilience. New York.
56. Valencia, G. (2006). La economía frente al conflicto armado interno colombiano, 1990-2006. In Perfil de Coyuntura Económica, 141-174.
57. Valenzuela, P. (2002). Reflexiones sobre interpretaciones recientes de la violencia en Colombia. Convergencia., 30(9), 125-146.
An exploratory assessment of the relationship between multidimensional46
desarro. soc. no. 80, bogotá, primer semestre 2018, pp. 11-51, issn 0120-3584, e-issn 1900-7760, doi: 10.29263/dYs.80.1
58. Vélez, M. A. (2001). FARC-ELN: evolución y expansión territorial. Desa-rrollo & Sociedad, 47, 151-225.
59. World Bank. (2011). World development report: Conflict, security, and development. Washington D. C.: The World Bank.
60. Yaffe, L. (2011). Conflicto armado en Colombia: análisis de las causas económicas, sociales e institucionales de la oposición violenta. CS, 8, 187-208.

Osmar Leandro Loaiza Quintero et al. 47
desarro. soc. no. 80, bogotá, primer semestre 2018, pp. 11-51, issn 0120-3584, e-issn 1900-7760, doi: 10.29263/dYs.80.1
Appendix
A1. The Administrative Subdivisions of Antioquia
Source: Instituto Agustín Codazzi.
A2. Methodological Appendix: The MPI further explained
Let d be the number of dimensions selected to compute a direct poverty mea-sure, and let k be the poverty cutoff. In the union approach k=1 and in the intersection approach k=d. However, the MPI allows k to be such that 1<k<d. Thus, Alkire and Foster’s (2011) identification method of lies half-way between the union and intersection approaches.
Moreover, the MPI can be broken down into population groups and dimen-sions. In the first case, it makes it possible to see which population groups are hardest hit by poverty. In the second case, it allows the contribution made by each dimension to poverty to be determined. This second property is of the utmost usefulness from a policymaking perspective, as it makes it possible to determine the dimensions that make the most significant contribution to overall poverty, thus providing valuable information for policy prioritization.

An exploratory assessment of the relationship between multidimensional48
desarro. soc. no. 80, bogotá, primer semestre 2018, pp. 11-51, issn 0120-3584, e-issn 1900-7760, doi: 10.29263/dYs.80.1
Figure A2. Official Municipal Subdivision of Antioquia, according Departamento Administrativo de Planeación at Gobernación de Antioquia.

Osmar Leandro Loaiza Quintero et al. 49
desarro. soc. no. 80, bogotá, primer semestre 2018, pp. 11-51, issn 0120-3584, e-issn 1900-7760, doi: 10.29263/dYs.80.1
However, this feature is not stressed in this paper, whose purpose is to exam-ine the relationship between poverty and armed conflict in Antioquia.
It should be noted that the implementation of the MPI requires some criti-cal decisions to be taken regarding the parameters used: 1) defining the set of dimensions to be used for the index; 2) choosing a set of variables or indi-cators that reflect each dimension adequately; 3) setting and applying the deprivation cutoffs for each indicator; 4) selecting the weights to be assigned to each indicator; and 5) establishing the poverty cutoff (Alkire and Santos, 2013). The deprivation and poverty cutoffs are defined, respectively, as “the level of achievement (normatively) considered sufficient in order to be non-deprived in each indicator [...] and the proportion of weighted deprivations a person needs to experience in order to be considered multidimensionally poor” (Alkire and Santos, 2013, p. 8).
One methodological difficulty arises from the fact that it is impossible to assess every individual using the same lens, since different people may value a completely different set of things. In other words, everybody pursues their own functionings. Thus, Sen (1988, 2000) recognises that the practical imple-mentation of the Capability Approach requires some deprivations to be priori-tised, according to a set of common values shared by each society and chosen as a result of public scrutiny, in order to determine the kind of needs that each society considers must be met. This is always, of course, an issue that is important in the implementation of the MPI. Clearly, the selection of dimen-sions and cutoffs can be guided by the common values shared by a society, as embodied in its Constitution and its laws, or derived from policy consider-ations and priorities. However, the selection of dimensions is also frequently heavily restricted by data constraints (see Alkire and Santos, 2013). Moreover, alternative sets of weights can be given to the selected dimensions “to indi-cate the relative importance of the different deprivations” (Alkire and Foster, 2011b, p. 6). The associated selection decisions may reflect a sense of hierar-chy or the priority afforded a particular set of dimensions (or functionings).
However, as stated in the methodological section of the paper we follow the lead of the 2014 UNDP Human Development Report. Thus, we consider three poverty dimensions, each one receiving the same weights and which are com-puted using a set of nine indicator variables, whose deprivations cutoffs are defined as follows:

An exploratory assessment of the relationship between multidimensional50
desarro. soc. no. 80, bogotá, primer semestre 2018, pp. 11-51, issn 0120-3584, e-issn 1900-7760, doi: 10.29263/dYs.80.1
Dimension Indicator Cutoff (deprivation criteria)
Living Standards
Electricity the household has no access to electricity.
Piped water the household has no access to fresh piped water.*
Sanitation the household has no access to a non-shared sanitation facility connected to a sewage system or a cesspit.
Assets the household does not own at least two of the following assets: refrigerator, TV, radio, computer or scooter.
Housing materials the household resides in a home built with inadequate materials, e.g. using floor or wall materials such as earth, sand, dung, or fabric.
Health
Health insurance one or more members of the household lacks health insurance.
Permanent disability one or more members of the household has some permanent disability.
Education
School attainment no adult (>18 years old) household member has completed their primary education cycle.
School attendance at least one school-age child (between 6 and 12 years old) does not attend school.
* The information collected by SISBEN does not allow determining if the household has access to water ready for human consumption.
A3. Alternative measures of rank correlations
Table A1. Kendall Rank correlations between MPI measures
Kendall M0_1 M0_2 M0_3 M0_4 M0_5 M0_6 M0_7 M0_8 M0_9
M0_1 1.000
M0_2 0.999 1.000
M0_3 0.986 0.983 1.000
M0_4 0.967 0.965 0.986 1.000
M0_5 0.927 0.925 0.961 0.975 1.000
M0_6 0.874 0.872 0.911 0.936 0.950 1.000
M0_7 0.650 0.658 0.653 0.687 0.699 0.749 1.000
M0_8 0.632 0.634 0.634 0.626 0.678 0.688 0.638 1.000
M0_9 0.123 0.123 0.157 0.225 0.231 0.276 0.481 0.368 1.000

Osmar Leandro Loaiza Quintero et al. 51
desarro. soc. no. 80, bogotá, primer semestre 2018, pp. 11-51, issn 0120-3584, e-issn 1900-7760, doi: 10.29263/dYs.80.1
Table A2. Spearman Rank correlation coefficients between MPI measures
Spearman M0_1 M0_2 M0_3 M0_4 M0_5 M0_6 M0_7 M0_8 M0_9
M0_1 1.000
M0_2 0.998 1.000
M0_3 0.988 0.986 1.000
M0_4 0.976 0.976 0.987 1.000
M0_5 0.964 0.966 0.982 0.989 1.000
M0_6 0.946 0.945 0.964 0.975 0.982 1.000
M0_7 0.843 0.848 0.846 0.875 0.882 0.914 1.000
M0_8 0.829 0.833 0.829 0.821 0.861 0.875 0.841 1.000
M0_9 0.192 0.195 0.239 0.323 0.344 0.410 0.670 0.480 1.000