Embed Size (px)
Citation preview

Analysis of Financial Performance of Banqsoft
Erik Hesselroth
Bachelor’s Thesis
Degree Programme in Interna-
tional Business
2014

Abstract 3.11.2014 Degree programme in International Business
Author or authors Erik Hesselroth
Group or year of entry 2011
Title of report Analysis of Financial Performance of Banqsoft
Number of report pages and attachment pages 60 + 0
Teacher(s) or supervisor(s) Jaana Melamies, Anne Arkimaa
The aim of this paper is to give a financial analysis of Banqsoft AS. This is mainly done
by calculating key performance indicators for the company between 2010 and 2013,
and by benchmarking these ratios to those of other companies from the software
industry (in which Banqsoft operates). Further on, the paper looks at the cost structure
of the company in order to give an idea of how much capital is required to finance the
operations after the biggest shareholder will be withdrawing from the company.
The calculations are illustrated both numerically and graphically, with a written analysis
of each ratio. The different ratios and their analyses are connected to draw a bigger
picture, based on key findings and recommendations are made.
The most important key finding is that the company seems to be running well, both
compared to itself (trend analysis) and compared to other companies from the same
industry. The company is amongst the most profitable companies of those observed in
this paper. The company is also well able to manage short-term debt, and the
company’s cash flow is positive. On the flipside, the company does seem to be quite
highly leveraged, largely due to a low amount of equity, and ratios that illustrate this are
likely to worsen when their biggest shareholder withdraws from the company.
Keywords Financial performance, key performance indicators, benchmarking, working capital, financial statements, profitability

Table of contents
1 Introduction .......................................................................................................................... 3
1.1 Background of the thesis topic .................................................................................. 3
1.2 Project objectives, scope and methods .................................................................... 4
1.3 Case company introduction ....................................................................................... 5
1.4 Key concepts ................................................................................................................ 6
2 Financial analysis – theory and calculations ..................................................................... 8
2.1 Volume of Business .................................................................................................... 8
2.1.1 Turnover ........................................................................................................... 8
2.1.2 Number of employees .................................................................................... 9
2.1.3 Balance sheet total ......................................................................................... 10
2.2 Profitability ................................................................................................................. 10
2.2.1 Gross profit .................................................................................................... 11
2.2.2 Operating profit & operating loss ............................................................... 12
2.2.3 Operating margin........................................................................................... 14
2.2.4 Net profit ........................................................................................................ 15
2.2.5 Return on investment ................................................................................... 16
2.2.6 Return on assets ............................................................................................. 18
2.2.7 Return on owners’ equity ............................................................................. 20
2.2.8 Human capital value added (HCVA) .......................................................... 21
2.3 Liquidity ...................................................................................................................... 22
2.3.1 Quick ratio ...................................................................................................... 23
2.3.2 Working capital ratio ..................................................................................... 25
2.4 Solvency, gearing and leverage ................................................................................ 26
2.4.1 Solvency rate .................................................................................................. 27
2.4.2 Leverage on sales ........................................................................................... 28
2.4.3 Gearing ratio .................................................................................................. 29
2.4.4 Debt-to-equity ratio ...................................................................................... 31
2.4.5 Shareholders’ equity ratio ............................................................................. 32
2.4.6 Debt-to-assets ratio ....................................................................................... 33
2.4.7 Debt-to-EBITDA ratio ................................................................................ 35

3 Benchmarking ..................................................................................................................... 37
3.1 Profitability ................................................................................................................. 37
3.1.1 Gross Profit .................................................................................................... 38
3.1.2 Operating profit/loss (EBIT) ...................................................................... 39
3.1.3 Operating margin (EBITDA) ...................................................................... 40
3.1.4 Net Profit ........................................................................................................ 41
3.1.5 Return on investment (ROI) ........................................................................ 42
3.1.6 Return on total assets (ROTA) .................................................................... 43
3.1.7 Return on owners’ equity ............................................................................. 44
3.2 Current assets and liabilities ..................................................................................... 44
3.2.1 Quick ratio (acid test) .................................................................................... 45
3.2.2 Working capital ratio ..................................................................................... 46
3.3 Solvency, gearing and leverage ratios...................................................................... 47
3.3.1 Solvency rate .................................................................................................. 47
3.3.2 Leverage on sales ........................................................................................... 48
3.3.3 Gearing ratio .................................................................................................. 49
3.3.4 Debt-to-equity ratio ...................................................................................... 50
3.3.5 Shareholders’ equity ratio ............................................................................. 51
3.3.6 Debt-to-assets ratio ....................................................................................... 52
3.3.7 Debt-to-EBITDA ratio ................................................................................ 53
4 Capital required to continue operations .......................................................................... 55
5 Discussion ........................................................................................................................... 57
5.1 Key findings ............................................................................................................... 57
5.2 Recommendations for the commissioning party .................................................. 59
5.3 Limitations of the research ...................................................................................... 59
5.4 Learning outcome for the author ............................................................................ 60
References ................................................................................................................................ 61

3
1 Introduction
The aim of this report is to calculate and analyse key ratios for a case company, Ban-
qsoft AS, with a secondary aim of evaluating the working capital required for the com-
pany to operate. The report follows a zipper structure, in which theory and practise are
combined. The author feels that such a structure is the most suitable for the topic on
hand, as this allows the reader to have the theory easily available when looking at the
practical calculations, rather than having to browse back and forth through the report.
Chapter 1 is an introduction to the report, in which the background and the objectives
of the report will be explained, and the case company will be introduced.
Chapter 2 is dedicated to key performance indicators, and combines theory and prac-
tise, in that it includes explanations for each ratio, followed by calculations for these
ratios, and finally comments on the figures obtained from the calculations. The main
outcome in this chapter is a trend analysis of Banqsoft’s key ratios throughout the
timeframe.
Chapter 3 is dedicated to benchmarking. In this chapter Banqsoft’s key ratios are illus-
trated together with those of other software companies. Comments will focus on how
Banqsoft is doing compared to these companies and how the general trend looks for
Banqsoft compared to those of the other companies.
Chapter 4 is dedicated to the how much working capital is required for the case com-
pany to continue operations.
Chapter 5 focuses on the results from chapter 2 and 3. In this chapter the author will
reflect on the results, how much emphasis should be put on the results, and give sug-
gestions for further action for the case company.
Finally the report includes a reference section in which all the sources used in the re-
port are listed in alphabetical order.
1.1 Background of the thesis topic
Analysing how a company is performing financially is something that is important for a
company. Most companies are required to file their financial results annually (e.g. in-
come statement and balance sheet), however calculating key point indicators (KPIs), is

4
something which is up to the management to decide; it is not required to calculate or
file, and is used internally. Most companies will calculate certain key point indicators, as
these indicators give the management further information than the numbers from the
income statement and balance sheet do. There are many different kinds of key point
indicators, and this report aims to explain, calculate and analyse certain key point indi-
cators for Banqsoft AS, a Norwegian software company (an introduction of the com-
pany can be found in subchapter 1.2).
There are numerous ways to analyse the performance of a company, let alone its finan-
cial performances. By analysing its financial performance, a company can see, in clear
numbers, how well it is doing in various aspects, which might make it easier to see be-
yond the numbers of the income statement and balance sheet. Key point indicators
often have certain levels, or standards, that a company can look at, which tell how well
it is performing, many standards of which depend on the industry a company works in.
Furthermore, many ratios are presented as percentages, which means that they can be
used for comparing own performances with the results of other companies, regardless
of the size of the companies, in addition to making it easy to compare to own results
from previous years.
In addition to analysing key ratios, this report also aims to look at capital required to
operate. Banqsoft’s biggest shareholder, a company which currently owns 35 % of
Banqsoft, is planning on withdrawing from Banqsoft in the summer of 2015. Due to
this situation, in which the biggest shareholder of the company is leaving, capital will
also be withdrawn from the company, and it is due to this that Banqsoft is interested in
knowing how much capital is required from them in order to maintain their operations
as they are.
1.2 Project objectives, scope and methods
Based on the objectives stated in subchapter 1.1, the main objective of this report can
be summarised in a concise research question, as stated below:
How is Banqsoft performing financially?
5
In order to answer the abovementioned research question, the following investigative
questions will be answered in this report, which when put together will form a whole,
answering the research question:
1. How has the company’s financial performances developed in recent years?
2. How is the company performing compared to other companies in the software
sector?
3. Where is the company performing well, and are there areas in which the company
could improve?
4. How much working capital is required in order to continue daily operations?
This report will focus solely on these questions. Further on, the scope of the report has
been demarcated so that the key performance indicators covered in the report are cho-
sen by the author (as opposed to calculating all key performance indicators), the com-
panies used for benchmarking have been chosen by the author, and there is a set time-
frame, as the report will focus on the years 2010-2013.
As the main focus of the report is on calculations, having the data necessary for doing
these calculations is important. Due to this, there is one kind of resource in particular
that is vital for accomplishing the report objectives; namely, annual reports. In these
reports the financial statements, in particular the statement of financial position (bal-
ance sheet) and the statement of comprehensive income (income statement), include
the numbers required for doing the calculations. What this means is that all the figures
illustrated in this report have been calculated by using figures from annual statements,
both for Banqsoft and for the other companies. The annual reports can typically be
obtained directly from a company’s website.
1.3 Case company introduction
Banqsoft AS is a software company which was founded in 1994 in Norway. Based in
Oslo, in which the company’s headquarters are located, the company has also got sub-
sidiaries in Sweden, Finland and Poland, all countries with different currencies. In addi-

6
tion to the group’s presence in the aforementioned markets, it also have clients in
Denmark and in the Baltic countries. (Banqsoft 2014)
Banqsoft’s core business is the development and selling of software solutions for effec-
tive management of deposit and credit portfolios, with an aim of combining cost effi-
cient portfolio handling with automated handling of the sales and credit process. The
company’s products are highly specialised, and the company does not have any direct
competitors. In terms of competition, their biggest threat comes from their customers
themselves, as the financial institutions could potentially decide to develop their own
software, rather than buying it from Banqsoft. (Banqsoft 2014)
Banqsoft’s clients are primarily from the finance sector (banks, insurance companies,
and other financial institutions) and the automobile sector. Their client list includes
some of the biggest banks and insurance companies in the Nordic countries. The
group as a whole (all countries included) had 126 employees at the end of 2013. (Ban-
qsoft 2014)
1.4 Key concepts
In this subchapter some key concepts are explained. These concepts are meant to
cover the main points of the report, whereas more specific terms will be explained as
they become relevant throughout chapter 2.
Financial performance refers to how well a company is performing financially, which
can be measured in a range of different ways, some of which will be utilised in this re-
port. (Investopedia 2014b.)
Key performance indicators (KPI) are indicators that illustrate how well a company,
an industry, an economy etc. is doing. There are many different key performance indi-
cators, all of which have their own separate purpose, e.g. different ways of measuring
profitability or liabilities, which looks beyond the simple monetary figures given in a
financial statement. Because there are so many different key point indicators used for

7
different purposes, a company, an investor, etc. might be interested in certain indica-
tors. (Cambridge University Press 2011, 473; Investopedia 2014e.)
Profitability, to put it simply, refers to the state when a company is making a profit,
that is, the company’s income exceeds their costs. Most companies (notable exceptions
including non-profit organisations and often departments in the public sector) are aim-
ing to make a profit, and as such figures illustrating profitability will always be interest-
ing, both from a company’s point of view, and from an investor’s. (Cambridge Univer-
sity Press 2011, 664.)
Working capital refers to the money needed in order to operate a business. (Cam-
bridge University Press 2011, 930.)

8
2 Financial analysis – theory and calculations
This chapter combines theory with practise. Each key performance indicator has its
own subchapter, each following the same structure: First a theoretical explanation of
the ratio (i.e. what does the ratio mean, for what purpose is it used), the formula used
to calculate the ratio, then the actual figures are shown, both in a table, and as a chart.
Finally the figures are analysed, through a trend analysis, before the report moves on to
the next key figure (i.e. in the following subchapter), repeating the same structure. The
key ratios will further on be compared to other software companies in chapter 3.
The calculations are based on the income statements and balance sheets from the an-
nual reports, covering the years 2010-2013. Furthermore, as the indicators are used for
different purposes, they will be divided into separate subchapters. All calculations have
been done using figures for the entire group, not parent company (i.e. the ratios will be
illustrating the entire Banqsoft group, not just the Norwegian parent company).
2.1 Volume of Business
This chapter serves as an introduction of the company, and includes some simple fig-
ures from the company’s annual report. These are among the basic and essential fig-
ures, which should not need a long explanation, but it will be useful to compare them
from year to year.
2.1.1 Turnover
A basic concept in business, turnover is another word for revenue or net sales, i.e. it
shows how much money a company has earned through their operations. Turnover is
essential for any business, and as such it is often mentioned already near the beginning
of a company’s annual statement, before the actual income statement and balance
sheet. (Cambridge University Press 2011, 885.)
The turnover can be found in the income statement in the annual report. Table 1 be-
low shows the net turnover for Banqsoft during the relevant time period.

9
Table 1: Net turnover
Net Turnover
Year 2013 2012 2011 2010
Turnover 150 025 127 667 117 879 106 555
Difference 17.5 % 8.3 % 10.6 %
The company’s turnover shows a positive trend, having increased steadily from year to
year. Increased income is good news for any company, however; turnover alone does
not give a full picture of the overall result for the company, as expenses are likely to
have risen during this time period as well.
2.1.2 Number of employees
An employee is a person who receives payment for working for someone. For the pur-
pose of this section of the report is a rather straight-forward measurement, it simply
deals with the total amount of employees in the Banqsoft group. (Cambridge Univer-
sity Press 2011, 281.)
Table 2 shows the total number of employees of Banqsoft during the relevant time period. Table 2: Total number of employees
Total Number of Employees
Year 2013 2012 2011 2010
Employees 126 112 107 112
There can be many reasons for why the number of employees change. Restructuring of
the company, selling subsidiaries, bad times for the company, or a wish to cut costs, are
all examples of reasons for decreasing the number of employees. Likewise restructur-
ing of a company could potentially also lead to an increase in the amount of employ-
ees, as could good times for the company, or an expansion of the company, either by
expanding the company itself, entering new markets, or through acquisitions of com-
panies. Just to mention a few potential reasons for changes in the amount of employ-
ees.

10
In the case of Banqsoft, it can be seen that, despite a small reduction of employees in
2011, the company employed more employees at the end of 2013 than in any other
year during this time period.
2.1.3 Balance sheet total
One of the required components of the annual financial report of a company, the bal-
ance sheet lists all of the company’s assets, liabilities and shareholders’ equity. The bal-
ance sheet gets its name from that these three parts must be in balance (total assets
must equal total liabilities plus shareholders’ equity: assets = liabilities + shareholders’
equity), i.e. the figure showing total assets is the same as the figure showing the liabili-
ties and shareholders’ equity. The reason for this is simple; assets are something the
company own, and in order to pay for assets, the company can either borrow money
(liability), or get it from shareholders (shareholders’ equity). This is why, when a com-
pany buys new assets, the liability and shareholders’ equity side in the balance sheet will
increase by the same amount as the asset side. (Investopedia 2014a.)
Table 3 shows the balance sheet total for Banqsoft during the relevant time period. Table 3: Balance sheet total
Balance Sheet Total
Year 2013 2012 2011 2010
Balance sheet total 80 411 72 647 59 015 56 804
The figures show an increase in the balance sheet total from year to year. Usually the
reason for this is that a company acquires new assets, e.g. stock, property, equipment,
cash or accounts receivable. In the balance sheet, these three categories are divided into
multiple sub-parts, and it is from these that the reason(s) for the change in the balance
sheet total can be seen.
2.2 Profitability
This subchapter focuses on key performance indicators that represent profitability,
with a focus on different profit figures, that are illustrated both as monetary sums, and

11
as percentages, and on figures illustrating different forms of returns, expressed solely as
percentages. Percentages are good for making comparisons, as they do not take the
size of a company into consideration, which means that the figures from one company
can be compared to those of another company, or to average rates, typically from the
sector in which the company is operating. All ratios in this subchapter are based on the
income statements and balance sheets covering the time period.
2.2.1 Gross profit
The gross profit shows a company’s revenue less all costs of sales. The gross profit can
be calculated as a ratio, in which case the figure will be given as a percentage. It is then
called a gross profit ratio, also known as gross margin ratio. The gross profit margin is
a ratio in which figures vary between different sectors. Software companies typically
have a high gross margin. (Investopedia 2014c.)
Note that the gross profit margin technically should take labour directly attributable to
the production of the products into account. Often, however, it can be difficult to tell
how much of the labour costs are directly attributable to the production, and therefore
labour costs are typically omitted altogether from the calculation of this ratio. This is
the case also in this report.
The gross profit ratio can be calculated by using the following formula: Table 4 shows Banqsoft’s gross profit margin for the relevant time period, while chart 1 illustrates the figures graphically. Table 4: Gross profit margin
Gross Profit Margin
Year 2013 2012 2011 2010
Gross Profit 140 720,00 117 479,00 107 202,00 98 513,00
Gross Margin 94 % 92 % 91 % 92 %
Gross profit X 100
Turnover

12
Chart 1: Gross profit margin
The figures show a positive trend, in that the gross profit margin has increased annu-
ally, after a small drop in 2011. This means that there is more left of the revenue to pay
for other costs that were not costs of sales. As there are always costs that are not costs
of sales, it is important to have a positive gross profit, in order to make a net profit,
and as was mentioned above, these figures do not include labour costs, which is a type
of expenditure that is typically relatively high in the software sector (more on this in
chapter 3, in which Banqsoft’s gross profit margin will be compared to the correspond-
ing figures from other software companies).
2.2.2 Operating profit & operating loss
Operating profit is the profit a company earns from its day-to-day business operations,
such as for example the sale of the products a company manufactures. The operating
profit omits income from sources such as through ownership in other companies, or
interest income, however it does include depreciation and amortisation. The operating
income is commonly known as earnings before interest and taxes (EBIT). Should the
figure be negative, it is called an operating loss, as opposed to an operating profit. (In-
vestopedia 2014i.)
As a general figure, a figure higher than 10 % can be considered good, a figure between
5-10 % satisfactory, while a figure lower than 5 % can be considered insufficient.
The operating profit can be calculated by using the following formula:
92%
91%
92%
94%
89%
90%
91%
92%
93%
94%
95%
2010 2011 2012 2013
Gross Profit
Operating revenue - cost of goods sold - operating expenses - depreciation & amortisation

13
This operating profit can further be calculated as a percentage, using the following
formula:
The earnings before interest and taxes is given in the income statement, and the author
has verified these numbers, before using the abovementioned formula to calculate the
percentage form. Table 5 shows Banqsoft’s operating profit and operating loss
throughout the relevant time period, whereas Chart 2 illustrates the same figures
graphically.
Table 5: Operating profit / operating loss
Operating Profit / Operating Loss (EBIT)
Year 2013 2012 2011 2010
EBIT 22 637 15 138 -6 624 -1 577
Percentage 15.1 % 11.9 % -5.6 % -1.5 %
Chart 2: Operating profit/loss
The figures show an operating loss in 2010 and 2011, and that the operating loss in-
creased in 2011, however, in 2012 it had changed into an operating profit, after having
increased significantly, and the operating profit further increased in 2013. The figures
show what is likely to be the beginning of a positive trend.
-1,5 %
-5,6 %
11,9 %
15,1 %
-10,0 %
-5,0 %
0,0 %
5,0 %
10,0 %
15,0 %
20,0 %
2010 2011 2012 2013
Operating Profit/Loss (EBIT)
Earnings before interest and taxes X 100
Turnover

14
2.2.3 Operating margin
The operating margin shows how much of the revenue a company has made is left,
after the company has paid for variable costs related to the production of the produc-
tion, also known as the cost of goods sold (COGS). In other words, the operating
margin shows how much money is left from the company's operations to pay its inter-
est, taxes and shareholders. (Marr, B. 2012.)
The operating margin is also known as earnings before interest, taxes, depreciation and
amortisation (EBITDA), and can be illustrated both as a monetary sum and as a per-
centage. As a percentage it is often referred to as the gross profit margin. Calculating
the percentage means that different companies can be compared regardless of the size
of the companies. It is important to note, however, that different industries have dif-
ferent norms for the operating margin. For instance it is common to see margins
higher than 80 % in the software industry. (Investopedia 2014h; Marr, B. 2012, 17-19.)
The operating margin percentage can be calculating by using the following formula:
Earnings before interest, taxes, depreciations and amortisation (EBITDA) is com-
monly a key figure that companies calculate, and it can usually be found early on in an
annual report, either on its own, or as part of other key figures shown before the more
detailed financial reporting. This is the case also for Banqsoft, however this report adds
the margin figures to the monetary ones given in the company’s annual report.
Table 6 below shows Banqsoft’s operating margin throughout the relevant time period,
whereas chart 3 illustrates the same figures graphically.
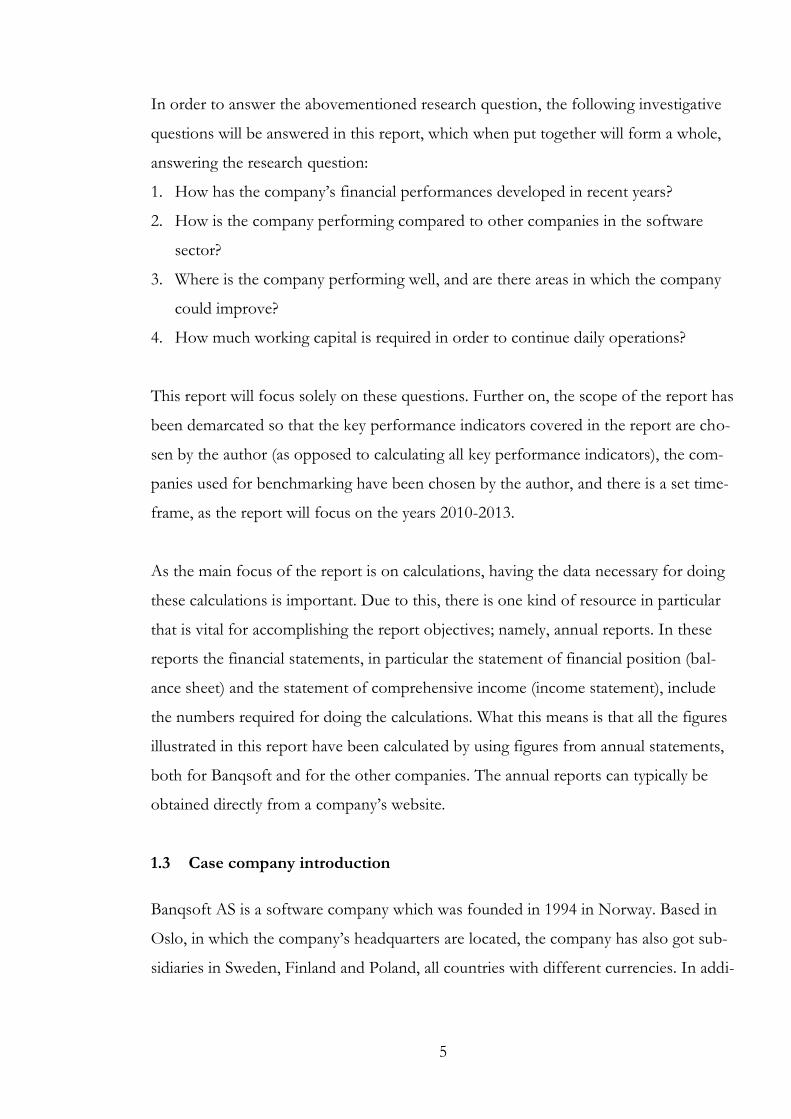
Table 6: Operating margin
Operating Margin, EBITDA
Year 2013 2012 2011 2010
EBITDA 25 083 17 941 -5 219 1 006
Gross profit margin 16.72 % 14.05 % -4.4 % -0.9 %
(Revenue - Cost of goods sold) X 100
Revenues
15
Chart 3: Operating margin
The figures show that a marginally positive operating margin in 2011 had turned nega-
tive in 2011, before increased quite significantly in 2012, and then increasing further in
2013. As there will still be costs to account for after the operating margin, it is impor-
tant to have a bit of a margin in order to have a positive end result (net profit). After
the increased operating margin in 2012, Banqsoft has managed to acquire such a mar-
gin. The trend, in other words, seems positive, although it would be useful to compare
this numbers to the corresponding numbers for the coming few years, to see if the
positive trend continues.
2.2.4 Net profit
The profit a company has made after all expenses have been paid, excluding extraordi-
nary items. Net profit is perhaps the most important measure of performance, as profit
forms the basis for any business. (Marr, B. 2012, 3.)
Net profit is a straightforward measurement. A number which is positive illustrates
that the company has made a profit, whereas a negative number illustrates a loss made
by the company. As such, in the latter case, where a loss has been made, this is called
net loss, as opposed to net profit. The net profit is usually the final result for a com-
pany (the exception being in the case that there would be extraordinary items), and is
found at the bottom of the income statement.
0,9 %
-4,4 %
14,1 %
16,7 %
-10,0 %
-5,0 %
0,0 %
5,0 %
10,0 %
15,0 %
20,0 %
2010 2011 2012 2013
Operating Margin (EBITDA)

16
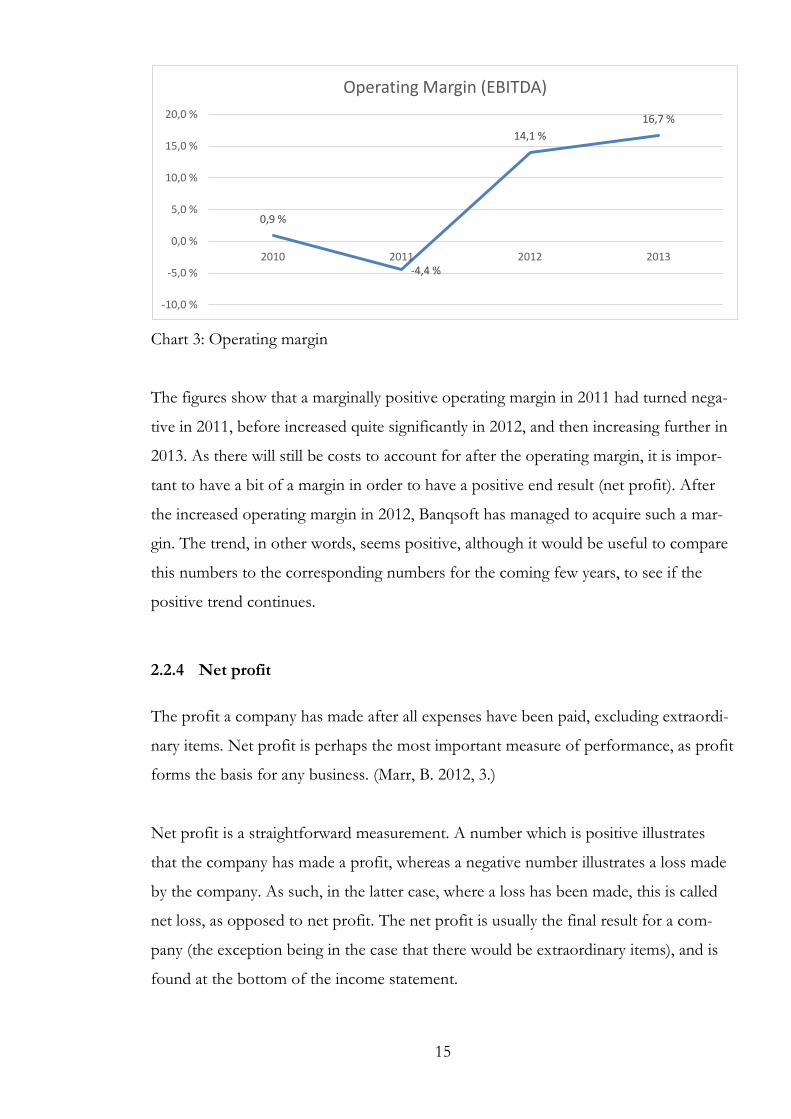
The net profit can be illustrated as percentage by using the following formula: Banqsoft’s net profit throughout the relevant time period is illustrated in table 7 below, and graphically in chart 4. Table 7: Net profit
Net Profit
Year 2013 2012 2011 2010
Net profit 16 961 10 763 -7 270 -616
Net profit margin 11.3 % 8.4 % -6.2 % -0.6 %
Chart 4: Net profit
The figures illustrate that a small net loss increased in 2011, before turning into a
profit, following a significant increase in 2012, after which the net profit increased fur-
ther in 2013. This is a positive change of results, and in line with what the operating
profit and operating margin have shown, and as was the case with the aforementioned
ratios, this suggests the beginning of a positive trend, which will be interesting to fol-
low in the coming years.
2.2.5 Return on investment
Return on investment, commonly known as ROI, illustrates how much return is
earned from investments. The return on investment is given as a percentage, and is a
popular figure for investors and owners, as it shows the profitability of the invest-
ments. (Investopedia 2014l; Marr, B. 2012, 39-41.)
-0,6 %
-6,2 %
8,4 %
11,3 %
-8,0 %
-6,0 %
-4,0 %
-2,0 %
0,0 %
2,0 %
4,0 %
6,0 %
8,0 %
10,0 %
12,0 %
14,0 %
2010 2011 2012 2013
Net Profit
Profit/loss before extraordinary items X 100
Turnover

17
EBIT X 100
Average capital employed (total assets less non-interest-bearing liabilities)
The return on investment should always be positive; otherwise the investment(s) have
been inefficient and resulted in a loss. And positive return on investment figure is a
positive one, however the bigger the better. Generally we could say that 0-9 % is suffi-
cient, 10-14 % percent is good, and 15 % or higher is a very good return on invest-
ment.
An important thing to know about the return on investment, is that there are different
ways of calculating it, and that these different methods can yield significantly different
results. This is especially true due to the fact that the return on investment can be ma-
nipulated, e.g. one common formula for calculating the ROI is the following:
It is a good formula for calculating the return on investment, in its simplicity. How-
ever, how the gains and costs from an investment (or investments) are accounted for,
can lead to different results, and someone could manipulate the numbers in order to
yield a figure that will suit his or his company’s purpose. The return on investment is,
however, still a useful and popular tool. (Investopedia 2014d.)
The author is using the following formula to calculate the return on investment:
Table 8 below illustrate the return on investment for Banqsoft during the relevant time
period, whereas Chart 5 illustrate the same figures graphically.
Table 8: Return on investment
Return on Investment (ROI)
Year 2013 2012 2011 2010
Return on Investment
28.3 % 20.9 % -11.4 % -2.8 %
(Gains - Cost)
Cost

18
Chart 5: Return on investment
The figures show a similar pattern to the profitability ratios above, in that the figure for
2010 was low, the development in 2011 negative, before a significant positive
development in 2012, increased further in 2013. Therefore the trend can be said to be
positive. In accordance to the general rule for the return on investment, as stated
above, it can be said that Banqsoft had a very good return on investment in 2012 and
2013. As is the case with most key ratios, however, standards and norms can vary
between different industries, thus a comparison to other software companies will show
a more comparable picture (see chapter 3).
2.2.6 Return on assets
The return on assets (ROA) shows the relation between the earnings before interest
and taxes (EBIT) and the total assets of the company. What the ratio shows is how
well the company uses its assets in order to gain earnings before expenses such as taxes
and interest will have to be accounted for, i.e. it measures how efficient the company’s
assets are being used. (Investopedia 2014m; Marr, B. 2012, 49.)
The return on assets is calculated as a percentage, the higher the percentage, the more
earnings the company has in proportion to its assets, which means that the company’s
assets is used in an effective manner. Because industries vary a lot in regards to how
asset- or capital intensive they are, the return on assets will vary a lot between different
industries, meaning that it is very useful to benchmark this ratio against other
companies in a company’s own industry. (Marr, B. 2012, 50-51.)
-2,8 %
-11,4 %
20,9 %
28,3 %
-15,0 %
-10,0 %
-5,0 %
0,0 %
5,0 %
10,0 %
15,0 %
20,0 %
25,0 %
30,0 %
35,0 %
2010 2011 2012 2013
Return on Investment (ROI)

19
The return on assets can be calculated using the following formula:
In order to get the average total balance sheet, take the total assets from the beginning
at the year, add the total assets at the end of the year, then divide by two.
Table 9 below show the return on assets for Banqsoft for the relevant time period,
with chart 6 adding a graphical illustration of the figures.
Table 9: Return on assets
Return on Assets (ROA)
Year 2013 2012 2011 2010
Return on assets 29.6 % 23.0 % -11.4 % -2.8 %
Chart 6: Return on assets
The figures show a low number in 2010, which decreased in 2011, before increasing
significantly in 2012 and 2013. This development follows the overall profitability trend,
as the company has gone from a loss, to a profit which has then increased. Using the
numbers listed above the formula as benchmarking, the numbers from 2010 and 2011
seem insufficient, while the figures from 2012 and 2013 look solid. Another useful tool
is to compare the figures to other software companies, which is done in chapter 3.
-2,8 %
-11,4 %
23,0 %
29,6 %
-15,0 %
-10,0 %
-5,0 %
0,0 %
5,0 %
10,0 %
15,0 %
20,0 %
25,0 %
30,0 %
35,0 %
2010 2011 2012 2013
Return on Assets (ROA)
EBIT X 100
Average total balance sheet

20
Net profit
Shareholders' equity at start of year
2.2.7 Return on owners’ equity
The return on owners’ equity (ROE) compares the net profit of a company to its share
capital, and the purpose of the ratio is to illustrate how effectively the company uses its
share capital in order to make a profit. The ratio is commonly used for comparing the
profitability of different companies, and is therefore a popular ratio amongst investors.
The return on owners’ equity is also known as return on net worth (RONW), or simply
as return on equity. (Investopedia 2014k; Marr, B. 2012, 53.)
Although the most useful benchmark will be against other companies from the same
industry, the return on owners’ equity can also be benchmarked against more general
numbers, where figures greater than 20 % can be deemed good, figures between 10-
20% can be deemed satisfactory, while figures below 10 % can be deemed insufficient.
There are different ways in which to calculate the return on owners’ equity. Some
formulas use the shareholders’ equity at the end of the year; some use the average eq-
uity for the year, and some use the equity at the beginning of the year. The latter
method is less susceptible to influence from decisions made during the course of the
year, in which managers can make decisions that would make figures look better for
that particular year, even though they have not actually added more value. (Taub, E.
2001). Hence by using the equity at the start of the year, the figures should be more
reliable, and this is also the method used in this report. The formula can be seen below:
The return on equity for the relevant time period can be seen in table 10, together with
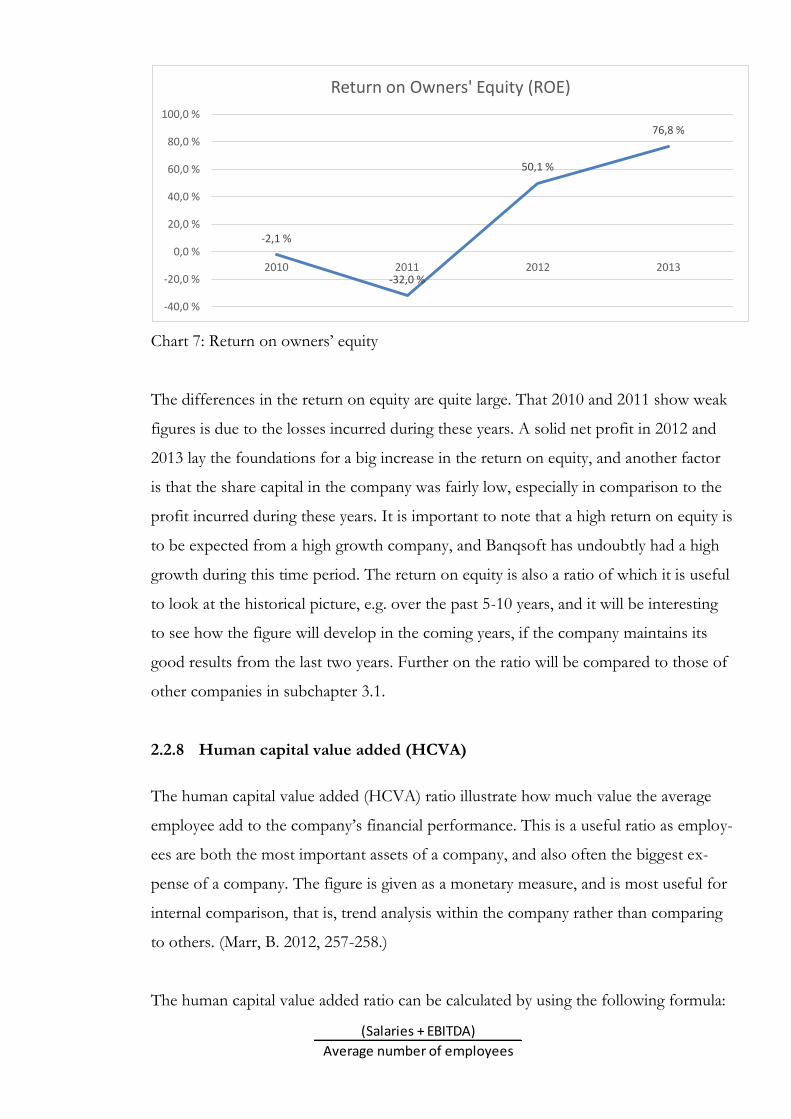
a graphical illustration in chart 7.
Table 10: Return on owners’ equity
Return on Owners’ Equity (ROE)
Year 2013 2012 2011 2010
Return on
equity 76.8 % 50.1 % -32.0 % -2.1 %
21
(Salaries + EBITDA)
Average number of employees
Chart 7: Return on owners’ equity
The differences in the return on equity are quite large. That 2010 and 2011 show weak
figures is due to the losses incurred during these years. A solid net profit in 2012 and
2013 lay the foundations for a big increase in the return on equity, and another factor
is that the share capital in the company was fairly low, especially in comparison to the
profit incurred during these years. It is important to note that a high return on equity is
to be expected from a high growth company, and Banqsoft has undoubtly had a high
growth during this time period. The return on equity is also a ratio of which it is useful
to look at the historical picture, e.g. over the past 5-10 years, and it will be interesting
to see how the figure will develop in the coming years, if the company maintains its
good results from the last two years. Further on the ratio will be compared to those of
other companies in subchapter 3.1.
2.2.8 Human capital value added (HCVA)
The human capital value added (HCVA) ratio illustrate how much value the average
employee add to the company’s financial performance. This is a useful ratio as employ-
ees are both the most important assets of a company, and also often the biggest ex-
pense of a company. The figure is given as a monetary measure, and is most useful for
internal comparison, that is, trend analysis within the company rather than comparing
to others. (Marr, B. 2012, 257-258.)
The human capital value added ratio can be calculated by using the following formula:
-2,1 %
-32,0 %
50,1 %
76,8 %
-40,0 %
-20,0 %
0,0 %
20,0 %
40,0 %
60,0 %
80,0 %
100,0 %
2010 2011 2012 2013
Return on Owners' Equity (ROE)

22
The return on equity for the relevant time period can be seen in table 11 below,
together with a graphical illustration in chart 8.
Table 11: Human capital value added
Human capital value added (HCVA)
Year 2013 2012 2011 2010
HCVA 898 896 686 663
Chart 8: Human capital value added
The figures illustrate a positive trend, in which the human capital value added has
increased annually. In 2012 in particular the figure increased quite significantly. The
ratio remained more or less the same in 2013.
2.3 Liquidity
Liquidity is a term which has three different meanings, two of which are relevant to
this report. One definition is used especially about assets, and means that the assets
easily can be converted into cash. The second definition which is important in this re-
port is the state in which a company is able to meet their short-term obligations. A
company with insufficient liquidity stands in risk of bankruptcy. (Cambridge University
Press 2011, 497; Investopedia 2014f.)
663 686
896 898
0
200
400
600
800
1 000
2010 2011 2012 2013
Human Capital Value Added

23
Having sufficient liquidity is important to any business, as a company which is not able
to pay their obligations stands in the risk of bankruptcy. This subchapter has a focus
on the short-term, that is, up to a year, but not more.
2.3.1 Quick ratio
Also known as an acid test, the quick ratio shows a company's ability to pay of its short-
term obligations by using its current assets. In other words, the quick ratio shows
much much quick assets the company has got, compared to its current liabilities.
(Investopedia 2014j.)
Important to note about the quick ratio is that it is calculated using only quick assets;
assets that can quickly be converted into cash. Such assets typically includes cash,
marketable securities and accounts receivable, while stock (inventory) is left out of the
equation. The reason for this exclusion is that stock typically does not quickly convert
into cash, i.e. stock is typically less liquid. (Investopedia 2014j.)
The higher a company's quick ratio is, the stronger liquidity position the company finds
itself in. Typically a quick ratio of 1.0 or higher can be considered as to be a very good
number, whilst a ratio between 0.5 and 1 can still be deemed satisfactory. A ratio lower
than 0.5, however, can be deemed insufficient, as this illustrates an inability to pay of
current liabilities by using the company's liquid assets. To make the result seem more
quantifiable, the ratio can be thought of in monetary terms, i.e. a ratio of 1.25 means
that a company has 1.25 NOK (or any other given currency) of liquid assets available
per 1.00 NOK of current liabilities.
The quick ratio can be calculated by using the following formula:
By using the aforementioned formula, the quick ratio can be seen in table 12 below,
with a graphical illustration in chart 9.
Current assets - stock
Current liabilities

24
Table 12: Quick ratio
Quick Ratio (Acid Test)
Year 2013 2012 2011 2010
Quick Ratio 1.34 1.29 1.32 1.07
Chart 9: Quick ratio
Using the figures listed above as a means to benchmark, it can be seen that the quick
ratio has been good throughout the entire period, with the highest ratio in 2012. The
most recent figure, from 2013, is however lower than in previous years, which is a
negative development. Looking at the numbers used in the calculation, it is clear that
Banqsoft has a bigger amount of current assets, including stock, however the bigger
difference seems to come from the current liabilities, which have increased quite much.
A more detailed look into the current liabilities reveal that the most significant
increases are in the tax liabilities and dividends to shareholders. This implies that the
reason for the lower quick ratio is simply the increased profitability of the company,
and it is also clear that the ratio would be significantly higher if not for these big
increases in the aforementioned liabilities, and therefore the decreasing ratio should
not be a cause of alarm. As mentioned the ratio is also within the range of what is
considered a good figure.
1,34 1,29 1,32
1,07
0,00
0,20
0,40
0,60
0,80
1,00
1,20
1,40
1,60
2010 2011 2012 2013
Quick Ratio

25
2.3.2 Working capital ratio
The working capital, also known as net working capital, shows the amount of a
company’s current assets less its current liabilities. This means that the working capital
can be used for illustrating a company’s ability to meet its current obligations, and as
such is a useful tool for illustrating the company’s liquidity and efficiency. High
working capital means more capital available, not only for meeting obligations, but also
for expanding or otherwise improving operations. (Marr, B. 2012, 67-69.)
Working capital is calculated as a monetary figure, however it can also be calculated as
a ratio, in which it is illustrated as a percentage, making it possible to compare to other
companies. The ratio is positive when the value is higher than 1, and negative when the
value is lower than 1, and the higher the ratio, the better. On the other hand it is
generally not beneficial to have a very high workig capital ratio either, as this often
means that the company has capital that could have been better invested elsewhere
than in the working capital. To make the result seem more quantifiable, the ratio can
be thought of in monetary terms, i.e. a ratio of 2.3 means that a company has 2.3 NOK
(or any other given currency) of liquid assets available per 1.00 NOK of current
liabilities. The working capital ratio is also known as the current ratio. (Marr, B. 2012,
67-69.)
The working capital ratio can be calculated by using the following formula:
Using the abovementioned formula, Banqsoft’s current ratios can be seen in table 13
below, whereas chart 10 adds a graphical illustration.
Table 13: Working capital ratio
Working capital ratio
Year 2013 2012 2011 2010
Current Ratio 1.34 1.29 1.32 1.07
Current assets
Current liabilities

26
Chart 10: Working capital ratio
The figures show that Banqsoft’s working capital ratio has been positive throughout
the period. It can also be seen that the ratio dropped quite much in 2013. This implies
more current liabilities relative to current assets, which means that the lower ratio is
not a positive change. The ratio is still above 1, however, meaning that the working
capital ratio, and hence the working capital, is positive, which is positive for the
company. The reason that the current ratio is lower in 2013 than in 2012 due to the
increased current liabilities, which, as explained in the paragraph about the quick ratio
(see previous subchapter), is due to the increased profits, and the decrease should
therefore not be seen as particularly alarming. Note that the figures are the same as for
the quick ratio. It is typical with little or not difference in these ratios in the software
industry, due to the relatively small amount of stock. For industries were stock makes
up a larger part of the assets, the difference would be larger.
2.4 Solvency, gearing and leverage
Solvency means that a company is able to meet all of its obligations. This means that in
addition to its short-term obligations (see subchapter 2.3; liquidity), the company is
also able to meet all of its long-term obligations. In a situation where a company is un-
able to meet all of its obligations, the company is insolvent, and is in a state of insol-
vency. Such a company can file for insolvency, or bankruptcy. (Cambridge University
Press 2011, 192, 441.)
1,34 1,29 1,32
1,07
0,00
0,20
0,40
0,60
0,80
1,00
1,20
1,40
1,60
2010 2011 2012 2013
Working Capital Ratio
27
Equity
(Total balance sheet - received prepayments)
This subchapter focuses on ratios which illustrate solvency and the capital structure of
the company. The purpose of the ratios is to illustrate the financial health of the com-
pany, and whether they might stand in risk of insolvency.
2.4.1 Solvency rate
The solvency rate compares a company’s equity to its balance sheet total (less received
prepayments). What this means is that, as the balance sheet total equals equity plus
liabilities, the solvency rate illustrates how much equity the company has got in relation
to its liabilities. Received prepayments are subtracted due to the fact that these are
money that the company will record as income later on, rather than being an obligation
to pay others. For accounting purposes, however, received prepayments are recorded
as liabilities. Due to the fact that the ratio illustrates equity to liabilities, a higher ratio is
preferable to a lower one, as this indicates that the company is financed relatively less
by debt compared to equity, than is the case with a higher value. Generally speaking, a
ratio higher than 40 percent can be deemed good, a ratio from 20-40 can be deemed
satisfactory, while a ratio below 20 can be deemed too low. This ratio however, as most
other ratios, varies between industries, due to differences in the typical capital structure
in different businesses. Because of this, it makes sense to focus on how the other com-
panies in the same industry are doing (see subchapter 3.3). (Investopedia 2014o)
The solvency rate can be calculated by using the following formula:
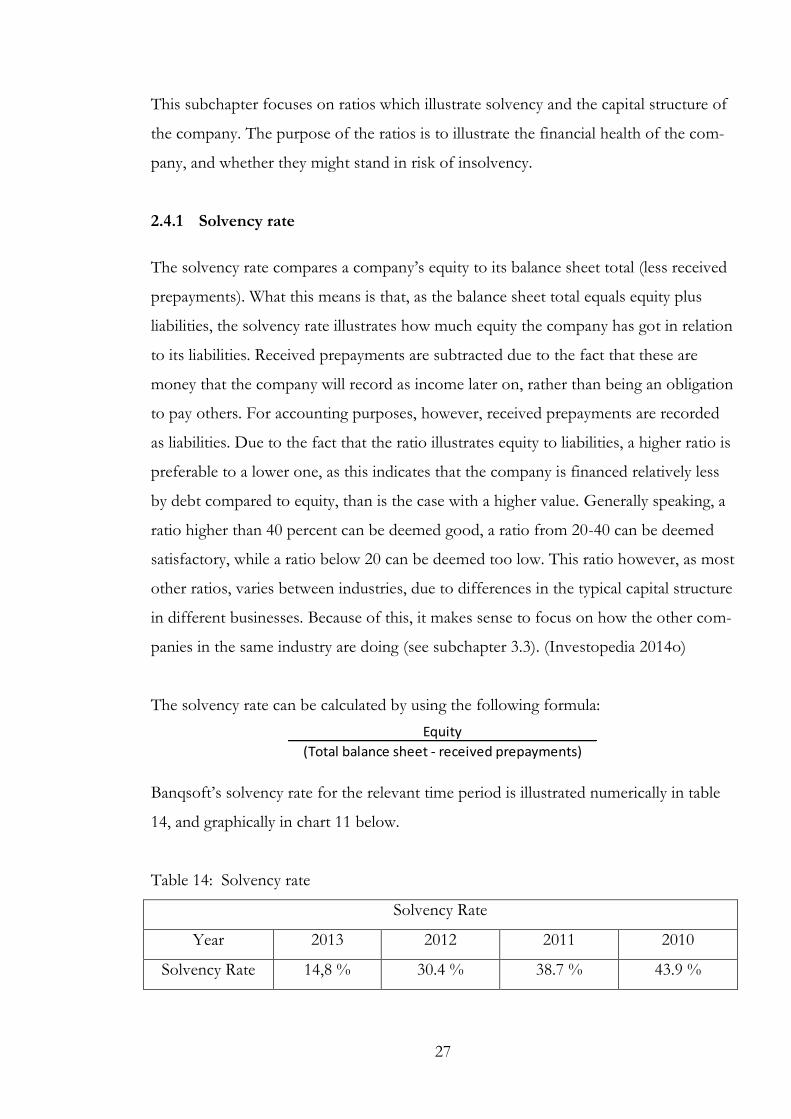
Banqsoft’s solvency rate for the relevant time period is illustrated numerically in table
14, and graphically in chart 11 below.
Table 14: Solvency rate
Solvency Rate
Year 2013 2012 2011 2010
Solvency Rate 14,8 % 30.4 % 38.7 % 43.9 %

28
(Total liabilities - received prepayments)
Turnover
Chart 11: Solvency rate
The figures show that the ratio has decreased from year to year throughout the period,
with quite a significant drop in 2013. A look at the balance sheet explains this drop:
The equity in the company has decreased, while at the same time the balance sheet to-
tal has increased. Nonetheless, the trend is negative, and the 2013 ratio is at a level that,
according to the general benchmarking numbers, can be deemed too low. In subchap-
ter 3.3 the figures are benchmarked against other software companies, which might
give a more accurate picture for the software industry.
2.4.2 Leverage on sales
The leverage on sales ratio illustrates the relation between a company’s liabilities to its
turnover. For this purpose, received prepayments are subtracted from the liabilities.
The purpose of this ratio is to see how much liabilities a company has compared to its
revenue. This means that the higher the ratio, the more liabilities the company has
compared to its revenue, and conversely the lower the ratio is, the less liabilities the
company has compared to its revenue. In other words, a lower figure is preferable, as
this indicates less risk. (Melamies, J. 2013)
The leverage on sales can be calculated by using the following formula:
43,9 %
38,7 %
30,4 %
14,8 %
0,0 %
5,0 %
10,0 %
15,0 %
20,0 %
25,0 %
30,0 %
35,0 %
40,0 %
45,0 %
50,0 %
2010 2011 2012 2013
Solvency Rate
29
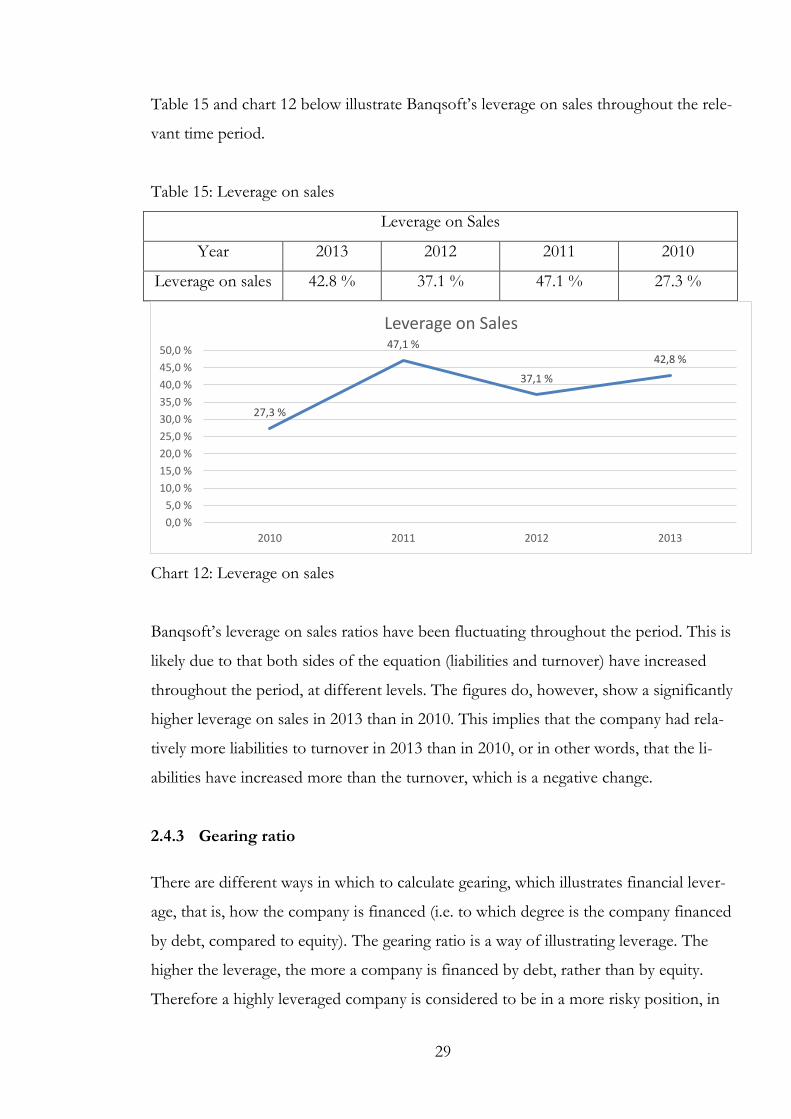
Table 15 and chart 12 below illustrate Banqsoft’s leverage on sales throughout the rele-
vant time period.
Table 15: Leverage on sales
Leverage on Sales
Year 2013 2012 2011 2010
Leverage on sales 42.8 % 37.1 % 47.1 % 27.3 %
Chart 12: Leverage on sales
Banqsoft’s leverage on sales ratios have been fluctuating throughout the period. This is
likely due to that both sides of the equation (liabilities and turnover) have increased
throughout the period, at different levels. The figures do, however, show a significantly
higher leverage on sales in 2013 than in 2010. This implies that the company had rela-
tively more liabilities to turnover in 2013 than in 2010, or in other words, that the li-
abilities have increased more than the turnover, which is a negative change.
2.4.3 Gearing ratio
There are different ways in which to calculate gearing, which illustrates financial lever-
age, that is, how the company is financed (i.e. to which degree is the company financed
by debt, compared to equity). The gearing ratio is a way of illustrating leverage. The
higher the leverage, the more a company is financed by debt, rather than by equity.
Therefore a highly leveraged company is considered to be in a more risky position, in
27,3 %
47,1 %
37,1 %
42,8 %
0,0 %
5,0 %
10,0 %
15,0 %
20,0 %
25,0 %
30,0 %
35,0 %
40,0 %
45,0 %
50,0 %
2010 2011 2012 2013
Leverage on Sales

30
Net debt X 100
Equity
which it could find itself in trouble with meeting all its obligations, especially if it hits
hard times. (Financial Memos 2013)
Generally speaking, a lower gearing ratio is preferable to a high one. A percentage be-
low 100 % is considered preferable, as a lower ratio implies lower risk. However it
could be noted that high leverage is not necessarily an entirely bad thing, as a highly
leveraged company could face higher profits, i.e. the potential returns are higher. Typi-
cally this happens during good times, when revenue and profits are high, however high
leverage can be dangerous during bad times, when revenue and profits are failing. (Fi-
nancial Memos 2013)
The following formula was used for calculating the gearing ratio. Note that the net
debt consists of interest bearing liabilities less cash and cash equivalents.
Table 16 and chart 13 illustrate Banqsoft’s gearing ratio during the relevant time pe-
riod.
Table 16: Gearing ratio
Gearing Ratio
Year 2013 2012 2011 2010
Gearing Ratio -386 % -183 % -96 % -73 %
Chart 13: Gearing ratio
-73% -96% -183%
-386%
-450%
-400%
-350%
-300%
-250%
-200%
-150%
-100%
-50%
0%
2010 2011 2012 2013
Gearing Ratio

31
The figures show negative values throughout the entire period, and a trend in which
the value has decreased from year to year. The explanation for this can be found in the
formula and the balance sheet. Banqsoft do not have much in the way of interest bear-
ing liabilities, however they do have cash and cash equivalents, and the cash and cash
equivalents increased quite much in 2011, resulting in a big difference in the gearing
ratio, whereas in 2013 the equity decreased a lot, further making a big impact on the
ratio. The gearing ratio suggests that Banqsoft should have no problems with repaying
their interest bearing liabilities, which comes as no surprise when having looked at their
balance sheets.
2.4.4 Debt-to-equity ratio
There are different ways in which to calculate financial leverage, that is, how is the
company financed, and how risky can the capitalisation be deemed. The gearing ratio
(see above) is one such ratio, the debt-to-equity ratio another. What this ratio illustrates
is the relation between total debt and total equity, i.e. the second part of the total bal-
ance sheet (the other part being the total assets). The higher the ratio, the more the
company is financed through debt relative to equity. (Marr, B. 2012, 57-59.)
The debt-to-equity ratio can be calculated by using the following formula:
The debt-to-equity ratio of Banqsoft throughout the relevant time period is illustrated
in table 17 and chart 14 below.
Table 17: Debt-to-equity ratio
Debt-to-equity ratio
Year 2013 2012 2011 2010
Financial leverage 5.74 2.29 1.75 1.50
Total liabilities
Total equity

32
Chart 14: Debt-to-equity ratio
The figures show a trend that is increasing, with a significant increase in 2013. The
reason for the increase in 2013 is easy to explain; the equity in the company was
reduced quite significantly, while at the same time the liabilities went up. For the most
part the increase in liabilities comes from dividends, taxes and advance payments from
customers, so the increase largely stems from the fact that the company’s profitability
has increased, rather than that the company is financed more through debt. The
biggest contributor for the increased figures are, however, the reduced equity.
2.4.5 Shareholders’ equity ratio
The shareholders’ equity ratio illustrates the proportion of shareholders’ equity to a
company’s total assets. The ratio both indicates long-term solvency position of the
company, and also illustrates how much the shareholders would receive of the com-
pany’s assets in the event of liquidation. In the latter case, the ratio shows how much
of the assets the shareholders would get, e.g. based on the 2013 figure, the sharehold-
ers would get 14.8 % of the assets. So the higher the ratio, the better for the sharehold-
ers. (Investopedia 2014n, ReadyRatios 2014b)
The shareholders equity ratio can be calculated by using the following formula:
1,50 1,75
2,29
5,74
0,00
1,00
2,00
3,00
4,00
5,00
6,00
7,00
2010 2011 2012 2013
Debt-to-Equity Ratio)
Shareholders' equity X 100
Total assets

33
Banqsoft’s shareholders’ equity for the time period is illustrated in table 18 and chart
15 below.
Table 18: Shareholders’ equity
Shareholders’ equity
Year 2013 2012 2011 2010
Sharheolders’ equity 14.8 % 30.4 % 36.4 % 40.1 %
Chart 15: Shareholders’ equity
The figures show a clear trend in which the shareholders’ equity ratio has dropped each
year, with a rather large drop in 2013. This trend has a simple explanation, in that the
equity has decreased throughout the period, particularly in 2013 (mostly the statuary
reserve), while at the same time the assets have grown steadily. Generally speaking a
higher ratio is considered better, so this trend is not a positive one, and it is something
that one might want to look more into, as low shareholders’ equity ratio suggests that
the company’s assets are relatively more financed by liabilities rather than by equity.
2.4.6 Debt-to-assets ratio
The debt-to-assets ratio shows how much of the company is financed by financial in-
stitutions, i.e. through debt. The higher the number, the more of the company’s assets
are financed through debt, rather than equity, which means a lower number is prefer-
able. The debt-to-assets has a connection with the shareholders’ equity ratio (illustrated
40,1 % 36,4 %
30,4 %
14,8 %
0,0 %
5,0 %
10,0 %
15,0 %
20,0 %
25,0 %
30,0 %
35,0 %
40,0 %
45,0 %
2010 2011 2012 2013
Shareholders' Equity Ratio

34
Total liabilities
Total assets
above the debt-to-assets ratio), in that the two ratios add up to 100 %. (Michigan State
University 2011)
The debt-to-assets ratio can be calculated by using the following formula:
Banqsoft’s debt-to-assets ratio for the time period is illustrated in table 19 and chart 16
below.
Table 19: Debt-to-assets ratio
Debt-to-Assets Ratio
Year 2013 2012 2011 2010
Debt-to-assets ratio 85.2 % 69.6 % 63.6 % 59.9 %
Chart 16: Debt-to-assets
As there is a correlation between the debt-to-assets ratio and the shareholders’ equity
ratio, they show more or less the same, but in different ways. It makes sense that they
should add up to 100 %, as they show the relation between different parts of the equity
and liability side of the balance to the assets, and these two sides should balance. Due
to this, the trend analysis yields similar results as for the shareholders’ equity ratio. The
figures show that the ratio has grown throughout the period, which means that a rela-
59,9 % 63,6 %
69,6 %
85,2 %
0,0 %
10,0 %
20,0 %
30,0 %
40,0 %
50,0 %
60,0 %
70,0 %
80,0 %
90,0 %
2010 2011 2012 2013
Debt-to-Assets
35
Liabilities
EBITDA
tively larger part of the operations are financed through liabilities, rather than equity,
and that especially in 2013 the ratio increased quite much.
2.4.7 Debt-to-EBITDA ratio
The debt-to-EBITDA ratio compares a company’s debt to its earnings before interest,
taxes, depreciation and amortization. Its purpose is to illustrate the liquidity position of
the company. Unlike many other common ratios that illustrate liquidity and leverage,
the debt-to-EBITDA ratio is based on earnings (non-cash expenses excluded), rather
than assets or equity. The reason why the equation uses the EBITDA, as opposed to
net profit, is that it is the EBITDA that is used for paying off debts. As is the case with
most other liquidity and leverage ratios, a lower number indicates lower risk of liquida-
tion and a more secure position, which is favourable. Generally speaking, a ratio below
3 is considered good, while higher ratios could be alarming. It should be noted, how-
ever, that the ratio can vary greatly between different industries, as companies in differ-
ent industries typically have different capital requirements. Capital intensive industries
require more financing, hence larger borrowings, than industries that are less capital
intensive. It is also worth noting that the debt-to-EBITDA ratio has its limitations, as
there could be big amounts spent on different investments, and it also does not take
into consideration bad debt. Nonetheless it is a useful ratio for looking at a company’s
liquidity position, and is a popular tool both for management and financial analysts and
credit rating agencies. (Investopedia 2014g; ReadyRatios 2014a)
The debt-to-EBITDA ratio can be calculated by using the following formula:
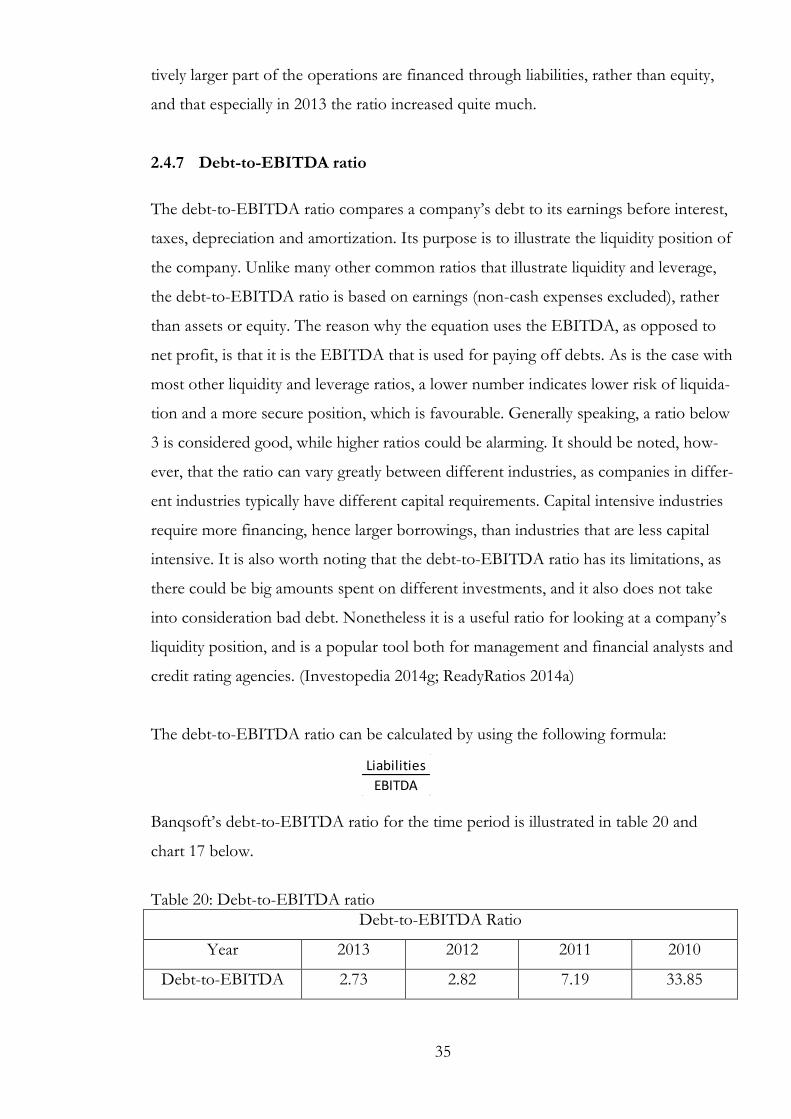
Banqsoft’s debt-to-EBITDA ratio for the time period is illustrated in table 20 and
chart 17 below.
Table 20: Debt-to-EBITDA ratio
Debt-to-EBITDA Ratio
Year 2013 2012 2011 2010
Debt-to-EBITDA 2.73 2.82 7.19 33.85

36
Chart 17: Debt-to-EBITDA ratio As can be seen from the figures, Banqsoft had a very high debt-to-EBITDA ratio in
2010, which indicates high risk. The ratio has, however, decreased a lot since then,
which is a positive trend. The change from 2012 to 2013 was minor, and it will have to
be seen whether that is a trend that will continue, which would mean that the company
will stabilise around that level. Although the trend has been positive, the figures do not
give the full picture, as there are no figures to compare to (see subchapter 3.3 for
benchmarking).
33,85
7,19
2,82 2,73
0,00
5,00
10,00
15,00
20,00
25,00
30,00
35,00
40,00
2010 2011 2012 2013
Debt-to-EBITDA Ratio

37
3 Benchmarking
Benchmarking is a concept that refers to the act of measuring something, by compar-
ing the particular item with some sort of a standard. This standard could be a set, gen-
erally accepted standard, or in the case of for example a company, it can compare itself
to other companies, typically other companies from the same industry, e.g. direct com-
petitors. This is usually done in order to see in which position the company finds itself,
either by comparing how the company has been doing in previous years (historical), by
comparison to its competitors (or other companies from the same sector), or by com-
parison to given standard values. By doing this, the company might be able to improve
its own results. (Cambridge University Press 2011, 68; Hope J., Player S. 2012, 87-88.)
This chapter is devoted to benchmarking, in which the author has compared the key
performance indicators of Banqsoft, with those of some other companies from the
same industry. Because Banqsoft offers specialised products, and the company does
not have much in the way of direct competitors, the author has chosen the companies
used for this purpose. The companies are all software companies, of various sizes, and
from different countries (one company is Dutch, the rest are Nordic).
The structure will be similar to that from the previous chapter; for each ratio, the indi-
cators from the different companies will be illustrated in a table, similar to those used
in the previous chapter, paired up with visual illustrations from charts, followed by
comments about the results. This chapter will, however, not repeat the theoretical part,
instead it will focus on the figures and the analysis only. Thus this chapter will be more
concise and to the point, with less text. Emphasis will be put on ratios that are ex-
pressed in percentage, as these discard the size of the company, i.e. monetary figures
will not be included in this chapter.
3.1 Profitability
This subchapter corresponds to subchapter 2.2, with a focus on profitability.

38
3.1.1 Gross Profit
Table 21: Gross profit - benchmarking
Gross Profit Year 2010 2011 2012 2013
Banqsoft 92% 91% 92% 94%
Basware 94% 93% 92% 90%
Unit4 91% 90% 92% 93%
Visma 85% 86% 86% 86%
Ixonos 90% 88% 90% 91%
Solteq 80% 76% 73% 76%
Company X 99% 97% 89% 92%
IAR Systems 88% 91% 90% 94%
Chart 18: Gross profit - benchmarking
The figures show that the gross profit is quite similar for most of these companies, and
that Banqsoft falls within this norm. Furthermore, at the end of 2013, Banqsoft had
the highest gross profit, together with IAR Systems. If looking at the development of
the figures, it can be seen that they vary; for most companies, the gross profit has
increased slightly during this period, while for some it has decreased slightly. It can be
seen that Banqsoft, besides having the highest gross profit, also follows a similar trend
to most of the other companies in that the gross profit has increased slightly.
As was the case in the gross profit calculations in subchapter 2.2, labour costs have not
been taken into account for any of these companies.
70%
75%
80%
85%
90%
95%
100%
2010 2011 2012 2013
Gross Profit
Banqsoft Basware Unit4 Visma
Ixonos Solteq Company X IAR Systems
39
3.1.2 Operating profit/loss (EBIT)
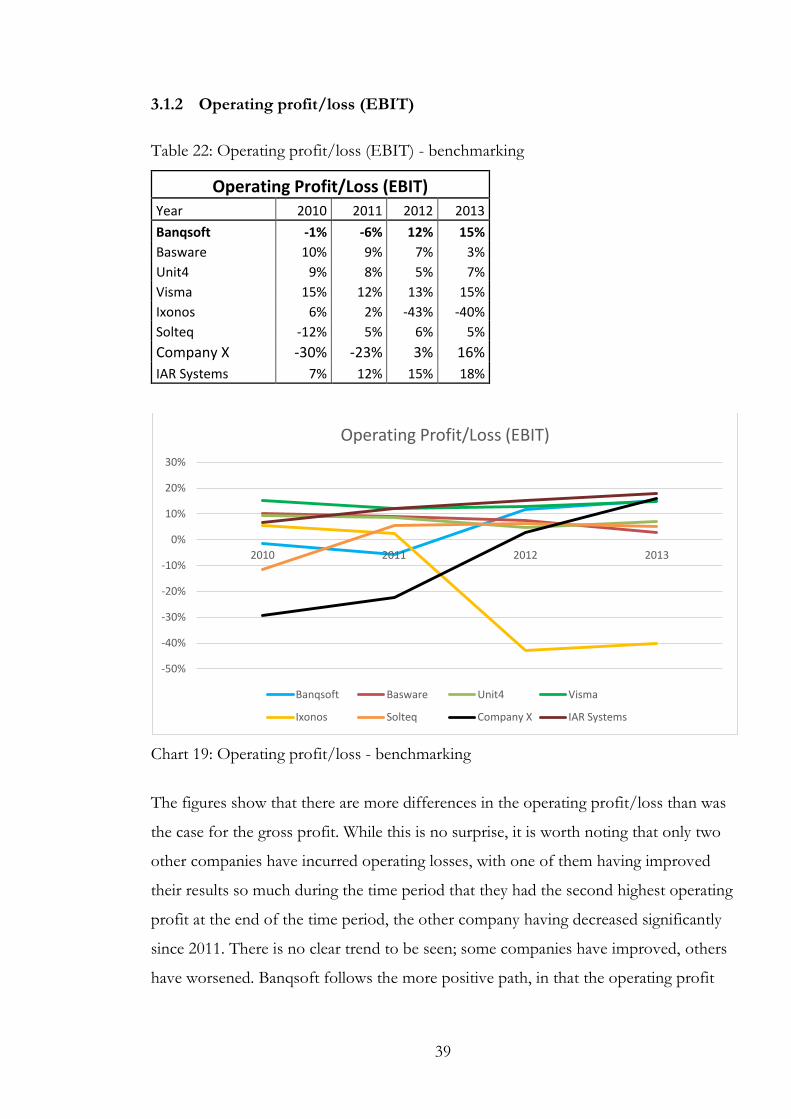
Table 22: Operating profit/loss (EBIT) - benchmarking
Operating Profit/Loss (EBIT) Year 2010 2011 2012 2013
Banqsoft -1% -6% 12% 15%
Basware 10% 9% 7% 3%
Unit4 9% 8% 5% 7%
Visma 15% 12% 13% 15%
Ixonos 6% 2% -43% -40%
Solteq -12% 5% 6% 5%
Company X -30% -23% 3% 16%
IAR Systems 7% 12% 15% 18%
Chart 19: Operating profit/loss - benchmarking
The figures show that there are more differences in the operating profit/loss than was
the case for the gross profit. While this is no surprise, it is worth noting that only two
other companies have incurred operating losses, with one of them having improved
their results so much during the time period that they had the second highest operating
profit at the end of the time period, the other company having decreased significantly
since 2011. There is no clear trend to be seen; some companies have improved, others
have worsened. Banqsoft follows the more positive path, in that the operating profit
-50%
-40%
-30%
-20%
-10%
0%
10%
20%
30%
2010 2011 2012 2013
Operating Profit/Loss (EBIT)
Banqsoft Basware Unit4 Visma
Ixonos Solteq Company X IAR Systems

40
has increased quite much, and was among the companies with the highest operating
profits at the end of the time period. Company X follows a similar trend, although
more dramatic, in that it has increased significantly since 2011, and is now amongt the
companies with the highest figures.
3.1.3 Operating margin (EBITDA)
Table 23: Operating margin (EBITDA) - benchmarking
Operating Margin (EBITDA) Year 2010 2011 2012 2013
Banqsoft 1% -4% 14% 17%
Basware 15% 14% 13% 8%
Unit4 20% 19% 18% 19%
Visma 20% 18% 19% 21%
Ixonos 9% 8% -33% -32%
Solteq -3% 8% 9% 8%
Company X -8% 7% 22% 32%
IAR Systems 9% 15% 18% 22%
Chart 20: Operating margin - benchmarking
Some changes can be seen between the operating margin and the operating profit.
Most notably, in the operating margin, in which depreciations have not been accounted
for, Company X shows a much higher figure in 2013 than other companies, despite
-40%
-30%
-20%
-10%
0%
10%
20%
30%
40%
2010 2011 2012 2013
Operating Margin (EBITDA)
Banqsoft Basware Unit4 Visma
Ixonos Solteq Company X IAR Systems
41
not having the largest operating profit. It can be seen thatBanqsoftis farther behind the
companies with the highest figures, than was the case in the operating profit. This
suggests that depreciations and amortisations were relatively lower in Banqsoft than for
some of these other companies.
3.1.4 Net Profit
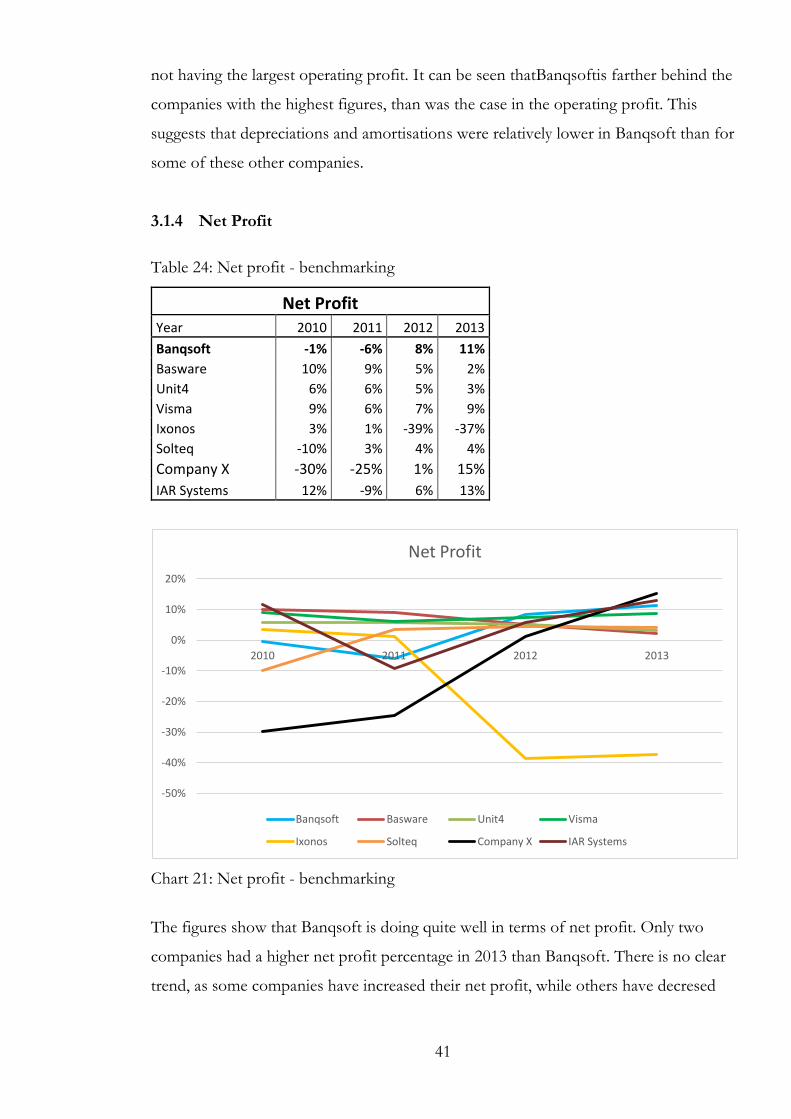
Table 24: Net profit - benchmarking
Net Profit Year 2010 2011 2012 2013
Banqsoft -1% -6% 8% 11%
Basware 10% 9% 5% 2%
Unit4 6% 6% 5% 3%
Visma 9% 6% 7% 9%
Ixonos 3% 1% -39% -37%
Solteq -10% 3% 4% 4%
Company X -30% -25% 1% 15%
IAR Systems 12% -9% 6% 13%
Chart 21: Net profit - benchmarking
The figures show that Banqsoft is doing quite well in terms of net profit. Only two
companies had a higher net profit percentage in 2013 than Banqsoft. There is no clear
trend, as some companies have increased their net profit, while others have decresed
-50%
-40%
-30%
-20%
-10%
0%
10%
20%
2010 2011 2012 2013
Net Profit
Banqsoft Basware Unit4 Visma
Ixonos Solteq Company X IAR Systems

42
their net profits, however what is clear is that Banqsoft is performing well in terms of
net profit compared to the other companies, and that the company’s trend is positive.
3.1.5 Return on investment (ROI)
Table 25: Return on investment (ROI) - benchmarking
Return on Investment (ROI) Year 2010 2011 2012 2013
Banqsoft -3% -11% 21% 28%
Basware 15% 10% 7% 3%
Unit4 10% 10% 6% 9%
Visma 16% 12% 14% 15%
Ixonos 13% 5% -120% -74%
Solteq -35% 14% 15% 11%
Company X -25% -14% 4% 25%
IAR Systems 2% 10% 14% 14%
Chart 22: Return on investment - benchmarking
There is no clear trend in the return on investments during this time period; some
companies have seen increasing figures, others have seen theirs decrease. What is clear
is that Banqsoft had the highest figures both in 2012 and in 2013, and that only
Company X were anywhere near as high a figure in 2013 as Banqsoft. It is also clear
-140%
-120%
-100%
-80%
-60%
-40%
-20%
0%
20%
40%
2010 2011 2012 2013
Return on Investment (ROI)
Banqsoft Basware Unit4 Visma
Ixonos Solteq Company X IAR Systems

43
that both these companies have seen a positive trend in 2012 and 2013, in which the
return on investment increased significantly for both, which is a positive change.
3.1.6 Return on total assets (ROTA)
Table 26: Return on total assets (ROTA) - benchmarking
Return on Total Assets (ROTA) Year 2010 2011 2012 2013
Banqsoft -3% -11% 23% 30%
Basware 12% 9% 7% 3%
Unit4 8% 7% 4% 6%
Visma 13% 11% 10% 11%
Ixonos 9% 4% -56% -45%
Solteq -23% 8% 11% 7%
Company X -18% -14% 3% 23%
IAR Systems 2% 8% 11% 11%
Chart 23: Return on total assets - benchmarking
The return on total assets figures draw a similar picture to those of the return on
investment, that is, that Banqsoft and Company X are quite far above the rest of the
companies; both companies increased their figures significantly in 2012 and 2013, and
Banqsoft had the highest figures in 2012 and 2013. As a higher number is better, it is
clear that these are solid figures for Banqsoft.
-70%
-60%
-50%
-40%
-30%
-20%
-10%
0%
10%
20%
30%
40%
2010 2011 2012 2013
Return on Total Assets (ROTA)
Banqsoft Basware Unit4 Visma
Ixonos Solteq Company X IAR Systems

44
3.1.7 Return on owners’ equity
Table 27: Return on owners’ equity (ROE) - benchmarking
Return on Owners' Equity (ROE) Year 2010 2011 2012 2013
Banqsoft -2% -32% 50% 77%
Basware 18% 14% 6% 3%
Unit4 18% 12% 10% 6%
Visma 39% 27% 33% 38%
Ixonos 11% 3% -75% -166%
Solteq -37% 17% 29% 16%
Company X -153% -68% 28% 347%
IAR Systems 4% -3% 5% 12%
Chart 24: Return on owners’ equity - benchmarking
The chart is not the clearest, due to the extremely high and low figures from Company
X and Ixonos. Banqsoft has increased its profits quite much, relative to its equity, thus
leading to a higher return on owners’ equity. There is no general trend in this ratio,
some have increased their ratio, some have decreased theirs. As a higher number is
better, it can be said that Banqsoft is showing strong figures for this ratio.
3.2 Current assets and liabilities
This subchapter corresponds to subchapter 2.3, with a focus on liquidity.
-200%
-100%
0%
100%
200%
300%
400%
2010 2011 2012 2013
Return on Owners' Equity (ROE)
Banqsoft Basware Unit4 Visma
Ixonos Solteq Company X IAR Systems
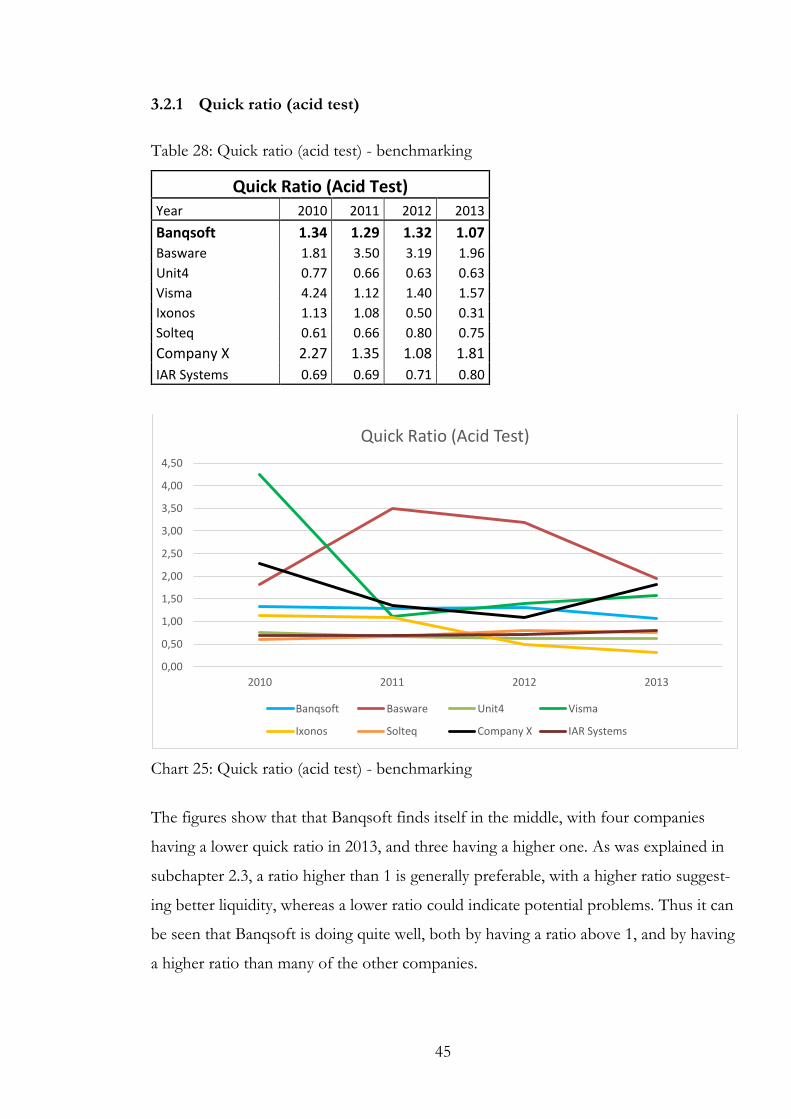
45
3.2.1 Quick ratio (acid test)
Table 28: Quick ratio (acid test) - benchmarking
Quick Ratio (Acid Test) Year 2010 2011 2012 2013
Banqsoft 1.34 1.29 1.32 1.07
Basware 1.81 3.50 3.19 1.96
Unit4 0.77 0.66 0.63 0.63
Visma 4.24 1.12 1.40 1.57
Ixonos 1.13 1.08 0.50 0.31
Solteq 0.61 0.66 0.80 0.75
Company X 2.27 1.35 1.08 1.81
IAR Systems 0.69 0.69 0.71 0.80
Chart 25: Quick ratio (acid test) - benchmarking
The figures show that that Banqsoft finds itself in the middle, with four companies
having a lower quick ratio in 2013, and three having a higher one. As was explained in
subchapter 2.3, a ratio higher than 1 is generally preferable, with a higher ratio suggest-
ing better liquidity, whereas a lower ratio could indicate potential problems. Thus it can
be seen that Banqsoft is doing quite well, both by having a ratio above 1, and by having
a higher ratio than many of the other companies.
0,00
0,50
1,00
1,50
2,00
2,50
3,00
3,50
4,00
4,50
2010 2011 2012 2013
Quick Ratio (Acid Test)
Banqsoft Basware Unit4 Visma
Ixonos Solteq Company X IAR Systems
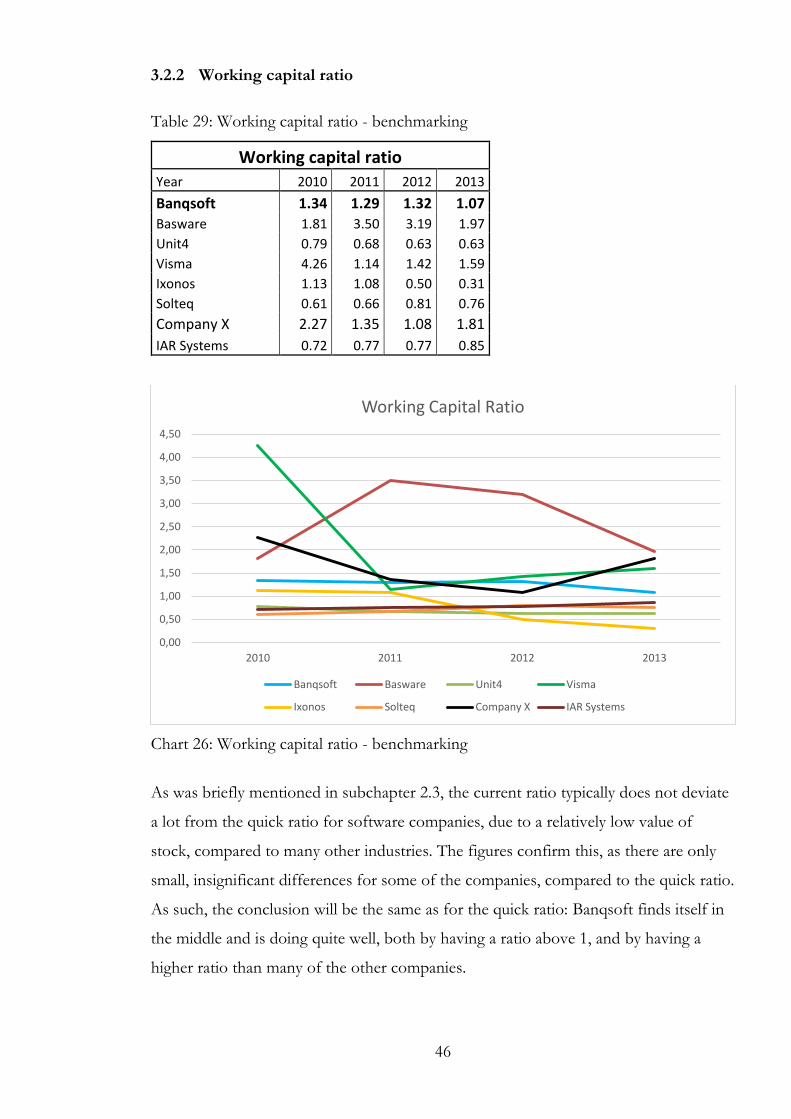
46
3.2.2 Working capital ratio
Table 29: Working capital ratio - benchmarking
Working capital ratio Year 2010 2011 2012 2013
Banqsoft 1.34 1.29 1.32 1.07
Basware 1.81 3.50 3.19 1.97
Unit4 0.79 0.68 0.63 0.63
Visma 4.26 1.14 1.42 1.59
Ixonos 1.13 1.08 0.50 0.31
Solteq 0.61 0.66 0.81 0.76
Company X 2.27 1.35 1.08 1.81
IAR Systems 0.72 0.77 0.77 0.85
Chart 26: Working capital ratio - benchmarking
As was briefly mentioned in subchapter 2.3, the current ratio typically does not deviate
a lot from the quick ratio for software companies, due to a relatively low value of
stock, compared to many other industries. The figures confirm this, as there are only
small, insignificant differences for some of the companies, compared to the quick ratio.
As such, the conclusion will be the same as for the quick ratio: Banqsoft finds itself in
the middle and is doing quite well, both by having a ratio above 1, and by having a
higher ratio than many of the other companies.
0,00
0,50
1,00
1,50
2,00
2,50
3,00
3,50
4,00
4,50
2010 2011 2012 2013
Working Capital Ratio
Banqsoft Basware Unit4 Visma
Ixonos Solteq Company X IAR Systems

47
3.3 Solvency, gearing and leverage ratios
This subchapter corresponds to subchapter 2.4, with a focus on solvency, gearing and
leverage ratios.
3.3.1 Solvency rate
Table 30: Solvency rate - benchmarking
Solvency Rate Year 2010 2011 2012 2013
Banqsoft 44% 39% 30% 15%
Basware 83% 90% 84% 85%
Unit4 43% 47% 46% 47%
Visma 22% 18% 21% 24%
Ixonos 50% 56% 22% 14%
Solteq 37% 45% 47% 55%
Company X 31% 6% 8% 28%
IAR Systems 83% 88% 87% 88%
Chart 27: Solvency rate – benchmarking The figures show four companies with figures above 40 percent, two companies be-
tween 20-40 percent, and two companies below 20 percent. There are significant dif-
ferences between the companies, in other words. The ratio has decreased for Banqsoft
during these years, and was at a low level in 2013, compared to the other companies. A
0%
20%
40%
60%
80%
100%
2010 2011 2012 2013
Solvency Rate
Banqsoft Basware Unit4 Visma
Ixonos Solteq Company X IAR Systems

48
quick look at the company’s balance sheet at the end of 2013 explains why the number
is so low, as the equity is quite low, compared to the liabilities.
3.3.2 Leverage on sales
Table 31: Leverage on sales - benchmarking
Leverage on Sales Year 2010 2011 2012 2013
Banqsoft 27% 47% 37% 43%
Basware 14% 11% 17% 14%
Unit4 72% 59% 64% 57%
Visma 98% 109% 97% 96%
Ixonos 30% 29% 45% 79%
Solteq 24% 27% 29% 24%
Company X 110% 192% 97% 60%
IAR Systems 32% 17% 17% 17%
Chart 28: Leverage on sales – benchmarking
As explained in subchapter 2.4, the leverage on sales shows the relation between
liabilities (less received prepayments) and revenue, in which lower ratios are better than
higher ratios, as higher ratios could indicate higher risk of being unable to meet
obligations. The figures show big differences between the companies, with Banqsoft
finding itself in the middle, with a ratio below 50% at the end of 2013. There is no
clear trend in this ratio, as some companies have lowered their figures, while other
0%
50%
100%
150%
200%
250%
2010 2011 2012 2013
Leverage on Sales
Banqsoft Basware Unit4 Visma
Ixonos Solteq Company X IAR Systems

49
have increased it. The figure has risen for Banqsoft, however the company still seems
to be at a good level compared to some of the other companies.
3.3.3 Gearing ratio
Table 32: Gearing ratio - benchmarking
Gearing Ratio Year 2010 2011 2012 2013
Banqsoft -73% -96% -183% -386%
Basware 24% 17% -24% -5%
Unit4 57% 62% 47% 49%
Visma 145% 205% 163% 99%
Ixonos 37% 27% 163% 280%
Solteq 133% 65% 51% 29%
Company X 104% 1077% 814% 171%
IAR Systems -2% -14% -18% -27%
Chart 29: Gearing ratio – benchmarking
Extreme figures to both ends make the chart difficult to use, but the table shows that
Banqsoft had by far the lowest gearing ratio in 2013, and has had the lowest ratio
throughout the entire period. The table also shows that the ratios vary a lot between
different companies, from -27 % to 280 % in 2013 (Banqsoft not included), thus it is
difficult to draw any conclusions as to what might be the norm for the industry based
-600%
-400%
-200%
0%
200%
400%
600%
800%
1000%
1200%
2010 2011 2012 2013
Gearing Ratio
Banqsoft Basware Unit4 Visma
Ixonos Solteq Company X IAR Systems
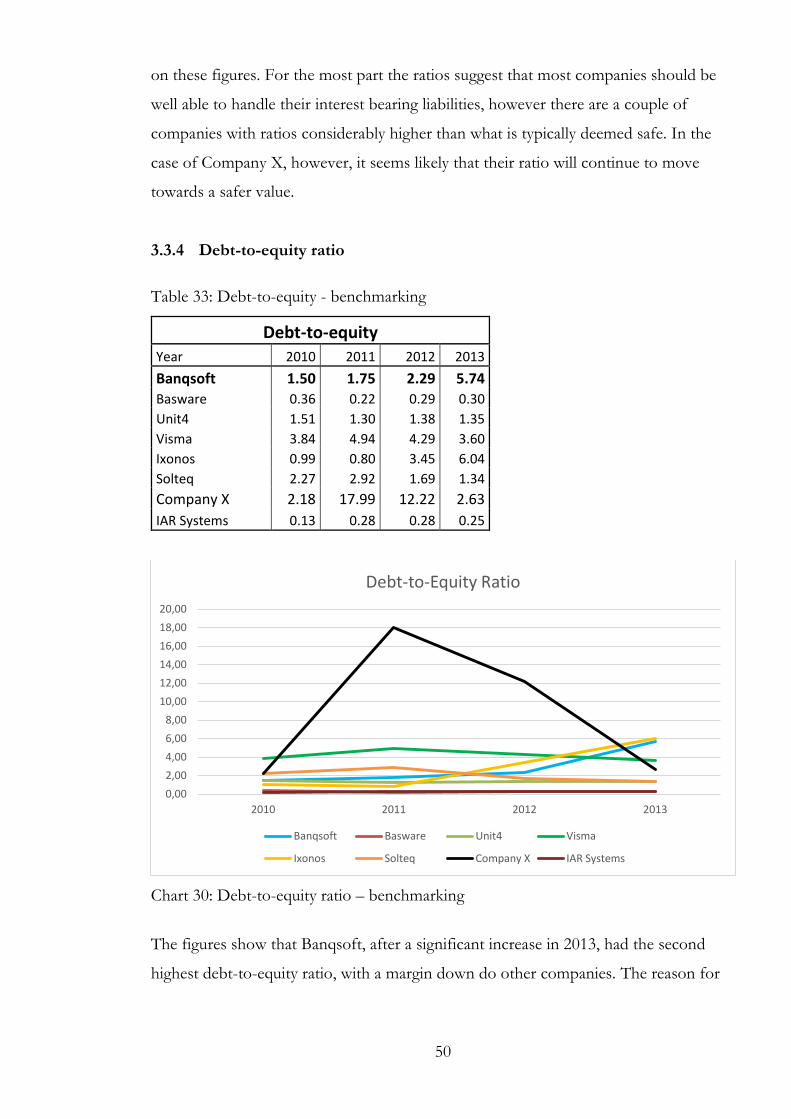
50
on these figures. For the most part the ratios suggest that most companies should be
well able to handle their interest bearing liabilities, however there are a couple of
companies with ratios considerably higher than what is typically deemed safe. In the
case of Company X, however, it seems likely that their ratio will continue to move
towards a safer value.
3.3.4 Debt-to-equity ratio
Table 33: Debt-to-equity - benchmarking
Debt-to-equity Year 2010 2011 2012 2013
Banqsoft 1.50 1.75 2.29 5.74
Basware 0.36 0.22 0.29 0.30
Unit4 1.51 1.30 1.38 1.35
Visma 3.84 4.94 4.29 3.60
Ixonos 0.99 0.80 3.45 6.04
Solteq 2.27 2.92 1.69 1.34
Company X 2.18 17.99 12.22 2.63
IAR Systems 0.13 0.28 0.28 0.25
Chart 30: Debt-to-equity ratio – benchmarking
The figures show that Banqsoft, after a significant increase in 2013, had the second
highest debt-to-equity ratio, with a margin down do other companies. The reason for
0,00
2,00
4,00
6,00
8,00
10,00
12,00
14,00
16,00
18,00
20,00
2010 2011 2012 2013
Debt-to-Equity Ratio
Banqsoft Basware Unit4 Visma
Ixonos Solteq Company X IAR Systems

51
this increase in 2013 is explained in subchapter 2.4. Further on the figures show that
the majority of companies had a ratio lower than 3 in 2013.
3.3.5 Shareholders’ equity ratio
Table 34: Shareholders’ equity - benchmarking
Shareholders' Equity Ratio Year 2010 2011 2012 2013
Banqsoft 40% 36% 30% 15%
Basware 73% 82% 78% 77%
Unit4 40% 43% 42% 42%
Visma 21% 17% 19% 22%
Ixonos 50% 56% 22% 14%
Solteq 31% 34% 37% 43%
Company X 31% 5% 8% 28%
IAR Systems 80% 78% 78% 80%
Chart 31: Shareholders’ equity – benchmarking
The figures show big differences between the companies. Two companies had a very
high ratio throughout the entire period, two companies find themselves more in the
middle, two companies in the 20-30 % area, and two companies, including Banqsoft, at
around 15 %. Further on the figures show that some companies have increased their
0%
10%
20%
30%
40%
50%
60%
70%
80%
90%
2010 2011 2012 2013
Shareholders' Equity Ratio
Banqsoft Basware Unit4 Visma
Ixonos Solteq Company X IAR Systems

52
ratio, while others have seen theirs decrease. Due to these two reasons, neither a clear
trend, nor a norm for values, can be deduced from the figures. It is still worth noting
that Banqsoft had the second lowest shareholders’ equity ratio in 2013.
3.3.6 Debt-to-assets ratio
Table 35: Debt-to-assets ratio - benchmarking
Debt-to-Assets Ratio Year 2010 2011 2012 2013
Banqsoft 60% 64% 70% 85%
Basware 27% 18% 22% 23%
Unit4 60% 57% 58% 58%
Visma 79% 83% 81% 78%
Ixonos 50% 44% 78% 86%
Solteq 69% 66% 63% 57%
Company X 69% 95% 92% 72%
IAR Systems 10% 22% 22% 20%
Chart 32: Debt-to-assets ratio – benchmarking
As was explained in subchapter 2.4, there is a correlation between the debt-to-assets
ratio and the shareholders’ equity ratio, in that the two add up to 100 %, i.e. the ratios
show much the same, but with a different focus, one on equity-to-assets, and one to
0%
10%
20%
30%
40%
50%
60%
70%
80%
90%
100%
2010 2011 2012 2013
Debt-to-Assets Ratio
Banqsoft Basware Unit4 Visma
Ixonos Solteq Company X IAR Systems

53
debt-to-assets. Thus the figures are reversed, but the conclusions the same as for the
shareholders’ equity ratio: Two companies had a very low ratio in 2013, two are more
in the middle, two are between the 70-80 % range, while two, including Banqsoft, are
in the 80-90 % range. As was the case with the shareholders’ equity ratio, there is no
clear trend to be seen from these figures; some have improved their ratios, others have
seen theirs decrease.
3.3.7 Debt-to-EBITDA ratio
Table 36: Debt-to-EBITDA ratio - benchmarking
Debt-to-EBITDA Ratio Year 2010 2011 2012 2013
Banqsoft 33.85 7.19 2.82 2.73
Basware 1.58 1.51 1.96 2.80
Unit4 3.97 3.55 4.14 3.64
Visma 5.51 6.74 7.02 5.32
Ixonos 3.23 3.83 -1.38 -2.09
Solteq -10.95 5.19 4.78 4.61
Company X -13.72 27.56 36.17 1.88
IAR Systems 4.84 2.31 1.68 1.47
Chart 33: Debt-to-EBITDA ratio – benchmarking
-20,00
-10,00
0,00
10,00
20,00
30,00
40,00
2010 2011 2012 2013
Debt-to-EBITDA Ratio
Banqsoft Basware Unit4 Visma
Ixonos Solteq Company X IAR Systems

54
Only one of the companies have had a debt-to-EBITDA ratio as high as Banqsoft’s
was in 2010, however Banqsoft has decreased its ratio significantly, and find
themselves right in the middle. When the figure is negative, that is because of the
companies having incurred losses (in the earnings before interest, taxes, depreciations
and amortisations) during those years, so although a low number can be considered
good, it should be a positive number. Some companies have increased their ratios,
others have decreased theirs, but overall a trend can be seen in which most of the
companies have improved their ratios. Banqsoft follows this trend, and by being in the
middle, seems to follow the ratios of the other companies well, which could imply that
the current ratio level is a good one.

55
4 Capital required to continue operations
The second objective of this report was to look at how much capital is required in or-
der to continue operations, given the situation in which the company’s biggest share-
holder is planning to withdraw from the company in 2015. This chapter is dedicated to
this issue.
This objective can be linked to the previous chapters, subchapter 2.4 in particular. As
has been illustrated in this subchapter, Banqsoft’s equity decreased quite much already
in 2013, leaving the company more heavily leveraged, which increases the risk of insol-
vency. It should be noted, however, that although liabilities increased quite much in
2013, the lion’s share of this increase comes from increased tax and dividend liabilities,
both signs of increased profitability. As was illustrated in subchapter 2.4.7, the com-
pany has decreased its liabilities relative to its earnings quite a lot throughout this pe-
riod, which suggests that it should have no trouble meeting its current obligations. The
other larger part of the liabilities comes from other current liabilities, of which a large
part comes from accrued expenses.
Table 37 on the following page shows that the company’s operating costs do not in-
crease much, relative to the expansion of the company. The cost of sales was lower in
2013 than it was in 2010, as were other operating expenses (marginally lower). Depre-
ciations and amortisations have increased a bit, while employee expenses have in-
creased, following a higher number of employees and certainly higher salaries in 2013
than in 2010. In other words, the capital requirement is fairly low for handling the op-
erating expenses. The labour expenses make up the larger part of the expenses, which
is typical for software companies. These are expenses that will have to be covered, and
under the assumption that the amount of employees will not have decreased since
2013, and under the assumption that salaries have increased, it seems likely that the
labour costs will increase in 2014 and 2015. Table 38 on the following shows some
scenarios for what the total operating expenses would be, if increasing by the percent-
ages shown in the table. This is obviously a simplified cost model, as the total operat-
ing expenses are highly unlikely to increase with these percentages, but rather some-

56
where between, however the figures do give an idea of what the operating expenses
might be. For instance, if they increase by 5 %, then the total operating expenses
would be 140,127 NOK, whereas if they increase by 20 %, they would be 152,866
NOK. This will of course affect how much capital is required. It does not seem
unlikely that the total operating expenses will be around the 130,000-150,000 area in
2014, increasing further in 2015.
Table 37: Operating expenses
Operating expenses 2010 2011 2012 2013
Cost of sales -10 677 -8 042 -10 188 -9 305
Employee benefit expenses -73 201 -82 041 -77 878 -88 068
Depreciation and amortisation -1 405 -2 583 -2 803 -2 446
Other operating expenses -27 895 -26 790 -21 957 -27 569
TOTAL OPERATING EXPENSES -113 179 -119 456 -112 529 -127 388
Annual change 5.5 % -5.8 % 13.2 %
Table 38: Various total operating expenses scenarios
Change
-5 % -121 019
5 % -133 757
10 % -140 127
15 % -146 496
20 % -152 866
25 % -159 235
30 % -165 604
35 % -171 974
40 % -178 343
57
5 Discussion
The main aim of this report was to analyse the financial performance of Banqsoft AS,
using key performance indicators, both through internal trend analysis and through
benchmarking against other companies from the same industry. Comments on each
key ratio were given throughout the report, where the ratios were illustrated. This
chapter aims to connect and summarise the findings, in order to create a bigger picture
and to give comments based on the bigger picture.
5.1 Key findings
Banqsoft is a fairly young company, still in its growth stage, which can be seen from
the figures. During the time period examined (2010-2013), the company’s total balance
sheet has grown, as has its revenue and its amount of employees, and, as is usually the
case in growing businesses like this, costs have also increased. So then the question is
whether revenue has increased more than costs, i.e. is the company more profitable
now than it was in 2010?
The answer to the question above is yes. All the different key ratios illustrating differ-
ent aspects of profitability (see subchapter 2.2) have improved. These ratios all show a
positive trend, and it seems likely that the growth stage of the company will continue
(this is reinforced by that the company has got new clients during 2014), meaning that
it seems likely that the profitability of the company will increase. Beyond the increased
net profit, the company shows strong figures in the return on investment, return on
assets and return on equity ratios, in addition to that the increased human capital value
added. Further on, in subchapter 3.1, it can be seen that Banqsoft has shown good
profitability and high returns, also compared to the other companies used for bench-
marking in this report.
Further on, in accordance to subchapter 2.3, the ratios show that Banqsoft throughout
the period has been able to meet all of its current obligations, by using its current as-
sets. Compared to the other companies used for benchmarking, Banqsoft seems to be
doing fairly well, finding itself right in the middle, with four companies having negative

58
numbers, and the remaining three companies having higher figures than Banqsoft. It
should be noted that Banqsoft’s figures have decreased, which is a negative develop-
ment.
Subchapter 2.4 does, however, uncovers less positive key ratios. The ratios that show
the company’s financial structure show that a relatively large part of the company is
being financed through liabilities, rather than through equity, and the trend shows that
the capitalisation consists relatively more of liabilities at the end of 2013 than it did in
2010, something which implies higher leverage, meaning that there is a greater risk of
facing insolvency. The other side of the coin is that high leverage typically also leads to
higher returns when times are good, which, as shown earlier, has been the case for
Banqsoft. The debt-to-EBITDA ratio illustrates this point quite well; even though the
company, judging by these key ratios, was more heavily leveraged in 2013 than in 2010,
it had a much lower debt-to-EBITDA ratio in 2013, meaning that the company’s debts
were much smaller in relation to the company’s earnings than was the case in 2010. It
should also be noted that a large part of the increased liabilities towards the end of the
period comes from the increased profitability; once a company starts showing profits,
and increase its profits, increased taxes follow, as do typically dividends. Dividends and
taxes make up the lion’s share of the increased liabilities during this period. Subchapter
3.3 showed that overall, for most of these ratios, Banqsoft found itself at the lower end
of what is typically considered good, whereas its debt-to-EBITDA ratio was quite good
in 2013. What is interesting to note is that companies such as Visma and Company X,
which together with Banqsoft were three of the most profitable companies, also are
three of the companies that seem to be in the most risky positions.
As was illustrated in chapter 4, it is likely that the company’s operating expenses will
increase, both in 2014 and 2015, and the company will have to be ready to cover these
expenses, in addition to their liabilities. Simple scenarios shown in chapter 4 show that
the company should be ready for total operating expenses around the area of 130,000-
150,000 area in 2014, and perhaps up to 180,000 in 2015. The company has seen its
revenue increase more than its costs, leading to higher profits, and the actual cash flow
has also been positive for the past two years, meaning that the company had more cash

59
in 2013 than previously. In accounting and finance it is a common saying that ‘cash is
king’, as all the profits in the world might not be able to help you meet your obligations
if there is no cash. Therefore the positive cash flow is good news for the company.
5.2 Recommendations for the commissioning party
Banqsoft seems to be under good management. The company is clearly in a growth
stage, and it is not surprising that it has incurred losses before turning those losses into
profits. Further on the company has grown quite much, and seems to be performing
well profit wise. It is likely that the company will continue to grow also during the next
few years, further increasing profits. The company has got a sufficient amount of cash
and cash equivalents, which adds security, and a positive cash flow. It is therefore diffi-
cult to give concrete recommendations for the future.
The weakest ratios have been related to the capital structure of the company, mostly
due to a low amount of equity, and thus a big amount of liabilities. These ratios are
likely to worsen further when Verdane withdraws from the ownership side. Although
the company is profitable and has a positive cash flow, and they are having good times
in their business, in which they should have no trouble meeting their obligations, it
might still be advisable to consider increasing the equity. This would reduce the risk of
not being able to meet all obligations, although on the flipside the potential returns
might also decrease.
5.3 Limitations of the research
It should be noted that although key performance indicators give a good notion about
how a company is doing in various aspects, they do not show the full picture, and
therefore the company representative reading this report might not necessarily fully
agree with the results and recommendations given, and should not make potential de-
cisions solely based on results presented in this report. The key ratios are however
good indicators of how the company is doing, and having benchmarked against other
software companies enhances the usefulness of the ratios. It should also be noted that
many key ratios, including several used in this report, go under different names, and
60
sometimes they are also calculated differently. Finally it should be noted that the com-
panies used for benchmarking are at different stages, some are young, others are more
established, which does show in some of the calculations. The size of the companies,
however, is irrelevant, as the comparisons are all done in percentages.
5.4 Learning outcome for the author
The area of key performance indicators is a vast topic; there are a lot of different ratios,
which meant that I had to go through some work to decide on which ones to use. This
process was complicated further by that quite many ratios go under different names,
and many ratios also have different variations of how to calculate them. There is no
lack of resources on the subject, especially online, which lead to a process of selecting
the material to be used in the report. Further on I had to choose companies which I
could use for benchmarking, and find the material needed from them, and although all
the companies used in this report follow the IFRS accounting standards, there are
some variations in how the financial statements are reported. The implications men-
tioned have been the biggest challenges in this report, and I have learnt tremendously
from going through annual reports and doing calculations. Quality control of the calcu-
lations has been a very important aspect to successfully meeting the objectives. Further
on I have had to consider and make choices as to how to present the results in a reader
friendly and functional manner. Having used Microsoft Excel a lot, I have also become
quicker with setting up charts. The overall learning outcome from writing this report is
that I have got a lot more experience in the key performance indicator area, and in ad-
dition I have learnt a lot about financial report. In other words, I have increased my
knowledge when it comes to financial analysis, which is beneficial knowledge to take
with me from my education, and could prove useful in my future career.
61
References
Banqsoft 2014. Annual Report 2013. URL:
http://banqsoft.com/images/stories/pdf/bqs_annualreport_2012.pdf. Accessed
07.04.2014
Cambridge University Press 2011. Business English Dictionary. Cambridge University
Press. Cambridge.
Financial Memos 2013. Gearing Ratio Formula, Calculation and Analysis with Exam-
ples. URL: http://financialmemos.com/gearing-ratio-formula-calculation-and-analysis-
with-examples/. Accessed 16.4.2014
Hope, J., Player, S. 2012. Beyond Performance Management. Harvard Business School
Publishing 2012. Boston.
Investopedia 2014a. Balance Sheet. URL:
http://www.investopedia.com/terms/b/balancesheet.asp. Accessed 7.4.2014
Investopedia 2014b. Financial performance. URL:
http://www.investopedia.com/terms/f/financialperformance.asp. Accessed 7.4.2014
Investopedia 2014c. Gross Profit. URL:
http://www.investopedia.com/terms/g/grossprofit.asp. Accessed 14.4.2014
Investopedia 2014d. FYI On ROI: A Guide To Calculating Return On Investment.
URL: http://www.investopedia.com/terms/r/returnoninvestment.asp. Accessed
15.4.2014
Investopedia 2014e. Key Performance Indicators - KPI. URL:
http://www.investopedia.com/terms/k/kpi.asp. Accessed 7.4.2014
62
Investopedia 2014f. Liquidity. URL:
http://www.investopedia.com/terms/l/liquidity.asp. Accessed 7.4.2014
Investopedia 2014g. Net Debt To EBITDA Ratio. URL:
http://www.investopedia.com/terms/n/net-debt-to-ebitda-ratio.asp. Accessed
16.4.2014
Investopedia 2014h. Operating Margin. URL:
http://www.investopedia.com/terms/o/operatingmargin.asp. Accessed 14.4.2014
Investopedia 2014i. Operating Profit. URL:
http://www.investopedia.com/terms/o/operating_profit.asp. Accessed 14.4.2014
Investopedia 2014j. Quick Ratio. URL:
http://www.investopedia.com/terms/q/quickratio.asp. Accessed 17.4.2014
Investopedia 2014k. Return on Equity. URL:
http://www.investopedia.com/terms/r/returnonequity.asp. Accessed 16.4.2014
Investopedia 2014l. Return on Investment – ROI. URL:
http://www.investopedia.com/terms/r/returnoninvestment.asp. Accessed 15.4.2014
Investopedia 2014m. Return on Total Assets - ROTA – ROI. URL:
http://www.investopedia.com/terms/r/return_on_total_assets.asp. Accessed
16.4.2014
Investopedia 2014n. Shareholder Equity Ratio. URL:
http://www.investopedia.com/terms/s/shareholderequityratio.asp. Accessed
16.4.2014

63
Investopedia 2014o. Solvency Ratio – ROI. URL:
http://www.investopedia.com/terms/s/solvencyratio.asp. Accessed 16.4.2014
Marr, B. 2012. Key Performance Indicators. Pearson Education Limited. Gosport.
Melamies, J. 2013. Senior Lecturer, HAAGA-HELIA University of Applied Sciences.
Lecture notes on key performance indicators. Helsinki.
Michigan State University 2011. Financial Ratios Part 4 of 21: Debt-To-Asset Ratio.
URL:
http://msue.anr.msu.edu/news/financial_ratios_part_4_of_21_debt_to_asset_ratio.
Accessed 16.4.2014
ReadyRatios 2014a. Debt/EBITDA Ratio. URL:
http://www.readyratios.com/reference/debt/debt_ebitda_ratio.html. Accessed
16.4.2014
ReadyRatios 2014b. Equity Ratio. URL:
http://www.readyratios.com/reference/debt/equity_ratio.html?sphrase_id=7796. Ac-
cessed 16.4.2014
Taub, E. 2001. Using ROE to Analyze Stocks: What You Need to Know About. URL:
http://www.aaii.com/journal/article/using-roe-to-analyze-stocks-what-you-need-to-
know-about. Accessed 16.4.2014