Embed Size (px)
Citation preview
Abstract—Composite steel-concrete members offer the
advantages of the best properties of each material. Different structural design codes have appeared around the world, but Eurocode 4 and AISC360 are the reference guides. In this paper, an experimental database on Steel Reinforced Concrete columns has been compiled and accuracy on predictions from both codes has been checked. Based on Artificial Neural Networks, new expressions for predicting the ultimate load of compact and slender Steel Reinforced Concrete columns have been developed.
Index Terms—AISC360, Composite Columns, Eurocode 4,
Neural Networks, SRC, Steel Reinforced Concrete.
I. INTRODUCTION
OMPOSITE steel-concrete members can be made by a wide variety of cross-sections, but the most commonly
used are concrete-encased I-shape steel (also called Steel Reinforced Concrete column, SRC) and concrete-filled steel tubes.
Although composite steel-concrete constructions have been used for more than a century, all their advantages were not fully understood at first; in the early twentieth century concrete was used as a fire protection material for the steel profile, but the performance improvement produced by the encasement was not yet considered. Nowadays, it is well known that these structural members exploit the synergistic action of both materials; steel provides strength, ductility, light weight and fast erection, whereas concrete provides stiffness, good performance at high temperatures and it is an economical material.
In recent years, this type of composite members is being increasingly used in a wide range of applications, such as high-rise buildings, bridge piers and earthquake-resistant construction.
Many codes have been developed from experimental tests results and later numerical analysis in order to stablish the design criteria of composite elements. Two of the guidance
Manuscript received March 5, 2015; revised March 31, 2015. Óscar Martínez-Ramos is with Mechanical Engineering and
Construction Department, Universitat Jaume I, Castellón, Spain (corresponding author, phone: +34-964728005; fax: +34-964728106; e-mail: [email protected]).
David Hernández-Figueirido is with Mechanical Engineering and Construction Department, Universitat Jaume I, Castellón, Spain (e-mail: [email protected]).
Ana Piquer is with Department of Mechanical Engineering and Construction, Universitat Jaume I, Castellón, Spain (e-mail: [email protected]).
documents are Eurocode 4 [1] and AISC360 [2] (to be referred as EC4 and AISC in this paper). The former is the European unified design standard for composite structures and the latter is the American code for steel structures.
The objectives of this paper are threefold: firstly, a historical review of experimental tests of concentrically loaded SRC columns is shown; secondly, an assessment of the ability of EC4 and AISC to predict the behavior of such columns, and finally a proposal of a neural-network-based method to improve the prediction of the ultimate load is given.
II. REVIEW OF EC4 AND AISC PROVISIONS
In this section, the way in which EC4 and AISC predict the ultimate load is exposed. It should be noted that both codes methods are based in Euler’s critical buckling load. Also, they are only applicable within a enclosed range of parameters, such as material strengths and geometrical considerations, which in some cases are overpassed by available test specimens.
When comparing design calculations with the result of experimental tests, the material safety factors specified in all the design codes were set to unity.
A. Eurocode 4
The simplified method offered by EC4 will be taken into account in the analysis of this standard, since all specimens in the database have doubly symmetrical and uniform cross-section.
Resistance of cross-sections
The plastic resistance to compression of a composite cross-section is
.···85.0·, ssccyaRkpl fAfAfAN (1)
Where:
- Aa, Ac and As are the cross-sectional area of structural steel shape, concrete and reinforcement, respectively.
- fy, fc and fs are the nominal value of the yield strength of structural steel, the characteristic value of the 150x300 mm cylinder compressive strength of concrete at 28 days and the characteristic value of the yield strength of reinforcing steel, respectively.
The slenderness ratio used in EC4 to evaluate instability effects due to compression (buckling) is called relative slenderness (λ).
Analysis of Steel-Encased Composite Columns Subjected to Concentric Axial Load Using
Artificial Neural Networks
Óscar Martínez-Ramos, David Hernández-Figueirido, and Ana Piquer
C
Proceedings of the World Congress on Engineering 2015 Vol I WCE 2015, July 1 - 3, 2015, London, U.K.
ISBN: 978-988-19253-4-3 ISSN: 2078-0958 (Print); ISSN: 2078-0966 (Online)
WCE 2015
5.0, )/( crRkpl NN (2)
Where: - Ncr is the elastic critical normal force.
22 /)·( LIEN effcr (3)
- L is the effective buckling length of the column. - (E·I)eff is the effective flexural stiffness.
ssccmaaeff IEIEIEIE ···6.0·)·( (4)
- Ia, Ic and Is are the second moment of inertia of the
structural steel section, the un-cracked concrete section and the steel reinforcement, respectively.
- The modulus of elasticity for structural and reinforced steel is: Ea=Es=210 GPa. For concrete, there is a reference to Eurocode 2 [3], table 3.1, where the secant modulus of elasticity is defined as:
)()10/(22 3.0 GPafE ccm (5)
For member verification, a second order lineal analysis is
used. The design value for effective flexural stiffness (E·I)eff,II is determined from the following expression:
)···5.0··(9.0)·( , ssccmaaIIeff IEIEIEIE (6)
The influence of geometrical imperfections is taken into
account by an equivalent geometrical imperfection of e0=L/200 for the strong axis and e0=L/150 for the weak axis.
Second order effects are evaluated by multiplying the greatest first order bending moment MEd by a factor k.
)···( 00 kekeNM EdEd (7)
Where: - e is the eccentricity related to the considered axis.
00.1)/1(/ , effcrEd NNk (8)
r·44.066.0 (9)
- Ncr,eff is the critical nominal force for the relevant axis
and corresponding to the effective flexural stiffness given in (6), with the effective length taken as the column length.
- β is an equivalent moment factor. - r is the ratio between the end moments. According to
the way in which the forces are applied, this equals a ratio between eccentricities at both ends.
- k0 has the same expression as (8), assuming β=1. Resistance of members in axial compression
The simplified method is used for members in axial compression. The predicted axial force (NEC4) is calculated according to
.· ,4 RkplEC NN (10)
Where: - χ is the reduction factor for the relevant buckling mode
given in EN 1993-1-1, 6.3.1.2 [4] in terms of the relevant relative slenderness .
22
1
(11)
])2.0·(1·[5.0 2 (12)
Where: - is an imperfection factor which depends on the
buckling axis. For strong axis buckling, =0.34 (curve b) and for weak axis buckling, =0.49 (curve c).
B. AISC
The compressive strength (NAISC) of doubly symmetric axially loaded SRC members is determined for the limit state of flexural buckling based on member slenderness as follows:
25.2/]658.0·[ )/( enoPP
noAISC PPifPN eno (13)
25.2/·877.0 enoeAISC PPifPN (14)
Where: - Pno has the same meaning as Npl,Rk defined in (1). - Pe is the elastic critical buckling load and has the same
expression that (3). Although the expression is the Euler’s formula, there is a difference in the definition of the effective stiffness of composite section: ssccmaaeff IEIECIEIE ··5.0···)·( 1 (15)
3.0/·21.01 scs AAAC (16)
In this code, the slenderness ratio can be assumed to be
.)/( 5.0enoAISC PP (17)
III. REVIEW OF HISTORICAL EXPERIMENTAL TESTS
This section briefly explains the history of use and research of SRC-based composite constructions and presents an up-to-date database of experimental tests made with steel-encased composite columns
A. Early times
Composite elements appeared because of the need to protect steel members against fire, but the increase of resistance was not considered. For that reason, no reinforcement bars were used in those first applications. In some cases, only a small amount of steel reinforcement was employed to avoid concrete spalling due to fire.
After the big Kanto (Japan) earthquake in 1910, the excellent behavior of composite columns in seismic conditions was reported and some studies were carried out to better understand the joint performance of steel and concrete.
For several decades, neither usage nor investigations were focused on composite construction. In 1965, Stevens [5] was one of the firsts authors who carried on with investigations.
Proceedings of the World Congress on Engineering 2015 Vol I WCE 2015, July 1 - 3, 2015, London, U.K.
ISBN: 978-988-19253-4-3 ISSN: 2078-0958 (Print); ISSN: 2078-0966 (Online)
WCE 2015
He tested a series of encased wide flange steel columns, concentrically loaded and with eccentricity on the minor axis. Stevens reported that the reinforcement did not provide further additional strength to the columns tested.
B. Historical efforts
Several researchers have made compilations of experimental tests on composite columns. The first experimental database was carried by SSRC Task Group, in 1979 [6] where 30 concentrically loaded and 44 eccentrically loaded SRC were reported. Some other authors [7], [8], [9] and [10] have completed and expanded the database.
C. Database review
The last database was elaborated in 2001, so there was a need to review and complete it with the latest researches. A new compilation of a significant amount of SRC columns has been carried out, and is presented in this paper. The starting point for it was those mentioned above. The original sources were checked, some tests were removed due to the lack of information and some recent tests were included.
A total of 164 tests were compiled, 48 with plain concrete and 116 with steel reinforcement bars. Although modern applications always include reinforcement, plain concrete tests have also been included in this analysis. Materials
The main materials in SRC columns are the steel used in profiles and the concrete in covers. Steel is classified by the yield strength (fy) and concrete is classified by the compressive strength resistance that is measured in cylindrical tests of 150 x 300 mm (fc). High strength concrete is considered when fc>50 MPa and high strength steel when fy>360 MPa. Normal strength materials are considered when fc50 MPa and fy360 MPa.
Slenderness
Columns have been divided into compact and slender columns. The slenderness ratio used in this paper is the relative slenderness (λ), defined in (2).
The relative slenderness range considered in this study is between 0.1 and 2.12. As stated in EC4, columns with λ ≤ 0.2 are classified as compact, and its behavior is governed by its cross-section strength; columns with λ > 0.2 are assumed to be slender. These columns are governed by stability and fail by either elastic or inelastic column buckling.
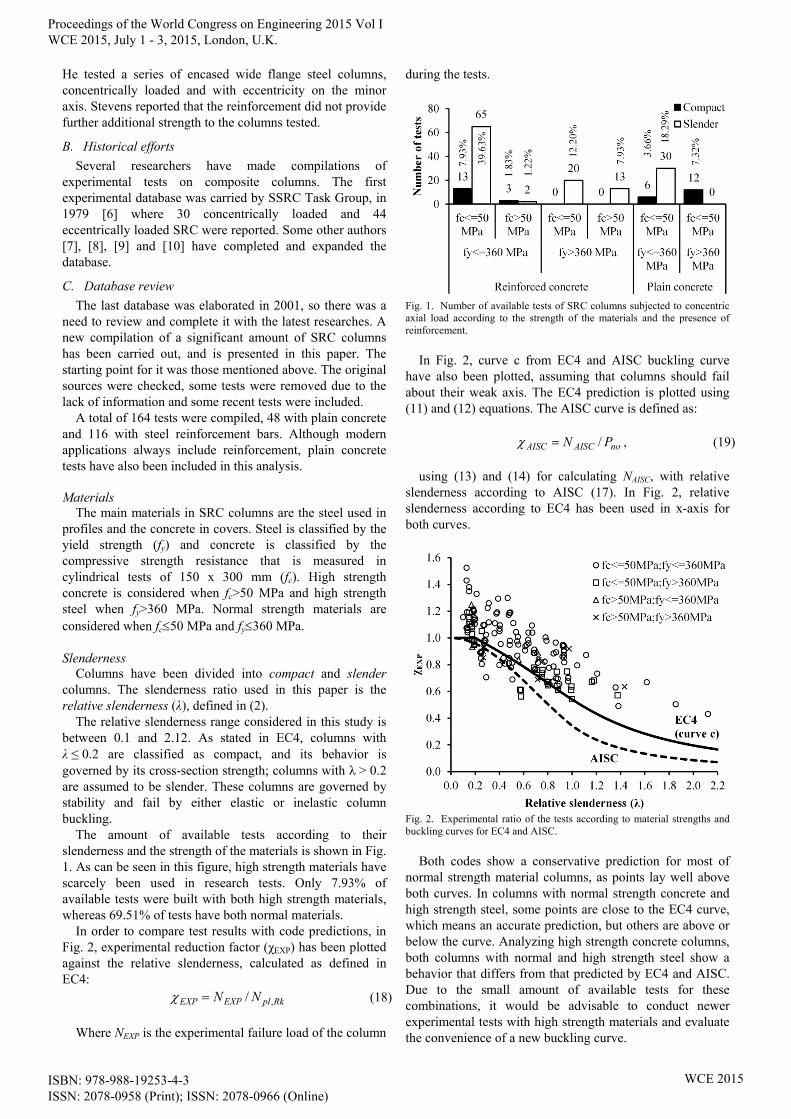
The amount of available tests according to their slenderness and the strength of the materials is shown in Fig. 1. As can be seen in this figure, high strength materials have scarcely been used in research tests. Only 7.93% of available tests were built with both high strength materials, whereas 69.51% of tests have both normal materials.
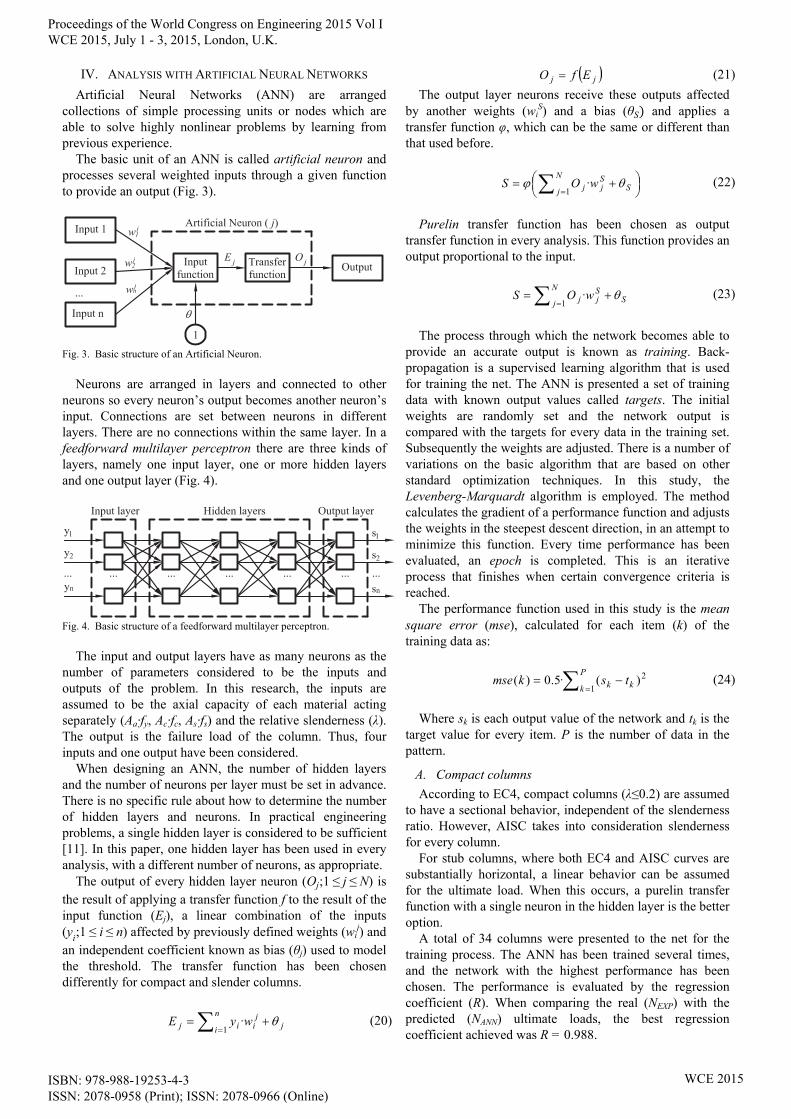
In order to compare test results with code predictions, in Fig. 2, experimental reduction factor (χEXP) has been plotted against the relative slenderness, calculated as defined in EC4: RkplEXPEXP NN ,/ (18)
Where NEXP is the experimental failure load of the column
during the tests.
Fig. 1. Number of available tests of SRC columns subjected to concentric axial load according to the strength of the materials and the presence of reinforcement.
In Fig. 2, curve c from EC4 and AISC buckling curve
have also been plotted, assuming that columns should fail about their weak axis. The EC4 prediction is plotted using (11) and (12) equations. The AISC curve is defined as:
noAISCAISC PN / , (19)
using (13) and (14) for calculating NAISC, with relative
slenderness according to AISC (17). In Fig. 2, relative slenderness according to EC4 has been used in x-axis for both curves.
Fig. 2. Experimental ratio of the tests according to material strengths and buckling curves for EC4 and AISC.
Both codes show a conservative prediction for most of
normal strength material columns, as points lay well above both curves. In columns with normal strength concrete and high strength steel, some points are close to the EC4 curve, which means an accurate prediction, but others are above or below the curve. Analyzing high strength concrete columns, both columns with normal and high strength steel show a behavior that differs from that predicted by EC4 and AISC. Due to the small amount of available tests for these combinations, it would be advisable to conduct newer experimental tests with high strength materials and evaluate the convenience of a new buckling curve.
Proceedings of the World Congress on Engineering 2015 Vol I WCE 2015, July 1 - 3, 2015, London, U.K.
ISBN: 978-988-19253-4-3 ISSN: 2078-0958 (Print); ISSN: 2078-0966 (Online)
WCE 2015
IV. ANALYSIS WITH ARTIFICIAL NEURAL NETWORKS
Artificial Neural Networks (ANN) are arranged collections of simple processing units or nodes which are able to solve highly nonlinear problems by learning from previous experience.
The basic unit of an ANN is called artificial neuron and processes several weighted inputs through a given function to provide an output (Fig. 3).
Fig. 3. Basic structure of an Artificial Neuron.
Neurons are arranged in layers and connected to other
neurons so every neuron’s output becomes another neuron’s input. Connections are set between neurons in different layers. There are no connections within the same layer. In a feedforward multilayer perceptron there are three kinds of layers, namely one input layer, one or more hidden layers and one output layer (Fig. 4).
Fig. 4. Basic structure of a feedforward multilayer perceptron.
The input and output layers have as many neurons as the
number of parameters considered to be the inputs and outputs of the problem. In this research, the inputs are assumed to be the axial capacity of each material acting separately (Aa·fy, Ac·fc, As·fs) and the relative slenderness (λ). The output is the failure load of the column. Thus, four inputs and one output have been considered.
When designing an ANN, the number of hidden layers and the number of neurons per layer must be set in advance. There is no specific rule about how to determine the number of hidden layers and neurons. In practical engineering problems, a single hidden layer is considered to be sufficient [11]. In this paper, one hidden layer has been used in every analysis, with a different number of neurons, as appropriate.
The output of every hidden layer neuron (Oj;1≤j≤N) is the result of applying a transfer function f to the result of the input function (Ej), a linear combination of the inputs (yi;1≤i≤n) affected by previously defined weights (wi
j) and an independent coefficient known as bias (θj) used to model the threshold. The transfer function has been chosen differently for compact and slender columns.
n
i jj
iij wyE1
· (20)
jj EfO (21)
The output layer neurons receive these outputs affected by another weights (wi
S) and a bias (θS and applies a transfer function φ, which can be the same or different than that used before.
N
j SSjj wOS
1· (22)
Purelin transfer function has been chosen as output
transfer function in every analysis. This function provides an output proportional to the input.
N
j SSjj wOS
1· (23)
The process through which the network becomes able to
provide an accurate output is known as training. Back-propagation is a supervised learning algorithm that is used for training the net. The ANN is presented a set of training data with known output values called targets. The initial weights are randomly set and the network output is compared with the targets for every data in the training set. Subsequently the weights are adjusted. There is a number of variations on the basic algorithm that are based on other standard optimization techniques. In this study, the Levenberg-Marquardt algorithm is employed. The method calculates the gradient of a performance function and adjusts the weights in the steepest descent direction, in an attempt to minimize this function. Every time performance has been evaluated, an epoch is completed. This is an iterative process that finishes when certain convergence criteria is reached.
The performance function used in this study is the mean square error (mse), calculated for each item (k) of the training data as:
P
k kk tskmse1
2)(·5.0)( (24)
Where sk is each output value of the network and tk is the
target value for every item. P is the number of data in the pattern.
A. Compact columns
According to EC4, compact columns (λ≤0.2) are assumed to have a sectional behavior, independent of the slenderness ratio. However, AISC takes into consideration slenderness for every column.
For stub columns, where both EC4 and AISC curves are substantially horizontal, a linear behavior can be assumed for the ultimate load. When this occurs, a purelin transfer function with a single neuron in the hidden layer is the better option.
A total of 34 columns were presented to the net for the training process. The ANN has been trained several times, and the network with the highest performance has been chosen. The performance is evaluated by the regression coefficient (R). When comparing the real (NEXP) with the predicted (NANN) ultimate loads, the best regression coefficient achieved was R = 0.988.
Proceedings of the World Congress on Engineering 2015 Vol I WCE 2015, July 1 - 3, 2015, London, U.K.
ISBN: 978-988-19253-4-3 ISSN: 2078-0958 (Print); ISSN: 2078-0966 (Online)
WCE 2015
A design equation can be derived from the predictions of the trained network. For our best results of ANN, the predicting equation (NANN) is:
1228677+8856804-
·709.1·036.1·095.1
ssccyaANN fAfAfAN
(25)
Where the cross-sectional area is expressed in mm2, the
material strengths in MPa and the load is obtained in N.
B. Slender columns
Slender columns (λ > 0.2) have a non-linear behavior. In this case, one of the most widely used transfer functions is chosen: the log-sigmoid transfer function. Thus, (21) becomes
.)exp(1
1
jj E
O
(26)
For training the ANN, 130 columns have been used, with
relative slenderness ranging between 0.21 and 2.12. Different numbers of neurons in the hidden layer have
been used to train the network, but no improvement has been found when more than two neurons were implemented. The best ANN found has R = 0.979, and as above, an equation is derived:
5
2
7
1
7
10·111.3)exp(1
10·238.2
)exp(1
10·502.1
EE
N ANN (27)
Where:
506.0-1.216-·10·553.8
·10·040.8·-4.555·10
7
8-71
ss
ccya
fA
fAfAE
(28)
1-0.935-·10·257.5
·10·195.1·-9.167·10
7
7-102
ss
ccya
fA
fAfAE
(29)
As before, when the cross-sectional area is expressed in
mm2 and the material strengths are in MPa, the load is obtained in N.
V. COMPARISON BETWEEN ANN AND CODES PREDICTIONS
In this section, the accuracy of the ANN predicting the ultimate load is compared with EC4 and AISC standards. For that purpose, strength ratios are defined as
Ratio = NEXP / NPRED, (30)
where NPRED is the predicted load by ANN, EC4 and
AISC. In order to better reflect the deviations of the predictions
from the experimental results, the -10% and +10% error bounds are provided in Fig. 5 and Fig. 6.
A. Compact columns
Table I shows some statistical data about Ratios obtained from the three predictions.
EC4 and AISC predictions are rather conservative: all of the Ratios are above 0.9, and in both cases, more than half
of predictions are over 1.1. In contrast, mean value for the Ratio obtained from the ANN is near to the unit and the standard deviation is smaller than those obtained from the codes.
Nevertheless, ANN predictions lay on both sides of the 1:1 line, which could mean that some tests have been underpredicted.
TABLE I
STATISTICAL VALUES FOR COMPACT COLUMNS
Ratio-EC4 Ratio-AISC Ratio-ANN Mean value 1.132 1.169 1.001
Standard deviation 0.134 0.136 0.096 Ratio > 1.1 58.82% 70.59% 11.76%
1 < Ratio ≤ 1.1 23.53% 20.59% 41.18% 0.9 < Ratio ≤ 1 17.65% 8.82% 29.41%
Ratio ≤ 0.9 0.00% 0.00% 17.65%
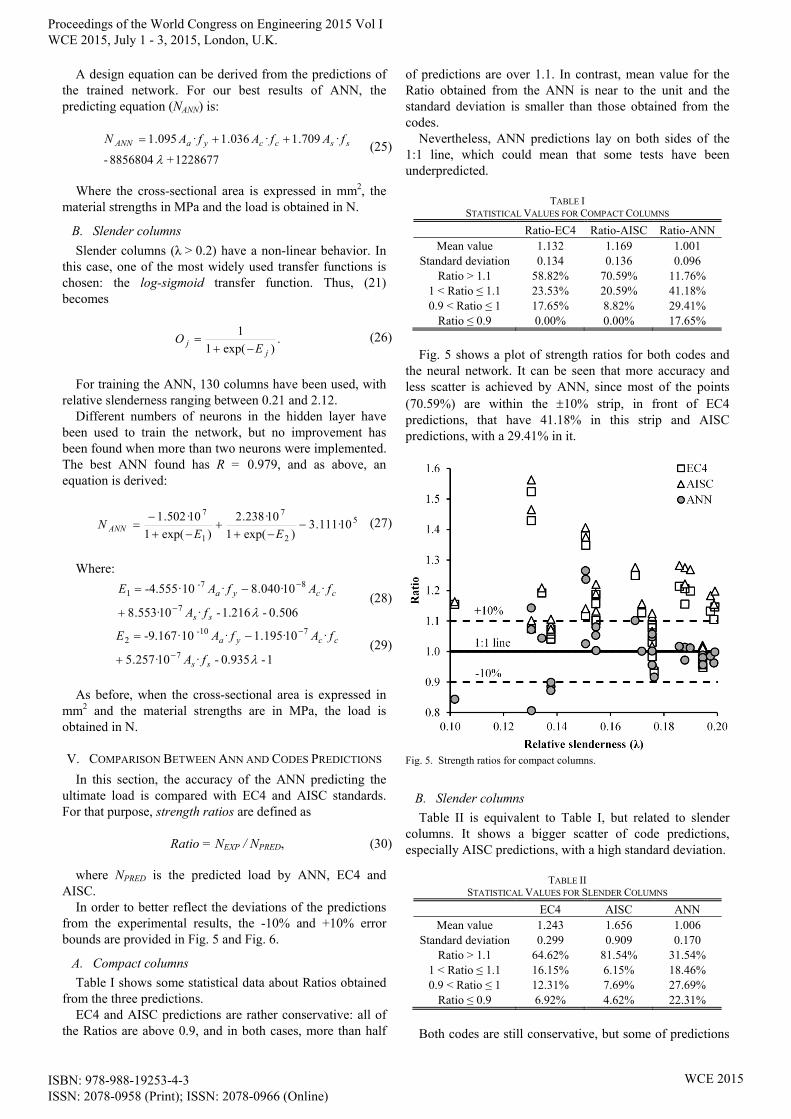
Fig. 5 shows a plot of strength ratios for both codes and
the neural network. It can be seen that more accuracy and less scatter is achieved by ANN, since most of the points (70.59%) are within the 10% strip, in front of EC4 predictions, that have 41.18% in this strip and AISC predictions, with a 29.41% in it.
Fig. 5. Strength ratios for compact columns.
B. Slender columns
Table II is equivalent to Table I, but related to slender columns. It shows a bigger scatter of code predictions, especially AISC predictions, with a high standard deviation.
TABLE II
STATISTICAL VALUES FOR SLENDER COLUMNS
EC4 AISC ANN Mean value 1.243 1.656 1.006
Standard deviation 0.299 0.909 0.170 Ratio > 1.1 64.62% 81.54% 31.54%
1 < Ratio ≤ 1.1 16.15% 6.15% 18.46% 0.9 < Ratio ≤ 1 12.31% 7.69% 27.69%
Ratio ≤ 0.9 6.92% 4.62% 22.31%
Both codes are still conservative, but some of predictions
Proceedings of the World Congress on Engineering 2015 Vol I WCE 2015, July 1 - 3, 2015, London, U.K.
ISBN: 978-988-19253-4-3 ISSN: 2078-0958 (Print); ISSN: 2078-0966 (Online)
WCE 2015
are below Ratio 0.9. ANN predictions are nearly 50% on each side of Ratio=1, although more dispersion is found.
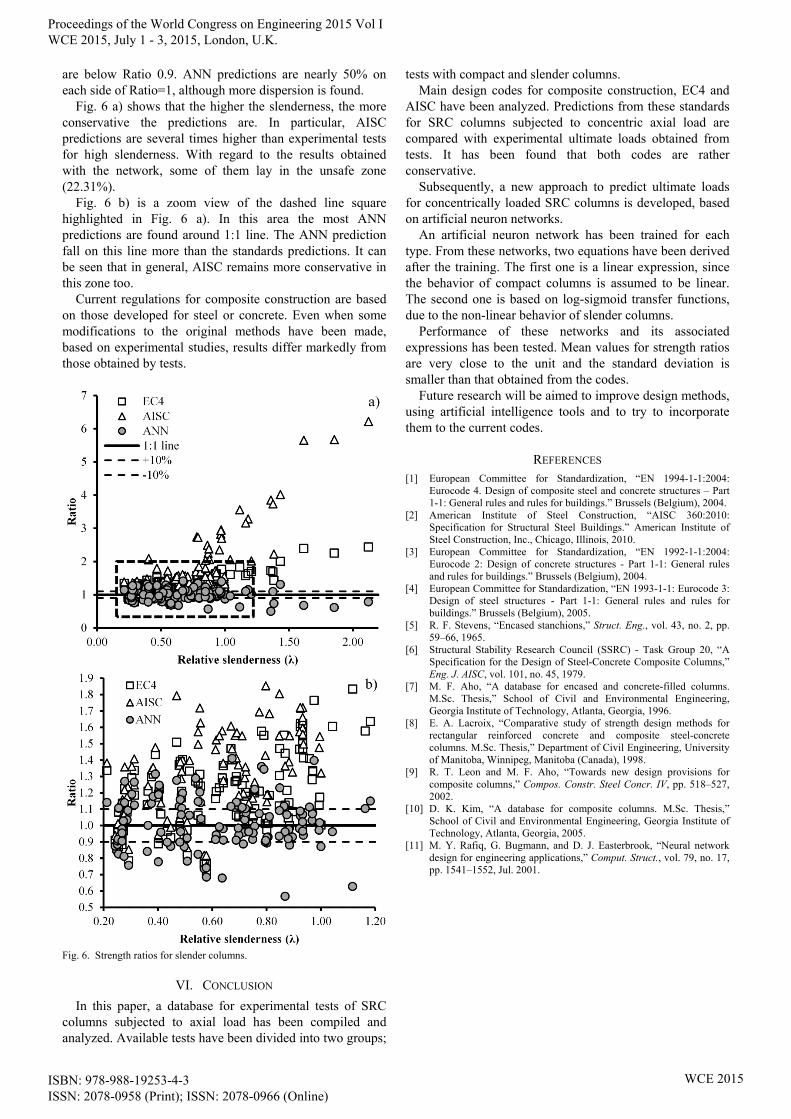
Fig. 6 a) shows that the higher the slenderness, the more conservative the predictions are. In particular, AISC predictions are several times higher than experimental tests for high slenderness. With regard to the results obtained with the network, some of them lay in the unsafe zone (22.31%).
Fig. 6 b) is a zoom view of the dashed line square highlighted in Fig. 6 a). In this area the most ANN predictions are found around 1:1 line. The ANN prediction fall on this line more than the standards predictions. It can be seen that in general, AISC remains more conservative in this zone too.
Current regulations for composite construction are based on those developed for steel or concrete. Even when some modifications to the original methods have been made, based on experimental studies, results differ markedly from those obtained by tests.
Fig. 6. Strength ratios for slender columns.
VI. CONCLUSION
In this paper, a database for experimental tests of SRC columns subjected to axial load has been compiled and analyzed. Available tests have been divided into two groups;
tests with compact and slender columns. Main design codes for composite construction, EC4 and
AISC have been analyzed. Predictions from these standards for SRC columns subjected to concentric axial load are compared with experimental ultimate loads obtained from tests. It has been found that both codes are rather conservative.
Subsequently, a new approach to predict ultimate loads for concentrically loaded SRC columns is developed, based on artificial neuron networks.
An artificial neuron network has been trained for each type. From these networks, two equations have been derived after the training. The first one is a linear expression, since the behavior of compact columns is assumed to be linear. The second one is based on log-sigmoid transfer functions, due to the non-linear behavior of slender columns.
Performance of these networks and its associated expressions has been tested. Mean values for strength ratios are very close to the unit and the standard deviation is smaller than that obtained from the codes.
Future research will be aimed to improve design methods, using artificial intelligence tools and to try to incorporate them to the current codes.
REFERENCES [1] European Committee for Standardization, “EN 1994-1-1:2004:
Eurocode 4. Design of composite steel and concrete structures – Part 1-1: General rules and rules for buildings.” Brussels (Belgium), 2004.
[2] American Institute of Steel Construction, “AISC 360:2010: Specification for Structural Steel Buildings.” American Institute of Steel Construction, Inc., Chicago, Illinois, 2010.
[3] European Committee for Standardization, “EN 1992-1-1:2004: Eurocode 2: Design of concrete structures - Part 1-1: General rules and rules for buildings.” Brussels (Belgium), 2004.
[4] European Committee for Standardization, “EN 1993-1-1: Eurocode 3: Design of steel structures - Part 1-1: General rules and rules for buildings.” Brussels (Belgium), 2005.
[5] R. F. Stevens, “Encased stanchions,” Struct. Eng., vol. 43, no. 2, pp. 59–66, 1965.
[6] Structural Stability Research Council (SSRC) - Task Group 20, “A Specification for the Design of Steel-Concrete Composite Columns,” Eng. J. AISC, vol. 101, no. 45, 1979.
[7] M. F. Aho, “A database for encased and concrete-filled columns. M.Sc. Thesis,” School of Civil and Environmental Engineering, Georgia Institute of Technology, Atlanta, Georgia, 1996.
[8] E. A. Lacroix, “Comparative study of strength design methods for rectangular reinforced concrete and composite steel-concrete columns. M.Sc. Thesis,” Department of Civil Engineering, University of Manitoba, Winnipeg, Manitoba (Canada), 1998.
[9] R. T. Leon and M. F. Aho, “Towards new design provisions for composite columns,” Compos. Constr. Steel Concr. IV, pp. 518–527, 2002.
[10] D. K. Kim, “A database for composite columns. M.Sc. Thesis,” School of Civil and Environmental Engineering, Georgia Institute of Technology, Atlanta, Georgia, 2005.
[11] M. Y. Rafiq, G. Bugmann, and D. J. Easterbrook, “Neural network design for engineering applications,” Comput. Struct., vol. 79, no. 17, pp. 1541–1552, Jul. 2001.
Proceedings of the World Congress on Engineering 2015 Vol I WCE 2015, July 1 - 3, 2015, London, U.K.
ISBN: 978-988-19253-4-3 ISSN: 2078-0958 (Print); ISSN: 2078-0966 (Online)
WCE 2015