Embed Size (px)
Citation preview
ANALYTICS IN HIGHER EDUCATION: PROGRESS AND PROMISE
July 2012
Susan Grajek, PhDVice President, EDUCAUSE
OBJECTIVES
Assess the current state of analytics in higher education
Outline the challenges and barriers to using analytics
Assess progress in analytics
METHODOLOGY
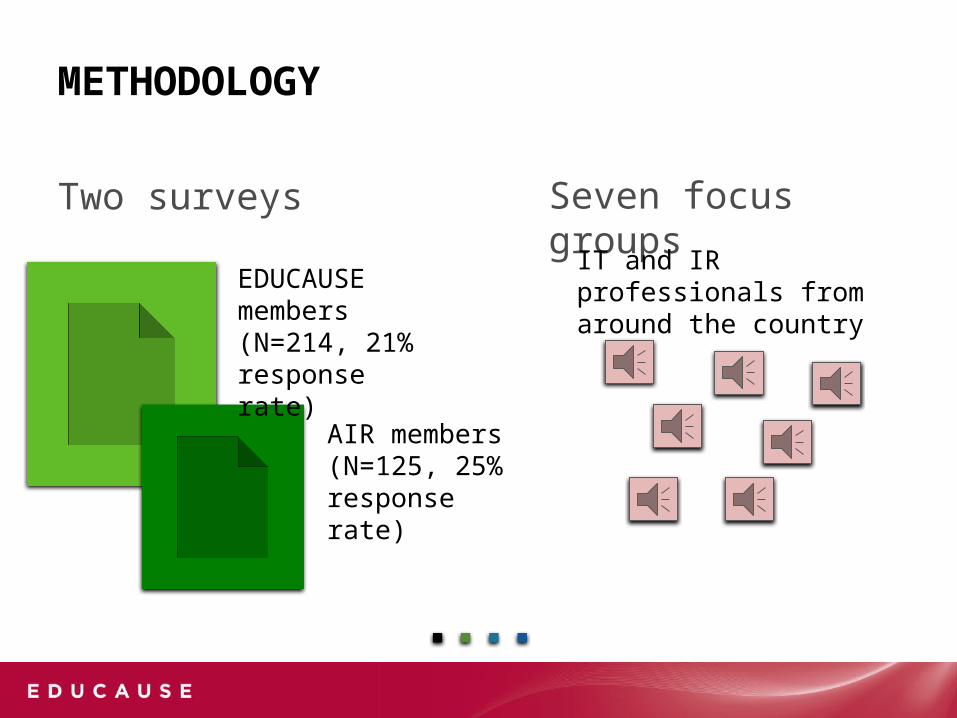
Two surveys Seven focus groups
EDUCAUSE members (N=214, 21% response rate)
AIR members (N=125, 25% response rate)
IT and IR professionals from around the country
THE CURRENT STATE OF ANALYTICS
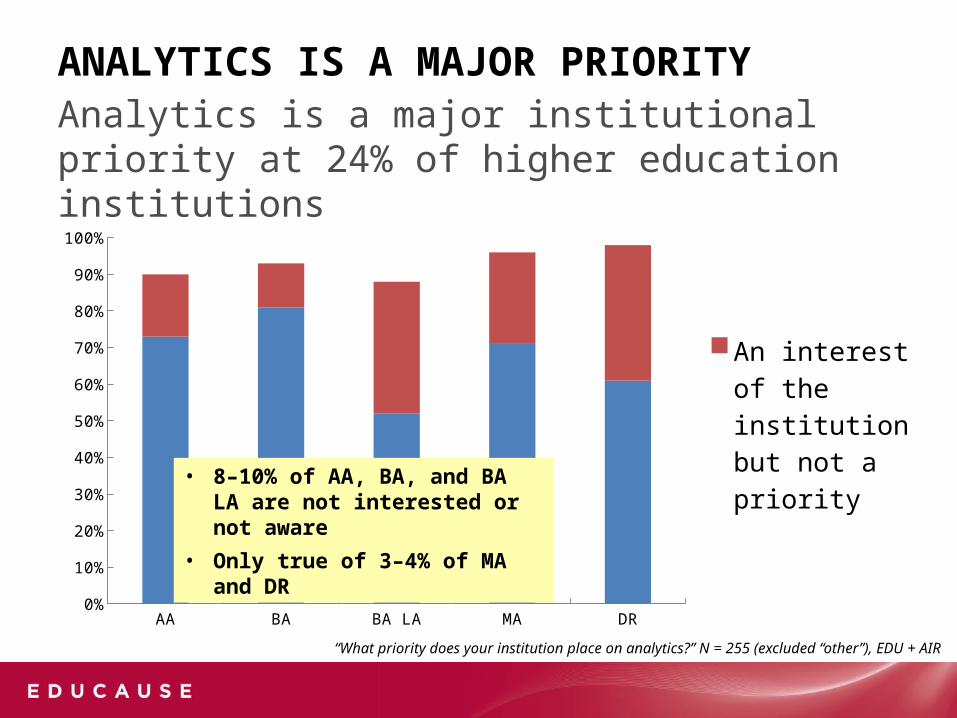
ANALYTICS IS A MAJOR PRIORITY
AA BA BA LA MA DR0%
10%
20%
30%
40%
50%
60%
70%
80%
90%
100%
An interest of the institution but not a priority
Major priority for at least some ar-eas
“What priority does your institution place on analytics?” N = 255 (excluded “other”), EDU + AIR
Analytics is a major institutional priority at 24% of higher education institutions
• 8–10% of AA, BA, and BA LA are not interested or not aware
• Only true of 3–4% of MA and DR
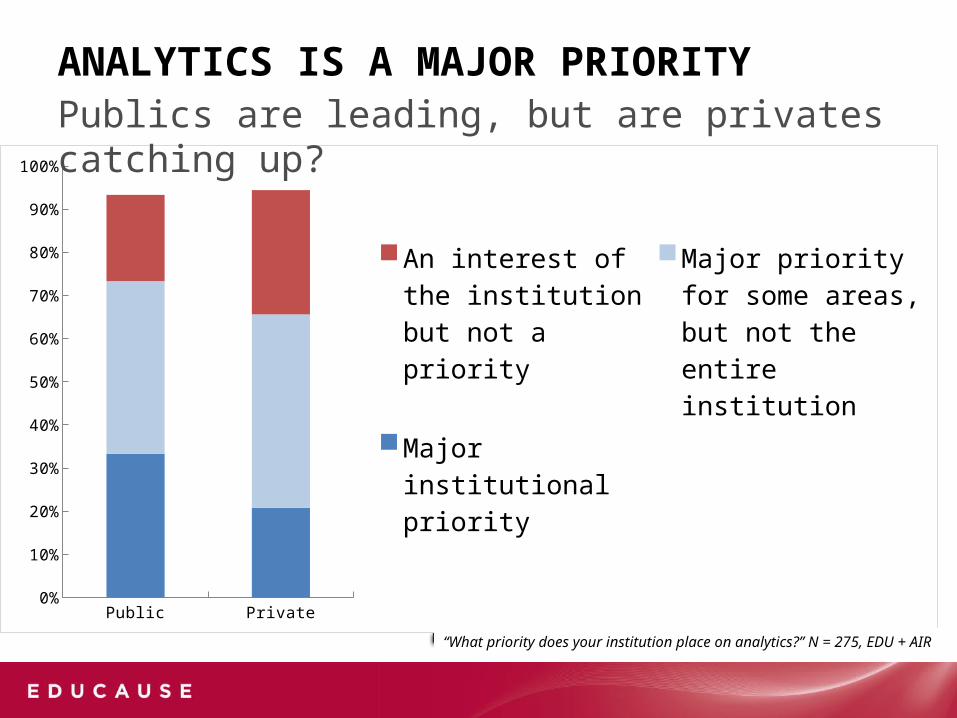
ANALYTICS IS A MAJOR PRIORITY
Public Private0%
10%
20%
30%
40%
50%
60%
70%
80%
90%
100%
An interest of the institu-tion but not a priorityMajor priority for some areas, but not the entire institutionMajor institutional prior-ity
Publics are leading, but are privates catching up?
“What priority does your institution place on analytics?” N = 275, EDU + AIR
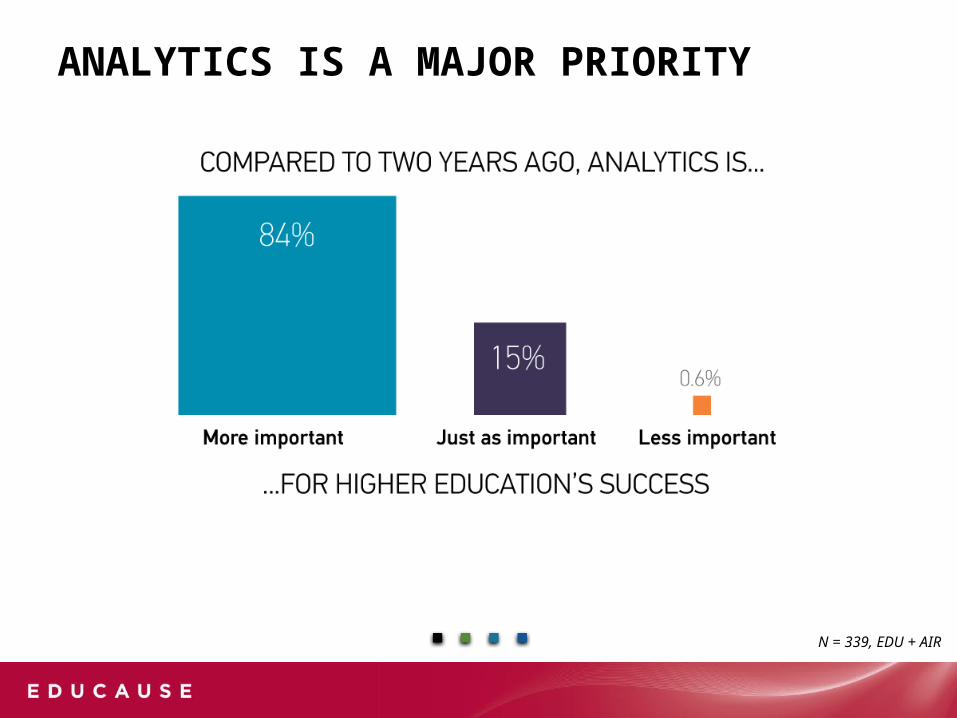
ANALYTICS IS A MAJOR PRIORITY
INSERT TYSON CHART 9
N = 339, EDU + AIR
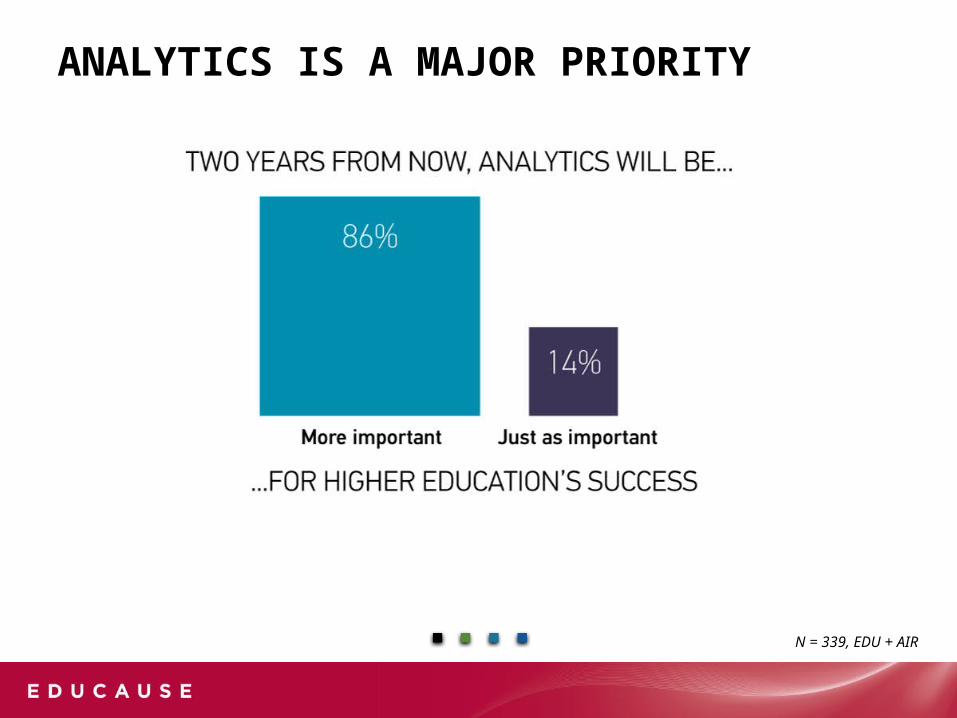
ANALYTICS IS A MAJOR PRIORITY
N = 339, EDU + AIR
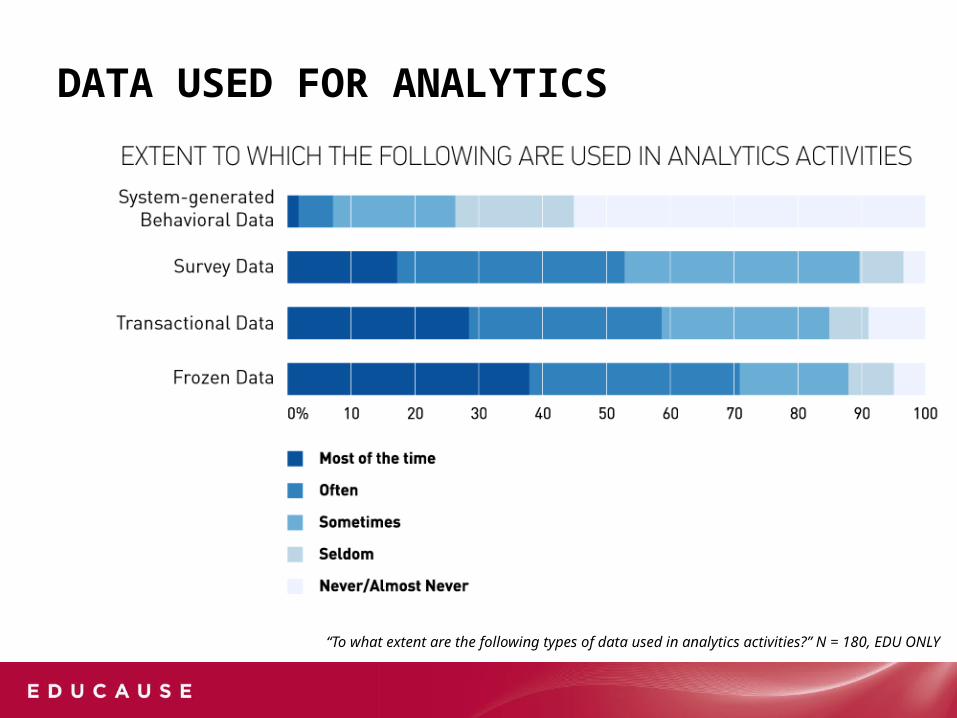
DATA USED FOR ANALYTICS
INSERT TYSON CHART 3
“To what extent are the following types of data used in analytics activities?” N = 180, EDU ONLY
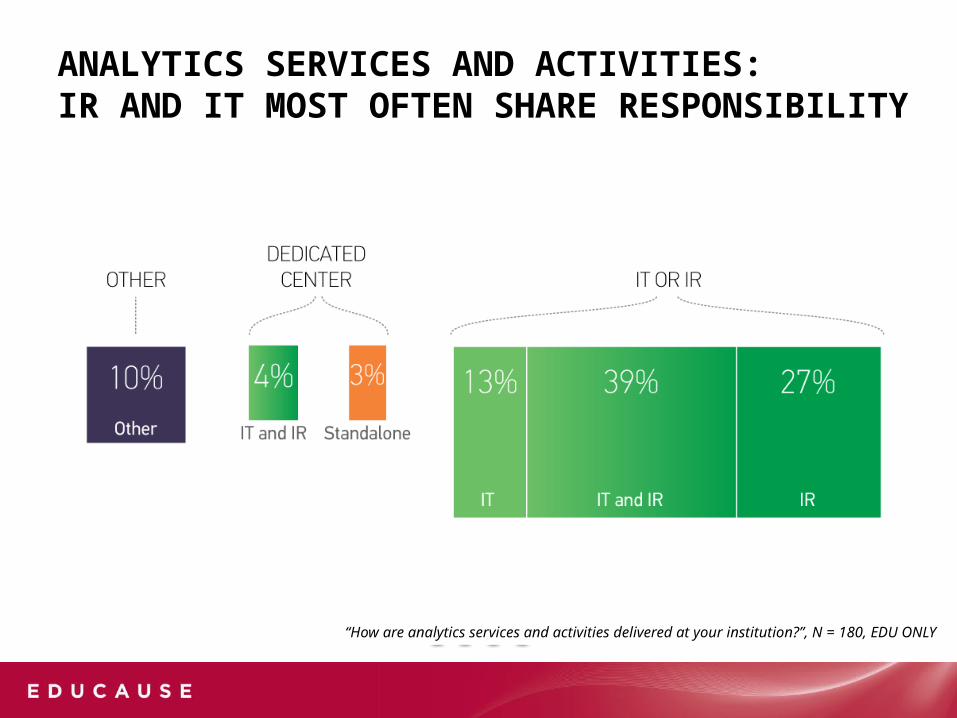
ANALYTICS SERVICES AND ACTIVITIES: IR AND IT MOST OFTEN SHARE RESPONSIBILITY
“How are analytics services and activities delivered at your institution?”, N = 180, EDU ONLY
INSERT TYSON CHART 1
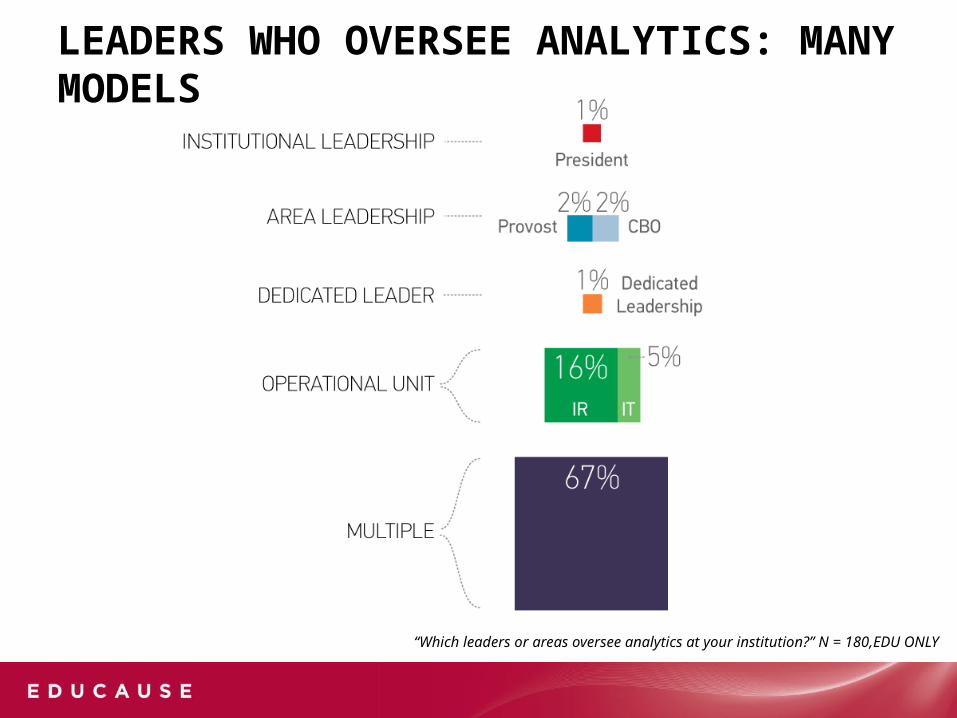
“Which leaders or areas oversee analytics at your institution?” N = 180,EDU ONLY
LEADERS WHO OVERSEE ANALYTICS: MANY MODELS
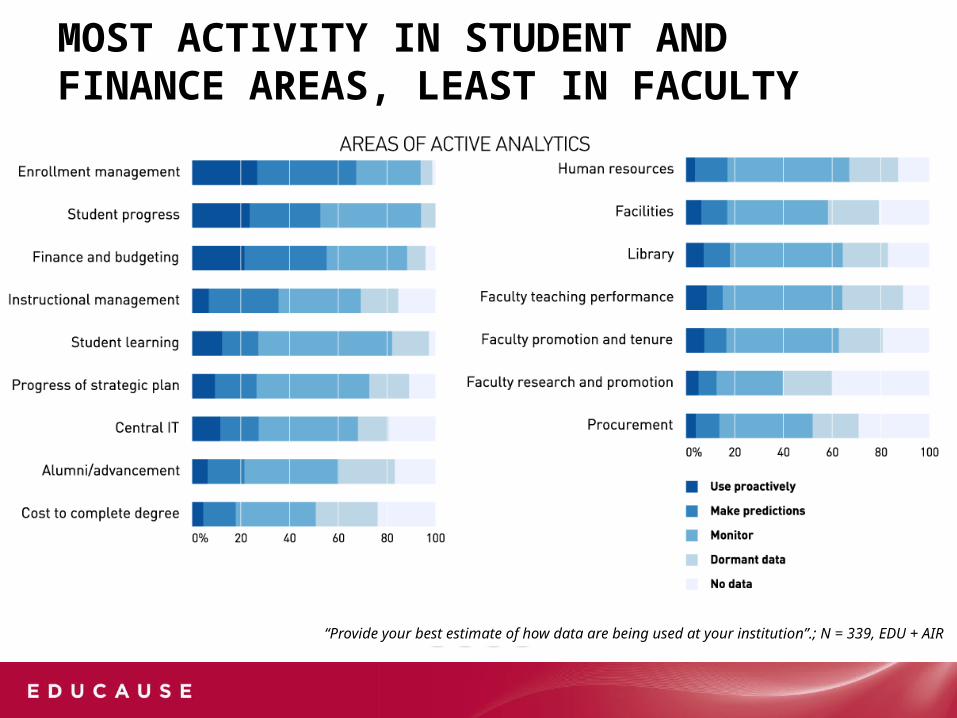
MOST ACTIVITY IN STUDENT AND FINANCE AREAS, LEAST IN FACULTY
INSERT TYSON CHART 4
“Provide your best estimate of how data are being used at your institution”.; N = 339, EDU + AIR
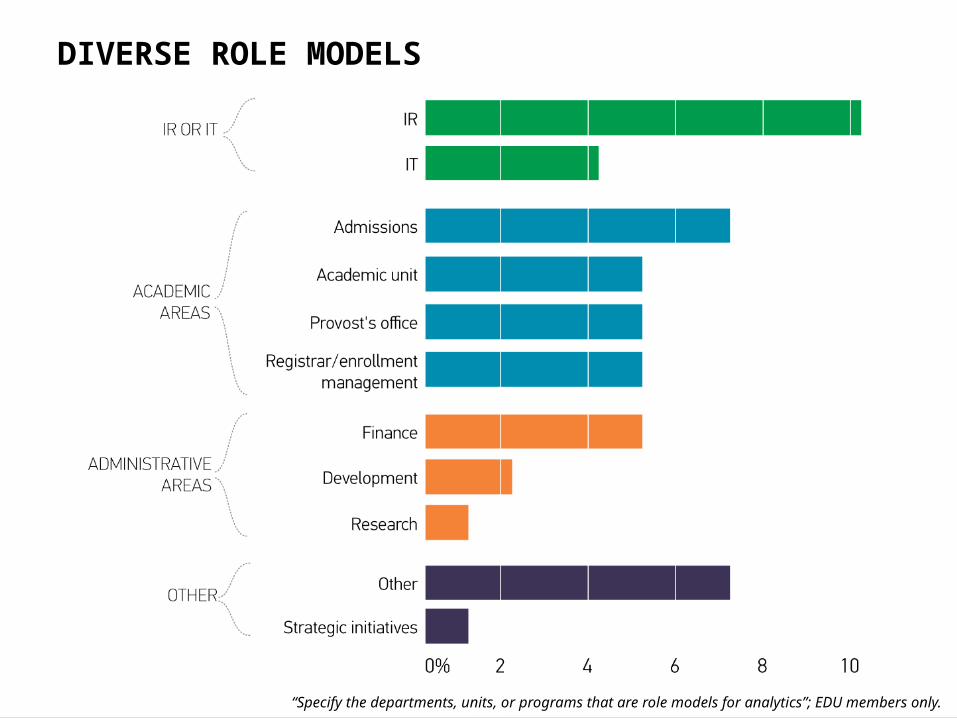
“Specify the departments, units, or programs that are role models for analytics”; EDU members only.
DIVERSE ROLE MODELS
OPPORTUNITIES, CHALLENGES, AND BARRIERS
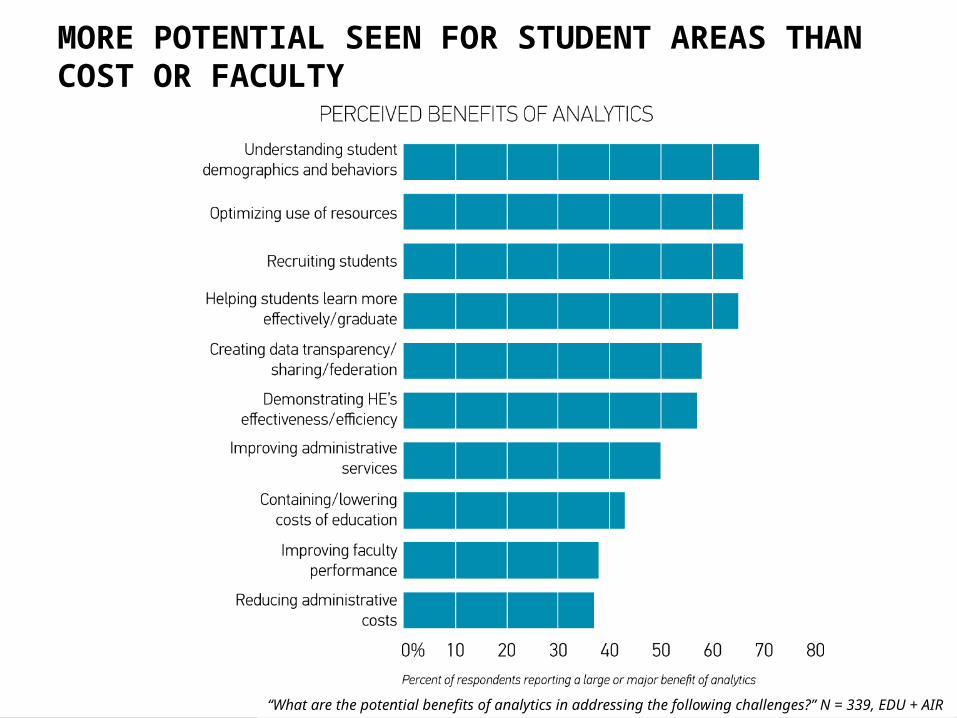
“What are the potential benefits of analytics in addressing the following challenges?” N = 339, EDU + AIR
MORE POTENTIAL SEEN FOR STUDENT AREAS THAN COST OR FACULTY
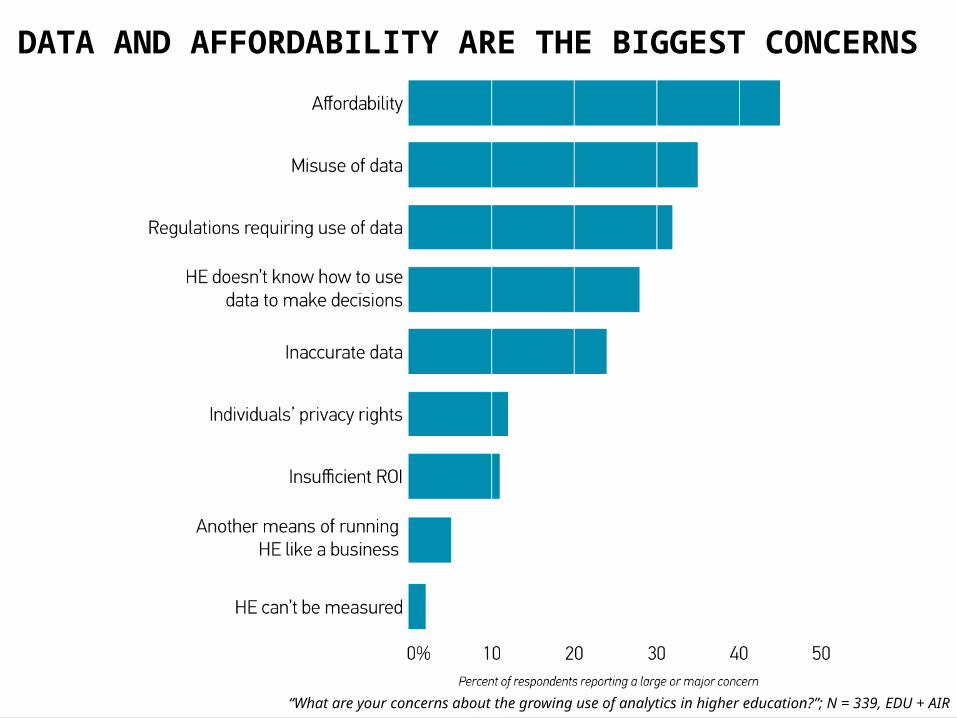
DATA AND AFFORDABILITY ARE THE BIGGEST CONCERNS
“What are your concerns about the growing use of analytics in higher education?”; N = 339, EDU + AIR
PROGRESS IN ANALYTICS
What are the components of analytics, and how capable is higher education today?
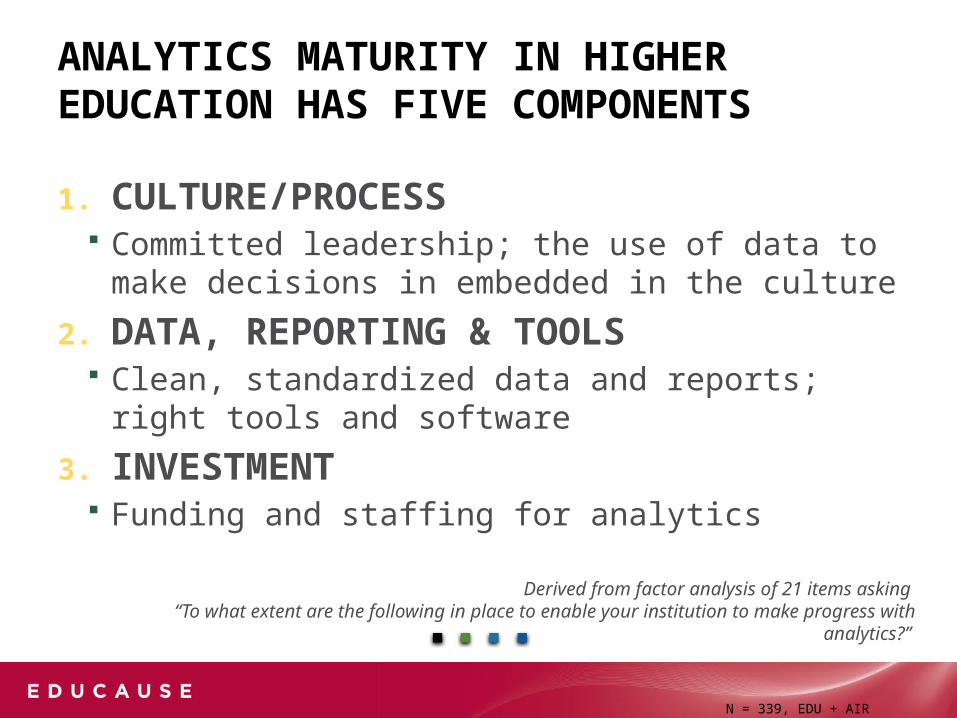
ANALYTICS MATURITY IN HIGHER EDUCATION HAS FIVE COMPONENTS
1. CULTURE/PROCESS Committed leadership; the use of data to make decisions
in embedded in the culture
2. DATA, REPORTING & TOOLS Clean, standardized data and reports; right tools and
software
3. INVESTMENT Funding and staffing for analytics
Derived from factor analysis of 21 items asking “To what extent are the following in place to enable your institution to make progress with
analytics?”
N = 339, EDU + AIR
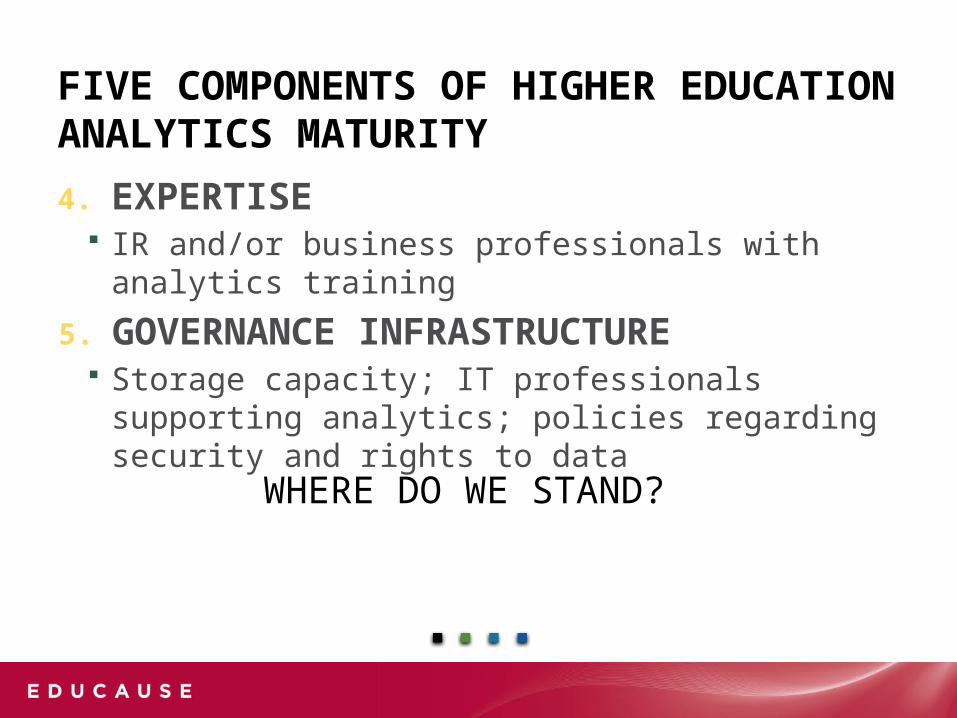
FIVE COMPONENTS OF HIGHER EDUCATION ANALYTICS MATURITY
4. EXPERTISE IR and/or business professionals with analytics training
5. GOVERNANCE INFRASTRUCTURE Storage capacity; IT professionals supporting analytics;
policies regarding security and rights to data
WHERE DO WE STAND?
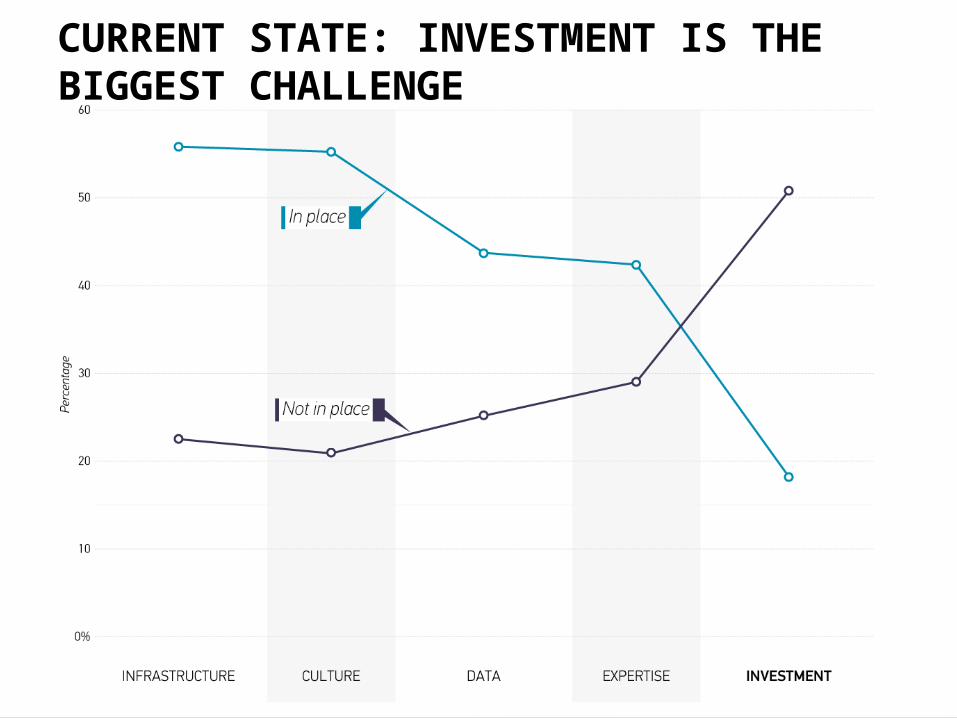
CURRENT STATE: INVESTMENT IS THE BIGGEST CHALLENGE
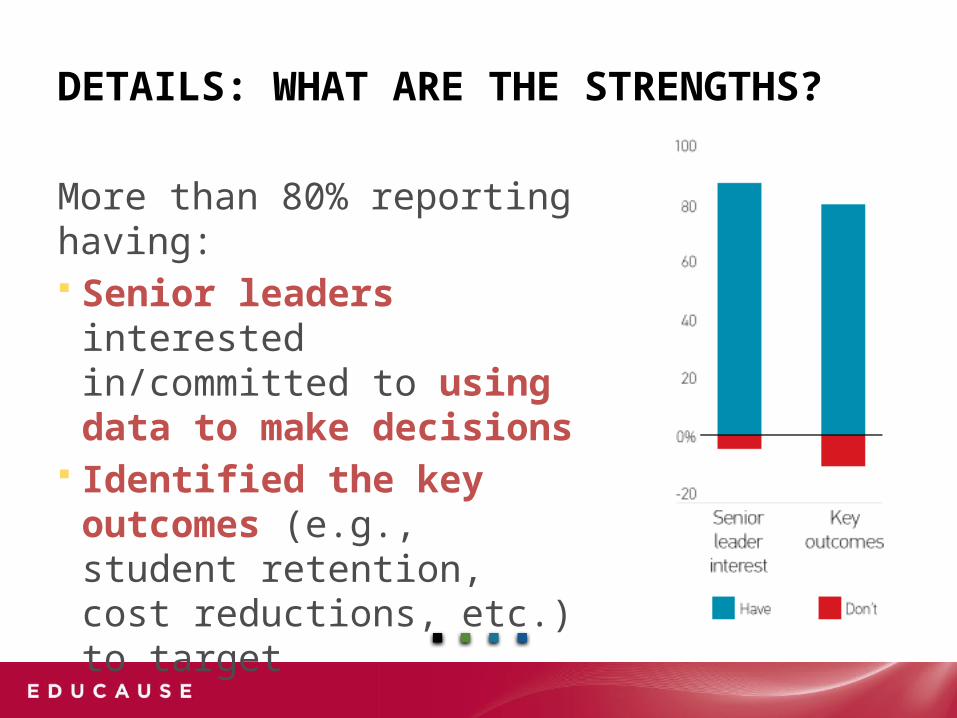
DETAILS: WHAT ARE THE STRENGTHS?
More than 80% reporting having: Senior leaders interested
in/committed to using data to make decisions
Identified the key outcomes (e.g., student retention, cost reductions, etc.) to target
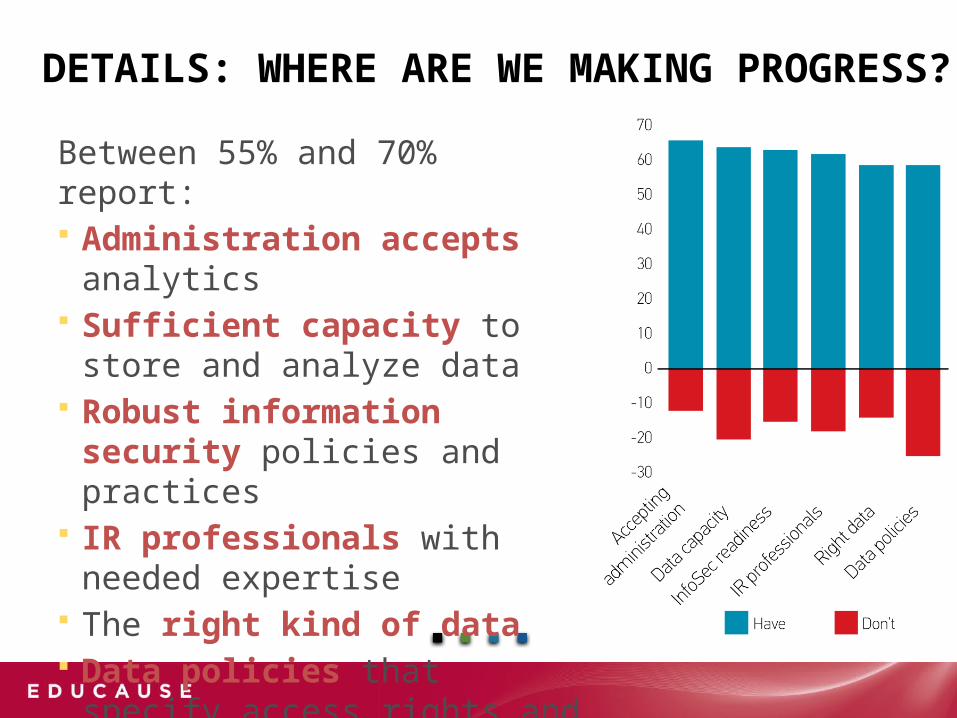
DETAILS: WHERE ARE WE MAKING PROGRESS?
Between 55% and 70% report: Administration accepts analytics Sufficient capacity to store and
analyze data Robust information security
policies and practices IR professionals with needed
expertise The right kind of data Data policies that specify access
rights and privileges
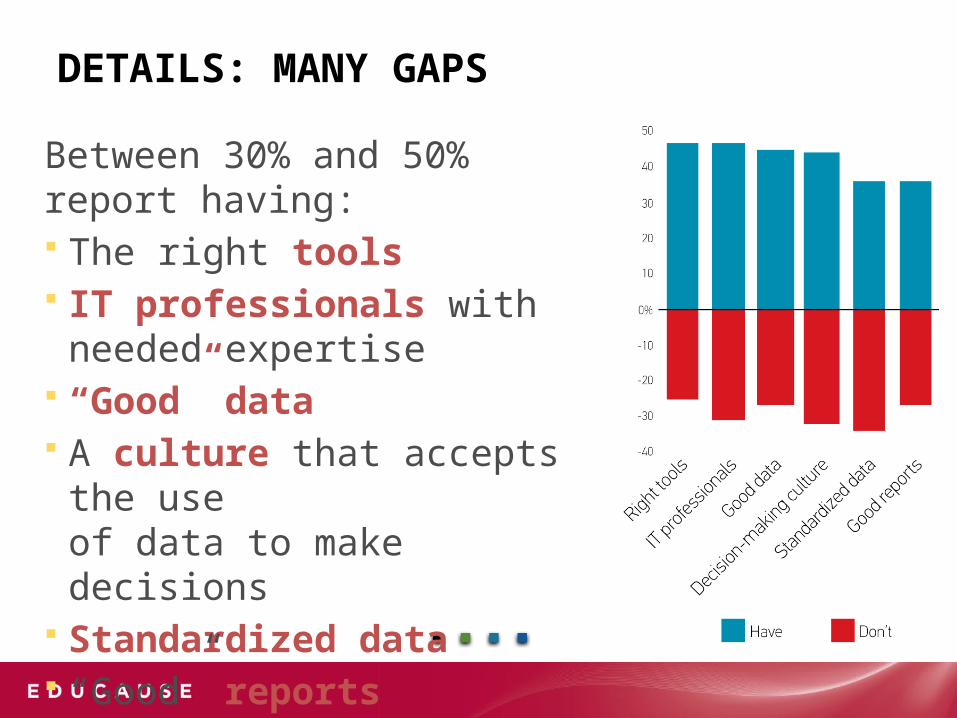
DETAILS: MANY GAPS
Between 30% and 50% report having: The right tools IT professionals with needed
expertise “Good” data A culture that accepts the use
of data to make decisions Standardized data “Good” reports
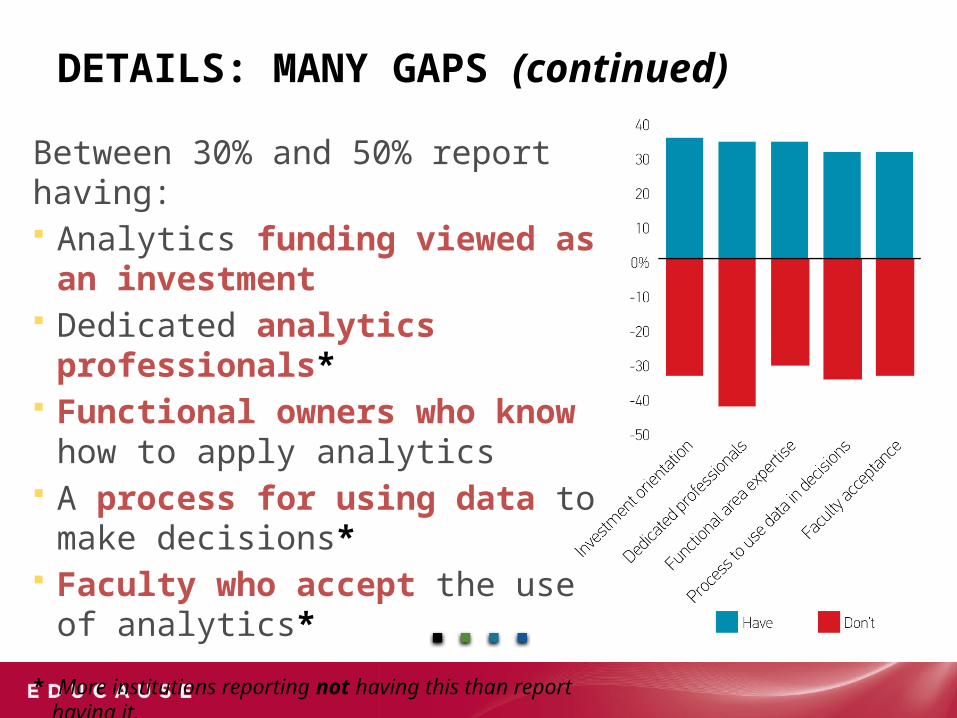
DETAILS: MANY GAPS (continued)
Between 30% and 50% report having: Analytics funding viewed as an
investment Dedicated analytics professionals* Functional owners who know how
to apply analytics A process for using data to make
decisions* Faculty who accept the use of
analytics*
* More institutions reporting not having this than report having it.
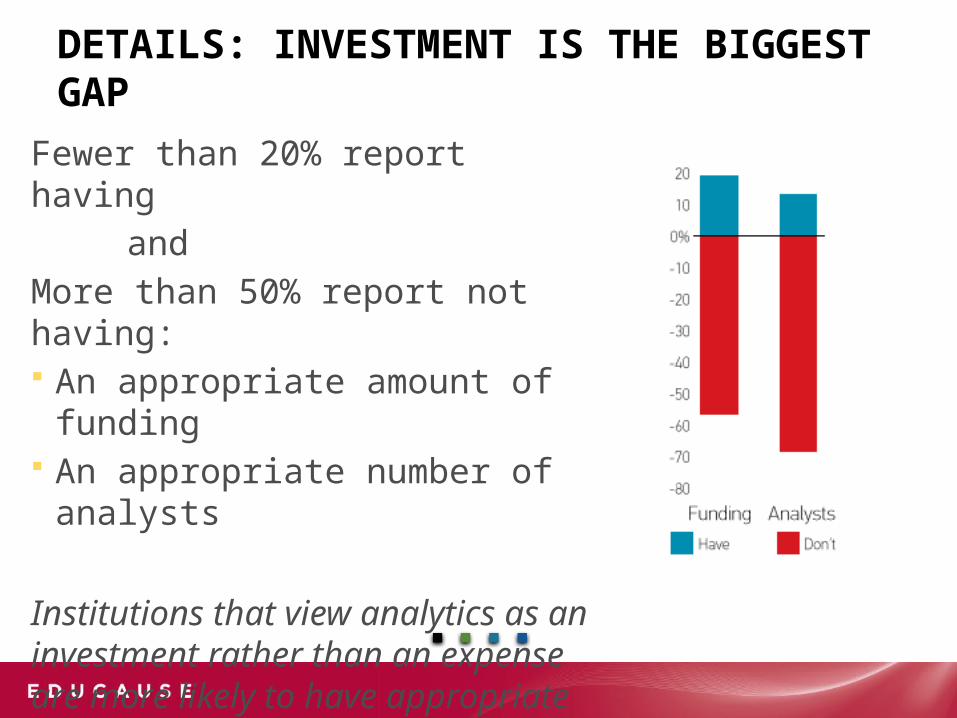
DETAILS: INVESTMENT IS THE BIGGEST GAP
Fewer than 20% report having
and
More than 50% report not having: An appropriate amount of funding An appropriate number of analysts
Institutions that view analytics as an investment rather than an expense are more likely to have appropriate funding in place.
ONCE AGAIN, LEADERSHIP IS THE MAGIC INGREDIENT
Senior leaders need to make analytics a priority Institutions that place a higher priority on analytics
are further ahead with Culture Investment Expertise Infrastructure …but not Data
SUMMARY AND FINAL POINTS
Analytics is widely viewed as important IR and IT are both critical partners
IT is more optimistic than IR regarding the potential of analytics
IT rates maturity higher on Culture and Infrastructure IR rates maturity higher on Expertise Focus group analysis suggests that great analytics
programs have good communication between IR and IT
SUMMARY AND FINAL POINTS
Analytics activities are occurring throughout institutions, but student and financial areas are the most active
Least optimism that analytics can be used to lower HE costs…but promise is seen in optimizing resource usage
The big challenge: How can higher education afford analytics? (Hint: Think investment)