Embed Size (px)
Citation preview
R E S EARCH ART I C L E
ANTHROPOLOGY
1Australian Centre for Ancient DNA, School of Biological Sciences and The EnvironmentInstitute, The University of Adelaide, Adelaide, South Australia 5005, Australia. 2Departmentof Anthropology, University of California, Santa Cruz, Santa Cruz, CA 95064, USA. 3Depart-ment of Genetics, Harvard Medical School, Boston, MA 02115, USA. 4Broad Institute ofHarvard and MIT, Cambridge, MA 02142, USA. 5Howard Hughes Medical Institute, Boston,MA 20815, USA. 6Department of Archaeology and History, La Trobe University, Melbourne,Victoria 3086, Australia. 7School of Mathematical Sciences, The University of Adelaide,Adelaide, South Australia 5005, Australia. 8Museo de Sitio Huaca Pucllana, Miraflores,Lima 18, Peru. 9Departamento de Humanidades, Pontificia Universidad Católica del Perú,Lima 32, Peru. 10Centro de Investigaciones Arqueológicas del Museo de Sitio de Ancón,Lima 38, Peru. 11Instituto Nacional de Antropología e Historia, Ciudad de Mexico, MexicoCity 6500, Mexico. 12Unidad de Arqueología y Museos, Ministerio de Culturas y Turismode Bolivia, La Paz 3165, Bolivia. 13Universidad de Magallanes, Punta Arenas 6210427, Chile.14Peabody Museum of Archaeology and Ethnology at Harvard University, Boston, MA02138, USA. 15Instituto de Investigaciones de Alta Montaña, Universidad Católica de Salta,Salta 4400, Argentina. 16Consejo Nacional de Investigaciones Científicas y Técnicas, GodoyCruz 2290, Cdad. Autónoma de Buenos Aires, Argentina. 17National Geographic Society,Washington, DC 20036, USA. 18Instituto de Investigaciones Arqueológicas y Paleontológicasdel Cuaternario Pampeano–Consejo Nacional de Investigaciones Científicas y Técnicas,Universidad Nacional del Centro de la Provincia de Buenos Aires, 7600 Olavarría, Argentina.19Instituto de Alta Investigación, Universidad de Tarapacá, Arica 1000000, Chile. 20School ofBiological Sciences, University of Sydney, Sydney, New South Wales 2006, Australia.*Corresponding author. E-mail: [email protected] (B.L.); [email protected] (A.C.); [email protected] (W.H.)†These authors contributed equally to this work.‡Present address: Department of Integrative Biology, University of Texas at Austin, Austin,TX 78712, USA.§Equal senior authors.¶Present address:Max Planck Institute for the ScienceofHumanHistory, Jena 07745, Germany.
Llamas et al. Sci. Adv. 2016; 2 : e1501385 1 April 2016
2016 © The Authors, some rights reserved;
exclusive licensee American Association for
the Advancement of Science. Distributed
under a Creative Commons Attribution
NonCommercial License 4.0 (CC BY-NC).
10.1126/sciadv.1501385
Ancient mitochondrial DNA provides high-resolutiontime scale of the peopling of the Americas
Bastien Llamas,1*† Lars Fehren-Schmitz,2† Guido Valverde,1 Julien Soubrier,1 Swapan Mallick,3,4,5 Nadin Rohland,3,4,5Susanne Nordenfelt,3,4,5 Cristina Valdiosera,6 Stephen M. Richards,1 Adam Rohrlach,7 Maria Inés Barreto Romero,8
Isabel Flores Espinoza,8 Elsa Tomasto Cagigao,9 Lucía Watson Jiménez,9,10 Krzysztof Makowski,9
Ilán Santiago Leboreiro Reyna,11 Josefina Mansilla Lory,11 Julio Alejandro Ballivián Torrez,12 Mario A. Rivera,13
Richard L. Burger,14 Maria Constanza Ceruti,15,16 Johan Reinhard,17 R. Spencer Wells,17‡ Gustavo Politis,18
Calogero M. Santoro,19 Vivien G. Standen,19 Colin Smith,6 David Reich,3,4,5 Simon Y. W. Ho,20
Alan Cooper,1*§ Wolfgang Haak1*§¶
http://advancesD
ownloaded from
The exact timing, route, and process of the initial peopling of the Americas remains uncertain despite much research.Archaeological evidence indicates the presence of humans as far as southern Chile by 14.6 thousand years ago (ka),shortly after the Pleistocene ice sheets blocking access from eastern Beringia began to retreat. Genetic estimates ofthe timing and route of entry have been constrained by the lack of suitable calibration points and low geneticdiversity of Native Americans. We sequenced 92 whole mitochondrial genomes from pre-Columbian South Americanskeletons dating from 8.6 to 0.5 ka, allowing a detailed, temporally calibrated reconstruction of the peopling of theAmericas in a Bayesian coalescent analysis. The data suggest that a small population entered the Americas via acoastal route around 16.0 ka, following previous isolation in eastern Beringia for ~2.4 to 9 thousand years afterseparation from eastern Siberian populations. Following a rapid movement throughout the Americas, limited geneflow in South America resulted in a marked phylogeographic structure of populations, which persisted through time.All of the ancient mitochondrial lineages detected in this study were absent from modern data sets, suggesting ahigh extinction rate. To investigate this further, we applied a novel principal components multiple logistic regressiontest to Bayesian serial coalescent simulations. The analysis supported a scenario in which European colonizationcaused a substantial loss of pre-Columbian lineages.
.scienc
INTRODUCTIONoem
ag.org/
The geographic isolation of the Americas delayed human settlementuntil the end of the Pleistocene [20 to 10 thousand years ago (ka)]; how-ever, despite this relatively recent date, the specific time, place, and
n June 5, 2018
route of entry remain uncertain. It is likely that the first peoplesmoved from Asia across the Bering Land Bridge (1, 2), the landmassbetween Eurasia and America exposed by lowered sea levels duringthe Last Glacial Maximum (LGM). However, at this time, much of north-ern North America was covered by the Cordilleran and Laurentide icesheets, which blocked access from eastern Beringia (Bering Land Bridgeand Alaska/Yukon) southward to the rest of the Americas (Fig. 1A).Shortly after the Cordilleran ice sheet began to retreat ~17 ka (3), a po-tential Pacific coastal route became available ~15 ka (Fig. 1B) (3, 4),whereas an alternative route through an inland ice-free corridor alongthe eastern side of the Rocky Mountains opened around ~11.5 to 11 ka(4–6). The timing and route used in the migration event are importantin understanding the size, number, and speed of the first migratorywave(s). Timing and route are also pivotal in resolving contentiousissues such as the nature of peoples before Clovis—the first wide-spread archaeologically recognized culture in North America (13.2to 12.8 ka) (1).
Genetic studies of Native American populations are complicatedby the demographic collapse and presumed major loss of genetic di-versity following European colonization at the end of the 15th century(7). However, geographically widespread signals of low diversity andshared ancestry (8–13)—particularly striking in maternally inheritedmitochondrial and paternally inherited Y-chromosome sequence data—suggest that small founding groups possibly initially entered the Amer-icas in a single migration event that gave rise to most of the ancestryof Native Americans today (9, 12, 14). In contrast, the distribution ofsome of the rare founding mitochondrial haplogroups (D4h3a along
1 of 10
R E S EARCH ART I C L E
on June 5, 2018http://advances.sciencem
ag.org/D
ownloaded from
the Pacific coast of North and South America, and X2a in northwest-ern North America) suggests that distinct migrations along the coastalroute and the ice-free corridor occurred within less than 2000 years(15). Recent studies have identified a weak Australasian genomicsignature in several Native American groups from the Amazon,compatible with two founding migrations (16), although the Austra-lasian gene flow may have occurred after the initial peopling (17). Ir-respective of the number of migration waves, the founding populationappears to have rapidly grown and expanded southward (8, 14, 18),with low levels of gene flow between areas following initial dispersion(12, 14).
Llamas et al. Sci. Adv. 2016; 2 : e1501385 1 April 2016
Unfortunately, the precision of molecular clock studies in theAmericas to date has been limited by the low genetic diversity andlack of appropriate calibration points to accurately estimate rates ofmolecular evolution. As a result, current mitochondrial molecularclock estimates of the initial entry into the Americas, which assumethat the event corresponds to the initial diversification of NativeAmerican genetic lineages, range from 26.3 to 9.7 ka (Fig. 2A). Thisbroad range spans most of the time frame over which the Bering Land
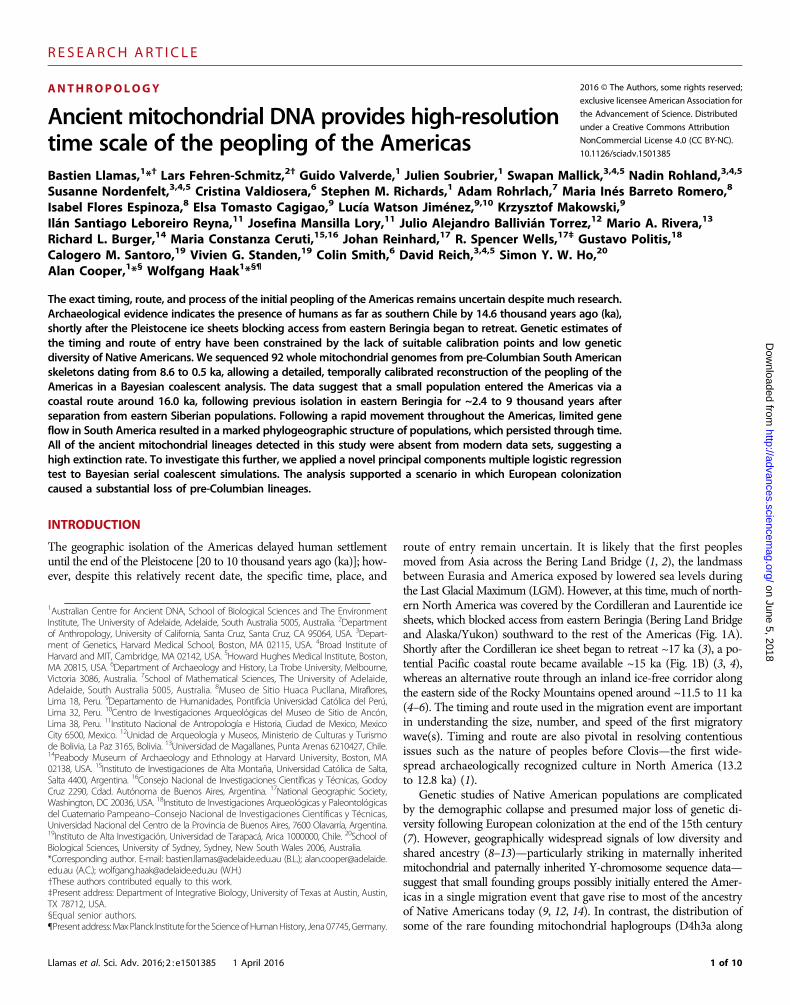
Fig. 1. Eastern Beringia during the LGM and retreat of the ice sheets.(A) Exposed land when sea levels were lowest (light green), modern-daylandmass (dark green), and ice sheets (white). At the height of the LGM, theLaurentide and Cordilleran ice sheets blocked access to the Americas fromeastern Beringia (that is, the Bering Land Bridge and Alaska/Yukon) (30).Populations west of the Bering Land Bridge were able to migrate south-ward during the LGM, but those on the Bering Land Bridge were unable toretreat farther than the Aleutian ice belt (arrows). The last point of detectablegene flow between Siberian and Native American ancestral populations(24.9 ka) and the geographic isolation marked by the formation of NativeAmerican founder lineages (18.4 ka) are shown (see Fig. 2B for details). TheYana Rhinoceros Horn site (32 ka) and the Swan Point site (14 ka) illustratethe temporal and geographic gaps in the Beringian archaeological record.(B) The ice sheets that began to retreat ~17 ka, opening a potential Pacificcoastal route by ~15 ka (arrow). The rapid population expansion (16.0 ka)likely marks the movement south of the ice (see Fig. 3C for details).
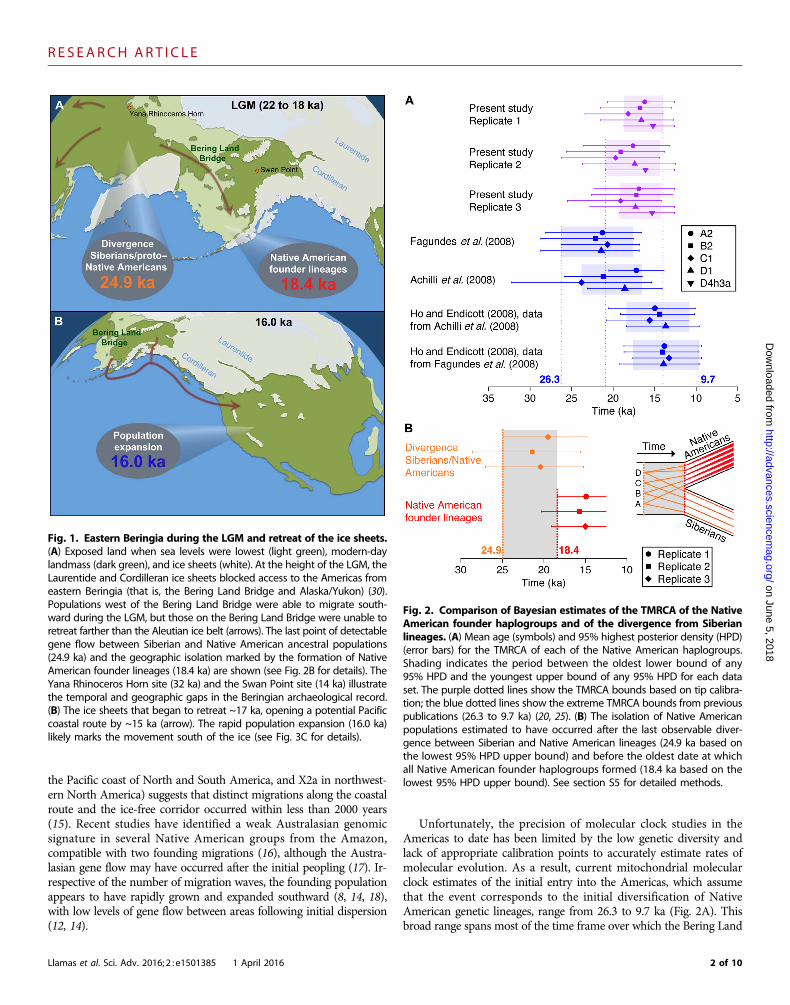
Fig. 2. Comparison of Bayesian estimates of the TMRCA of the NativeAmerican founder haplogroups and of the divergence from Siberianlineages. (A) Mean age (symbols) and 95% highest posterior density (HPD)(error bars) for the TMRCA of each of the Native American haplogroups.Shading indicates the period between the oldest lower bound of any95% HPD and the youngest upper bound of any 95% HPD for each dataset. The purple dotted lines show the TMRCA bounds based on tip calibra-tion; the blue dotted lines show the extreme TMRCA bounds from previouspublications (26.3 to 9.7 ka) (20, 25). (B) The isolation of Native Americanpopulations estimated to have occurred after the last observable diver-gence between Siberian and Native American lineages (24.9 ka based onthe lowest 95% HPD upper bound) and before the oldest date at whichall Native American founder haplogroups formed (18.4 ka based on thelowest 95% HPD upper bound). See section S5 for detailed methods.
2 of 10
R E S EARCH ART I C L E
http://D
ownloaded from
Bridge route was feasible. Given the narrow temporal span of the ac-tual diversification and migration into the Americas, much greaterprecision is needed to distinguish between different migration routesand hypotheses.
Molecular clocks highly depend on the quality of calibration pointsto accurately estimate rates of molecular evolution (19). In the Amer-icas, the scarce evidence of early human occupation and the absence ofsites in eastern Beringia for most of the late Pleistocene hinder reliablecalibration. An additional major challenge is the temporal dependenceof molecular rate estimates, whereby molecular evolution appearsmore rapid when measured over short time intervals (19). In humans,this problem is most apparent when recent time scales (for example,the human settlement of the Americas) are analyzed using deep fossilcalibrations such as the human-chimpanzee split ~6 to 7 million yearsago (20). Accurate molecular rate estimates require a distribution ofcalibration points close to the age of events under study (21, 22); inthis regard, ancient DNA sequences from dated skeletons provide suit-able tip calibrations for studying recent evolutionary events (23).
To generate a detailed view of human matrilineal genetic diversityin the Americas through time, with multiple calibration points, we se-quenced the complete mitochondrial genome (mitogenome) of 92pre-Columbian individuals, ranging in age from ~8.6 to 0.5 ka (tableS2). We then used Bayesian approaches to estimate coalescence times,reconstruct a demographic history, and simulate and test populationscenarios.
on June 5, 2018advances.sciencem
ag.org/
RESULTS AND DISCUSSION
Novel genetic diversity in pre-Columbian timesThe 92 pre-Columbian mitogenomes were sequenced to an averagecoverage depth of 112× (5.6× to 854.2×; table S2). Sequences were as-signed to 84 distinct haplotypes, which fell within the expected overallmitochondrial diversity of Native South Americans (13), that is,haplogroups A2, B2, C1b, C1c, C1d, and D1 (figs. S2 to S5). The Na-tive South American haplogroup D4h3a was not observed in our an-cient data set, although we sampled the South American southerncone (Arroyo Seco 2, Argentina) where this lineage is common today(15). None of the 84 haplotypes identified from ancient samples arerepresented in the existing genealogy of global human mitochondrialdiversity [that is, PhyloTree mt; (24)] (figs. S2 to S5) or in the literature(fig. S6). Although modern Native American genetic diversity is not wellcharacterized, this result clearly illustrates the importance of samplingpre-Columbian specimens to fully measure the past genetic diversityand to reconstruct the process of the peopling of the Americas.
Marked synchronicity of the Native South Americanhaplogroup times to most recent common ancestorThe estimated times to most recent common ancestor (TMRCA) forhaplogroups A2, B2, C1, D1, and D4h3a were highly synchronous(Fig. 3 and fig. S8), confirming previous interpretations that all fivehaplogroups were part of one initial population (25). The TMRCA fellwithin the range of previous molecular date estimates, although thenarrower 95% credible intervals considerably increased the precision(Fig. 2A). Older dates for the initial diversification within each haplo-group have been previously calculated using the human-chimpanzeecalibration (25, 26), whereas much younger dates resulted from cali-brations using non–Native American mitochondrial lineages asso-
Llamas et al. Sci. Adv. 2016; 2 : e1501385 1 April 2016
ciated with biogeographic events (20). This clearly illustrates theimpact of time-dependent rate estimates and the critical influence ofthe calibration framework (27). Our use of a large number of tempo-rally and phylogenetically distributed tip dates provides an accuratecalibration of the molecular rates relevant to Native American earlyhistory (28), allowing a uniquely precise timeline for the peopling ofthe Americas.
Separation from Siberian populations during the LGMThe most recent genetic divergence observed between the ancestorsof Siberians and Native Americans (24.9 ka; section S5 and Fig. 2B) isthe last point at which we can detect apparent gene flow (that is, ashared lineage) between the Siberian population and the ancestral Na-tive American population. We can assume that the real populationdivergence occurred after this point. In addition, if we accept that theestimated TMRCA of each of the five Native American haplogroupsprovides an independent estimate of the timing of the same small pop-ulation’s isolation, we can use the 95% credible intervals to constrainthe lower bound (section S5). The resulting estimate that the two pop-ulations became fully isolated between 24.9 and 18.4 ka is in accord-ance with calculations frommodern complete genomes which indicatethat Siberians and Native Americans split no later than ~23 ka (17).Gene flow to and from east Siberia certainly appears to have ceased bythe height of the LGM (18.4 ka; Fig. 2B).
Eastern Beringia as a sustainable refugium for ancestralNative AmericansOur data cannot determine whether the separation between Siberianand Native American ancestral populations occurred in Siberia orBeringia. However, the start of isolation (24.9 to 18.4 ka) closely co-incides with the LGM. We hypothesize that cold arid conditions drovepopulations on the western (that is, Siberian) margins of the Bering LandBridge to migrate to southern refugia (Fig. 1A), as suggested by theabsence of megafauna kill sites younger than the far north Yana Rhinoc-eros Horn site 32 ka (1). In contrast, any populations east of theKamchatka and Chukotka Peninsulas would not have been able toretreat farther south than the Aleutian ice belt and would thus remainisolated in eastern Beringia (Fig. 1A). We cannot accurately estimatethe size of this founding population, but the effective female popula-tion that subsequently entered the Americas appears to be ~2000, whichaccords well with previous studies (9, 10, 25). Although this numbercannot be directly translated into census population size, it suggeststhat the human population isolated in eastern Beringia was relativelysmall, probably not exceeding a few tens of thousands of people (sec-tion S6). The presence of large numbers of megafauna in easternBeringia during the late Pleistocene, including the LGM, indicatesan ice-free region dominated by shrub tundra (29), which would havebeen more than capable of sustaining such a population size (sectionS6). Thus, our observations are consistent with the idea that the found-ing Native American population used the exposed Bering Land Bridgeand adjacent regions in Alaska/Yukon as a refugium during the heightof the LGM, before climatic change and the retreat of the ice sheetsallowed access to the remainder of the Americas. Unfortunately, thelarge temporal and geographic gaps in the archaeological record be-tween the Yana Rhinoceros Horn site (~32 ka, western Beringia) andthe Swan Point site (~14 ka, eastern Beringia) provide little additionalinformation about this process (Fig. 1A) (1) or how the ancestral NativeAmericans were isolated from their Asian counterparts.
3 of 10
R E S EARCH ART I C L E
on June 5, 2018http://advances.sciencem
ag.org/D
ownloaded from
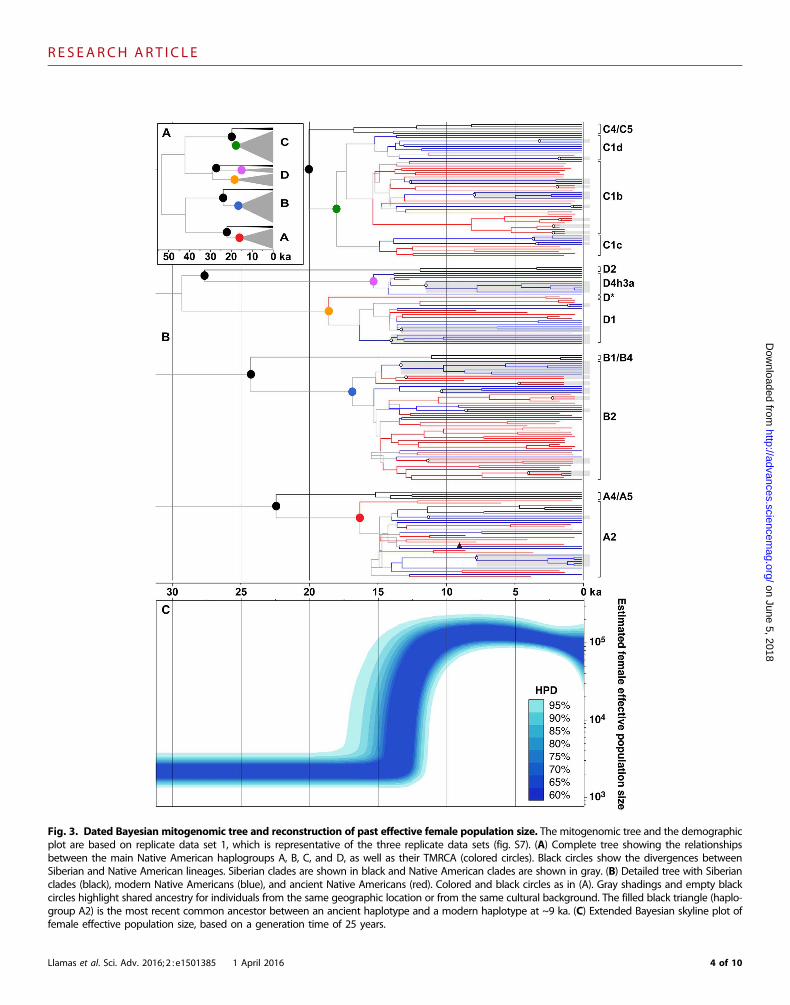
Fig. 3. Dated Bayesian mitogenomic tree and reconstruction of past effective female population size. The mitogenomic tree and the demographicplot are based on replicate data set 1, which is representative of the three replicate data sets (fig. S7). (A) Complete tree showing the relationshipsbetween the main Native American haplogroups A, B, C, and D, as well as their TMRCA (colored circles). Black circles show the divergences betweenSiberian and Native American lineages. Siberian clades are shown in black and Native American clades are shown in gray. (B) Detailed tree with Siberianclades (black), modern Native Americans (blue), and ancient Native Americans (red). Colored and black circles as in (A). Gray shadings and empty blackcircles highlight shared ancestry for individuals from the same geographic location or from the same cultural background. The filled black triangle (haplo-group A2) is the most recent common ancestor between an ancient haplotype and a modern haplotype at ~9 ka. (C) Extended Bayesian skyline plot offemale effective population size, based on a generation time of 25 years.
Llamas et al. Sci. Adv. 2016; 2 : e1501385 1 April 2016 4 of 10
R E S EARCH ART I C L E
on June 5, 2018http://advances.sciencem
ag.org/D
ownloaded from
The Beringian Standstill (~2.4 to 9 thousand years)The scenario of an Eastern Beringia refugium is consistent with theBeringian standstill hypothesis, which suggests that the ancestral Na-tive Americans were isolated in the area for up to 15 thousand years(ky) (9, 10, 29). Our large data set of dated mitogenomes providestight estimates for the duration of the standstill and the subsequentmovement out of the area. The mitogenomic tree shows a sudden burstof lineage diversification starting ~16.0 to 13.0 ka (Fig. 3B). This isfollowed by a steep increase in the mean female effective populationsize (>10%) between adjacent time bins starting 16.0 ka (Fig. 3C).Overall, the population underwent a 60-fold increase between 16.0 and13.0 ka, suggesting that 16.0 ka represents the initial entry into theAmericas, where population size significantly increased in a more fa-vorable environment. Considering the time between isolation (24.9 to18.4 ka) and entry (16.0 ka), the improved temporal resolution pro-vided by our data suggests that the Beringian Standstill could have beenas short as ~2.4 ky, and no longer than ~9 ky, consistent with re-cent estimates based on autosomal data from complete modern-daygenomes (17).
A coastal entry routeThe population burst at 16.0 ka is contemporaneous with the rapidretreat of coastal glaciers along the northwest Pacific coast associatedwith a phase of stepwise ocean warming (2° to 3°C) in the region (3).This date considerably predates the opening of the inland ice-free cor-ridor ~11.5 to 11.0 ka (4–6) and indicates that the initial entry into theAmericas took place via a southward expansion along recentlyemerged northwest Pacific coastal land (Fig. 1B) (3, 17, 28, 30, 31). Giventhe early archaeological sites in Monte Verde in southern Chile at14.6 ka (32), the mitogenome data indicate that the transit of the fulllength of the Americas took around 1.4 ky.
Early geographic structure after entry into the AmericasThe phylogenetic trees feature multiple long branches stemming fromthe initial expansion period (Fig. 3B), irrespective of whether the line-ages lead to pre-Columbian (ancient) or modern-day individuals. Thistopology appears to reflect the swift migration and expansion of apopulation, which contained each major haplogroup, into and through-out the Americas (8, 14, 18). Subsequent lineage diversification withineach haplogroup appears to be constrained to within specific geographicregions or shared cultural backgrounds (Fig. 3B, gray shadings), whichis consistent with suggestions that geographic structure was rapidlyestablished after colonization and was thereafter followed by limitedgene flow between populations from diverse regions (14, 33).
Extinction of ancient lineages after European colonizationIt has been suggested that European colonization resulted in a bottle-neck in Native American genetic diversity (34, 35). In the present dataset, it is notable that no ancient haplotype (Fig. 3B, red lineages)shared a common ancestor with a modern haplotype (Fig. 3B, bluelineages) more recently than ~9.0 ka (Fig. 3B, black triangle in haplo-group A2), despite the number of samples examined from both popu-lations. Our ancient samples were principally derived from largepopulation centers along the western coast of South America, whichexperienced high extinction rates following European colonization.Historic accounts have reported that the population decline wasmore rapid and intense in the Gulf of Mexico and the Pacific coastof Peru than in other areas such as the Mesoamerican plateau or the
Llamas et al. Sci. Adv. 2016; 2 : e1501385 1 April 2016
Andean highlands (7). The pronounced phylogeographic structureobserved in Native American mitogenomes suggests that suchdemographic events could have removed major portions of genetic di-versity in certain areas. As a result, it is possible that the lack of overlapbetween ancient and modern haplotypes is influenced by the under-sampling of modern-day diversity in the source regions of the ar-chaeological material.
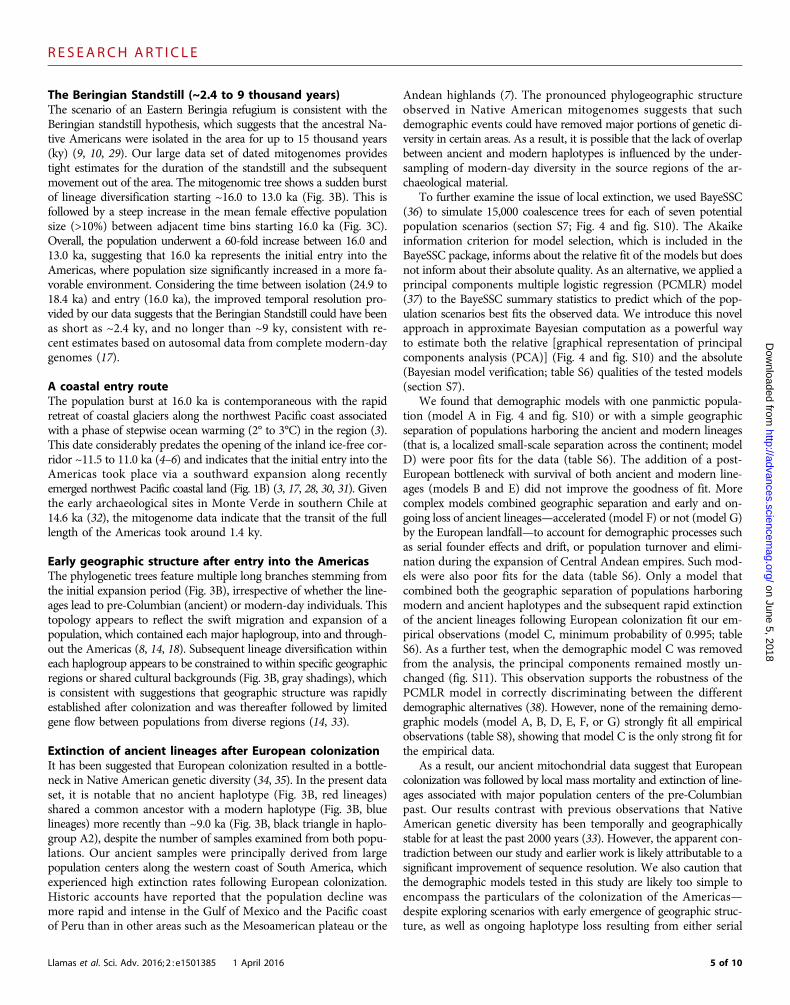
To further examine the issue of local extinction, we used BayeSSC(36) to simulate 15,000 coalescence trees for each of seven potentialpopulation scenarios (section S7; Fig. 4 and fig. S10). The Akaikeinformation criterion for model selection, which is included in theBayeSSC package, informs about the relative fit of the models but doesnot inform about their absolute quality. As an alternative, we applied aprincipal components multiple logistic regression (PCMLR) model(37) to the BayeSSC summary statistics to predict which of the pop-ulation scenarios best fits the observed data. We introduce this novelapproach in approximate Bayesian computation as a powerful wayto estimate both the relative [graphical representation of principalcomponents analysis (PCA)] (Fig. 4 and fig. S10) and the absolute(Bayesian model verification; table S6) qualities of the tested models(section S7).
We found that demographic models with one panmictic popula-tion (model A in Fig. 4 and fig. S10) or with a simple geographicseparation of populations harboring the ancient and modern lineages(that is, a localized small-scale separation across the continent; modelD) were poor fits for the data (table S6). The addition of a post-European bottleneck with survival of both ancient and modern line-ages (models B and E) did not improve the goodness of fit. Morecomplex models combined geographic separation and early and on-going loss of ancient lineages—accelerated (model F) or not (model G)by the European landfall—to account for demographic processes suchas serial founder effects and drift, or population turnover and elimi-nation during the expansion of Central Andean empires. Such mod-els were also poor fits for the data (table S6). Only a model thatcombined both the geographic separation of populations harboringmodern and ancient haplotypes and the subsequent rapid extinctionof the ancient lineages following European colonization fit our em-pirical observations (model C, minimum probability of 0.995; tableS6). As a further test, when the demographic model C was removedfrom the analysis, the principal components remained mostly un-changed (fig. S11). This observation supports the robustness of thePCMLR model in correctly discriminating between the differentdemographic alternatives (38). However, none of the remaining demo-graphic models (model A, B, D, E, F, or G) strongly fit all empiricalobservations (table S8), showing that model C is the only strong fit forthe empirical data.
As a result, our ancient mitochondrial data suggest that Europeancolonization was followed by local mass mortality and extinction of line-ages associated with major population centers of the pre-Columbianpast. Our results contrast with previous observations that NativeAmerican genetic diversity has been temporally and geographicallystable for at least the past 2000 years (33). However, the apparent con-tradiction between our study and earlier work is likely attributable to asignificant improvement of sequence resolution. We also caution thatthe demographic models tested in this study are likely too simple toencompass the particulars of the colonization of the Americas—despite exploring scenarios with early emergence of geographic struc-ture, as well as ongoing haplotype loss resulting from either serial
5 of 10
R E S EARCH ART I C L E
on June 5, 2018http://advances.sciencem
ag.org/D
ownloaded from
founder effects and drift, or population displacement and eliminationduring the expansion of major Central Andean imperial states. Finally,more complete mitochondrial sequence data from early and modern-day populations will be needed to further refine the demographicmodels. In particular, it will be critical to ensure a strong spatialoverlap between archaeological sites and present-day population loca-tions (for example, Peru).
Llamas et al. Sci. Adv. 2016; 2 : e1501385 1 April 2016
CONCLUSION
The additional resolving power gained from widespread temporalcalibrations makes ancient mitochondrial DNA data from SouthAmerica a very cost-effective approach to examining the precise tim-ing, route, and sequence of events that led to the peopling of theAmericas. In addition, this data set provides a genetic view of thepossible role played by European colonization in reducing the overall
Fig. 4. Effects of population structure and European colonization on South American mitochondrial diversity. Seven population scenarios simu-lated with BayeSSC are represented (models A to G). The arrowheads in demographic models C to G represent the time of separation (9 ka) between thepopulation carrying modern haplotypes (Population 0) and the population carrying ancient haplotypes (Population 1) (that is, meta-demes with a patternof localized small-scale separation across the continent). The bottom-right panel is a PCA plot of summary statistics for the 15,000 simulations for each ofthe seven models (25% of simulated data are reported; see fig. S10 for the full data set). Observed data from the three replicates are shown as black circlesand fall closest to results from model C (green points).
6 of 10
R E S EARCH ART I C L E
Native American genetic diversity to the low levels observed today.In the absence of archaeological evidence in southern and easternBeringia that is relevant to the peopling of the Americas, further res-olution of the entry and routes of dispersal of the early settlers will bepossible with ancient genomic data from South America.
on June 5, 2018http://advances.sciencem
ag.org/D
ownloaded from
MATERIALS AND METHODS
Archaeological samplesMost of the archaeological samples were collected in the Central Andesfrom sites in Peru (n = 70), western Bolivia (n = 9), and northernChile (n = 6), whereas the remaining samples came from northernMexico (n = 5) and the Argentinian Pampas (n = 2) (fig. S1 and tableS2). Permissions from respective National Heritage organizations wereobtained for all archaeological material analyzed in the study (sectionS1) and are available upon request. Radiocarbon dates were eitherpublished previously (39, 40) or obtained from the Oxford Radio-carbon Unit to confirm the archaeological assignation based on strat-ification and examination of artefacts (table S1).
Ancient DNA analysisAll ancient DNA work was conducted in clean-room facilities of theAustralian Centre for Ancient DNA (ACAD) at the University ofAdelaide, the Human Paleogenomics laboratory at the Universityof California at Santa Cruz (UCSC), and the Reich laboratory at Har-vard Medical School (HMS). DNA contamination control measuresare detailed in section S1. DNA was extracted using silica in solution(22, 41) and converted into double-stranded libraries with truncatedIllumina adapters (42). RNA or DNA baits were used for hybridiza-tion capture, followed by Illumina high-throughput sequencing(sections S1 to S4). Automated variant calls were confirmed by eyedirectly from the read pileups to avoid errors attributable to DNAdamage (sections S2 and S4).
BEAST analysisWe used a Bayesian approach to estimate mitogenome coalescencetimes from the complete data using BEAST 1.8.0 (43) and recon-structed a demographic history via the extended Bayesian skylinemethod (44), which infers effective population size. Three randomsubsets of 87 modern South American and Mexican mitogenomeswere used with the ancient data in replicate analyses. To estimatethe date of separation from Old World populations, we also added 20of the most closely related east Siberian mitogenomes. The previouslypublished 12.6-ky Anzick-1 genome from Montana, United States (45),was included to provide genetic diversity for haplogroup D4h3a and toincrease the depth of calibration points.We combinedmodern and datedancient mitogenomes and analyzed three replicate data sets of 200 se-quences. The 93 ancient samples (including 12 sequences older than3.5 ky) ensured temporal (12.6 to 0.5 ka) and phylogenetic coverage(Fig. 3B), allowing internal calibration of the substitution rate for eachSouthAmerican haplogroup (fig. S9). Details are provided in section S5.
BayeSSC and model testingWe used BayeSSC (36) to simulate data for seven population scenarios(Fig. 4): one panmictic population without (model A) or with a post-European bottleneck (model B), or geographic separation (9 ka) of par-allel populations featuring modern or ancient haplotypes (model D);
Llamas et al. Sci. Adv. 2016; 2 : e1501385 1 April 2016
geographic separation can be followed by either a post-Europeanbottleneck for both populations (model E), a complete extinction ofancient lineages after contact with Europeans (model C), an early andprogressive loss of lineages leading to extinction of ancient lineages(model G), or an early and progressive loss of ancient lineages followedby a rapid post-European extinction (model F). We calculated within-deme (Tajima’s D, haplotype diversity, number of haplotypes, etc.)and between-deme [Fixation index (FST), average pairwise distances]statistics for the observed and simulated data. We then performed aPCA to remove colinearity between the summary statistics, because theyare likely to be correlated (37, 46), using the princomp function inR (47).Finally, we fit a multiple logistic regression model (37) in which the re-sponse variablewas themodel underwhich the datawere simulated andthe explanatory variables were the first five principal components. Thisapproach predicted which scenario was the most likely to have produceddata like those that we observed. Details are provided in section S7.
SUPPLEMENTARY MATERIALSSupplementary material for this article is available at http://advances.sciencemag.org/cgi/content/full/2/4/e1501385/DC1Supplementary Materials and MethodsSection S1. Archaeological samples, radiocarbon dating, and DNA contamination controlSection S2. DNA extraction, library preparation, and mitochondrial capture (ACAD)Section S3. DNA extraction and library preparation (UCSC Human Paleogenomics laboratoryand HMS Reich laboratory)Section S4. Mitochondrial DNA capture (HMS Reich laboratory)Section S5. Bayesian phylogenetic analysis of mitochondrial dataSection S6. Ecological assessment of population sustainability in BeringiaSection S7. Bayesian coalescent simulations and evaluation of demographic scenariosTable S1. Date calibrations for ancient mitogenome sequences.Table S2. List of ancient samples, associated metadata, and sequencing results (separate Exceldocument).Table S3. Complete list of accession numbers for modern mitogenome sequences.Table S4. Polymerase chain reaction (PCR) primers used for mitochondrial long-range PCR.Table S5. Predictive accuracy of the PCMLR model.Table S6. Prediction of the population structure model that fits the observed data.Table S7. Highest predictive accuracy of the PCMLR model for each population structuremodel when model C is removed from the analysis.Table S8. Prediction of the population structure model that fits the observed data when modelC is removed from the analysis.Fig. S1. Location of archaeological sites (see table S2 for detailed information about sites and samples).Fig. S2. Phylogenetic tree of newly sequenced ancient mitogenomes (haplogroup A).Fig. S3. Phylogenetic tree of newly sequenced ancient mitogenomes (haplogroup B).Fig. S4. Phylogenetic tree of newly sequenced ancient mitogenomes (haplogroup C).Fig. S5. Phylogenetic tree of newly sequenced ancient mitogenomes (haplogroup D).Fig. S6. Maximum parsimony phylogenetic trees of the 93 ancient mitogenomes and threereplicate data sets of the 87 modern Native American mitogenomes (see table S3).Fig. S7. Extended Bayesian skyline plots of female effective population size for the threereplicate data sets.Fig. S8. Bayesian estimates of node ages for haplogroups A2, B2, C1, D1, and D4h3a.Fig. S9. Results of the date-randomization test for temporal sampling structure.Fig. S10. PCA plot of summary statistics for the 15,000 simulations for each of the sevenmodels simulated with BayeSSC (see Fig. 4).Fig. S11. PCA plot of summary statistics for the 15,000 simulations for each of the modelssimulated with BayeSSC, when model C is removed from the PCA.References (48–86)
REFERENCES AND NOTES1. T. Goebel, M. R. Waters, D. H. O’Rourke, The late Pleistocene dispersal of modern humans
in the Americas. Science 319, 1497–1502 (2008).2. J. H. Greenberg, C. G. Turner II, S. L. Zegura, L. Campbell, J. A. Fox, W. S. Laughlin,
E. J. E. Szathmary, K. M. Weiss, E. Woolford, The settlement of the Americas: A comparisonof the linguistic, dental, and genetic evidence. Curr. Anthropol. 27, 477–497 (1986).
7 of 10
R E S EARCH ART I C L E
on June 5, 2018http://advances.sciencem
ag.org/D
ownloaded from
3. M. A. Taylor, I. L. Hendy, D. K. Pak, Deglacial ocean warming and marine margin retreat ofthe Cordilleran Ice Sheet in the North Pacific Ocean. Earth Planet. Sci. Lett. 403, 89–98(2014).
4. C. A. S. Mandryk, H. Josenhans, D. W. Fedje, R. W. Mathewes, Late quaternary paleoenviron-ments of Northwestern North America: Implications for inland versus coastal migrationroutes. Quat. Sci. Rev. 20, 301–314 (2001).
5. E. J. Gowan, An assessment of the minimum timing of ice free conditions of the westernLaurentide Ice Sheet. Quat. Sci. Rev. 75, 100–113 (2013).
6. T. G. Arnold, Radiocarbon dates from the ice-free corridor. Radiocarbon 44, 437–454(2002).
7. M. Livi-Bacci, The depopulation of Hispanic America after the conquest. Popul. Dev. Rev.32, 199–232 (2006).
8. V. Battaglia, V. Grugni, U. A. Perego, N. Angerhofer, J. E. Gomez-Palmieri, S. R. Woodward,A. Achilli, N. Myres, A. Torroni, O. Semino, The first peopling of South America: New evidencefrom Y-chromosome haplogroup Q. PLOS One 8, e71390 (2013).
9. E. Tamm, T. Kivisild, M. Reidla, M. Metspalu, D. G. Smith, C. J. Mulligan, C. M. Bravi,O. Rickards, C. Martinez-Labarga, E. K. Khusnutdinova, S. A. Fedorova, M. V. Golubenko,V. A. Stepanov, M. A. Gubina, S. I. Zhadanov, L. P. Ossipova, L. Damba, M. I. Voevoda,J. E. Dipierri, R. Villems, R. S. Malhi, Beringian standstill and spread of Native Americanfounders. PLOS One 2, e829 (2007).
10. C. J. Mulligan, A. Kitchen, M. M. Miyamoto, Updated three-stage model for the peopling ofthe Americas. PLOS One 3, e3199 (2008).
11. K. B. Schroeder, T. G. Schurr, J. C. Long, N. A. Rosenberg, M. H. Crawford, L. A. Tarskaia,L. P. Osipova, S. I. Zhadanov, D. G. Smith, A private allele ubiquitous in the Americas. Biol. Lett.3, 218–223 (2007).
12. S. Wang, C. M. Lewis Jr., M. Jakobsson, S. Ramachandran, N. Ray, G. Bedoya, W. Rojas,M. V. Parra, J. A. Molina, C. Gallo, G. Mazzotti, G. Poletti, K. Hill, A. M. Hurtado,D. Labuda, W. Klitz, R. Barrantes, M. C. Bortolini, F. M. Salzano, M. L. Petzl-Erler,L. T. Tsuneto, E. Llop, F. Rothhammer, L. Excoffier, M. W. Feldman, N. A. Rosenberg,A. Ruiz-Linares, Genetic variation and population structure in Native Americans. PLOS Genet.3, e185 (2007).
13. U. A. Perego, N. Angerhofer, M. Pala, A. Olivieri, H. Lancioni, B. H. Kashani, V. Carossa,J. E. Ekins, A. Gómez-Carballa, G. Huber, B. Zimmermann, D. Corach, N. Babudri,F. Panara, N. M. Myres, W. Parson, O. Semino, A. Salas, S. R. Woodward, A. Achilli,A. Torroni, The initial peopling of the Americas: A growing number of founding mitochondrialgenomes from Beringia. Genome Res. 20, 1174–1179 (2010).
14. D. Reich, N. Patterson, D. Campbell, A. Tandon, S. Mazieres, N. Ray, M. V. Parra, W. Rojas,C. Duque, N. Mesa, L. F. García, O. Triana, S. Blair, A. Maestre, J. C. Dib, C. M. Bravi, G. Bailliet,D. Corach, T. Hünemeier, M. Cátira Bortolini, F. M. Salzano, M. L. Petzl-Erler,V. Acuña-Alonzo, C. Aguilar-Salinas, S. Canizales-Quinteros, T. Tusié-Luna, L. Riba,M. Rodríguez-Cruz, M. Lopez-Alarcón, R. Coral-Vazquez, T. Canto-Cetina, I. Silva-Zolezzi,J. C. Fernandez-Lopez, A. V. Contreras, G. Jimenez-Sanchez, M. J. Gómez-Vázquez,J. Molina, Á. Carracedo, A. Salas, C. Gallo, G. Poletti, D. B. Witonsky, G. Alkorta-Aranburu,R. I. Sukernik, L. Osipova, S. A. Fedorova, R. Vasquez, M. Villena, C. Moreau, R. Barrantes,D. Pauls, L. Excoffier, G. Bedoya, F. Rothhammer, J.-M. Dugoujon, G. Larrouy, W. Klitz,D. Labuda, J. Kidd, K. Kidd, A. Di Rienzo, N. B. Freimer, A. L. Price, A. Ruiz-Linares, Recon-structing Native American population history. Nature 488, 370–374 (2012).
15. U. A. Perego, A. Achilli, N. Angerhofer, M. Accetturo, M. Pala, A. Olivieri, B. H. Kashani,K. H. Ritchie, R. Scozzari, Q.-P. Kong, N. M. Myres, A. Salas, O. Semino, H.-J. Bandelt,S. R. Woodward, A. Torroni, Distinctive Paleo-Indian migration routes from Beringiamarked by two rare mtDNA haplogroups. Curr. Biol. 19, 1–8 (2009).
16. P. Skoglund, S. Mallick, M. C. Bortolini, N. Chennagiri, T. Hünemeier, M. L. Petzl-Erler,F. M. Salzano, N. Patterson, D. Reich, Genetic evidence for two founding populations ofthe Americas. Nature 525, 104–108 (2015).
17. M. Raghavan, M. Steinrücken, K. Harris, S. Schiffels, S. Rasmussen, M. DeGiorgio,A. Albrechtsen, C. Valdiosera, M. C. Ávila-Arcos, A.-S. Malaspinas, A. Eriksson, I. Moltke,M. Metspalu, J. R. Homburger, J. Wall, O. E. Cornejo, J. V. Moreno-Mayar, T. S. Korneliussen,T. Pierre, M. Rasmussen, P. F. Campos, P. de Barros Damgaard, M. E. Allentoft, J. Lindo,E. Metspalu, R. Rodríguez-Varela, J. Mansilla, C. Henrickson, A. Seguin-Orlando,H. Malmström, T. Stafford Jr., S. S. Shringarpure, A. Moreno-Estrada, M. Karmin, K. Tambets,A. Bergström, Y. Xue, V. Warmuth, A. D. Friend, J. Singarayer, P. Valdes, F. Balloux, I. Leboreiro,J. L. Vera, H. Rangel-Villalobos, D. Pettener, D. Luiselli, L. G. Davis, E. Heyer, C. P. E. Zollikofer,M. S. P. de León, C. I. Smith, V. Grimes, K.-A. Pike, M. Deal, B. T. Fuller, B. Arriaza, V. Standen,M. F. Luz, F. Ricaut, N. Guidon, L. Osipova, M. I. Voevoda, O. L. Posukh, O. Balanovsky,M. Lavryashina, Y. Bogunov, E. Khusnutdinova, M. Gubina, E. Balanovska, S. Fedorova,S. Litvinov, B. Malyarchuk, M. Derenko, M. J. Mosher, D. Archer, J. Cybulski, B. Petzelt,J. Mitchell, R. Worl, P. J. Norman, P. Parham, B. M. Kemp, T. Kivisild, C. Tyler-Smith,M. S. Sandhu, M. Crawford, R. Villems, D. G. Smith, M. R. Waters, T. Goebel, J. R. Johnson,R. S. Malhi, M. Jakobsson, D. J. Meltzer, A. Manica, R. Durbin, C. D. Bustamante, Y. S. Song,R. Nielsen, E. Willerslev, Genomic evidence for the Pleistocene and recent population historyof Native Americans. Science 349, aab3884 (2015).
Llamas et al. Sci. Adv. 2016; 2 : e1501385 1 April 2016
18. M. Bodner, U. A. Perego, G. Huber, L. Fendt, A. W. Röck, B. Zimmermann, A. Olivieri,A. Gómez-Carballa, H. Lancioni, N. Angerhofer, M. C. Bobillo, D. Corach, S. R. Woodward,A. Salas, A. Achilli, A. Torroni, H.-J. Bandelt, W. Parson, Rapid coastal spread of first Americans:Novel insights from South America’s Southern Cone mitochondrial genomes. Genome Res. 22,811–820 (2012).
19. S. Y. W. Ho, R. Lanfear, L. Bromham, M. J. Phillips, J. Soubrier, A. G. Rodrigo, A. Cooper,Time-dependent rates of molecular evolution. Mol. Ecol. 20, 3087–3101 (2011).
20. S. Y. W. Ho, P. Endicott, The crucial role of calibration in molecular date estimates for thepeopling of the Americas. Am. J. Hum. Genet. 83, 142–146 (2008).
21. Q. Fu, A. Mittnik, P. L. F. Johnson, K. Bos, M. Lari, R. Bollongino, C. Sun, L. Giemsch,R. Schmitz, J. Burger, A. M. Ronchitelli, F. Martini, R. G. Cremonesi, J. Svoboda, P. Bauer,D. Caramelli, S. Castellano, D. Reich, S. Pääbo, J. Krause, A revised timescale for humanevolution based on ancient mitochondrial genomes. Curr. Biol. 23, 553–559 (2013).
22. P. Brotherton, W. Haak, J. Templeton, G. Brandt, J. Soubrier, C. J. Adler, S. M. Richards,C. Der Sarkissian, R. Ganslmeier, S. Friederich, V. Dresely, M. van Oven, R. Kenyon,M. B. Van der Hoek, J. Korlach, K. Luong, S. Y. W. Ho, L. Quintana-Murci, D. M. Behar,H. Meller, K. W. Alt, A. Cooper, S. Adhikarla, A. K. G. Prasad, R. Pitchappan,A. V. Santhakumari, E. Balanovska, O. Balanovsky, J. Bertranpetit, D. Comas, B. Martínez-Cruz,M. Melé, A. C. Clarke, E. A. Matisoo-Smith, M. C. Dulik, J. B. Gaieski, A. C. Owings, T. G. Schurr,M. G. Vilar, A. Hobbs, H. Soodyall, A. Javed, L. Parida, D. E. Platt, A. K. Royyuru, L. Jin, S. Li,M. E. Kaplan, N. C. Merchant, R. J. Mitchell, C. Renfrew, D. R. Lacerda, F. R. Santos,D. F. S. Hernanz, R. S. Wells, P. Swamikrishnan, C. Tyler-Smith, P. P. Vieira, J. S. Ziegle; forThe Genographic Consortium, Neolithic mitochondrial haplogroup H genomes and thegenetic origins of Europeans. Nat. Commun. 4, 1764 (2013).
23. S. Y. W. Ho, S. Duchêne, Molecular-clock methods for estimating evolutionary rates andtimescales. Mol. Ecol. 23, 5947–5965 (2014).
24. M. van Oven, M. Kayser, Updated comprehensive phylogenetic tree of global human mito-chondrial DNA variation. Hum. Mutat. 30, E386–E394 (2009).
25. N. J. R. Fagundes, R. Kanitz, R. Eckert, A. C. S. Valls, M. R. Bogo, F. M. Salzano, D. G. Smith,W. A. Silva Jr., M. A. Zago, A. K. Ribeiro-dos-Santos, S. E. B. Santos, M. L. Petzl-Erler,S. L. Bonatto, Mitochondrial population genomics supports a single pre-Clovis origin witha coastal route for the peopling of the Americas. Am. J. Hum. Genet. 82, 583–592 (2008).
26. A. Achilli, U. A. Perego, C. M. Bravi, M. D. Coble, Q.-P. Kong, S. R. Woodward, A. Salas,A. Torroni, H.-J. Bandelt, The phylogeny of the four pan-American mtDNA haplogroups:Implications for evolutionary and disease studies. PLOS One 3, e1764 (2008).
27. N. J. R. Fagundes, R. Kanitz, S. L. Bonatto, Reply to Ho and Endicott. Am. J. Hum. Genet. 83,146–147 (2008).
28. D. H. O’Rourke, J. A. Raff, The human genetic history of the Americas: The final frontier.Curr. Biol. 20, R202–R207 (2010).
29. J. F. Hoffecker, S. A. Elias, D. H. O’Rourke, Out of Beringia? Science 343, 979–980 (2014).30. E. J. Dixon, Late Pleistocene colonization of North America from Northeast Asia: New insights
from large-scale paleogeographic reconstructions. Quat. Int. 285, 57–67 (2013).31. T. G. Schurr, S. T. Sherry, Mitochondrial DNA and Y chromosome diversity and the peopling
of the Americas: Evolutionary and demographic evidence. Am. J. Hum. Biol. 16, 420–439(2004).
32. T. D. Dillehay, C. Ramírez, M. Pino, M. B. Collins, J. Rossen, J. D. Pino-Navarro, Monte Verde:Seaweed, food, medicine, and the peopling of South America. Science 320, 784–786(2008).
33. D. H. O’Rourke, M. G. Hayes, S. W. Carlyle, Spatial and temporal stability of mtDNA haplogroupfrequencies in Native North America. Hum. Biol. 72, 15–34 (2000).
34. D. A. Bolnick, D. G. Smith, Unexpected patterns of mitochondrial DNA variation amongNative Americans from the Southeastern United States. Am. J. Phys. Anthropol. 122,336–354 (2003).
35. B. D. O’Fallon, L. Fehren-Schmitz, Native Americans experienced a strong populationbottleneck coincident with European contact. Proc. Natl. Acad. Sci. U.S.A. 108,20444–20448 (2011).
36. C. N. K. Anderson, U. Ramakrishnan, Y. L. Chan, E. A. Hadly, Serial SimCoal: A populationgenetics model for data from multiple populations and points in time. Bioinformatics 21,1733–1734 (2004).
37. M. Escabias, A. M. Aguilera, M. J. Valderrama, Principal component estimation of functionallogistic regression: Discussion of two different approaches. J. Nonparametr. Stat. 16,365–384 (2004).
38. I. Camminatie, A. Lucadamo, Estimating multinomial logit model with multicollinear data.Asian J. Math. Stat. 3, 93–101 (2010).
39. L. Fehren-Schmitz, B. Llamas, S. Lindauer, E. Tomasto-Cagigao, S. Kuzminsky, N. Rohland,F. R. Santos, P. Kaulicke, G. Valverde, S. M. Richards, S. Nordenfelt, V. Seidenberg, S. Mallick,A. Cooper, D. Reich, W. Haak, A re-appraisal of the early Andean human remains fromLauricocha in Peru. PLOS One 10, e0127141 (2015).
40. G. G. Politis, M. A. Gutiérrez, C. Scabuzzo, Eds., Estado actual de las investigaciones en el sitioarqueológico Arroyo Seco 2 (partido de Tres Arroyos, provincia de Buenos Aires, Argentina),Serie monográfica (INCUAPA, Olavarría, 2014).
8 of 10
R E S EARCH ART I C L E
on June 5, 2018http://advances.sciencem
ag.org/D
ownloaded from
41. W. Haak, I. Lazaridis, N. Patterson, N. Rohland, S. Mallick, B. Llamas, G. Brandt, S. Nordenfelt,E. Harney, K. Stewardson, Q. Fu, A. Mittnik, E. Bánffy, C. Economou, M. Francken,S. Friederich, R. G. Pena, F. Hallgren, V. Khartanovich, A. Khokhlov, M. Kunst,P. Kuznetsov, H. Meller, O. Mochalov, V. Moiseyev, N. Nicklisch, S. L. Pichler, R. Risch,M. A. R. Guerra, C. Roth, A. Szécsényi-Nagy, J. Wahl, M. Meyer, J. Krause, D. Brown,D. Anthony, A. Cooper, K. W. Alt, D. Reich, Massive migration from the steppe was a sourcefor Indo-European languages in Europe. Nature 522, 207–211 (2015).
42. M. Meyer, M. Kircher, Illumina sequencing library preparation for highly multiplexed targetcapture and sequencing. Cold Spring Harb. Protoc. 2010, 1–10 (2010).
43. A. J. Drummond, M. A. Suchard, D. Xie, A. Rambaut, Bayesian phylogenetics with BEAUtiand the BEAST 1.7. Mol. Biol. Evol. 29, 1969–1973 (2012).
44. J. Heled, A. J. Drummond, Bayesian inference of population size history from multiple loci.BMC Evol. Biol. 8, 289 (2008).
45. M. Rasmussen, S. L. Anzick, M. R. Waters, P. Skoglund, M. DeGiorgio, T. W. Stafford Jr.,S. Rasmussen, I. Moltke, A. Albrechtsen, S. M. Doyle, G. D. Poznik, V. Gudmundsdottir,R. Yadav, A.-S. Malaspinas, S. S. White V, M. E. Allentoft, O. E. Cornejo, K. Tambets,A. Eriksson, P. D. Heintzman, M. Karmin, T. S. Korneliussen, D. J. Meltzer, T. L. Pierre,J. Stenderup, L. Saag, V. M. Warmuth, M. C. Lopes, R. S. Malhi, S. Brunak, T. Sicheritz-Ponten,I. Barnes, M. Collins, L. Orlando, F. Balloux, A. Manica, R. Gupta, M. Metspalu, C. D. Bustamante,M. Jakobsson, R. Nielsen, E. Willerslev, The genome of a late Pleistocene human from aClovis burial site in western Montana. Nature 506, 225–229 (2014).
46. M. A. Beaumont, in Simulation, Genetics and Human Prehistory, S. Matsumura, P. Forster,C. Renfrew, Eds. (McDonald Institute for Archaeological Research, Cambridge, 2008),pp. 135–154.
47. R Development Core Team, R: A Language and Environment for Statistical Computing(R Foundation for Statistical Computing, Vienna, 2010).
48. S. Lindgreen, AdapterRemoval: Easy cleaning of next-generation sequencing reads. BMCRes. Notes 5, 337 (2012).
49. D. M. Behar, M. van Oven, S. Rosset, M. Metspalu, E.-L. Loogväli, N. M. Silva, T. Kivisild,A. Torroni, R. Villems, A “Copernican” reassessment of the human mitochondrial DNA treefrom its root. Am. J. Hum. Genet. 90, 675–684 (2012).
50. H. Li, R. Durbin, Fast and accurate short read alignment with Burrows–Wheeler transform.Bioinformatics 25, 1754–1760 (2009).
51. M. Schubert, A. Ginolhac, S. Lindgreen, J. F. Thompson, K. A. Al-Rasheid, E. Willerslev,A. Krogh, L. Orlando, Improving ancient DNA read mapping against modern referencegenomes. BMC Genomics 13, 178 (2012).
52. M. Kircher, Analysis of high-throughput ancient DNA sequencing data. Methods Mol. Biol.840, 197–228 (2012).
53. A. Ginolhac, M. Rasmussen, M. T. P. Gilbert, E. Willerslev, L. Orlando, mapDamage: Test-ing for damage patterns in ancient DNA sequences. Bioinformatics 27, 2153–2155(2011).
54. J. E. L. Templeton, M. Brotherton, B. Llamas, J. Soubrier, W. Haak, A. Cooper, J. J. Austin,DNA capture and next-generation sequencing can recover whole mitochondrial genomesfrom highly degraded samples for human identification. Invest. Genet. 4, 26 (2013).
55. J. Dabney, M. Knapp, I. Glocke, M.-T. Gansauge, A. Weihmann, B. Nickel, C. Valdiosera,N. García, S. Pääbo, J.-L. Arsuaga, M. Meyer, Complete mitochondrial genome sequenceof a Middle Pleistocene cave bear reconstructed from ultrashort DNA fragments. Proc. Natl.Acad. Sci. U.S.A. 110, 15758–15763 (2013).
56. N. Rohland, E. Harney, S. Mallick, S. Nordenfelt, D. Reich, Partial uracil–DNA–glycosylasetreatment for screening of ancient DNA. Philos. Trans. R. Soc. Lond. B Biol. Sci. 370,20130624 (2014).
57. Q. Fu, M. Meyer, X. Gao, U. Stenzel, H. A. Burbano, J. Kelso, S. Pääbo, DNA analysis of anearly modern human from Tianyuan Cave, China. Proc. Natl. Acad. Sci. U.S.A. 110,2223–2227 (2013).
58. M. Meyer, Q. Fu, A. Aximu-Petri, I. Glocke, B. Nickel, J.-L. Arsuaga, I. Martínez, A. Gracia,J. M. B. de Castro, E. Carbonell, S. Pääbo, A mitochondrial genome sequence of a homininfrom Sima de los Huesos. Nature 505, 403–406 (2014).
59. A. R. Quinlan, I. M. Hall, BEDTools: A flexible suite of utilities for comparing genomicfeatures. Bioinformatics 26, 841–842 (2010).
60. H. Jonsson, A. Ginolhac, M. Schubert, P. L. F. Johnson, L. Orlando, mapDamage2.0: Fastapproximate Bayesian estimates of ancient DNA damage parameters. Bioinformatics 29,1682–1684 (2013).
61. S. Kumar, C. Bellis, M. Zlojutro, P. E. Melton, J. Blangero, J. E. Curran, Large scale mitochon-drial sequencing in Mexican Americans suggests a reappraisal of Native American origins.BMC Evol. Biol. 11, 293 (2011).
62. R. Lanfear, B. Calcott, S. Y. W. Ho, S. Guindon, Partitionfinder: Combined selection ofpartitioning schemes and substitution models for phylogenetic analyses. Mol. Biol. Evol.29, 1695–1701 (2012).
63. M. Molak, E. D. Lorenzen, B. Shapiro, S. Y. W. Ho, Phylogenetic estimation of timescalesusing ancient DNA: The effects of temporal sampling scheme and uncertainty in sampleages. Mol. Biol. Evol. 30, 253–262 (2013).
Llamas et al. Sci. Adv. 2016; 2 : e1501385 1 April 2016
64. M. Molak, M. A. Suchard, S. Y. W. Ho, D. W. Beilman, B. Shapiro, Empirical calibrated radio-carbon sampler: A tool for incorporating radiocarbon-date and calibration error intoBayesian phylogenetic analyses of ancient DNA. Mol. Ecol. Resour. 15, 81–86 (2015).
65. A. J. Drummond, S. Y. W. Ho, M. J. Phillips, A. Rambaut, Relaxed phylogenetics and datingwith confidence. PLOS Biol. 4, e88 (2006).
66. S. Y. W. Ho, R. Lanfear, M. J. Phillips, I. Barnes, J. A. Thomas, S.-O. Kolokotronis, B. Shapiro,Bayesian estimation of substitution rates from ancient DNA sequences with lowinformation content. Syst. Biol. 60, 366–375 (2011).
67. S. Duchêne, D. Duchêne, E. C. Holmes, S. Y. W. Ho, The performance of the date-randomizationtest in phylogenetic analyses of time-structured virus data.Mol. Biol. Evol. 32, 1895–1906 (2015).
68. W. A. Gould, M. Raynolds, D. A. Walker, Vegetation, plant biomass, and net primaryproductivity patterns in the Canadian Arctic. J. Geophys. Res. 108, 1–14 (2003).
69. H. Lieth, R. H. Whittaker, Eds., Primary Productivity of the Biosphere (Springer-Verlag, Berlin,1975).
70. C. Smith, Late Stone Age Hunters of the British Isles (Routledge, New York, 1992).71. P. Rowley-Conwy, R. Layton, Foraging and farming as niche construction: Stable and un-
stable adaptations. Philos. Trans. R. Soc. Lond. B Biol. Sci. 366, 849–862 (2011).72. H. Schutkowski, Human Ecology: Biocultural Adaptations in Human Communities (Springer-
Verlag, Berlin, 2006).73. R. Frankham, Effective population size/adult population size ratios in wildlife: A review.
Genet. Res. 89, 491–503 (2007).74. F. P. Palstra, D. J. Fraser, Effective/census population size ratio estimation: A compendium
and appraisal. Ecol. Evol. 2, 2357–2365 (2012).75. M. Ingman, H. Kaessmann, S. Pääbo, U. Gyllensten, Mitochondrial genome variation and
the origin of modern humans. Nature 408, 708–713 (2000).76. E. B. Starikovskaya, R. I. Sukernik, O. A. Derbeneva, N. V. Volodko, E. Ruiz-Pesini, A. Torroni,
M. D. Brown, M. T. Lott, S. H. Hosseini, K. Huoponen, D. C. Wallace, Mitochondrial DNAdiversity in indigenous populations of the southern extent of Siberia, and the origins ofNative American haplogroups. Ann. Hum. Genet. 69, 67–89 (2005).
77. R. S. Just, T. M. Diegoli, J. L. Saunier, J. A. Irwin, T. J. Parsons, Complete mitochondrialgenome sequences for 265 African American and U.S. “Hispanic” individuals. ForensicSci. Int. Genet. 2, e45–e48 (2008).
78. M. Derenko, B. Malyarchuk, T. Grzybowski, G. Denisova, I. Dambueva, M. Perkova, C. Dorzhu,F. Luzina, H. K. Lee, T. Vanecek, R. Villems, I. Zakharov, Phylogeographic analysis of mitochon-drial DNA in northern Asian populations. Am. J. Hum. Genet. 81, 1025–1041 (2007).
79. M. Ingman, U. Gyllensten, Rate variation between mitochondrial domains and adaptiveevolution in humans. Hum. Mol. Genet. 16, 2281–2287 (2007).
80. N. V. Volodko, E. B. Starikovskaya, I. O. Mazunin, N. P. Eltsov, P. V. Naidenko, D. C. Wallace,R. I. Sukernik, Mitochondrial genome diversity in arctic Siberians, with particular referenceto the evolutionary history of Beringia and Pleistocenic peopling of the Americas. Am. J.Hum. Genet. 82, 1084–1100 (2008).
81. A. Hartmann, M. Thieme, L. K. Nanduri, T. Stempfl, C. Moehle, T. Kivisild, P. J. Oefner, Val-idation of microarray-based resequencing of 93 worldwide mitochondrial genomes. Hum.Mutat. 30, 115–122 (2009).
82. M. Derenko, B. Malyarchuk, T. Grzybowski, G. Denisova, U. Rogalla, M. Perkova,I. Dambueva, I. Zakharov, Origin and post-glacial dispersal of mitochondrial DNA hap-logroups C and D in northern Asia. PLOS One 5, e15214 (2010).
83. S. Cardoso, M. A. Alfonso-Sánchez, L. Valverde, D. Sánchez, M. T. Zarrabeitia, A. Odriozola,B. Martínez-Jarreta, M. M. de Pancorbo, Genetic uniqueness of the Waorani tribe from theEcuadorian Amazon. Heredity 108, 609–615 (2012).
84. M. Derenko, B. Malyarchuk, G. Denisova, M. Perkova, U. Rogalla, T. Grzybowski,E. Khusnutdinova, I. Dambueva, I. Zakharov, Complete mitochondrial DNA analysis of easternEurasian haplogroups rarely found in populations of northern Asia and eastern Europe.PLOS One 7, e32179 (2012).
85. M. de Saint Pierre, C. M. Bravi, J. M. B. Motti, N. Fuku, M. Tanaka, E. Llop, S. L. Bonatto,M. Moraga, An alternative model for the early peopling of southern South America re-vealed by analyses of three mitochondrial DNA haplogroups. PLOS One 7, e43486 (2012).
86. A. Achilli, U. A. Perego, H. Lancioni, A. Olivieri, F. Gandini, B. H. Kashani, V. Battaglia,V. Grugni, N. Angerhofer, M. P. Rogers, R. J. Herrera, S. R. Woodward, D. Labuda,D. G. Smith, J. S. Cybulski, O. Semino, R. S. Malhi, A. Torroni, Reconciling migration modelsto the Americas with the variation of North American native mitogenomes. Proc. Natl.Acad. Sci. U.S.A. 110, 14308–14313 (2013).
Acknowledgments: We thank the anonymous reviewers for providing helpful comments. Wethank K. Mitchell, J. Tuke, N. Bean, and M. S. Y. Lee for helpful discussions and critical commentson themanuscript. We are grateful to B. O’Fallon for providing the Java program for the demog-raphy plot and to ACAD members for general assistance. We thank J. Quilter and S. Leblanc forproviding the sample from Huaca Prieta. We also thank the following National Heritage organi-sations that delivered permits to collect, export, and analyze ancient specimens: the Ministry ofCulture (the former National Institute of Cultural Heritage–INC) in Peru; the National Institute ofArchaeology, a specialized agency of the Deputy Minister of Culture in Bolivia; the Universidad
9 of 10
R E S EARCH ART I C L E
de Chile and the Museo Arqueológico, Universidad de Tarapacá, San Miguel de Azapa, Arica, inChile; the Consejo Arqueológico and Consejo Jurídico committees of the National Institute ofAnthropology and History (INAH) in Mexico; and the Cultural Patrimony Office of the Ministry ofEducation in Argentina. Funding: B.L., L.F.-S., C.S., D.R., A.C., and W.H. acknowledge fundingfrom the Australian Research Council (DP1095782, DP130102158), the University of AdelaideEnvironment Institute, the Wenner-Gren Foundation (SC-14-62), the U.S. National ScienceFoundation (HOMINID BCS-1032255), the U.S. National Institutes of Health (GM100233), andtheHoward HughesMedical Institute for thegeneration of genetic data.Author contributions:B.L.,L.F.-S., A.C., and W.H. designed the experiments and analyses. B.L. and S.M.R. designed the mito-chondrial capture method at ACAD. B.L., L.F.-S., G.V., N.R., S.N., C.V., and W.H. generated the ge-netic data. B.L., L.F.-S., J.S., S.M., A.R., S.Y.W.H., andW.H. analyzed the data. M.I.B.R., I.F.E., E.T.C., L.W.J.,K.M., I.S.L.R., J.M.L., J.A.B.T., M.A.R., R.L.B., M.C.C., J.R., R.S.W., G.P., C.M.S., and V.G.S. provided archae-ological samples. B.L., L.F.-S., A.C., and W.H. wrote the manuscript, with contributions from all co-authors during extensive revisions. Competing interests: The authors declare that they have nocompeting interests.Data andmaterials availability: All ancient genetic data used to obtain the
Llamas et al. Sci. Adv. 2016; 2 : e1501385 1 April 2016
conclusions in the paper are available at the National Center for Biotechnology Information (ac-cession numbers KU523264 to KU523350 and KP300790 to KP300794). Additional data related tothis paper may be requested from the authors.
Submitted 5 October 2015Accepted 21 March 2016Published 1 April 201610.1126/sciadv.1501385
Citation: B. Llamas, L. Fehren-Schmitz, G. Valverde, J. Soubrier, S. Mallick, N. Rohland,S. Nordenfelt, C. Valdiosera, S. M. Richards, A. Rohrlach, M. I. B. Romero, I. F. Espinoza,E. T. Cagigao, L. W. Jiménez, K. Makowski, I. S. L. Reyna, J. M. Lory, J. A. B. Torrez,M. A. Rivera, R. L. Burger, M. C. Ceruti, J. Reinhard, R. S. Wells, G. Politis, C. M. Santoro,V. G. Standen, C. Smith, D. Reich, S. Y. W. Ho, A. Cooper, W. Haak, Ancient mitochondrial DNAprovides high-resolution time scale of the peopling of the Americas. Sci. Adv. 2, e1501385 (2016).
10 of 10
on June 5, 2018http://advances.sciencem
ag.org/D
ownloaded from
AmericasAncient mitochondrial DNA provides high-resolution time scale of the peopling of the
Politis, Calogero M. Santoro, Vivien G. Standen, Colin Smith, David Reich, Simon Y. W. Ho, Alan Cooper and Wolfgang HaakBallivián Torrez, Mario A. Rivera, Richard L. Burger, Maria Constanza Ceruti, Johan Reinhard, R. Spencer Wells, Gustavo Cagigao, Lucía Watson Jiménez, Krzysztof Makowski, Ilán Santiago Leboreiro Reyna, Josefina Mansilla Lory, Julio AlejandroCristina Valdiosera, Stephen M. Richards, Adam Rohrlach, Maria Inés Barreto Romero, Isabel Flores Espinoza, Elsa Tomasto Bastien Llamas, Lars Fehren-Schmitz, Guido Valverde, Julien Soubrier, Swapan Mallick, Nadin Rohland, Susanne Nordenfelt,
DOI: 10.1126/sciadv.1501385 (4), e1501385.2Sci Adv
ARTICLE TOOLS http://advances.sciencemag.org/content/2/4/e1501385
MATERIALSSUPPLEMENTARY http://advances.sciencemag.org/content/suppl/2016/03/30/2.4.e1501385.DC1
REFERENCES
http://advances.sciencemag.org/content/2/4/e1501385#BIBLThis article cites 80 articles, 12 of which you can access for free
PERMISSIONS http://www.sciencemag.org/help/reprints-and-permissions
Terms of ServiceUse of this article is subject to the
registered trademark of AAAS.is aScience Advances Association for the Advancement of Science. No claim to original U.S. Government Works. The title
York Avenue NW, Washington, DC 20005. 2017 © The Authors, some rights reserved; exclusive licensee American (ISSN 2375-2548) is published by the American Association for the Advancement of Science, 1200 NewScience Advances
on June 5, 2018http://advances.sciencem
ag.org/D
ownloaded from