Embed Size (px)
Citation preview
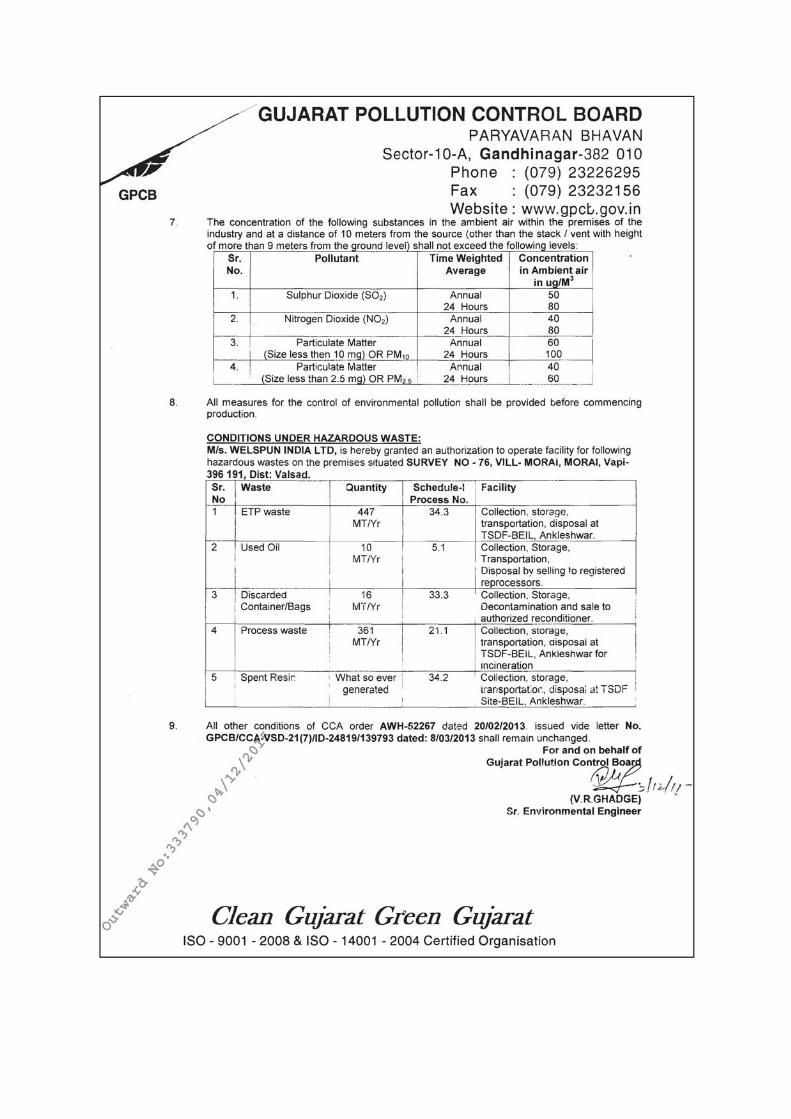
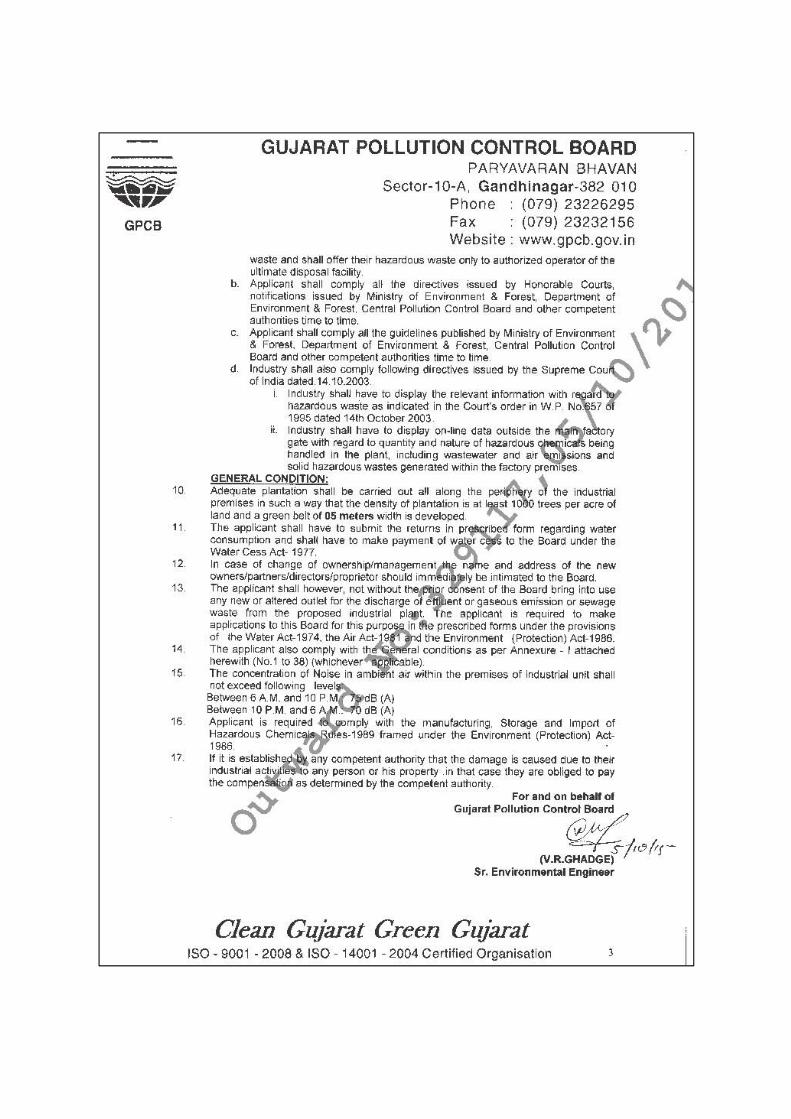
Annexure – 1: Copy of Existing Consolidated Consent & Authorization (CC&A)


Annexure – 2: Copy of Consent to Establish for Installation of 74 TPH & 15 MW Co-Generation Power Plant


Annexure – 3: Coal Supply Agreement


Annexure – 4: TSDF Membership Certificate

Page 1 of 7
Annexure - 5: Methodology for sampling & Analysis
1.0 Ambient Air Quality
1.1 Method of Analysis
The air samples are analyzed as per standard method specified by relevant sections of IS 5182.
1.2. Instrument used for Sampling
Respirable dust samplers, model RDS of Envirotech Instruments (duly calibrated) with gaseous sampling
attachment, were used for monitoring of PM10, SO2, NOx. Fine particulate samplers, of Envirotech
Instruments (Duly Calibrated)were used for monitoring of PM2.5. TVOC have been monitored with PID
based Gas ditectore. Samples for CO was collected in gas blader.
1.3 Instrument used for Analysis
PM10 and PM2.5 was analyzed on electronic balance. Whereas, SO2 & NOx were analyzed on UV – Visible Spectrophotometer. TVOC have been monitored with PID based Gas detector. CO was analyzed on Gas Chromatography. Atomic Absorption Spectrophotometer with hydride generator has been used for estimation of Hg.
1.4 Sampling and analytical techniques
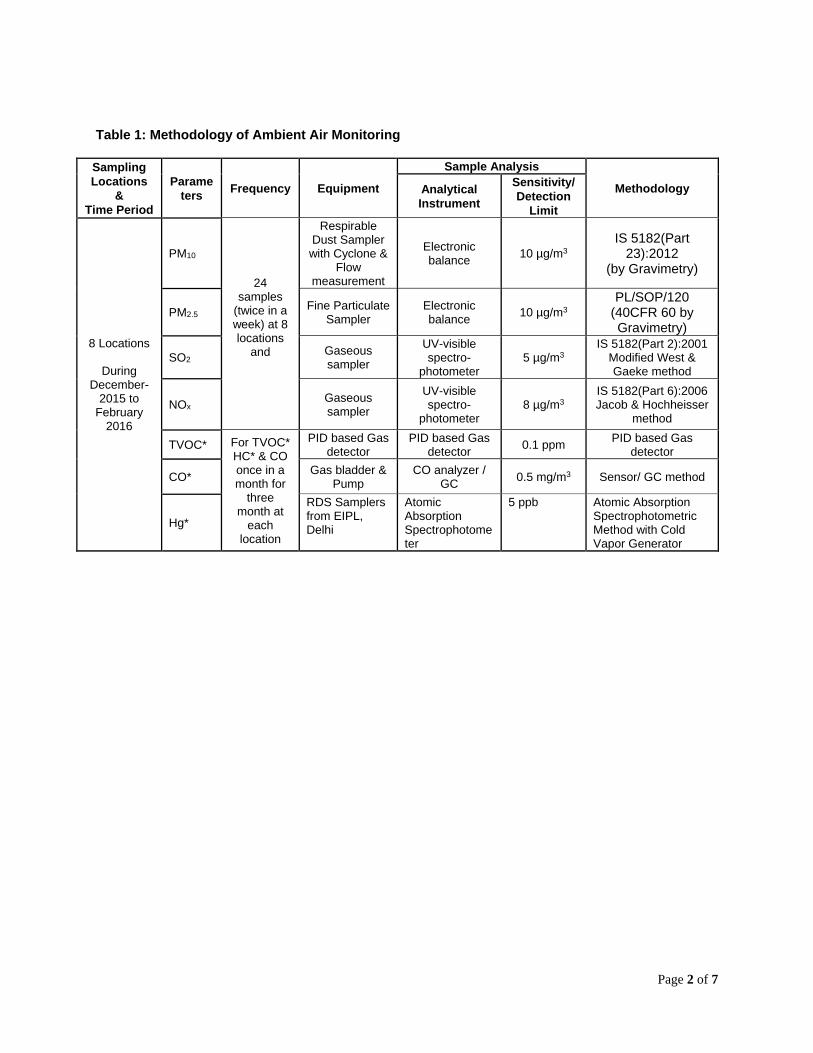
The methodology adopted for sampling and analysis of ambient air quality is as mentioned in Table 1.
Page 2 of 7
Table 1: Methodology of Ambient Air Monitoring
Sampling
Locations
&
Time Period
Parame
ters Frequency Equipment
Sample Analysis
Methodology Analytical
Instrument
Sensitivity/
Detection
Limit
8 Locations
During December-
2015 to February
2016
PM10
24
samples (twice in a week) at 8 locations
and
Respirable Dust Sampler with Cyclone &
Flow measurement
Electronic balance
10 µg/m3
IS 5182(Part 23):2012
(by Gravimetry)
PM2.5 Fine Particulate
Sampler Electronic balance
10 µg/m3
PL/SOP/120 (40CFR 60 by Gravimetry)
SO2 Gaseous sampler
UV-visible spectro-
photometer 5 µg/m3
IS 5182(Part 2):2001 Modified West & Gaeke method
NOx Gaseous sampler
UV-visible spectro-
photometer 8 µg/m3
IS 5182(Part 6):2006 Jacob & Hochheisser
method
TVOC* For TVOC* HC* & CO once in a month for
three month at
each location
PID based Gas detector
PID based Gas detector
0.1 ppm PID based Gas
detector
CO* Gas bladder &
Pump CO analyzer /
GC 0.5 mg/m3 Sensor/ GC method
Hg*
RDS Samplers from EIPL, Delhi
Atomic Absorption Spectrophotometer
5 ppb Atomic Absorption Spectrophotometric Method with Cold Vapor Generator

Page 3 of 7
2.0 Water Analysis
2.1 Sampling & Preservation
A sample to access the quality of the available water were taken for chemical analysis in
carboys/ glass bottles and preserved, as per the techniques explained by APHA in ‘Standard
Methods for Examination of Water & Wastewater’. The preserved samples were brought to the
laboratory and analyzed.
The samples have been analyzed as per the procedures specified in ‘Standard Methods for the
Examination of Water and Wastewater’ published by American Public Health Association
(APHA – 21st Edition) and Bureau of Indian Standards.
The methodology for sample collection and preservation techniques was followed as per the
techniques mentioned in table 2.
Table 2: Techniques for Preservation of Water Sampling
A) Refrigeration (preservation without chemical treatment)
Sr. No. Determination Preservation
1 Alkalinity Refrigerate
2 BOD Refrigerate
3 Color Refrigerate
4 Electrical Conductivity Refrigerate
5 Nitrate Analyze as soon as possible, refrigerate.
6 Solids Refrigerate
7 Sulphate Refrigerate
8 Odor Analyze as soon as possible, refrigerate
9 Phosphate Refrigerate
10 Turbidity Analyze same day, refrigerate
11 Fluoride Not specified
12 Sodium Not specified
13 Potassium Not specified
14 Calcium Not specified
15 Magnesium Not specified
16 Chloride Not required
17 pH Analyze as soon as possible
18 Temperature Immediately analyze at the time of sampling
19 Hardness Hno3or h2so4 <2 ph
20 Heavy Metal Hn03
B) Refrigeration (preservation with chemical treatment)
Sr. No. Determination Preservation
1 COD Analyze as soon as possible or add H2SO4 to pH<2 refrigerate
2 Oil & grease Add H2SO4 to pH<2 refrigerate
3 Phenolic compounds Refrigerate add H2SO4 to pH<2

Page 4 of 7
Remarks: 1. Sample is collected in an appropriate big size container instead of individual parameter-wise
sampling requiring similar container and preservation requirement. 2. Glass or plastic containers are used for samples.
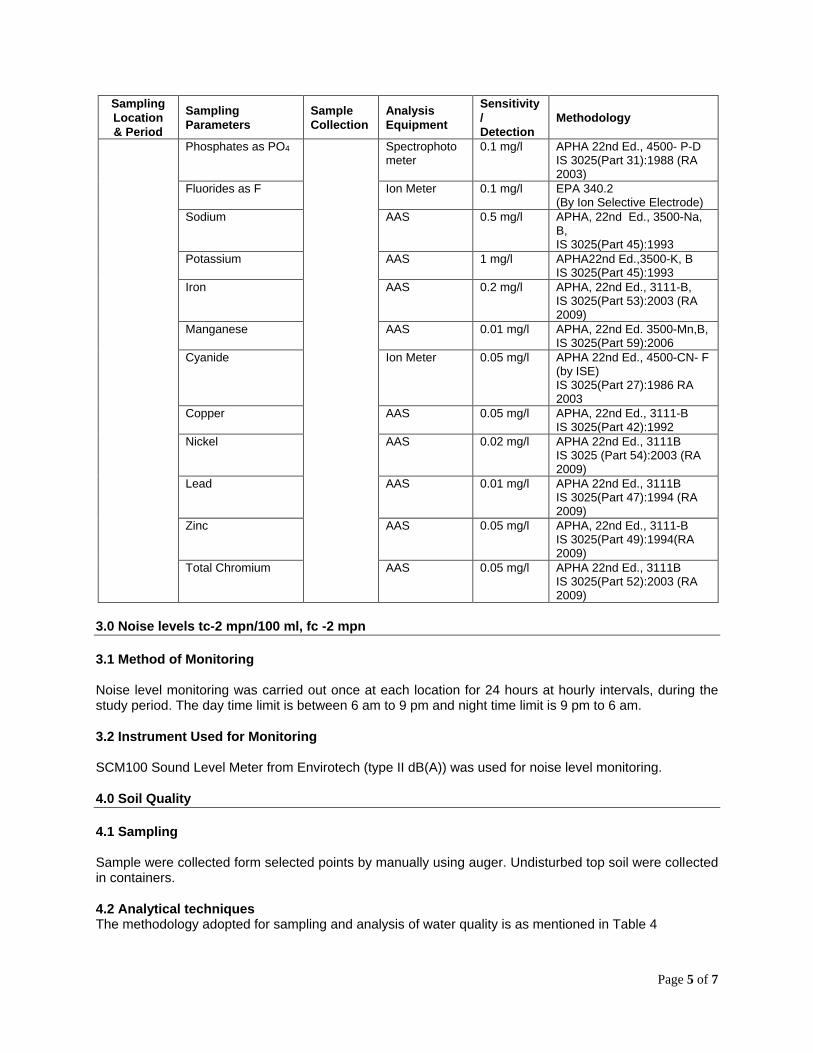
2.2 Analytical techniques The methodology adopted for sampling and analysis of water quality is as mentioned in Table 3.
Table 3: Analytical Methodology of Ground Water & Surface Water
Sampling
Location
& Period
Sampling
Parameters
Sample
Collection
Analysis
Equipment
Sensitivity
/
Detection
Methodology
Groundwater – 8
locations
Surface water – 8 locations
Grab
Sampling during April-
2015
pH Manual sampling in Polyethylene Carboy/ glass bottles
pH meter 2.0 APHA 22nd Ed. 4500 pH, IS 3025(Part 11):1983(RA 2002)
Temp (°C) Thermometer 5oC APHA 22nd Ed.,2550B
Colour (pt.co. Scale) Spectrophotometer
Colour Unit APHA 22nd Ed., 2120 B & C
Odour Manual Qualitative APHA 22nd Ed.,2150
Turbidity, (NTU) Nephlometer 0.1 NTU APHA 22nd Ed., 2130 B IS 3025(Part 10):1984, (RA 2012)
Total Dissolved Solids
Electronic Balance
5 mg/l APHA 22nd Ed. 2540 C IS 3025(Part 16):1984
EC Conductivity Meter
10 µS/cm APHA 22nd Ed. 2510-B
Oil & Grease Electronic Balance
1.0 mg/l APHA 22nd Ed., 5520 B IS 3025(Part 39):1991 (RA 2003)
BOD Incubator, Titration
2.0 mg/l IS 3025(Part 44):1993 (RA 2009), Amds.1
COD Titration 5.0 mg/l APHA 22nd Ed., 5220B IS 3025(Part 58):2006
Phenolic compounds
Spectrophotometer
0.001 mg/l APHA 22nd Ed., 5530 C APHA 22nd Ed., 5530 D IS 3025 (Part 43)1992 (RA 2003)
Total Alkalinity Titration 5.0 mg/l APHA 22nd Ed. 2320 B. IS 3025(Part 23):1986
Total Hardness Titration 2.0 mg/l IS 3025(Part 21):2009 APHA 22nd Ed. 2340 C. EDTA -Titrimetric Method
Calcium Titration 2.0 mg/l APHA, 22nd Ed., 3500-B, EDTA Titrimetric Method IS 3025(Part 40):1991 (RA 2003)
Magnesium Titration 2.0 mg/l APHA 22nd Ed.,3500- Mg-B IS 3025(Part 46):1994(RA 2009)
Chlorides as Cl Titration 5.0 mg/l APHA 22nd Ed. 4500 Cl. B IS 3025(Part 32):1988
Nitrates as NO3 Spectrophotometer
0.1 mg/l APHA 22nd Ed.,4500-NO3-B (UV Screening method)
Sulphates as SO4 Spectrophotometer
1.0 mg/l APHA 22nd Ed.,4500 SO42 –
E IS 3025(Part 24):1986 (1st Rev) (RA 1992) (Turbidity Method)
Page 5 of 7
Sampling
Location
& Period
Sampling
Parameters
Sample
Collection
Analysis
Equipment
Sensitivity
/
Detection
Methodology
Phosphates as PO4 Spectrophotometer
0.1 mg/l APHA 22nd Ed., 4500- P-D IS 3025(Part 31):1988 (RA 2003)
Fluorides as F Ion Meter 0.1 mg/l EPA 340.2 (By Ion Selective Electrode)
Sodium AAS 0.5 mg/l APHA, 22nd Ed., 3500-Na, B, IS 3025(Part 45):1993
Potassium AAS 1 mg/l APHA22nd Ed.,3500-K, B IS 3025(Part 45):1993
Iron AAS 0.2 mg/l APHA, 22nd Ed., 3111-B, IS 3025(Part 53):2003 (RA 2009)
Manganese AAS 0.01 mg/l APHA, 22nd Ed. 3500-Mn,B, IS 3025(Part 59):2006
Cyanide Ion Meter 0.05 mg/l APHA 22nd Ed., 4500-CN- F (by ISE) IS 3025(Part 27):1986 RA 2003
Copper AAS 0.05 mg/l APHA, 22nd Ed., 3111-B IS 3025(Part 42):1992
Nickel AAS 0.02 mg/l APHA 22nd Ed., 3111B IS 3025 (Part 54):2003 (RA 2009)
Lead AAS 0.01 mg/l APHA 22nd Ed., 3111B IS 3025(Part 47):1994 (RA 2009)
Zinc AAS 0.05 mg/l APHA, 22nd Ed., 3111-B IS 3025(Part 49):1994(RA 2009)
Total Chromium AAS 0.05 mg/l APHA 22nd Ed., 3111B IS 3025(Part 52):2003 (RA 2009)
3.0 Noise levels tc-2 mpn/100 ml, fc -2 mpn
3.1 Method of Monitoring Noise level monitoring was carried out once at each location for 24 hours at hourly intervals, during the study period. The day time limit is between 6 am to 9 pm and night time limit is 9 pm to 6 am.
3.2 Instrument Used for Monitoring SCM100 Sound Level Meter from Envirotech (type II dB(A)) was used for noise level monitoring.
4.0 Soil Quality
4.1 Sampling Sample were collected form selected points by manually using auger. Undisturbed top soil were collected in containers.
4.2 Analytical techniques The methodology adopted for sampling and analysis of water quality is as mentioned in Table 4
Page 6 of 7
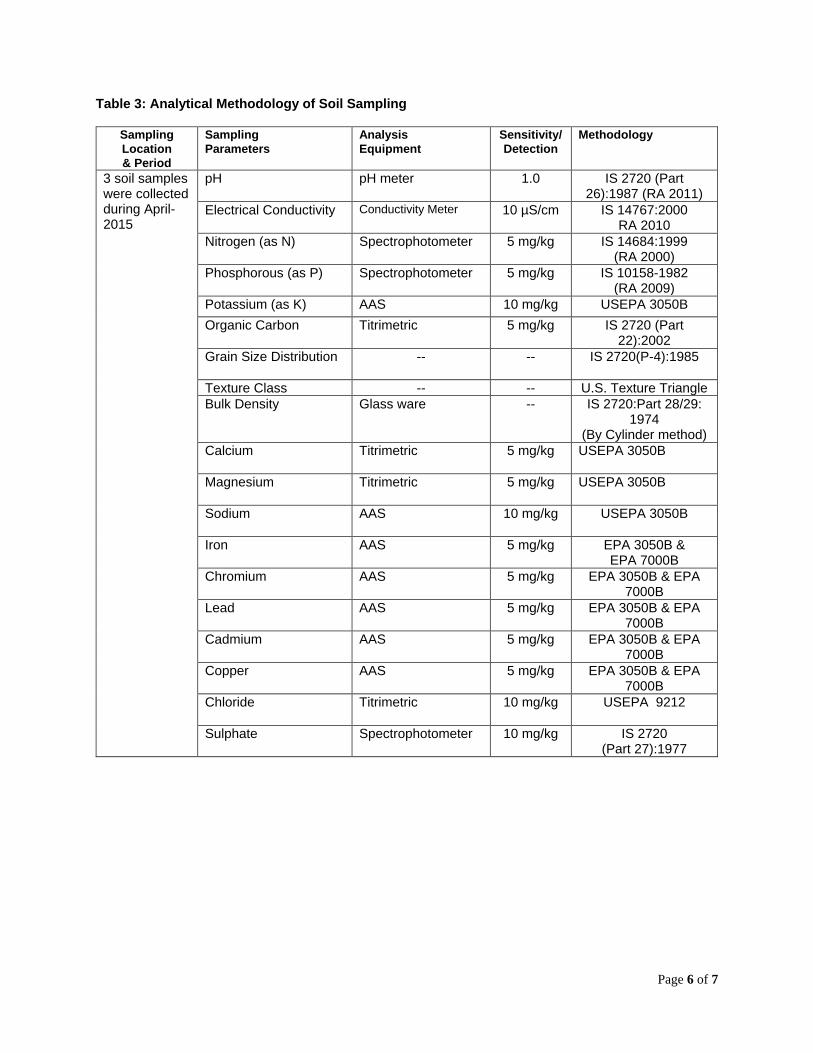
Table 3: Analytical Methodology of Soil Sampling
Sampling
Location
& Period
Sampling
Parameters
Analysis
Equipment
Sensitivity/
Detection
Methodology
3 soil samples were collected during April-2015
pH pH meter 1.0 IS 2720 (Part 26):1987 (RA 2011)
Electrical Conductivity Conductivity Meter 10 µS/cm IS 14767:2000 RA 2010
Nitrogen (as N) Spectrophotometer 5 mg/kg IS 14684:1999 (RA 2000)
Phosphorous (as P) Spectrophotometer 5 mg/kg IS 10158-1982 (RA 2009)
Potassium (as K) AAS 10 mg/kg USEPA 3050B
Organic Carbon Titrimetric 5 mg/kg IS 2720 (Part 22):2002
Grain Size Distribution -- -- IS 2720(P-4):1985
Texture Class -- -- U.S. Texture Triangle
Bulk Density Glass ware -- IS 2720:Part 28/29: 1974
(By Cylinder method)
Calcium Titrimetric 5 mg/kg USEPA 3050B
Magnesium Titrimetric 5 mg/kg USEPA 3050B
Sodium AAS 10 mg/kg USEPA 3050B
Iron AAS 5 mg/kg EPA 3050B & EPA 7000B
Chromium AAS 5 mg/kg EPA 3050B & EPA 7000B
Lead AAS 5 mg/kg EPA 3050B & EPA 7000B
Cadmium AAS 5 mg/kg EPA 3050B & EPA 7000B
Copper AAS 5 mg/kg EPA 3050B & EPA 7000B
Chloride Titrimetric 10 mg/kg USEPA 9212
Sulphate Spectrophotometer 10 mg/kg IS 2720 (Part 27):1977

Page 7 of 7
5.0 Meteorological data collection
Sr. No.
Sampling parameters
Sample Collection Total
Sampling period
Sampling frequency
Methodology Sampling equipment
Sensitivity / Detection
limit
1 Wind speed Anemometer Cup Counter
(0 to 100 km/hr)
0.5 m/s
Summer 2015
Hourly
As per manufacturers’
manual (IS 8829 -
1978) Instruments
are calibrated
2 Wind direction
Wind Vane (0o to 360o)
3o
3 Temperature Thermometer (0o to 50o)
0.2oC
4 Humidity Relative Humidity Meter (0-100%)
5%
5 Rainfall Rain Gauge (0 to 50 mm/hr)
1 mm

Annexure – 6: Reserved Forest Map of Valsad South Divison

Annexure – 7: Socio Economic Details of 10 km Radial Area from Project Site
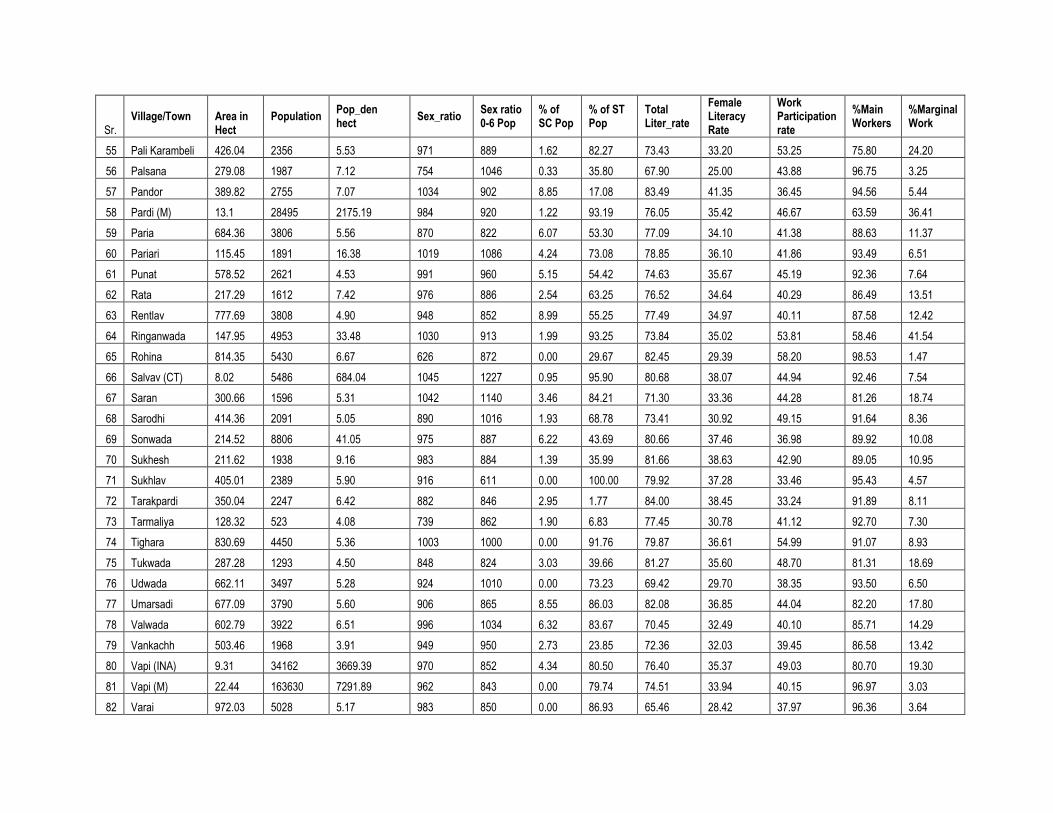
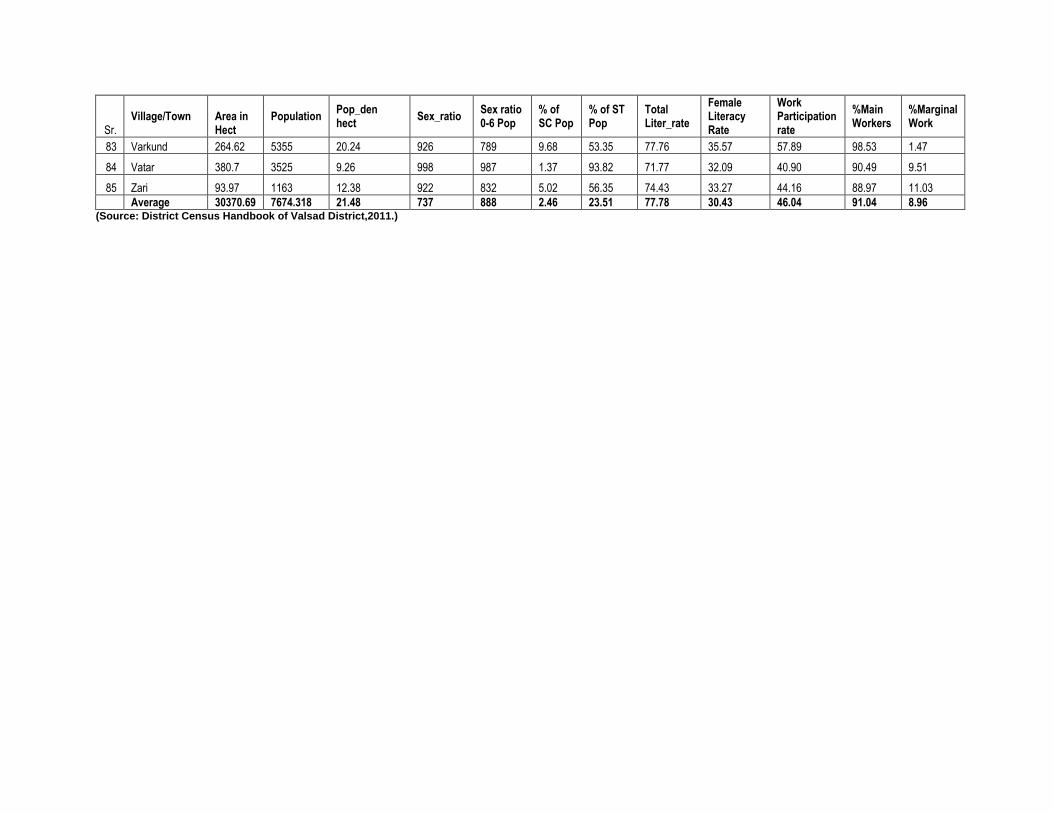
Table -1: Demographic indicators of villages/towns existing in the 10 Km radial distance from the project site
Sr. Village/Town Area in
Hect Population
Pop_den hect
Sex_ratio Sex ratio 0-6 Pop
% of SC Pop
% of ST Pop
Total Liter_rate
Female Literacy Rate
Work Participation rate
%Main Workers
%Marginal Work
1 Achchhari 455.18 2047 4.50 994 965 30.46 57.40 75.19 35.57 45.05 69.03 30.97
2 Ambach 1994.25 16454 8.25 318 947 1.85 10.29 78.15 15.28 69.72 97.05 2.95
3 Ambheti 2010.03 7484 3.72 329 884 0.90 0.59 77.96 15.09 68.84 97.65 2.35
4 Amli 773.39 3621 4.68 921 906 1.87 6.21 80.92 37.04 36.91 95.69 4.31
5 Bagwada 591.98 2902 4.90 1028 1114 2.38 19.90 74.06 34.95 34.44 75.31 24.69
6 Balda 323.26 1415 4.38 962 682 0.00 90.98 67.45 27.84 45.49 99.14 0.86
7 Balitha (CT) 4.03 12380 3071.96 675 852 1.85 17.39 77.84 28.00 49.84 98.32 1.68
8 Barai 403.86 2841 7.03 919 871 0.42 6.50 72.13 29.65 37.25 97.28 2.72
9 Bhamati 52.59 939 17.86 648 852 3.74 10.38 76.89 27.47 47.09 96.97 3.03
10 Bhimpore (CT) 4.27 10936 2561.12 1049 676 0.00 47.77 70.86 32.69 35.77 99.68 0.32
11 Borlai 465.16 2061 4.43 901 809 8.39 3.68 83.96 38.44 38.05 94.52 5.48
12 Chandor 868.42 5019 5.78 356 924 0.99 5.86 77.73 15.98 66.60 96.90 3.10
13 Chanod (CT) 3.05 18776 6156.07 341 857 1.56 3.40 81.32 17.08 67.41 98.57 1.43
14 Chharwada 130.41 821 6.30 925 927 1.66 26.65 75.46 32.61 35.99 96.20 3.80
15 Chhiri (CT) 2.07 18829 9096.14 928 1022 0.24 94.56 72.43 30.59 53.93 70.18 29.82
16 Dabhel (CT) 6.06 52578 8676.24 1018 600 11.01 38.55 73.33 33.04 33.62 90.52 9.48
17 Daman (M CI) 6.68 44282 6629.04 939 829 12.43 54.20 72.61 31.73 36.81 98.85 1.15
18 Damanwada 53.59 1176 21.94 327 1049 2.12 2.81 81.93 16.92 68.32 94.47 5.53
19 Dashwada 432.59 3871 8.95 817 978 7.15 3.03 76.47 31.13 41.89 96.30 3.70
20 Deva Pardi 32.32 255 7.89 786 754 0.43 87.02 78.59 31.81 58.73 63.98 36.02
21 Devka 138.28 3461 25.03 956 895 3.30 79.12 72.55 32.35 54.10 65.18 34.82
22 Dholar 81.6 1184 14.51 953 827 0.29 91.29 72.00 32.56 45.87 78.91 21.09
23 Dumalav 605.16 6303 10.42 1006 1064 3.24 78.92 79.63 37.33 59.92 49.19 50.81
24 Dunetha (CT) 7.53 12470 1656.04 963 1089 0.43 46.35 80.21 37.76 38.28 91.38 8.62
25 Dungri 202.46 4646 22.95 918 981 4.14 48.69 80.70 35.74 45.37 81.44 18.56
26 Eklahare 232.74 1696 7.29 749 905 1.66 18.00 73.64 28.80 43.59 95.59 4.41

Sr. Village/Town Area in
Hect Population
Pop_den hect
Sex_ratio Sex ratio 0-6 Pop
% of SC Pop
% of ST Pop
Total Liter_rate
Female Literacy Rate
Work Participation rate
%Main Workers
%Marginal Work
27 Jamburi 264.96 1868 7.05 940 747 7.69 45.41 78.60 35.79 60.67 68.40 31.60
28 Jampore 115.8 875 7.56 914 788 11.33 69.67 83.31 37.52 41.90 98.26 1.74
29 Janivankad 280.42 2063 7.36 966 769 3.93 75.18 72.62 33.07 40.73 91.26 8.74
30 Kachigam (CT) 6.41 18434 2875.82 739 872 0.90 6.52 78.11 31.13 39.33 94.15 5.85
31 Kadaiya (CT) 2.93 12717 4340.27 711 785 2.63 6.00 78.89 30.77 41.20 91.01 8.99
32 Kalai 481.66 3191 6.63 609 908 1.38 5.95 74.29 24.41 45.48 96.03 3.97
33 Kalsar 958.04 4967 5.18 917 607 4.11 70.13 77.06 35.06 60.82 90.04 9.96
34 Karaya 307.28 2253 7.33 974 1096 4.46 92.59 77.63 35.77 52.65 50.52 49.48
35 Karvad (CT) 12.22 5746 470.21 938 786 1.75 51.18 77.73 35.55 40.47 93.68 6.32
36 Khadki 199.99 631 3.16 1010 917 5.34 50.63 75.99 35.21 38.60 85.20 14.80
37 Kherlav 294.5 837 2.84 998 958 1.89 92.91 64.97 28.00 36.72 96.34 3.66
38 Khuntej 469.98 3312 7.05 901 952 10.04 39.45 77.11 34.02 41.70 73.21 26.79
39 Kikarla 99.98 432 4.32 940 1096 1.25 57.81 77.93 34.84 45.59 91.79 8.21
40 Kocharva 369 1831 4.96 1049 989 5.26 92.61 79.51 38.66 60.34 50.88 49.12
41 Kolak 350.35 1566 4.47 1018 1143 0.00 98.50 81.51 39.06 59.11 91.08 8.92
42 Koparli 323.12 1715 5.31 938 835 0.26 39.62 80.45 37.31 39.24 97.16 2.84
43 Kumbhariya 357.38 2096 5.86 865 914 9.08 18.07 79.62 34.09 41.66 91.13 8.87
44 Kunta 374.18 1536 4.10 1037 964 0.28 12.48 86.40 42.72 39.32 90.26 9.74
45 Magarwada 659.18 6735 10.22 959 1026 1.62 67.62 70.38 30.72 38.18 87.40 12.60
46 Mohan 933.74 6225 6.67 931 1051 6.61 16.29 85.56 39.40 66.00 53.88 46.12
47 Morai 274.28 1579 5.76 713 1015 4.75 36.18 79.27 29.96 50.41 97.14 2.86
48 Motiwada 303.89 4019 13.23 475 846 6.48 37.73 80.11 22.49 58.17 99.37 0.63
49 Nahuli 315.62 1644 5.21 865 1030 3.90 51.82 75.02 31.57 50.81 78.14 21.86
50 Naila Pardi 29.9 827 27.66 871 841 2.53 64.34 77.14 31.79 47.01 81.01 18.99
51 Namdha 308.77 2192 7.10 863 972 2.99 18.25 78.45 34.58 38.30 96.77 3.23
52 Orvad (CT) 2.32 5420 2336.21 1011 887 4.57 63.34 71.82 33.79 51.16 98.83 1.17
53 Palhit 27.24 345 12.67 917 788 6.07 69.49 73.55 32.47 47.92 84.23 15.77
54 Pali 583.9 2241 3.84 945 891 2.22 29.79 78.83 36.66 42.62 82.59 17.41
Sr. Village/Town Area in
Hect Population
Pop_den hect
Sex_ratio Sex ratio 0-6 Pop
% of SC Pop
% of ST Pop
Total Liter_rate
Female Literacy Rate
Work Participation rate
%Main Workers
%Marginal Work
55 Pali Karambeli 426.04 2356 5.53 971 889 1.62 82.27 73.43 33.20 53.25 75.80 24.20
56 Palsana 279.08 1987 7.12 754 1046 0.33 35.80 67.90 25.00 43.88 96.75 3.25
57 Pandor 389.82 2755 7.07 1034 902 8.85 17.08 83.49 41.35 36.45 94.56 5.44
58 Pardi (M) 13.1 28495 2175.19 984 920 1.22 93.19 76.05 35.42 46.67 63.59 36.41
59 Paria 684.36 3806 5.56 870 822 6.07 53.30 77.09 34.10 41.38 88.63 11.37
60 Pariari 115.45 1891 16.38 1019 1086 4.24 73.08 78.85 36.10 41.86 93.49 6.51
61 Punat 578.52 2621 4.53 991 960 5.15 54.42 74.63 35.67 45.19 92.36 7.64
62 Rata 217.29 1612 7.42 976 886 2.54 63.25 76.52 34.64 40.29 86.49 13.51
63 Rentlav 777.69 3808 4.90 948 852 8.99 55.25 77.49 34.97 40.11 87.58 12.42
64 Ringanwada 147.95 4953 33.48 1030 913 1.99 93.25 73.84 35.02 53.81 58.46 41.54
65 Rohina 814.35 5430 6.67 626 872 0.00 29.67 82.45 29.39 58.20 98.53 1.47
66 Salvav (CT) 8.02 5486 684.04 1045 1227 0.95 95.90 80.68 38.07 44.94 92.46 7.54
67 Saran 300.66 1596 5.31 1042 1140 3.46 84.21 71.30 33.36 44.28 81.26 18.74
68 Sarodhi 414.36 2091 5.05 890 1016 1.93 68.78 73.41 30.92 49.15 91.64 8.36
69 Sonwada 214.52 8806 41.05 975 887 6.22 43.69 80.66 37.46 36.98 89.92 10.08
70 Sukhesh 211.62 1938 9.16 983 884 1.39 35.99 81.66 38.63 42.90 89.05 10.95
71 Sukhlav 405.01 2389 5.90 916 611 0.00 100.00 79.92 37.28 33.46 95.43 4.57
72 Tarakpardi 350.04 2247 6.42 882 846 2.95 1.77 84.00 38.45 33.24 91.89 8.11
73 Tarmaliya 128.32 523 4.08 739 862 1.90 6.83 77.45 30.78 41.12 92.70 7.30
74 Tighara 830.69 4450 5.36 1003 1000 0.00 91.76 79.87 36.61 54.99 91.07 8.93
75 Tukwada 287.28 1293 4.50 848 824 3.03 39.66 81.27 35.60 48.70 81.31 18.69
76 Udwada 662.11 3497 5.28 924 1010 0.00 73.23 69.42 29.70 38.35 93.50 6.50
77 Umarsadi 677.09 3790 5.60 906 865 8.55 86.03 82.08 36.85 44.04 82.20 17.80
78 Valwada 602.79 3922 6.51 996 1034 6.32 83.67 70.45 32.49 40.10 85.71 14.29
79 Vankachh 503.46 1968 3.91 949 950 2.73 23.85 72.36 32.03 39.45 86.58 13.42
80 Vapi (INA) 9.31 34162 3669.39 970 852 4.34 80.50 76.40 35.37 49.03 80.70 19.30
81 Vapi (M) 22.44 163630 7291.89 962 843 0.00 79.74 74.51 33.94 40.15 96.97 3.03
82 Varai 972.03 5028 5.17 983 850 0.00 86.93 65.46 28.42 37.97 96.36 3.64
Sr. Village/Town Area in
Hect Population
Pop_den hect
Sex_ratio Sex ratio 0-6 Pop
% of SC Pop
% of ST Pop
Total Liter_rate
Female Literacy Rate
Work Participation rate
%Main Workers
%Marginal Work
83 Varkund 264.62 5355 20.24 926 789 9.68 53.35 77.76 35.57 57.89 98.53 1.47
84 Vatar 380.7 3525 9.26 998 987 1.37 93.82 71.77 32.09 40.90 90.49 9.51
85 Zari 93.97 1163 12.38 922 832 5.02 56.35 74.43 33.27 44.16 88.97 11.03
Average 30370.69 7674.318 21.48 737 888 2.46 23.51 77.78 30.43 46.04 91.04 8.96
(Source: District Census Handbook of Valsad District,2011.)

Table – 2: Facilities of Public Amenities in villages/towns existing in the 10 Km radial distance from the project
site.
Sr.
Village Name Anganwadi Govt. Primary School
Govt. Vocational Training Centre ITI
Govt. PHC & SC
Tap Water Untreated
River & Canal
Total Sanitation Campaign
Telephone / Mobile
Public/Pvt mode of transportation
Metal Road
Commercial Bank
Agriculture Credit Society
Community Centre
Self Help Groups
Electric Power Supply
1 Janivankad 1 1 2 0 2 2 2 1 1 1 2 2 2 2 1
2 Devka 1 1 2 0 2 2 2 1 1 1 2 2 2 2 1
3 Magarwada 1 1 2 0 2 2 2 1 1 1 2 2 2 2 1
4 Varkund 1 1 2 0 2 2 2 1 1 1 2 2 1 2 1
5 Ringanwada 1 1 1 0 2 2 2 1 1 1 2 2 2 2 1
6 Palhit 1 1 2 0 2 2 2 1 1 1 2 2 2 2 1
7 Bhamati 1 1 2 0 2 2 2 1 1 1 2 2 2 2 1
8 Damanwada 1 1 2 0 2 2 2 1 1 1 2 2 2 2 1
9 Dholar 1 2 2 0 2 2 2 1 1 1 2 2 2 2 1
10 Pariari 1 1 2 0 2 2 2 1 1 1 2 2 1 2 1
11 Jampore 1 1 2 0 2 2 2 1 1 1 2 2 2 2 1
12 Deva Pardi 2 2 2 0 2 2 2 1 1 1 2 2 2 2 1
13 Naila Pardi 1 1 2 0 2 2 2 1 1 1 2 2 2 2 1
14 Zari 1 1 2 0 2 2 2 1 1 1 2 2 1 2 1
15 Ambheti 1 1 2 0 1 1 2 1 1 1 1 1 2 1 1
16 Kalai 1 1 2 0 1 1 2 1 1 1 2 2 1 1 1
17 Pali Karambeli 1 1 2 0 1 1 2 1 1 1 1 1 1 1 1
18 Mohan 1 1 2 0 1 1 2 1 1 1 2 1 2 1 1
19 Jamburi 1 1 2 0 1 1 2 1 1 1 2 2 2 1 1
20 Pali 1 1 2 0 1 1 2 1 1 1 2 2 2 1 1
21 Punat 1 1 2 0 1 1 2 1 1 1 2 2 2 1 1
22 Eklahare 1 1 2 0 1 2 2 1 1 1 2 2 1 1 1
23 Nahuli 1 1 2 0 1 2 2 1 1 1 2 2 1 1 1
24 Valwada 1 1 2 1 1 1 2 1 1 1 1 2 1 1 1
25 Achchhari 1 1 2 0 1 1 2 1 1 1 2 2 2 1 1

Sr.
Village Name Anganwadi Govt. Primary School
Govt. Vocational Training Centre ITI
Govt. PHC & SC
Tap Water Untreated
River & Canal
Total Sanitation Campaign
Telephone / Mobile
Public/Pvt mode of transportation
Metal Road
Commercial Bank
Agriculture Credit Society
Community Centre
Self Help Groups
Electric Power Supply
26 Ambach 1 1 2 1 2 1 2 1 1 1 1 2 1 1 1
27 Amli 1 1 2 1 1 1 2 1 1 1 2 2 1 1 1
28 Bagwada 1 1 2 0 1 1 2 1 1 1 2 2 1 1 1
29 Balda 1 1 2 0 1 1 2 1 1 1 2 2 1 1 1
30 Barai 1 1 2 1 1 1 2 1 1 1 1 1 1 1 1
31 Borlai 1 1 2 0 1 1 2 1 1 1 2 2 1 1 1
32 Chandor 1 1 2 0 1 1 2 1 1 1 2 2 1 1 1
33 Chharwada 1 1 2 0 1 2 2 1 1 1 2 2 1 1 1
34 Dashwada 1 1 2 0 1 2 2 1 1 1 2 2 1 1 1
35 Dumalav 1 1 2 0 1 1 2 1 1 1 2 2 1 1 1
36 Dungri 1 1 2 0 1 2 2 1 1 1 1 2 1 1 1
37 Kalsar 1 1 2 0 1 1 2 1 1 1 2 2 1 1 1
38 Karaya 1 1 2 0 1 1 2 1 1 1 2 2 1 1 1
39 Khadki 1 1 2 0 1 1 2 1 1 1 2 2 1 1 1
40 Kherlav 1 1 2 0 1 1 2 1 1 1 2 2 1 1 1
41 Khuntej 1 1 2 0 1 1 2 1 1 1 2 2 1 1 1
42 Kikarla 1 1 2 0 1 2 2 1 1 1 2 2 1 1 1
43 Kocharva 1 1 2 0 1 2 2 1 1 1 2 1 1 1 1
44 Kolak 1 1 2 0 1 1 2 1 1 1 2 1 1 1 1
45 Koparli 1 1 2 0 1 1 2 1 1 1 2 2 1 1 1
46 Kumbhariya 1 1 2 0 1 1 2 1 1 1 2 2 1 1 1
47 Kunta 1 1 2 0 1 1 2 1 1 1 2 2 1 1 1
48 Morai 1 1 2 0 1 2 2 1 1 1 2 2 1 1 1
49 Motiwada 1 1 2 0 1 2 2 1 1 1 2 2 1 1 1
50 Namdha 1 1 2 0 1 2 2 1 1 1 2 2 1 1 1
51 Palsana 1 1 2 0 1 1 2 1 1 1 2 2 1 1 1

Sr.
Village Name Anganwadi Govt. Primary School
Govt. Vocational Training Centre ITI
Govt. PHC & SC
Tap Water Untreated
River & Canal
Total Sanitation Campaign
Telephone / Mobile
Public/Pvt mode of transportation
Metal Road
Commercial Bank
Agriculture Credit Society
Community Centre
Self Help Groups
Electric Power Supply
52 Pandor 1 1 2 0 1 2 2 1 1 1 2 1 1 1 1
53 Paria 1 1 2 0 1 1 2 1 1 1 2 1 1 1 1
54 Rata 1 1 2 0 1 1 2 1 1 1 2 2 1 1 1
55 Rentlav 1 1 2 0 1 1 2 1 1 1 2 2 1 1 1
56 Rohina 1 1 2 0 1 1 2 1 1 1 2 1 1 1 1
57 Saran 1 1 2 0 1 1 2 1 1 1 2 2 1 1 1
58 Sarodhi 1 1 2 0 1 1 2 1 1 1 2 2 1 1 1
59 Sonwada 1 1 2 0 1 1 2 1 1 1 2 2 1 1 1
60 Sukhesh 1 1 2 0 1 1 2 1 1 1 2 2 1 1 1
61 Sukhlav 1 1 2 0 1 1 2 1 1 1 2 2 1 1 1
62 Tarakpardi 1 1 2 0 1 1 2 1 1 1 2 2 1 1 1
63 Tarmaliya 1 1 2 0 1 1 2 1 1 1 2 2 1 1 1
64 Tighara 1 1 2 1 1 1 2 1 1 1 2 2 1 1 1
65 Tukwada 1 1 2 0 1 1 2 1 1 1 2 2 1 1 1
66 Udwada 1 1 2 0 1 1 2 1 1 1 2 2 1 1 1
67 Umarsadi 1 1 2 1 1 1 2 1 1 1 2 2 1 1 1
68 Vankachh 1 1 2 0 1 1 2 1 1 1 1 1 1 1 1
69 Varai 1 1 2 0 1 1 2 1 1 1 2 2 1 1 1
70 Vatar 1 1 2 0 1 1 2 1 1 1 2 2 1 1 1
71 DAMAN (MCI) 1 1 1 1 1 1 1 1 1 1 1 1 1 1 1
72 Kadaiya (CT) 1 1 1 1 1 1 2 1 1 1 2 2 1 1 1
73 Bhimpore (CT) 1 1 1 1 1 1 1 1 1 1 2 2 1 1 1
74 Dunetha (CT) 1 1 1 1 1 1 1 1 1 1 2 2 1 1 1
75 Dabhel (CT) 1 1 1 1 1 1 1 1 1 1 1 2 1 1 1
76 Kachigam (CT) 1 1 1 1 1 1 1 1 1 1 2 2 1 1 1
77 Balitha (CT) 1 1 1 1 1 1 2 1 1 1 2 2 1 1 1
78 Chanod (CT) 1 1 1 1 1 1 1 1 1 1 1 2 1 1 1
79 Chhiri (CT) 1 1 1 1 1 1 2 1 1 1 2 2 1 1 1

Sr.
Village Name Anganwadi Govt. Primary School
Govt. Vocational Training Centre ITI
Govt. PHC & SC
Tap Water Untreated
River & Canal
Total Sanitation Campaign
Telephone / Mobile
Public/Pvt mode of transportation
Metal Road
Commercial Bank
Agriculture Credit Society
Community Centre
Self Help Groups
Electric Power Supply
80 Karvad (CT) 1 1 1 1 1 1 2 1 1 1 2 2 1 1 1
81 Orvad (CT) 1 1 1 1 1 1 2 1 1 1 2 2 1 1 1
82 Pardi (M) 1 1 1 1 1 1 2 1 1 1 1 1 1 1 1
83 Salvav (CT) 1 1 1 1 1 1 2 1 1 1 2 2 1 1 1
84 Vapi (M) 1 1 1 1 1 1 1 1 1 1 1 1 1 1 1
85 Vapi (INA) 1 1 1 1 1 1 1 1 1 1 1 2 1 1 1 (Source: District Census Handbook of Valsad District, 2011 and updated by respective Village/Town Panchayat)

Annexure – 8: NABET Accreditation of EIA Consultant Organization