Embed Size (px)
Citation preview

Annual Report 2005


Fly leaf front

4
Fly leaf back
1
Annual Report 2005
Registered OfficeGefinor SA23 Avenue de la Porte NeuveLuxembourg
Management CompanyGefinor Management Limited Grand Cayman
Corporate ServicesGefinor Finance SAGefinor Building30 Quai Gustave-Ador1207 Geneva, Switzerland022 718 9300 Telephone 022 718 9301 Facsimile

2

3
Contents
The Company 5Chairman’s Letter 6Five-Year Financial Summary 8Auditors’ Report 9Consolidated Statement of Income 10Consolidated Balance Sheet 11Consolidated Statement of Changes in Equity 12Consolidated Statement of Cash Flows 13Notes to Consolidated Financial Statements 14Management and Directors 27Offices 28

4
5
The Company
Gefinor SA is a holding company incorporated in Luxembourg and is subject to the laws and jurisdiction of Luxembourg, which is a member of the European Union. The status of holding company confers complete liberty on its international investment activityand ensures freedom to select countries and sectors, shift investments and adapt to the needs of investments throughout the world. Generally speaking, the determination of the company’s strategies and the implementation of these strategies are carried out without government interference. Gefinor SA has been awarded the fiscal status of ‘holding milliardaire,’ which submits it to a fixed taxation. Shareholders who are not resident in Luxembourg are not liable for Luxembourg taxation on dividends received. The tax status avoids any double taxation on the revenue of Gefinor SA and enables it to structure its tax planning accordingly for maximum capital protection. Gefinor’s shares are listed on the Luxembourg Stock Exchange.

6
Chairman’s Letter
2005 was a strong year for the global economy. In spite of rising interest rates and substantial increases in energy costs, the US experienced GDP growth of more than 3%, while growth in Japan and Europe followed closely behind. The rapid rise in energy prices in 2005 was significant, but was largely absorbed by the US and other developed economies without any meaningful inflationary impact. As a precautionary measure, central bankers in the US and Europe steadily increased interest rates to control inflation. With the US continuing to run large budget deficits, the dollar continued to devalue against the major global currencies. In the emerging markets, and particularly in the Middle East, high energy prices drove substantial increases in both liquidity and valuation of the local public equity markets for oil-based economies. However, these markets have been exceedingly volatile, as was evidenced by the dramatic fall in several of the Middle East equity markets in the first half of 2006.
The global economic outlook for 2006 is less certain in a complex political and economic environment. In an increasingly inter-dependent global economy, movements in capital markets appear to bear a direct relationship to those of the US. Inflation in the US and Europe continues to be a concern and will most likely provide upward pressure on global interest rates. Rising energy prices, while absorbed in 2005, could have an impact if there are unexpected disruptions to supply. The influence of China and India on the global economy is expected to grow in 2006 and beyond.
Our financial results were satisfactory in 2005, with net income of $18.8 million comparing favorably to the $8.7 million reported in 2004. Total assets at December 31, 2005 came to $333.5 million and stockholders’ equity reached $242.8 million. In 2006, the Board of Directors approved the payment of a dividend of $11 million based on the solid financial performance in 2005. It is worth drawing attention to the fact that, while the Group’s investment strategy continues to emphasize long term capital growth and preservation over maximization of current income, the application of International Financial Reporting Standards (IFRS) in the presentation of the financial statements will certainly lead to greater fluctuations in year to year income figures and asset valuations. IFRS were applied for the first time in the current year’s financial statements.
The investment portfolio performed well in 2005, mainly as a result of our historical long term investment strategy for both real estate and private equity. The Group capitalized on the significant momentum in the public equity markets by reducing most of its exposure to listed securities, mainly European, thereby generating a substantial return of capital and profits.
The real estate portfolio benefited from a flight to quality in Europe and from increased liquidity and improved economic fundamentals in the Middle East. Optimism concerning the economic outlook for the region generated a resurgent interest in high quality real estate assets, with the result that the Group’s property holdings have seen an increase in rental revenue and value.
7
The private equity businesses showed a strong performance in 2005 as portfolio companies in the Gefus investment funds continued to experience substantial business growth. In general, the environment is attractive for US venture capital as the oppor-tunities for exits through public offerings and strategic sales have improved greatly in the past 18 months. As a result, a number of exits and positive valuation events have occurred recently for Gefus portfolio companies. The rise in value of the underlying investments led to an overall increase in the portfolio in 2005 of more than 250% compared to 2004.
The pursuit of growth opportunities continues in the asset management businesses. In the fourth quarter of 2005, Gefinor established GEF Private Equity Partners, SPC (“GEFPEP”) in the Cayman Islands as an access vehicle through which Gefinor and its investment partners can invest in top-performing private equity funds. GEFPEP’s unique structure permits the creation of segregated portfolios, each of which represents discrete investments in private equity funds, offering investors an opportunity to create customized portfolios. The fund advisory business is highly scalable and is an attractive complement to Gefinor’s US direct private equity fund management activities.
As part of a strategic evaluation of our Company, management has implemented a plan to redeploy investments from real estate assets and lending activities and increase the Company’s exposure to private equity. This strategy will begin to affect the investment results in 2006, but will have a more meaningful impact from 2007
onwards. Subject to global market conditions and overall risk tolerances, the investment allocation will shift from concentrated positions in real estate and private equity to a more diversified portfolio in these sectors, with an emphasis on the US and Europe.
Gefinor has maintained its strategy of consolidating its investment operations and in 2005 acquired the remaining interests in the investment banking and asset management businesses in order to have more control over its investments and better service partners and clients. We will continue to seek strategic investors and partners in order to grow these businesses. We will also consider opportunities to attract new capital by capitalizing on the Group’s core competency in private equity and real estate.
We are well positioned to continue to generate strong investment results for our shareholders and will continue to invest in people and infrastructure in order to further improve our investment origination and execution capabilities.
As always, I wish to express my personal thanks to our shareholders, partners, clients and staff for their unwavering support and trust.
Khaled Ousseimi
8
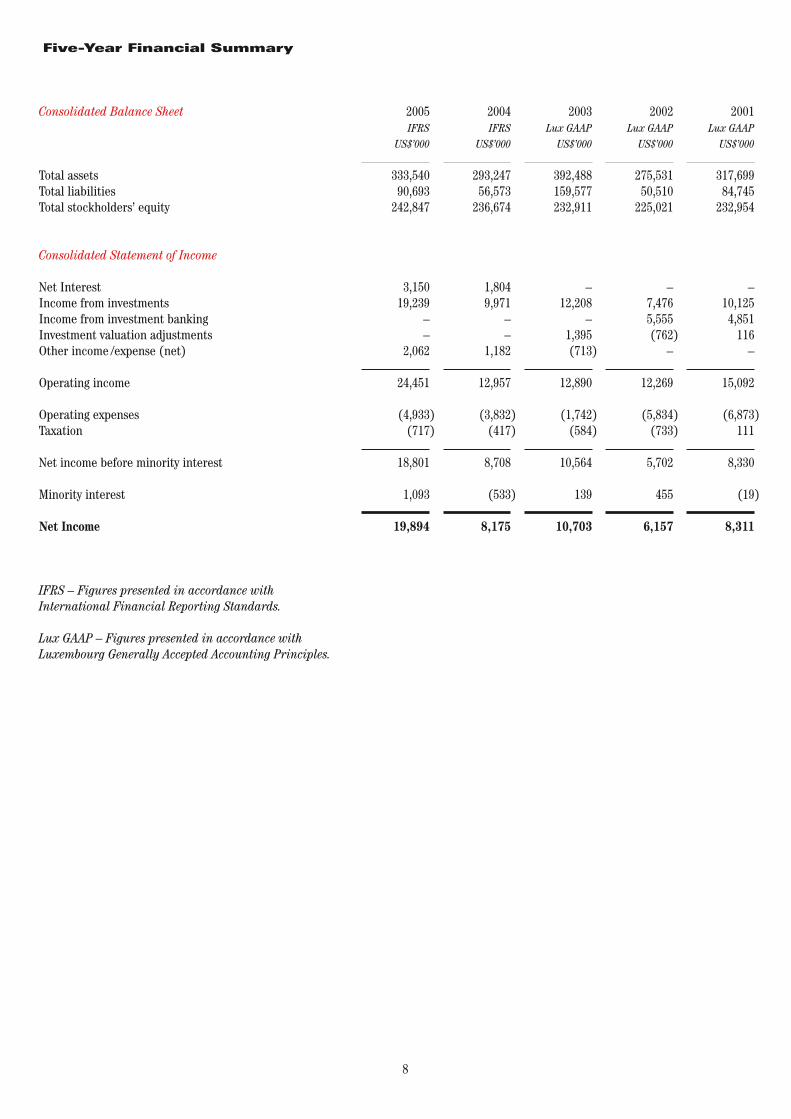
Five-Year Financial Summary
Consolidated Balance Sheet
Total assetsTotal liabilitiesTotal stockholders’ equity
Consolidated Statement of Income
Net InterestIncome from investmentsIncome from investment bankingInvestment valuation adjustmentsOther income /expense (net)
Operating income
Operating expensesTaxation
Net income before minority interest
Minority interest
Net Income
IFRS – Figures presented in accordance with International Financial Reporting Standards.
Lux GAAP – Figures presented in accordance with Luxembourg Generally Accepted Accounting Principles.
2003 Lux GAAP US$’000
392,488 159,577 232,911
– 12,208 – 1,395 (713)
12,890
(1,742) (584)
10,564
139
10,703
2002 Lux GAAP US$’000
275,531 50,510 225,021
– 7,476 5,555 (762) –
12,269
(5,834) (733)
5,702
455
6,157
2001 Lux GAAP US$’000
317,699 84,745 232,954
– 10,125 4,851 116 –
15,092
(6,873) 111
8,330
(19)
8,311
2004 IFRS US$’000
293,247 56,573 236,674
1,804 9,971 – – 1,182
12,957
(3,832) (417)
8,708
(533)
8,175
2005 IFRS US$’000
333,540 90,693 242,847
3,150 19,239 – – 2,062
24,451
(4,933) (717)
18,801
1,093
19,894
9
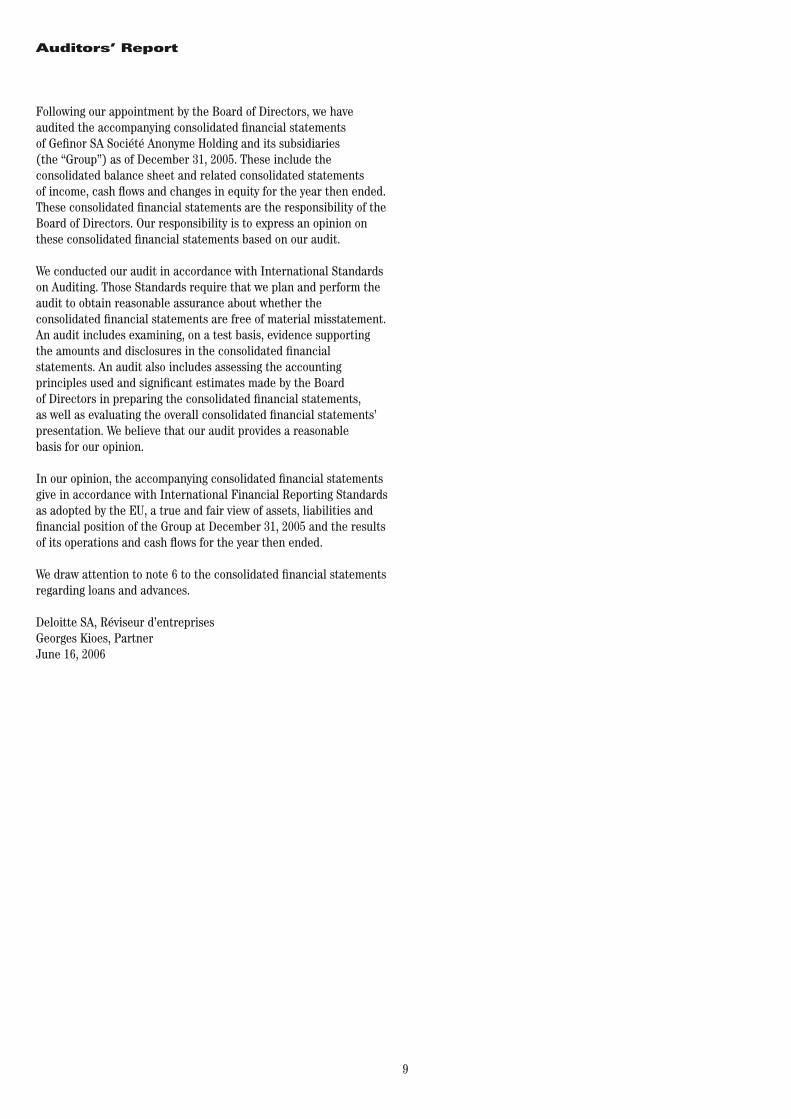
Auditors’ Report
Following our appointment by the Board of Directors, we have audited the accompanying consolidated financial statements of Gefinor SA Société Anonyme Holding and its subsidiaries (the “Group”) as of December 31, 2005. These include the consolidated balance sheet and related consolidated statements of income, cash flows and changes in equity for the year then ended. These consolidated financial statements are the responsibility of the Board of Directors. Our responsibility is to express an opinion on these consolidated financial statements based on our audit.
We conducted our audit in accordance with International Standards on Auditing. Those Standards require that we plan and perform the audit to obtain reasonable assurance about whether the consolidated financial statements are free of material misstatement. An audit includes examining, on a test basis, evidence supporting the amounts and disclosures in the consolidated financial statements. An audit also includes assessing the accounting principles used and significant estimates made by the Board of Directors in preparing the consolidated financial statements, as well as evaluating the overall consolidated financial statements’ presentation. We believe that our audit provides a reasonable basis for our opinion.
In our opinion, the accompanying consolidated financial statements give in accordance with International Financial Reporting Standards as adopted by the EU, a true and fair view of assets, liabilities and financial position of the Group at December 31, 2005 and the results of its operations and cash flows for the year then ended.
We draw attention to note 6 to the consolidated financial statements regarding loans and advances.
Deloitte SA, Réviseur d’entreprises Georges Kioes, Partner June 16, 2006
10
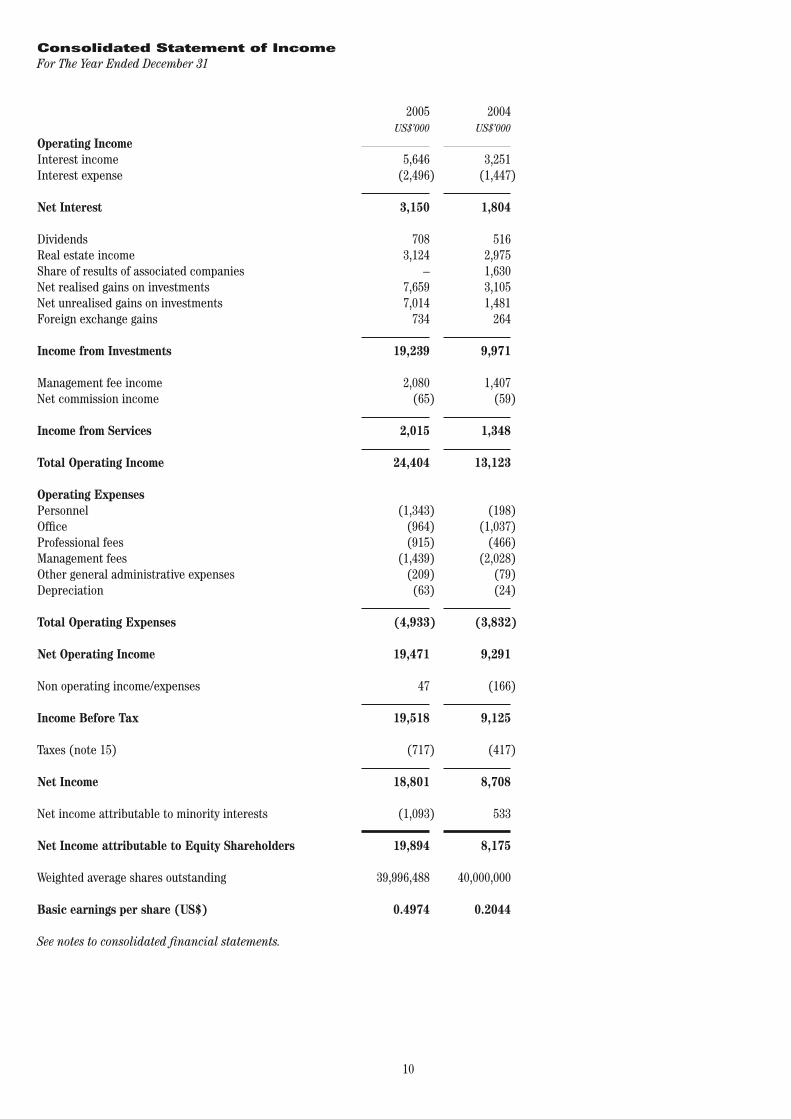
Consolidated Statement of IncomeFor The Year Ended December 31
Operating IncomeInterest incomeInterest expense
Net Interest
DividendsReal estate incomeShare of results of associated companies Net realised gains on investments Net unrealised gains on investments Foreign exchange gains
Income from Investments
Management fee incomeNet commission income
Income from Services
Total Operating Income
2005 US$’000
5,646 (2,496)
3,150
708 3,124 – 7,659 7,014 734
19,239
2,080 (65)
2,015 24,404
2004 US$’000
3,251 (1,447)
1,804
516 2,975 1,630 3,105 1,481 264
9,971
1,407 (59)
1,348
13,123
Operating Expenses Personnel Office Professional fees Management fees Other general administrative expensesDepreciation
Total Operating Expenses
Net Operating Income
Non operating income/expenses
Income Before Tax
Taxes (note 15)
Net Income
Net income attributable to minority interests Net Income attributable to Equity Shareholders
Weighted average shares outstanding
Basic earnings per share (US$)
See notes to consolidated financial statements.
(1,343) (964) (915) (1,439) (209) (63) (4,933)
19,471 47
19,518
(717)
18,801
(1,093)
19,894
39,996,488
0.4974
(198) (1,037) (466) (2,028) (79) (24) (3,832)
9,291 (166)
9,125
(417)
8,708
533
8,175
40,000,000
0.2044
11
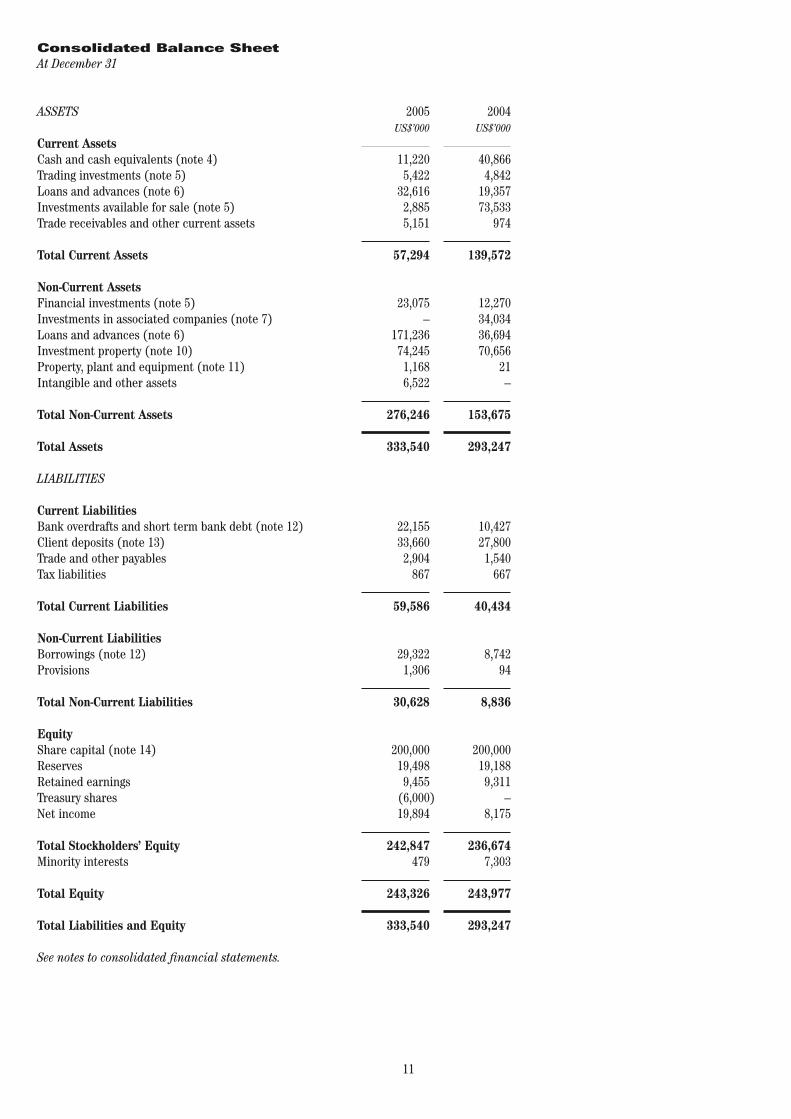
LIABILITIES
Current LiabilitiesBank overdrafts and short term bank debt (note 12)Client deposits (note 13) Trade and other payables Tax liabilities
Total Current Liabilities
Non-Current LiabilitiesBorrowings (note 12) Provisions
Total Non-Current Liabilities
EquityShare capital (note 14)Reserves Retained earningsTreasury sharesNet income
Total Stockholders’ Equity Minority interests
Total Equity
Total Liabilities and Equity
See notes to consolidated financial statements.
Consolidated Balance SheetAt December 31
ASSETS Current AssetsCash and cash equivalents (note 4) Trading investments (note 5) Loans and advances (note 6) Investments available for sale (note 5) Trade receivables and other current assets
Total Current Assets
Non-Current AssetsFinancial investments (note 5) Investments in associated companies (note 7) Loans and advances (note 6) Investment property (note 10) Property, plant and equipment (note 11) Intangible and other assets
Total Non-Current Assets
Total Assets
2005 US$’000
11,220 5,422 32,616 2,885 5,151
57,294
23,075 – 171,236 74,245 1,168 6,522
276,246
333,540
2004 US$’000
40,866 4,842 19,357 73,533 974 139,572
12,270 34,034 36,694 70,656 21 –
153,675
293,247
22,155 33,660 2,904 867 59,586
29,322 1,306 30,628
200,000 19,498 9,455 (6,000) 19,894
242,847 479
243,326
333,540
10,427 27,800 1,540 667 40,434
8,742 94
8,836
200,000 19,188 9,311 – 8,175
236,674 7,303
243,977
293,247
12
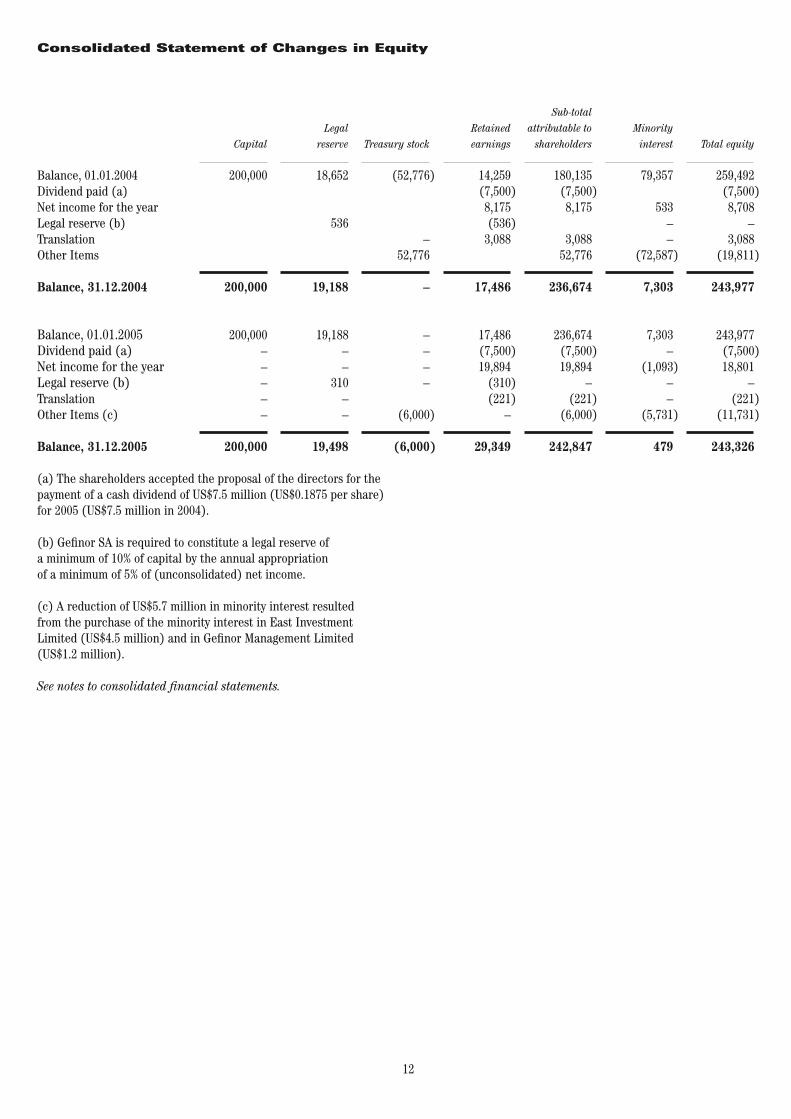
Consolidated Statement of Changes in Equity
Balance, 01.01.2004Dividend paid (a)Net income for the yearLegal reserve (b)TranslationOther Items
Balance, 31.12.2004
Balance, 01.01.2005Dividend paid (a)Net income for the yearLegal reserve (b)TranslationOther Items (c)
Balance, 31.12.2005
Capital 200,000
200,000
200,000 – – – – –
200,000
Legal reserve 18,652
536
19,188
19,188 – – 310 – –
19,498
Treasury stock
(52,776)
– 52,776
–
– – – – (6,000)
(6,000)
Retained earnings
14,259 (7,500) 8,175 (536) 3,088
17,486
17,486 (7,500) 19,894 (310) (221) –
29,349
Sub-total attributable to shareholders 180,135 (7,500) 8,175
3,088 52,776 236,674
236,674 (7,500) 19,894 – (221) (6,000)
242,847
Minority interest
79,357 533 – – (72,587) 7,303
7,303 – (1,093) – – (5,731)
479
Total equity 259,492 (7,500) 8,708 – 3,088 (19,811)
243,977
243,977 (7,500) 18,801 – (221) (11,731)
243,326
(a) The shareholders accepted the proposal of the directors for the payment of a cash dividend of US$7.5 million (US$0.1875 per share) for 2005 (US$7.5 million in 2004).
(b) Gefinor SA is required to constitute a legal reserve of a minimum of 10% of capital by the annual appropriation of a minimum of 5% of (unconsolidated) net income.
(c) A reduction of US$5.7 million in minority interest resulted from the purchase of the minority interest in East Investment Limited (US$4.5 million) and in Gefinor Management Limited (US$1.2 million).
See notes to consolidated financial statements.
13
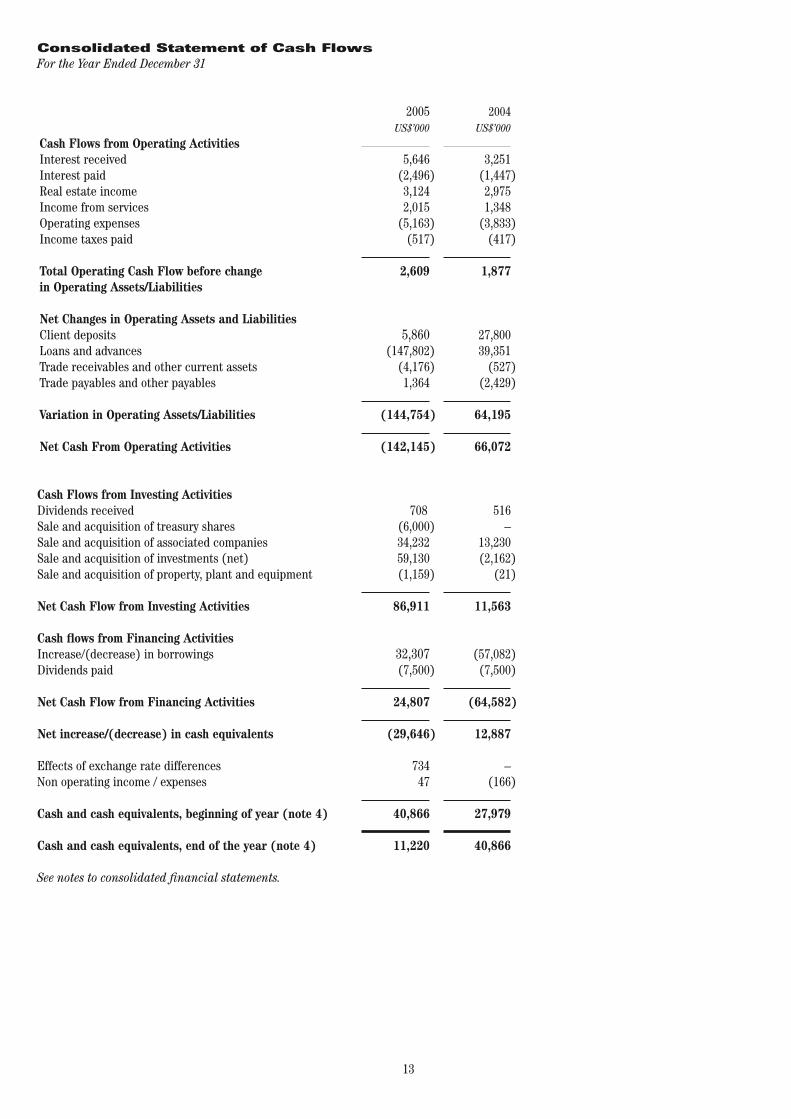
Consolidated Statement of Cash Flows For the Year Ended December 31
Cash Flows from Operating ActivitiesInterest received Interest paid Real estate income Income from services Operating expenses Income taxes paid
Total Operating Cash Flow before change in Operating Assets/Liabilities
Net Changes in Operating Assets and LiabilitiesClient deposits Loans and advances Trade receivables and other current assets Trade payables and other payables
Variation in Operating Assets/Liabilities
Net Cash From Operating Activities
2005 US$’000
5,646 (2,496) 3,124 2,015 (5,163) (517)
2,609
5,860 (147,802) (4,176) 1,364
(144,754)
(142,145)
2004 US$’000
3,251 (1,447) 2,975 1,348 (3,833) (417)
1,877
27,800 39,351 (527) (2,429)
64,195
66,072
Cash Flows from Investing ActivitiesDividends received Sale and acquisition of treasury sharesSale and acquisition of associated companies Sale and acquisition of investments (net) Sale and acquisition of property, plant and equipment
Net Cash Flow from Investing Activities
Cash flows from Financing ActivitiesIncrease/(decrease) in borrowingsDividends paid
Net Cash Flow from Financing Activities
Net increase/(decrease) in cash equivalents Effects of exchange rate differencesNon operating income / expenses
Cash and cash equivalents, beginning of year (note 4)
Cash and cash equivalents, end of the year (note 4)
See notes to consolidated financial statements.
708 (6,000) 34,232 59,130 (1,159) 86,911
32,307 (7,500)
24,807
(29,646)
734 47
40,866
11,220
516 – 13,230 (2,162) (21) 11,563
(57,082) (7,500) (64,582)
12,887
– (166)
27,979
40,866
14
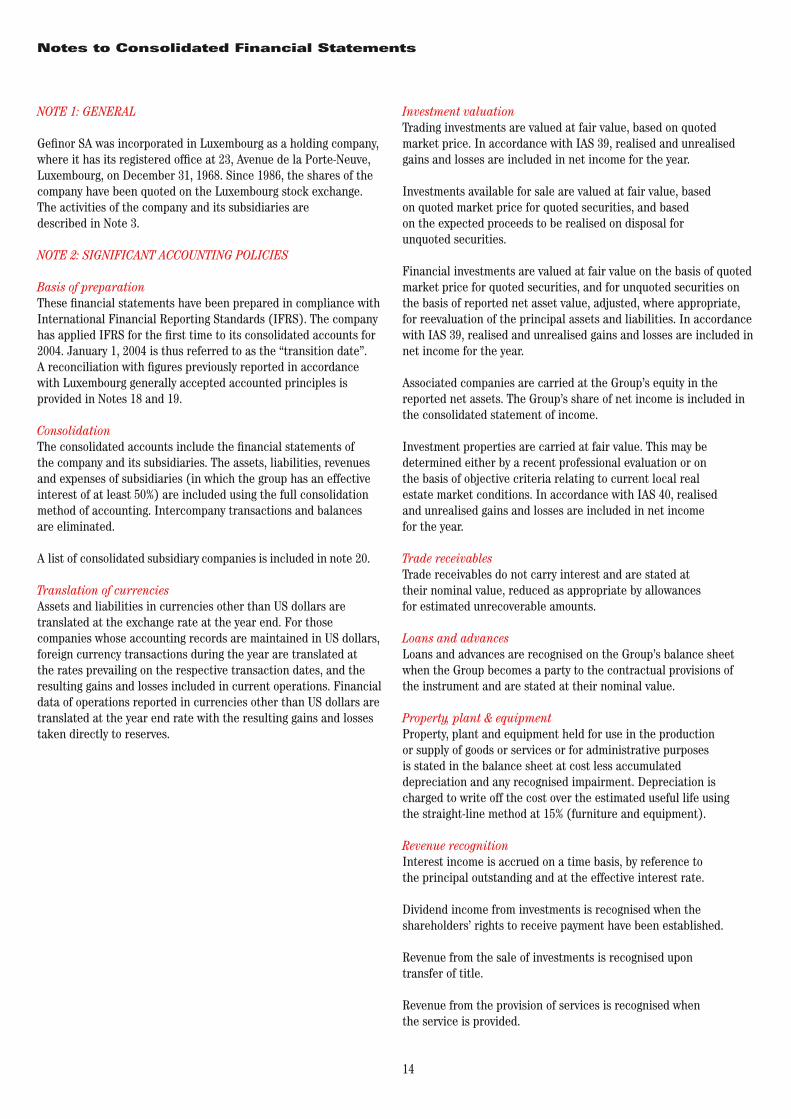
NOTE 1: GENERAL
Gefinor SA was incorporated in Luxembourg as a holding company, where it has its registered office at 23, Avenue de la Porte-Neuve, Luxembourg, on December 31, 1968. Since 1986, the shares of the company have been quoted on the Luxembourg stock exchange. The activities of the company and its subsidiaries are described in Note 3.
NOTE 2: SIGNIFICANT ACCOUNTING POLICIES
Basis of preparation These financial statements have been prepared in compliance with International Financial Reporting Standards (IFRS). The company has applied IFRS for the first time to its consolidated accounts for 2004. January 1, 2004 is thus referred to as the “transition date”. A reconciliation with figures previously reported in accordance with Luxembourg generally accepted accounted principles is provided in Notes 18 and 19.
Consolidation The consolidated accounts include the financial statements of the company and its subsidiaries. The assets, liabilities, revenues and expenses of subsidiaries (in which the group has an effective interest of at least 50%) are included using the full consolidation method of accounting. Intercompany transactions and balances are eliminated.
A list of consolidated subsidiary companies is included in note 20.
Translation of currencies Assets and liabilities in currencies other than US dollars are translated at the exchange rate at the year end. For those companies whose accounting records are maintained in US dollars, foreign currency transactions during the year are translated at the rates prevailing on the respective transaction dates, and the resulting gains and losses included in current operations. Financial data of operations reported in currencies other than US dollars are translated at the year end rate with the resulting gains and losses taken directly to reserves.
Investment valuation Trading investments are valued at fair value, based on quoted market price. In accordance with IAS 39, realised and unrealised gains and losses are included in net income for the year.
Investments available for sale are valued at fair value, based on quoted market price for quoted securities, and based on the expected proceeds to be realised on disposal for unquoted securities.
Financial investments are valued at fair value on the basis of quoted market price for quoted securities, and for unquoted securities on the basis of reported net asset value, adjusted, where appropriate, for reevaluation of the principal assets and liabilities. In accordance with IAS 39, realised and unrealised gains and losses are included in net income for the year.
Associated companies are carried at the Group’s equity in the reported net assets. The Group’s share of net income is included in the consolidated statement of income.
Investment properties are carried at fair value. This may be determined either by a recent professional evaluation or on the basis of objective criteria relating to current local real estate market conditions. In accordance with IAS 40, realised and unrealised gains and losses are included in net income for the year.
Trade receivables Trade receivables do not carry interest and are stated at their nominal value, reduced as appropriate by allowances for estimated unrecoverable amounts.
Loans and advances Loans and advances are recognised on the Group’s balance sheet when the Group becomes a party to the contractual provisions of the instrument and are stated at their nominal value.
Property, plant & equipment Property, plant and equipment held for use in the production or supply of goods or services or for administrative purposes is stated in the balance sheet at cost less accumulated depreciation and any recognised impairment. Depreciation is charged to write off the cost over the estimated useful life using the straight-line method at 15% (furniture and equipment).
Revenue recognition Interest income is accrued on a time basis, by reference to the principal outstanding and at the effective interest rate.
Dividend income from investments is recognised when the shareholders’ rights to receive payment have been established.
Revenue from the sale of investments is recognised upon transfer of title.
Revenue from the provision of services is recognised when the service is provided.
Notes to Consolidated Financial Statements
15
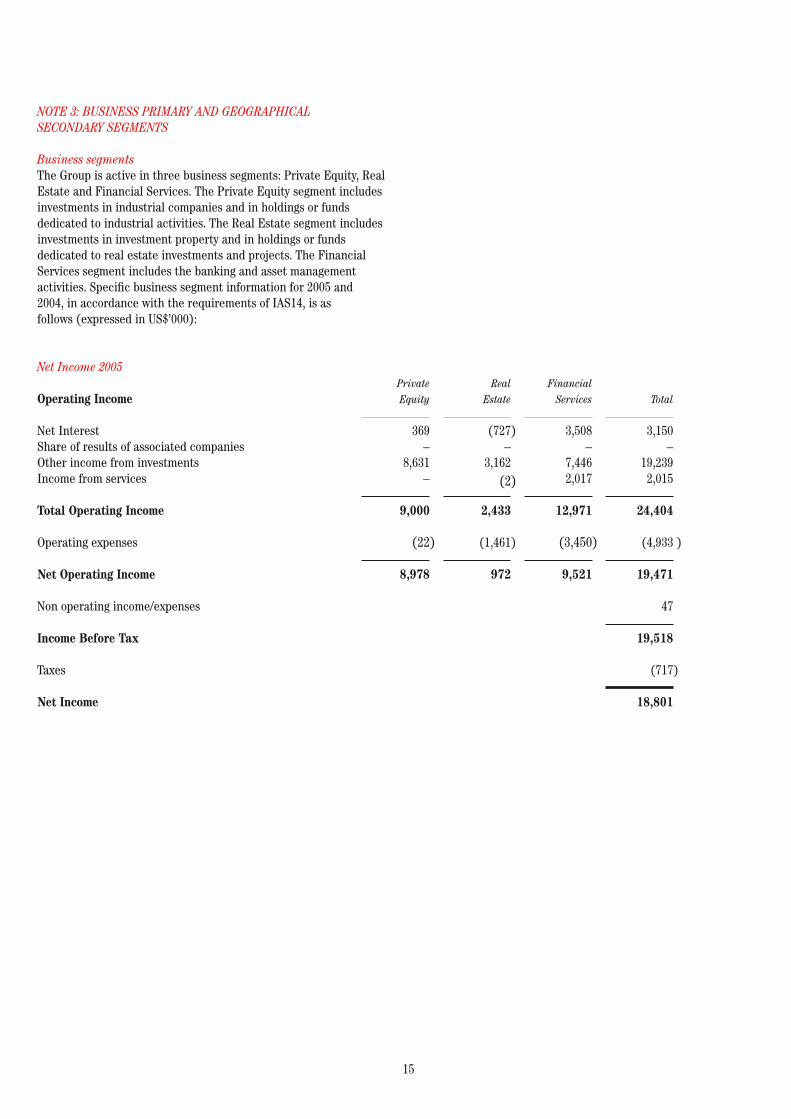
NOTE 3: BUSINESS PRIMARY AND GEOGRAPHICAL SECONDARY SEGMENTS
Business segments The Group is active in three business segments: Private Equity, Real Estate and Financial Services. The Private Equity segment includes investments in industrial companies and in holdings or funds dedicated to industrial activities. The Real Estate segment includes investments in investment property and in holdings or funds dedicated to real estate investments and projects. The Financial Services segment includes the banking and asset management activities. Specific business segment information for 2005 and 2004, in accordance with the requirements of IAS14, is as follows (expressed in US$’000):
Net Income 2005
Operating Income
Net InterestShare of results of associated companiesOther income from investments Income from services
Total Operating Income
Operating expenses
Net Operating Income
Non operating income/expenses
Income Before Tax
Taxes
Net Income
Private Equity
369 – 8,631 –
9,000
(22)
8,978
Real Estate
(727) – 3,162 (2)
2,433
(1,461)
972
Financial Services
3,508 – 7,446 2,017
12,971
(3,450)
9,521
Total
3,150 – 19,239 2,015
24,404
(4,933 )
19,471
47
19,518
(717)
18,801
16
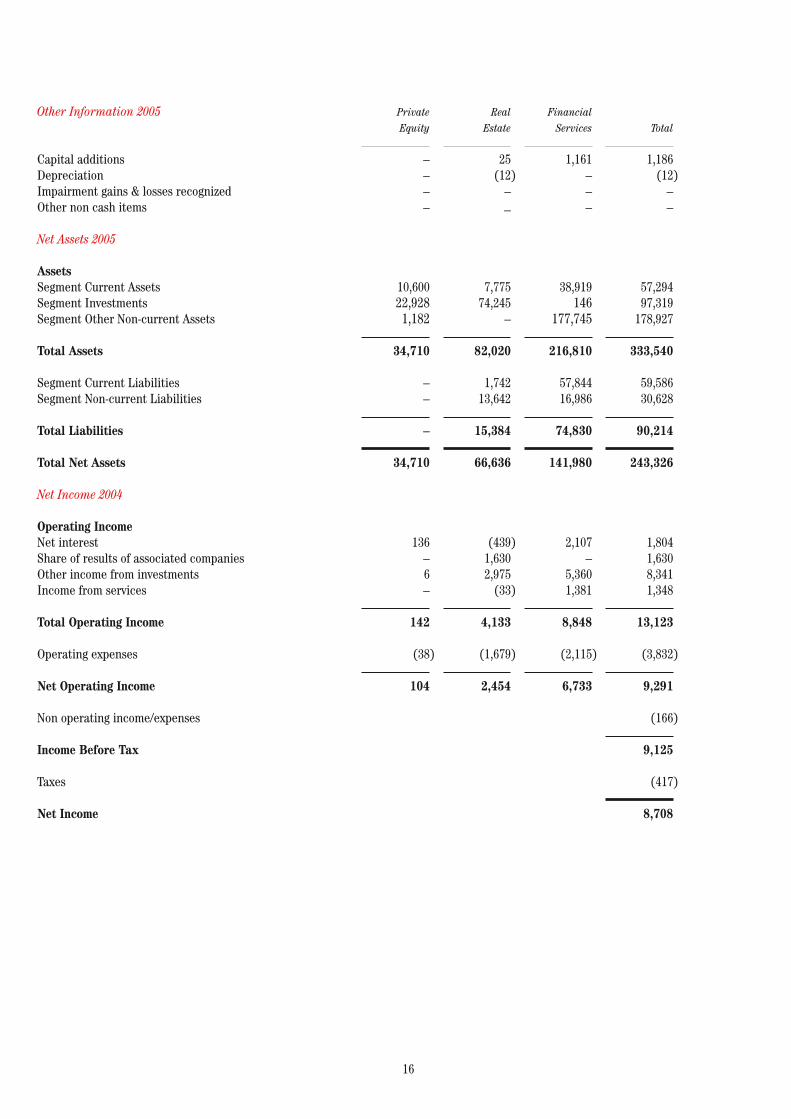
Other Information 2005
Capital additions Depreciation Impairment gains & losses recognizedOther non cash items
Net Assets 2005
AssetsSegment Current Assets Segment Investments Segment Other Non-current Assets
Total Assets Segment Current LiabilitiesSegment Non-current Liabilities
Total Liabilities
Total Net Assets
Net Income 2004
Operating IncomeNet interest Share of results of associated companies Other income from investments Income from services
Total Operating Income
Operating expenses
Net Operating Income
Non operating income/expenses
Income Before Tax
Taxes Net Income
Private Equity
– – – –
10,600 22,928 1,182
34,710
– –
–
34,710
136 – 6 – 142
(38)
104
Real Estate
25 (12) – –
7,775 74,245 –
82,020
1,742 13,642
15,384
66,636
(439) 1,630 2,975 (33)
4,133
(1,679)
2,454
Financial Services
1,161 – – –
38,919 146 177,745
216,810
57,844 16,986
74,830
141,980
2,107 – 5,360 1,381
8,848
(2,115)
6,733
Total
1,186 (12) – –
57,294 97,319 178,927
333,540
59,586 30,628
90,214
243,326
1,804 1,630 8,341 1,348
13,123
(3,832)
9,291
(166)
9,125
(417)
8,708
17
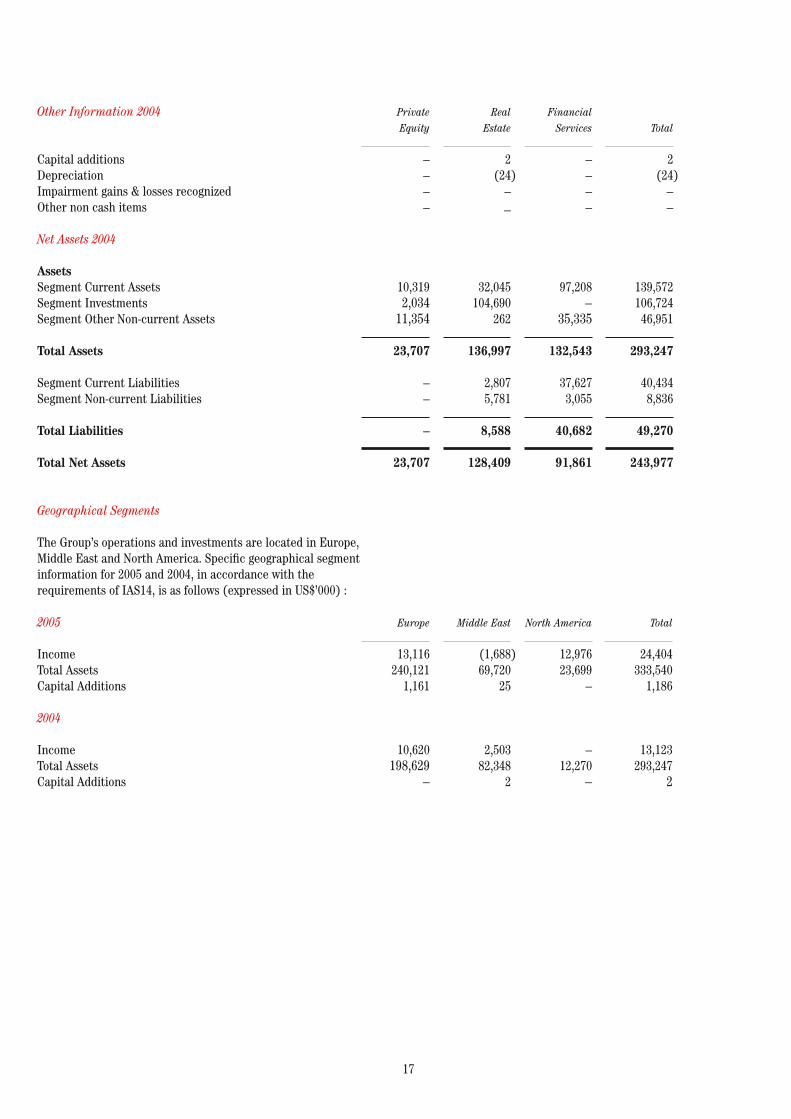
Other Information 2004
Capital additions Depreciation Impairment gains & losses recognizedOther non cash items
Net Assets 2004
AssetsSegment Current Assets Segment Investments Segment Other Non-current Assets Total Assets Segment Current Liabilities Segment Non-current Liabilities Total Liabilities
Total Net Assets
Private Equity
– – – –
10,319 2,034 11,354
23,707
– –
–
23,707
Real Estate
2 (24) – –
32,045 104,690 262
136,997
2,807 5,781
8,588
128,409
Financial Services
– – – –
97,208 – 35,335
132,543
37,627 3,055
40,682
91,861
Total
2 (24) – –
139,572 106,724 46,951
293,247
40,434 8,836
49,270
243,977
Europe
13,116 240,121 1,161
10,620 198,629 –
Middle East
(1,688) 69,720 25
2,503 82,348 2
North America
12,976 23,699 –
– 12,270 –
Geographical Segments
The Group’s operations and investments are located in Europe, Middle East and North America. Specific geographical segment information for 2005 and 2004, in accordance with the requirements of IAS14, is as follows (expressed in US$’000) :
2005
Income Total AssetsCapital Additions
2004
IncomeTotal Assets Capital Additions
Total
24,404 333,540 1,186
13,123 293,247 2

18
NOTE 4: CASH AND CASH EQUIVALENTS
Cash and cash equivalents consist of current accounts and short term deposits with banks.
NOTE 5: INVESTMENTS Trading InvestmentsScottish World Fund Portfolio
Investments available for sale Compagnie LebonGef Real Estate Holding SAGef Holding SA – shares Gef Holding – shareholders’ loan
Financial InvestmentsGefus Capital Partners I, LPAlexander Doll Company Kaizen Breakthrough PartnershipGEF Private Equity Partners, SPC Other investments
Trading investments consist essentially of listed equity securities with no fixed maturity or coupon rate and present the opportunity for return through dividend income and trading gains.
Investments available for sale are quoted and unquoted securities.
Financial investments consist of unquoted securities and investments in limited partnerships in which the company has no significant influence (as defined by IAS 28).
2005 US$’000
5,422
5,422
2,885 – – – 2,885
17,712 1,744 3,322 143 154
23,075
2004 US$’000
4,842 4,842 5,521 42,685 6,368 18,959
73,533
3,885 1,733 6,644 – 8 12,270
19
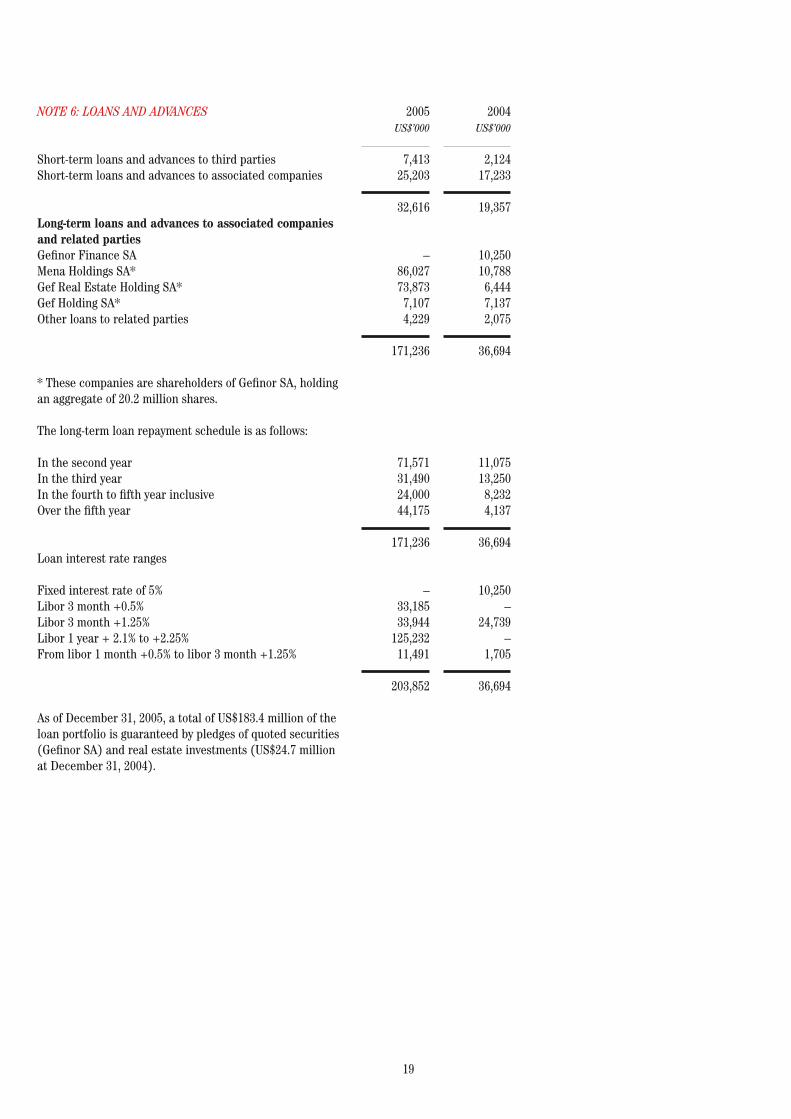
NOTE 6: LOANS AND ADVANCES
Short-term loans and advances to third partiesShort-term loans and advances to associated companies Long-term loans and advances to associated companies and related partiesGefinor Finance SAMena Holdings SA*Gef Real Estate Holding SA* Gef Holding SA* Other loans to related parties
* These companies are shareholders of Gefinor SA, holding an aggregate of 20.2 million shares.
The long-term loan repayment schedule is as follows:
In the second year In the third year In the fourth to fifth year inclusive Over the fifth year
Loan interest rate ranges
Fixed interest rate of 5% Libor 3 month +0.5% Libor 3 month +1.25% Libor 1 year + 2.1% to +2.25% From libor 1 month +0.5% to libor 3 month +1.25%
As of December 31, 2005, a total of US$183.4 million of the loan portfolio is guaranteed by pledges of quoted securities (Gefinor SA) and real estate investments (US$24.7 millionat December 31, 2004).
2005 US$’000
7,413 25,203
32,616
– 86,027 73,873 7,107 4,229
171,236
71,571 31,490 24,000 44,175
171,236
– 33,185 33,944 125,232 11,491
203,852
2004 US$’000
2,124 17,233
19,357
10,250 10,788 6,444 7,137 2,075
36,694
11,075 13,250 8,232 4,137
36,694
10,250 – 24,739 – 1,705
36,694
20
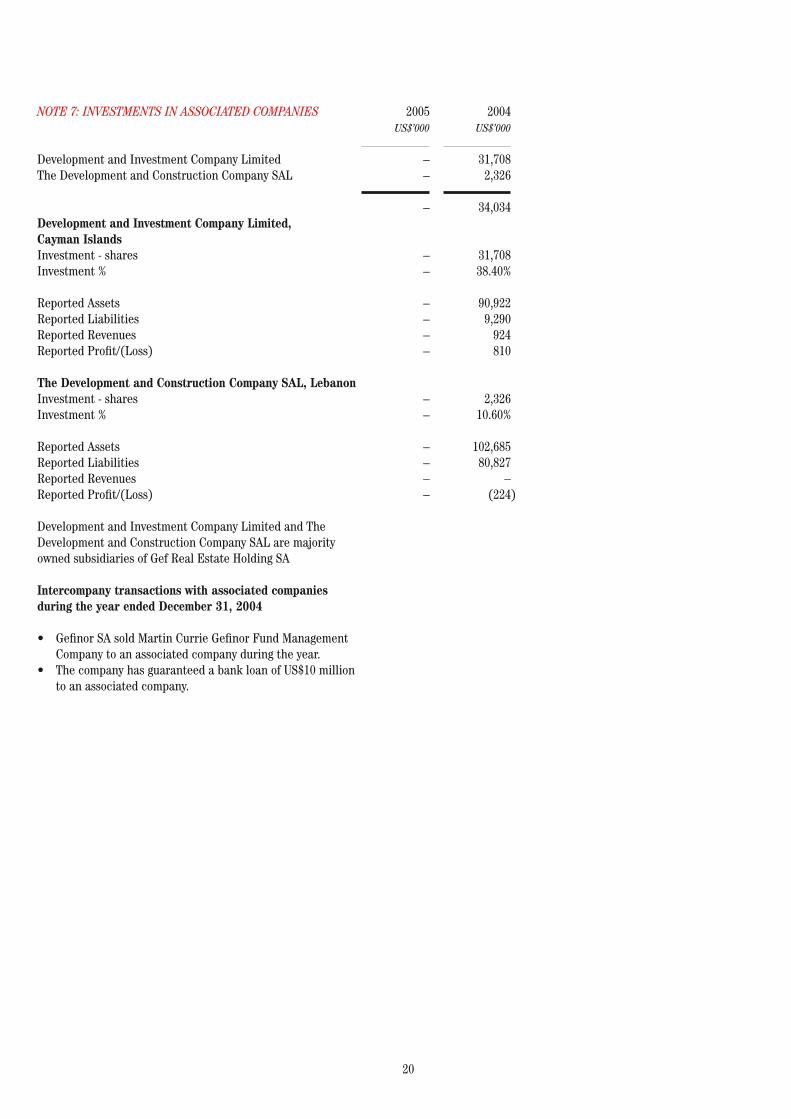
NOTE 7: INVESTMENTS IN ASSOCIATED COMPANIES
Development and Investment Company LimitedThe Development and Construction Company SAL
Development and Investment Company Limited, Cayman IslandsInvestment - shares Investment %
Reported Assets Reported Liabilities Reported Revenues Reported Profit/(Loss)
The Development and Construction Company SAL, LebanonInvestment - shares Investment %
Reported Assets Reported LiabilitiesReported RevenuesReported Profit/(Loss)
Development and Investment Company Limited and The Development and Construction Company SAL are majority owned subsidiaries of Gef Real Estate Holding SA
Intercompany transactions with associated companies during the year ended December 31, 2004
• Gefinor SA sold Martin Currie Gefinor Fund Management Company to an associated company during the year. • The company has guaranteed a bank loan of US$10 million to an associated company.
2005 US$’000
– –
–
– – – – – –
– –
– – – –
2004 US$’000
31,708 2,326
34,034
31,708 38.40%
90,922 9,290 924 810
2,326 10.60%
102,685 80,827 – (224)

21
NOTE 9: OTHER RELATED PARTY INFORMATION
Remuneration allocated to the Board of Directors in 2005 is US$50 thousand (2004 – US$50 thousand).
NOTE 10: INVESTMENT PROPERTIES
Gefinor Center, Beirut Gefinor Building, GenevaByblos Land
• The Company’s subsidiary, Real Estate Development Company SAL (REDCO), owns and manages the Gefinor Center in Beirut. REDCO was acquired directly in 2004 by Gefinor SA from Gef Real Estate Holding SA, a former subsidiary, for US$65 million and almost the whole of the purchase price, representing the fair value of the property, was allocated to the Gefinor Center. • The Gefinor building in Geneva is owned by Gefinor Finance SA a wholly owned subsidiary acquired in 2005 by Gefinor SA • Land held for development is undeveloped real estate with a surface area of 856,952 m2 in the Byblos area of Lebanon. Because of the situation of the properties in a relatively undeveloped zone, the fair value is estimated not to exceed the accumulated costs of acquisition. • Rental income from investment properties is disclosed in Note 3.
2005 US$’000
63,250 8,962 2,033
74,245
2004 US$’000
63,623 – 7,033
70,656
NOTE 8: SUBSIDIARIES
Transactions during the year ended December 31, 2004 • During the year the investment in Gef Real Estate Holding SA, previously a consolidated subsidiary, was reduced from 51% to 27%. • The effective interest in Investment and Management Company, Development and Investment Company Limited, The Development and Construction Company SAL and National Real Estate Company SAL, subsidiaries of Gef Real Estate Holding SA, were reduced accordingly. • Real Estate Development Company SAL and General Company for Car Services SAL were acquired by Gefinor SA from Gef Real Estate Holding SA • An 80% interest in Real Estate and Commercial Development Company SAL was acquired from Mena Holdings SA • Gefinor SA acquired Gefinor Bank Limited and its subsidiary, Scottish World Fund, during the year from an associated company.
Transactions during the year ended December 31, 2005 • Gefinor SA acquired a 40% minority interest in East Investments limited • Gefinor SA acquired a 40% minority interest in Gefinor Management Limited • Gefinor SA sold its 28.2% minority interest in Development and Investment Company Limited • Real Estate Development Company SAL sold its 10.2% minority interest in Development and Investment Company Limited • Gefinor SA sold its 10.6% minority interest in The Development and Construction Company SAL • Gefinor SA sold its 26.92% minority interest in Gef Real Estate Holding SA • Gefinor SA sold its 31% minority interest in Gef Holding SA • Gefinor SA sold its 100% interest in the General Company for Car Services SAL • Gefinor SA acquired a 100% interest in Gefinor Finance SA • Gefinor SA acquired a 100% interest in Gefinor Finance SAL • Gefinor SA acquired a 100% interest in Gefinor (USA) Inc. • Gefinor SA acquired a 100% interest in Gefinor Capital Advisors Limited • Gefinor SA acquired a 1% interest in KUSA, LLC • Gefinor SA acquired a 5% interest in Gefinor Acquisition I, LLC • The company acquired 512,820 treasury shares representing an interest of 1.28% • The company acquired an interest in Gef Private Equity Partnership
22
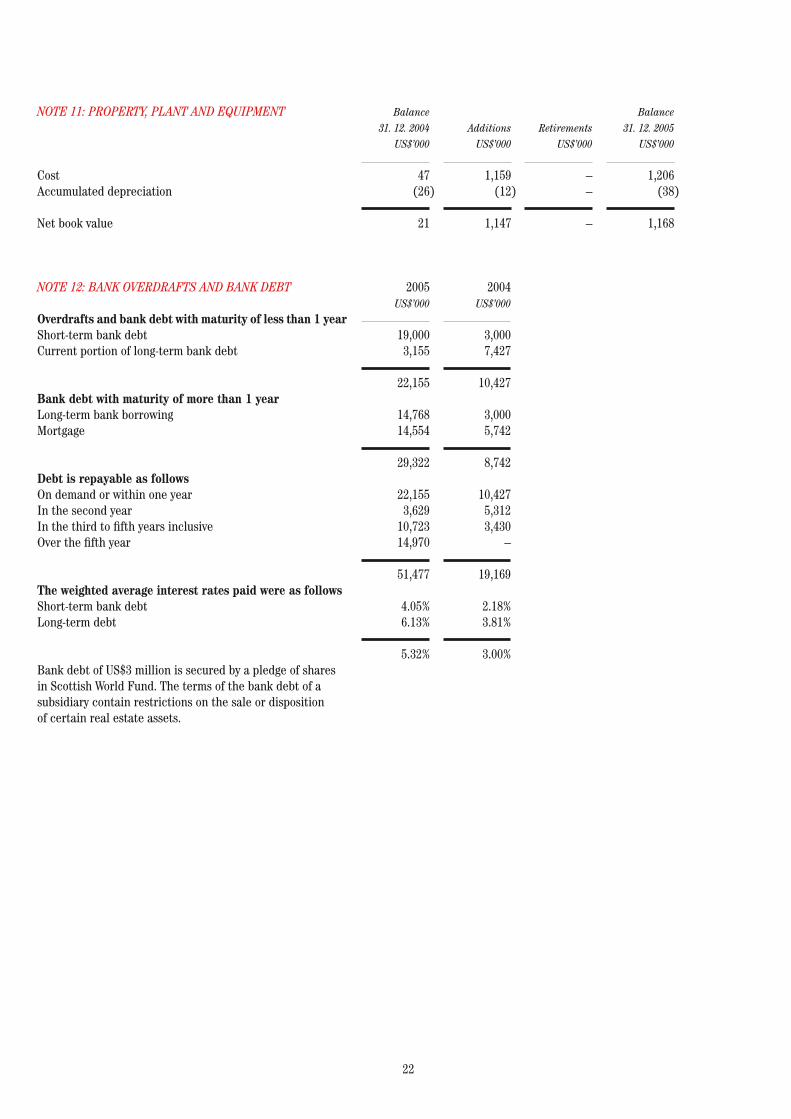
NOTE 11: PROPERTY, PLANT AND EQUIPMENT
CostAccumulated depreciation
Net book value
Balance 31. 12. 2004 US$’000
47 (26)
21
Additions US$’000
1,159 (12)
1,147
Retirements US$’000
– –
–
Balance 31. 12. 2005 US$’000
1,206 (38)
1,168
NOTE 12: BANK OVERDRAFTS AND BANK DEBT Overdrafts and bank debt with maturity of less than 1 year Short-term bank debt Current portion of long-term bank debt
Bank debt with maturity of more than 1 year Long-term bank borrowing Mortgage
Debt is repayable as followsOn demand or within one year In the second year In the third to fifth years inclusive Over the fifth year
The weighted average interest rates paid were as followsShort-term bank debtLong-term debt Bank debt of US$3 million is secured by a pledge of shares in Scottish World Fund. The terms of the bank debt of a subsidiary contain restrictions on the sale or disposition of certain real estate assets.
2005 US$’000
19,000 3,155
22,155
14,768 14,554 29,322
22,155 3,629 10,723 14,970
51,477
4.05% 6.13% 5.32%
2004 US$’000
3,000 7,427
10,427
3,000 5,742 8,742
10,427 5,312 3,430 –
19,169
2.18% 3.81% 3.00%
23
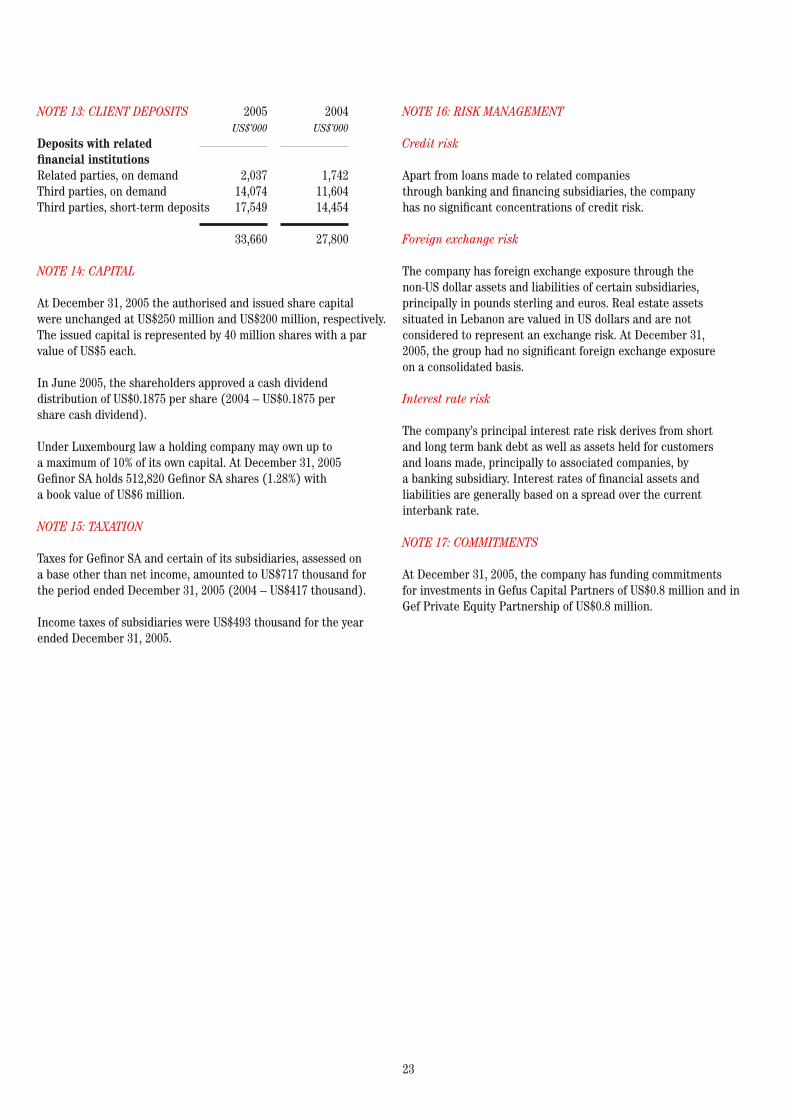
NOTE 13: CLIENT DEPOSITS
Deposits with related financial institutionsRelated parties, on demand Third parties, on demand Third parties, short-term deposits
NOTE 14: CAPITAL
At December 31, 2005 the authorised and issued share capital were unchanged at US$250 million and US$200 million, respectively. The issued capital is represented by 40 million shares with a par value of US$5 each.
In June 2005, the shareholders approved a cash dividend distribution of US$0.1875 per share (2004 – US$0.1875 per share cash dividend).
Under Luxembourg law a holding company may own up to a maximum of 10% of its own capital. At December 31, 2005 Gefinor SA holds 512,820 Gefinor SA shares (1.28%) with a book value of US$6 million.
NOTE 15: TAXATION
Taxes for Gefinor SA and certain of its subsidiaries, assessed on a base other than net income, amounted to US$717 thousand for the period ended December 31, 2005 (2004 – US$417 thousand).
Income taxes of subsidiaries were US$493 thousand for the year ended December 31, 2005.
2005 US$’000
2,037 14,074 17,549
33,660
2004 US$’000
1,742 11,604 14,454
27,800
NOTE 16: RISK MANAGEMENT
Credit risk
Apart from loans made to related companies through banking and financing subsidiaries, the company has no significant concentrations of credit risk.
Foreign exchange risk
The company has foreign exchange exposure through the non-US dollar assets and liabilities of certain subsidiaries, principally in pounds sterling and euros. Real estate assets situated in Lebanon are valued in US dollars and are not considered to represent an exchange risk. At December 31, 2005, the group had no significant foreign exchange exposure on a consolidated basis.
Interest rate risk
The company’s principal interest rate risk derives from short and long term bank debt as well as assets held for customers and loans made, principally to associated companies, by a banking subsidiary. Interest rates of financial assets and liabilities are generally based on a spread over the current interbank rate.
NOTE 17: COMMITMENTS
At December 31, 2005, the company has funding commitments for investments in Gefus Capital Partners of US$0.8 million and in Gef Private Equity Partnership of US$0.8 million.
24
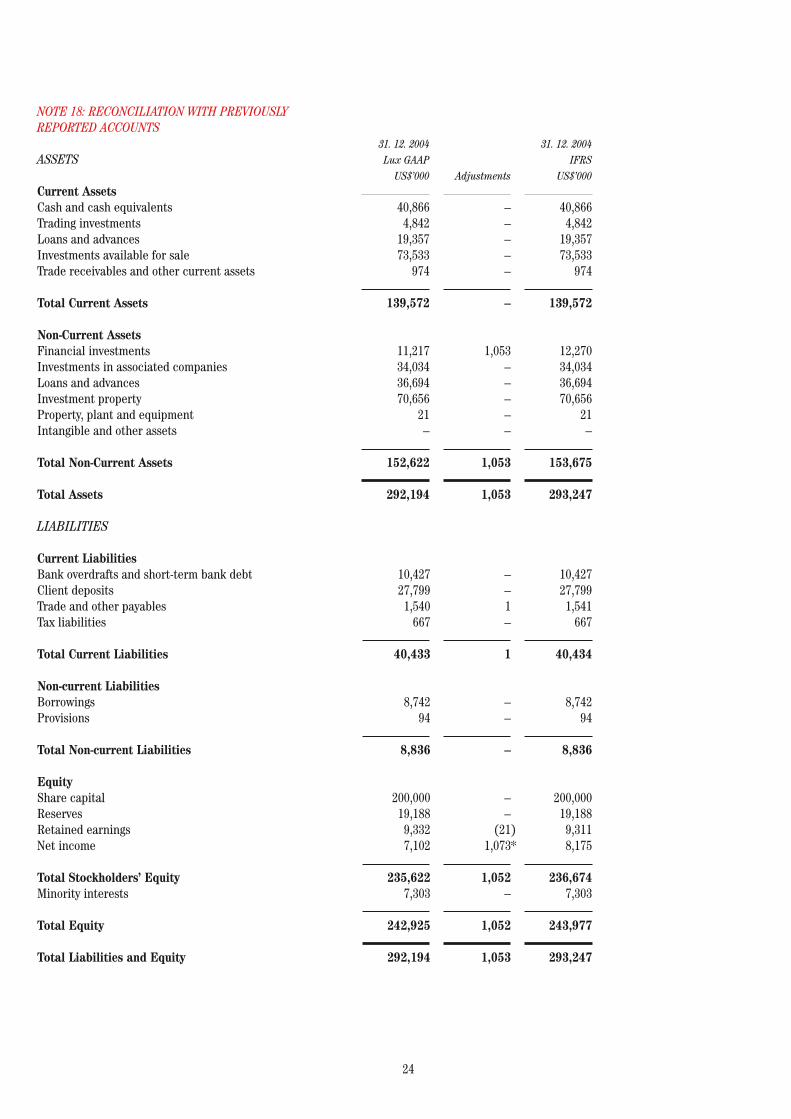
NOTE 18: RECONCILIATION WITH PREVIOUSLY REPORTED ACCOUNTS
ASSETS
Current AssetsCash and cash equivalents Trading investments Loans and advances Investments available for sale Trade receivables and other current assets
Total Current Assets
Non-Current Assets Financial investments Investments in associated companies Loans and advances Investment property Property, plant and equipment Intangible and other assets
Total Non-Current Assets
Total Assets
31. 12. 2004 Lux GAAP US$’000
40,866 4,842 19,357 73,533 974
139,572
11,217 34,034 36,694 70,656 21 –
152,622
292,194
Adjustments
– – – – – –
1,053 – – – – –
1,053
1,053
31. 12. 2004 IFRS US$’000
40,866 4,842 19,357 73,533 974
139,572
12,270 34,034 36,694 70,656 21 –
153,675
293,247
10,427 27,799 1,540 667
40,433
8,742 94 8,836
200,000 19,188 9,332 7,102
235,622 7,303
242,925
292,194
– – 1 – 1
– – –
– – (21) 1,073*
1,052 –
1,052
1,053
10,427 27,799 1,541 667
40,434
8,742 94 8,836
200,000 19,188 9,311 8,175
236,674 7,303
243,977
293,247
LIABILITIES
Current LiabilitiesBank overdrafts and short-term bank debt Client deposits Trade and other payables Tax liabilities
Total Current Liabilities
Non-current LiabilitiesBorrowings Provisions
Total Non-current Liabilities
EquityShare capital Reserves Retained earnings Net income
Total Stockholders’ Equity Minority interests
Total Equity
Total Liabilities and Equity
25
Year ending 31. 12. 2004 IFRS US$’000
3,251 (1,447)
1,804
516 2,975 1,630 3,105 1,481 264
9,971
1,407 (59)
1,348
13,123
(198) (1,037) (466) (2,028) (79) (24)
(3,832)
9,291
(166)
9,125
(417)
8,708
(533)
8,175
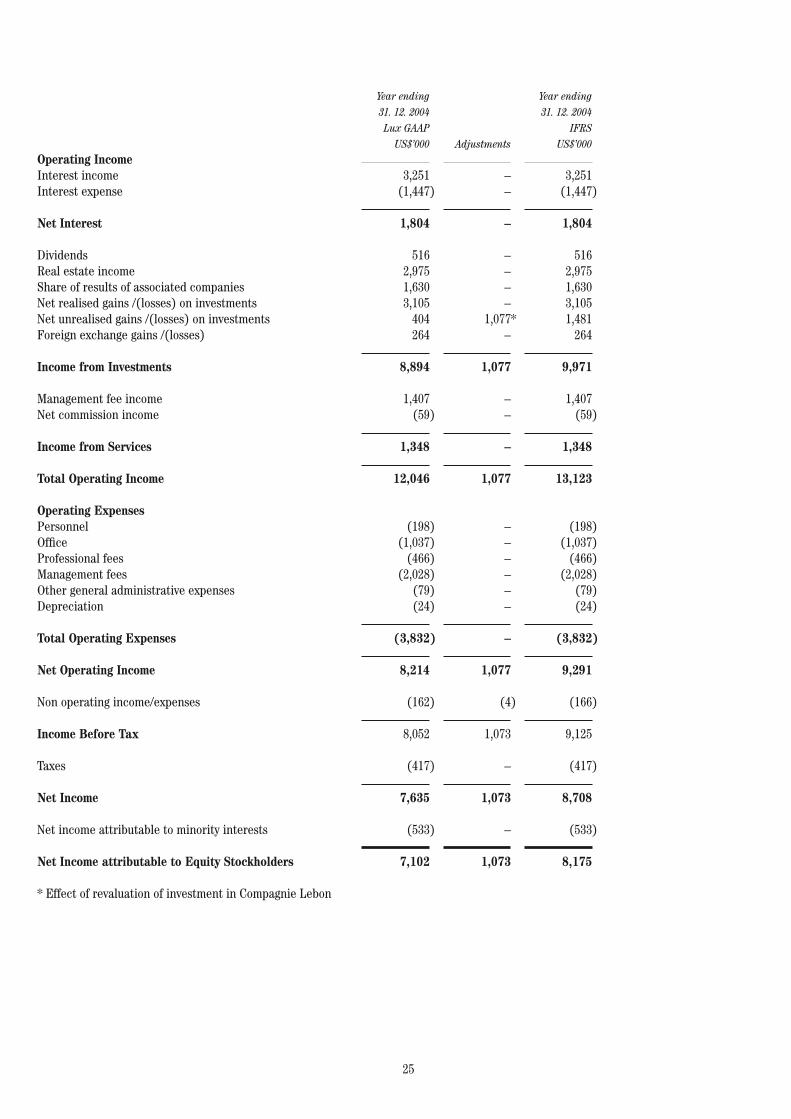
Operating IncomeInterest income Interest expense
Net Interest
Dividends Real estate income Share of results of associated companies Net realised gains /(losses) on investments Net unrealised gains /(losses) on investments Foreign exchange gains /(losses)
Income from Investments
Management fee income Net commission income
Income from Services
Total Operating Income
Operating ExpensesPersonnel Office Professional fees Management fees Other general administrative expenses Depreciation
Total Operating Expenses
Net Operating Income
Non operating income/expenses
Income Before Tax
Taxes
Net Income
Net income attributable to minority interests
Net Income attributable to Equity Stockholders
* Effect of revaluation of investment in Compagnie Lebon
Year ending 31. 12. 2004 Lux GAAP US$’000
3,251 (1,447)
1,804
516 2,975 1,630 3,105 404 264
8,894
1,407 (59)
1,348
12,046
(198) (1,037) (466) (2,028) (79) (24)
(3,832)
8,214
(162)
8,052
(417)
7,635
(533)
7,102
Adjustments
– –
–
– – – – 1,077* –
1,077
– –
–
1,077
– – – – – –
–
1,077
(4)
1,073
–
1,073
–
1,073
26
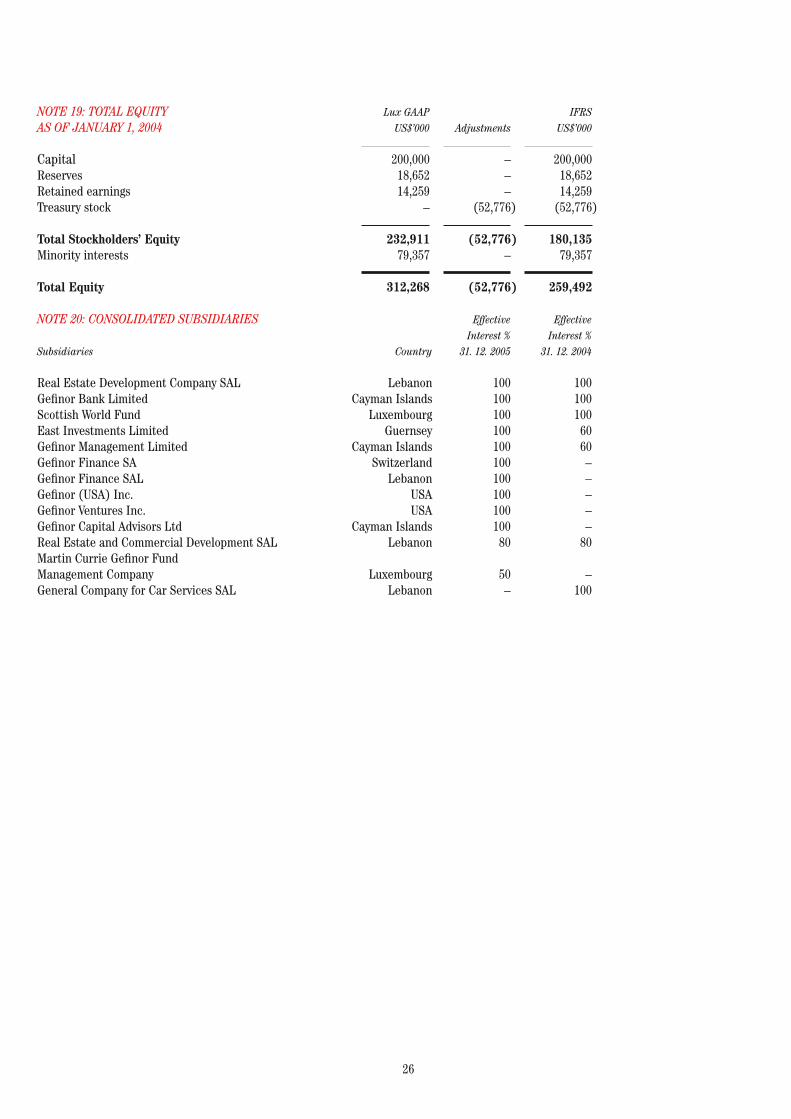
NOTE 19: TOTAL EQUITY AS OF JANUARY 1, 2004
Capital Reserves Retained earnings Treasury stock
Total Stockholders’ Equity Minority interests
Total Equity
NOTE 20: CONSOLIDATED SUBSIDIARIES Effective Effective Interest % Interest % Subsidiaries Country 31. 12. 2005 31. 12. 2004
Real Estate Development Company SAL Lebanon 100 100 Gefinor Bank Limited Cayman Islands 100 100 Scottish World Fund Luxembourg 100 100 East Investments Limited Guernsey 100 60 Gefinor Management Limited Cayman Islands 100 60 Gefinor Finance SA Switzerland 100 – Gefinor Finance SAL Lebanon 100 – Gefinor (USA) Inc. USA 100 – Gefinor Ventures Inc. USA 100 – Gefinor Capital Advisors Ltd Cayman Islands 100 – Real Estate and Commercial Development SAL Lebanon 80 80 Martin Currie Gefinor Fund Management Company Luxembourg 50 – General Company for Car Services SAL Lebanon – 100
Lux GAAP US$’000
200,000 18,652 14,259 –
232,911 79,357 312,268
Adjustments
– – – (52,776)
(52,776) –
(52,776)
IFRS US$’000
200,000 18,652 14,259 (52,776)
180,135 79,357
259,492
27
Management and Directors
Executive Committee and Corporate ServicesMustapha FakhouryWalid HrayssiMohamed Ousseimi
Group SecretaryWalid Hrayssi
Board of DirectorsGefinor SAKhaled Ousseimi Chairman
George Bennett Yves PrussenJ. Barry B. Stewart Damien Wigny
28
GenevaGefinor Building30 Quai Gustave-Ador1207 Geneva, Switzerland022 718 9300 Telephone022 718 9301 [email protected] E-mailContact: André Bernath
New YorkSeagram Building375 Park Avenue, Suite 2401New York, NY 10152United States of America212 308-1111 Telephone212 308-1182 [email protected] E-mailContact: William J. Beckett
BeirutGefinor CenterP.O. Box 3869Rue ClemenceauBeirut, Lebanon1 73-97-87 Telephone1 73-97-90 [email protected] E-mail Contact: Karam Atallah
Offices
Prod
uced
by
Red
Squa
re D
esig
n, N
ew Y
ork
City

29
Fly leaf front

Fly leaf back