Embed Size (px)
Citation preview
®
A N N U A L R E P O R T 2 0 0 7
®

B E N I H A N A I N C . A N D S U B S I D I A R I E S
®
®
The Benihana family of restaurants is one of theleading Asian restaurant chains.
From the heightened experience of Benihana,where many Americans first tasted Japanese food, to theelegant urban fusion of Haru to the funky and flashyscenes at RA Sushi, our restaurants treat you to fabulousdining served in unique settings.
The Benihana Restaurant Group
®
®
LAS VEGAS, NEVADA
MAPLE GROVE, MINNESOTA
BROADWAY NEW YORK, NEW YORK

B E N I H A N A I N C . A N D S U B S I D I A R I E S
Selected Financial Data
1
March 26,2006
March 27,2005
March 28,2004
March 30,2003
FISCAL YEAR ENDEDIn thousands, except per share information
(1) Subsequent to the end of fiscal 2007, on May 18, 2007, the Board of Directors declared a 3 for 2 stock dividend payable in Common Sharesto the holders of both the Class A Shares and Common Shares. The stock dividend is payable on June 15, 2007 to holders of record June 1,2007. The basic and diluted earnings per common share are not shown as if the stock dividend had been in existence for each fiscal yearpresented, in accordance with SFAS No. 128, “Earnings per Share,” as the stock dividend had not occurred prior to the issuance of thisannual report.
CONSOLIDATED STATEMENTSOF EARNINGS DATA:
Total revenues $ 272,649 $ 245,553 $ 218,331 $ 202,963 $ 189,244
Cost of food and beverage sales 66,051 59,014 53,372 51,437 46,182
Restaurant operating expenses 159,456 139,433 126,825 118,183 112,050
Restaurant opening costs 1,535 1,270 1,304 2,088 501
Marketing, general and administrative expenses 23,811 22,693 20,939 16,362 15,512
Impairment charge – – 2,668 – –
Interest income (expense), net 465 88 (298) (457) (528)
Income before income taxes andminority interest 22,261 23,231 12,925 14,436 14,471
Income tax provision 7,766 8,491 4,520 4,821 4,725
Income before minority interest 14,495 14,740 8,405 9,615 9,746
Minority interest – 178 585 643 477
Net income 14,495 14,562 7,820 8,972 9,269
Basic earnings per share (1) 1.35 1.40 .81 1.01 1.06
Diluted earnings per share (1) 1.26 1.36 .77 .98 .99
CONSOLIDATED BALANCE SHEETS DATA:
Total assets $ 204,289 $ 191,516 $ 154,254 $ 142,643 $ 129,759
Long-term debt including current maturities – 6,666 10,000 21,500 22,000
Stockholders’ equity 142,482 125,262 103,207 95,045 83,713
OTHER FINANCIAL DATA:
Capital expenditures $ 37,543 $ 25,834 $ 22,446 $ 22,950 $ 27,418
April 1,2007
(53 wk yr)
The following table sets forth, for the periods indicated, selected consolidated financial data that has been derivedfrom our audited Consolidated Financial Statements. The following selected consolidated financial data should be readin conjunction with our Consolidated Financial Statements and related notes thereto, and “Management’s Discussionand Analysis of Financial Condition and Results of Operations”.
The Company has a 52/53-week fiscal year. The Company’s fiscal year ends on the Sunday within the dates ofMarch 26 through April 1. Fiscal year 2007 consisted of 53 weeks, while all other fiscal years presented consisted eachof 52 weeks.

B E N I H A N A I N C . A N D S U B S I D I A R I E S
To Our Shareholders
Dear Shareholders,
Fiscal 2007 was a year of notable achievements at Benihana and we are well positioned for continued successin the year ahead. Our financial results demonstrate the considerable brand equity we have cultivated at ourBenihana, RA Sushi, and Haru concepts, and we are clearly capitalizing on the growing popularity of Asiancuisine in the American dining landscape.
For the fiscal year just ended, we realized increased sales and higher guest counts across our entire portfolio, asignificant distinction for us in the current environment. Same-store sales for restaurants open for more than12 months, increased 8.5%, with the Company’s overall restaurant sales growing to $271.1 million, an overallincrease of 11.1% due in some measure to new units coming online. Net income was $14.5 million, compared to$14.6 million in fiscal 2006. During fiscal 2007, the company continued to incur approximately $2.0 million inongoing expenses at teppanyaki restaurants which were temporarily closed for remodeling.
Our strategic decision to renovate and convert some of our older Benihana teppanyaki units to our newprototype has been rewarding. The remodeled units are experiencing higher sales and are significantly moreefficient from an operating standpoint. Further, the enhanced design puts guests at the center of the Benihanaexperience with a new atmosphere that is inspiring and more inviting, and more significantly, lays the groundworkfor our Benihana teppanyaki brand to thrive for many decades.
We remain confident that the long-term benefits of the revitalization initiative far outweigh the more immediatecosts and will therefore ultimately enhance shareholder value. In fact, there are currently seven locations boastingthe updated and contemporary new design, and they are all meeting our operating performance targets. Weconsider the completion of this effort absolutely critical to the continued vitality, relevance, and success of ourBenihana teppanyaki brand.
During the year, our restaurant portfolio expanded to 79 restaurants from 73 restaurants in fiscal 2006, as webrought the Benihana experience to Coral Gables and Miramar, Florida, while RA Sushi continued its aggressiveexpansion with new units in Palm Beach Gardens, Florida; Glenview, Illinois; as well as Corona and Torrance,California. We currently have more restaurants in various stages of development than at any other point in our 43year history, which points to the tremendous opportunities that exist for our brands and our ability to realize themin a disciplined manner. Benihana teppanyaki will forge ahead with its exciting new restaurant prototype, as itbackfills existing geographies as well as enters new markets. Haru will expand “downtown” to New York City’sfinancial district as well as the Boston’s Back Bay Retail District. And finally, our highly portable RA Sushi, whichhas become a destination for the young and chic, as well as serious sushi connoisseurs, will continue its acceleratedrollout as we look to realize its vast potential.
Recently, our Board of Directors unanimously approved a stock dividend of one-half of one share of CommonStock for each outstanding share of Common Stock and each outstanding share of Class A Common Stock. Webelieve this action offers greater liquidity to the benefit of our shareholders and is reflective of our positive outlookas well as the unique value creation opportunity we offer our shareholders.
2
B E N I H A N A I N C . A N D S U B S I D I A R I E S
3
Finally, I would also like to acknowledge the appointment of Juan Garcia as President of our company andJose Ortega as our Vice President of Finance and Chief Financial Officer, two well-deserved promotions whichtook place over the course of this past year. As Chief Executive Officer, I will continue to set the long-termstrategic direction and operating policies for the Company, but as we prepare for the “next generation” ofBenihana, we must also groom the next generation of Benihana leadership.
Above all, we are encouraged by our fiscal 2007 results in what remains a challenging environment for manyof our restaurant peers, and rightfully pleased with our accomplishments. We look forward to reporting on ourprogress to you and appreciate your interest in Benihana.
Sincerely,
Joel A. SchwartzChairman of the Board and CEO
August 2, 2007
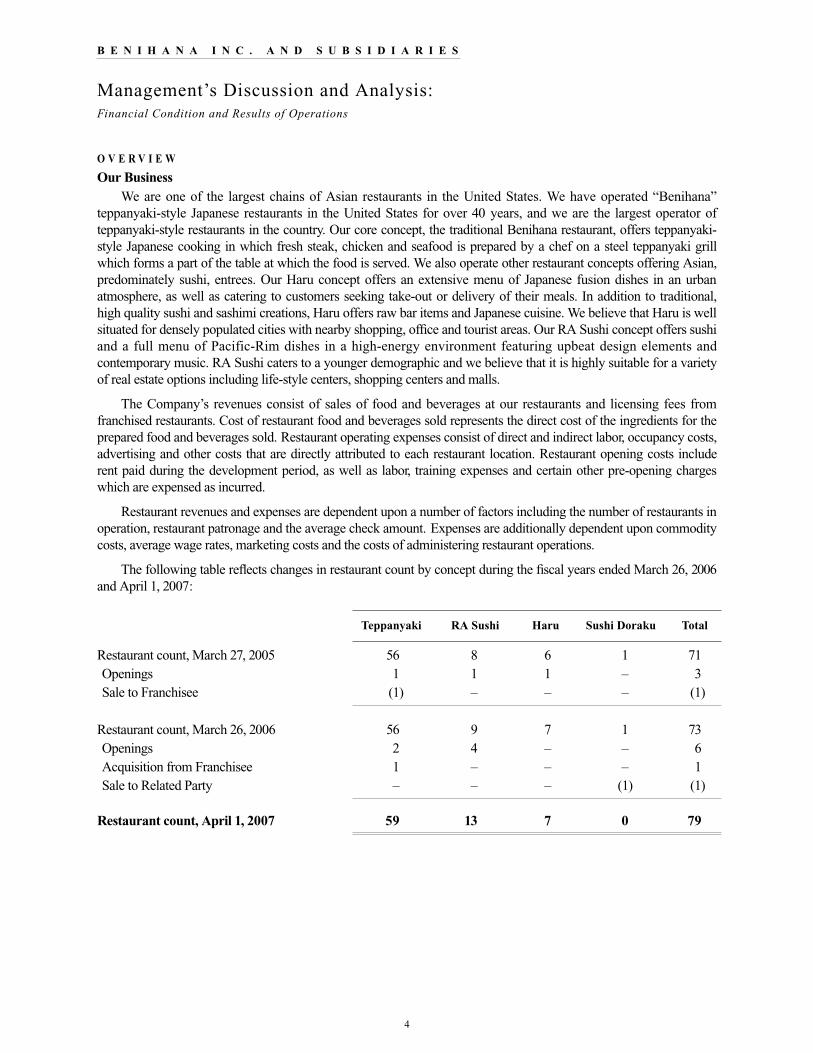
Restaurant count, March 27, 2005 56 8 6 1 71Openings 1 1 1 – 3Sale to Franchisee (1) – – – (1)
Restaurant count, March 26, 2006 56 9 7 1 73Openings 2 4 – – 6Acquisition from Franchisee 1 – – – 1Sale to Related Party – – – (1) (1)
Restaurant count, April 1, 2007 59 13 7 0 79
4
B E N I H A N A I N C . A N D S U B S I D I A R I E S
Management’s Discussion and Analysis:Financial Condition and Results of Operations
O V E R V I E W
Our BusinessWe are one of the largest chains of Asian restaurants in the United States. We have operated “Benihana”
teppanyaki-style Japanese restaurants in the United States for over 40 years, and we are the largest operator ofteppanyaki-style restaurants in the country. Our core concept, the traditional Benihana restaurant, offers teppanyaki-style Japanese cooking in which fresh steak, chicken and seafood is prepared by a chef on a steel teppanyaki grillwhich forms a part of the table at which the food is served. We also operate other restaurant concepts offering Asian,predominately sushi, entrees. Our Haru concept offers an extensive menu of Japanese fusion dishes in an urbanatmosphere, as well as catering to customers seeking take-out or delivery of their meals. In addition to traditional,high quality sushi and sashimi creations, Haru offers raw bar items and Japanese cuisine. We believe that Haru is wellsituated for densely populated cities with nearby shopping, office and tourist areas. Our RA Sushi concept offers sushiand a full menu of Pacific-Rim dishes in a high-energy environment featuring upbeat design elements andcontemporary music. RA Sushi caters to a younger demographic and we believe that it is highly suitable for a varietyof real estate options including life-style centers, shopping centers and malls.
The Company’s revenues consist of sales of food and beverages at our restaurants and licensing fees fromfranchised restaurants. Cost of restaurant food and beverages sold represents the direct cost of the ingredients for theprepared food and beverages sold. Restaurant operating expenses consist of direct and indirect labor, occupancy costs,advertising and other costs that are directly attributed to each restaurant location. Restaurant opening costs includerent paid during the development period, as well as labor, training expenses and certain other pre-opening chargeswhich are expensed as incurred.
Restaurant revenues and expenses are dependent upon a number of factors including the number of restaurants inoperation, restaurant patronage and the average check amount. Expenses are additionally dependent upon commoditycosts, average wage rates, marketing costs and the costs of administering restaurant operations.
The following table reflects changes in restaurant count by concept during the fiscal years ended March 26, 2006and April 1, 2007:
Teppanyaki Haru Sushi Doraku TotalRA Sushi

5
B E N I H A N A I N C . A N D S U B S I D I A R I E S
Management’s Discussion and Analysis:Financial Condition and Results of Operations
Summary of resultsSummary highlights of our fiscal 2007 year compared to the previous year:
• fifteenth consecutive year with total sales increases,
• opened 2 new Benihana teppanyaki-style restaurants in Miramar, Florida and Coral Gables, Florida and acquired a restaurant from a franchisee in Broomfield, Colorado,
• opened 4 new RA Sushi restaurants in Torrance, California; Corona, California; Glenview, Illinois and Palm Beach Gardens, Florida,
• completed major remodeling projects of our teppanyaki-style restaurants in Anaheim, California; Cleveland, Ohio; Memphis, Tennessee; and Indianapolis, Indiana, as well as a minor remodeling of our Bethesda, Maryland restaurant, and
• four teppanyaki-style restaurants located in Burlingame, California; Torrance, California; Ft. Lauderdale, Florida and Miami Beach, Florida were closed undergoing renovations at the end of fiscal 2007.
O U T L O O K
In fiscal 2007, we opened two teppanyaki restaurants and four RA Sushi restaurants. We also acquired ateppanyaki restaurant from a franchisee. We believe that our revenues will increase next year due to the newly openedrestaurants and from continuing increases in customer counts at restaurants open for longer than one year. We believethat total revenues will also increase during fiscal 2008 from the planned openings of two new teppanyaki restaurantsin Maple Grove, Minnesota and Chandler, Arizona; and six new RA Sushi restaurants in Lombard, Illinois; Tustin,California; Mesa, Arizona; South Miami, Florida; Baltimore, Maryland and Plano, Texas; and two new Harurestaurants in New York, New York and Boston, Massachusetts. We will, however, have to contend with lost salesdue to temporary closures resulting from our renovation and revitalization program.
We have undertaken a design initiative to develop a prototype Benihana teppanyaki restaurant to improve theunit-level economics while shortening construction time and improving decor. The restaurant in Miramar, Florida,which opened during June 2006, is the first restaurant to feature the new prototype design. Under a renovationprogram commenced during 2005, we are also using many of the design elements of the new prototype to refurbishour mature teppanyaki restaurant units.
During fiscal 2006, management made a strategic decision to accelerate the renovation and revitalizationprogram, which was discussed above. We are committed to revitalizing our 40-plus year old Benihana teppanyakiconcept for a new generation, while simultaneously generating a solid return on invested capital for our shareholders.The new design reflects the cutting edge of contemporary dining and entertainment, and places the customer at thecenter of the Benihana experience through the visual impact of the exterior, a vibrant waiting area, and a moredramatic stage setting for our legendary Benihana chefs. We plan to refurbish a total of approximately 20-25 of ourmature teppanyaki restaurants over a thirty month timeframe. By beginning the transformation of these 20-25 matureBenihana teppanyaki units now, we are opportunistically building a stronger foundation for our core brand amid agrowing American appetite for Asian cuisine. During fiscal 2006, our restaurant in Short Hills, New Jersey was thefirst teppanyaki to be retrofitted with the new design elements. During fiscal 2007 our Memphis, Tennessee;Cleveland, Ohio; Indianapolis, Indiana and Anaheim, California restaurants re-opened after similar renovations werecompleted. A minor remodel has also been completed at the Bethesda, Maryland restaurant, without the need totemporarily close the location. At the end of fiscal 2007, restaurants closed and undergoing major renovationsincluded the Fort Lauderdale, Florida; Miami Beach, Florida; Burlingame, California and Torrance, Californialocations. The Torrance location has subsequently reopened and we believe that we will complete two more of these

Restaurant sales $ 271,080 11.1% $ 244,032 12.6% $ 216,756Franchise fees and royalties 1,569 3.2% 1,521 (3.4%) 1,575
Total revenues $ 272,649 11.0% $ 245,553 12.5% $ 218,331
6
Management’s Discussion and Analysis:Financial Condition and Results of Operations
B E N I H A N A I N C . A N D S U B S I D I A R I E S
O P E R A T I N G R E S U L T S
RevenuesRevenues consist of the sales of food and beverages at our restaurants and royalties and licensing fees from
franchised restaurants. Revenues are dependent upon the number of restaurants in operation, the number of patronsthat visit our restaurants and franchisees’ restaurants and the average per person guest check amounts.
The following table shows revenues for the fiscal years ended April 1, 2007, March 26, 2006 and March 27, 2005and the related percentage changes (dollar amounts in thousands):
2007 2006 2005
Percentage change
from 2006
(53 wk. yr.)
Percentage change
from 2005
FISCAL YEAR ENDED
major renovations during the first quarter of fiscal 2008. We expect the other one to be completed during the secondquarter of fiscal 2008. Similar to the Bethesda location, two restaurants located in the New York City, New York andSacramento, California are currently undergoing minor remodeling, as well. These restaurants have not requiredtemporary closures either. We expect to complete a total of 17 renovations and have four other restaurants in progress,by the end of fiscal 2008. As we roll out the new design, we currently estimate the capital expenditures of the programto average approximately between $2.0 million and $2.3 million per unit. The cost to remodel each unit is directlydependent on the scope of work to be performed at each location. Management is continuously reviewing the extentof work to be performed at these sites. The scope of work may be impacted by the age of the location, currentcondition of the location, as well as local permitting requirements. The scope of work will vary by location. Somelocations will undergo a limited remodel, while others will undergo a complete renovation and a major facilityupgrade of its HVAC, electrical and plumbing systems. Management believes the long-term benefits of therevitalization initiative far outweigh the costs. The renovation of the Company’s older teppanyaki units is necessary toensure the continued relevance of the Benihana brand, and the program will enhance our leadership position as thepremier choice for Japanese-style dining.
The restaurant industry is a highly competitive business, which is sensitive to changes in economic conditions,trends in lifestyles and fluctuating costs. Operating margins for the restaurant industry are susceptible to fluctuationsin prices of commodities, which include beef, chicken and seafood as well as other items necessary to operate, suchas electricity or other energy supplies, and the ability to pass along increased costs to customers through priceincreases. Additionally, the restaurant industry is characterized by a significant initial capital investment, coupled withhigh labor costs. Our management is focused on monitoring these costs and increasing same store sales to continue toraise restaurant operating profit in existing restaurants as well as new restaurants. Our expansion plans take intoaccount these operational factors and investment costs to generate sustainable operating results and achieveacceptable returns of investment from each of our restaurant concepts.
Summary of results (cont.)
7
Management’s Discussion and Analysis:Financial Condition and Results of Operations
B E N I H A N A I N C . A N D S U B S I D I A R I E S
In addition to our Benihana teppanyaki restaurants, we have other concepts that feature sushi along with otherpredominately Asian menu choices. Our Haru concept features an extensive menu of Japanese fusion dishes served ina high energy, urban setting. Haru’s menu offers traditional sushi and sashimi creations as well as raw bar items andJapanese cuisine. The Haru concept generates exceptionally high average unit sales volumes from take-out anddelivery and as a result of customer satisfaction and the high population density that comprises the concept’s primarymarket, New York City. Approximately 40% of Haru’s revenues are derived from delivery and takeout sales. The RASushi concept is a vibrant, hip restaurant featuring sushi and other Asian menu items in a high-energy environmentfeaturing upbeat design elements and contemporary music. RA Sushi’s beverage sales represent approximately 35%of restaurant sales. The RA Sushi units are less expensive to build than the Company’s other two concepts and offerthe Company a growth vehicle that we believe can succeed in larger markets. The Company’s sole Doraku restaurant,which was sold during fiscal 2007, offered sushi and other Japanese dishes.
We believe that the Benihana style of presentation makes us a unique choice for customers. We believe thatcustomers who are seeking greater value for their dining budget appreciate the entertainment value provided by thechef cooking directly at their table. Sushi bars have been added to most of the Benihana restaurants over the pastseveral years.
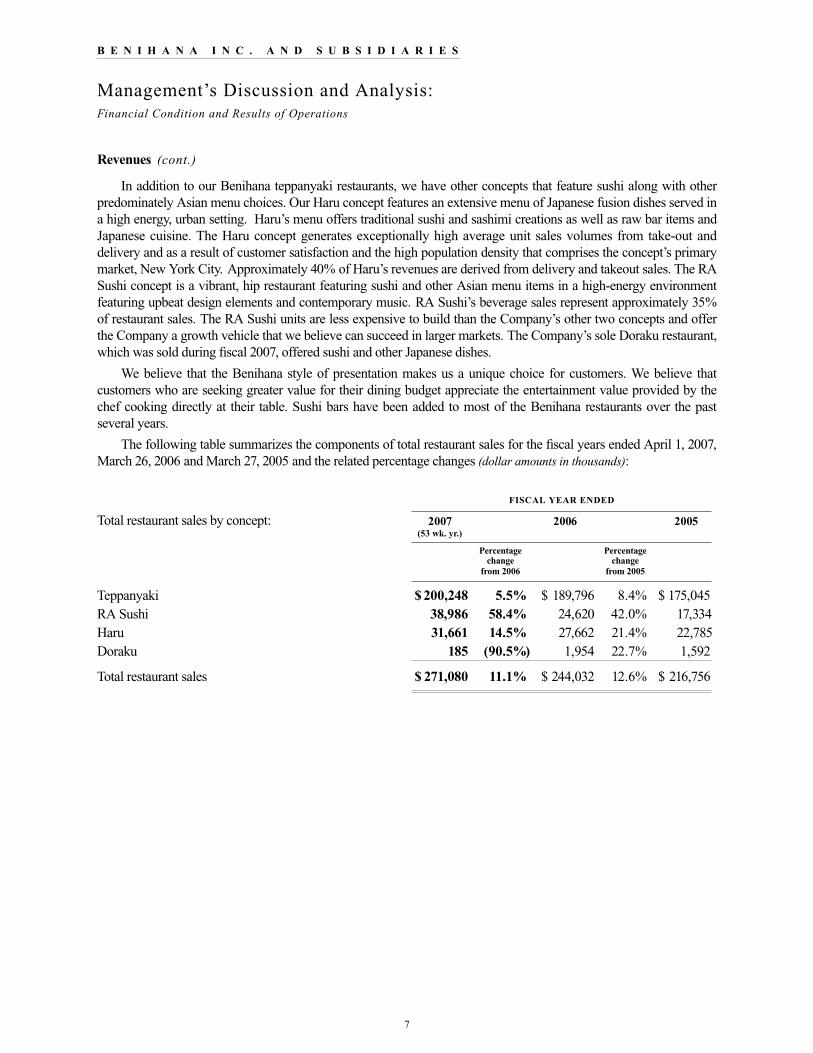
The following table summarizes the components of total restaurant sales for the fiscal years ended April 1, 2007,March 26, 2006 and March 27, 2005 and the related percentage changes (dollar amounts in thousands):
Total restaurant sales by concept:
Teppanyaki $ 200,248 5.5% $ 189,796 8.4% $ 175,045RA Sushi 38,986 58.4% 24,620 42.0% 17,334Haru 31,661 14.5% 27,662 21.4% 22,785Doraku 185 (90.5%) 1,954 22.7% 1,592
Total restaurant sales $ 271,080 11.1% $ 244,032 12.6% $ 216,756
Revenues (cont.)
2007 2006 2005
Percentage change
from 2006
(53 wk. yr.)
Percentage change
from 2005
FISCAL YEAR ENDED

8
Management’s Discussion and Analysis:Financial Condition and Results of Operations
B E N I H A N A I N C . A N D S U B S I D I A R I E S
The following tables summarize the components of comparable restaurant sales and the percentage changesbetween fiscal years 2007 and 2006, and fiscal years 2006 and 2005, respectively (dollar amounts in thousands).Restaurants are considered comparable when they are open during the same periods in the two years being compared.New restaurants enter the comparable restaurant base when they have been open for more than one year. Restaurantsmay leave and enter the comparable restaurant base, as they are closed for renovation and subsequently re-open.
Teppanyaki $ 184,531 $ 171,793 7.4% $181,398 $ 169,157 7.2%RA Sushi 27,892 24,620 13.3% 22,529 17,338 29.9%Haru 30,716 27,661 11.0% 23,429 22,784 2.8% Doraku 185 175 5.7% 1,954 1,592 22.7%
Total comparable restaurant sales $243,324 $ 224,249 8.5% $ 229,310 $210,871 8.7%
2006
FISCAL YEAR ENDED
2006 2005
FISCAL YEAR ENDED
Comparable restaurant sales by concept:
Restaurant sales duringfiscal year ended March 27, 2005 $ 175,045 $ 17,334 $ 22,785 $ 1,592 $ 216,756
Increase in comparable sales 12,241 5,191 645 362 18,439Increase from new or acquired restaurants 4,025 2,095 4,232 – 10,352Decrease from closed or sold restaurants (2,907) – – – (2,907)Increase from re-openings(decrease from temporary closures), net 1,392 – – – 1,392
Restaurant sales duringfiscal year ended March 26, 2006 189,796 24,620 27,662 1,954 244,032
Increase in comparable sales 12,738 3,272 3,055 10 19,075Increase from new or acquired restaurants 8,306 10,192 328 – 18,826Decrease from closed or sold restaurants (1,210) – – (1,779) (2,989)Decrease from temporary closures, net (13,377) – – – (13,377)Impact of 53rd week for fiscal year 3,995 902 616 – 5,513
Restaurant sales during fiscal yearended April 1, 2007 $ 200,248 $ 38,986 $ 31,661 $ 185 $ 271,080
Teppanyaki Haru Sushi Doraku TotalRA Sushi
Revenues (cont.)
The following table summarizes the changes in restaurant sales between the fiscal years ended March 27, 2005,March 26, 2006 and April 1, 2007 (in thousands):
2007 Percentage change
from 2006
Percentage change
from 2005(53 wk. yr.)

9
Management’s Discussion and Analysis:Financial Condition and Results of Operations
B E N I H A N A I N C . A N D S U B S I D I A R I E S
2007 compared to 2006
Revenues increased 11.1% in fiscal 2007 when compared to fiscal 2006. Restaurant sales increased $27.1 millionin fiscal 2007 when compared to fiscal 2006. The increase was mainly attributable to sales from new or acquiredrestaurants of $18.8 million and from increases in sales from restaurants opened longer than one year of $19.1million, as well as $5.5 million in sales from an additional week, offset by lost sales of $13.4 million for restaurantstemporarily closed for remodeling and $3.0 million for permanently closed restaurants.
BENIHANA - Sales for the Benihana teppanyaki restaurants increased $10.5 million in fiscal 2007 compared tofiscal 2006. The increase is attributable to increases in sales from restaurants opened longer than one year of $12.7million and from sales from new and acquired restaurants prior to becoming comparable restaurant units of $8.3million, as well as $4.0 million in sales from an additional week, offset by lost sales attributable to permanentrestaurant closures totaling $1.2 million and sales reductions attributable to temporary restaurant closures due tomajor refurbishings totaling $13.4 million. Comparable restaurant sales growth for teppanyaki restaurants openedlonger than one year increased 7.4%. The average per person guest check amount was $25.51 in fiscal 2007 comparedto $24.96 in fiscal 2006. Sales from new restaurants were mainly attributable to the Miramar, Florida and CoralGables, Florida restaurants which opened in June and October 2006, respectively.
HARU - Sales for the Haru restaurants increased $4.0 million in fiscal 2007 compared to fiscal 2006. The increaseis attributable to increases in sales from restaurants opened longer than one year of $3.1 million and from sales of $0.3million from a new restaurant, as well as $0.6 million in sales from an additional week. The increase from restaurantsopened longer than one year was a result of increased traffic of 3.9%. In addition, take-out and delivery salesincreased by 14.3% compared to the prior year. Comparable restaurant sales growth for the Haru restaurants increased11.0% from fiscal 2006. The average per person guest check amount was $29.90 in fiscal 2007 compared to $29.36in fiscal 2006.
RA SUSHI - Sales for the RA Sushi restaurants increased $14.4 million in fiscal 2007 compared to fiscal 2006.The increase is attributable to increases in sales from restaurants opened longer than one year of $3.3 million andfrom sales of new restaurants of $10.2 million, as well as $0.9 million in sales from an additional week. The increasefrom restaurants opened longer than one year is a result of increased traffic of 11.7% and from the maturation ofrecently opened restaurants in new markets. Comparable restaurant sales growth for the RA Sushi restaurants was13.3% for fiscal 2007 compared to fiscal 2006. The average per person guest check amount was $21.05 in fiscal 2007compared to $20.51 in fiscal 2006.
Franchise fees and royalties increased slightly in fiscal 2007 when compared to fiscal 2006. There was one newfranchised location in Trinidad opened during fiscal 2007. During fiscal 2007, the Company acquired the Benihanarestaurant located in Broomfield, Colorado from the franchisee.
2006 compared to 2005
Revenues increased 12.5% in fiscal 2006 when compared to fiscal 2005. Restaurant sales increased $27.3million in fiscal 2006 when compared to fiscal 2005. The increase was mainly attributable to increases in sales fromrestaurants opened longer than one year of $18.4 million, sales from new or acquired restaurants of $10.4 million,and a net increase of $1.4 million in sales from restaurants closed for remodeling offset by $2.9 million decrease forrestaurants permanently closed.
BENIHANA - Sales for the Benihana teppanyaki restaurants increased $14.8 million in fiscal 2006 compared tofiscal 2005. The increase is attributable to increases in sales from restaurants opened longer than one year of $12.2million and from sales of new or acquired restaurants prior to becoming comparable restaurant units of $4.1 million.Sales were positively impacted by $1.4 million due to the timing of temporary closures during fiscal 2006 whencompared to fiscal 2005. These increases were offset by sales reductions attributable to permanent restaurant closures
10
Management’s Discussion and Analysis:Financial Condition and Results of Operations
B E N I H A N A I N C . A N D S U B S I D I A R I E S
totaling $1.2 million. Two restaurants were closed during fiscal 2005 as a result of lease expirations and one unit wassold to a franchisee during fiscal 2006. The increase in sales from restaurants opened longer than one year benefitedfrom a 2-3% menu price increase initiated during the second quarter of fiscal 2005. Additionally, guest countsincreased 4.6% to 7.6 million guests in fiscal 2006 from fiscal 2005. Comparable restaurant sales growth forteppanyaki restaurants opened longer than one year increased 7.2%. The average per person guest check amount was$24.96 in fiscal 2006 compared to $24.15 in fiscal 2005, representing a 3.4% increase. Guest counts for teppanyakirestaurants opened longer than one year increased by 4.2%. Sales from new or acquired restaurants were mainlyattributable to the Carlsbad, California restaurant which opened in June 2005 and the Anchorage, Alaska restaurantand the Tucson, Arizona restaurant, which were acquired in March 2005 and November 2005, respectively. Weclosed two teppanyaki restaurants in fiscal 2005, after their leases expired. One restaurant was located in Kendall, asuburb of Miami, Florida and the other was located in New York City. The Kendall restaurant was replaced by theCoral Gables, Florida restaurant which opened in fiscal 2007. During fiscal 2006, we sold the Monterey, Californiarestaurant to a franchisee.
HARU - Sales for the Haru restaurants increased $4.9 million in fiscal 2006 compared to fiscal 2005. The increaseis attributable to increases in sales from restaurants opened longer than one year of $0.6 million and from sales of $4.2million from two new Haru restaurants, one restaurant located in Philadelphia, Pennsylvania, which opened duringfiscal 2006, and the other in Manhattan located in Gramercy Park, which opened during fiscal 2005. Comparablerestaurant sales growth for the Haru restaurants increased 2.8% from fiscal 2005. The average per person guest checkamount was $29.36 in fiscal 2006 compared to $27.73 in fiscal 2005, representing a 5.9% increase. The increase inaverage per person guest checks, however, was offset by a decrease in traffic at restaurants opened longer than oneyear totaling 3.2%.
RA SUSHI - Sales for the RA Sushi restaurants increased $7.3 million in fiscal 2006 compared to fiscal 2005. Theincrease is attributable to increases in sales from restaurants opened longer than one year of $5.2 million and fromsales of new restaurants of $2.1 million. As a result, during fiscal 2006, total traffic increased by 39.8%. Comparablerestaurant sales growth for the RA Sushi restaurants was 29.9% for fiscal 2006 compared to fiscal 2005. The averageper person guest check amount was $20.51 in fiscal 2006 compared to $20.19 in fiscal 2005, representing an increaseof 1.6%. Additionally, traffic at restaurants opened longer than one year increased by 24.2% between fiscal years.Sales from new restaurants were attributable to the opening of a RA Sushi restaurant in Houston, Texas in February2006 and the restaurant in Las Vegas, Nevada, which opened in October 2004.
Franchise fees and royalties decreased slightly in fiscal 2006 when compared to fiscal 2005. There was a netdecrease of one restaurant in the franchise portfolio. The net decrease reflected one new opening offset by the closureof two franchise locations.
2006 compared to 2005 (cont.)

11
Management’s Discussion and Analysis:Financial Condition and Results of Operations
B E N I H A N A I N C . A N D S U B S I D I A R I E S
Operating costs and expenses
Cost of restaurant food and beverages sold represents the direct cost of the ingredients for the prepared food andbeverages sold. Restaurant operating expenses consist of direct and indirect labor, occupancy costs, advertising andother costs that are directly attributed to each restaurant location. Restaurant opening costs include rent paid duringthe development period, as well as labor, training expenses and certain other pre-opening charges which are expensedas incurred.
Operating costs and expenses are largely dependent on the number of customers that visit our restaurants and thecost of commodities, the number of employees that are necessary to provide a high quality of service to ourcustomers, rents we pay for our restaurant properties, utilities and other necessary operating costs. Expenses areadditionally dependent upon average wage rates, marketing costs and the costs of administering restaurant operations.
The following table summarizes the costs and expenses by concept, as well as consolidated for the years endedApril 1, 2007, March 26, 2006 and March 27, 2005.
Fiscal year ended April 1, 2007Cost of food and beverage sales $ 49,169 $ 9,780 $ 7,039 $ 63 $ – $ 66,051Restaurant operating expenses 119,024 22,614 17,766 52 – 159,456Restaurant opening costs 478 854 203 – – 1,535Marketing, general and administrative expenses 7,727 3,200 1,202 – 11,682 23,811
Total operating expenses $ 176,398 $ 36,448 $ 26,210 $ 115 $ 11,682 $ 250,853
Fiscal year ended March 26, 2006Cost of food and beverage sales $ 46,011 $ 6,287 $ 6,176 $ 540 $ – $ 59,014Restaurant operating expenses 108,690 13,410 15,960 1,373 – 139,433Restaurant opening costs 471 602 197 – – 1,270Marketing, general and administrative expenses 9,339 2,019 730 – 10,605 22,693
Total operating expenses $ 164,511 $ 22,318 $ 23,063 $ 1,913 $ 10,605 $ 222,410
Fiscal year ended March 27, 2005 Cost of food and beverage sales $ 43,501 $ 4,454 $ 4,979 $ 438 $ – $ 53,372Restaurant operating expenses 103,725 10,149 11,675 1,276 – 126,825Restaurant opening costs 500 219 585 – – 1,304Marketing, general and administrative expenses 8,081 1,608 581 – 10,669 20,939
Impairment charge 834 1,462 – 372 – 2,668
Total operating expenses $ 156,641 $ 17,892 $ 17,820 $ 2,086 $ 10,669 $ 205,108
RA SushiTeppanyakiSushi
Doraku ConsolidatedHaru Corporate

12
Management’s Discussion and Analysis:Financial Condition and Results of Operations
B E N I H A N A I N C . A N D S U B S I D I A R I E S
The following table summarizes the costs and expenses as a percentage of restaurant sales by concept, as well asconsolidated for the years ended April 1, 2007, March 26, 2006 and March 27, 2005.
Fiscal year ended April 1, 2007Cost of food and beverage sales 24.6% 25.1% 22.2% 33.9% 24.4%Restaurant operating expenses 59.4% 58.0% 56.1% 27.9% 58.8%Restaurant opening costs 0.2% 2.2% 0.6% – 0.6%Marketing, general and administrative expenses 3.9% 8.2% 3.8% – 8.7%
Total operating expenses 88.1% 93.5% 82.7% 61.8% 92.5%
Fiscal year ended March 26, 2006Cost of food and beverage sales 24.2% 25.5% 22.3% 27.6% 24.2%Restaurant operating expenses 57.3% 54.5% 57.7% 70.3% 57.1%Restaurant opening costs 0.2% 2.4% 0.7% – 0.5%Marketing, general and administrative expenses 4.9% 8.2% 2.6% – 9.3%
Total operating expenses 86.6% 90.6% 83.3% 97.9% 91.1%
Fiscal year ended March 27, 2005Cost of food and beverage sales 24.9% 25.7% 21.9% 27.5% 24.6%Restaurant operating expenses 59.3% 58.5% 51.2% 80.2% 58.5%Restaurant opening costs 0.3% 1.3% 2.6% – 0.6%Marketing, general and administrative expenses 4.6% 9.3% 2.5% – 9.7%
Impairment charge 0.5% 8.4% – 23.4% 1.2%
Total operating expenses 89.6% 103.2% 78.2% 131.1% 94.6%
Teppanyaki Haru ConsolidatedRA SushiSushi
Doraku
2007 compared to 2006
Cost of food and beverage sales increased in absolute amount in fiscal 2007 when compared to fiscal 2006. Theincrease in absolute amount is directly attributable to the increase in sales resulting from new restaurants openedduring the year, increases in comparable sales, and the additional week in fiscal 2007. Cost of food and beverage salesincreased slightly when expressed as a percentage of restaurant sales in fiscal 2007 when compared to fiscal 2006.The Company continued to experience relatively stable commodity prices throughout the year.
Restaurant operating expenses increased in absolute amount in fiscal 2007 when compared to fiscal 2006. Theincrease in absolute amount was mainly attributable to the aforementioned increase in sales resulting from newrestaurants opened during the year, increases in comparable sales, and the additional week in fiscal 2007. Additionally,the Company continued to recognize additional depreciation expense which resulted from the Company reevaluatingthe remaining useful lives of assets at teppanyaki restaurants to be renovated as part of its renovation program. Thisadditional depreciation totaled approximately $1.6 million and $1.1 million, during fiscal years 2007 and 2006,respectively. The significant increase in restaurant operating expenses specifically experienced at the RA Sushi
Operating costs and expenses (cont.)

Management’s Discussion and Analysis:Financial Condition and Results of Operations
B E N I H A N A I N C . A N D S U B S I D I A R I E S
13
concept reflects the overall increase in restaurant count between years. Restaurant operating expenses increased whenexpressed as a percentage of sales in fiscal 2007 when compared to fiscal 2006. The additional depreciation expense ispartially responsible for the increase in restaurant operating expenses when expressed as a percentage of restaurantsales, specifically in the teppanyaki segment. Additionally, during fiscal 2007, the Company continued to incurapproximately $2.0 million in ongoing expenses at teppanyaki restaurants which were temporarily closed forremodeling. At RA Sushi, the change in margins is reflective of inefficiencies experienced at newer restaurants duringinitial operations.
Restaurant opening expenses increased in absolute amount but remained stable when expressed as a percentageof restaurant sales in fiscal 2007. The Company opened more restaurants during fiscal 2007 than in the prior year.Additionally, the Company has more restaurants under development at the end of fiscal 2007 than fiscal 2006.
Marketing, general and administrative expenses increased in absolute amount but decreased when expressed as apercentage of restaurant sales in fiscal 2007 when compared to fiscal 2006. The increase in absolute amount isattributable to increased administration headcount and professional fees. Additional corporate personnel were hired toaccommodate the Company’s growth plans.
Interest income, net, increased in fiscal 2007 when compared to fiscal 2006. Interest income increased duringfiscal 2007 due to an increase in interest earning balances during the current fiscal year compared to prior year, as aresult of the proceeds from the sale of the Series B Preferred Stock during fiscal 2006. Additionally, interest expensedecreased as a result of a continued decrease in the average outstanding bank debt in fiscal 2007 compared to fiscal2006. During fiscal 2007, the Company paid off the outstanding term loan. No borrowings were outstanding againstthe Company’s $75 million line of credit, as of April 1, 2007. The Company expects to incur additional interestexpense as it begins to draw on its new line of credit to finance its expansion and renovation programs. Interestincome is expected to decrease as cash on hand is also used to fund these programs.
Our effective tax rate was 34.9% for fiscal 2007 compared to 36.6% for fiscal 2006. During fiscal 2007, theCompany benefited from increasing tax credits on decreased pre-tax income.
Net income for fiscal 2007 was $14.5 million, a decrease of 0.5% from net income of approximately $14.6million in fiscal 2006. Basic earnings per common share decreased to $1.35 for fiscal 2007 from basic earnings pershare of $1.40 for fiscal 2006. Basic weighted average shares outstanding increased by approximately 530,000 sharesto 9,894,000 shares at April 1, 2007 from 9,364,000 shares at March 26, 2006. Diluted earnings per common sharedecreased to $1.26 for fiscal 2007 from diluted earnings per common share of $1.36 in fiscal 2006. Average dilutedweighted shares outstanding increased by approximately 847,000 shares to 11,518,000 shares at April 1, 2007 from10,671,000 shares at March 26, 2006. The increase in both basic and diluted weighted average shares outstandingduring fiscal 2007 compared to fiscal 2006 was due to the issuance of shares for stock option exercises and theissuance of convertible preferred stock during fiscal 2006, as well as the impact of higher stock prices during fiscal2007 on the weighted average shares calculation.
2006 compared to 2005
Cost of food and beverage sales increased in absolute amount but decreased when expressed as a percentage ofrestaurant sales in fiscal 2006 when compared to fiscal 2005. The increase in absolute amount is directly attributableto the increase in restaurant sales. The decrease when expressed as a percentage of sales during the current fiscal yearcan be attributed to menu price increases taken during the prior year’s second fiscal quarter coupled with relativelystable commodity prices.
Restaurant operating expenses increased in absolute amount but decreased when expressed as a percentage ofrestaurant sales in fiscal 2006 when compared to fiscal 2005. The increase in absolute amount was primarilyattributable to increases in variable costs directly related to restaurant sales and new restaurant units. Also, theCompany recognized additional depreciation expense totaling approximately $1.1 million during fiscal 2006, which
2007 compared to 2006 (cont.)
Management’s Discussion and Analysis:Financial Condition and Results of Operations
B E N I H A N A I N C . A N D S U B S I D I A R I E S
14
resulted from the Company reevaluating the remaining useful lives of assets at restaurants to be renovated as part ofits renovation program. The decrease when expressed as a percentage of sales was primarily attributable to gains inlabor productivity in fiscal 2006 when compared to fiscal 2005.
Restaurant opening expenses decreased slightly in absolute amount and when expressed as a percentage ofrestaurant sales in fiscal 2006. A comparable number of restaurants were under active development in fiscal 2006compared to fiscal 2005.
Marketing, general and administrative expenses increased in absolute amount but decreased slightly whenexpressed as a percentage of restaurant sales in fiscal 2006 when compared to fiscal 2005. The increase in absoluteamount is primarily attributable to increased administration headcount. Additional corporate personnel have beenhired to accommodate the Company’s growth plans and renovation program. The Company’s expansion andrenovation programs have also resulted in increased travel expenses between the corporate office and restaurantlocations. Advertising and promotional costs have also increased during fiscal 2006 as a result of increasedadvertising related to new store openings and entrance into new markets. The Company did realize a decrease inprofessional fees during fiscal 2006 attributable to Benihana of Tokyo, Inc. litigation fees primarily incurred duringfiscal 2005, as the trial was held during fiscal 2005. This decrease was partially offset by increased costs associated withprofessional fees incurred by the Company in order to remediate its material weakness identified during fiscal 2005.
Interest income (expense), net, increased in fiscal 2006 when compared to fiscal 2005. The decrease in expensewas a result of a decrease in the average outstanding bank debt in fiscal 2006 compared to fiscal 2005 offset byincreasing interest rates between fiscal years. Additionally, the Company’s invested cash balances were higher duringfiscal 2006 due to the completion of the second tranche of the Series B Preferred Stock sale during fiscal year 2006, aswell as greater cash provided by operating activities than cash used in investing activities during 2006, which resultedin increased interest income.
Our effective tax rate was 36.6% for fiscal 2006 compared to 35.0% for fiscal 2005. The increase was a directresult of increasing marginal tax rates caused by increased sales, as well as sales and profitability increasing at agreater rate than tax credits earned during the current year.
Net income for fiscal 2006 was $14.6 million, an increase of 86.2% over net income of $7.8 million in fiscal2005, as a result of the items previously described. Basic earnings per common share increased to $1.40 for fiscal2006 from basic earnings per share of $.81 for fiscal 2005. Basic average weighted shares outstanding increased byapproximately 210,000 shares to 9,364,000 shares at March 26, 2006 from 9,154,000 shares at March 27, 2005.Diluted earnings per common share increased to $1.36 for fiscal 2006 from diluted earnings per common share of$.77 in fiscal 2005. Average diluted weighted shares outstanding increased by approximately 524,000 shares to10,671,000 shares at March 26, 2006 from 10,147,000 shares at March 27, 2005. The increase in both basic anddiluted average weighted shares outstanding during fiscal 2006 compared to fiscal 2005 was due to the issuance ofshares for stock option exercises and the issuance of convertible preferred stock in fiscal 2006 and 2005.
Our financial resources
Cash flow from operations has historically been the primary source to fund our capital expenditures. Since theCompany has accelerated its building program, the Company will be relying more upon financing obtained fromfinancial institutions.
The Company presently has available up to $75 million from Wachovia Bank, National Association(“Wachovia”) under the terms of a line of credit entered into on March 15, 2007. The line of credit facility allows theCompany to borrow up to $75 million through March 15, 2012, and is secured by the assets of the Company. TheCompany has the option to pay interest at Wachovia’s prime rate or at libor plus applicable margin. The interest ratemay vary depending upon the ratio of the sum of earnings before interest, taxes, depreciation and amortization, asdefined in the agreement, to our indebtedness. The Company also incurs a commitment fee on the unused balance
2006 compared to 2005 (cont.)
Management’s Discussion and Analysis:Financial Condition and Results of Operations
B E N I H A N A I N C . A N D S U B S I D I A R I E S
15
available under the terms of the line of credit, based on a leverage ratio. The agreement requires that the Companymaintain certain financial ratios and profitability amounts and limits the payment of cash dividends. At April 1, 2007,the Company had approximately $2.0 million in letters of credit outstanding against this credit facility in connectionwith its workers compensation insurance program and certain leases. Accordingly, at April 1, 2007, the Company hadapproximately $73 million available for borrowing under the line of credit facility, as no borrowings were outstanding.
On July 1, 2004, the Company received net proceeds of $9,253,000, after transaction costs, representing thefunding of the first $10.0 million tranche of its sale of $20.0 million aggregate principal amount of Series BConvertible Preferred Stock (“Series B Preferred Stock”) to BFC Financial Corporation (“BFC”). In connection withthe first tranche, the Company issued and sold 400,000 shares of its Series B Preferred Stock. John E. Abdo, a directorof the Company, is a director and Vice Chairman of the Board of BFC and is a significant shareholder of BFC.
On August 4, 2005, the Company completed the second and final tranche consisting of $10.0 million aggregateprincipal amount of its Series B Preferred Stock sold to BFC. In connection with the second tranche, the Companyissued and sold 400,000 shares of its Series B Preferred Stock. The Company received net proceeds of $9,884,000,after transaction costs, from the sale.
The Series B Preferred Stock has a liquidation preference of $20.0 million, or $25.00 per share, (subject toanti-dilution provisions). The Series B Preferred Stock is convertible into Common Stock of the Company at aconversion price of $19.00 per share, that is 1.32 shares of Common Stock for each share of Series B PreferredStock (subject to anti-dilution provisions), carries a dividend at the annual rate of $1.25 per share (or 5% of thepurchase price) payable in cash or additional Series B Preferred Stock, and votes on an “as if converted” basistogether with the Company’s Common Stock on all matters put to a vote of the holders of Common Stock. Inaddition, under certain circumstances, the approval of a majority of the Series B Preferred Stock is required forcertain events outside the ordinary course of business, principally acquisitions or disposition of assets having a valuein excess of 25% of the total consolidated assets of the Company.
The Company pays quarterly dividends on the Series B Preferred Stock, and at April 1, 2007, accrued but unpaiddividends on the Series B Preferred Stock totaled $249,000.
The Company is obligated to redeem the Series B Preferred Stock at its original issue price on July 2, 2014,which date may be extended by the holders of a majority of the then-outstanding shares of Series B Preferred Stockto a date no later than July 2, 2024. The Company may pay the redemption in cash or, at its option, in shares ofCommon Stock valued at then-current market prices unless the aggregate market value of the Company’s CommonStock and any other common equity is below $75.0 million. In addition, the Series B Preferred Stock may, at theCompany’s option, be redeemed in cash at any time beginning three years from the date of issue if the volume-weighted average price of the Common Stock exceeds $38.00 per share for sixty consecutive trading days.
The holders of a majority of the outstanding Series B Preferred Stock are entitled to nominate one individual tothe Company’s board of directors. In the event that dividends are not paid for two consecutive quarters, the holders ofthe majority of the Series B Preferred Stock are entitled to elect one additional director.
As further discussed in Item 3, Legal Proceedings, the sale of the Series B Preferred Stock was the subject oflitigation. While the Delaware Court of Chancery (the “Chancery Court”) has rejected all claims asserted againstthe Company and certain directors, the decision had been appealed. On August 24, 2006, the Delaware SupremeCourt issued an opinion affirming the Chancery Court’s ruling in favor of the Company and its Board of Directors inall respects.
The Company has entered into supply agreements for the purchase of beef and seafood, in the normal course ofbusiness, at fixed prices for up to twelve-month terms. These supply agreements will eliminate volatility in the cost ofthe commodities over the terms of the agreements. These supply agreements are not considered derivative contracts.
Since restaurant businesses do not have large amounts of inventory and accounts receivable, there is generallyno need to finance such items. As a result, many restaurant businesses, including our own, operate with negativeworking capital.
Our financial resources (cont.)
Management’s Discussion and Analysis:Financial Condition and Results of Operations
B E N I H A N A I N C . A N D S U B S I D I A R I E S
16
We have undertaken a design initiative to develop a prototype Benihana teppanyaki restaurant to improve theunit-level economics while shortening construction time and improving decor. The restaurant in Miramar, Florida,which opened during June 2006, is the first restaurant to feature the new prototype design. Under a renovationprogram commenced during 2005, we are also using many of the design elements of the new prototype to refurbishour mature teppanyaki restaurant units.
During fiscal 2006, management made a strategic decision to accelerate the renovation and revitalizationprogram, which was discussed above. We are committed to revitalizing our 40-plus year old Benihana teppanyakiconcept for a new generation, while simultaneously generating a solid return on invested capital for our shareholders.The new design reflects the cutting edge of contemporary dining and entertainment, and places the customer at thecenter of the Benihana experience through the visual impact of the exterior, a vibrant waiting area, and a moredramatic stage setting for our legendary Benihana chefs. We plan to refurbish a total of approximately 20-25 of ourmature teppanyaki restaurants over a thirty month timeframe. By beginning the transformation of these 20-25 matureBenihana teppanyaki units now, we are opportunistically building a stronger foundation for our core brand amid agrowing American appetite for Asian cuisine. During fiscal 2006, our restaurant in Short Hills, New Jersey was thefirst teppanyaki to be retrofitted with the new design elements. During fiscal 2007, our Memphis, Tennessee;Cleveland, Ohio; Indianapolis, Indiana and Anaheim, California restaurants re-opened after similar renovations werecompleted. A minor remodel has also been completed at the Bethesda, Maryland restaurant, without the need totemporarily close the location. At the end of fiscal 2007, restaurants closed and undergoing major renovationsincluded the Fort Lauderdale, Florida; Miami Beach, Florida; Burlingame, California and Torrance, Californialocations. The Torrance location has subsequently reopened and we believe that we will complete two more of thesemajor renovations during the first quarter of fiscal 2008. We expect the other one to be completed during the secondquarter of fiscal 2008. Similar to the Bethesda location, two restaurants located in the New York City, New York andSacramento, California are currently undergoing minor remodeling, as well. These restaurants have not requiredtemporary closures either. We expect to complete a total of 17 renovations and have four other restaurants in progress,by the end of 2008. As we roll out the new design, we currently estimate the capital expenditures of the program toaverage approximately between $2.0 million and $2.3 million per unit. The cost to remodel each unit is directlydependent on the scope of work to be performed at each location. Management is continuously reviewing the extentof work to be performed at these sites. The scope of work may be impacted by the age of the location, currentcondition of the location, as well as local permitting requirements. The scope of work will vary by location. Somelocations will undergo a limited remodel, while others will undergo a complete renovation and a major facilityupgrade of its HVAC, electrical and plumbing systems. Management believes the long-term benefits of therevitalization initiative far outweigh the costs. The renovation of the Company’s older teppanyaki units is necessary toensure the continued relevance of the Benihana brand, and the program will enhance our leadership position as thepremier choice for Japanese-style dining.
Other future capital requirements depend on numerous factors, including market acceptance of products, thetiming and rate of expansion of the business, acquisitions, and other factors. The Company has experienced increasesin its expenditures commensurate with growth in its operations, and management anticipates that expenditures willcontinue to increase in the foreseeable future. The Company currently has fifteen restaurants under development,consisting of four Benihana teppanyaki restaurants, nine RA Sushi restaurants, and two Haru restaurants.
In addition to the renovation program, the Company will use its capital resources to settle the outstanding liabilityincurred when the Minority Stockholders exercised their put option in Haru Holding Corp. On July 1, 2005, theMinority Stockholders exercised the put option to sell their respective shares to the Company. Currently, there is adispute between the Company and the former Minority Stockholders concerning the price at which the formerMinority Stockholders exercised their put option to sell the remaining interest in Haru to the Company. The Companybelieves that the proper application of the put option price formula would result in a payment to the former MinorityStockholders of approximately $3.7 million. The Company has offered to pay such amount to the former MinorityStockholders and recorded a $3.7 million liability for the payment of the put option with respect thereto.
Our financial resources (cont.)

Management’s Discussion and Analysis:Financial Condition and Results of Operations
B E N I H A N A I N C . A N D S U B S I D I A R I E S
17
O P E R A T I N G A C T I V I T I E S
Cash provided by operations increased during the year when compared to fiscal 2006. The increase resultedmainly from the changes in working capital during the current fiscal year when compared to the prior fiscal year, aswell as from increases in earnings after adjustment for significant non-cash expenses, such as depreciation andamortization and stock-based compensation.
I N V E S T I N G A C T I V I T I E S
Expenditures for property and equipment increased during fiscal 2007 when compared to the prior year. TheCompany continues to pursue its new construction and renovation programs. Capital expenditures are expected toincrease, as the Company accelerates the pace of its programs. The Company currently has fifteen restaurants underdevelopment, consisting of four Benihana teppanyaki restaurants, nine RA Sushi restaurants and two Harurestaurants.
In September 2006, the Company completed the acquisition of a Benihana restaurant in Broomfield, Colorado.This restaurant was previously owned and operated by a franchisee. The purchase price totaled $2.8 million, of whichapproximately $2.7 million was paid in cash and the remainder in other consideration.
As discussed in Note 16 of the consolidated financial statements, in April 2006, the Company sold its SushiDoraku restaurant to Kevin Aoki, the Company’s former Vice President of Marketing and a current member of theBoard of Directors.
The following table summarizes the sources and uses of cash and cash equivalents (in thousands):
Cash provided by operating activities $31,153 $ 29,440
Cash used in investing activities (36,771) (25,286)Cash (used in) provided by financing activities (4,236) 11,539
(Decrease) increase in cash and cash equivalents $ (9,854) $ 15,693
20062007
FISCAL YEAR ENDED
Our financial resources (cont.)
On August 25, 2006, the former Minority Stockholders sued the Company. The complaint, which was filed in theSupreme Court of the State of New York, County of New York, seeks an award of $10.7 million based on the formerMinority Stockholders’ own calculation of the put option price formula and actions allegedly taken by the Companyto reduce the value of the put option.
On September 21, 2006, the parties jointly removed the case from the Supreme Court of the State of New York,County of New York, to the United States District Court for the Southern District of New York. The former MinorityStockholders filed a motion to remand the case back to the Supreme Court of the State of New York, County ofNew York, but that motion was denied on May 21, 2007. The District Court has set a scheduling conference for June21, 2007.
The Company believes that it has correctly calculated the put option price and that the claims of the formerMinority Stockholders are without merit. However, there can be no assurance as to the outcome of this litigation.
Management believes that the Company’s cash from operations and the funds available under the line of creditwill provide sufficient capital to fund operations, the restaurant renovation program and restaurant expansion for atleast the next twelve months.

Management’s Discussion and Analysis:Financial Condition and Results of Operations
B E N I H A N A I N C . A N D S U B S I D I A R I E S
18
F I N A N C I N G A C T I V I T I E S
During fiscal 2007, there were stock option exercises with cash proceeds to the Company of $2,242,000 ascompared to $5,720,000 in the prior year. Our total indebtedness decreased by $6,666,000 during fiscal 2007, as wepaid off the term loan. Additionally, as discussed above, during fiscal 2006, the Company completed the sale of thesecond and final tranche consisting of $10,000,000 aggregate principal amount of its Series B Preferred Stock sold toBFC. In connection with the second tranche, the Company issued and sold 400,000 shares of its Series B PreferredStock. The Company received net proceeds of $9,884,000, after transaction costs, from the sale.
O F F - B A L A N C E S H E E T A R R A N G E M E N T S
As of April 1, 2007 the Company did not have any “off-balance sheet arrangements” as that term is defined inRegulation S-K Item 303(a)(4).
T H E I M P A C T O F I N F L A T I O N
The Company does not believe that inflation has had a material effect on sales or expenses during the last threeyears other than labor costs. The Company’s restaurant operations are subject to federal and state minimum wagelaws governing such matters as working conditions, overtime and tip credits. Significant numbers of the Company’sfood service and preparation personnel are paid at rates related to the federal minimum wage and, accordingly,increases in the minimum wage have increased the Company’s labor costs in recent years. To the extent permitted bycompetition, the Company has mitigated increased costs by increasing menu prices and may continue to do so ifdeemed necessary in future years.
Q U A N T I TAT I V E A N D Q U A L I TAT I V E D I S C L O S U R E S A B O U T M A R K E T R I S K S
We are exposed to certain risks of increasing interest rates and commodity prices. The interest on ourindebtedness is largely variable and is benchmarked to the prime rate in the United States or to libor. We may protectourselves from interest rate increases from time-to-time by entering into derivative agreements that fix the interest rateat predetermined levels. We have a policy not to use derivative agreements for trading purposes. We have noderivative agreements as of April 1, 2007.
We purchase commodities such as chicken, beef, lobster, fish and shrimp for our restaurants. The prices of thesecommodities may be volatile depending upon market conditions. We do not purchase forward commodity contractsbecause the changes in prices for them have historically been short-term in nature and, in our view, the cost of thecontracts is in excess of the benefits.
We have, however, entered into supply agreements for the purchase of beef and seafood, in the normal course ofbusiness, at fixed prices for up to twelve-month terms. These supply agreements will eliminate volatility in the cost ofthe commodities over the terms of the agreements. These supply agreements are not considered derivative contracts.
Contractual obligations and commitments (in thousands):
Operating lease obligations $174,285 $ 12,233 $ 12,429 $ 12,324 $ 12,327 $ 12,125 $112,847Haru put option 3,718 3,718 – – – – –Purchase commitments 10,618 10,618 – – – – –
Total $188,621 $ 26,569 $ 12,429 $ 12,324 $ 12,327 $ 12,125 $112,847
2008Total 2010 20122009 2011 Thereafter
19
B E N I H A N A I N C . A N D S U B S I D I A R I E S
Management’s Discussion and Analysis:Financial Condition and Results of Operations
S E A S O N A L I T Y O F O U R B U S I N E S S
We have a 52/53-week fiscal year. Our fiscal year ends on the Sunday within the dates of March 26 throughApril 1. We divide the fiscal year into 13 four-week periods. Because of the odd number of periods, our first fiscalquarter consists of 4 periods totaling 16 weeks and each of the remaining three quarters consists of 3 periods totaling12 weeks each. In the event of a 53-week year, the additional week is included in the fourth quarter of the fiscal year.This operating calendar provides us a consistent number of operating days within each period, as well as ensures thatcertain holidays significant to our operations occur consistently within the same fiscal quarters. Because of thedifferences in length of fiscal quarters, however, results of operations between the first quarter and the later quarters ofa fiscal year are not comparable.
Our business is not highly seasonal although we do have more diners coming to our restaurants for specialholidays such as Mother’s Day, Valentine’s Day and New Year’s Eve. Mother’s Day falls in our first fiscal quarter,New Year’s Eve in the third fiscal quarter and Valentine’s Day in the fourth fiscal quarter of each year.
Fiscal year 2007 consisted of 53 weeks, while fiscal years 2006 and 2005 each consisted of 52 weeks.
C R I T I C A L A C C O U N T I N G P O L I C I E S A N D E S T I M AT E S
The Company’s discussion and analysis of its financial condition and results of operations are based upon theCompany’s consolidated financial statements, which have been prepared in accordance with accounting principlesgenerally accepted in the United States of America. The preparation of these financial statements requires theCompany to make estimates and judgments that affect the reported amounts of assets, liabilities, revenues andexpenses, and related disclosure of contingent assets and liabilities during the reported period. Actual amounts coulddiffer from those estimates. (See Note 1 of Notes to Consolidated Financial Statements included in this Annual Report).
Critical accounting policies are those that we believe are most important to portraying our financial condition andresults of operations and also require the greatest amount of subjective or complex judgments by management.Judgments or uncertainties regarding the application of these policies may result in materially different amounts beingreported under different conditions or using different assumptions. We consider the following policies to be the mostcritical in understanding the judgments that are involved in preparing our consolidated financial statements.
Long-Lived Assets - We record all property and equipment at cost. Improvements are capitalized while repairsand maintenance costs are expensed as incurred. Depreciation and amortization of long-lived assets are calculatedusing the straight-line method over the estimated useful life of the assets or the lease terms of the respective leases.The useful life of property and equipment and the determination as to what constitutes a capitalized cost versus arepair and maintenance expense involves judgments by management. These judgments may produce materiallydifferent amounts of depreciation and amortization expense and repairs and maintenance expense if differentassumptions were used.
We periodically assess the potential impairment of long-lived assets whenever events or changes incircumstances indicate that the carrying value may not be recoverable. Recoverability of assets is measured bycomparing the carrying value of the assets to the future cash flows to be generated by the asset. If the total estimatedfuture cash flows are less than the carrying amount of the asset, the carrying amount is written down to the estimatedfair value, and an impairment charge is taken against results of operations. In fiscal 2005 we recorded such animpairment charge resulting in a write down of long-lived assets of approximately $2.7 million. (See Note 3 of Notesto Consolidated Financial Statements). No impairment charges were recognized during fiscal 2007 or 2006.
Goodwill - We review the recoverability of goodwill annually based primarily upon an estimation of the fairmarket value based upon an analysis of cash flows of the related investment assets in comparison to cash flows ofsimilar restaurant businesses that were bought and sold within a reasonable time frame to our own evaluation. Ourannual evaluation is made during the third fiscal quarter of each year. We also would make a similar evaluationwhenever events or changes in circumstances indicate that the carrying amounts may not be recoverable. The analysisinvolves judgments by management which could produce materially different results if different assumptions are usedin the analysis.

20
B E N I H A N A I N C . A N D S U B S I D I A R I E S
Leases - The Company is obligated under various lease agreements for certain restaurant facilities. For operatingleases, the Company recognizes rent expense on a straight-line basis over the expected lease term. Capital leases, ifany, are recorded as an asset and an obligation at an amount equal to the present value of the minimum leasepayments during the lease term. Under the provisions of certain of the Company’s leases, there are rent holidaysand/or escalations in payments over the base lease term, as well as options for renewal for additional periods. Theeffects of the rent holidays and escalations have been reflected in rent expense on a straight-line basis over theexpected lease term, which includes option periods when management determines that the Company will exercisesuch option periods due to the fact that the Company would incur an economic penalty for not doing so. The leaseterm commences on the date when the Company becomes legally obligated for the rent payments. Leaseholdimprovements and property held under capital leases, if any, for each restaurant facility are amortized on the straight-line method over the shorter of the estimated life of the asset or the same expected lease term used for leaseaccounting purposes. For each restaurant facility, the consolidated financial statements reflect the same lease term foramortizing leasehold improvements as the Company uses to determine capital versus operating lease classificationsand in calculating straight-line rent expense. Percentage rent expense is generally based upon sales levels and isaccrued at the point in time the Company determines that it is probable that such sales levels will be achieved.Leasehold improvements paid for by the lessor are recorded as leasehold improvements and deferred rent.
Judgments made by the Company related to the probable term for each restaurant’s lease affect the classificationand accounting for a lease as capital or operating, the rent holidays and/or escalations in payments that are taken intoconsideration when calculating straight-line rent, and the term over which leasehold improvements for each restaurantfacility are amortized. These judgments may produce materially different amounts of depreciation, amortization andrent expense than would be reported if different lease term assumptions were used.
Self-Insurance - The Company is self-insured for certain losses, principally related to health and workers’compensation. The Company maintains stop loss coverage with third party insurers to limit its total exposure. Theself-insurance liability represents an estimate of the ultimate cost of claims incurred and unpaid as of the balancesheet date. The Company contracted with third-party actuaries, who utilize estimates of expected losses, based onstatistical analyses, to validate its self-insurance liability. The self-insurance liability is reviewed by the Company on aquarterly basis to ensure that the liability is appropriate. If actual trends, including the severity or frequency of claims,differ from our estimates, our financial results could be impacted.
Income Taxes - We estimate certain components of our provision for income taxes. These estimates include, butare not limited to, effective state and local income tax amounts, allowable tax credits for items such as FICA taxespaid on reported tip income and estimates related to depreciation expense allowable for tax purposes. Our estimatesare made based on the best available information at the time that we prepare the provision. We usually file our incometax returns many months after our fiscal year-end. All tax returns are subject to audit by federal and stategovernments, usually years after the returns are filed, and could be subject to differing interpretations of the tax lawsor the Company’s application of such laws to its business (see Note 12 of Notes to Consolidated FinancialStatements).
Stock-Based Compensation - Prior to March 27, 2006, the Company accounted for stock options issued toemployees and directors under the intrinsic value method of accounting for stock-based compensation as definedin Accounting Principles Board Opinion No. 25, “Accounting for Stock Issued to Employees” (“APB 25”).Accordingly, the Company recognized no compensation expense with respect to such awards because stock optionswere granted at the fair market value of the underlying shares on the date of the grant. On March 27, 2006, theCompany adopted Statement of Financial Accounting Standards (“SFAS”) No. 123 (revised 2004), “Share-BasedPayment” (“SFAS 123R”), which replaces SFAS No. 123, “Accounting for Stock-Based Compensation”, (“SFAS123”) and supersedes APB 25. SFAS 123R requires compensation costs related to share-based payments toemployees, including grants of employee and director stock options, to be recognized in the financial statementsbased on their fair values. With limited exceptions, the amount of compensation cost will be measured based on the
Management’s Discussion and Analysis:Financial Condition and Results of Operations
C R I T I C A L A C C O U N T I N G P O L I C I E S A N D E S T I M AT E S (cont.)

21
B E N I H A N A I N C . A N D S U B S I D I A R I E S
fair market value on the grant date of the equity or liability instruments issued. Compensation cost will be recognizedover the period that an employee provides service for that award, resulting in charges to earnings. The Companyelected to adopt SFAS 123R using the modified prospective method, which required compensation expense to berecorded for all unvested share-based awards beginning in the first quarter of adoption. Accordingly, the prior fiscalyears presented in this Annual Report on Form 10-K have not been restated to reflect the fair value method ofexpensing stock options. In accordance with SFAS 123R, tax benefits related to equity award grants that are in excessof the tax benefits recorded on the Company’s consolidated statements of earnings are classified as a cash inflow inthe financing section of the Company’s consolidated statements of cash flows beginning in fiscal 2007. The Companyrecorded $399,000 ($239,000 net of tax) in stock compensation expense during the fiscal year ended April 1, 2007, asa result of adopting SFAS 123R. As of April 1, 2007, total unrecognized compensation cost related to nonvestedshare-base compensation totaled $647,000 and is expected to be recognized over approximately 1.75 years.
The fair value of options granted was estimated at the date of grant using the Black-Scholes option-pricingmodel. Option valuation models, including Black-Scholes, require the input of highly subjective assumptions, andchanges in the assumptions used can materially affect the grant date fair value of an award. These assumptionsinclude the risk-free interest rate, expected dividend yield, expected volatility and the expected life of the award.
NEW ACCOUNTING PRONOUNCEMENTS THAT MAY AFFECT OUR FINANCIAL REPORTING
In June 2006, the Financial Accounting Standards Board (“FASB”) issued Interpretation No. 48, “Accounting forUncertainty in Income Taxes, an interpretation of FAS109, Accounting for Income Taxes” (“FIN 48”), to create asingle model to address accounting for uncertainty in tax positions. FIN 48 clarifies the accounting for income taxes,by prescribing a minimum recognition threshold a tax position is required to meet before being recognized in thefinancial statements. FIN 48 also provides guidance on derecognition, measurement, classification, interest andpenalties, accounting in interim periods, disclosure and transition. FIN 48 is effective for fiscal years beginning afterDecember 15, 2006. The cumulative effect of adopting FIN 48 will be recorded in retained earnings and otheraccounts as applicable. The Company is currently evaluating the effect, if any, the adoption of FIN 48, as of April 2,2007, will have on the Company’s financial position, results of operations and disclosures.
In June 2006, the Emerging Issues Task Force (“EITF”) issued EITF Issue 06-03, “How Taxes Collected fromCustomers and Remitted to Governmental Authorities Should Be Presented in the Income Statement (That Is, Grossversus Net Presentation).” A consensus was reached that entities may adopt a policy of presenting sales taxes in theincome statement on either a gross or net basis. If taxes are significant, an entity should disclose its policy ofpresenting taxes and the amounts of taxes. The guidance is effective for periods beginning after December 15, 2006.The Company presents restaurant sales net of sales taxes. The adoption of EITF Issue 06-03 will have no impact onthe presentation of sales tax in the Company’s consolidated financial statements.
In September 2006, the FASB issued SFAS No. 157, “Fair Value Measures”(“SFAS 157”). SFAS 157 defines fairvalue, establishes a framework for measuring fair value and enhances disclosures about fair value measures requiredunder other accounting pronouncements, but does not change existing guidance as to whether or not an instrument iscarried at fair value. SFAS 157 is effective for fiscal years beginning after November 15, 2007. The Company iscurrently reviewing the provisions of SFAS 157 to determine the impact on its consolidated financial statements.
In February 2007, the FASB issued SFAS No. 159, “The Fair Value Option for Financial Assets and FinancialLiabilities” (“SFAS 159”). SFAS 159 provides reporting entities an option to report selected financial assets,including investment securities designated as available for sale, and liabilities, including most insurance contracts, atfair value. SFAS 159 establishes presentation and disclosure requirements designed to facilitate comparisons betweencompanies that choose different measurement attributes for similar types of assets and liabilities. The standard alsorequires additional information to aid financial statement users' understanding of a reporting entity's choice to use fairvalue on its earnings and also requires entities to display on the face of the balance sheet the fair value of those assetsand liabilities for which the reporting entity has chosen to measure at fair value. SFAS 159 is effective as of the
Management’s Discussion and Analysis:Financial Condition and Results of Operations
C R I T I C A L A C C O U N T I N G P O L I C I E S A N D E S T I M AT E S (cont.)
22
B E N I H A N A I N C . A N D S U B S I D I A R I E S
beginning of a reporting entity's first fiscal year beginning after November 15, 2007. Early adoption is permitted as ofthe beginning of the previous fiscal year provided the entity makes that choice in the first 120 days of that fiscal yearand also elects to apply the provisions of SFAS 157. Because application of the standard is optional, any impacts arelimited to those financial assets and liabilities to which SFAS 159 would be applied, which has yet to be determined,as is any decision concerning the early adoption of the standard.
F O R WA R D L O O K I N G S T A T E M E N T S
This Annual Report contains various “forward-looking statements” which represent our expectations or beliefsconcerning future events, including unit growth, future capital expenditures, and other operating information. Anumber of factors could, either individually or in combination, cause actual results to differ materially from thoseincluded in the forward-looking statements, including changes in consumer dining preferences, fluctuations incommodity prices, availability of qualified employees, changes in the general economy, industry cyclicality, and inconsumer disposable income, competition within the restaurant industry, availability of suitable restaurant locations,or acquisition opportunities, harsh weather conditions in areas in which the Company and its franchisees operaterestaurants or plan to build new restaurants, acceptance of the Company’s concepts in new locations, changes ingovernmental laws and regulations affecting labor rates, employee benefits, and franchising, ability to complete newrestaurant construction and obtain governmental permits on a reasonably timely basis, the possibility of an adverseoutcome in the Company’s dispute with the former Minority Stockholders of Haru Holding Corp., unstable economicconditions in foreign countries where we franchise restaurants and other factors that we cannot presently foresee.
Management’s Discussion and Analysis:Financial Condition and Results of Operations
NEW ACCOUNTING PRONOUNCEMENTS THAT MAY AFFECT OUR FINANCIAL REPORTING (cont.)

23
B E N I H A N A I N C . A N D S U B S I D I A R I E S
REVENUES
Restaurant sales $ 271,080 $ 244,032 $ 216,756 Franchise fees and royalties 1,569 1,521 1,575
Total revenues 272,649 245,553 218,331
COSTS AND EXPENSES
Cost of food and beverage sales 66,051 59,014 53,372Restaurant operating expenses 159,456 139,433 126,825Restaurant opening costs 1,535 1,270 1,304Marketing, general and administrative expenses 23,811 22,693 20,939Impairment charge – – 2,668
Total operating expenses 250,853 222,410 205,108
Income from operations 21,796 23,143 13,223Interest income (expense), net 465 88 (298)
Income before income taxes and minority interest 22,261 23,231 12,925Income tax provision 7,766 8,491 4,520
Income before minority interest 14,495 14,740 8,405Minority interest – 178 585
NET INCOME 14,495 14,562 7,820
Less: accretion of issuance costs and preferredstock dividends 1,104 1,430 422
Net Income attributable to common stockholders $ 13,391 $ 13,132 $ 7,398
EARNINGS PER SHARE
Basic earnings per common share $ 1.35 $ 1.40 $ 0.81 Diluted earnings per common share $ 1.26 $ 1.36 $ 0.77
PROFORMA EARNINGS PER SHARE
TO EFFECT STOCK DIVIDEND (Note 1)
Basic earnings per common share $ 0.90 $ 0.93 $ 0.54 Diluted earnings per common share $ 0.84 $ 0.91 $ 0.51
See notes to consolidated financial statements.
Consolidated Statements of Earnings
FISCAL YEAR ENDED
(In thousands, except per share information)
April 1,2007
March 27,2005
March 26,2006

24
B E N I H A N A I N C . A N D S U B S I D I A R I E S
ASSETS
CURRENT ASSETS:
Cash and cash equivalents $ 8,449 $ 18,303Receivables, net 2,800 2,437Inventories 5,729 6,528 Income tax receivable – 1,634Prepaid expenses and other current assets 2,784 1,517 Investment securities, available for sale - restricted 841 835Deferred income tax asset, net 931 805
Total current assets 21,534 32,059
PROPERTY AND EQUIPMENT, NET 146,479 123,578 GOODWILL 29,900 29,900 DEFERRED INCOME TAX ASSET, NET 169 – OTHER ASSETS 6,207 5,979
$ 204,289 $ 191,516
LIABILITIES, CONVERTIBLE PREFERRED STOCK AND STOCKHOLDERS’ EQUITY
CURRENT LIABILITIES:
Accounts payable $ 9,318 $ 8,044 Accrued expenses 20,663 20,821Accrued put option liability 3,718 3,718Income tax payable 136 –Current maturity of bank debt – 4,166
Total current liabilities 33,835 36,749
DEFERRED OBLIGATIONS UNDER OPERATING LEASES 8,611 7,059 LONG-TERM DEBT – BANK – 2,500 DEFERRED INCOME TAX LIABILITY, NET – 673
Total liabilities 42,446 46,981
COMMITMENTS AND CONTINGENCIES (Notes 10, 11 and 13)CONVERTIBLE PREFERRED STOCK - $1.00 par value; authorized – 5,000,000
shares; Series B Mandatory Redeemable Convertible Preferred Stock – authorized – 800,000 shares; issued and outstanding – 800,000 shares in 2007 and 2006 respectively, with a liquidation preference of $20 million plus accrued and unpaid dividends as of April 1, 2007 (Note 14) 19,361 19,273
STOCKHOLDERS’ EQUITY:Common stock - $.10 par value; convertible into Class A Common stock;
authorized – 12,000,000 shares; issued and outstanding – 2,158,312and 2,649,953 shares in 2007 and 2006, respectively 216 265
Class A Common stock - $.10 par value; authorized – 20,000,000 shares;issued and outstanding – 7,791,588 and 7,111,671 shares in 2007 and 2006, respectively 779 711
Additional paid-in capital 64,060 60,393 Retained earnings 77,427 64,036 Treasury stock -10,828 shares of Common and Class A Common
stock at cost in 2006 – (143)
Total stockholders’ equity 142,482 125,262
$ 204,289 $ 191,516
See notes to consolidated financial statements.
March 26,2006
April 1,2007
(In thousands, except share and pershare information)
Consolidated Balance Sheets
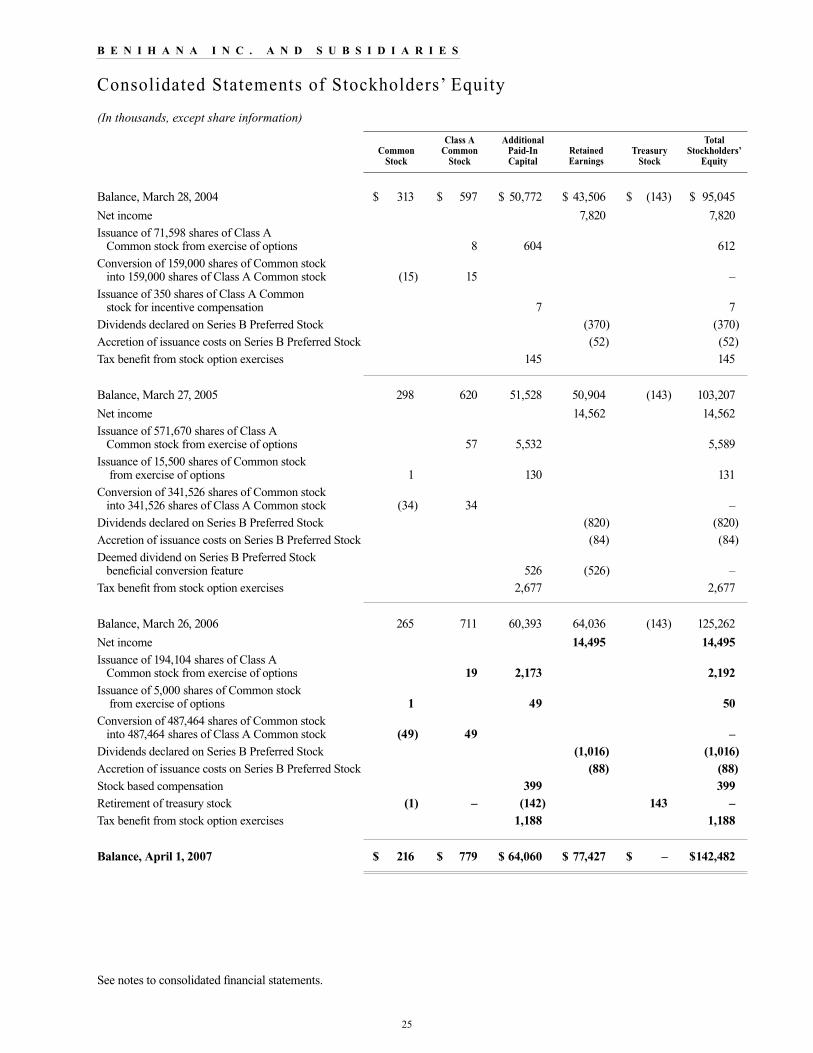
25
B E N I H A N A I N C . A N D S U B S I D I A R I E S
Balance, March 28, 2004 $ 313 $ 597 $ 50,772 $ 43,506 $ (143) $ 95,045
Net income 7,820 7,820Issuance of 71,598 shares of Class A
Common stock from exercise of options 8 604 612Conversion of 159,000 shares of Common stock
into 159,000 shares of Class A Common stock (15) 15 –Issuance of 350 shares of Class A Common
stock for incentive compensation 7 7Dividends declared on Series B Preferred Stock (370) (370)Accretion of issuance costs on Series B Preferred Stock (52) (52)Tax benefit from stock option exercises 145 145
Balance, March 27, 2005 298 620 51,528 50,904 (143) 103,207
Net income 14,562 14,562Issuance of 571,670 shares of Class A
Common stock from exercise of options 57 5,532 5,589Issuance of 15,500 shares of Common stock
from exercise of options 1 130 131Conversion of 341,526 shares of Common stock
into 341,526 shares of Class A Common stock (34) 34 –Dividends declared on Series B Preferred Stock (820) (820)Accretion of issuance costs on Series B Preferred Stock (84) (84)Deemed dividend on Series B Preferred Stock
beneficial conversion feature 526 (526) –Tax benefit from stock option exercises 2,677 2,677
Balance, March 26, 2006 265 711 60,393 64,036 (143) 125,262
Net income 14,495 14,495Issuance of 194,104 shares of Class A
Common stock from exercise of options 19 2,173 2,192Issuance of 5,000 shares of Common stock
from exercise of options 1 49 50Conversion of 487,464 shares of Common stock
into 487,464 shares of Class A Common stock (49) 49 –Dividends declared on Series B Preferred Stock (1,016) (1,016)Accretion of issuance costs on Series B Preferred Stock (88) (88)Stock based compensation 399 399Retirement of treasury stock (1) – (142) 143 –Tax benefit from stock option exercises 1,188 1,188
Balance, April 1, 2007 $ 216 $ 779 $ 64,060 $ 77,427 $ – $142,482
See notes to consolidated financial statements.
Consolidated Statements of Stockholders’ Equity
Class A Common
Stock
AdditionalPaid-InCapital
TreasuryStock
Retained Earnings
TotalStockholders’
EquityCommon
Stock
(In thousands, except share information)
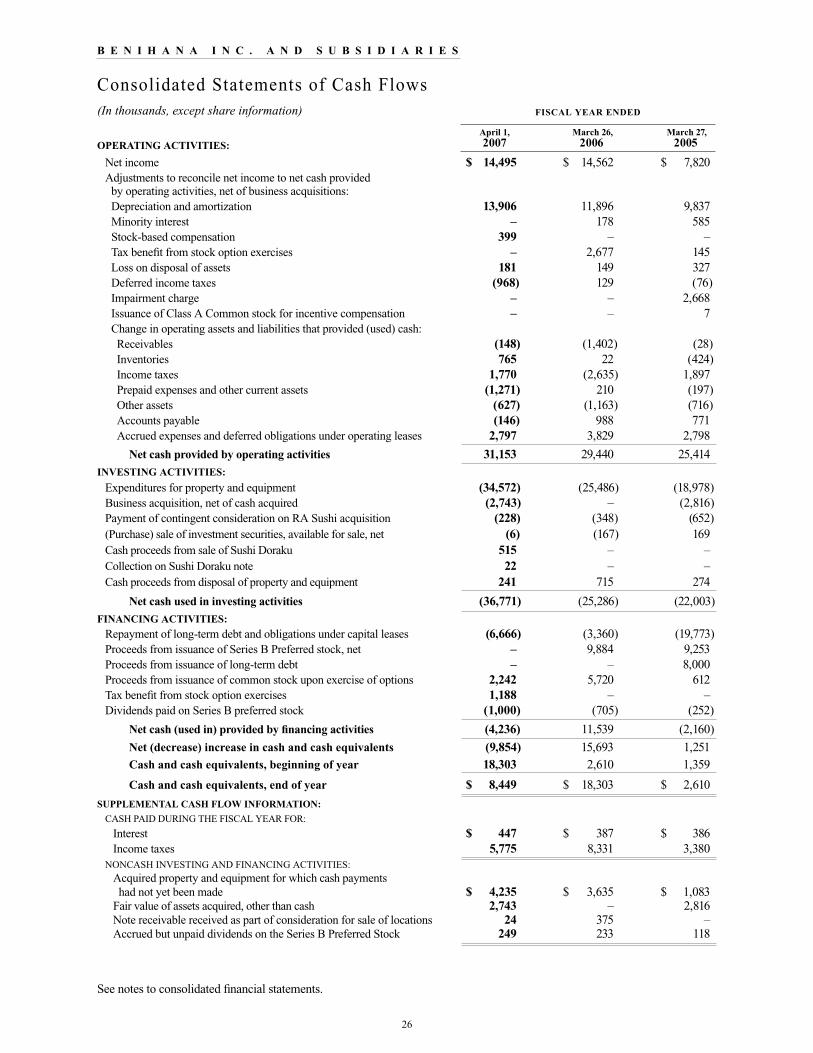
26
OPERATING ACTIVITIES:
Net income $ 14,495 $ 14,562 $ 7,820Adjustments to reconcile net income to net cash provided
by operating activities, net of business acquisitions:Depreciation and amortization 13,906 11,896 9,837 Minority interest – 178 585Stock-based compensation 399 – –Tax benefit from stock option exercises – 2,677 145Loss on disposal of assets 181 149 327Deferred income taxes (968) 129 (76)Impairment charge – – 2,668Issuance of Class A Common stock for incentive compensation – – 7Change in operating assets and liabilities that provided (used) cash:Receivables (148) (1,402) (28)Inventories 765 22 (424)Income taxes 1,770 (2,635) 1,897Prepaid expenses and other current assets (1,271) 210 (197)Other assets (627) (1,163) (716)Accounts payable (146) 988 771Accrued expenses and deferred obligations under operating leases 2,797 3,829 2,798
Net cash provided by operating activities 31,153 29,440 25,414 INVESTING ACTIVITIES:
Expenditures for property and equipment (34,572) (25,486) (18,978)Business acquisition, net of cash acquired (2,743) – (2,816)Payment of contingent consideration on RA Sushi acquisition (228) (348) (652)(Purchase) sale of investment securities, available for sale, net (6) (167) 169Cash proceeds from sale of Sushi Doraku 515 – –Collection on Sushi Doraku note 22 – –Cash proceeds from disposal of property and equipment 241 715 274
Net cash used in investing activities (36,771) (25,286) (22,003)FINANCING ACTIVITIES:
Repayment of long-term debt and obligations under capital leases (6,666) (3,360) (19,773)Proceeds from issuance of Series B Preferred stock, net – 9,884 9,253Proceeds from issuance of long-term debt – – 8,000Proceeds from issuance of common stock upon exercise of options 2,242 5,720 612 Tax benefit from stock option exercises 1,188 – –Dividends paid on Series B preferred stock (1,000) (705) (252)
Net cash (used in) provided by financing activities (4,236) 11,539 (2,160)
Net (decrease) increase in cash and cash equivalents (9,854) 15,693 1,251Cash and cash equivalents, beginning of year 18,303 2,610 1,359
Cash and cash equivalents, end of year $ 8,449 $ 18,303 $ 2,610
SUPPLEMENTAL CASH FLOW INFORMATION:
CASH PAID DURING THE FISCAL YEAR FOR:
Interest $ 447 $ 387 $ 386 Income taxes 5,775 8,331 3,380
NONCASH INVESTING AND FINANCING ACTIVITIES:Acquired property and equipment for which cash payments had not yet been made $ 4,235 $ 3,635 $ 1,083
Fair value of assets acquired, other than cash 2,743 – 2,816Note receivable received as part of consideration for sale of locations 24 375 –Accrued but unpaid dividends on the Series B Preferred Stock 249 233 118
See notes to consolidated financial statements.
Consolidated Statements of Cash Flows
B E N I H A N A I N C . A N D S U B S I D I A R I E S
April 1,2007
March 27,2005
March 26,2006
FISCAL YEAR ENDED(In thousands, except share information)

27
Notes to Consolidated Financial StatementsYears Ended April 1, 2007, March 26, 2006 and March 27, 2005
B E N I H A N A I N C . A N D S U B S I D I A R I E SB E N I H A N A I N C . A N D S U B S I D I A R I E S
OPERATIONS
Benihana Inc., including its wholly-owned subsidiaries (the “Company”), owned and operated 59 teppanyakitheme and 20 Japanese theme restaurants featuring sushi, as of April 1, 2007. The Company also has 17 franchisedteppanyaki theme restaurants as of April 1, 2007. The Company owns the right to open, license and develop restaurantsusing the Benihana name and trademarks in the United States, Central and South America and the Caribbean islands.
BASIS OF PRESENTATION
The consolidated financial statements include the assets, liabilities and results of operations of the Company’swholly-owned subsidiaries. All intercompany accounts and transactions have been eliminated in consolidation. Duringfiscal years 2006 and 2005, income attributable to other interest holders is reflected as minority interest in theconsolidated statements of earnings.
The Company has a 52/53-week fiscal year. The Company’s fiscal year ends on the Sunday within the dates ofMarch 26 through April 1. The Company divides the fiscal year into 13 four-week periods. Because of the odd numberof periods, the Company’s first fiscal quarter consists of 4 periods totaling 16 weeks and each of the remaining threequarters consists of 3 periods totaling 12 weeks each. In the event of a 53-week year, the additional week is included inthe fourth quarter of the fiscal year. This operating calendar provides the Company a consistent number of operatingdays within each period, as well as ensures that certain holidays significant to the Company occur consistently withinthe same fiscal quarters. Because of the differences in length of fiscal quarters, however, results of operations betweenthe first quarter and the later quarters of a fiscal year are not comparable. Fiscal year 2007 consisted of 53 weeks, whilefiscal years 2006 and 2005 each consisted of 52 weeks.
As further discussed in Note 15, subsequent to the end of fiscal year 2007, on May 18, 2007, the Company's Boardof Directors unanimously declared a three-for-two stock split to be effected by means of a dividend of one-half of oneshare of Common Stock for each outstanding share of Common Stock and each outstanding share of Class A CommonStock. Share and per share information included in the consolidated financial statements does not reflect the impact ofthe stock dividend, in accordance with Statement of Financial Accounting Standards No. 128, “Earnings per Share,” asthe stock dividend had not occurred prior to the issuance of these consolidated financial statements. However, theCompany has presented the proforma effects of the stock dividend on earnings per share in the accompanyingconsolidated statements of earnings.
Certain amounts shown in the consolidated balance sheet as of March 26, 2006 have been reclassified to conformto the current year consolidated balance sheet presentation. Specifically, investment securities, available for sale havebeen presented as a separate item in the current year presentation. Corresponding changes have been made to theconsolidated statements of cash flows for fiscal 2006 and 2005. The effects on the consolidated statements of cash flowsresulted in changes from amounts previously presented to the captions described below:
These changes resulted in:
• Net (decrease) increase in cash and cash equivalents decreased by $167,000 in 2006 and increased by$169,000 in 2005; and
• Net cash used in investing activities increased by $167,000 in 2006 and decreased by $169,000 in 2005
USE OF ESTIMATES
The preparation of financial statements in conformity with accounting principles generally accepted in the UnitedStates of America (“generally accepted accounting principles”) requires that management make estimates andassumptions that affect the reported amounts of assets and liabilities at the date of the financial statements and thereported amounts of revenue and expenses during the reporting period. Actual amounts could differ from thoseestimates.
NOTE 1: SUMMARY OF SIGNIFICANT ACCOUNTING POLICIES

28
Notes to Consolidated Financial StatementsYears Ended April 1, 2007, March 26, 2006 and March 27, 2005
NOTE 1: SUMMARY OF SIGNIFICANT ACCOUNTING POLICIES ( c o n t . )
B E N I H A N A I N C . A N D S U B S I D I A R I E SB E N I H A N A I N C . A N D S U B S I D I A R I E S
REVENUE RECOGNITION
Restaurant Sales - Revenues from food and beverage sales are recognized as products are sold. Franchise Feesand Royalties - The Company recognizes initial franchise fees as income when substantially all of its obligations aresatisfied, which generally coincides with the opening of the franchised restaurants. The Company also receivescontinuing royalties based upon a percentage of each franchised restaurant’s gross revenues. Royalties are recognizedas income when earned.
The Company sells gift cards to customers in its restaurants and through its websites. Proceeds from the sale of giftcards are deferred until the revenue recognition criteria has been met, generally upon redemption.
CASH AND CASH EQUIVALENTS
The Company considers all highly liquid investment instruments purchased with an initial maturity of threemonths or less to be cash equivalents. Amounts receivable from third-party credit card processors are also consideredcash equivalents because they are both short-term and highly liquid in nature and are typically converted to cash withinthree days of the sales transaction.
INVENTORIES
Inventories, which consist principally of restaurant operating supplies and food and beverage, are stated at thelower of cost (first-in, first-out method) or market.
INVESTMENT SECURITIES, AVAILABLE FOR SALE
The Company maintains investments in certain publicly traded mutual funds that invest in debt and equitysecurities. The Company invests in these mutual funds to mirror and track the performance of the elections made byemployees that participate in the Company’s deferred compensation plan. These investments are held in trust inaccordance with the deferred compensation plan and are restricted for payment of plan expenses and benefits to theparticipants. These mutual fund investments are classified as available for sale and are carried at fair value withunrealized gains and losses reflected as a separate component of stockholders’ equity. The unrealized gain (loss)position of the investments as of April 1, 2007 and March 26, 2006 was not material to these consolidated financialstatements. These investments have no stated maturities.
ACCOUNTING FOR LONG-LIVED ASSETS
Property and equipment are stated at cost. The Company capitalizes all direct costs incurred to constructrestaurants. Upon opening, these costs are depreciated and charged to expense based upon their useful lifeclassification. Rent expense incurred during the construction period is not capitalized but is charged to restaurantopening costs. The amount of interest capitalized in connection with restaurant construction in fiscal 2007, 2006 and2005 were approximately $318,000, $213,000 and $127,000, respectively.
The Company evaluates its net investment in restaurant properties and its other long-lived assets for impairmentwhen events or changes in circumstances that indicate the carrying amounts of an asset may not be recoverable. Duringfiscal 2005, the Company recorded an impairment charge of $2.7 million for the write-down to fair value of propertyand equipment at two teppanyaki restaurants, one RA Sushi restaurant and its sole Doraku restaurant. (See Note 3). Noimpairment charges were recognized during fiscal years 2007 or 2006.
DEPRECIATION AND AMORTIZATION
Depreciation and amortization are computed by the straight-line method over the estimated useful life (buildings -30 years; restaurant furniture, fixtures and equipment - 8 years; office equipment - 8 years; personal computers,software and related equipment - 3 years; and leasehold improvements - lesser of the underlying lease terms, includingrenewal options, or their useful lives). Depreciation expense associated with property and equipment, includingproperty under capital leases, totaled $13,323,000, $11,386,000, and $9,452,000, for fiscal years 2007, 2006, and 2005,respectively. During fiscal years 2007 and 2006, the Company incurred incremental depreciation expenses of $1.6million and $1.1 million, respectively, related to the Company’s review of estimated useful lives of assets forrestaurants scheduled to be remodeled.

29
Notes to Consolidated Financial StatementsYears Ended April 1, 2007, March 26, 2006 and March 27, 2005
NOTE 1: SUMMARY OF SIGNIFICANT ACCOUNTING POLICIES ( c o n t . )
B E N I H A N A I N C . A N D S U B S I D I A R I E SB E N I H A N A I N C . A N D S U B S I D I A R I E S
ACCOUNTING FOR GOODWILL AND INTANGIBLES
Goodwill represents the residual purchase price remaining after allocation of the purchase price, based upon thefair value of assets acquired. Goodwill and intangible assets deemed to have indefinite lives are not amortized, but aresubject to annual impairment tests. Intangible assets deemed to have definite lives are amortized over their estimateduseful lives.
The Company annually reviews goodwill for recoverability based primarily on a multiple of earnings analysiscomparing the fair value to the carrying value. The Company performs its annual assessment for impairment duringthe third quarter of its fiscal year and more frequently if impairment indicators are identified during the year. TheCompany reviewed goodwill for possible impairment during fiscal years 2007, 2006 and 2005 and determined thatthere was no impairment of goodwill.
The following table reflects the changes in the carrying amount of goodwill for fiscal years 2006 and 2007(in thousands):
Balance as of March 27, 2005 $ 28,131RA Sushi contingent payment 228Haru put option exercise 1,541
Balance as of March 26, 2006 and April 1, 2007 $ 29,900
Estimated amortization expense over the estimated remaining life is as follows (in thousands):
FISCAL YEAR ENDING:2008 $ 5842009 2692010 2562011 2552012 254Thereafter 812
Total $ 2,430
ACCOUNTING FOR LEASES
Operating Leases - Rent expense for the Company’s operating leases, which generally have escalating rentalsover the term of the lease, is recorded on a straight-line basis over the lease term, as defined in SFAS No. 13,“Accounting for Leases.” The lease term begins when the Company has the right to control the use of the leasedproperty, which is typically before rent payments are due under the terms of most of the Company’s leases. Thedifference between rent expense and rent paid is recorded as deferred rent obligation and is included in theconsolidated balance sheets. Capital Leases, if any, are recorded as an asset and an obligation is recorded at anamount equal to the present value of the minimum lease payments during the lease term.
ACCOUNTING FOR THE COSTS OF COMPUTER SOFTWARE DEVELOPED OR OBTAINED FOR INTERNAL USE
The Company capitalizes and records in other assets the cost of computer software obtained for internal use andamortizes such costs over a three-year period. Amortization of these costs totaled $221,000, $259,000 and $84,000during fiscal years 2007, 2006 and 2005, respectively.
There was no change in goodwill during fiscal 2007.
Intangible assets consist of premiums on liquor licenses, lease acquisition costs, capitalized computer softwarecosts, and reacquired franchise rights. These intangible assets are classified as other assets. Premiums on liquorlicenses are indefinite lived intangible assets. Lease acquisition costs are amortized over the remaining life of theacquired lease. Capitalized computer software costs are amortized over three years. Reacquired franchise rights areamortized over the remaining term of purchased rights. Amortization of intangibles totaled $454,000, $438,000 and$324,000 during fiscal years 2007, 2006 and 2005, respectively.

30
Notes to Consolidated Financial StatementsYears Ended April 1, 2007, March 26, 2006 and March 27, 2005
NOTE 1: SUMMARY OF SIGNIFICANT ACCOUNTING POLICIES ( c o n t . )
B E N I H A N A I N C . A N D S U B S I D I A R I E SB E N I H A N A I N C . A N D S U B S I D I A R I E S
SELF-INSURANCE
The Company is self-insured for certain losses, principally related to health and workers’ compensation. TheCompany maintains stop loss coverage with third party insurers to limit its total exposure. The self-insurance liabilityrepresents an estimate of the ultimate cost of claims incurred and unpaid as of the balance sheet date. The Companycontracted with third-party actuaries, who utilize estimates of expected losses, based on statistical analyses, to validateits self-insurance liability. The self-insurance liability is reviewed by the Company on a quarterly basis to ensure thatthe liability is appropriate. If actual trends, including the severity or frequency of claims, differ from the Company’sestimates, the Company’s financial results could be impacted.
INCOME TAXES
The Company uses the asset and liability method which recognizes the amount of current and deferred taxespayable or refundable at the date of the financial statements as a result of all events that have been recognized in theconsolidated financial statements as measured by the provisions of enacted law. Recognition of deferred tax assets islimited to amounts considered by management to be more likely than not of realization in future periods.
DERIVATIVE INSTRUMENTS
The Company does not currently utilize instruments to hedge exposure to fluctuations in variable interest rates,currency fluctuations or fluctuations in the prices of commodities used in its products.
STOCK-BASED COMPENSATION
Prior to March 27, 2006, the Company accounted for stock options issued to employees and directors under theintrinsic value method of accounting for stock-based compensation as defined in Accounting Principles BoardOpinion No. 25, “Accounting for Stock Issued to Employees” (“APB 25”). Accordingly, the Company recognized nocompensation expense with respect to such awards because stock options were granted at the fair market value of theunderlying shares on the date of the grant. On March 27, 2006, the Company adopted Statement of FinancialAccounting Standards (“SFAS”) No. 123 (revised 2004), “Share-Based Payment” (“SFAS 123R”), which replacesSFAS No. 123, “Accounting for Stock-Based Compensation”, (“SFAS 123”) and supersedes APB 25. SFAS 123Rrequires compensation costs related to share-based payments to employees, including grants of employee and directorstock options, to be recognized in the financial statements based on their fair values. With limited exceptions, theamount of compensation cost will be measured based on the fair market value on the grant date of the equity orliability instruments issued. Compensation cost will be recognized over the period that an employee provides servicefor that award, resulting in charges to earnings. The Company elected to adopt SFAS 123R using the modifiedprospective method, which required compensation expense to be recorded for all unvested share-based awardsbeginning in the first quarter of adoption. Accordingly, the prior fiscal years presented have not been restated to reflectthe fair value method of expensing stock options. In accordance with SFAS 123R, tax benefits related to equity awardgrants that are in excess of the tax benefits recorded on the Company’s consolidated statements of earnings areclassified as a cash inflow in the financing section of the Company’s consolidated statements of cash flows beginningin fiscal 2007.
The Company recorded $399,000 ($239,000 net of tax) in stock compensation expense during the fiscal yearended April 1, 2007, as a result of adopting SFAS 123R. The Company did not recognize any stock compensationexpense during the fiscal years 2006 and 2005. The pro-forma disclosures for fiscal years 2006 and 2005 below areprovided as if the Company had adopted the fair value recognition requirements under SFAS 123. Under SFAS 123,the fair value of each stock option granted is estimated on the date of grant using the Black-Scholes option-pricingmodel. This model requires the use of subjective assumptions that can materially affect fair value estimates.

31
Notes to Consolidated Financial StatementsYears Ended April 1, 2007, March 26, 2006 and March 27, 2005
NOTE 1: SUMMARY OF SIGNIFICANT ACCOUNTING POLICIES ( c o n t . )
B E N I H A N A I N C . A N D S U B S I D I A R I E SB E N I H A N A I N C . A N D S U B S I D I A R I E S
The following weighted average assumptions were used in the Black-Scholes option-pricing model used inestimating the fair value of option grants: a risk-free interest rate of 4.6%, 4.3% and 3.6% for fiscal years 2007, 2006and 2005, respectively; an expected life of three years for fiscal years 2007, 2006 and 2005; no expected dividendyield; and a volatility factor of 44%, 37% and 36% for fiscal years 2007, 2006 and 2005, respectively. The risk-freeinterest rate is based on the U.S. Treasury yield curve in effect at the time of grant for the expected term of the option.The expected life is based on the period of time the options are expected to be outstanding. The expected dividendyield is based on the Company’s history and expectation of dividend payments. The volatility factor is based on thehistorical price of the Company’s Common Stock or Class A Common Stock, as appropriate, over the expected life ofthe option.
The Company will generally use the Black-Scholes option pricing model to estimate the fair value of optionsgranted. The estimated fair value of share-based compensation is amortized to expense over the vesting period, whichis generally two years.
SEGMENT REPORTING
The Company accounts for its segments in accordance with SFAS No. 131, “Disclosure about Segments of anEnterprise and Related Information” (“SFAS 131”). SFAS 131 requires that a public company report annual andinterim financial and descriptive information about its reportable operating segments. Operating segments, as defined,are components of an enterprise about which separate financial information is available that is evaluated regularly bythe chief operating decision maker in deciding how to allocate resources and in assessing performance. The Companyhas determined that its reportable segments are those that are based on the Company’s methods of internal reportingand management structure, which is based upon the Company’s restaurant concepts. Accordingly, the Company’sreportable segments are based on restaurant concept. Prior to fiscal year 2007, the Company operated as a singlereporting segment. As a result of the change in presentation, prior years have been presented in a manner consistentwith the current year’s presentation.
Net incomeAs reported $14,562 $ 7,820
Less: Accretion of issuance costs and preferred stock dividends (1,430) (422)
Net income attributable to common stockholders 13,132 7,398Add: Stock-based compensation cost included in net income, net of tax – 7Less: Total stock-based employee compensation expense
determined under fair value based method for all awards, net of tax (263) (248)
Pro forma income for computation of basic earnings per share 12,869 7,157Add: Accretion of issuance costs and preferred stock dividends 1,430 422
Pro forma income for computation of diluted earnings per share $14,299 $ 7,579Basic earnings per share:
As reported $ 1.40 $ .81
Pro forma $ 1.37 $ .78Diluted earnings per share:
As reported $ 1.36 $ .77
Pro forma $ 1.34 $ .75
March 27,2005
March 26,2006
Had the Company accounted for its stock-based awards under the fair value method, the table below shows thepro forma effect on net income and earnings per share for the fiscal years ended March 26, 2006 and March 27, 2005(in thousands, except per share information):

32
Notes to Consolidated Financial StatementsYears Ended April 1, 2007, March 26, 2006 and March 27, 2005
B E N I H A N A I N C . A N D S U B S I D I A R I E SB E N I H A N A I N C . A N D S U B S I D I A R I E S
NOTE 1: SUMMARY OF SIGNIFICANT ACCOUNTING POLICIES ( c o n t . )
There were no material amounts of revenues or transfers between reportable segments. Revenues from externalcustomers are derived principally from food and beverage sales. The Company does not rely on any major customers asa source of revenue.
RESTAURANT OPENING COSTS
Restaurant opening costs include incremental out-of-pocket costs that are directly related to the opening of newrestaurants and are not capitalizable and the amortization of rentals under lease agreements for accounting purposes.Restaurant opening costs include costs to recruit and train hourly restaurant employees; wages, travel and lodging costsfor the Company’s opening training team and other support employees; costs for practice service activities; andstraight-line minimum base rent during the restaurant preopening period. The Company expenses restaurant openingcosts as incurred.
ADVERTISING
Advertising costs are expensed as incurred. Advertising costs were $6.7 million, $7.4 million, and $6.7 million infiscal 2007, 2006 and 2005, respectively and are included in Marketing, General and Administrative expenses in theConsolidated Statements of Earnings.
EARNINGS PER SHARE
Basic earnings per share is computed by dividing net income available to common shareholders by the weightedaverage number of common shares outstanding during each period. The diluted earnings per share computationincludes dilutive share equivalents issued under the Company’s various stock option plans and the dilutive convertiblepreferred stock outstanding during fiscal years 2007, 2006 and 2005.
The computation of basic earnings per share and diluted earnings per share for each fiscal year is shown below(in thousands):
Net income $ 14,495 $ 14,562 $ 7,820Less: Accretion of issuance costs and preferred stock dividends (1,104) (1,430) (422)
Income for computation of basic earnings per share 13,391 13,132 7,398Add: Accretion of issuance costs and preferred dividends (See Note 14) 1,104 1,430 422
Income for computation of diluted earnings per share $ 14,495 $ 14,562 $ 7,820
Weighted average number of common shares in basic earnings per share 9,894 9,364 9,154Effect of dilutive securities:
Stock options and warrants 558 429 483Convertible preferred shares 1,066 878 510
Weighted average number of common shares and dilutive potential common shares used in diluted earnings per share 11,518 10,671 10,147
April 1,2007
March 27,2005
March 26,2006
During fiscal 2007, no stock options were excluded from the calculation of diluted earnings per share. Duringfiscal years 2006 and 2005, stock options to purchase 60,000 and 222,750 shares, respectively, of common stock wereexcluded from the calculation of diluted earnings per share since the effect would be considered antidilutive.
NEW ACCOUNTING PRONOUNCEMENTS THAT MAY AFFECT OUR FINANCIAL REPORTING
In June 2006, the Financial Accounting Standards Board (“FASB”) issued Interpretation No. 48, “Accounting forUncertainty in Income Taxes, an interpretation of FAS109, Accounting for Income Taxes” (“FIN 48”), to create asingle model to address accounting for uncertainty in tax positions. FIN 48 clarifies the accounting for income taxes,

33
Notes to Consolidated Financial StatementsYears Ended April 1, 2007, March 26, 2006 and March 27, 2005
B E N I H A N A I N C . A N D S U B S I D I A R I E SB E N I H A N A I N C . A N D S U B S I D I A R I E S
NOTE 1: SUMMARY OF SIGNIFICANT ACCOUNTING POLICIES ( c o n t . )
NOTE 2: P U R C H A S E A N D S A L E O F R E S TA U R A N T FA C I L I T I E S
Fiscal 2007 - As discussed in Note 16, in April 2006, the Company sold its Sushi Doraku restaurant to Kevin Aoki,the Company’s former Vice President of Marketing and a current member of the Board of Directors.
In September 2006, the Company completed the acquisition of a Benihana restaurant in Broomfield, Colorado.This restaurant was previously owned and operated by a franchisee. The purchase price totaled $2.8 million, of whichapproximately $2.7 million was paid in cash and the remainder in other consideration.
Fiscal 2006 - During November 2005, the Company completed the acquisition of a teppanyaki restaurant facility inTucson, Arizona. The purchase price totaled $1.9 million payable in cash. The restaurant facility has been converted toa Benihana restaurant. The cash expenditure for this asset purchase is included in expenditures for property andequipment in the consolidated statement of cash flows for the year ended March 26, 2006.
by prescribing a minimum recognition threshold a tax position is required to meet before being recognized in thefinancial statements. FIN 48 also provides guidance on derecognition, measurement, classification, interest andpenalties, accounting in interim periods, disclosure and transition. FIN 48 is effective for fiscal years beginning afterDecember 15, 2006. The cumulative effect of adopting FIN 48 will be recorded in retained earnings and otheraccounts as applicable. The Company is currently evaluating the effect, if any, the adoption of FIN 48, as of April 2,2007, will have on the Company’s financial position, results of operations and disclosures.
In June 2006, the Emerging Issues Task Force (“EITF”) issued EITF Issue 06-03, “How Taxes Collected fromCustomers and Remitted to Governmental Authorities Should Be Presented in the Income Statement (That Is, Grossversus Net Presentation).” A consensus was reached that entities may adopt a policy of presenting sales taxes in theincome statement on either a gross or net basis. If taxes are significant, an entity should disclose its policy ofpresenting taxes and the amounts of taxes. The guidance is effective for periods beginning after December 15, 2006.The Company presents restaurant sales net of sales taxes. The adoption of EITF Issue 06-03 will have no impact onthe presentation of sales tax in the Company’s consolidated financial statements.
In September 2006, the FASB issued SFAS No. 157, “Fair Value Measures” (“SFAS 157”). SFAS 157 defines fairvalue, establishes a framework for measuring fair value and enhances disclosures about fair value measures requiredunder other accounting pronouncements, but does not change existing guidance as to whether or not an instrument iscarried at fair value. SFAS 157 is effective for fiscal years beginning after November 15, 2007. The Company iscurrently reviewing the provisions of SFAS 157 to determine the impact on its consolidated financial statements.
In February 2007, the FASB issued SFAS No. 159, “The Fair Value Option for Financial Assets and FinancialLiabilities” (“SFAS 159”). SFAS 159 provides reporting entities an option to report selected financial assets, includinginvestment securities designated as available for sale, and liabilities, including most insurance contracts, at fair value.SFAS 159 establishes presentation and disclosure requirements designed to facilitate comparisons between companiesthat choose different measurement attributes for similar types of assets and liabilities. The standard also requiresadditional information to aid financial statement users’ understanding of a reporting entity’s choice to use fair valueon its earnings and also requires entities to display on the face of the balance sheet the fair value of those assets andliabilities for which the reporting entity has chosen to measure at fair value. SFAS 159 is effective as of the beginningof a reporting entity’s first fiscal year beginning after November 15, 2007. Early adoption is permitted as of thebeginning of the previous fiscal year provided the entity makes that choice in the first 120 days of that fiscal year andalso elects to apply the provisions of SFAS 157. Because application of the standard is optional, any impacts arelimited to those financial assets and liabilities to which SFAS 159 would be applied, which has yet to be determined,as is any decision concerning the early adoption of the standard.

34
Notes to Consolidated Financial StatementsYears Ended April 1, 2007, March 26, 2006 and March 27, 2005
B E N I H A N A I N C . A N D S U B S I D I A R I E SB E N I H A N A I N C . A N D S U B S I D I A R I E S
Inventories consist of (in thousands):
Food and beverage $ 2,165 $ 3,152Supplies 3,564 3,376
$ 5,729 $ 6,528
April 1,2007
March 26,2006
N O T E 5 : I N V E N T O R I E S
NOTE 2: P U R C H A S E A N D S A L E O F R E S TA U R A N T FA C I L I T I E S ( c o n t . )
The carrying amounts of cash and cash equivalents, accounts receivable and payable, and accrued liabilitiesapproximate fair value because of the short-term nature of the items. The carrying amounts of the Company’s debt, atMarch 26, 2006, and other payables approximate fair value either due to their short-term nature or the variable ratesassociated with these debt instruments. The fair value of investment securities, available for sale are based on quotedmarket prices.
NOTE 4: FA I R VA L U E O F F I N A N C I A L I N S T R U M E N T S
During December 2005, the Company sold its Benihana restaurant facility located in Monterey, California to anew franchisee. The restaurant facility was sold for $522,000, of which $147,000 was paid in cash and $375,000 ispayable with interest over three years. The franchisee has entered into a 15-year franchise agreement for the operationof the Monterey location. The initial cash payment has been included in cash proceeds from sale of property andequipment in the consolidated statement of cash flows for the year ended March 26, 2006.
Fiscal 2005 - During March 2005, the Company acquired a Benihana restaurant from a franchisee in Anchorage,Alaska. The restaurant was acquired for $2.8 million, which was paid in cash.
NOTE 3: I M PA I R M E N T C H A R G E
The Company reviews its long-lived assets for impairment whenever events or changes in circumstances indicatethe carrying value amount of an asset or group of assets may not be recoverable. The Company considers a history ofrelatively small operating gains or consistent and significant operating losses to be a primary indicator of potential assetimpairment, after the individual restaurant locations have been operating for 2 years. Assets are grouped and evaluatedfor impairment at the lowest level for which there is identifiable cash flows, primarily the individual restaurant units. Arestaurant unit is deemed to be impaired if a forecast of future operating cash flows directly related to the restaurant isless than the carrying amount of the restaurant’s long-lived assets. If a restaurant unit is determined to be impaired, theloss is measured as the amount by which the carrying amount of the restaurant’s long-lived assets exceeds its fair value.Fair value is an estimate based on the best information available, including multiples of cash flow derived from recentpurchases and sales of restaurant businesses in the restaurant industry.
In fiscal 2005, the Company recorded a $2,668,000 expense for the impairment of long-lived assets. The loss onimpairment of long-lived assets primarily related to the write-down of equipment and leasehold improvements at fourrestaurant units. No impairment charges were recognized during fiscal years 2007 or 2006.
As of April 1, 2007, the Company believes that all of its restaurant units have sufficient estimated future cash flowsto support the carrying value of their long-lived assets. However, if an individual restaurant unit’s estimated future cashflows decline below its carrying value of long-lived assets, it could result in additional impairment charges.

Notes to Consolidated Financial StatementsYears Ended April 1, 2007, March 26, 2006 and March 27, 2005
B E N I H A N A I N C . A N D S U B S I D I A R I E SB E N I H A N A I N C . A N D S U B S I D I A R I E S
35
NOTE 8: ACCRUED EXPENSES
Accrued expenses consist of (in thousands):
Accrued payroll, incentive compensation and related taxes $ 4,221 $ 4,824Unredeemed gift cards and certificates 3,075 2,521Accrued workers compensation claims 2,045 1,325Sales taxes payable 1,754 1,287Accrued percentage rent 2,077 1,248Deferred compensation 884 861Accrued property taxes 674 682Accrued health insurance costs 888 608Straight-line rent accrual 199 130Other accrued operating expenses 4,846 7,335
$ 20,663 $ 20,821
April 1,2007
March 26,2006
N O T E 7 : O T H E R A S S E T S
Other assets, net consist of (in thousands):
Lease acquisition costs, net of accumulated amortization of $1,083 and $904, respectively $ 1,298 $ 1,478
Premium on liquor licenses 1,451 1,308Reacquired franchise rights, net of accumulated amortization of $40 785 –Security deposits 2,037 2,018Computer software costs, net of accumulated
amortization of $1,231 and $1,009, respectively 303 375Non-compete agreements, net of accumulated
amortization of $14 and $1, respectively 46 9Cash surrender value of life insurance policy – 391Deferred financing charges, net of accumulated
amortization of $2 and $643, respectively 277 127Long-term receivables 10 273
$ 6,207 $ 5,979
April 1,2007
March 26,2006
N O T E 6 : P R O P E R T Y A N D E Q U I P M E N T
Property and equipment, net consist of (in thousands):
Land $ 12,975 $ 12,975 Buildings 27,572 30,511 Leasehold improvements 130,609 105,244Restaurant furniture, fixtures, and equipment 32,898 29,804
204,054 178,534 Less: Accumulated depreciation and amortization 74,090 69,949
129,964 108,585 Construction in progress 16,515 14,993
$ 146,479 $ 123,578
April 1,2007
March 26,2006

36
B E N I H A N A I N C . A N D S U B S I D I A R I E S
Notes to Consolidated Financial StatementsYears Ended April 1, 2007, March 26, 2006 and March 27, 2005
B E N I H A N A I N C . A N D S U B S I D I A R I E S
N O T E 10 : L E A S E S
The Company is obligated under various lease agreements for most of its restaurant units, as well as its corporateoffice. For operating leases, the Company recognizes rent expense on a straight-line basis over the expected lease term.
Under the provisions of certain of the Company’s leases, there are rent holidays and/or escalations in paymentsover the base lease term, as well as renewal periods. The effects of the rent holidays and escalations have been reflectedin rent expense on a straight-line basis over the expected lease term, which includes option periods when it is deemed tobe reasonably assured that the Company will exercise such option periods due to the fact that the Company would incuran economic penalty for not doing so. The lease term commences on the date when the Company gains access to theleased property. Percentage rent expense is generally based upon sales levels and is accrued at the point in time theCompany determines that it is probable that such sales levels will be achieved. Leasehold improvements paid for by thelessor are recorded as leasehold improvements and deferred rent.
Judgments made by the Company related to the probable term for each restaurant unit lease affect the classificationand accounting for a lease as capital or operating, the rent holidays and/or escalations in payments that are taken intoconsideration when calculating straight-line rent, and the term over which leasehold improvements for each restaurantunit are amortized.
These judgments may produce materially different amounts of depreciation, amortization and rent expense thanwould be reported if different lease term assumptions were used.
The Company generally operates its restaurant units in leased premises. The typical restaurant premises lease is fora term of between 15 to 25 years with renewal options ranging from 5 to 25 years. The leases generally provide for theobligation to pay property taxes, utilities, and various other use and occupancy costs. Rentals under certain leases arebased on a percentage of sales in excess of a certain minimum level. Certain leases provide for increases based uponthe changes in the consumer price index. The Company is also obligated under various leases for restaurant equipmentand for office space and equipment.
N O T E 9 : R E S TA U R A N T O P E R AT I N G E X P E N S E S
Restaurant operating expenses are those costs that are directly attributed to the operation of individual restaurantlocations and consist of (in thousands):
Labor and related costs $91,903 $ 81,398 $ 76,026 Occupancy costs 16,523 14,204 12,830Depreciation and amortization 13,369 11,467 9,607Utilities 6,917 6,084 5,239Restaurant supplies 6,120 5,065 4,313Credit card discounts 5,020 4,450 3,871Other restaurant operating expenses 19,604 16,765 14,939
Total restaurant operating expenses $159,456 $139,433 $126,825
April 1,2007
March 27,2005
March 26,2006
FISCAL YEAR ENDED

B E N I H A N A I N C . A N D S U B S I D I A R I E S
Notes to Consolidated Financial StatementsYears Ended April 1, 2007, March 26, 2006 and March 27, 2005
37
The term loan was repaid during fiscal 2007.
The Company presently has available up to $75 million from Wachovia Bank, National Association (“Wachovia”)under the terms of a line of credit entered on March 15, 2007. The line of credit facility allows the Company to borrowup to $75 million through March 15, 2012, and is secured by the assets of the Company. The Company has the optionto pay interest at Wachovia’s prime rate plus 1% or at the London interbank offering rate plus an applicable margin.The interest rate may vary depending upon the ratio of the sum of earnings before interest, taxes, depreciation andamortization, as defined in the agreement, to its indebtedness. The Company also incurs a commitment fee on theunused balance available under the terms of the line of credit, based on a leverage ratio. The agreement requires that theCompany maintain certain financial ratios and profitability amounts and limits the payment of cash dividends. At April1, 2007, the Company had approximately $2 million in letters of credit outstanding against this facility in connectionwith its workers’ compensation insurance program and certain leases. Accordingly, at April 1, 2007, the Company hadapproximately $73 million available for borrowing under the line of credit facility, as no borrowings were outstanding.As of April 1, 2007, the Company was in compliance with all covenants of the Company’s credit agreement withWachovia.
N O T E 11 : L O N G - T E R M D E B T
At March 26, 2006, long-term debt consisted of (in thousands):
Term loan – bank (5.53% at March 26, 2006) $ 6,666Less current portion 4,166
$ 2,500
The amounts of operating lease obligations are as follows:
FISCAL YEAR ENDING:
2008 $ 12,2332009 12,4292010 12,3242011 12,3272012 12,125Thereafter 112,847
Total minimum lease payments $174,285
There are no remaining amounts due under the Company’s capital lease agreements at April 1, 2007.
Rent expense is comprised of the following for the fiscal years ended 2007, 2006 and 2005 (in thousands):
OperatingLeases
Minimum rentals $ 12,103 $ 10,304 $ 9,948
Contingent rentals 3,712 3,293 2,454
$ 15,815 $ 13,597 $ 12,402
April 1,2007
March 27,2005
March 26,2006
N O T E 10 : L E A S E S ( c o n t . )
Minimum payments under lease commitments are summarized below for operating leases (in thousands).

38
B E N I H A N A I N C . A N D S U B S I D I A R I E S
Notes to Consolidated Financial StatementsYears Ended April 1, 2007, March 26, 2006 and March 27, 2005
The income tax provision consists of (in thousands):
Current:Federal $ 6,707 $ 5,823 $ 3,037 State 2,027 2,539 1,559
Deferred:Federal and State (968) 129 (76)
Income tax provision $ 7,766 $ 8,491 $ 4,520
April 1,2007
March 27,2005
March 26,2006
Current asset $ 931 $ 805Long-term asset (liability) 169 (673)
$ 1,100 $ 132
April 1,2007
March 26,2006
FISCAL YEAR ENDED
N O T E 12 : I N C O M E TA X E S
Deferred tax assets and liabilities reflect the tax effect of temporary differences between amounts of assets andliabilities for financial reporting purposes and the amounts of such assets and liabilities as measured by income tax law.A valuation allowance is recognized to reduce deferred tax assets to the amounts that are more likely than not to berealized.
The income tax effects of temporary differences that give rise to deferred tax assets and liabilities are as follows(in thousands):
Deferred tax assets:Straight-line rent expense $ 2,046 $ 1,715Gift certificate liability 1,258 1,031Amortization of gain 744 784Employee benefit accruals 807 302Other 30 396
4,885 4,228Deferred tax liabilities:
Property and equipment 1,085 1,741Inventories 910 853Goodwill 1,790 1,502
3,785 4,096
Net deferred tax asset: $ 1,100 $ 132
April 1,2007
March 26,2006

39
B E N I H A N A I N C . A N D S U B S I D I A R I E S
Notes to Consolidated Financial StatementsYears Ended April 1, 2007, March 26, 2006 and March 27, 2005
Federal income tax provision at statutory rate of 35% $ 7,791 $ 8,131 $ 4,524 Benefit of graduated rates – – (86)State income taxes, net of federal benefit 1,179 1,519 963Tax credits, net (1,372) (1,226) (1,222)Other 168 67 341
Income tax provision $ 7,766 $ 8,491 $ 4,520
Effective income tax rate 34.9% 36.6% 35.0%
April 1,2007
March 27,2005
March 26,2006
FISCAL YEAR ENDED
ACQUISITIONS
In December 1999, the Company completed the acquisition of 80% of the equity of Haru Holding Corp.(“Haru”). The acquisition was accounted for using the purchase method of accounting. Pursuant to the purchaseagreement, at any time during the period from July 1, 2005 through September 30, 2005, the holders of the balance ofHaru’s equity (the “Minority Stockholders”) had a one-time option to sell their remaining shares to the Company (the“put option”). The exercise price under the put option was to be calculated as four and one-half (41/2) times Haru’sconsolidated cash flow for the fiscal year ended March 27, 2005 less the amount of Haru’s debt (as that term isdefined in the purchase agreement) at the date of the computation.
On July 1, 2005, the Minority Stockholders exercised the put option.
The Company believes that the proper application of the put option price formula would result in a payment tothe former Minority Stockholders of approximately $3.7 million. The Company has offered to pay such amount tothe former Minority Stockholder and recorded a $3.7 million liability with respect thereto.
On August 25, 2006, the former Minority Stockholders sued the Company. The complaint, which was filed in theSupreme Court of the State of New York, County of New York, seeks an award of $10.7 million based on the formerMinority Stockholders’ own calculation of the put option price formula and actions allegedly taken by the Companyto reduce the value of the put option.
On September 21, 2006, the parties jointly removed the case from the Supreme Court of the State of New York,County of New York, to the United States District Court for the Southern District of New York. The former MinorityStockholders filed a motion to remand the case back to the Supreme Court of the State of New York, County of NewYork, but that motion was denied on May 21, 2007. The District Court has set a scheduling conference for June 21, 2007.
The Company believes that it has correctly calculated the put option price and that the claims of the formerMinority Stockholders are without merit. However, there can be no assurance as to the outcome of this litigation.
In December 2002, the Company completed the acquisition of RA Sushi, a privately owned Arizona chain whichoperated four restaurants. Pursuant to the purchase agreement of RA Sushi, the Company was required to pay theseller contingent purchase price payments based on certain operating results of the acquired business for fiscal yearsending 2004, 2005 and 2006. The contingent purchase price payments were based upon the achievement of stipulated
N O T E 13 : C O M M I T M E N T S A N D C O N T I N G E N C I E S
The income tax provision differed from the amount computed at the statutory rate as follows (in thousands):
N O T E 12 : I N C O M E TA X E S ( c o n t . )

40
B E N I H A N A I N C . A N D S U B S I D I A R I E S
Notes to Consolidated Financial StatementsYears Ended April 1, 2007, March 26, 2006 and March 27, 2005
levels of operating earnings and revenues by the acquired restaurants over a three-year period commencing with theend of fiscal 2004 and such payments were not contingent on the continued employment of the sellers of therestaurants. The minimum contingent payment levels were met in fiscal years 2006, 2005 and 2004. The Companyrecorded $228,000, $348,000 and $652,000 in fiscal years 2006, 2005 and 2004, respectively, as additional goodwillfor the contingent purchase price payments due for those years. These amounts were paid during fiscal years 2007, 2006and 2005, respectively.
LITIGATION
On July 2, 2004, Benihana of Tokyo, Inc. (“BOT”), a significant holder of the Company’s Common Stock,commenced a lawsuit in the Court of Chancery of the State of Delaware (the “Chancery Court”) against the Company,individuals who were then members of the Company’s Board of Directors and BFC Financial Corporation (“BFC”).The action sought temporary and permanent injunctive relief, monetary damages and recovery of costs and expenses, inconnection with the closing of the $20.0 million sale of a new class of Series B Preferred Stock of the Company toBFC, a diversified holding company with operations in banking, real estate and other industries (see Note 14). John E.Abdo, a director of the Company, serves as a Vice Chairman, director, and is a significant shareholder of BFC. Amongother relief sought, the action sought rescission of the sale of the Series B Preferred Stock to BFC.
The action alleged that the director defendants breached their fiduciary duties in approving the financingtransaction with BFC by diluting the voting power represented by BOT’s Common Stock holding in the Company.
After a trial, the Chancery Court rejected all claims asserted against the Company and its directors finding that “thedirectors who approved the transaction did so, on an informed basis, acting in good faith and believing that they wereacting in the best interests of Benihana.” Thereafter, BOT filed an appeal with respect to the decision of the ChanceryCourt, and on August 24, 2006, the Delaware Supreme Court issued an opinion affirming the trial court’s ruling infavor of the Company and the Board of Directors in all respects.
The Company is not subject to any other significant pending legal proceedings, other than ordinary routine claimsincidental to its business.
The Company has entered into supply agreements for the purchase of beef, chicken and seafood, in the normalcourse of business, at fixed prices for up to twelve-month terms. These supply agreements will eliminate volatility inthe cost of the commodities over the terms of the agreements. These supply agreements are not considered derivativecontracts. As of April 1, 2007, purchase commitments totaled approximately $10.6 million.
N O T E 13 : C O M M I T M E N T S A N D C O N T I N G E N C I E S ( c o n t . )
N O T E 14 : C O N V E R T I B L E P R E F E R R E D S T O C K
On July 1, 2004, the Company received net proceeds of $9,253,000, after transaction costs, representing thefunding of the first $10.0 million tranche of its sale of $20.0 million aggregate principal amount of Series BConvertible Preferred Stock (“Series B Preferred Stock”) to BFC Financial Corporation (“BFC”). In connection with thefirst tranche, the Company issued and sold 400,000 shares of its Series B Preferred Stock. John E. Abdo, a director ofthe Company, is a director and Vice Chairman of the Board of BFC and is a significant shareholder of BFC.
On August 4, 2005, the Company completed the second and final tranche consisting of $10.0 million aggregateprincipal amount of its Series B Preferred Stock sold to BFC. In connection with the second tranche, the Companyissued and sold 400,000 shares of its Series B Preferred Stock. The Company received net proceeds of $9,884,000,after transaction costs, from the sale.
The Series B Preferred Stock has a liquidation preference of $20.0 million, or $25.00 per share, (subject to anti-dilution provisions) plus accrued and unpaid dividends. The Series B Preferred Stock is convertible into CommonStock of the Company at a conversion price of $19.00 per share that equates to 1.32 shares of Common Stock for eachshare of Series B Preferred Stock (subject to anti-dilution provisions). The 800,000 shares of Series B Preferred Stockoutstanding at April 1, 2007 are convertible into an aggregate 1,052,632 shares of Common Stock. The Series BPreferred Stock carries a dividend at the annual rate of $1.25 per share (or 5% of the purchase price) payable in cash oradditional Series B Preferred Stock, and votes on an “as if converted” basis together with the Company’s Common

41
B E N I H A N A I N C . A N D S U B S I D I A R I E S
Notes to Consolidated Financial StatementsYears Ended April 1, 2007, March 26, 2006 and March 27, 2005
N O T E 14 : C O N V E R T I B L E P R E F E R R E D S T O C K ( c o n t . )
Stock on all matters put to a vote of the holders of Common Stock. In addition, under certain circumstances, theapproval of a majority of the Series B Preferred Stock is required for certain events outside the ordinary course ofbusiness, principally acquisitions or disposition of assets having a value in excess of 25% of the total consolidatedassets of the Company.
The Company pays quarterly dividends on the Series B Preferred Stock, and at April 1, 2007, accrued but unpaiddividends on the Series B Preferred Stock totaled $249,000 or $0.31 per share of the Series B Preferred Stock.
Since the Series B Preferred Stock is convertible into Common Stock at a conversion price of $19.00 per share andthe Common Stock was trading at $20.00 per share on August 4, 2005 when the second tranche was completed, adeemed dividend was recognized on the beneficial conversion feature, in connection with the second tranche, totaling$526,000. The deemed dividend will not result in any cash payments to the holders of the Series B Preferred Stock.
The Company is obligated to redeem the Series B Preferred Stock at its original issue price on July 2, 2014, whichdate may be extended by the holders of a majority of the then-outstanding shares of Series B Preferred Stock to a dateno later than July 2, 2024. The Company may pay the redemption in cash or, at its option, in shares of Common Stockvalued at then-current market prices unless the aggregate market value of the Company’s Common Stock and any othercommon equity is below $75.0 million. In addition, the Series B Preferred Stock may, at the Company’s option, beredeemed in cash at any time beginning three years from the date of issue if the volume-weighted average price of theCommon Stock exceeds $38.00 per share for sixty consecutive trading days.
The holders of a majority of the outstanding Series B Preferred Stock are entitled to nominate one individual to theCompany’s board of directors. In the event that dividends are not paid for two consecutive quarters, the holders of themajority of the Series B Preferred Stock are entitled to elect one additional director.
Consistent with SFAS No. 133, “Accounting for Derivative Instruments and Hedging Activities” and EITF 00-19,“Accounting for Derivative Financial Instruments Indexed to, and Potentially Settled in, a Company’s Own Stock,” theconversion option of the Series B Preferred Stock is not a derivative liability that must be fair valued.
NOTE 15: STOCKHOLDERS’ EQUITY
COMMON AND CLASS A COMMON STOCK
The Company’s Common Stock is convertible into Class A Common stock on a one-for-one basis. The Class ACommon stock is identical to the Common stock except that it gives the holder one-tenth (1/10) vote per share, votingtogether with the Company’s Common Stock as a single class on all matters except the election of directors. Forelection of directors, the Class A common stockholders vote as a class to elect 25% of the members of the Boardof Directors.
STOCK OPTIONS
The Company has various stock option plans: a 1997 Class A Stock Option Plan, a 2000 Class A Stock OptionPlan, an Amended and Restated Directors’ Stock Option Plan and a 2003 Directors’ Stock Option Plan (“2003Directors’ Plan”), under all of which a maximum of 3,157,750 shares of the Company’s Common Stock and Class ACommon Stock were authorized for grant and for all of which options for 1,054,954 shares remain available for grant.
Options granted under the 1997 and 2000 Plans have a term of ten years from date of issuance, and are exercisableratably over a three-year period commencing with the date of the grant. Options granted under these plans require thatthe exercise price be at market value on the date of the grant, or for optionees that own more than 10% of the combinedvoting rights of the Company, at 110% of market value for incentive stock options.
Under the 2003 Directors’ Plan, options to purchase 10,000 shares of Class A Common Stock are automaticallygranted to each of the Company’s non-employee directors on the date of the Company’s annual meeting. Optionsgranted under the 2003 Directors’ Plan are exercisable ratably as to one-third of the shares on the date which is sixmonths after the date of grant, one-third of the shares on the first anniversary of the grant of such option and as to thebalance of such shares on the second anniversary of grant of such option.

B E N I H A N A I N C . A N D S U B S I D I A R I E S
Notes to Consolidated Financial StatementsYears Ended April 1, 2007, March 26, 2006 and March 27, 2005
42
NOTE 15: STOCKHOLDERS’ EQUITY ( c o n t . )
Outstanding at March 28, 2004 1,727,453 $ 11.07Granted 70,000 11.87Canceled/Expired (15,000) 12.04Exercised (71,598) 8.55
Outstanding at March 27, 2005 1,710,855 11.20Granted 60,000 22.36Canceled/Expired (10,501) 11.02Exercised (587,170) 9.74
Outstanding at March 26, 2006 1,173,184 12.49Granted 70,000 28.22Canceled/Expired (3,465) 9.25Exercised (199,104) 11.26
Outstanding at April 1, 2007 1,040,615 $ 13.81 4.6 $15,048,000
Exercisable at April 1, 2007 950,615 $ 12.57 4.2 $14,926,000
Transactions under the above plans for the fiscal years 2005, 2006 and 2007 are as follows:
AggregateIntrinsic
Value
WeightedAverage
RemainingContractual Term
(in years)
Weighted Average
Exercise Price(per share)
Shares
The purpose of the employee plans and the directors’ plans is to enable the Company to attract, retain andmotivate key employees and directors by providing them equity participation. The employee plans provide forincentive stock options (ISO’s) under Section 422A of the Internal Revenue Code of 1986, as amended, and foroptions which are not ISO’s. Options granted under the employee plans may not have terms exceeding ten years, and,in the case of the options which are ISO’s, may not provide for an option exercise price of less than 100% of the fairmarket value of the Company’s Common Stock or Class A Stock on the day of the grant (110% of such fair marketvalue in the case of optionees holding 10% or more of the combined voting rights of the Company’s securities).
The Company expects options to purchase 66,667 shares to vest during fiscal 2008. Historically, forfeitures ofoptions have not been significant.
The weighted average fair values of options granted during fiscal years 2007, 2006 and 2005 were $9.79, $6.67and $3.37, respectively.

B E N I H A N A I N C . A N D S U B S I D I A R I E S
Notes to Consolidated Financial StatementsYears Ended April 1, 2007, March 26, 2006 and March 27, 2005
43
NOTE 15: STOCKHOLDERS’ EQUITY ( c o n t . )
The following table summarizes information about stock options outstanding at April 1, 2007:
$ 6.63 - $ 7.83 98,526 3.8 $ 7.37 98,526 $ 7.379.89 - 10.65 203,250 2.5 10.39 203,250 10.39
11.03 - 13.48 425,589 4.1 12.10 425,589 12.1015.00 - 16.78 183,250 5.3 16.73 183,250 16.7322.36 60,000 8.8 22.36 40,000 22.3628.22 70,000 9.8 28.22 – –
1,040,615 4.6 $ 13.81 950,615 $ 12.57
Number
Weighted-AverageRemaining
Contractual Life NumberWeighted Average
Exercise PriceWeighted Average
Exercise PriceRanges of
Exercise Prices
Options Outstanding Options Exercisable
The intrinsic value of a stock option is the amount by which the market value of the underlying stock exceeds theexercise price of the option. For fiscal years 2007, 2006 and 2005, the total intrinsic value of stock options exercisedwas approximately $3,463,000, $7,377,000 and $472,000, respectively. Proceeds from stock options exercisedduring the fiscal years ended 2007, 2006 and 2005 totaled $2,242,000, $5,720,000 and $612,000, respectively. Uponthe exercise of stock options, shares are issued from new issuances of stock. The tax benefit realized for taxdeductions from stock options during the fiscal years ended 2007, 2006 and 2005 totaled $1,188,000, $2,677,000 and$145,000, respectively. As of April 1, 2007, total unrecognized compensation cost related to nonvested share-basecompensation totaled $647,000 and is expected to be recognized over approximately 1.75 years.
STOCK RIGHTS
The Company has a Shareholder Rights Plan under which a Preferred Share Purchase Right (Right) is representedby outstanding shares of the Company’s Common and Class A Common Stock. The Rights operate to createsubstantial dilution to a potential acquirer who seeks to make an acquisition, the terms of which the Company’s Boardof Directors believes is inadequate or structured in a coercive manner.
The Rights become exercisable on the tenth day (or such later date as the Board of Directors may determine) afterpublic announcement that a person or a group (subject to certain exceptions) has acquired 20% or more of theoutstanding Common Stock or an announcement of a tender offer that would result in beneficial ownership by a personor a group of 20% or more of the Common Stock.
On January 31, 2007, the Board of Directors of the Company approved and the Company entered into an Amendedand Restated Rights Agreement (the “Agreement”). The Agreement amended and restated that certain RightsAgreement (the “Original Agreement”) between the Company and First Union National Bank of North Carolina(which was succeeded in interest by American Stock Transfer & Trust Company), dated as of February 6, 1997. Theprincipal purpose of the Agreement was to extend the final expiration date of the Rights certificates issued under theOriginal Agreement from February 2, 2007 to February 2, 2011. The Agreement also implements certain other changesto the Original Agreement, including modifications to the provisions governing “Exempt Persons”.
Subsequent to the end of fiscal year 2007, on May 18, 2007, the Board of Directors of the Company approved andthe Company entered into an Amendment (the “Amendment”) to the Amended and Restated Rights Agreement, datedas of January 31, 2007, between the Company and American Stock Transfer & Trust Company, as rights agent. TheAmendment amended the Agreement to clarify that an Exempt Person (as defined under the Agreement) will not ceaseto be an Exempt Person if such person acquires additional shares of Common Stock pursuant to one or more actions ortransactions approved by the Company’s Board of Directors.

B E N I H A N A I N C . A N D S U B S I D I A R I E S
Notes to Consolidated Financial StatementsYears Ended April 1, 2007, March 26, 2006 and March 27, 2005
44
NOTE 15: STOCKHOLDERS’ EQUITY ( c o n t . )
STOCK DIVIDEND
Subsequent to the end of fiscal year 2007, on May 18, 2007, the Company’s Board of Directors unanimouslydeclared a three-for-two stock split to be effected by means of a dividend of one-half of one share of Common Stockfor each outstanding share of Common Stock and each outstanding share of Class A Common Stock. The stockdividend will be payable on June 15, 2007 to holders of record of the Common Stock and Class A Common Stock atthe close of business on June 1, 2007. In lieu of distributing a fractional share of Common Stock, the Company will payto stockholders holding an odd number of shares of Common Stock or an odd number of shares of Class A CommonStock an amount in cash equal to one-third of the closing price of the Common Stock on the Nasdaq National MarketSystem on June 1, 2007.
The number and class of shares available upon exercise of any options granted by the Company under its variousstock options plans will be equitably adjusted to reflect the stock dividend in accordance with the terms of such plans,taking into effect any differential in the closing price of the Common Stock and the Class A Common Stock on June 1,2007. Applicable terms of all other instruments and agreements to purchase Common Stock or Class A Common Stockwill be appropriately adjusted to reflect the stock dividend.
Share and per share information included in the consolidated financial statements does not reflect the impact of thestock dividend, in accordance with SFAS 128, as the stock dividend had not occurred prior to the issuance of theseconsolidated financial statements.
TREASURY STOCK
During fiscal year 2007, the Company retired 9,177 shares of Common Stock and 1,651 shares of Class ACommon stock, previously held in treasury.
NOTE 16: RELATED PARTY TRANSACTIONS
As discussed in Note 14, the Company sold an aggregate 800,000 shares of its Series B Preferred Stock to BFCfor $20,000,000. John E. Abdo, a director of the Company, is a director and Vice Chairman of the Board of BFC and isa significant shareholder of BFC. The sale of Series B Preferred Stock was completed in two tranches during fiscalyears 2005 and 2006. The sale of Series B Preferred Stock resulted in net aggregate proceeds of $19,137,000($9,253,000 in fiscal 2005 and $9,884,000 in fiscal 2006).
As discussed in Note 13, BOT, a significant holder of the Company’s Common Stock, commenced a lawsuit in theDelaware Chancery Court against the Company, individuals who were then members of the Company’s Board ofDirectors and BFC, in connection with the closing of the $20.0 million sale of Series B Preferred Stock of the Companyto BFC. After a trial, the Chancery Court rejected all claims asserted against the Company and its directors finding that“the directors who approved the transaction did so, on an informed basis, acting in good faith and believing that theywere acting in the best interests of Benihana.” Thereafter, BOT filed an appeal with respect to the decision of theChancery Court, and on August 24, 2006, the Delaware Supreme Court issued an opinion affirming the trial court’sruling in favor of the Company and the Board of Directors in all respects.
BOT owns a Benihana restaurant in Honolulu, Hawaii (the “Honolulu Restaurant”) and all rights to the Benihananame and trade names, service marks and proprietary systems outside the territory served by the Company whichconsists of the United States (except for rights related to the State of Hawaii) and Central and South America and theislands of the Caribbean Sea. The Company also granted to BOT a perpetual license to operate the Honolulu Restaurantand an exclusive license to own and operate Benihana restaurants in Hawaii. This license is royalty free with respect toany Hawaiian restaurant beneficially owned by Rocky H. Aoki. The Company has a right of first refusal to purchaseany Hawaiian restaurant or any joint venture or sublicensing thereof proposed to be made by BOT with an unaffiliatedthird party; and, in the event any Hawaiian restaurant is sold, sublicensed or transferred to a third party not affiliated withRocky H. Aoki, the Company will be entitled to receive royalties from such restaurant equal to 6% of gross revenues.
In April 2006, the Company sold the assets of its sole Doraku restaurant to Kevin Aoki, the Company’s formerVice President of Marketing and a current member of the Board of Directors. The assets were sold for $539,000, after

B E N I H A N A I N C . A N D S U B S I D I A R I E S
Notes to Consolidated Financial StatementsYears Ended April 1, 2007, March 26, 2006 and March 27, 2005
45
NOTE 16: RELATED PARTY TRANSACTIONS ( c o n t . )
adjustment, as determined by an independent appraisal. The transaction was approved by the Board of Directors.Pursuant to the sale agreement, Kevin Aoki extended the non-competition provision of his employment agreementthrough August 31, 2008, but Mr. Aoki is permitted (i) to own, operate and manage Sushi Doraku restaurants inHawaii and in Miami-Dade County, Florida, provided any such restaurants in Miami-Dade County are not within aseven mile radius of any existing or proposed restaurants then being operated by the Company or any of itssubsidiaries or franchisees and (ii) to have an interest in any other additional Sushi Doraku restaurants with the priorwritten consent, not to be unreasonably withheld, of a committee of Benihana’s Board of Directors. Additionally, theCompany paid Mr. Aoki approximately $56,000 upon his resignation from the Company, representing the remainderof his unearned salary under an employment agreement. Consistent with SFAS No. 146, “Accounting for CostsAssociated with Exit or Disposal Activities,” these items are reflected in the Company’s fiscal 2007 results. Thefinancial impact of this transaction was nominal.
While the assets of the Doraku restaurant meet the definition of “discontinued operations,” as defined in SFASNo. 144, “Accounting for the Impairment or Disposal of Long-Lived Assets,” the Company has not segregatedDoraku’s assets and results of operations, as the amounts are immaterial. Assets held for sale at March 26, 2006,totaled $499,000, and net income (loss) totaled approximately $41,000, $24,000 and $(296,000) for fiscal years2007, 2006 and 2005, respectively.
Darwin C. Dornbush, the Company’s Secretary and a retired Director of the Company, is a partner in DornbushSchaeffer Strongin & Venaglia, LLP, formerly known as Dornbush Schaeffer Strongin & Weinstein, LLP, a law firm.In the fiscal years 2007, 2006, and 2005, the Company incurred approximately $841,000, $660,000 and $650,000,respectively, in legal fees and expenses to Dornbush Schaeffer Strongin & Venaglia, LLP.
NOTE 17: INCENTIVE AND DEFERRED COMPENSATION PLANS
The Company has an incentive compensation plan whereby bonus awards are made if the Company attains acertain targeted return on its equity at the beginning of each fiscal year or at the discretion of the CompensationCommittee. The purpose of the plan is to improve the long-term sustainable results of operations of the Company bymore fully aligning the interests of management and key employees with the shareholders of the Company.
The Company’s annual incentive compensation plan ties key employees’ bonus earning potential to individually-designed performance objectives. Under the plan, each plan participant is provided a range of potential annual cashincentive awards based on his or her individually-designed performance objectives. Actual awards paid under the planare based on exceeding goals tied to certain budgeted results of the Company. A portion of awards is also determinedby achieving other performance and management goals.
For fiscal years 2007 and 2006, the maximum incentive awards that could be awarded to the Company’s namedexecutive officers pursuant to the incentive compensation plan are as follows: for the president and chief executiveofficer; executive vice president of operations; senior vice president – finance; vice president – marketing; senior vicepresident – chief operating administrative officer; and the vice president – sushi division: their annual base salarymultiplied by 30%. The controller and the other senior directors are eligible to receive their annual base salarymultiplied by 25% in fiscal 2007 and 20% in fiscal 2006. Incentive compensation earned during fiscal years 2007 and2006 is payable in a lump sum payment.
For fiscal 2005, the amount of the awards is capped at 50% of the eligible salary of the employee. One-third of theamounts awarded were immediately made available to the employee and the remaining two-thirds become availableratably over the succeeding two years. Amounts allocated under the plan may be taken in cash or stock deferred in anon-qualified deferred compensation plan.
Target rates are approved annually based upon a review of the rates of return on equity of other publicly tradedrestaurant businesses by the Compensation Committee of the Board of Directors.
The Company recorded $280,000, $461,000 and $75,000 of corporate incentive compensation expense for fiscalyears 2007, 2006 and 2005, respectively.

B E N I H A N A I N C . A N D S U B S I D I A R I E S
Notes to Consolidated Financial StatementsYears Ended April 1, 2007, March 26, 2006 and March 27, 2005
46
NOTE 17: INCENTIVE AND DEFERRED COMPENSATION PLANS ( c o n t . )
The Company has an executive retirement plan whereby certain key employees may elect to defer up to 20% oftheir salary and 100% of their bonus until retirement or age 55, whichever is later, or due to disability or death.Employees may select from various investment options for their available account balances. The Company has electedto invest the deferrals in mutual funds that track the election made by the participants and to monitor the selectedinvestment’s performance. Investment earnings are credited to their accounts and the Company increases or decreasesits obligations under the deferred compensation plan.
NOTE 18: SEGMENT REPORTING
The table below presents information about reportable segments for fiscal years 2007, 2006 and 2005 (inthousands):
Revenues for each of the segments consist of restaurant sales. Franchise revenues, while generated fromBenihana franchises, have not been allocated to the Teppanyaki segment. Franchise revenues are reflected ascorporate revenues.
Revenues $200,248 $ 38,986 $ 31,661 $ 185 $ 1,569 $ 272,649 Income from operations 23,850 2,538 5,451 70 (10,113) 21,796Capital expenditures 29,774 6,201 1,568 – – 37,543Depreciation expense 9,951 1,507 1,756 – 109 13,323Total assets 120,485 30,540 22,121 – 31,142 204,288
RA SushiTeppanyakiSushi
Doraku ConsolidatedHaru Corporate
Revenues $ 189,796 $ 24,620 $ 27,662 $ 1,954 $ 1,521 $ 245,553Income from operations 25,285 2,302 4,599 41 (9,084) 23,143Capital expenditures 17,816 4,904 3,111 3 – 25,834Depreciation expense 8,715 903 1,572 115 81 11,386Total assets 100,294 25,079 22,960 534 42,649 191,516
RA SushiTeppanyakiSushi
Doraku ConsolidatedHaru Corporate
Revenues $ 175,045 $ 17,334 $ 22,785 $ 1,592 $ 1,575 $ 218,331 Income from operations 18,404 (558) 4,965 (494) (9,094) 13,223Capital expenditures 13,507 3,534 5,405 – – 22,446Depreciation expense 7,222 959 1,013 186 72 9,452Total assets 89,220 19,884 20,567 632 23,951 154,254
RA SushiTeppanyakiSushi
Doraku ConsolidatedHaru Corporate
FISCAL YEAR ENDED MARCH 27, 2005
FISCAL YEAR ENDED MARCH 26, 2006
FISCAL YEAR ENDED APRIL 1, 2007

B E N I H A N A I N C . A N D S U B S I D I A R I E S
Notes to Consolidated Financial StatementsYears Ended April 1, 2007, March 26, 2006 and March 27, 2005
47
Fiscal quarter ended (in thousands except for per share information):
REVENUES $ 71,625 $62,202 $58,929 $79,893 $ 61,222 $ 55,644 $ 54,622 $ 74,065
GROSS PROFIT 53,801 46,714 44,247 60,267 46,104 41,869 41,384 55,661
NET INCOME 4,072 3,279 2,623 4,521 3,919 3,300 2,845 4,498
BASIC EARNINGS PER SHARE $ .38 $ .30 $ .24 $ .43 $ .38 $ .33 $ .22 $ .47
DILUTED EARNINGS PER SHARE $ .35 $ .28 $ .23 $ .40 $ .35 $ .30 $ .21 $ .44
Fourth Second FirstThird
N O T E 19 : Q U A R T E R LY F I N A N C I A L D ATA ( U n a u d i t e d )
Fourth Second FirstThird
APRIL 1, 2007 MARCH 26, 2006

To the Board of Directors and Stockholders of Benihana Inc.Miami, Florida
We have audited the accompanying consolidated balance sheets of Benihana Inc. and subsidiaries (the“Company”) as of April 1, 2007 and March 26, 2006, and the related consolidated statements of earnings,stockholders’ equity, and cash flows for each of the three years in the period ended April 1, 2007. These financialstatements are the responsibility of the Company’s management. Our responsibility is to express an opinion onthese financial statements based on our audits.
We conducted our audits in accordance with the standards of the Public Company Accounting OversightBoard (United States). Those standards require that we plan and perform the audit to obtain reasonable assuranceabout whether the financial statements are free of material misstatement. An audit includes examining, on a testbasis, evidence supporting the amounts and disclosures in the financial statements. An audit also includes assessingthe accounting principles used and significant estimates made by management, as well as evaluating the overallfinancial statement presentation. We believe that our audits provide a reasonable basis for our opinion.
In our opinion, such consolidated financial statements present fairly, in all material respects, the financialposition of the Company as of April 1, 2007 and March 26, 2006, and the results of its operations and its cash flowsfor each of the three years in the period ended April 1, 2007, in conformity with accounting principles generallyaccepted in the United States of America.
We have also audited, in accordance with the standards of the Public Company Accounting Oversight Board(United States), the effectiveness of the Company’s internal control over financial reporting as of April 1, 2007,based on the criteria established in Internal Control–Integrated Framework issued by the Committee of SponsoringOrganizations of the Treadway Commission and our report dated June 15, 2007 expressed an unqualified opinionon management's assessment of the effectiveness of the Company's internal control over financial reporting and anunqualified opinion on the effectiveness of the Company's internal control over financial reporting.
Deloitte & Touche LLPCertified Public Accountants
Fort Lauderdale, FloridaJune 15, 2007
B E N I H A N A I N C . A N D S U B S I D I A R I E S
Report of Independent Registered Public Accounting Firm
48
We have established and maintain disclosure controls and procedures that are designed to ensure that materialinformation relating to the Company and our subsidiaries required to be disclosed by us in the reports that we file orsubmit under the Securities Exchange Act of 1934 is recorded, processed, summarized, and reported within the timeperiods specified in the SEC’s rules and forms, and that such information is accumulated and communicated to ourmanagement, including our Chief Executive Officer and Chief Financial Officer, as appropriate to allow timelydecisions regarding required disclosure. In designing and evaluating the disclosure controls and procedures,management recognized that any controls and procedures, no matter how well designed and operated, can provideonly a reasonable assurance of achieving the desired control objectives, and management was necessarily required toapply its judgment in evaluating the cost-benefit relationship of possible controls and procedures. We carried out anevaluation, under the supervision and with the participation of our management, including our Chief ExecutiveOfficer and Chief Financial Officer, of the effectiveness of the design and operation of our disclosure controls andprocedures as of the end of the period covered by this report. Based on that evaluation, the Chief Executive Officerand Chief Financial Officer concluded that our disclosure controls and procedures were effective as of the date ofsuch evaluation.
MANAGEMENT’S REPORT ON INTERNAL CONTROL OVER FINANCIAL REPORTING
Our management is responsible for establishing and maintaining adequate internal control over financialreporting. As defined in Exchange Act Rule 13a-15(f) and 15d-15(f), internal control over financial reporting is aprocess designed by, or under the supervision of, our principal executive and principal financial officer and effectedby our Board of Directors, management and other personnel, to provide reasonable assurance regarding the reliabilityof financial reporting and the preparation of financial statements for external purposes in accordance with generallyaccepted accounting principles and includes those policies and procedures that (i) pertain to the maintenance ofrecords that in reasonable detail accurately and fairly reflect the transactions and dispositions of the assets of theCompany; (ii) provide reasonable assurance that transactions are recorded as necessary to permit preparation offinancial statements in accordance with generally accepted accounting principles, and that receipts and expendituresof the Company are being made only in accordance with authorizations of management and directors of the Company;and (iii) provide reasonable assurance regarding prevention or timely detection of unauthorized acquisition, use ordisposition of the Company’s assets that could have a material effect on the financial statements. Because of itsinherent limitations, internal control over financial reporting may not prevent or detect misstatements. Projections ofany evaluation of effectiveness to future periods are subject to the risk that controls may become inadequate becauseof changes in conditions or that the degree of compliance with the policies or procedures may deteriorate.
Under the supervision and with the participation of our management, including our Chief Executive Officerand Chief Financial Officer, we carried out an evaluation of the effectiveness of our internal control over financialreporting as of April 1, 2007 based on the criteria in “Internal Control – Integrated Framework” issued by theCommittee of Sponsoring Organizations of the Treadway Commission (“COSO”). Based upon this evaluation, ourmanagement concluded that the Company’s internal control structure and consequently, the Company’s internalcontrol over financial reporting were effective as of April 1, 2007.
Deloitte & Touche LLP, the independent registered public accounting firm that audited our financial statementsincluded in this Annual Report on Form 10K, has also audited management’s assessment of the effectiveness of theCompany’s internal control over financial reporting and the effectiveness of the Company’s internal control overfinancial reporting as of April 1, 2007. Deloitte & Touche LLP expressed an unqualified opinion on management’sassessment of the effectiveness of our internal control over financial reporting and an unqualified opinion on theeffectiveness of our internal control over financial reporting as of April 1, 2007 as stated in their report included herein.
B E N I H A N A I N C . A N D S U B S I D I A R I E S
Evaluation Disclosure Controls and Procedures
49
/s/ Joel A. SchwartzJoel A. SchwartzChief Executive Officer
/s/ Jose I. OrtegaJose I. OrtegaChief Financial Officer
June 15, 2007

To the Board of Directors and Stockholders of Benihana Inc.Miami, Florida
We have audited management’s assessment, included in the accompanying Management’s Report on InternalControl over Financial Reporting, that Benihana Inc. and subsidiaries (the “Company”) maintained effective internalcontrol over financial reporting as of April 1, 2007, based on criteria established in Internal Control–IntegratedFramework issued by the Committee of Sponsoring Organizations of the Treadway Commission. The Company’smanagement is responsible for maintaining effective internal control over financial reporting and for its assessment ofthe effectiveness of internal control over financial reporting. Our responsibility is to express an opinion onmanagement’s assessment and an opinion on the effectiveness of the Company’s internal control over financialreporting based on our audit.
We conducted our audit in accordance with the standards of the Public Company Accounting Oversight Board(United States). Those standards require that we plan and perform the audit to obtain reasonable assurance aboutwhether effective internal control over financial reporting was maintained in all material respects. Our audit includedobtaining an understanding of internal control over financial reporting, evaluating management’s assessment, testingand evaluating the design and operating effectiveness of internal control, and performing such other procedures as weconsidered necessary in the circumstances. We believe that our audit provides a reasonable basis for our opinions.
A company’s internal control over financial reporting is a process designed by, or under the supervision of, thecompany’s principal executive and principal financial officers, or persons performing similar functions, and effectedby the company’s board of directors, management, and other personnel to provide reasonable assurance regarding thereliability of financial reporting and the preparation of financial statements for external purposes in accordance withgenerally accepted accounting principles. A company’s internal control over financial reporting includes thosepolicies and procedures that (1) pertain to the maintenance of records that, in reasonable detail, accurately and fairlyreflect the transactions and dispositions of the assets of the company; (2) provide reasonable assurance thattransactions are recorded as necessary to permit preparation of financial statements in accordance with generallyaccepted accounting principles, and that receipts and expenditures of the company are being made only in accordancewith authorizations of management and directors of the company; and (3) provide reasonable assurance regardingprevention or timely detection of unauthorized acquisition, use, or disposition of the company’s assets that could havea material effect on the financial statements.
Because of the inherent limitations of internal control over financial reporting, including the possibility ofcollusion or improper management override of controls, material misstatements due to error or fraud may not beprevented or detected on a timely basis. Also, projections of any evaluation of the effectiveness of the internal controlover financial reporting to future periods are subject to the risk that the controls may become inadequate because ofchanges in conditions, or that the degree of compliance with the policies or procedures may deteriorate.
In our opinion, management’s assessment that the Company maintained effective internal control over financialreporting as of April 1, 2007, is fairly stated, in all material respects, based on the criteria established in InternalControl–Integrated Framework issued by the Committee of Sponsoring Organizations of the Treadway Commission.Also in our opinion, the Company maintained, in all material respects, effective internal control over financialreporting as of April 1, 2007, based on the criteria established in Internal Control–Integrated Framework issued bythe Committee of Sponsoring Organizations of the Treadway Commission.
We have also audited, in accordance with the standards of the Public Company Accounting Oversight Board(United States), the consolidated financial statements as of and for the year ended April 1, 2007 of the Company andour report dated June 15, 2007 expressed an unqualified opinion on those financial statements.
Deloitte & Touche LLPCertified Public Accountants
Fort Lauderdale, FloridaJune 15, 2007
B E N I H A N A I N C . A N D S U B S I D I A R I E S
Report of Independent Registered Public Accounting Firm
50

B E N I H A N A I N C . A N D S U B S I D I A R I E S
51
CORPORATE OFFICERS
Joel A. Schwartz Chairman of the Boardand Chief Executive Officer
Juan C. Garcia President
Taka Yoshimoto Executive Vice President, Operations
Jose I. Ortega Vice President - Finance, Chief Financial Officer and Treasurer
Darwin C. Dornbush Secretary
DIRECTORS
Joel A. Schwartz
Taka Yoshimoto
John E. Abdo Vice Chairman of the Board of Directors and Chairman of the Executive Committee, BFC Financial Corporation; Vice Chairman of the Board and Chairman of the Executive Committee, BankAtlantic Bancorp, Inc.; Vice Chairman and President, Levitt Corporation; and Vice Chairmanof the Board, Bluegreen Corporation
Kevin Aoki President, Aoki Group LLC
Norman Becker Independent Consultant, Certified Public Accountant
J. Ronald Castell Reelron LLC
Lewis Jaffe Chief Executive Officer, Oxford Media Inc.
Robert B. Sturges Chief Executive Officer, Nevada Gold & Casinos Inc.
Joseph J. West Dean, School of Hospitality and Tourism Management, Florida International University
COMMON STOCK
NASDAQ SymbolsCommon Stock BNHNClass A Common Stock BNHNA
GENERAL COUNSEL
Dornbush Schaeffer Strongin & Venaglia, LLP747 Third AvenueNew York, New York 10017
INDEPENDENT REGISTERED PUBLIC ACCOUNTING FIRM
Deloitte & Touche, LLP200 East Las Olas BoulevardSuite 1400Fort Lauderdale, FL 33301
10-K REPORT AVAILABILITY
A copy of the Benihana Inc. Form 10-K, filed with theU.S. Securities and Exchange Commission, is availableon our corporate website at www.Benihana.com or can beobtained by writing us at:8685 N.W. 53rd TerraceMiami, FL 33166
TRANSFER AGENT AND REGISTRAR
American Stock Transfer & Trust CompanyShareholder Services Group10150 Mallard Creek Drive, Suite 307Charlotte, North Carolina 28262(800) 937-5449
CORPORATE HEADQUARTERS
8685 Northwest 53rd TerraceMiami, Florida 33166(305) 593-0770
Corporate Information
Officers and Directors

B E N I H A N A I N C . A N D S U B S I D I A R I E S
Common Stock Information
COMMON STOCK
1ST QUARTER $ 36.45 $ 21.40 $ 16.05 $ 13.002ND QUARTER 31.12 21.10 21.66 14.253RD QUARTER 33.26 26.40 23.73 16.974TH QUARTER 34.29 27.93 30.53 21.60
CLASS A COMMON STOCK
1ST QUARTER $ 36.40 $ 21.25 $ 16.10 $ 13.072ND QUARTER 31.00 21.03 20.64 14.203RD QUARTER 33.29 25.55 23.20 16.234TH QUARTER 33.81 28.05 30.50 20.89
The Company’s Common Stock and Class A Common Stock are traded on the Nasdaq National Market System.There were 188 holders of record of the Company’s Common Stock and 427 holders of record of the Class A CommonStock at April 1, 2007.
The table below sets forth high and low prices for the Company’s Common Stock and Class A Common Stock forthe periods indicated.
FISCAL YEAR ENDED
APRIL 1, 2007
High Low
MARCH 26, 2006
High Low
FISCAL YEAR ENDED
APRIL 1, 2007
High Low
MARCH 26, 2006
High Low
The Class A Common Stock is identical to the Common Stock except that it gives the holder one-tenth (1/10) voteper share, voting together with the Company’s Common Stock as a single class on all matters except the election ofdirectors. For election of directors, the Class A Common stockholders vote as a class to elect 25% of the members ofthe Board of Directors.
The Company has not declared or paid a cash dividend on common equity since its organization and has nopresent intention of paying any such dividend in the foreseeable future. The Company intends to retain all availablecash for the operation and expansion of its business. In addition, the Company’s present loan agreement restricts thepayment of cash dividends on common stock.
52

80 COMPANY OWNED RESTAURANTS 15 UNDER DEVELOPMENT
ANCHORAGE, AKSCOTTSDALE, AZTUCSON, AZANAHEIM, CABURLINGAME, CACARLSBAD, CACITY OF INDUSTRY, CA CONCORD, CACUPERTINO, CAENCINO, CANEWPORT BEACH, CAONTARIO, CASACRAMENTO, CASAN DIEGO, CASAN FRANCISCO, CASANTA MONICA, CATORRANCE, CABROOMFIELD, CODENVER, COWASHINGTON D.C.
CORALGABLES, FLFT.LAUDERDALE, FLLAKE BUENA VISTA, FLMIRAMAR, FL NORTH BAYVILLAGE, FLMIAMI, FL - SAMURAISTUART, FLALPHARETTA, GAATLANTA I, GAATLANTA II, GALOMBARD, ILSCHAUMBURG, ILWHEELING, ILINDIANAPOLIS, INBETHESDA, MDDEARBORN, MIFARMINGTON HILLS, MITROY, MIGOLDEN VALLEY, MNMAPLEGROVE, MN
SHORT HILLS, NJPENNSAUKEN, NJMANHASSET, NYNEWYORKWEST, NYWESTBURY, NYCINCINNATI I, OHCINCINNATI II, OHCLEVELAND, OHBEAVERTON, ORPITTSBURGH, PAMEMPHIS, TNDALLAS, TXTURTLE CREEK, TXHOUSTON I, TXHOUSTON II, TXLAS COLINAS, TXSUGARLAND, TXWOODLANDS, TXSALT LAKE CITY, UT
CHANDLER, AZCHICAGO, ILPLYMOUTH MEETING, PAPLANO, TXDULLES, VA
HARU WALL STREET, NYHARU BOSTON, MA
RA SUSHI-MESA, AZRA SUSHI-HUNTINGTON BCH, CARA SUSHI-TUSTIN, CARA SUSHI-PEMBROKE PINES, FLRA SUSHI- SOUTH MIAMI, FLRA SUSHI-BALTIMORE, MDRA SUSHI-HOUSTON, TXRA SUSHI-PLANO, TX
BENIHANA BENIHANA
BENIHANA
19 BENIHANA FRANCHISE RESTAURANTS 1 UNDER DEVELOPMENT
BENIHANA
RA SUSHI RA SUSHI
HARU HARU
RA SUSHI-AHWATUKEE, AZRA SUSHI-KIERLAND, AZRA SUSHI- SCOTTSDALE, AZRA SUSHI-TEMPE, AZRA SUSHI-TUCSON, AZRA SUSHI-CORONA, CARA SUSHI- SAN DIEGO, CA
RA SUSHI-TORRANCE, CARA SUSHI-PALM BEACH GARDENS, FLRA SUSHI-CHICAGO, ILRA SUSHI-GLENVIEW, ILRA SUSHI-LOMBARD, ILRA SUSHI-LAS VEGAS, NVRA SUSHI-HOUSTON, TX
HARU AMSTERDAM, NYHARU BROADWAY, NYHARU GRAMERCY PARK, NYHARU PARK AVENUE, NY
HARU THIRD AVENUE, NYHARU TOO, NYHARU PHILADEPHIA, PA
NAPLES, FLNORTH LITTLE ROCK, ARBEVERLY HILLS, CAMONTEREY, CAHONOLULU, HIEDISON, NJLAS VEGAS, NV HARRISBURG, PA
AUSTIN, TXSAN ANTONIO, TXSEATTLE,WAMILWAUKEE,WIARUBACARACAS I VENEZUELACARACAS II VENEZUELA
EL SALVADORLIMA, PERUPANAMASANTIAGO, CHILETRINIDAD & TOBAGO
®
®
®
B E N I H A N A I N C . A N D S U B S I D I A R I E S
Benihana Restaurant Group Locations 2007

®
®
8 6 8 5 N . W. 5 3 r d Te r r a c e , M i a m i F l o r i d a 3 3 1 6 6