Embed Size (px)
Citation preview

India
Central Statistics Office (Industrial StatisticsWing), MOSPI, Government of India
Annual Survey of Industries 1999-2000
April 21, 2012

Metadata ProductionMetadataProducer(s)
Computer Centre (MOSPI, CC) , Ministry of Statistics and P I , Documentation of the study
Production Date April 20, 2012
Version version1.00 (April,2012)
Identification DDI-IND-CSO-ASI-1999-2000
This document was generated using the IHSN Microdata Management Toolkit
Table of ContentsOverview............................................................................................................................................. 1Scope & Coverage............................................................................................................................. 2Producers & Sponsors....................................................................................................................... 2Sampling............................................................................................................................................. 2Data Collection................................................................................................................................... 3Data Processing & Appraisal............................................................................................................. 4Accessibility........................................................................................................................................ 5Rights & Disclaimer............................................................................................................................5Files Description................................................................................................................................. 6
A-IDENTIFICATION PARTICULARS................................................................................6B-OWNER'S DETAIL........................................................................................................6C-FIXED ASSETS............................................................................................................6D-WORKING CAPITALS & LOANS.................................................................................7E-EMPLOYMENT AND LABOUR COST.........................................................................7F-OTHER EXPENSES..................................................................................................... 8G- OTHER OUTPUT or RECEIPT.................................................................................. 9H-INPUT ITEMS ( INDIGENOUS ).................................................................................. 9I-INPUT ITEMS IMPORTED............................................................................................ 9J-PRODUCTS AND BY-PRODUCTS............................................................................ 10
Variables List.................................................................................................................................... 11A-IDENTIFICATION PARTICULARS..............................................................................11B-OWNER'S DETAIL......................................................................................................11C-FIXED ASSETS..........................................................................................................11D-WORKING CAPITALS & LOANS...............................................................................12E-EMPLOYMENT AND LABOUR COST.......................................................................12F-OTHER EXPENSES................................................................................................... 13G- OTHER OUTPUT or RECEIPT................................................................................ 13H-INPUT ITEMS ( INDIGENOUS )................................................................................ 14I-INPUT ITEMS IMPORTED.......................................................................................... 14J-PRODUCTS AND BY-PRODUCTS............................................................................ 15
Variables Description........................................................................................................................16A-IDENTIFICATION PARTICULARS..............................................................................16B-OWNER'S DETAIL......................................................................................................18C-FIXED ASSETS..........................................................................................................21D-WORKING CAPITALS & LOANS...............................................................................23E-EMPLOYMENT AND LABOUR COST.......................................................................24F-OTHER EXPENSES................................................................................................... 26G- OTHER OUTPUT or RECEIPT................................................................................ 28H-INPUT ITEMS ( INDIGENOUS )................................................................................ 29I-INPUT ITEMS IMPORTED.......................................................................................... 32J-PRODUCTS AND BY-PRODUCTS............................................................................ 34
Documentation..................................................................................................................................37


Annual Survey of Industries 1999-2000 - Overview
- 1 -
India (2000-2001)Annual Survey of Industries 1999-2000 (ASI 1999-2000)
OverviewType Industrial Statistics (Organised Manufacturing & Labour Sector) Survey
Identification IND-CSO-ASI-1999-2000
Version Production Date: 2012-04-20Version1.00: Reorganised Anonymized dataset for publicationNotesThe final unit level data of ASI 1999-2000 is available now in electronic media. This document describes additional information regarding ASI 1999-2000 data from the point of data processing. Users of the data are requested to read this document carefully before they attempt to process the unit level data for their own purpose. They are also requested to refer to the schedule and the instruction manual for filling up the schedule before interpreting contents of various data fields.
Series The Collection of Statistics (Central) Rules, 1959 framed under the 1953 Act provided for, among others, a comprehensive Annual Survey of Industries (ASI) in India. This survey replaced both the CMI (Census of Manufacturing Industries) and SSMI (Sample Survey of Manufacturing Industries). The ASI was launched in 1960 with 1959 as the reference year and is continuing since then except for 1972. For ASI, the Collection of Statistics Act 1953 and the rules frame there-under in 1959 provides the statutory basis. The ASI refers to the factories defined in accordance with the Factories Act 1948, and thus has coverage wider than that of the CMI and SSMI put together.
AbstractIntroduction The Annual Survey of Industries (ASI) is one of the large-scale sample survey conducted by Field Operation Division of National Sample Survey Office for more than three decades with the objective of collecting comprehensive information related to registered factories on annual basis. ASI is the primary source of data for facilitating systematic study of the structure of industries, analysis of various factors influencing industries in the country and creating a database for formulation of industrial policy. The main objectives of the Annual Survey of Industries are briefly as follows: (a) Estimation of the contribution of manufacturing industries as a whole and of each unit to national income. (b) Systematic study of the structure of industry as a whole and of each type of industry and each unit. (c) Casual analysis of the various factors influencing industry in the country: and (d) Provision of comprehensive, factual and systematic basis for the formulation of policy. The Annual Survey of Industries (ASI) is the principal source of industrial statistics in India. It provides statistical information to assess changes in the growth, composition and structure of organised manufacturing sector comprising activities related to manufacturing processes, repair services, gas and water supply and cold storage. The Survey is conducted annually under the statutory provisions of the Collection of Statistics Act 1953, and the Rules framed there-under in 1959, except in the State of Jammu & Kashmir where it is conducted under the State Collection of Statistics Act, 1961 and the rules framed there-under in 1964.
Kind of Data Census and Sample survey data [cen/ssd]
Unit of Analysis The primary unit of enumeration in the survey is a factory in the case of manufacturing industries, a workshop in the case of repair services, an undertaking or a licensee in the case of electricity, gas & water supply undertakings and an establishment in the case of bidi & cigar industries. The owner of two or more establishments located in the same State and pertaining to the same industry group and belonging to same scheme (census or

Annual Survey of Industries 1999-2000 - Overview
- 2 -
sample) is, however, permitted to furnish a single consolidated return. Such consolidated returns are common feature in the case of bidi and cigar establishments, electricity and certain public sector undertakings.
Scope & CoverageScopeThe survey covers all the factories registered under Sections 2(m)(i) and 2(m)(ii) of the Factories Act, 1948, i.e. 10 or more workers with the aid of power or 20 or more workers without the aid of power. The survey also covers bidi and cigar manufacturing establishments registered under the Bidi and Cigar Workers (Conditions of Employment) Act 1966. All electricity undertakings engaged in generation, transmission and distribution of electricity, but not registered with the Central Electricity Authority (CEA) are also covered under ASI. Defence establishments, oil storage and distribution depots etc. are excluded from the purview of the survey. However, certain activities like cold storage, water supply, gas production and distribution, motion picture production, laundry services, repair of motor vehicles and of other consumer durable are covered under the survey.
Keywords FIXED CAPITAL, BONUS, WORKING CAPITAL, EMPLOYEES, WAGES AND SALARIES,TOTAL EMOLUMENTS, FUELS CONSUMED, DEPRECIATION, GROSS OUTPUT,NET VALUE ADDED, FINISHED GOODS, PHYSICAL WORKING CAPITAL, TOTALINPUT, TOTAL OUTPUT, BLOCK-A (IDENTIFICATION PARTICULARS FOR OFFICIALUSE), BLOCK-B (PARTICULARS OF FACTORIES:TO BE FILLED BY OWNERS),BLOCK-C (FIXED ASSETS), BLOCK-D (WORKING CAPITAL AND LOANS), BLOCK-E (EMPLOYMENT AND LABOUR COST), BLOCK-F (OTHER EXPENSES), BLOCK-G(OTHER INCOMES), BLOCK-H (INPUT ITEMS - Indigenous items consumed), BLOCK-I(INPUT ITEMS - Directly imported items only (consumed)), BLOCK-J (PRODUCTS ANDBY-PRODUCTS (Manufactured by the unit))
Topics Macroeconomics & Growth, Private Sector and Trade, Public Sector
Geographic CoverageThe ASI is the principal source of industrial statistics in India and extends to the entire country except Arunachal Pradesh, Mizoram & Sikkim and the Union Territory of Lakshadweep. It covers all factories registered under Sections 2m(i) and 2m(ii) of the Factories Act, 1948.
UniverseThe survey cover factories registered under the Factory Act 1948. Establishments under the control of the Defence Ministry,oil storage and distribution units, restaurants and cafes and technical training institutions not producing anything for sale or exchange were kept outside the coverage of the ASI.
Producers & SponsorsPrimaryInvestigator(s)
Central Statistics Office (Industrial Statistics Wing), MOSPI, Government of India
Other Producer(s) CSO(IS Wing), Kolkata (CSO) , MOSPI , Analysis, Design and data processingField Operation Division, NSSO (FOD, NSSO) , MOSPI , Data CollectionComputer Centre (CC) , MOSPI , Data dissemination
Funding Agency/ies MOSPI, Government of India (GOI)
OtherAcknowledgment(s)
Standing Committee on Industrial Statistics , Formulation and Finalisation of the surveystudy , GOIComputer Centre , Dissemination and web hosting , MOSPI
SamplingSampling Procedure

Annual Survey of Industries 1999-2000 - Overview
- 3 -
Sampling Procedure The sampling design followed in ASI 1999-2000 is a Circular Systematic one. All the factories in the updated frame (universe) are divided into two sectors, viz., Census and Sample. Census Sector: Census Sector is defined as follows: a) All the complete enumeration States namely, Manipur, Meghalaya, Nagaland, Tripura and Andaman & Nicobar Islands. b) For the rest of the States/ UT's., (i) units having 100 or more workers, and (ii) all factories covered under Joint Returns. Rest of the factories found in the frame constituted Sample sector on which sampling was done. Factories under Biri & Cigar sector were not considered uniformly under census sector. Factories under this sector were treated for inclusion in census sector as per definition above (i.e., more than 100 workers and/or joint returns). After identifying Census sector factories, rest of the factories were arranged in ascending order of States, NIC-98 (4 digit), number of workers and district and properly numbered. The Sampling fraction was taken as 12% within each stratum (State X Sector X 4-digit NIC) with a minimum of 8 samples except for the State of Gujarat where 9.5% sampling fraction was used. For the States of Jammu & Kashmir, Himachal Pradesh, Daman & Diu, Dadra & Nagar Haveli, Goa and Pondicherry, a minimum of 4 samples per stratum was selected. For the States of Bihar and Jharkhand, a minimum of 6 samples per stratum was selected. The entire sample was selected in the form of two independent sub-sample using Circular Systematic Sampling method.
Deviations from Sample DesignThere was no deviation from sample design in ASI 1999-2000.
WeightingPlease note that an inflation factor (Multiplier) WGT is available for each unit against records belonging to Block A: IDENTIFICATION Block., for ASI 1999-2000 data. The multiplier is calculated for each stratum (i.e. State X NIC-98 (4 Digit) after adjusting for non-response cases
Data CollectionData CollectionDates
start 2000-04-01end 2001-04-30
Data CollectionMode
Statutory return submitted by factories as well as Face to face
Data Collection NotesData Collection : The Deputy Director General, FOD(NSSO) has been designated as the SDtatistics Authority under the Collection of Statistics Act, 1953. The FOD of NSSO through its elaborate network of regional and sub-regional offices located in various parts of the country, carries out the field work. Notices are issued by the FOD (NSSO) to owners of the factories enclosing, inter-alia, a complete set of the schedule and instructions requiring them to submit the returns pertaining to the previous financial year by a specified date. Data collection is spread over a prescribed time frame as decided for specific ASI and the returns are regularly despatched to the tabulating agencies after conducting necessary data consistency checks by the NSSO field offices, in accordance with well designed scrutiny procedures and checks.
QuestionnairesAnnual Survey of Industries Questionnaire (in External Resources) is divided into different blocks: BLOCK A.IDENTIFICATION PARTICULARS BLOCK B. PARTICULARS OF THE FACTORY (TO BE FILLED BY OWNER OF THE FACTORY) BLOCK C: FIXED ASSETS BLOCK D: WORKING CAPITAL & LOANS BLOCK E : EMPLOYMENT AND LABOUR COST BLOCK F : OTHER EXPENSES

Annual Survey of Industries 1999-2000 - Overview
- 4 -
BLOCK G : OTHER INCOMES BLOCK H: INPUT ITEMS (indigenous items consumed) BLOCK I: INPUT ITEMS – directly imported items only (consumed) BLOCK J: PRODUCTS AND BY-PRODUCTS (manufactured by the unit)
Data Collector(s) NSSO(Field Operation Division) (NSSO(FOD)) , Ministry of Statistics and ProgrammeImplementation
SupervisionFOD (NSSO) under the Ministry of Statistics and PI, Government of India is responsible for supervision of data collection.
Data Processing & AppraisalData EditingPre-data entry scrutiny was carried out on the schedules for inter and intra block consistency checks. Such editing was mostly manual, although some editing was automatic. But, for major inconsistencies, the schedules were referred back to NSSO (FOD) for clarifications/modifications. Validation checks are carried out on data files. Code list, State code list, Tabulation program and ASICC code are may be refered in the External Resources which are used for editing and data processing as well.. B. Tabulation procedure The tabulation procedure by CSO(ISW) includes both the ASI 1999-00 data and the extracted data from ASI 98-99 for all tabulation purpose. For extracted returns, status of unit (Block A, Item 12) would be in the range 17 to 20. To make results comparable, users are requested to follow the same procedure. For calculation of various parameters, users are requested to refer instruction manual/report. Please note that a separate inflation factor (Multiplier) is available for each unit against records belonging to Block-A ,pos:54-62 (Please refer STRUC00.XLS) for ASI 99-00 data. The multiplier is calculated for each stratum (i.e. State X NIC'98(4 Digit)) after adjusting for non-response cases. C. Merging of unit level data As per existing policy to merge unit level data at ultimate digit level of NIC'98 (i.e., 5 digit) for the purpose of dissemination, the data have been merged for industries having less than three units within State, District and NIC'98(5 Digit) with the adjoining industries within district and then to adjoining districts within a state. There may be some NIC'98(5 Digit) ending with '9' which do not figure in the book of NIC '98. These may be treated as 'Others' under the corresponding 4-digit group. To suppress the identity of factories data fields corresponding to PSL number, Industry code as per Frame (4-digit level of NIC-98) and RO/SRO code have been filled with '9' in each record. It may please be noted that, tables generated from the merged data may not tally with the published results for few industries, since the merging for published data has been done at aggregate-level to minimise loss of information. G. Record Identification Key Record identification key for each factory is Despatch Serial No. (DSL, pos: 4-8) X Block code (Blk, pos: 3). Please refer STRUC00.XLS for item level identification key for each unit.
Other ProcessingAfter pre-data entry scrutiny, all the scrutinised schedules were entered in the ORACLE data base by manual typing through data entry software which was prepared in Visual Basic. Client-Server architecture has been used for in house data entry and validation using Oracle as a back end data base and Visual Basic as the front-end tools. There were many data entry operators doing the data entry and validation through software. After data
Annual Survey of Industries 1999-2000 - Overview
- 5 -
entry, verification of the schedules was also done programmatically. After all kinds of coverage checking and verification, logical validation was done and then the tables were prepared as per the tabulation programme. The results of ASI are produced in the form of two volumes. Volume - I presents statewise and industry-wise data relating to capital, employments, output - gross and net and several other economic parameters relevant to the industrial sector. Volume -II provides details on materials consumed and ex-factory of products and by products both at all-India level as well as at the level of state/UTs.
Estimates of Sampling ErrorRelative Standard Error (RSE) is calculated in terms of worker, wages to worker and GVA using the formula (Pl ease refer to Estimation Procedure document in external resources). Programs developed in Visual Faxpro are used to compute the RSE of estimates.
Other Forms of Data AppraisalTo check for consistency and reliability of data the same are compared with the NIC-2digit level growth rate at all India Index of Production (IIP) and the growth rates obtained from the National Accounts Statistics at current and constant prices for the registered manufacturing sector.
AccessibilityAccess Authority Deputy Director General, CC ( Ministry of Statistics and P.I) , mospi.nic.in ,
[email protected] CSO(IS Wing),Kolkata ( Ministry of Statistics and P.I) , mospi.nic.in ,[email protected]
Contact(s) ASI Processing and Report (Deputy Director General, CSO (IS Wing) 1, Council HouseStreet, Kolkata) , www.mospi.nic.in , [email protected] Dissemination (Deputy Director General, Computer Centre, East Block-10, R KPuram, New Delhi) , www.mospi.nic.in , [email protected] Dissemination (Deputy Director, Computer Centre, East Block-10, R K Puram, NewDelhi) , www.mospi.nic.in , [email protected]
ConfidentialityThe ASI data at factory level are strictly confidential and are to be used only for statistical purposes after aggregation. The collection of Statistics Act assures confidentiality of the data to the factories. To ensure confidentiality, data of factories with less than three units in an industry are merged. Location of the unit is also not divulged in the micro data.
Access ConditionsData is chargeable. Document accessing for data may be seen at "Data Access" tab on home page of Micro Data Archieve.
Citation RequirementsASI Survey 1999-2000, provided by CSO(IS Wing) Kolkata.
Rights & DisclaimerDisclaimerThe user of the data acknowledges that the original collector of the data, the authorised distributor of the data, and the relevant funding agency bear no responsibility for use of the data or for interpretations or inferences based upon such uses.
Copyright ASI 1999-2000, CSO(IS Wing), Kolkata

Annual Survey of Industries 1999-2000 - Files Description
- 6 -
Files DescriptionDataset contains 10 file(s)
A-IDENTIFICATION PARTICULARS# Cases 33515
# Variable(s) 13
File Structure Type: relationalKey(s): DSL (Despatch Serial No)
File ContentBlock - A- Identification Particulars : The file contains the Identification variables of Factory. It also contains the weighting Multiplier - WGT. Variables under this blocks are: YR, DSL common in all the blocks. DSL is Primary key and may be used for relation. Other Identification variables are Scheme, State code, NIC 5 digit, District and Sector. Variables representing Number of Factories A_Itm11, Status of factory A_Itm12, Total Number of working days and Total cost of production posted from Block E
ProducerCSO(IS Wing)
B-OWNER'S DETAIL# Cases 26815
# Variable(s) 9
File Structure Type: relationalKey(s): DSL (Despatch Serial No)
File ContentBlock - B Owner's Detail : The file contains the Factory details for : YR, DSL Type of organisation, Type of ownership, Total number of units, Original value of Investment in P & M (codes), Year of initial production, Accounting year (From) and (To), Months of operation (0 to 12 months).
ProducerCSO(IS Wing)
C-FIXED ASSETS# Cases 170116
# Variable(s) 15
File Structure Type: relationalKey(s): DSL (Despatch Serial No) , C_Itm1 (S. No.)
File ContentBlocks C: fixed assets: Fixed assets are those, which have generally normal productive life of more than one year; it covers all type of assets, new or used or own constructed, deployed for productions, transportation, living or recreational facilities, hospitals, schools, etc. for factory

Annual Survey of Industries 1999-2000 - Files Description
- 7 -
personnel; it would include land, building, plant and machinery, transport equipment, etc.; it includes the fixed assets of the head office allocable to the factory and also the full value of assets taken on hire-purchase basis (whether fully paid or not) excluding interest element; it excludes intangible assets and assets solely used for post-manufacturing activities such as, sale, storage, distribution, etc.
ProducerCSO(IS Wing)
NotesFIXED ASSETS (Block-C) Column wise relationship (please refer schedule) may not hold true for data in this block. This is because of the lack of information available from the factory owners.
D-WORKING CAPITALS & LOANS# Cases 332174
# Variable(s) 6
File Structure Type: relationalKey(s): DSL (Despatch Serial No)
File ContentBlock D: working capital and loans: This is defined to include all physical inventories owned, held or controlled by the factory as on the closing day of the accounting year such as the materials, fuels and lubricants, stores, etc. that enter into products manufactured by the factory itself or supplied by the factory to others for processing. Physical working capital also includes the value of stock of materials, fuels and stores, etc. purchased expressly for re-sale, semi-finished goods and goodsin- process on account of others and goods made by the factory which are ready for sale at the end of the accounting year. However, it does not include the stock of the materials, fuels, stores, etc. supplied by others to the factory for processing. Finished goods processed by others from raw materials supplied by the factory and held by them are included and finished goods processed by the factory from raw materials supplied by others, are excluded. Outstanding loans represent all loans, whether short-term or long-term, whether interest bearing or not, outstanding according to the books of the factory as on the closing day of accounting year. Fields are : Year, DSL, Opening and closing amount in Rs. for S. No. representing various items such as Raw materials, Fuels & lubricants etc.
ProducerCSO(IS Wing)
E-EMPLOYMENT AND LABOUR COST# Cases 150590
# Variable(s) 12
File Structure Type: relationalKey(s): DSL (Despatch Serial No) , E_Itm1 (S. No.)
File Content
Annual Survey of Industries 1999-2000 - Files Description
- 8 -
Block E - Employment and Labour cost : Information collected in this block was regarding employment and labour cost. In this block emoluments of the employees was collected. Emoluments were defined as wages paid to all employees plus imputed value of benefits in kind, i.e., the net cost to the employers on those goods and services provided to employees free of charge or at markedly reduced cost which are clearly and primarily of benefit to the employees as consumers. It includes profit sharing, festival and other bonuses and ex-gratia payments paid at less frequent intervals (i.e. other than bonus paid more or less regularly for each period). Benefits in kind include supplies or services rendered such as housing, medical, education and recreation facilities. Personal insurance, income tax, house rent allowance, conveyance, etc. for payment by the factory also is included in the emoluments. The variables are : YR, DSL Item No. represinting category of staff- male workers, female workes, child workers, workers employed through contractors, supervisory & managerial staff, other employees. Mandays worked, Mandays (non-manufacturing), Average number of persons worked, No. of mandays paid for, Wages/salaries, Bonus, Contribution to Provident & other funds and Workman & welfare expenses. The information in this block is also used by Labour Bureau. Central Statistics Office (ISW), Kolkata supplies the information of this block to Labour Bureau directly.
ProducerCSO(IS Wing)
NotesEMPLOYMENT AND LABOUR COST (Block-E) It has been found that a larger number of factory owners were unable to provide detailed break-up of information regarding provident fund (Block-E, Col.9) and Workmen & staff welfare expenses (Block-E, Col.10). Instead they provide the same as a whole for all employees (Block-E, Srl. No. 9, Col.9 & 10). Users are requested to use Srl.9, Col.9 for information on provident fund and Srl.9, Col.10 for information on Workmen & staff welfare expenses. The total of srl.6 to 8 for Col.7 & 9 may not tally with srl.9, col.7 & 9.
F-OTHER EXPENSES# Cases 25655
# Variable(s) 15
File Structure Type: relationalKey(s): DSL (Despatch Serial No)
File ContentBlock - F : Other Expenses : (All the items are Expenditure incurred in Rs.) This block includes the cost of other inputs as both the industrial and non-industrial service rendered by others, which were paid by the factory and most of which were reflected in the ex-factory value of its production during the accounting year. Variables in this block were: YR, DSL Expenditure ( in Rs.) against the following items were recorded : Work done by others, Repair & maintenance of building, Repair & maintenance of Plant & machinery, Other fixed assets, Operating expenses, Non-operating expenses, Insurance charges, Rent paid for buildings, P & M and other fixed assets, Rent paid for land on lease or royalties on mines, quarries and similar assets, Interest paid, Purchase value of goods sold in the same condition as purchased. Purchase value of goods sold in the same condition as purchased
Producer

Annual Survey of Industries 1999-2000 - Files Description
- 9 -
CSO(IS Wing)
G- OTHER OUTPUT or RECEIPT# Cases 22369
# Variable(s) 10
File Structure Type: relationalKey(s): DSL (Despatch Serial No)
File ContentBlock - G : Other Outputs/Receipts (Incomes) : The file contains Other OUTPUT/RECEIPTS Detail ( All items are Receipts in Rs.) : In this block, information on other output/receipts was reported. Fields were : YR, DSL Receipts in ( Rs.) were recorded against the following items : Income from services, variation in stock of semi-finished goods, Value of elctricity generated and sold, Value of own construction, Net balance of goods sold in the same condition as purchased, Total receipts, sale value of goods sold in the same condition as purchased.
ProducerCSO(IS Wing)
H-INPUT ITEMS ( INDIGENOUS )# Cases 250663
# Variable(s) 8
File Structure Type: relationalKey(s): DSL (Despatch Serial No) , H_Itm1 (Sl. No.)
File ContentBlock - H Input Items Indigenous : This block covers all the goods (raw materials, components, chemicals, packing material, etc.) which entered into the production process of the factory during the accounting year. The file contains Input Items - Indigenous items consumed : YR, DSL Item code (ASICC), Unit of quantity (code), Quantity consumed Purchase value (in Rs.)
ProducerCSO(IS Wing)
NotesASICC codes in Block H, I & J Because of the proximity of various item's description, it is possible that same ASICC code may appear against multiple records in these blocks. They should not be treated as duplicates. They are clubbed together at the time of tabulation to provide information at ASICC level.
I-INPUT ITEMS IMPORTED# Cases 12932
# Variable(s) 8

Annual Survey of Industries 1999-2000 - Files Description
- 10 -
File Structure Type: relationalKey(s): DSL (Despatch Serial No) , I_Itm1 (Sl. No.)
File ContentBlock - I - Input Items Imported : Details of imported input items consumed - directly only : Information in this block were reported for all imported items consumed. The items were imported by the factory directly. Variables are for : YR, DSL Item serial number represents major five imported items and other items imported, Total imports ( consumed), Item code (ASICC code), Unit of quantity, Quantity consumed, Purchase value at delivery (Rs.)
ProducerCSO(IS Wing)
NotesASICC codes in Block H, I & J Because of the proximity of various item's description, it is possible that same ASICC code may appear against multiple records in these blocks. They should not be treated as duplicates. They are clubbed together at the time of tabulation to provide information at ASICC level.
J-PRODUCTS AND BY-PRODUCTS# Cases 69025
# Variable(s) 15
File Structure Type: relationalKey(s): DSL (Despatch Serial No) , J_Itm1 (Sl.No.)
File ContentBlock - J Products and By-products : Products and By-Products (Manufactured by the unit) detail : It includes information on all goods that had been produced by the factory during the accounting year for sale, i.e., either actually sold during the accounting year or entered into stocks. Calculation of gross value added of the enterprise was done from here. In this block, information like quantity manufactured, quantity sold, gross sale value, excise duty, sales tax paid and other distributive expenses, per unit net sale value and ex-factory value of output was furnished by the factory item by item. If the distributive expenses were not available product-wise, the details might be given on the basis of reasonable estimation. Variables in this block are: YR, DSL Serial number represents products/by-products for first ten major items as per value - no brand name, Item code (ASICC code), Unit of quantity, Quantity manufactured, Quantity sold, Gross sale value (Rs.), Exice duty, Sales tax, Other expenses , Total Per unit net sale value (Rs.), Ex-factory value (Rs.)
ProducerCSO(IS Wing)
NotesASICC codes in Block H, I & J Because of the proximity of various item's description, it is possible that same ASICC code may appear against multiple records in these blocks. They should not be treated as duplicates. They are clubbed together at the time of tabulation to provide information at ASICC level.

Annual Survey of Industries 1999-2000 - Variables List
- 11 -
Variables ListDataset contains 111 variable(s)
File A-IDENTIFICATION PARTICULARS# Name Label Type Format Valid Invalid Question
1 YR Year discrete character-2 33515 0 Accounting year
2 BLK Block code A discrete character-1 33515 0 Schedule ( Questionnaire ) Block
3 DSL Despatch Serial No discrete numeric-5.0 33515 0 Despatch Serial No
4 A_Itm3 Scheme code discrete character-1 33515 0 Scheme code ( Census-1,Sample-2 )
5 A_Itm5 Ind Code as per return (5-digit, NIC-98)
continuous numeric-5.0 33515 0 Industry Code as per Return (5-digitlevel of NIC-1998)
6 A_Itm7 State code discrete character-2 33515 0 State Code
7 A_Itm8 District code continuous numeric-2.0 33515 0 District Code for the States of India
8 A_Itm9 Rural/Urban code discrete numeric-1.0 33515 0 Sector (Rural-1, Urban-2)
9 A_Itm11 No. of Units continuous numeric-2.0 33515 0 No. of Units-Factories
10 A_Itm12 Status of Unit(code) discrete numeric-2.0 33515 0 Status of Unit(code)
11 E_Itm10 Number of Total workingdays
continuous numeric-3.0 33515 0 Total number of working days
12 E_Itm11 Total Cost of Production continuous numeric-12.0 33515 0 Total Cost of Production(in Rs.)
13 WGT Inflation/Multiplier factor(in9999.9999 format)
continuous numeric-7.4 33515 0 -
File B-OWNER'S DETAIL# Name Label Type Format Valid Invalid Question
1 YR Year discrete character-2 26815 0 Accounting year
2 BLK Block code B discrete character-1 26815 0 Schedule ( Questionnaire ) Block
3 DSL Despatch Serial No continuous numeric-5.0 26815 0 Despatch Serial No
4 B_Itm3 Type of organisation(code) discrete numeric-2.0 26815 0 Type of Organisation(code)
5 B_Itm4 Type of ownership (code) discrete numeric-1.0 26815 0 Type of ownership(code)
6 B_Itm5 Year of initial production continuous numeric-4.0 26815 0 Year of initial production
7 B_Itm6F Accounting year (From) discrete character-9 26803 0 Accounting year (From )
8 B_Itm6T Accounting year (To) discrete character-9 26800 0 Accounting year ( To )
9 B_Itm7 Months of operation discrete numeric-2.0 26815 0 Number of months of operation
File C-FIXED ASSETS# Name Label Type Format Valid Invalid Question
1 YR Year discrete character-2 170116 0 Accounting year
2 BLK Block code C discrete character-1 170116 0 Schedule ( Questionnaire ) Block
3 DSL Despatch Serial No discrete numeric-5.0 170116 0 Despatch serial number
4 C_Itm1 S. No. discrete numeric-1.0 170116 0 Types of Fixed Assets

Annual Survey of Industries 1999-2000 - Variables List
- 12 -
File C-FIXED ASSETS# Name Label Type Format Valid Invalid Question
5 C_Itm3 Opening as on - GrossValue
continuous numeric-12.0 170116 0 Gross Value (Rs.) : Opening ason ....
6 C_Itm4 Due to revaluation continuous numeric-10.0 170116 0 Gross Value (Rs.) : Addition duringthe year due to revaluation
7 C_Itm5 Actual addition continuous numeric-11.0 170116 0 Gross Value (Rs.) : Addition duringthe year : Actual Addition
8 C_Itm6 Deduction & adjustmentduring the year
continuous numeric-11.0 170116 0 Gross Value (Rs.) : Deduction &Adjustment during the year
9 C_Itm7 Closing as on - GrossValue
continuous numeric-12.0 170116 0 Gross Value (Rs.) : Closing as on ....
10 C_Itm8 Up to year beginning continuous numeric-11.0 170116 0 Depreciation (Rs.) : Up to the Yearbeginning
11 C_Itm9 Provided during the year continuous numeric-11.0 170116 0 Depreciation (Rs.) : Provided duringthe year
12 C_Itm10 Adjustment for sold/discarded during the year
continuous numeric-10.0 170116 0 Depreciation (Rs.) : Adjustment forsold/discarded during the year
13 C_Itm11 Up to year end continuous numeric-11.0 170116 0 Depreciation (Rs.) : Up to the yearend
14 C_Itm12 Opening as on - Net Value continuous numeric-11.0 170116 0 Net Value (Rs.) : Opening as on -----
15 C_Itm13 Closing as on - Net Value. continuous numeric-11.0 170116 0 Net Value (Rs.) : Closing as on ------
File D-WORKING CAPITALS & LOANS# Name Label Type Format Valid Invalid Question
1 YR Year discrete character-2 332174 0 Accounting year
2 BLK Block code D discrete character-1 332174 0 Schedule ( Questionnaire ) Block
3 DSL Despatch Serial No discrete numeric-5.0 332174 0 Despatch serial number
4 D_Itm1 S. No. discrete numeric-2.0 332174 0 Serial Number representing variousWorking capital items
5 D_Itm3 Opening (Rs.) continuous numeric-12.0 332174 0 Working Capital & Loans : Opening(Rs.)
6 D_Itm4 Closing (Rs.). continuous numeric-12.0 332174 0 Working Capital & Loans : Closing(Rs.)
File E-EMPLOYMENT AND LABOUR COST# Name Label Type Format Valid Invalid Question
1 YR Year discrete character-2 150590 0 Accounting year
2 BLK Block code E discrete character-1 150590 0 Schedule ( Questionnaire ) Block
3 DSL Despatch Serial No discrete numeric-5.0 150590 0 Despatch serial number
4 E_Itm1 S. No. discrete numeric-2.0 150590 0 Category of staff
5 E_Itm3 Mandays Worked-Manufacturing
continuous numeric-8.0 150590 0 Man-days worked by the eachcategory of staff
6 E_Itm4 Mandays Worked - NonManufacturing
continuous numeric-7.0 150590 0 Man-days worked by the eachcategory of staff
7 E_Itm5 Mandays Worked - Total continuous numeric-8.0 150590 0 Man-days worked by the eachcategory of staff

Annual Survey of Industries 1999-2000 - Variables List
- 13 -
File E-EMPLOYMENT AND LABOUR COST# Name Label Type Format Valid Invalid Question
8 E_Itm6 Average Number ofpersons worked
continuous numeric-5.0 150590 0 Average Number of persons workedin each category of staff
9 E_Itm7 Wages/salaries (in Rs.). continuous numeric-10.0 150590 0 Wages/salaries (Rs.) in eachcategory of staff
10 E_Itm8 Bonus (in Rs.). continuous numeric-9.0 150590 0 Bonus (Rs.) in each category of staff
11 E_Itm9 Provident Fund continuous numeric-10.0 150590 0 Contribution to Provident & Otherfunds (Rs.) in each category of staff
12 E_Itm10 Workmen & Staff WelfareExpenses
continuous numeric-9.0 150590 0 Workman & staff welfare expenses(in Rs.) in each categorey of staff
File F-OTHER EXPENSES# Name Label Type Format Valid Invalid Question
1 YR Year discrete numeric-1.0 25655 0 Accounting year
2 BLK Block code F discrete character-1 25655 0 Schedule ( Questionnaire ) Block
3 DSL Despatch Serial No discrete numeric-5.0 25655 0 Despatch serial number
4 F_Itm1 Work done by others continuous numeric-10.0 25655 0 Expenditure in Rs. : Work done byothers on materials supplied by theindustrial undertaking
5 F_Itm2a Repair & maintenance ofBuilding
continuous numeric-9.0 25655 0 Expenditure in Rs. : Repair &maintenance of Building
6 F_Itm2b Repair & maintenance ofPlant & Machinery
continuous numeric-10.0 25655 0 Expenditure in Rs. : Repair &maintenance of Plant & machinery
7 F_Itm2c Repair & maintenance ofOther fixed assets
continuous numeric-9.0 25655 0 Expenditure in Rs. : Plant &machinery other fixed assets
8 F_Itm3 Operating expenses continuous numeric-10.0 25655 0 Expenditure in Rs. : Operatingexpenses
9 F_Itm4 Non-operating expenses continuous numeric-10.0 25655 0 Expenditure in Rs. : Non-operatingexpenses(excluding insuranceCharges)
10 F_Itm5 Insurance Charges continuous numeric-9.0 25655 0 Expenditure in Rs. : InsuranceCharges
11 F_Itm6 Total expenses(1 to 5) continuous numeric-10.0 25655 0 Expenditure in Rs. : Total expenses( items 1 to 5)
12 F_Itm7 Rent paid for Buildings,Plant & Machinery andother Fixed assets
continuous numeric-9.0 25655 0 Expenditure in Rs. : Rent paid forbuildings, P&M and other fixedassets
13 F_Itm8 Rent paid for land,royaltieson mines,quarries andsimilar assets
continuous numeric-9.0 25655 0 Expenditure in Rs. : Rent paid forland on lease or royalties on mines,quarries and similar assets
14 F_Itm9 Interest paid continuous numeric-10.0 25655 0 Expenditure in Rs. : Interest paid
15 F_Itm10 Value of purchase goodssold in the same condition
continuous numeric-11.0 25655 0 Expenditure in Rs. : Purchase valueof goods sold in the same conditionas purchased
File G- OTHER OUTPUT or RECEIPT# Name Label Type Format Valid Invalid Question
1 YR Year discrete character-2 22369 0 Accounting year

Annual Survey of Industries 1999-2000 - Variables List
- 14 -
File G- OTHER OUTPUT or RECEIPT# Name Label Type Format Valid Invalid Question
2 BLK Block code G discrete character-1 22369 0 Schedule ( Questionnaire ) Block
3 DSL Despatch Serial No discrete numeric-5.0 22369 0 Despatch serial number
4 G_Itm1 Income from services continuous numeric-10.0 22369 0 Income from services (industrial/non industrial including work donefor others on materials supplied bythem)
5 G_Itm2 Variation in stock of semi-finished goods
continuous numeric-11.0 22369 0 Variation in stock of semi-finishedgoods (Col.(4)minus Col(3) againstitem 5 in Block D
6 G_Itm3 Electricity generated andsold
continuous numeric-10.0 22369 0 Value of electricity generated andsold
7 G_Itm4 Value of own construction continuous numeric-10.0 22369 0 Value of own construction
8 G_Itm5 Net balance of goods soldas purchased
continuous numeric-10.0 22369 0 Net balance of goods sold in thesame condition as purchased. (Item7 of Bl.G minus item 10 of Bl.F)
9 G_Itm6 Total receipts continuous numeric-10.0 22369 0 Total receipts ( items 1 to 5)
10 G_Itm7 Value of purchasegoods sold in the samecondition .
continuous numeric-11.0 22369 0 Sale value of goods sold in the samecondition as purchased
File H-INPUT ITEMS ( INDIGENOUS )# Name Label Type Format Valid Invalid Question
1 YR Year discrete character-2 250663 0 Accounting year
2 BLK Block code H discrete character-1 250663 0 Schedule ( Questionnaire ) Block
3 DSL Despatch Serial No discrete numeric-5.0 250663 0 Despatch serial number
4 H_Itm1 Sl. No. discrete numeric-2.0 250663 0 Input items ( Indigenous items ) :Item Description
5 H_Itm3 Item code (ASICC) continuous numeric-5.0 250663 0 Item Code (ASICC)
6 H_Itm4 Unit of Quantity (code) discrete numeric-2.0 250663 0 Unit of Quantity
7 H_Itm5 Quantity consumed (as99999999999.999)
continuous numeric-11.0 250663 0 Quantity consumed
8 H_Itm6 Purchase value (in Rs.) continuous numeric-11.0 250663 0 Purchase Value ( in Rs.)
File I-INPUT ITEMS IMPORTED# Name Label Type Format Valid Invalid Question
1 YR Year discrete numeric-1.0 12932 0 Accounting year
2 BLK Block code I discrete character-1 12932 0 Schedule ( Questionnaire ) Block
3 DSL Despatch Serial No continuous numeric-4.0 12932 0 Despatch serial number
4 I_Itm1 Sl. No. discrete numeric-1.0 12932 0 Directly imported items : ItemDescription ( Major five importeditems)
5 I_Itm3 Item code (ASICC) continuous numeric-5.0 12932 0 Item Code (ASICC)
6 I_Itm4 Unit of Quantity (code) discrete numeric-2.0 12932 0 Unit of Quantity
7 I_Itm5 Quantity consumed continuous numeric-9.0 12932 0 Quantity consumed

Annual Survey of Industries 1999-2000 - Variables List
- 15 -
File I-INPUT ITEMS IMPORTED# Name Label Type Format Valid Invalid Question
8 I_Itm6 Purchase value at delivery(in Rs.)
continuous numeric-11.0 12932 0 Purchase Value at delivery (in Rs.)
File J-PRODUCTS AND BY-PRODUCTS# Name Label Type Format Valid Invalid Question
1 YR Year discrete numeric-1.0 69025 0 Accounting year
2 BLK Block code J discrete character-1 69025 0 Schedule ( Questionnaire ) Block
3 DSL Despatch Serial No discrete numeric-5.0 69025 0 Despatch serial number
4 J_Itm1 Sl.No. continuous numeric-2.0 69025 0 Products /By-Products Description( First ten Major Items as per value -No Brand Name)
5 J_Itm3 Item code (ASICC) continuous numeric-5.0 69025 0 Item Code (ASICC)
6 J_Itm4 Unit of Quantity discrete numeric-2.0 69025 0 Unit of Quantity
7 J_Itm5 Quantity manufactured continuous numeric-11.0 69025 0 Quantity manufactured
8 J_Itm6 Quantity sold continuous numeric-11.0 69025 0 Quantity sold
9 J_Itm7 Gross sale value (Rs.) continuous numeric-12.0 69025 0 Gross sale value (Rs.)
10 J_Itm8 Excise duty continuous numeric-11.0 69025 0 Distributive Expense(Rs.) : Exciseduty
11 J_Itm9 Sales Tax continuous numeric-10.0 69025 0 Distributive Expense(Rs.) : Sales Tax
12 J_Itm10 Others continuous numeric-10.0 69025 0 Distributive Expense(Rs.) : Others
13 J_Itm11 Total continuous numeric-11.0 69025 0 Distributive Expense(Rs.) : Total
14 J_Itm12 Per unit net sale value(Rs.) [7-11]/6
continuous numeric-9.0 69025 0 Per Unit net sale value (Rs.)
15 J_Itm13 Ex-factory value of output(Rs.) (12x5).
continuous numeric-11.0 69025 0 Ex-factory value

Annual Survey of Industries 1999-2000 - Variables Description
- 16 -
Variables DescriptionDataset contains111 variable(s)
File A-IDENTIFICATION PARTICULARS#1 YR: YearInformation [Type= discrete] [Format=character] [Missing=*]
Statistics [NW/ W] [Valid=33515 /-] [Invalid=0 /-]
Literal question Accounting year
Value Label Cases Percentage
00 2000 33515 100.0%Warning: these figures indicate the number of cases found in the data file. They cannot be interpreted as summary statistics of the population of interest.
#2 BLK: Block code AInformation [Type= discrete] [Format=character] [Missing=*]
Statistics [NW/ W] [Valid=33515 /-] [Invalid=0 /-]
Literal question Schedule ( Questionnaire ) Block
Value Label Cases Percentage
A Block A 33515 100.0%Warning: these figures indicate the number of cases found in the data file. They cannot be interpreted as summary statistics of the population of interest.
#3 DSL: Despatch Serial NoInformation [Type= discrete] [Format=numeric] [Missing=*]
Statistics [NW/ W] [Valid=33515 /-] [Invalid=0 /-]
Definition Despatch Serial No
Literal question Despatch Serial No
Interviewer'sinstructions
schedule despatch (DSL) no: With a view to reconcile the despatch of filled-in schedule by FOD field offices vis-à-vis receipt of the same by CSO (IS Wing), Kolkata a unique Despatch Serial number (DSL) has been provided for all the selected factories both under Census Sector and the Sample Sector and the same is to be reported by the field staff of FOD both in Parts I & II. These items will be copied from the sample list. DSL numbers are unique across the region for a particular year of survey. However, the same factory may have different DSL numbers in different years of survey.
#4 A_Itm3: Scheme codeInformation [Type= discrete] [Format=character] [Missing=*]
Statistics [NW/ W] [Valid=33515 /-] [Invalid=0 /-]
Literal question Scheme code ( Census-1, Sample-2 )
Value Label Cases Percentage
1 Census 7694 23.0%
2 Sample 25821 77.0%Warning: these figures indicate the number of cases found in the data file. They cannot be interpreted as summary statistics of the population of interest.
#5 A_Itm5: Ind Code as per return (5-digit, NIC-98)Information [Type= continuous] [Format=numeric] [Range= 1400-93010] [Missing=*]
Statistics [NW/ W] [Valid=33515 /-] [Invalid=0 /-] [Mean=24120.234 /-] [StdDev=9184.135 /-]
Literal question Industry Code as per Return (5-digit level of NIC-1998)
Interviewer'sinstructions
The description of the industry to which the factory belongs will be indicated in the space provided as per description given in NIC 1998. If a factory happens to be ngaged in multiple industries its major activities will be determined first. This should depend on the nature and value of product excluding goods in process but including the charges received on account of work done for others.

Annual Survey of Industries 1999-2000 - Variables Description
- 17 -
File A-IDENTIFICATION PARTICULARS#6 A_Itm7: State codeInformation [Type= discrete] [Format=character] [Missing=*]
Statistics [NW/ W] [Valid=33515 /-] [Invalid=0 /-]
Definition State code for the states of India
Literal question State Code
Frequency table not shown (35 Modalities)
#7 A_Itm8: District codeInformation [Type= continuous] [Format=numeric] [Range= 1-80] [Missing=*]
Statistics [NW/ W] [Valid=33515 /-] [Invalid=0 /-] [Mean=11.709 /-] [StdDev=12.501 /-]
Definition District code indicate district of a given state
Literal question District Code for the States of India
#8 A_Itm9: Rural/Urban codeInformation [Type= discrete] [Format=numeric] [Range= 1-2] [Missing=*]
Statistics [NW/ W] [Valid=33515 /-] [Invalid=0 /-] [Mean=1.649 /-] [StdDev=0.477 /-]
Literal question Sector (Rural-1, Urban-2)
Value Label Cases Percentage
1 Rural 11756 35.1%
2 Urban 21759 64.9%Warning: these figures indicate the number of cases found in the data file. They cannot be interpreted as summary statistics of the population of interest.
#9 A_Itm11: No. of UnitsInformation [Type= continuous] [Format=numeric] [Range= 1-58] [Missing=*]
Statistics [NW/ W] [Valid=33515 /-] [Invalid=0 /-] [Mean=1.056 /-] [StdDev=0.515 /-]
Definition No. of units for which data has been collected from single firm
Literal question No. of Units-Factories
#10 A_Itm12: Status of Unit(code)Information [Type= discrete] [Format=numeric] [Range= 1-20] [Missing=*]
Statistics [NW/ W] [Valid=33515 /-] [Invalid=0 /-] [Mean=1.674 /-] [StdDev=1.419 /-]
Definition Status of unit ( code )
Literal question Status of Unit(code)
Value Label Cases Percentage
1 Open 24741 73.8%
2 Closed 1264 3.8%
3 NOP 3841 11.5%
4 Deleted (Units found non-existent within 3 years) 2917 8.7%
5 NR due to closure but in existence and owner/occupier is nottraceable
287 0.9%
6 NR due to non existence and owner is not traceable 85 0.3%
7 NR due to relevant records are with court/Income Tax 35 0.1%
8 NR due to recalcitrant / refuse to submit 147 0.4%
9 NR due to factory under prosecution 7 0.0%
10 NR due to other reasons 156 0.5%

Annual Survey of Industries 1999-2000 - Variables Description
- 18 -
File A-IDENTIFICATION PARTICULARS#10 A_Itm12: Status of Unit(code)Value Label Cases Percentage
17 Extracted from ASI 1998-99 4 0.0%
18 Extracted from ASI 1998-99 9 0.0%
20 Extracted from ASI 1998-99 22 0.1%Warning: these figures indicate the number of cases found in the data file. They cannot be interpreted as summary statistics of the population of interest.
#11 E_Itm10: Number of Total working daysInformation [Type= continuous] [Format=numeric] [Range= 0-721] [Missing=*]
Statistics [NW/ W] [Valid=33515 /-] [Invalid=0 /-] [Mean=215.948 /-] [StdDev=136.498 /-]
Definition Total no. of working days
Literal question Total number of working days
#12 E_Itm11: Total Cost of ProductionInformation [Type= continuous] [Format=numeric] [Range= -24972-109846061775] [Missing=*]
Statistics [NW/ W] [Valid=33515 /-] [Invalid=0 /-] [Mean=135802957.909 /-] [StdDev=1310876135.808 /-]
Definition Total cost of production ( in Rs. )
Literal question Total Cost of Production(in Rs.)
#13 WGT: Inflation/Multiplier factor(in 9999.9999 format)Information [Type= continuous] [Format=numeric] [Range= 0-13] [Missing=*]
Statistics [NW/ W] [Valid=33515 /-] [Invalid=0 /-] [Mean=5.2 /-] [StdDev=3.721 /-]
Definition Weight multiplier / inflation factor
File B-OWNER'S DETAIL#1 YR: YearInformation [Type= discrete] [Format=character] [Missing=*]
Statistics [NW/ W] [Valid=26815 /-] [Invalid=0 /-]
Literal question Accounting year
Value Label Cases Percentage
00 2000 26815 100.0%Warning: these figures indicate the number of cases found in the data file. They cannot be interpreted as summary statistics of the population of interest.
#2 BLK: Block code BInformation [Type= discrete] [Format=character] [Missing=*]
Statistics [NW/ W] [Valid=26815 /-] [Invalid=0 /-]
Literal question Schedule ( Questionnaire ) Block
Value Label Cases Percentage
B Block B 26815 100.0%Warning: these figures indicate the number of cases found in the data file. They cannot be interpreted as summary statistics of the population of interest.
#3 DSL: Despatch Serial NoInformation [Type= continuous] [Format=numeric] [Missing=*]
Statistics [NW/ W] [Valid=26815 /-] [Invalid=0 /-]
Literal question Despatch Serial No

Annual Survey of Industries 1999-2000 - Variables Description
- 19 -
File B-OWNER'S DETAIL#4 B_Itm3: Type of organisation(code)Information [Type= discrete] [Format=numeric] [Range= 1-19] [Missing=*]
Statistics [NW/ W] [Valid=26815 /-] [Invalid=0 /-] [Mean=3.608 /-] [StdDev=2.352 /-]
Literal question Type of Organisation(code)
Value Label Cases Percentage
1 Individual Proprietorship 5453 20.3%
2 Joint family (HUF) 465 1.7%
3 Partnership 8248 30.8%
4 Public Limited Company 5335 19.9%
5 Private Limited Company 5848 21.8%
6 Govt. Departmental Enterprise (Excl. khadi, handloom) 237 0.9%
7 Public Corporation by Special act of Parliament/ legislator,PSU
342 1.3%
8 Khadi & village industries commission 91 0.3%
9 Handlooms 17 0.1%
10 Co-operative Society 496 1.8%
19 Others (incl Trusts, wakf board, etc) 283 1.1%Warning: these figures indicate the number of cases found in the data file. They cannot be interpreted as summary statistics of the population of interest.
#5 B_Itm4: Type of ownership (code)Information [Type= discrete] [Format=numeric] [Range= 1-6] [Missing=*]
Statistics [NW/ W] [Valid=26815 /-] [Invalid=0 /-] [Mean=5.817 /-] [StdDev=0.797 /-]
Literal question Type of ownership(code)
Value Label Cases Percentage
1 Wholly Central Govt. 283 1.1%
2 Wholly state govt and/or local Govt 472 1.8%
3 Central Govt and State and/or Local govt. jointly 131 0.5%
4 Joint sector Public 464 1.7%
5 Joint sector Private 273 1.0%
6 Wholly private ownership 25192 93.9%Warning: these figures indicate the number of cases found in the data file. They cannot be interpreted as summary statistics of the population of interest.
#6 B_Itm5: Year of initial productionInformation [Type= continuous] [Format=numeric] [Range= 0-1999] [Missing=*]
Statistics [NW/ W] [Valid=26815 /-] [Invalid=0 /-] [Mean=1910.746 /-] [StdDev=368.194 /-]
Literal question Year of initial production
#7 B_Itm6F: Accounting year (From)Information [Type= discrete] [Format=character] [Missing=*]
Statistics [NW/ W] [Valid=26803 /-] [Invalid=0 /-]
Literal question Accounting year (From )
Value Label Cases Percentage
01-APR-08 1 0.0%
01-APR-97 1 0.0%
01-APR-98 37 0.1%
01-APR-99 26748 99.8%

Annual Survey of Industries 1999-2000 - Variables Description
- 20 -
File B-OWNER'S DETAIL#7 B_Itm6F: Accounting year (From)Value Label Cases Percentage
01-AUG-98 2 0.0%
01-JAN-99 6 0.0%
01-JUL-98 3 0.0%
01-OCT-98 3 0.0%
04-OCT-99 1 0.0%
10-APR-99 1 0.0%Warning: these figures indicate the number of cases found in the data file. They cannot be interpreted as summary statistics of the population of interest.
#8 B_Itm6T: Accounting year (To)Information [Type= discrete] [Format=character] [Missing=*]
Statistics [NW/ W] [Valid=26800 /-] [Invalid=0 /-]
Literal question Accounting year ( To )
Value Label Cases Percentage
01-APR-00 2 0.0%
01-APR-20 1 0.0%
01-MAR-00 2 0.0%
03-APR-00 1 0.0%
13-MAR-00 1 0.0%
30-JUN-99 3 0.0%
30-SEP-98 1 0.0%
30-SEP-99 2 0.0%
31-AUG-99 1 0.0%
31-DEC-00 1 0.0%
31-DEC-99 9 0.0%
31-JAN-00 1 0.0%
31-JUL-99 2 0.0%
31-MAR-00 26730 99.7%
31-MAR-01 8 0.0%
31-MAR-20 1 0.0%
31-MAR-99 34 0.1%Warning: these figures indicate the number of cases found in the data file. They cannot be interpreted as summary statistics of the population of interest.
#9 B_Itm7: Months of operationInformation [Type= discrete] [Format=numeric] [Range= 0-99] [Missing=*]
Statistics [NW/ W] [Valid=26815 /-] [Invalid=0 /-] [Mean=10.811 /-] [StdDev=6.511 /-]
Literal question Number of months of operation
Value Label Cases Percentage
0 0 2148 8.0%
1 1 44 0.2%
2 2 74 0.3%
3 3 140 0.5%
4 4 202 0.8%
5 5 345 1.3%
6 6 583 2.2%

Annual Survey of Industries 1999-2000 - Variables Description
- 21 -
File B-OWNER'S DETAIL#9 B_Itm7: Months of operationValue Label Cases Percentage
7 7 310 1.2%
8 8 386 1.4%
9 9 333 1.2%
10 10 365 1.4%
11 11 152 0.6%
12 12 21631 80.7%
99 Greater than 12 months 102 0.4%Warning: these figures indicate the number of cases found in the data file. They cannot be interpreted as summary statistics of the population of interest.
File C-FIXED ASSETS#1 YR: YearInformation [Type= discrete] [Format=character] [Missing=*]
Statistics [NW/ W] [Valid=170116 /-] [Invalid=0 /-]
Literal question Accounting year
Value Label Cases Percentage
00 2000 170116 100.0%Warning: these figures indicate the number of cases found in the data file. They cannot be interpreted as summary statistics of the population of interest.
#2 BLK: Block code CInformation [Type= discrete] [Format=character] [Missing=*]
Statistics [NW/ W] [Valid=170116 /-] [Invalid=0 /-]
Literal question Schedule ( Questionnaire ) Block
Value Label Cases Percentage
C Block C 170116 100.0%Warning: these figures indicate the number of cases found in the data file. They cannot be interpreted as summary statistics of the population of interest.
#3 DSL: Despatch Serial NoInformation [Type= discrete] [Format=numeric] [Missing=*]
Statistics [NW/ W] [Valid=170116 /-] [Invalid=0 /-]
Literal question Despatch serial number
#4 C_Itm1: S. No.Information [Type= discrete] [Format=numeric] [Range= 1-9] [Missing=*]
Statistics [NW/ W] [Valid=170116 /-] [Invalid=0 /-] [Mean=4.949 /-] [StdDev=2.578 /-]
Literal question Types of Fixed Assets
Value Label Cases Percentage
1 Land 16125 9.5%
2 Building 21037 12.4%
3 Plant &Machinery 24644 14.5%
4 Transport equipment 19177 11.3%
5 Computer equipment including software 10864 6.4%
6 Others 23675 13.9%
7 Sub-total (2 to 6) 25414 14.9%

Annual Survey of Industries 1999-2000 - Variables Description
- 22 -
File C-FIXED ASSETS#4 C_Itm1: S. No.Value Label Cases Percentage
8 Capital work in progress 3752 2.2%
9 Total (1+7 +8) 25428 14.9%Warning: these figures indicate the number of cases found in the data file. They cannot be interpreted as summary statistics of the population of interest.
#5 C_Itm3: Opening as on - Gross ValueInformation [Type= continuous] [Format=numeric] [Range= 0-101909686393] [Missing=*]
Statistics [NW/ W] [Valid=170116 /-] [Invalid=0 /-] [Mean=65347647.646 /-] [StdDev=1056829977.488 /-]
Literal question Gross Value (Rs.) : Opening as on ....
#6 C_Itm4: Due to revaluationInformation [Type= continuous] [Format=numeric] [Range= 0-5654101846] [Missing=*]
Statistics [NW/ W] [Valid=170116 /-] [Invalid=0 /-] [Mean=327740.966 /-] [StdDev=24540785.18 /-]
Literal question Gross Value (Rs.) : Addition during the year due to revaluation
#7 C_Itm5: Actual additionInformation [Type= continuous] [Format=numeric] [Range= 0-18692244000] [Missing=*]
Statistics [NW/ W] [Valid=170116 /-] [Invalid=0 /-] [Mean=9332488.952 /-] [StdDev=203505476.481 /-]
Literal question Gross Value (Rs.) : Addition during the year : Actual Addition
#8 C_Itm6: Deduction & adjustment during the yearInformation [Type= continuous] [Format=numeric] [Range= 0-14706800000] [Missing=*]
Statistics [NW/ W] [Valid=170116 /-] [Invalid=0 /-] [Mean=3383177.038 /-] [StdDev=126953061.05 /-]
Literal question Gross Value (Rs.) : Deduction & Adjustment during the year
#9 C_Itm7: Closing as on - Gross ValueInformation [Type= continuous] [Format=numeric] [Range= -2511995-103640232592] [Missing=*]
Statistics [NW/ W] [Valid=170116 /-] [Invalid=0 /-] [Mean=71147402.911 /-] [StdDev=1105221663.273 /-]
Literal question Gross Value (Rs.) : Closing as on ....
#10 C_Itm8: Up to year beginningInformation [Type= continuous] [Format=numeric] [Range= 0-35416030483] [Missing=*]
Statistics [NW/ W] [Valid=170116 /-] [Invalid=0 /-] [Mean=21645985.433 /-] [StdDev=354360312.018 /-]
Literal question Depreciation (Rs.) : Up to the Year beginning
#11 C_Itm9: Provided during the yearInformation [Type= continuous] [Format=numeric] [Range= 0-17423061577] [Missing=*]
Statistics [NW/ W] [Valid=170116 /-] [Invalid=0 /-] [Mean=3997272.423 /-] [StdDev=87915241.309 /-]
Literal question Depreciation (Rs.) : Provided during the year
#12 C_Itm10: Adjustment for sold/discarded during the yearInformation [Type= continuous] [Format=numeric] [Range= 0-1196116491] [Missing=*]
Statistics [NW/ W] [Valid=170116 /-] [Invalid=0 /-] [Mean=393989.884 /-] [StdDev=9445991.499 /-]
Literal question Depreciation (Rs.) : Adjustment for sold/discarded during the year
#13 C_Itm11: Up to year endInformation [Type= continuous] [Format=numeric] [Range= -18887595-39613558009] [Missing=*]

Annual Survey of Industries 1999-2000 - Variables Description
- 23 -
File C-FIXED ASSETS#13 C_Itm11: Up to year endStatistics [NW/ W] [Valid=170116 /-] [Invalid=0 /-] [Mean=25130367.363 /-] [StdDev=417189257.43 /-]
Literal question Depreciation (Rs.) : Up to the year end
#14 C_Itm12: Opening as on - Net ValueInformation [Type= continuous] [Format=numeric] [Range= -357893557-81342139663] [Missing=*]
Statistics [NW/ W] [Valid=170116 /-] [Invalid=0 /-] [Mean=44775050.893 /-] [StdDev=762333324.688 /-]
Literal question Net Value (Rs.) : Opening as on -----
#15 C_Itm13: Closing as on - Net Value.Information [Type= continuous] [Format=numeric] [Range= -49397454-65655155643] [Missing=*]
Statistics [NW/ W] [Valid=170116 /-] [Invalid=0 /-] [Mean=47259027.837 /-] [StdDev=746562874.826 /-]
Literal question Net Value (Rs.) : Closing as on ------
File D-WORKING CAPITALS & LOANS#1 YR: YearInformation [Type= discrete] [Format=character] [Missing=*]
Statistics [NW/ W] [Valid=332174 /-] [Invalid=0 /-]
Literal question Accounting year
Value Label Cases Percentage
00 2000 332174 100.0%Warning: these figures indicate the number of cases found in the data file. They cannot be interpreted as summary statistics of the population of interest.
#2 BLK: Block code DInformation [Type= discrete] [Format=character] [Missing=*]
Statistics [NW/ W] [Valid=332174 /-] [Invalid=0 /-]
Literal question Schedule ( Questionnaire ) Block
Value Label Cases Percentage
D Block D 332174 100.0%Warning: these figures indicate the number of cases found in the data file. They cannot be interpreted as summary statistics of the population of interest.
#3 DSL: Despatch Serial NoInformation [Type= discrete] [Format=numeric] [Missing=*]
Statistics [NW/ W] [Valid=332174 /-] [Invalid=0 /-]
Literal question Despatch serial number
#4 D_Itm1: S. No.Information [Type= discrete] [Format=numeric] [Range= 1-17] [Missing=*]
Statistics [NW/ W] [Valid=332174 /-] [Invalid=0 /-]
Literal question Serial Number representing various Working capital items
Value Label Cases Percentage
1 Raw Materials & Components 20849 6.3%
2 Fuels & Lubricants 5280 1.6%
3 Spares, Stores & Others 11110 3.3%
4 Sub-total (1 to 3) 22495 6.8%
5 Semi-finished goods / work in progress 10551 3.2%

Annual Survey of Industries 1999-2000 - Variables Description
- 24 -
File D-WORKING CAPITALS & LOANS#4 D_Itm1: S. No.Value Label Cases Percentage
6 Finished goods 17589 5.3%
7 Total inventory ( 4 to 6) 23119 7.0%
8 Cash in Hand at Bank 25188 7.6%
9 Sundry Debtors 22457 6.8%
10 Other current assets 20828 6.3%
11 Total current assets (7 to 10) 25459 7.7%
12 Sundry Creditors 22234 6.7%
13 Over draft, cash credit, other short Terms loan from Banks &other financial Institutions.
15184 4.6%
14 Other current liabilities. 21684 6.5%
15 Total current liabilities (12 to 14) 23765 7.2%
16 Working capital (11 minus 15) 25462 7.7%
17 Outstanding loans (excluding Interest but including deposits) 18920 5.7%Warning: these figures indicate the number of cases found in the data file. They cannot be interpreted as summary statistics of the population of interest.
#5 D_Itm3: Opening (Rs.)Information [Type= continuous] [Format=numeric] [Range= -10705643767-48122948226] [Missing=*]
Statistics [NW/ W] [Valid=332174 /-] [Invalid=0 /-] [Mean=34995872.872 /-] [StdDev=377481476.828 /-]
Literal question Working Capital & Loans : Opening (Rs.)
#6 D_Itm4: Closing (Rs.).Information [Type= continuous] [Format=numeric] [Range= -12724985108-73679886733] [Missing=*]
Statistics [NW/ W] [Valid=332174 /-] [Invalid=0 /-] [Mean=38081210.144 /-] [StdDev=423569367.612 /-]
Literal question Working Capital & Loans : Closing (Rs.)
File E-EMPLOYMENT AND LABOUR COST#1 YR: YearInformation [Type= discrete] [Format=character] [Missing=*]
Statistics [NW/ W] [Valid=150590 /-] [Invalid=0 /-]
Literal question Accounting year
Value Label Cases Percentage
00 2000 150590 100.0%Warning: these figures indicate the number of cases found in the data file. They cannot be interpreted as summary statistics of the population of interest.
#2 BLK: Block code EInformation [Type= discrete] [Format=character] [Missing=*]
Statistics [NW/ W] [Valid=150590 /-] [Invalid=0 /-]
Literal question Schedule ( Questionnaire ) Block
Value Label Cases Percentage
E Block E 150590 100.0%Warning: these figures indicate the number of cases found in the data file. They cannot be interpreted as summary statistics of the population of interest.
#3 DSL: Despatch Serial NoInformation [Type= discrete] [Format=numeric] [Missing=*]

Annual Survey of Industries 1999-2000 - Variables Description
- 25 -
File E-EMPLOYMENT AND LABOUR COST#3 DSL: Despatch Serial NoStatistics [NW/ W] [Valid=150590 /-] [Invalid=0 /-]
Literal question Despatch serial number
#4 E_Itm1: S. No.Information [Type= discrete] [Format=numeric] [Range= 1-9] [Missing=*]
Statistics [NW/ W] [Valid=150590 /-] [Invalid=0 /-] [Mean=5.587 /-] [StdDev=2.712 /-]
Literal question Category of staff
Value Label Cases Percentage
1 Male Workers employed directly 23436 15.6%
2 Female Workers employed directly 7394 4.9%
3 Child Workers employed directly 19 0.0%
4 Sub-total (1+2+3) 23650 15.7%
5 Workers employed through contractors 5208 3.5%
6 Total Workers (4+5) 24593 16.3%
7 Supervisory & managerial staff 20567 13.7%
8 Other employees 20553 13.6%
9 Total employees (6+7+8) 25170 16.7%
10 Total number of working days 0 0.0%
11 Total Cost of Production(in Rs.) 0 0.0%Warning: these figures indicate the number of cases found in the data file. They cannot be interpreted as summary statistics of the population of interest.
#5 E_Itm3: Mandays Worked- ManufacturingInformation [Type= continuous] [Format=numeric] [Range= 0-21583685] [Missing=*]
Statistics [NW/ W] [Valid=150590 /-] [Invalid=0 /-] [Mean=31240.286 /-] [StdDev=195123.145 /-]
Literal question Man-days worked by the each category of staff
Interviewer'sinstructions
The total number of man-days worked during the accounting year by each category of employees is obtained by summing up the number of workers attending in each shift over all shifts worked on all working days during the accounting year. This figure excludes persons who are paid but remain on leave/ strike etc. Non-Working day is the day on which neither manufacturing process nor repairing and maintenance work is carried out but the factory and/or office remains open.
#6 E_Itm4: Mandays Worked - Non ManufacturingInformation [Type= continuous] [Format=numeric] [Range= 0-6798004] [Missing=*]
Statistics [NW/ W] [Valid=150590 /-] [Invalid=0 /-] [Mean=1245.288 /-] [StdDev=32992.573 /-]
Literal question Man-days worked by the each category of staff
#7 E_Itm5: Mandays Worked - TotalInformation [Type= continuous] [Format=numeric] [Range= 0-21583685] [Missing=*]
Statistics [NW/ W] [Valid=150590 /-] [Invalid=0 /-] [Mean=32491.162 /-] [StdDev=200253.269 /-]
Literal question Man-days worked by the each category of staff
#8 E_Itm6: Average Number of persons workedInformation [Type= continuous] [Format=numeric] [Range= 0-58972] [Missing=*]
Statistics [NW/ W] [Valid=150590 /-] [Invalid=0 /-] [Mean=102.926 /-] [StdDev=616.472 /-]
Literal question Average Number of persons worked in each category of staff

Annual Survey of Industries 1999-2000 - Variables Description
- 26 -
File E-EMPLOYMENT AND LABOUR COST#9 E_Itm7: Wages/salaries (in Rs.).Information [Type= continuous] [Format=numeric] [Range= 0-6189500000] [Missing=*]
Statistics [NW/ W] [Valid=150590 /-] [Invalid=0 /-] [Mean=6420678.571 /-] [StdDev=51772360.237 /-]
Literal question Wages/salaries (Rs.) in each category of staff
#10 E_Itm8: Bonus (in Rs.).Information [Type= continuous] [Format=numeric] [Range= 0-913448714] [Missing=*]
Statistics [NW/ W] [Valid=150590 /-] [Invalid=0 /-] [Mean=404662.211 /-] [StdDev=5119435.747 /-]
Literal question Bonus (Rs.) in each category of staff
Interviewer'sinstructions
bonus: Profit sharing, festival, year end, other bonuses and exgratia payments paid at less frequent intervals (i.e., other than bonuses paid more or less regularly for each pay period) are to be recorded under this item.
#11 E_Itm9: Provident FundInformation [Type= continuous] [Format=numeric] [Range= 0-1682310446] [Missing=*]
Statistics [NW/ W] [Valid=150590 /-] [Invalid=0 /-] [Mean=530983.613 /-] [StdDev=7110582.749 /-]
Literal question Contribution to Provident & Other funds (Rs.) in each category of staff
Interviewer'sinstructions
provident fund and other funds: It includes old age benefits like contribution to provident fund, pension, gratuity and contribution to other social security charges such as employee's state insurance, compensation for work injuries and occupational diseases, provident fund linked insurance retrenchment and lay-off benefits, payment made for VRS etc.
#12 E_Itm10: Workmen & Staff Welfare ExpensesInformation [Type= continuous] [Format=numeric] [Range= 0-513248611] [Missing=*]
Statistics [NW/ W] [Valid=150590 /-] [Invalid=0 /-] [Mean=365892.308 /-] [StdDev=4971746.299 /-]
Literal question Workman & staff welfare expenses (in Rs.) in each categorey of staff
Interviewer'sinstructions
workmen and staff welfare expenses: Includes benefits in kind include neutralizing agents, fats, milk, molasses given to workers of a factory where there is possibility of health hazard. cheap ration, shoes, umbrellas, residence, etc. are provided to workers who work at tea gardens. Light meal or lunch, beverages, tobacco, clothing (except uniform) electricity free of charge, water purchased but supplied free of charge, medical expenses. Children educational allowances, LTC, bus hired for to and fro daily journey (HRA will be considered as a part of wage and salary), maternity benefits and crèches, cultural and recreational facilities, cooperative stores for employees etc. If category wise break up is not available, total may be recorded against Item 10, Column 11.
File F-OTHER EXPENSES#1 YR: YearInformation [Type= discrete] [Format=numeric] [Missing=*]
Statistics [NW/ W] [Valid=25655 /-] [Invalid=0 /-]
Literal question Accounting year
Value Label Cases Percentage
0 2000 25655 100.0%Warning: these figures indicate the number of cases found in the data file. They cannot be interpreted as summary statistics of the population of interest.
#2 BLK: Block code FInformation [Type= discrete] [Format=character] [Missing=*]
Statistics [NW/ W] [Valid=25655 /-] [Invalid=0 /-]

Annual Survey of Industries 1999-2000 - Variables Description
- 27 -
File F-OTHER EXPENSES#2 BLK: Block code FLiteral question Schedule ( Questionnaire ) Block
Value Label Cases Percentage
F Block F 25655 100.0%Warning: these figures indicate the number of cases found in the data file. They cannot be interpreted as summary statistics of the population of interest.
#3 DSL: Despatch Serial NoInformation [Type= discrete] [Format=numeric] [Missing=*]
Statistics [NW/ W] [Valid=25655 /-] [Invalid=0 /-]
Literal question Despatch serial number
#4 F_Itm1: Work done by othersInformation [Type= continuous] [Format=numeric] [Range= 0-2378286959] [Missing=*]
Statistics [NW/ W] [Valid=25655 /-] [Invalid=0 /-] [Mean=2750472.042 /-] [StdDev=28900337.202 /-]
Literal question Expenditure in Rs. : Work done by others on materials supplied by the industrial undertaking
#5 F_Itm2a: Repair & maintenance of BuildingInformation [Type= continuous] [Format=numeric] [Range= 0-188660899] [Missing=*]
Statistics [NW/ W] [Valid=25655 /-] [Invalid=0 /-] [Mean=376756.482 /-] [StdDev=2791359.78 /-]
Literal question Expenditure in Rs. : Repair & maintenance of Building
#6 F_Itm2b: Repair & maintenance of Plant & MachineryInformation [Type= continuous] [Format=numeric] [Range= 0-2508663584] [Missing=*]
Statistics [NW/ W] [Valid=25655 /-] [Invalid=0 /-] [Mean=2093933.31 /-] [StdDev=24026638.364 /-]
Literal question Expenditure in Rs. : Repair & maintenance of Plant & machinery
#7 F_Itm2c: Repair & maintenance of Other fixed assetsInformation [Type= continuous] [Format=numeric] [Range= 0-728444087] [Missing=*]
Statistics [NW/ W] [Valid=25655 /-] [Invalid=0 /-] [Mean=521596.389 /-] [StdDev=6248592.972 /-]
Literal question Expenditure in Rs. : Plant & machinery other fixed assets
#8 F_Itm3: Operating expensesInformation [Type= continuous] [Format=numeric] [Range= 0-2950760000] [Missing=*]
Statistics [NW/ W] [Valid=25655 /-] [Invalid=0 /-] [Mean=2087386.123 /-] [StdDev=28517857.395 /-]
Literal question Expenditure in Rs. : Operating expenses
#9 F_Itm4: Non-operating expensesInformation [Type= continuous] [Format=numeric] [Range= 0-2592900000] [Missing=*]
Statistics [NW/ W] [Valid=25655 /-] [Invalid=0 /-] [Mean=6438947.083 /-] [StdDev=48669567.399 /-]
Literal question Expenditure in Rs. : Non-operating expenses(excluding insurance Charges)
#10 F_Itm5: Insurance ChargesInformation [Type= continuous] [Format=numeric] [Range= 0-338180422] [Missing=*]
Statistics [NW/ W] [Valid=25655 /-] [Invalid=0 /-] [Mean=625213.923 /-] [StdDev=5565177.507 /-]
Literal question Expenditure in Rs. : Insurance Charges
#11 F_Itm6: Total expenses(1 to 5)Information [Type= continuous] [Format=numeric] [Range= 0-6496891075] [Missing=*]

Annual Survey of Industries 1999-2000 - Variables Description
- 28 -
File F-OTHER EXPENSES#11 F_Itm6: Total expenses(1 to 5)Statistics [NW/ W] [Valid=25655 /-] [Invalid=0 /-] [Mean=14894305.35 /-] [StdDev=99847958.269 /-]
Literal question Expenditure in Rs. : Total expenses ( items 1 to 5)
#12 F_Itm7: Rent paid for Buildings, Plant & Machinery and other Fixed assetsInformation [Type= continuous] [Format=numeric] [Range= 0-894408674] [Missing=*]
Statistics [NW/ W] [Valid=25655 /-] [Invalid=0 /-] [Mean=794539.135 /-] [StdDev=9270771.026 /-]
Literal question Expenditure in Rs. : Rent paid for buildings, P&M and other fixed assets
#13 F_Itm8: Rent paid for land,royalties on mines,quarries and similar assetsInformation [Type= continuous] [Format=numeric] [Range= 0-450000000] [Missing=*]
Statistics [NW/ W] [Valid=25655 /-] [Invalid=0 /-] [Mean=234228.393 /-] [StdDev=5265315.131 /-]
Literal question Expenditure in Rs. : Rent paid for land on lease or royalties on mines, quarries and similar assets
#14 F_Itm9: Interest paidInformation [Type= continuous] [Format=numeric] [Range= 0-5526075235] [Missing=*]
Statistics [NW/ W] [Valid=25655 /-] [Invalid=0 /-] [Mean=11275014.091 /-] [StdDev=104880616.855 /-]
Literal question Expenditure in Rs. : Interest paid
#15 F_Itm10: Value of purchase goods sold in the same conditionInformation [Type= continuous] [Format=numeric] [Range= 0-11800418541] [Missing=*]
Statistics [NW/ W] [Valid=25655 /-] [Invalid=0 /-] [Mean=9698016.336 /-] [StdDev=122859739.16 /-]
Literal question Expenditure in Rs. : Purchase value of goods sold in the same condition as purchased
File G- OTHER OUTPUT or RECEIPT#1 YR: YearInformation [Type= discrete] [Format=character] [Missing=*]
Statistics [NW/ W] [Valid=22369 /-] [Invalid=0 /-]
Literal question Accounting year
Value Label Cases Percentage
00 2000 22369 100.0%Warning: these figures indicate the number of cases found in the data file. They cannot be interpreted as summary statistics of the population of interest.
#2 BLK: Block code GInformation [Type= discrete] [Format=character] [Missing=*]
Statistics [NW/ W] [Valid=22369 /-] [Invalid=0 /-]
Literal question Schedule ( Questionnaire ) Block
Value Label Cases Percentage
G Block G 22369 100.0%Warning: these figures indicate the number of cases found in the data file. They cannot be interpreted as summary statistics of the population of interest.
#3 DSL: Despatch Serial NoInformation [Type= discrete] [Format=numeric] [Missing=*]
Statistics [NW/ W] [Valid=22369 /-] [Invalid=0 /-]
Literal question Despatch serial number

Annual Survey of Industries 1999-2000 - Variables Description
- 29 -
File G- OTHER OUTPUT or RECEIPT#4 G_Itm1: Income from servicesInformation [Type= continuous] [Format=numeric] [Range= 0-8101070902] [Missing=*]
Statistics [NW/ W] [Valid=22369 /-] [Invalid=0 /-] [Mean=10200782.338 /-] [StdDev=103664823.388 /-]
Literal question Income from services (industrial/non industrial including work done for others on materials supplied by them)
#5 G_Itm2: Variation in stock of semi-finished goodsInformation [Type= continuous] [Format=numeric] [Range= -2458317405-1015282000] [Missing=*]
Statistics [NW/ W] [Valid=22369 /-] [Invalid=0 /-] [Mean=432630.697 /-] [StdDev=27579963.856 /-]
Literal question Variation in stock of semi-finished goods (Col.(4)minus Col(3) against item 5 in Block D
#6 G_Itm3: Electricity generated and soldInformation [Type= continuous] [Format=numeric] [Range= 0-2498773070] [Missing=*]
Statistics [NW/ W] [Valid=22369 /-] [Invalid=0 /-] [Mean=356701.71 /-] [StdDev=18289948.859 /-]
Literal question Value of electricity generated and sold
#7 G_Itm4: Value of own constructionInformation [Type= continuous] [Format=numeric] [Range= 0-1450374800] [Missing=*]
Statistics [NW/ W] [Valid=22369 /-] [Invalid=0 /-] [Mean=323219.939 /-] [StdDev=15421737.163 /-]
Literal question Value of own construction
#8 G_Itm5: Net balance of goods sold as purchasedInformation [Type= continuous] [Format=numeric] [Range= -589694042-1508492800] [Missing=*]
Statistics [NW/ W] [Valid=22369 /-] [Invalid=0 /-] [Mean=1485457.534 /-] [StdDev=23661493.953 /-]
Literal question Net balance of goods sold in the same condition as purchased. (Item 7 of Bl.G minus item 10 of Bl.F)
#9 G_Itm6: Total receiptsInformation [Type= continuous] [Format=numeric] [Range= -566674776-8102331665] [Missing=*]
Statistics [NW/ W] [Valid=22369 /-] [Invalid=0 /-] [Mean=12798792.219 /-] [StdDev=114957424.185 /-]
Literal question Total receipts ( items 1 to 5)
#10 G_Itm7: Value of purchase goods sold in the same condition .Information [Type= continuous] [Format=numeric] [Range= 0-12472609885] [Missing=*]
Statistics [NW/ W] [Valid=22369 /-] [Invalid=0 /-] [Mean=12608109.826 /-] [StdDev=146615994.785 /-]
Literal question Sale value of goods sold in the same condition as purchased
File H-INPUT ITEMS ( INDIGENOUS )#1 YR: YearInformation [Type= discrete] [Format=character] [Missing=*]
Statistics [NW/ W] [Valid=250663 /-] [Invalid=0 /-]
Literal question Accounting year
Value Label Cases Percentage
00 2000 250663 100.0%Warning: these figures indicate the number of cases found in the data file. They cannot be interpreted as summary statistics of the population of interest.
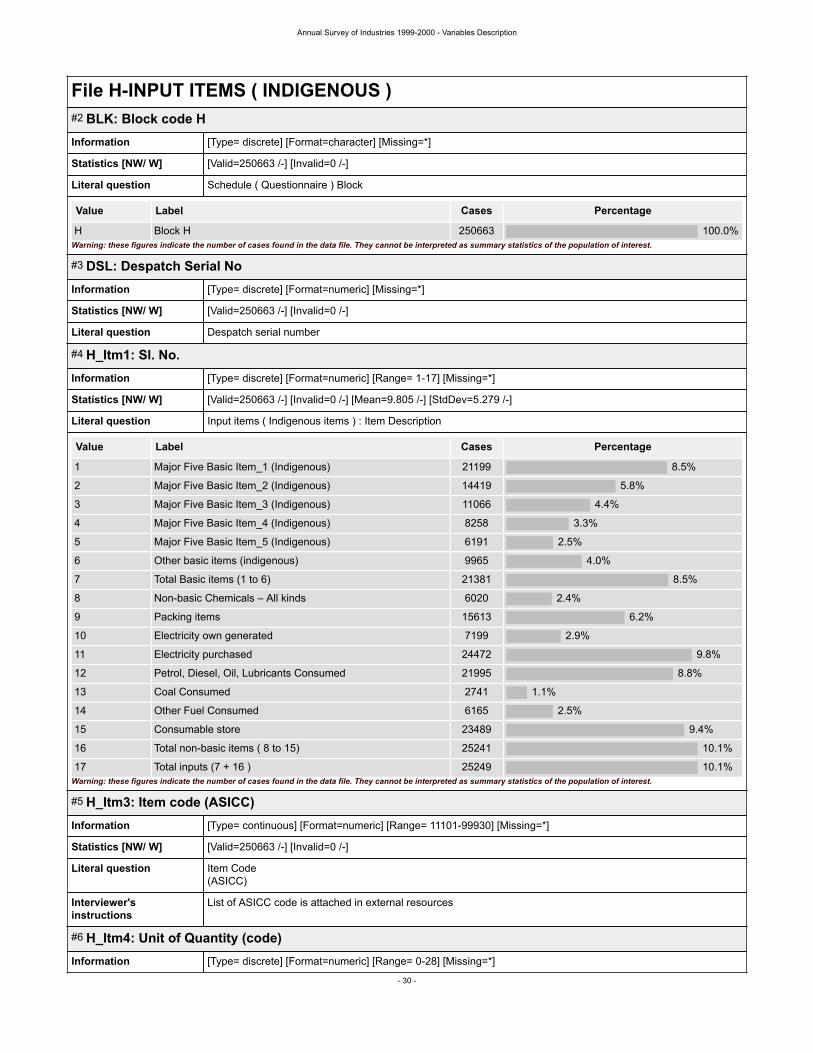
Annual Survey of Industries 1999-2000 - Variables Description
- 30 -
File H-INPUT ITEMS ( INDIGENOUS )#2 BLK: Block code HInformation [Type= discrete] [Format=character] [Missing=*]
Statistics [NW/ W] [Valid=250663 /-] [Invalid=0 /-]
Literal question Schedule ( Questionnaire ) Block
Value Label Cases Percentage
H Block H 250663 100.0%Warning: these figures indicate the number of cases found in the data file. They cannot be interpreted as summary statistics of the population of interest.
#3 DSL: Despatch Serial NoInformation [Type= discrete] [Format=numeric] [Missing=*]
Statistics [NW/ W] [Valid=250663 /-] [Invalid=0 /-]
Literal question Despatch serial number
#4 H_Itm1: Sl. No.Information [Type= discrete] [Format=numeric] [Range= 1-17] [Missing=*]
Statistics [NW/ W] [Valid=250663 /-] [Invalid=0 /-] [Mean=9.805 /-] [StdDev=5.279 /-]
Literal question Input items ( Indigenous items ) : Item Description
Value Label Cases Percentage
1 Major Five Basic Item_1 (Indigenous) 21199 8.5%
2 Major Five Basic Item_2 (Indigenous) 14419 5.8%
3 Major Five Basic Item_3 (Indigenous) 11066 4.4%
4 Major Five Basic Item_4 (Indigenous) 8258 3.3%
5 Major Five Basic Item_5 (Indigenous) 6191 2.5%
6 Other basic items (indigenous) 9965 4.0%
7 Total Basic items (1 to 6) 21381 8.5%
8 Non-basic Chemicals – All kinds 6020 2.4%
9 Packing items 15613 6.2%
10 Electricity own generated 7199 2.9%
11 Electricity purchased 24472 9.8%
12 Petrol, Diesel, Oil, Lubricants Consumed 21995 8.8%
13 Coal Consumed 2741 1.1%
14 Other Fuel Consumed 6165 2.5%
15 Consumable store 23489 9.4%
16 Total non-basic items ( 8 to 15) 25241 10.1%
17 Total inputs (7 + 16 ) 25249 10.1%Warning: these figures indicate the number of cases found in the data file. They cannot be interpreted as summary statistics of the population of interest.
#5 H_Itm3: Item code (ASICC)Information [Type= continuous] [Format=numeric] [Range= 11101-99930] [Missing=*]
Statistics [NW/ W] [Valid=250663 /-] [Invalid=0 /-]
Literal question Item Code (ASICC)
Interviewer'sinstructions
List of ASICC code is attached in external resources
#6 H_Itm4: Unit of Quantity (code)Information [Type= discrete] [Format=numeric] [Range= 0-28] [Missing=*]

Annual Survey of Industries 1999-2000 - Variables Description
- 31 -
File H-INPUT ITEMS ( INDIGENOUS )#6 H_Itm4: Unit of Quantity (code)Statistics [NW/ W] [Valid=250663 /-] [Invalid=0 /-] [Mean=5.579 /-] [StdDev=10.816 /-]
Literal question Unit of Quantity
Value Label Cases Percentage
0 N R 194461 77.6%
1 bags 6 0.0%
2 bale 58 0.0%
3 cubic meter 725 0.3%
4 carat 10 0.0%
5 dozen 1 0.0%
6 gramme 26 0.0%
7 k. litres 229 0.1%
8 km 20 0.0%
9 kg 4416 1.8%
10 kg rim 0 0.0%
11 lines 0 0.0%
12 litres 331 0.1%
13 megawatt 0 0.0%
14 metres 810 0.3%
15 nos 2043 0.8%
16 pair 10 0.0%
17 ream 2 0.0%
18 roll 59 0.0%
19 set 21 0.0%
20 sq.metre 264 0.1%
21 system 0 0.0%
22 th nos 688 0.3%
23 th.cubic metre 10 0.0%
24 th.k. litre 75 0.0%
25 th.pair 7 0.0%
26 th.sq. metre 0 0.0%
27 tonne 14720 5.9%
28 kwh 31671 12.6%Warning: these figures indicate the number of cases found in the data file. They cannot be interpreted as summary statistics of the population of interest.
#7 H_Itm5: Quantity consumed (as 99999999999.999)Information [Type= continuous] [Format=numeric] [Range= 0-20530000000] [Missing=*]
Statistics [NW/ W] [Valid=250663 /-] [Invalid=0 /-] [Mean=464323.397 /-] [StdDev=42869175.312 /-]
Literal question Quantity consumed
#8 H_Itm6: Purchase value (in Rs.)Information [Type= continuous] [Format=numeric] [Range= 0-54339898611] [Missing=*]
Statistics [NW/ W] [Valid=250663 /-] [Invalid=0 /-] [Mean=33128461.353 /-] [StdDev=406888403.251 /-]
Literal question Purchase Value ( in Rs.)

Annual Survey of Industries 1999-2000 - Variables Description
- 32 -
File I-INPUT ITEMS IMPORTED#1 YR: YearInformation [Type= discrete] [Format=numeric] [Missing=*]
Statistics [NW/ W] [Valid=12932 /-] [Invalid=0 /-]
Literal question Accounting year
Value Label Cases Percentage
0 2000 12932 100.0%Warning: these figures indicate the number of cases found in the data file. They cannot be interpreted as summary statistics of the population of interest.
#2 BLK: Block code IInformation [Type= discrete] [Format=character] [Missing=*]
Statistics [NW/ W] [Valid=12932 /-] [Invalid=0 /-]
Literal question Schedule ( Questionnaire ) Block
Value Label Cases Percentage
I Block I 12932 100.0%Warning: these figures indicate the number of cases found in the data file. They cannot be interpreted as summary statistics of the population of interest.
#3 DSL: Despatch Serial NoInformation [Type= continuous] [Format=numeric] [Missing=*]
Statistics [NW/ W] [Valid=12932 /-] [Invalid=0 /-]
Literal question Despatch serial number
Frequency table not shown (3486 Modalities)
#4 I_Itm1: Sl. No.Information [Type= discrete] [Format=numeric] [Range= 1-7] [Missing=*]
Statistics [NW/ W] [Valid=12932 /-] [Invalid=0 /-] [Mean=3.88 /-] [StdDev=2.427 /-]
Literal question Directly imported items : Item Description ( Major five imported items)
Value Label Cases Percentage
1 Major five imported item_1 3385 26.2%
2 Major five imported item_2 1867 14.4%
3 Major five imported item_3 1321 10.2%
4 Major five imported item_4 942 7.3%
5 Major five imported item_5 666 5.2%
6 Other items imported 1265 9.8%
7 Total imports (consumed) ( 1 to 6 ) 3486 27.0%Warning: these figures indicate the number of cases found in the data file. They cannot be interpreted as summary statistics of the population of interest.
#5 I_Itm3: Item code (ASICC)Information [Type= continuous] [Format=numeric] [Range= 11404-99940] [Missing=*]
Statistics [NW/ W] [Valid=12932 /-] [Invalid=0 /-]
Literal question Item Code (ASICC)
Interviewer'sinstructions
List of ASICC Code is attached in external resources
#6 I_Itm4: Unit of Quantity (code)Information [Type= discrete] [Format=numeric] [Range= 0-27] [Missing=*]
Statistics [NW/ W] [Valid=12932 /-] [Invalid=0 /-]

Annual Survey of Industries 1999-2000 - Variables Description
- 33 -
File I-INPUT ITEMS IMPORTED#6 I_Itm4: Unit of Quantity (code)Literal question Unit of
Quantity
Value Label Cases Percentage
0 N R 9435 73.0%
1 bags 0 0.0%
2 bale 16 0.1%
3 cubic meter 16 0.1%
4 carat 7 0.1%
5 dozen 1 0.0%
6 gramme 3 0.0%
7 k. litres 4 0.0%
8 km 11 0.1%
9 kg 707 5.5%
10 kg rim 0 0.0%
11 lines 0 0.0%
12 litres 65 0.5%
13 megawatt 0 0.0%
14 metres 126 1.0%
15 nos 965 7.5%
16 pair 6 0.0%
17 ream 0 0.0%
18 roll 23 0.2%
19 set 10 0.1%
20 sq.metre 66 0.5%
21 system 0 0.0%
22 th nos 159 1.2%
23 th.cubic metre 0 0.0%
24 th.k. litre 1 0.0%
25 th.pair 5 0.0%
26 th.sq. metre 0 0.0%
27 tonne 1306 10.1%
28 kwh 0 0.0%Warning: these figures indicate the number of cases found in the data file. They cannot be interpreted as summary statistics of the population of interest.
#7 I_Itm5: Quantity consumedInformation [Type= continuous] [Format=numeric] [Range= 0-537913452] [Missing=*]
Statistics [NW/ W] [Valid=12932 /-] [Invalid=0 /-] [Mean=275927.845 /-] [StdDev=6495459.795 /-]
Literal question Quantity consumed
#8 I_Itm6: Purchase value at delivery (in Rs.)Information [Type= continuous] [Format=numeric] [Range= 0-36476336422] [Missing=*]
Statistics [NW/ W] [Valid=12932 /-] [Invalid=0 /-] [Mean=111289231.067 /-] [StdDev=1062340821.002 /-]
Literal question Purchase Value at delivery (in Rs.)

Annual Survey of Industries 1999-2000 - Variables Description
- 34 -
File J-PRODUCTS AND BY-PRODUCTS#1 YR: YearInformation [Type= discrete] [Format=numeric] [Missing=*]
Statistics [NW/ W] [Valid=69025 /-] [Invalid=0 /-]
Literal question Accounting year
Value Label Cases Percentage
0 2000 69025 100.0%Warning: these figures indicate the number of cases found in the data file. They cannot be interpreted as summary statistics of the population of interest.
#2 BLK: Block code JInformation [Type= discrete] [Format=character] [Missing=*]
Statistics [NW/ W] [Valid=69025 /-] [Invalid=0 /-]
Literal question Schedule ( Questionnaire ) Block
Value Label Cases Percentage
J block J 69025 100.0%Warning: these figures indicate the number of cases found in the data file. They cannot be interpreted as summary statistics of the population of interest.
#3 DSL: Despatch Serial NoInformation [Type= discrete] [Format=numeric] [Missing=*]
Statistics [NW/ W] [Valid=69025 /-] [Invalid=0 /-]
Literal question Despatch serial number
#4 J_Itm1: Sl.No.Information [Type= continuous] [Format=numeric] [Range= 1-12] [Missing=*]
Statistics [NW/ W] [Valid=69025 /-] [Invalid=0 /-] [Mean=5.788 /-] [StdDev=4.805 /-]
Literal question Products /By-Products Description ( First ten Major Items as per value - No Brand Name)
Value Label Cases Percentage
1 Products/ By-Products description 20690 30.0%
2 Products/ By-Products description 9206 13.3%
3 Products/ By-Products description 5546 8.0%
4 Products/ By-Products description 3230 4.7%
5 Products/ By-Products description 1914 2.8%
6 Products/ By-Products description 1201 1.7%
7 Products/ By-Products description 849 1.2%
8 Products/ By-Products description 590 0.9%
9 Products/ By-Products description 433 0.6%
10 Products/ By-Products description 327 0.5%
11 Other Products/ By-Products 4223 6.1%
12 Total ( 1 to 11) 20816 30.2%Warning: these figures indicate the number of cases found in the data file. They cannot be interpreted as summary statistics of the population of interest.
#5 J_Itm3: Item code (ASICC)Information [Type= continuous] [Format=numeric] [Range= 11159-99950] [Missing=*]
Statistics [NW/ W] [Valid=69025 /-] [Invalid=0 /-] [Mean=81876.404 /-] [StdDev=29442.341 /-]
Literal question Item Code (ASICC)

Annual Survey of Industries 1999-2000 - Variables Description
- 35 -
File J-PRODUCTS AND BY-PRODUCTS#5 J_Itm3: Item code (ASICC)Interviewer'sinstructions
List of ASICC Code is attached in external resources
#6 J_Itm4: Unit of QuantityInformation [Type= discrete] [Format=numeric] [Range= 0-27] [Missing=*]
Statistics [NW/ W] [Valid=69025 /-] [Invalid=0 /-]
Literal question Unit of Quantity
Value Label Cases Percentage
0 N R 49346 71.5%
1 bags 3 0.0%
2 bale 47 0.1%
3 cubic meter 303 0.4%
4 carat 7 0.0%
5 dozen 169 0.2%
6 gramme 27 0.0%
7 k. litres 179 0.3%
8 km 48 0.1%
9 kg 2952 4.3%
10 kg rim 0 0.0%
11 lines 1 0.0%
12 litres 338 0.5%
13 megawatt 17 0.0%
14 metres 608 0.9%
15 nos 4629 6.7%
16 pair 96 0.1%
17 ream 1 0.0%
18 roll 13 0.0%
19 set 22 0.0%
20 sq.metre 245 0.4%
21 system 0 0.0%
22 th nos 1560 2.3%
23 th.cubic metre 23 0.0%
24 th.k. litre 5 0.0%
25 th.pair 13 0.0%
26 th.sq. metre 0 0.0%
27 tonne 8373 12.1%
28 kwh 0 0.0%Warning: these figures indicate the number of cases found in the data file. They cannot be interpreted as summary statistics of the population of interest.
#7 J_Itm5: Quantity manufacturedInformation [Type= continuous] [Format=numeric] [Range= 0-84620000000] [Missing=*]
Statistics [NW/ W] [Valid=69025 /-] [Invalid=0 /-] [Mean=1773574.871 /-] [StdDev=322303270.537 /-]
Literal question Quantity manufactured
#8 J_Itm6: Quantity soldInformation [Type= continuous] [Format=numeric] [Range= 0-83640000000] [Missing=*]

Annual Survey of Industries 1999-2000 - Variables Description
- 36 -
File J-PRODUCTS AND BY-PRODUCTS#8 J_Itm6: Quantity soldStatistics [NW/ W] [Valid=69025 /-] [Invalid=0 /-] [Mean=1719658.092 /-] [StdDev=318562350.244 /-]
Literal question Quantity sold
#9 J_Itm7: Gross sale value (Rs.)Information [Type= continuous] [Format=numeric] [Range= 0-112010961849] [Missing=*]
Statistics [NW/ W] [Valid=69025 /-] [Invalid=0 /-] [Mean=157038711.984 /-] [StdDev=1266663749.979 /-]
Literal question Gross sale value (Rs.)
#10 J_Itm8: Excise dutyInformation [Type= continuous] [Format=numeric] [Range= 0-23255882410] [Missing=*]
Statistics [NW/ W] [Valid=69025 /-] [Invalid=0 /-] [Mean=14800009.769 /-] [StdDev=219613101.131 /-]
Literal question Distributive Expense(Rs.) : Excise duty
#11 J_Itm9: Sales TaxInformation [Type= continuous] [Format=numeric] [Range= 0-1770335000] [Missing=*]
Statistics [NW/ W] [Valid=69025 /-] [Invalid=0 /-] [Mean=1023444.632 /-] [StdDev=17520080.991 /-]
Literal question Distributive Expense(Rs.) : Sales Tax
#12 J_Itm10: OthersInformation [Type= continuous] [Format=numeric] [Range= 0-4250944607] [Missing=*]
Statistics [NW/ W] [Valid=69025 /-] [Invalid=0 /-] [Mean=5495781.049 /-] [StdDev=50326547.332 /-]
Literal question Distributive Expense(Rs.) : Others
#13 J_Itm11: TotalInformation [Type= continuous] [Format=numeric] [Range= 0-27506827017] [Missing=*]
Statistics [NW/ W] [Valid=69025 /-] [Invalid=0 /-] [Mean=21324444.557 /-] [StdDev=253974405.659 /-]
Literal question Distributive Expense(Rs.) : Total
#14 J_Itm12: Per unit net sale value (Rs.) [7-11]/6Information [Type= continuous] [Format=numeric] [Range= 0-902982696] [Missing=*]
Statistics [NW/ W] [Valid=69025 /-] [Invalid=0 /-] [Mean=103372.06 /-] [StdDev=5803380.68 /-]
Literal question Per Unit net sale value (Rs.)
#15 J_Itm13: Ex-factory value of output (Rs.) (12x5).Information [Type= continuous] [Format=numeric] [Range= 0-93666456308] [Missing=*]
Statistics [NW/ W] [Valid=69025 /-] [Invalid=0 /-] [Mean=141025851.936 /-] [StdDev=1115094097.809 /-]
Literal question Ex-factory value

Annual Survey of Industries 1999-2000 - Documentation
- 37 -
DocumentationReports and analytical documents...........................................................................................................................................................................37
Selected Characteristics By Major Industry Group (NIC-98 2 Digit)....................................................................................................................37Table 3 : Principal Characterstics By Major States.............................................................................................................................................. 37Table 4 : - Principal Characterstics by Type of Organisation...............................................................................................................................37Table 5: Estimate of some important characteristics by State for the year 1999-2000....................................................................................... 37Table 6 - Principal Characteristics by Rural - Urban Break-up............................................................................................................................37
Questionnaires..........................................................................................................................................................................................................37Annual survey of industries 1999-2000................................................................................................................................................................37
Technical documents................................................................................................................................................................................................ 37LIST OF STATE CODES...................................................................................................................................................................................... 37NIC 1998 code list................................................................................................................................................................................................ 37Flow Chart for Tabulation Program.......................................................................................................................................................................37A note on final unit level data of ASI, 1999-00....................................................................................................................................................37
Other resources........................................................................................................................................................................................................38Table 1 : Annual Series For Principal Characteristics..........................................................................................................................................38
Reports and analytical documents
Selected Characteristics By Major Industry Group (NIC-98 2 Digit), India [ind], English [eng],"ASI_REPORTS_1999_2000\asi_2_digit_nic_99_00.htm"
Table 3 : Principal Characterstics By Major States, English [eng], "DOCUMENTS\Table 3.pdf"
Table 4 : - Principal Characterstics by Type of Organisation, English [eng], "DOCUMENTS\Table 4.pdf"
Table 5: Estimate of some important characteristics by State for the year 1999-2000, English [eng],"DOCUMENTS\Table 5.pdf"
Table 6 - Principal Characteristics by Rural - Urban Break-up, India [ind], English [eng], "DOCUMENTS\Table6.pdf"
Questionnaires
Annual survey of industries 1999-2000, India [ind], English [eng], "DOCUMENTS\ASIsch99-00.pdf"
Technical documents
LIST OF STATE CODES, India [ind], English [eng], "DOCUMENTS\ASISTATE_CODES.pdf"
NIC 1998 code list, India [ind], English [eng], "DOCUMENTS\NIC98.pdf"
Flow Chart for Tabulation Program, India [ind], English [eng], "DOCUMENTS\tp00.pdf"
A note on final unit level data of ASI, 1999-00, India [ind], English [eng], "DOCUMENTS\readme00.pdf"

Annual Survey of Industries 1999-2000 - Documentation
- 38 -
Other resources
Table 1 : Annual Series For Principal Characteristics, India [ind], English [eng], "DOCUMENTS\Table-1.pdf"