Embed Size (px)
Citation preview

Document Name i Insert Month/Year
Appendix N Horse Creek Meander Belt Diversion Design
PSM AUSTRALIA PTY LTDDate: October 2012 WJC Meynink
PrincipalG:\HorseCk\Report 400.01 Horse Creek Meander Belt Diversion Design.docx
NEW HOPE CORPORATION
HORSE CREEK MEANDER BELTDIVERSION DESIGN
Report No: 400.01
COPYRIGHT
©WJC Meyninkand
©PSM Australia Pty Ltd, 2012
All intellectual property and copyright reserved.
Apart from any fair dealing for the purpose of private study, research, criticism orreview, as permitted under the Copyright Act, 1968, no part of this report may bereproduced, transmitted, stored in a retrieval system or adapted in any form or byany means (electronic, mechanical, photocopying, recording or otherwise), nor mayany methods, procedures or analytical developments be used or adapted withoutwritten permission. Enquiries should be addressed to PSM Australia Pty. Ltd.

PSM AUSTRALIA PTY LTD
G:\HorseCk\Report 400.01 Horse Creek Meander Belt Diversion Design.docx Page i
TABLE OF CONTENTS
1.0 INTRODUCTION .................................................................................................................................. 3
2.0 DIVERSION DESIGN ........................................................................................................................... 6
2.1 STEAM MORPHOLOGY ............................................................................................................................ 6
2.2 MEANDER GEOMETRY ......................................................................................................................... 17
2.3 MEANDERBELT ROUGHNESS ................................................................................................................ 22
2.4 DERM GUIDELINES ............................................................................................................................. 27
3.0 APPLICATION TO HORSE CREEK................................................................................................ 31
3.1 FINAL DIVERSION................................................................................................................................. 31
3.1.1 Upstream Diversion on Fill...................................................................................................................... 31
3.1.2 Middle Diversion in Natural Ground ....................................................................................................... 33
4.0 TRANSITION DESIGN....................................................................................................................... 36
4.1 UPSTREAM TRANSITION ....................................................................................................................... 36
5.0 DIVERSION SEQUENCE................................................................................................................... 36
6.0 REFERENCES ..................................................................................................................................... 39
TABLES
Table 1 Definition of key Design Parameters ..................................................................... 22Table 2 Main/Lowflow Channel Engendered Form roughness in a fully exploited
Floodplain. B=20, Kx=0.9, Kc=0.2...................................................................... 26Table 3 Floodplain Depth, Velocity and component roughness for a fully exploited
floodplain............................................................................................................... 27Table 4 DERM Stability Criteria for Stream Diversion ..................................................... 27Table 5 Horse Creek Design Floods Based on Juandah & Yuleba Ck G.S........................ 28Table 6 Comparison of Diversion on Fill hydraulic stability parameters with DERM
guidelines............................................................................................................... 32Table 7 Comparison of Diversion Natural Ground Stability Parameters with DERM
Guidelines.............................................................................................................. 33

PSM AUSTRALIA PTY LTD
G:\HorseCk\Report 400.01 Horse Creek Meander Belt Diversion Design.docx Page ii
TABLE OF FIGURES
Figure 1 Elimatta Project Final Landforms and Diversion Corridor.................................... 4Figure 2 Diversion Development Sequence............................................................................ 5Figure 3 Ariel View of Horse Creek within Mine Lease......................................................... 8Figure 4 Horse Creek Just Upstream of Proposed Temporary Central Diversion Offtake 9Figure 5 Debris Accumulation Horse Creek at Temporary Central Diversion Inlet ............. 9Figure 6 Floodplain Showing Location of Temporary Central Diversion (Fresh Sand
Lenses on Floodplain) ........................................................................................... 10Figure 7 Upper 'Bundi' Bar .................................................................................................. 10Figure 8 Lower 'Bundi' Bar (Upper in Background)............................................................ 11Figure 9 Failed Causeway over Horse Creek Several Kilometres Upstream of Mine Area 11Figure 10 Large Sand Deposits Just Downstream of Causeway............................................ 12Figure 11 Horse Creek Meander Patterns about Elimatta Lease .......................................... 13Figure 12 Horse Creek Meander Channel Talweg Profile .................................................... 14Figure 13 Catchment Area and Slope..................................................................................... 15Figure 14 (Leopold and Wolman, 1957) channel pattern, gradient and bankfull discharge. 15Figure 15 (Lane, 1957) channel pattern, gradient and mean discharge................................ 16Figure 16 Three distinct Meander Patterns in Horse Creek .................................................. 18Figure 17 Plot of meander wavelength versus flow width (after Da Silva 2005) .................. 18Figure 18 Earlier meander channel width - wave length relationships ................................. 19Figure 19 Geometric characteristics of sine-generated meandering streams. (a) Plot of1 /
and / aB R versus ; (b_ Maximum possible value of 0 ...................................... 20
Figure 20 Dimensionless Talweg Meander Belt Ratio as a function of Meander CrossingAngle...................................................................................................................... 21
Figure 21 Meander pattern in a fully exploited floodplain .................................................... 23Figure 22 Vertical Section for floodplain flow across the low flow channel ......................... 23Figure 23 Flood frequency Plot Juandah Creek GS .............................................................. 30Figure 24 Flood frequency Plot Yuleba Creek GS ................................................................. 30Figure 25 Meander Channel Cross Sectional Location ......................................................... 34Figure 26 Histogram of Meander Channel Top Widths ......................................................... 35Figure 27 Histogram of Meander Channel Depths ................................................................ 35Figure 28 Matching Existing and Diversion Rating Curves and Upstream Edge of Lease ... 37Figure 29 Diversion Development Sequence.......................................................................... 38
PSM AUSTRALIA PTY LTD
G:\HorseCk\Report 400.01 Horse Creek Meander Belt Diversion Design.docx Page 3
1.0 INTRODUCTION
The current design of the Horse Creek diversion was adopted to maximize dump space. It has arelatively narrow floodplain with a minimal sinuosity low flow channel and significant energydissipating drop structures that pass the entire flow.
A possible alternative, albeit with significant economic impairment, is to have a wider steeperfloodplain with a meandering low flow channel with low flow only energy dissipation as/ifrequired. The notion is that the energy dissapators can be replaced with the combination of awider floodplain and a highly sinuous main channel. In this design there are two factors thatpotentially define the floodplain width: the width for adequate sinuosity and the width forminimal scour. These two factors are evaluated in this study as a basis for defining floodplainwidth for a high sinuosity diversion design.
This report focuses on the technical aspects of diversion design, in particular channel morphologyand hydraulics such that these might be agreed as part of the overall approvals process.
While the focus of this report is the technical aspects of diversion design: hydrology, morphologyand hydraulics, it is important nonetheless to provide some background setting. Virtually theentire base is undelayed by mineable coal while being bisected by Horse Creek with a catchmentarea of 554km² upstream of the lease. The lowerstrip ratio coal that makes the project viable isbeneath the floodplain necessitating its diversion.
Figure 1 presents the final landform with the diversion corridor and original stream talwegshown. In addition to meeting morphological and hydraulic criteria the diversion musthydraulically match natural stream conditions at the upstream and downstream ends of the leaseand not generate any afflux in drainage of western tributaries. Figure 2 provides the diversiondevelopment sequence. (See Section 5 for further detail.)
Consistent with the technical focus in the remainder of this report qualitative and quantitativeaspects of stream morphology are first discussed and presented. A meander pattern geometrydesign procedure is then developed and hydraulic criteria evaluated.

PSM AUSTRALIA PTY LTD
G:\HorseCk\Report 400.01 Horse Creek Meander Belt Diversion Design.docx Page 4
Figure 1 Elimatta Project Final Landforms and Diversion Corridor

PSM AUSTRALIA PTY LTD
G:\HorseCk\Report 400.01 Horse Creek Meander Belt Diversion Design.docx Page 5
Figure 2 Diversion Development Sequence
PSM AUSTRALIA PTY LTD
G:\HorseCk\Report 400.01 Horse Creek Meander Belt Diversion Design.docx Page 6
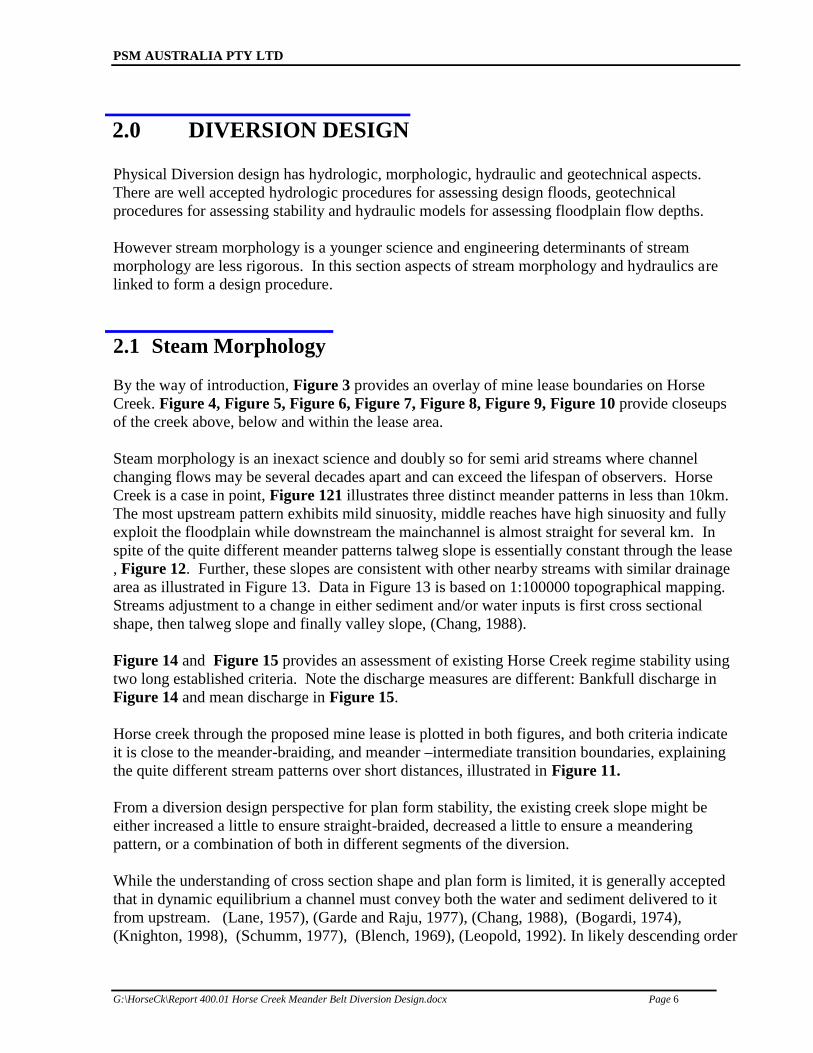
2.0 DIVERSION DESIGN
Physical Diversion design has hydrologic, morphologic, hydraulic and geotechnical aspects.There are well accepted hydrologic procedures for assessing design floods, geotechnicalprocedures for assessing stability and hydraulic models for assessing floodplain flow depths.
However stream morphology is a younger science and engineering determinants of streammorphology are less rigorous. In this section aspects of stream morphology and hydraulics arelinked to form a design procedure.
2.1 Steam Morphology
By the way of introduction, Figure 3 provides an overlay of mine lease boundaries on HorseCreek. Figure 4, Figure 5, Figure 6, Figure 7, Figure 8, Figure 9, Figure 10 provide closeupsof the creek above, below and within the lease area.
Steam morphology is an inexact science and doubly so for semi arid streams where channelchanging flows may be several decades apart and can exceed the lifespan of observers. HorseCreek is a case in point, Figure 121 illustrates three distinct meander patterns in less than 10km.The most upstream pattern exhibits mild sinuosity, middle reaches have high sinuosity and fullyexploit the floodplain while downstream the mainchannel is almost straight for several km. Inspite of the quite different meander patterns talweg slope is essentially constant through the lease, Figure 12. Further, these slopes are consistent with other nearby streams with similar drainagearea as illustrated in Figure 13. Data in Figure 13 is based on 1:100000 topographical mapping.Streams adjustment to a change in either sediment and/or water inputs is first cross sectionalshape, then talweg slope and finally valley slope, (Chang, 1988).
Figure 14 and Figure 15 provides an assessment of existing Horse Creek regime stability usingtwo long established criteria. Note the discharge measures are different: Bankfull discharge inFigure 14 and mean discharge in Figure 15.
Horse creek through the proposed mine lease is plotted in both figures, and both criteria indicateit is close to the meander-braiding, and meander –intermediate transition boundaries, explainingthe quite different stream patterns over short distances, illustrated in Figure 11.
From a diversion design perspective for plan form stability, the existing creek slope might beeither increased a little to ensure straight-braided, decreased a little to ensure a meanderingpattern, or a combination of both in different segments of the diversion.
While the understanding of cross section shape and plan form is limited, it is generally acceptedthat in dynamic equilibrium a channel must convey both the water and sediment delivered to itfrom upstream. (Lane, 1957), (Garde and Raju, 1977), (Chang, 1988), (Bogardi, 1974),(Knighton, 1998), (Schumm, 1977), (Blench, 1969), (Leopold, 1992). In likely descending order

PSM AUSTRALIA PTY LTD
G:\HorseCk\Report 400.01 Horse Creek Meander Belt Diversion Design.docx Page 7
of importance key determinants of sediment transport capacity are slope, flowrate andcrossectional shape. Broadly this means that to maintain sediment transport capacity the newmain channel must have about the same slope as the one it replaces.

PSM AUSTRALIA PTY LTD
G:\HorseCk\Report 400.01 Horse Creek Meander Belt Diversion Design.docx Page 8
Figure 3 Ariel View of Horse Creek within Mine Lease

PSM AUSTRALIA PTY LTD
G:\HorseCk\Report 400.01 Horse Creek Meander Belt Diversion Design.docx Page 9
Figure 4 Horse Creek Just Upstream of Proposed Temporary Central DiversionOfftake
Figure 5 Debris Accumulation Horse Creek at Temporary Central Diversion Inlet

PSM AUSTRALIA PTY LTD
G:\HorseCk\Report 400.01 Horse Creek Meander Belt Diversion Design.docx Page 10
Figure 6 Floodplain Showing Location of Temporary Central Diversion (Fresh SandLenses on Floodplain)
Figure 7 Upper 'Bundi' Bar

PSM AUSTRALIA PTY LTD
G:\HorseCk\Report 400.01 Horse Creek Meander Belt Diversion Design.docx Page 11
Figure 8 Lower 'Bundi' Bar (Upper in Background)
Figure 9 Failed Causeway over Horse Creek Several Kilometres Upstream of MineArea

PSM AUSTRALIA PTY LTD
G:\HorseCk\Report 400.01 Horse Creek Meander Belt Diversion Design.docx Page 12
Figure 10 Large Sand Deposits Just Downstream of Causeway

PSM AUSTRALIA PTY LTD
G:\HorseCk\Report 400.01 Horse Creek Meander Belt Diversion Design.docx Page 13
Figure 11 Horse Creek Meander Patterns about Elimatta Lease

PSM AUSTRALIA PTY LTD
G:\HorseCk\Report 400.01 Horse Creek Meander Belt Diversion Design.docx Page 14
Figure 12 Horse Creek Meander Channel Talweg Profile

PSM AUSTRALIA PTY LTD
G:\HorseCk\Report 400.01 Horse Creek Meander Belt Diversion Design.docx Page 15
Figure 13 Catchment Area and Slope
Figure 14 (Leopold and Wolman, 1957) channel pattern, gradient and bankfulldischarge

PSM AUSTRALIA PTY LTD
G:\HorseCk\Report 400.01 Horse Creek Meander Belt Diversion Design.docx Page 16
Figure 15 (Lane, 1957) channel pattern, gradient and mean discharge
Yalin (1992) has shown that the sinuosity, σ, for a talweg defined by (1) is
0 01/ ( )J (1)
When 0J is the first order Bessel function.
Figure 19 plots the reciprocal of sinuosity and width/radius ratio.
In numerical analysis carried out as part of this study the maximum possible value of 0 was
found to be about 2.1 radians somewhat less than that indicated in 3(b).
In a design context, sinuosity is defined by ratio of valley slope to talweg slope. The latter in turndefined by the minimal scour critical of criteria in Table 4 (Section 2.4).
Sinuosity, , defines 0 via (3)

PSM AUSTRALIA PTY LTD
G:\HorseCk\Report 400.01 Horse Creek Meander Belt Diversion Design.docx Page 17
2.2 Meander Geometry
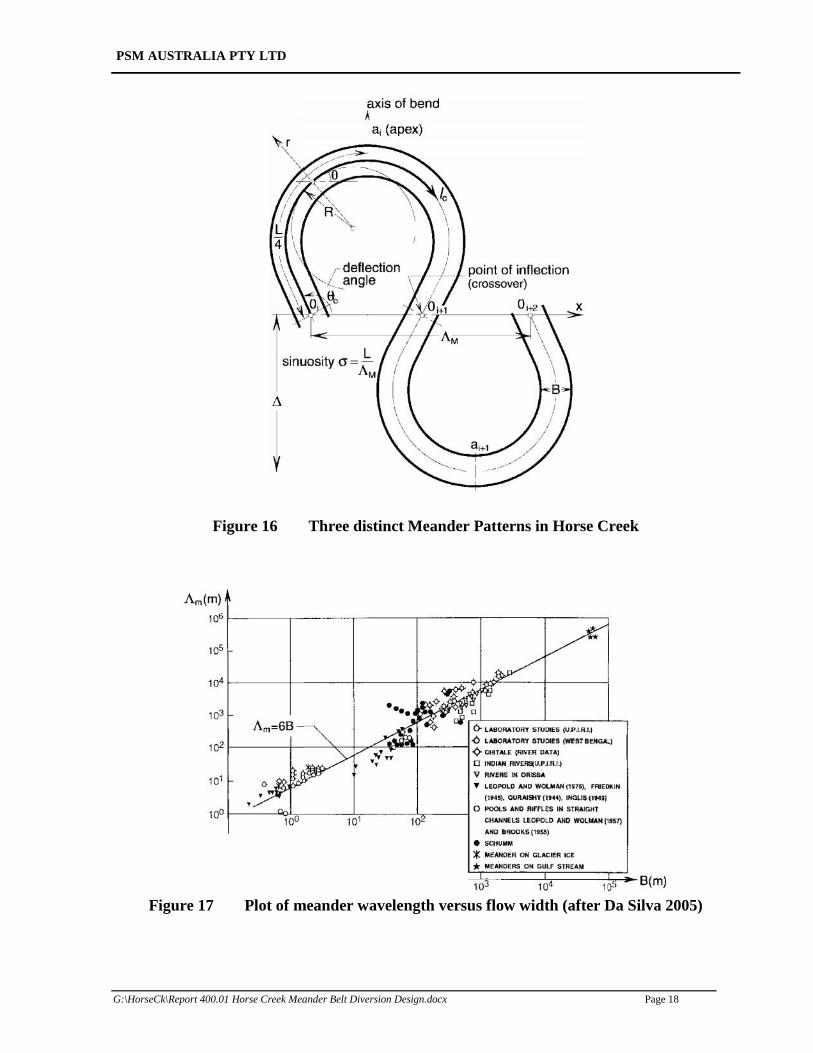
In 2005, Da Silva, presented the Ippen Lecturer and in it provided a state of the art review of“How and Why Rivers Meander”. The definition of meander geometry and analysis used in thisstudy relies heavily on this work.
Da Silva starts with Leopold and Langbein (1966) Idealized sine-generated curve meanderfunction (see Figure 16 for nomenclature)
0 cos 2c
L
(2)
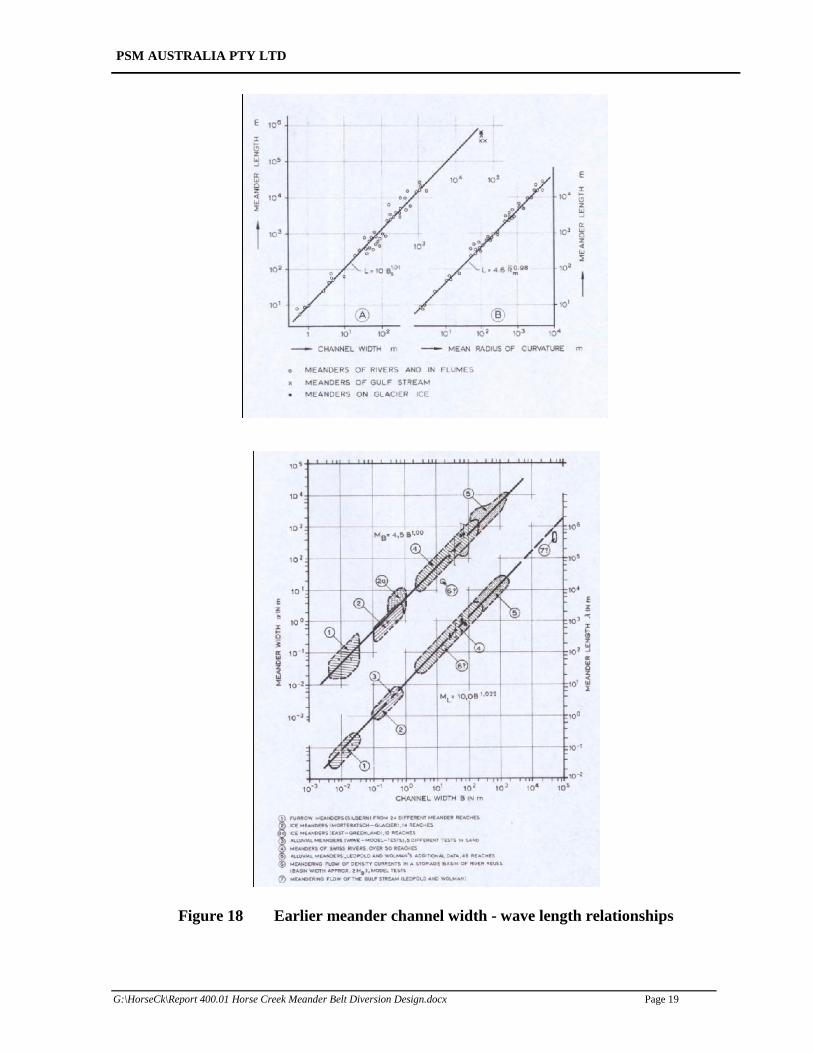
And a relationship between meander wave length, m , and channel top width, B.
6.m B (3)
Where the constant of proportionality, 6, is based on both theoretical analysis and experimentaldata, Figure 17.
As an indication of the upper bound uncertainty Figure 18 provides results of two earlier studiesindicating wave length is about ten times the width - rather than six times. The first figure isbased on (Leopold et al., 1964) and the second that of (Zeller, 1967).
PSM AUSTRALIA PTY LTD
G:\HorseCk\Report 400.01 Horse Creek Meander Belt Diversion Design.docx Page 18
Figure 16 Three distinct Meander Patterns in Horse Creek
Figure 17 Plot of meander wavelength versus flow width (after Da Silva 2005)
PSM AUSTRALIA PTY LTD
G:\HorseCk\Report 400.01 Horse Creek Meander Belt Diversion Design.docx Page 18
Figure 16 Three distinct Meander Patterns in Horse Creek
Figure 17 Plot of meander wavelength versus flow width (after Da Silva 2005)
PSM AUSTRALIA PTY LTD
G:\HorseCk\Report 400.01 Horse Creek Meander Belt Diversion Design.docx Page 18
Figure 16 Three distinct Meander Patterns in Horse Creek
Figure 17 Plot of meander wavelength versus flow width (after Da Silva 2005)
PSM AUSTRALIA PTY LTD
G:\HorseCk\Report 400.01 Horse Creek Meander Belt Diversion Design.docx Page 19
Figure 18 Earlier meander channel width - wave length relationships

PSM AUSTRALIA PTY LTD
G:\HorseCk\Report 400.01 Horse Creek Meander Belt Diversion Design.docx Page 20
Figure 19 Geometric characteristics of sine-generated meandering streams. (a) Plot of1 / and / aB R versus ; (b_ Maximum possible value of 0
Sinuosity is also defined by
6.m
L L
B
(4)
and rearranging with L as dependant variable
(6 ).L B (5)
If Ŀ and θo are defined then the meander belt width, mW , is similarly defined.
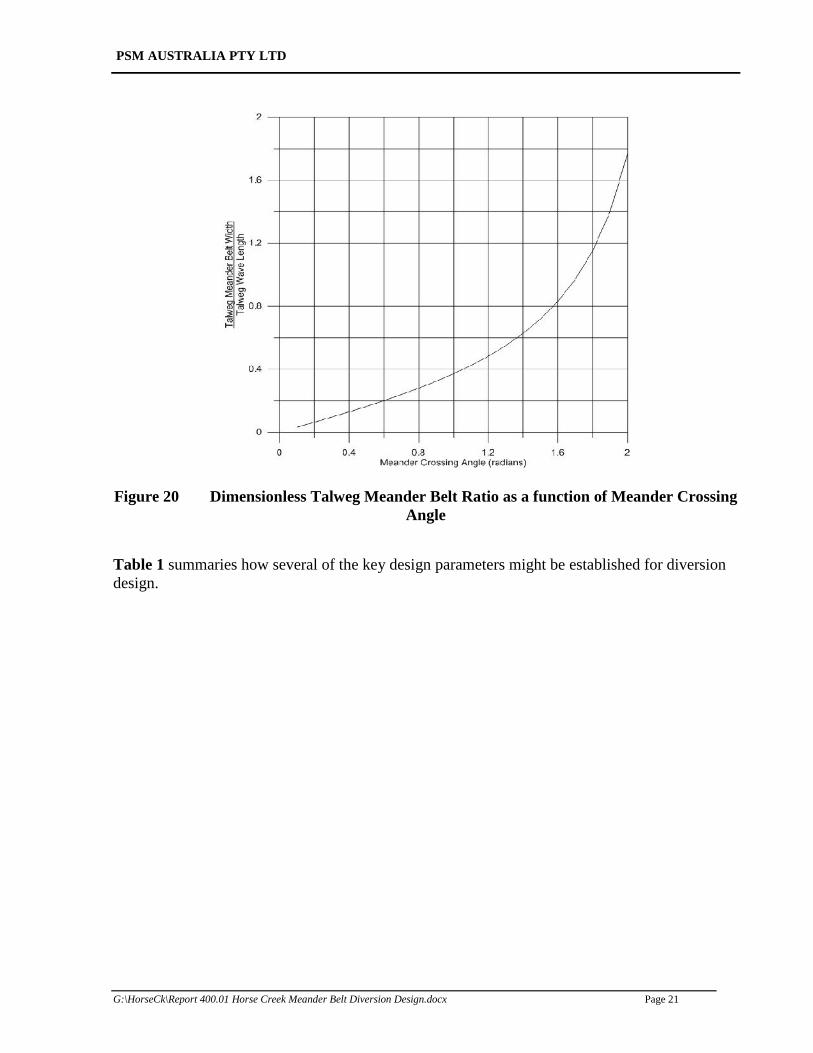
Figure 20 established by numerical application of (1) plots /mW L as a function of 0 .⋅The required minimum floodplain width, WFP, becomes
( ) 6. 1 10FB m mW B (6)
where the additive 10m is to allow access about the meander apexes.
A key feature of this analysis is that the meander pattern is uniquely specified by any physicallyrealistic combination of crossing angle and meander channel Top width. Since sinuosity andcrossing angle are explicitly related, equation (3), it can equally be stated that meander pattern isuniquely specified by any physically realistic combination of sinuosity and meander channel topwidth. For practical design the meander pattern is uniquely defined by the sinuosity and topwidth. Sinuosity in turn for design is defined by ratio of the proposed valley/floodplain slope tothat of the meander channel.
PSM AUSTRALIA PTY LTD
G:\HorseCk\Report 400.01 Horse Creek Meander Belt Diversion Design.docx Page 20
Figure 19 Geometric characteristics of sine-generated meandering streams. (a) Plot of1 / and / aB R versus ; (b_ Maximum possible value of 0
Sinuosity is also defined by
6.m
L L
B
(4)
and rearranging with L as dependant variable
(6 ).L B (5)
If Ŀ and θo are defined then the meander belt width, mW , is similarly defined.
Figure 20 established by numerical application of (1) plots /mW L as a function of 0 .⋅The required minimum floodplain width, WFP, becomes
( ) 6. 1 10FB m mW B (6)
where the additive 10m is to allow access about the meander apexes.
A key feature of this analysis is that the meander pattern is uniquely specified by any physicallyrealistic combination of crossing angle and meander channel Top width. Since sinuosity andcrossing angle are explicitly related, equation (3), it can equally be stated that meander pattern isuniquely specified by any physically realistic combination of sinuosity and meander channel topwidth. For practical design the meander pattern is uniquely defined by the sinuosity and topwidth. Sinuosity in turn for design is defined by ratio of the proposed valley/floodplain slope tothat of the meander channel.
PSM AUSTRALIA PTY LTD
G:\HorseCk\Report 400.01 Horse Creek Meander Belt Diversion Design.docx Page 21
Figure 20 Dimensionless Talweg Meander Belt Ratio as a function of Meander CrossingAngle
Table 1 summaries how several of the key design parameters might be established for diversiondesign.

PSM AUSTRALIA PTY LTD
G:\HorseCk\Report 400.01 Horse Creek Meander Belt Diversion Design.docx Page 22
Table 1 Definition of key Design Parameters
Parameter Definition/CommentTalweg Slope (m/m) Survey of Existing creek/river.
Nearby streams with similar geology.Consideration of historic and future sedimentloads.
Valley Slope (m/m) Slope of existing valley ORSlope of proposed floodplain through/aboutMine Lease
Sinuosity, (-), Ratio of Valley Slope to Talweg Slope OR Ratioof Talweg length to Valley length
Meander Crossing Angle, (Radians) From (3), Yalin solution sine generationfunction, that is defined by Sinuosity
Meander Channel Width (m) Average Top width of Meander channel
Talweg meander Belt Width Ratio (-)From solution of sine generation function Figure20.
2.3 Meanderbelt Roughness
The DERM diversion stability criteria are in terms of velocity, shear and stream power. For aprescribed floodplain cross section and longitudinal slope increasing roughness reduces thevelocity but increases the depth and therefore bed shear and leaves the (specific) stream power orenergy dissipation per unit of bed area unchanged. Assessment of the floodplain/Meander beltroughness is therefore fundamental to assessing compliance with DERM criteria.
In Australia the majority of stream diversions are associated with open cut mine developments.For some of these topographical lease boundary constraints require the natural floodplain andmain channel be replaced by a shorter narrower floodplain with a more sinuous main channel topreserve main channel slopes with the main channel continuously exploiting the full width of thefloodplain. Such a system is depicted in Figure 21.
With this configuration significant lengths of the main channel are about normal to the flow suchthat in large floods the main channel will contribute little to overall flood capacity.Conservatively, in terms of scour potential at flood depths, it might be ignored.
With the main channel about normal to the floodplain flow hydraulically it repeatedly providesexpansion and contraction to the overpassing flood. The associated head losses are potentially

PSM AUSTRALIA PTY LTD
G:\HorseCk\Report 400.01 Horse Creek Meander Belt Diversion Design.docx Page 23
significant. A basis for incorporating these losses in the calculation of floodplain hydraulics isrequired.
Consider conditions depicted in the vertical section in Figure 22 when floodplain flows passvirtually at right angles over the lowflow channel.
Figure 21 Meander pattern in a fully exploited floodplain
Figure 22 Vertical Section for floodplain flow across the low flow channel

PSM AUSTRALIA PTY LTD
G:\HorseCk\Report 400.01 Horse Creek Meander Belt Diversion Design.docx Page 24
Unless the banks of the lowflow channel are exceptionally flat flow separation will occurengendering a weak up bank flow. The core flow will expand vertically until its depth is limitedby the bed of the main channel or contact with the opposing bank.
The opposing bank acts to contract the flow back to the depth over the floodplain. Everywhereexcept at the apexes of the meanders the floodplain flow passes over the main channel twice inevery meander wave length.
Consistent with convention these contraction and expansion losses can be expressed as a fraction(coefficient) of the velocity head.
Expressing the expansion loss as
2 21 2
2 2x x
V Vh K
g g
(7)
and the contraction loss as
2 23 2
2 2c c
V Vh K
g g
(8)
and since 3V ~ 1V the total form loss is the sum of expansion and contraction loses
2 2
1 2
2 2x c x c
V Vh K K
g g
(9)
Considering Unit width 1 1 2 1 2q V D V D D
then
2
22
1
12
x cx c
K K qh
g D
(10)
where 1 1 2/D D D
or
2
2 11 .2x c x c
Vh K K
g
(11)
This headloss occurs at each crossing of the lowflow channel. For a meander pattern that fullyexploits the floodplain width this headloss occurs twice in each meander wave length except atthe apexes of the meanders. From simple proportion the average crossings per wave length is

PSM AUSTRALIA PTY LTD
G:\HorseCk\Report 400.01 Horse Creek Meander Belt Diversion Design.docx Page 25
2
m
(12)
From Figure 22 and (2) / 1 / 6 . After substitution (12) becomes
12
6 1
(13)
Apply these head losses to a meander wave length the equivalent Manning Roughness can be hadfrom
2 2 2
21 14/3
1
. 12m x c
n V VK K
D g
(14)
which reduces too
4
32 21 . 1
2 x cm
Dn K K
g
(15)
For designed meanders m ~ 6B, eqn (3), so
4
321
12F
x c x c
Dn K K
Bg (16)
That the form roughness, x cn , is significant can be seen from some typical values presented in
Table 2. These were determined using 0.9xK , cK = 0.2, and B = 20
Total floodplain roughness is the sum of the form roughness due to the lowflow channel, x ch ,
and the skin roughness associated with the floodplain which is the total floodplain area less thatoccupied by the lowflow channel. The latter being closely approximated by . . .
The skin roughness area as a ratio, , of the total plan area in a wave length is defined by
1
(17)
where W = W/ is the talweg meander belt width ratio.

PSM AUSTRALIA PTY LTD
G:\HorseCk\Report 400.01 Horse Creek Meander Belt Diversion Design.docx Page 26
Table 2 Main/Lowflow Channel Engendered Form roughness in a fully exploitedFloodplain. B=20, Kx=0.9, Kc=0.2
mD FD x c
2 1 0.02762 0.04024 0.0549
4 2 0.04384 0.06388 0.0872
8 4 0.06958 0.101316 0.01384
Which reduces to
16 1
(18)
For hydraulic calculation the floodplain total roughness would be calculated from
16 1T F x cn n n
(19)
Where values of the "skin" roughness, Fn , might be determined allowing for the effects of both
flow depth and velocity on vegetal roughness, using curves such as those presented by (ChowVen, 1959) or for a floodplain with a mixture of 'rigid' timber and grasses using a constant "skin"roughness.
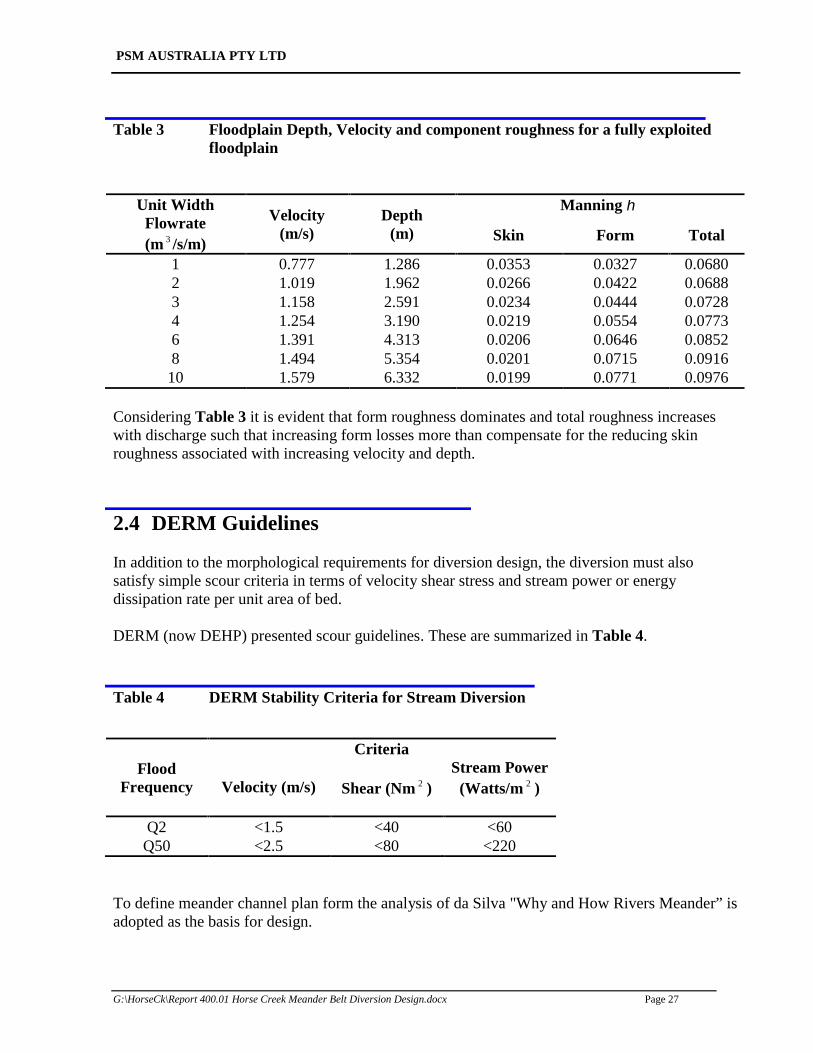
Table 3 presents component and total roughness for a floodplain with a slope of 0.002m/m for arange of unit width discharges and vegetal retardance class B.
PSM AUSTRALIA PTY LTD
G:\HorseCk\Report 400.01 Horse Creek Meander Belt Diversion Design.docx Page 27
Table 3 Floodplain Depth, Velocity and component roughness for a fully exploitedfloodplain
Unit WidthFlowrate(m 3 /s/m)
Velocity(m/s)
Depth(m)
Manning
Skin Form Total
1 0.777 1.286 0.0353 0.0327 0.06802 1.019 1.962 0.0266 0.0422 0.06883 1.158 2.591 0.0234 0.0444 0.07284 1.254 3.190 0.0219 0.0554 0.07736 1.391 4.313 0.0206 0.0646 0.08528 1.494 5.354 0.0201 0.0715 0.0916
10 1.579 6.332 0.0199 0.0771 0.0976
Considering Table 3 it is evident that form roughness dominates and total roughness increaseswith discharge such that increasing form losses more than compensate for the reducing skinroughness associated with increasing velocity and depth.
2.4 DERM Guidelines
In addition to the morphological requirements for diversion design, the diversion must alsosatisfy simple scour criteria in terms of velocity shear stress and stream power or energydissipation rate per unit area of bed.
DERM (now DEHP) presented scour guidelines. These are summarized in Table 4.
Table 4 DERM Stability Criteria for Stream Diversion
FloodFrequency
Criteria
Velocity (m/s) Shear (Nm 2 )Stream Power
(Watts/m 2 )
Q2 <1.5 <40 <60Q50 <2.5 <80 <220
To define meander channel plan form the analysis of da Silva "Why and How Rivers Meander” isadopted as the basis for design.

PSM AUSTRALIA PTY LTD
G:\HorseCk\Report 400.01 Horse Creek Meander Belt Diversion Design.docx Page 28
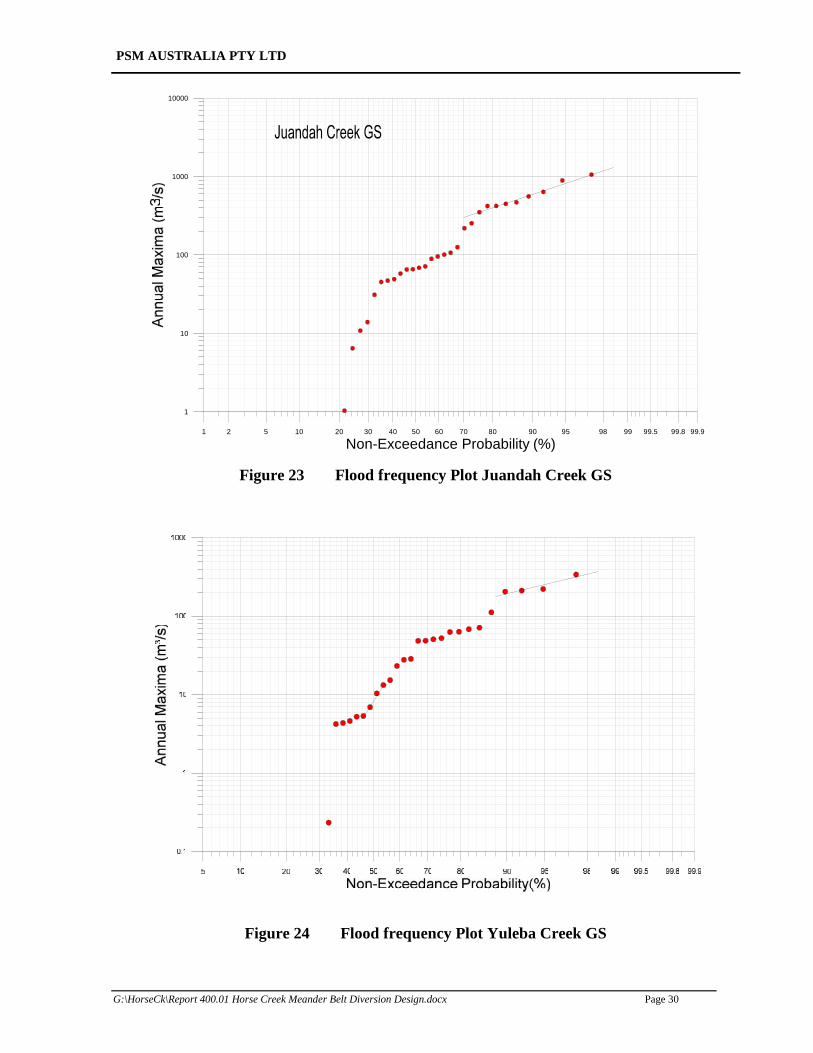
Application of these criteria requires estimator of the Q2 and Q50 discharges. In a separate PSMAustralia study several alternate flood estimation/extrapolation techniques where used to estimatethese and larger design floods and compromise values adopted for design. Since the two nearbygauged catchments have records approaching 50 years, these two records after limitedextrapolation are scaled according to catchment area to the 0.8 power and geometrically averagedfor flow estimates at the up and downstream ends of the lease. Catchment areas are Juandah Ck1678km², Yuleba Ck 1475km², Horse Ck upstream lease boundary 543km², downstreamboundary 664km². The Q2 and Q50 flows are summarized in Table 5. Flood frequency plots areshown in Figure 23 and Figure 24.
Table 5 Horse Creek Design Floods Based on Juandah & Yuleba Ck G.S.
Flood Frequency Upstream Downstream Design
Q2 10.5 11.7 11.1
Q5 68.8 81 75
Q10 156 182 168
Q20 191 224 207
Q50 274 306 290
Q100 334 394 363
Based on the above criteria the proposed final diversion channel has a strongly meanderingupstream segment with a meander channel slope of 0.9m/km in a valley/floodplain with a slopeof 2.02 m/km and a mildly sinuous downstream segment with a slope of 1.1m/km.
For prescribed Q50 design flowrate and floodplain slope, these guidelines can be used to defineacceptable floodplain width depth combinations. For a floodplain wide compared to its depth thevelocity constraint can be interpreted under steady flow conditions as a depth constraint viaManning's equation
32 3
250max . maxv
nD V
s
(20)
Likewise the maximum bed shear can be similarly interpreted as a depth constraint under steadyflow condition viz

PSM AUSTRALIA PTY LTD
G:\HorseCk\Report 400.01 Horse Creek Meander Belt Diversion Design.docx Page 29
maxmax
. .D
j S
(21)
The streampower or more correctly the specific streampower - the rate of energy dissipation perunit area of bed can be interpreted as a minimum floodplain width constraint.
50
50
Q SW
P
(22)
Finally the continuity equation with the velocity constraint provide a constraint equation for thecross sectional area, the product of width and depth viz
5050.
maxso
QW D
V
(23)
PSM AUSTRALIA PTY LTD
G:\HorseCk\Report 400.01 Horse Creek Meander Belt Diversion Design.docx Page 30
Figure 23 Flood frequency Plot Juandah Creek GS
Figure 24 Flood frequency Plot Yuleba Creek GS
1 2 5 10 20 30 40 50 60 70 80 90 95 98 99 99.5 99.8 99.9
Non-Exceedance Probability (%)
1
10
100
1000
10000

PSM AUSTRALIA PTY LTD
G:\HorseCk\Report 400.01 Horse Creek Meander Belt Diversion Design.docx Page 31
3.0 APPLICATION TO HORSE CREEK
For coal resource developments by open cut methods stream diversions are often required toaccess the lowest strip ratio coal under the floodplain. From a mine development perspective thenarrowest and shortest diversion is best since it maximizes dump and infrastructure space.However, as noted in the introduction the minimum stable floodplain width may be set by scourcriteria under floods or by morphological considerations of meander belt width requirements.
For the diversion of Horse Creek within the Elimatta lease design is driven by:
The need to maintain talweg slopes similar to the 1m/km that exists naturally to ensuresediment transport capacity.
Recognition that channel slope and discharge place the existing stream near themeandering-braided threshold such that use of a talweg slope of 0.9m/km will increasethe stability and meandering pattern segment while use of a slope of 1.1m/km willincrease the stability the straight channel alignment segment.
Recognition of the fact that meander pattern is uniquely defined by sinuosity and meanderchannel top width. Sinuosity in turn is defined by the ratio of valley or floodplain slope totalweg slope. The best indicator of stable top width is that of the existing meanderchannel.
The need to cause minimal changes to flood levels up and downstream of the lease.
The final diversion is in place by year 10 of a currently projected 35 year mine life and is theprimary focus of this report however DERM have indicated they require the same level of designrigour be applied to temporary diversion design as well to cover the possibility of premature mineclosure. In this section, design of the final diversion is first developed and then the temporarydiversion designs outlined based on the same methodology.
3.1 Final Diversion
The final diversion which is in place early in mine life has three components: a downstreamsection constructed overfill, a middle section constructed in natural ground at start up and anupstream section constructed over fill during early mine life. Because the diversions over fill aremore problematic they are detailed first.
3.1.1 Upstream Diversion on Fill
Table 1 provides the parameters required to execute a design. The ratio of valley or floodplainslope to main/ lowflow channel slope defines the sinuosity, , required. The sinuosity viaYalin's equation (3) defines the crossing angle, 0 . The meander channel width, B, combined
with the part theoretical part empirical relation (5 ) defines the meander wave length, m .

PSM AUSTRALIA PTY LTD
G:\HorseCk\Report 400.01 Horse Creek Meander Belt Diversion Design.docx Page 32
Crossing angle, 0 , wave length, m , and channel width, B, define the meander belt talweg
width using Figure 20, which is based on numerical integration of (1).
With a reach length of greater than 10km talweg and valley slopes are defined with reasonableprecision so the required sinuosity, , is also defined with reasonable precision.Meander channel width, B, is the second key parameter in the design process. It is not clear theextent to which this might be prescribed or must considered a dependant variable. In temperateclimates channel width has been related to bankfull discharge and the calibre of the sedimentload. It has been found channel width varies with about the square root of bankfull dischargemoving downstream and that channels are wider and shallower for coarser sediments. This isfurther complicated by the propensity for sediment fining moving downstream due to hydraulicsorting and to lesser extent abrasion.
Again in temperate climates the bankfull flood has been found to be about equivalent to the meanannual flood. In the Australian semi-arid the bankfull flood has been found to have asignificantly lower frequency of occurrence. The width of the existing meander channel is anintegration of all the factors that influence this dynamically stable width and provided conditions(flow, sediment load) have not changed likely provides the best indication for the stable width forthe diversion.
To this end some 41 meander channel cross sections were extracted for Horse Creek. Thelocation of these is shown in Figure 25. Figure 26 provides a histogram of width values.Figure 27 provides the distribution of depths. For design a top width of 30m and a depth of 4.5mhave been adopted. Both are well within the range of observe values.
Allowing for a ~2m drop in the lowflow channel invert through the upstream transition results ina 7.7m fall over the 3.82km diversion or fill length. This provides a floodplain slope of2.02m/km. To achieve a lowflow channel Talweg slope of 0.9m/km requires a sinuosity of 2.24.Figure 21 illustrates the "Da Silva" meander pattern with a total floodplain width of 210m.
Table 6 compares computed scour potential parameter values with the DERM guidelines.
Table 6 Comparison of Diversion on Fill hydraulic stability parameters with DERMguidelines
FlowFrequency
Flow Rate(m³/s)
Basis Velocity (m/s) Shear (N/m²) Streamflow(W/m²)
Q2 11.1 Guideline <1.5 <40 <60Design 0.57 24.7 7.6
Q50 290 Guideline <2.5 <80 <220Design 0.86 26.0 22.3

PSM AUSTRALIA PTY LTD
G:\HorseCk\Report 400.01 Horse Creek Meander Belt Diversion Design.docx Page 33
3.1.2 Middle Diversion in Natural Ground
The middle segment of the final diversion is constructed at mine startup in natural ground andconsists of a ~ 200m wide floodplain on a slope of 1.25m/km with a mildly sinuous lowflowchannel with a slope of 1.1m/km and sinuosity of 1.14.
These slopes are selected based on the Leopold & Wolman and Lane plan form relations, Figure14 and Figure 15. The lowflow channel cross-section is the same as that for the highly sinuousfill sections. Table 7 compares design with the DERM guidelines.
Table 7 Comparison of Diversion Natural Ground Stability Parameters with DERMGuidelines
FlowFrequency
Flow Rate(m³/s)
Basis Velocity (m/s) Shear (N/m²) Power
Q2 11 Guideline <1.5 <40 <60Design 0.52 13 128
Q50 290 Guideline <2.5 <80 <220Design 2.25 36.3 97

PSM AUSTRALIA PTY LTD
G:\HorseCk\Report 400.01 Horse Creek Meander Belt Diversion Design.docx Page 34
Figure 25 Meander Channel Cross Sectional Location

PSM AUSTRALIA PTY LTD
G:\HorseCk\Report 400.01 Horse Creek Meander Belt Diversion Design.docx Page 35
Figure 26 Histogram of Meander Channel Top Widths
Figure 27 Histogram of Meander Channel Depths
12 16 20 24 28 32 36 40 44 48 52 56 60 64 68Meander Channel Top Width (m)
0
2
4
6
8
10
NumberinWidthClass(-)
DesignTop
Width(m)=30
DesignDepth
(m)=4.5
PSM AUSTRALIA PTY LTD
G:\HorseCk\Report 400.01 Horse Creek Meander Belt Diversion Design.docx
Page 36
4.0 TRANSITION DESIGN
Transitions about the up and downstream lease boundaries are required to minimize effluxupstream and induced scour potential downstream. A transition is also required for the smallertributaries that join Horse Creek from the west midway through the lease. Design of the upstreamtransition, the most important, is developed in this section as an example.
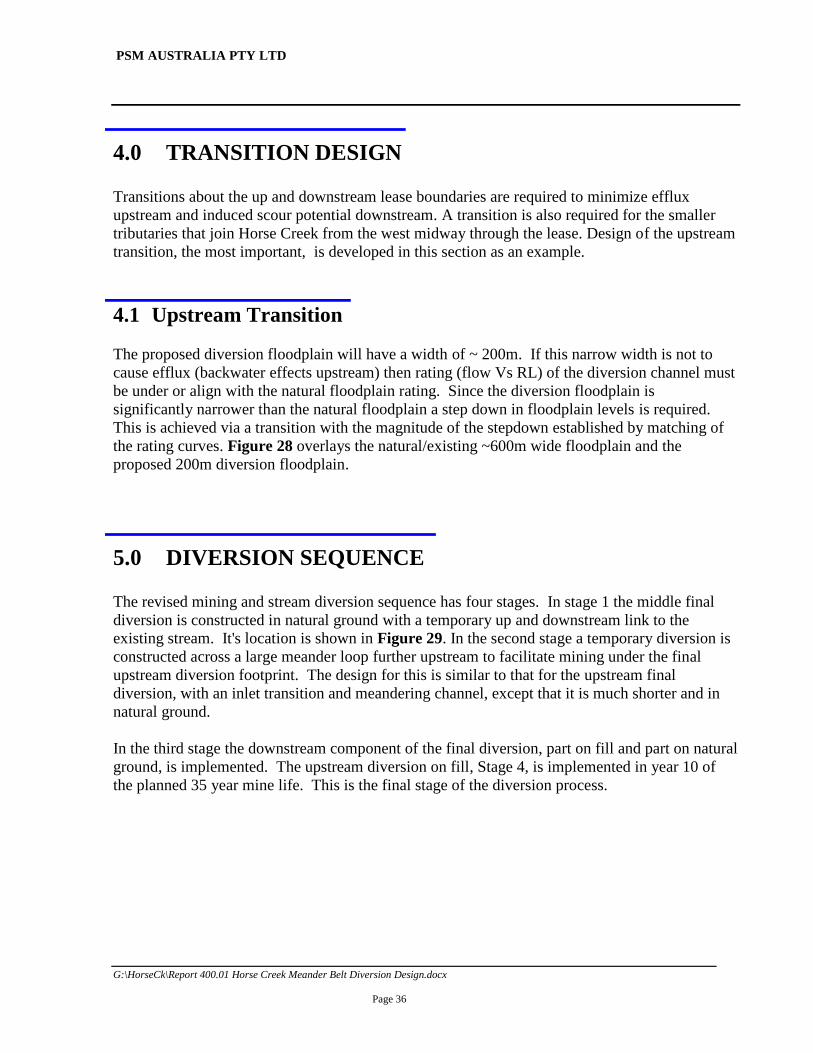
4.1 Upstream Transition
The proposed diversion floodplain will have a width of ~ 200m. If this narrow width is not tocause efflux (backwater effects upstream) then rating (flow Vs RL) of the diversion channel mustbe under or align with the natural floodplain rating. Since the diversion floodplain issignificantly narrower than the natural floodplain a step down in floodplain levels is required.This is achieved via a transition with the magnitude of the stepdown established by matching ofthe rating curves. Figure 28 overlays the natural/existing ~600m wide floodplain and theproposed 200m diversion floodplain.
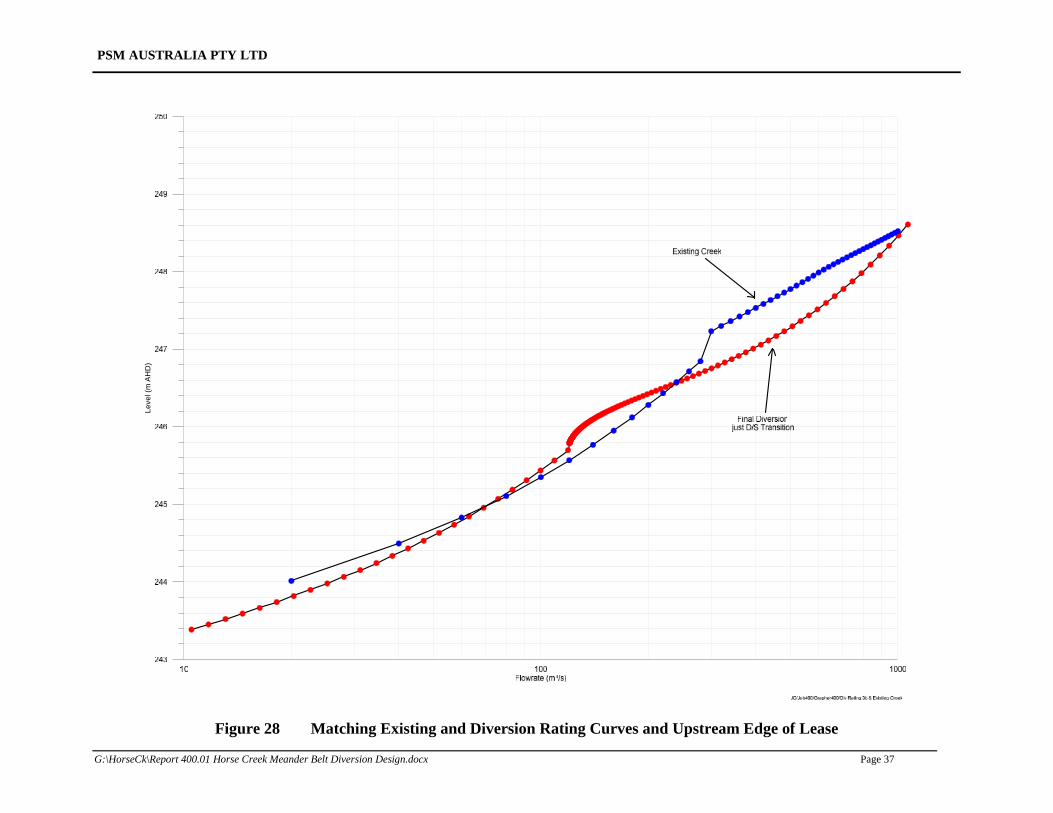
5.0 DIVERSION SEQUENCE
The revised mining and stream diversion sequence has four stages. In stage 1 the middle finaldiversion is constructed in natural ground with a temporary up and downstream link to theexisting stream. It's location is shown in Figure 29. In the second stage a temporary diversion isconstructed across a large meander loop further upstream to facilitate mining under the finalupstream diversion footprint. The design for this is similar to that for the upstream finaldiversion, with an inlet transition and meandering channel, except that it is much shorter and innatural ground.
In the third stage the downstream component of the final diversion, part on fill and part on naturalground, is implemented. The upstream diversion on fill, Stage 4, is implemented in year 10 ofthe planned 35 year mine life. This is the final stage of the diversion process.
PSM AUSTRALIA PTY LTD
G:\HorseCk\Report 400.01 Horse Creek Meander Belt Diversion Design.docx Page 37
Figure 28 Matching Existing and Diversion Rating Curves and Upstream Edge of Lease
Leve
l(m
AH
D)
PSM AUSTRALIA PTY LTD
G:\HorseCk\Report 400.01 Horse Creek Meander Belt Diversion Design.docx Page 38
Figure 29 Diversion Development Sequence

PSM AUSTRALIA PTY LTD
G:\HorseCk\Report 400.01 Horse Creek Meander Belt Diversion Design.docx Page 39
6.0 REFERENCES
(1) BLENCH, T. (1969). Mobile-Bed Fluviology, Edmonton, Alberta, Canada, TheUniversity of Alberta Press.
(2) BOGARDI, J. (1974). Sediment Transport in Alluvial Streams.(3) CHANG, H. H. (1988). Fluvial processes in river engineering, New York, Wiley.(4) CHOW VEN, T. (1959). Open-channel hydraulics : international student ed, Tokyo etc.(5) GARDE, R. J. & RAJU, K. G. R. (1977). Mechanics of sediment transportation and
alluvial stream problems, New Dehli, Wiley Eastern.(6) KNIGHTON, D. (1998). Fluvial Forms & Processes - A New Perspective, London,
Arnold.(7) LANE, E. W. (1957). A study of the shape of channels formed by natural streams flowing
in erodible material. M.R.D. Sediment, Series No. 9.(8) LEOPOLD, L. B., MILLER, J. P. & WOLMAN, M. G. (1964). Fluvial processes in
geomorphology, San Francisco, Freeman.(9) LEOPOLD, L. B. & WOLMAN, M. G. (1957). River channel patterns; braided
meandering and straight. U.S Geological Survey, Professional Paper 282-B.(10) LEOPOLD, L. B. W., M.GORDON; MILLER, JOHN P (1992). Fluvial Processes in
Geomorphology, Mineola, N.Y., Dover Publications.(11) SCHUMM, S. (1977). The Fluvial System, Canada, John Wiley & Sons.(12) ZELLER, J. (1967). Meandering channels in Switzerland. In: Symposium on River
Morphology, 1967 Bern. IASH.