Embed Size (px)
Citation preview
1
APPLICATION OF CIRCULATING FLUIDIZED BED (CFB) TO
A WASTE TO ENERGY (WTE) PLANT IN HONG KONG
JUN DONG
Advisors: Professor Nickolas J. Themelis, and A.C. Bourtsalas
Earth and Environmental Engineering, Columbia University
Department of Earth and Environmental Engineering
Fu Foundation School of Engineering & Applied Science
Columbia University
December 2018
Research Sponsored by
2
EXECUTIVE SUMMARY
The objective of this study was to analyze the current waste situation in Hong
Kong, and discuss the pre-feasibility of implementing a waste to energy plant in Hong
Kong.
Hong Kong, one of China’s most developed regions, has a population of 7.3
million and generated 5.74 million tons (0.79 tons per capital) of municipal solid waste
(MSW) in 2015, with an annual increase of roughly 2% in the last few years. Hong Kong
is faced with a scarcity of land and three of Hong Kong’s largest landfills, including the
South East New Territories Landfill (SENT), are expected to be full by the end of 2019.
The technology of Circulating Fluid Bed (CFB) for energy recovery from MSW
(waste to energy or WTE) is an alternative to the moving grate combustion technology.
First, it would reduce the volume of MSW by up to 90% through combustion, solving the
most urgent problem of land scarcity. Second, energy would be recovered and then be
used for electricity generation, thus reducing the consumption of non-renewable coals.
Third, emission of methane, a potent greenhouse gas and a normal phenomenon in
landfills, would be prevented.
The Bubbling Fluidized Bed (BFB) and Circulating Fluidized Bed (CFB) boiler,
were analyzed and compared in this study. In addition, the final site and transportation
method were examined during this study. Possible ways to increase public acceptance of
WTE in Hong Kong are also discussed.
ACKNOWLEDGEMENTS
I would like to thank my advisor Professor Nickolas J. Themelis for his invaluable support
and guidance during this research. I would also like to thank my mother, Taiyi Duan, for
her continuous encouragement and support throughout my academic career.
3
TABLE OF CONTENTS
EXECUTIVE SUMMARY …….…………………………………………………... 2
ACKNOWLEDGEMENTS ………………………………………………………... 2
LIST OF FIGURES ………………………………………………………………... 6
LIST OF TABLES …………………………………………………………………. 8
1. INTRODUCTION ……………………………………………………………… 9
1.1 Current Waste Management in Hong Kong ………………………..……… 9
1.2 Population and Economic Level in Hong Kong ……………………..…… 10
2. GENERATION OF SOLID WASTE IN HONG KONG ……… ………..… 11
2.1 Definition of Various Types of Solid Waste in HK …. ………………..... 11
2.2 Municipal Solid Waste (MSW) ……………………… …………………... 14
2.2.1 Definition of MSW …………………………………………… ….. 14
2.2.2 Composition of Landfilled MSW in HK ……………………………15
2.2.3 Recycled and Non-recycled Material …………………………… 17
2.2.4 MSW Recovered Situation ……………………………………… . 19
2.2.5 Moisture Content in MSW ………………………………………….. 22
2.2.6 Method of Processing MSW ………………………………………... 23
2.3 Government Initiatives in Waste Reduction and Recycling ………………… 26
3. PLASTIC WASTE IN HONG KONG ………………………………………... 27
3.1 Definition of Plastic ………………………………………………………… 27
3.2 Plastic Waste in China …………………………………………………… 30
3.3 Hong Kong’s Role in Waste Plastic Market …………………………………31
3.3.1 Importer …………………………………………………………….. 31
3.3.2 Exporter …………………………………………………………….. 32
3.4 Plastic Recycling in Hong Kong …………………………………………… 34
3.5 Plastic Recovered Situation in Hong Kong …………………………………. 36
3.6 Major Challenges in Handling Plastic Waste ……………………..………... 37
4. FLUIDIZED BED COMBUSTION (FBC) TECHNOLOGIES …………….. 38
4
4.1 Bubbling Fluidized Bed (BFB) ……………………………………………... 38
4.1.1 Introduction …………………………………………………………. 38
4.1.2 Babcock & Wilcox Enterprises, Inc. BFB …………………………... 38
4.2 Circulating Fluidized Bed (CFB) …………………………………………… 40
4.2.1 Introduction …………………………………………………………. 40
4.2.2 Zhejiang University CFB …………………………………………… 40
4.2.3 Advantages of CFB …………………………………………………. 43
4.3 Comparation of BFB and CFB ……………………………………………… 43
5. PRE-FEASIBILITY ANALYSIS OF CFB WTE PLANT IN HK ……… 45
5.1 Advantages of using CFB WTE plant ………………………………………. 45
5.2 Regulations …………………………………………………………………. 46
5.3 Heating Value ……………………………………………………………….. 47
5.3.1 High Heating Value (HHV) …………………………………………. 47
5.3.2 Low Heating Value (LHV) ………………………………………….. 48
5.4 R1 Formula …………………………………………………………………. 49
5.5 Site Selection ……………………………………………………………….. 51
5.6 Transportation ………………………………………………………………. 55
6. CONCLUSIONS AND RECONMENDATIONS …………………………… 56
6.1 Conclusions ……...………………………………………………………….. 56
6.2 Major Constraints on Waste Recovery/ Recycling ………………………….. 56
6.3 Use the plant as Visitors/Education Center ………………………..……….. 57
7. REFERENCES ………………………………………………………………... 59
8. APPENDIX I: CALCULATIONS
LIST OF FIGURES
5
Figure 1: Economic Freedom Score of Hong Kong 2018 ……………………..….... 11
Figure 2: Distribution of Hong Kong solid waste in 2016 ……………….…..….…. 13
Figure 3: Distribution of each composition of Landfilled MSW in 2015 …….……. 17
Figure 4: Annual amount of Landfilled MSW vs. Recovered MSW in HK ……..… 21
Figure 5: MSW annual recovered rate in HK …………………………………..….. 22
Figure 6: Amount and Composition of MSW in HK in 2015 ,,,2015……………… 23
Figure 7: Location of Existing Strategic Landfills in Hong Kong …………………..25
Figure 8: Top 5 importers of plastic waste to China, based on financial transactions.30
Figure 9: Top 5 importers of plastic waste worldwide ………………………..….…. 31
Figure 10: World exports of recovered plastics to China including HK ……..….…. 32
Figure 11: Top 5 exporters of plastic waste worldwide ……………………..…….... 33
Figure 12: Amount of Annual Recycled vs. Exported Plastic Waste in HK ….….… 34
Figure 13: Hand Sorting of Recyclables in HK ………………………………..…... 35
Figure 14: Distribution of Recovered MSW in Hong Kong, 2015 ………………… 36
Figure 15: Annual Amount of recovered plastic from 2006 to 2016 in HK …..…… 37
Figure 16: B&W Bottom-Supported BFB Boiler …………………………………… 40
Figure 17: Layout of 800 t/d CFB incinerator at Cixi city, China ……………….…. 41
Figure 18: Location of shredders in WTE bunker ………………………………….. 42
Figure 19: Route from Tai Chik Sha to SENT Landfill of Hong Kong …………..... 52
Figure 20: Location of SENT in HK ……………………………………………….. 53
Figure 21: Photograph of SENT Landfill in HK ……………………….....…………. 53
Figure 22: Location of Power stations in Hong Kong …………………..………..…. 54
6
Figure 23: Distance from SENT Landfill to CLP Power Station ……………..……. 55
LIST OF TABLES
Table 1: Annual solid waste disposed of at Hong Kong landfills …………………. 12
Table 2: Percentage of MSW Landfills in HK from 2004 to 2016 ………………….. 14
Table 3: Composition of Hong Kong MSW delivered to landfills ………………….. 15
Table 4: Description of Recyclable Materials in HK ………………………………... 16
Table 5: Description of Non-Recyclable Materials in HK ………………..………... 18
Table 6: Composition of recovered municipal solid waste in HK …………………... 19
Table 7: Description of Closed Landfills in Hong Kong ……………………………. 23
Table 8: Description of Strategic landfills in use in Hong Kong ……………………. 24
Table 9: Resin Identification Code ………………………………………………….. 27
Table 10: Comparation of BFB and CFB Design Parameters ………………………. 43
Table 11: Hong Kong Air Quality Objectives (AQOs) ………………………..…… 45
Table 12: High Heating Values ……………………………………………..……… 46
Table 13: High heating value (HHV) of dry HK MSW ……………………………... 47
Table 14: Energy balance of WTE plant …………………………………………….. 49
Table 15: Mass balance of WTE plant ………………………………………………. 49
7
1. INTRODUCTION
1.1 Current Waste Management in Hong Kong
The amount of waste generation in Hong Kong has exceeded early projections. When
the three-landfill strategy was implemented in 1993, the amount of waste processed daily
by landfills was expected to increase from 12,500 tons per day in 1989, to 14,000 tons per
day in 1997 and 16,700 tons per day in 2001. However, the three strategic landfills already
received 16,000 tons of waste per day by 1997. The landfill sites have filled up faster than
anticipated. If this trend continues, the landfills will not be lasting until 2020 as they were
designed for.
For decades, China was the world’s largest importer of waste. In 2016, China took 51%
of the 15 million tons of plastic recyclables exported globally1. Hong Kong has no internal
market for plastic waste, therefore, it is exporting most of the imported and locally
collected plastic wastes. According to world news, until last year, Hong Kong exported
over 90% of the imported and collected recyclables to mainland China 2 . As a
cosmopolitan metropolis, Hong Kong boasts glittering skyscrapers, seamless
transportation and billion-dollar infrastructure projects, but it also struggling with the
waste disposal problem. The main reason why it is hard for the local government to deal
with the recyclable stream is that Hong Kong has not the land needed to develop an
effective recycling industry, in the meantime, it has done little to develop alternatives to
landfilling.
As of January 1, 2018, China effectively banned imports of 24 types of unprocessed
rubbish from other countries. China’s ban on importing waste means cutting down the
main channel of waste disposal in countries such as EU, U.S, UK, etc. Faced with this
challenge, many different ideas have emerged, the European Union was planning to levy a 1 The world is scrambling now that China is refusing to be a trash dumping ground, Reporting by Farah Master; additional reporting by Chermaine Lee and Wyman Ma; Editing by Philip McClellan, Jan 31, 2018, web source: https://www.reuters.com/article/us-hongkong-rubbish/hong-kong-drowning-in-waste-as-china-rubbish-ban-takes-toll-idUSKBN1FK0J4 2 Hong Kong drowning in waste as China rubbish ban takes toll, Reporting by Farah Master; additional reporting by Chermaine Lee and Wyman Ma; Editing by Philip McClellan, Jan 31, 2018, web source: https://www.reuters.com/article/us-hongkong-rubbish/hong-kong-drowning-in-waste-as-china-rubbish-ban-takes-toll-idUSKBN1FK0J4
8
tax on plastics usage, the U.K. was looking to divert some of its trash to Southeast Asia,
and the U.S. asked China to lift its ban. However, none of those suggestions are long-term
solutions to the new global problems in waste management.
The objective of this study was to characterize and quantify Hong Kong’s plastic
waste and to assess the potential technologies for Hong Kong’s waste. Two technologies,
Bubbling Fluidized Bed (BFB) and Circulating Fluidized Bed (CFB), were compared and
analyzed in this paper.
1.2 Population and Economic Level of Hong Kong
Hong Kong is an autonomous territory on the eastern side of the Pearl River
estuary in East Asia, on the south of the Chinese province of Guangdong, and east of the
former Portuguese colony and special administrative region of Macau. It is strategically
located at the mouth of the Pearl River delta in Southern China. All major cities in East
and Southeast Asia, such as Beijing, Shanghai, Tokyo, Seoul and Singapore are within a
few hours’ flight. With a population of 7.3 million (Source from: World Bank 20163),
Hong Kong residents occupy a territory of 1,104 square kilometers, Hong Kong is the
fourth-most densely populated region in the world. Moreover, this bustling city also
features lush green hillsides, secluded beaches, leisurely rural landscape and rocky
coastline4.
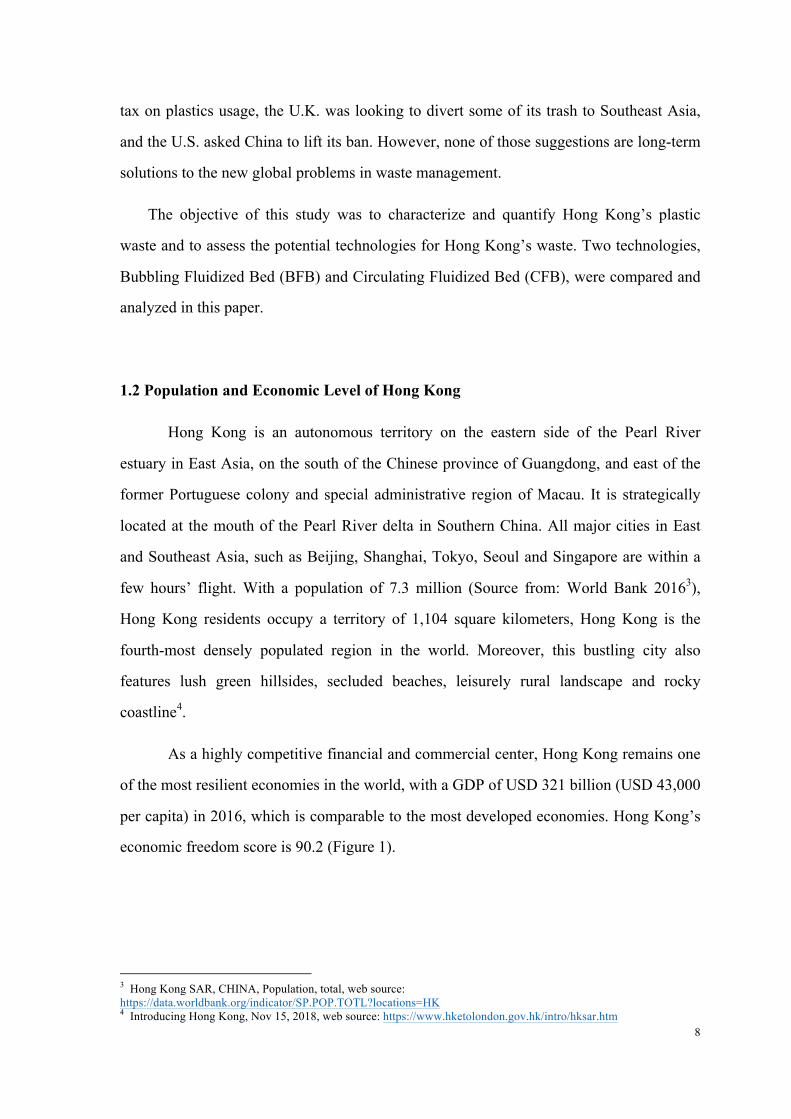
As a highly competitive financial and commercial center, Hong Kong remains one
of the most resilient economies in the world, with a GDP of USD 321 billion (USD 43,000
per capita) in 2016, which is comparable to the most developed economies. Hong Kong’s
economic freedom score is 90.2 (Figure 1).
3 Hong Kong SAR, CHINA, Population, total, web source: https://data.worldbank.org/indicator/SP.POP.TOTL?locations=HK 4 Introducing Hong Kong, Nov 15, 2018, web source: https://www.hketolondon.gov.hk/intro/hksar.htm
9
Figure 1: “Economic Freedom Score” of Hong Kong in 2018
(Source: Miller 2018)
2. SOLID WASTE IN HONG KONG
2.1 Definition of Various Types of Solid Waste in HK
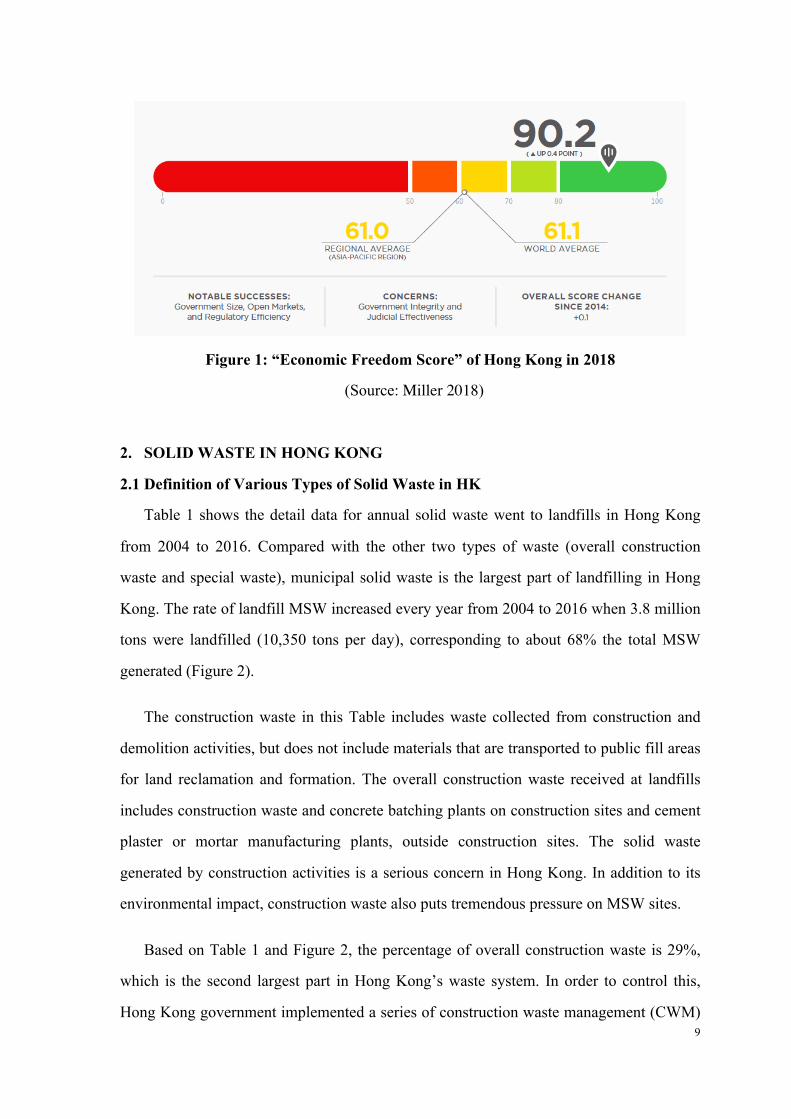
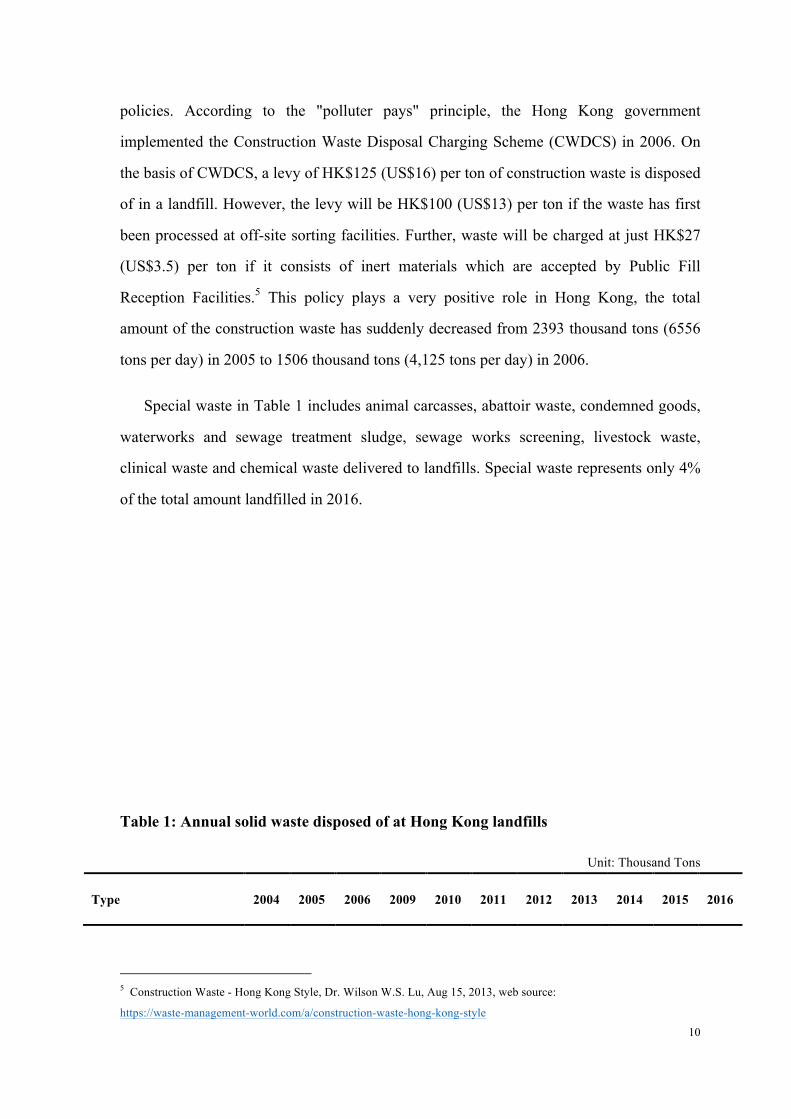
Table 1 shows the detail data for annual solid waste went to landfills in Hong Kong
from 2004 to 2016. Compared with the other two types of waste (overall construction
waste and special waste), municipal solid waste is the largest part of landfilling in Hong
Kong. The rate of landfill MSW increased every year from 2004 to 2016 when 3.8 million
tons were landfilled (10,350 tons per day), corresponding to about 68% the total MSW
generated (Figure 2).
The construction waste in this Table includes waste collected from construction and
demolition activities, but does not include materials that are transported to public fill areas
for land reclamation and formation. The overall construction waste received at landfills
includes construction waste and concrete batching plants on construction sites and cement
plaster or mortar manufacturing plants, outside construction sites. The solid waste
generated by construction activities is a serious concern in Hong Kong. In addition to its
environmental impact, construction waste also puts tremendous pressure on MSW sites.
Based on Table 1 and Figure 2, the percentage of overall construction waste is 29%,
which is the second largest part in Hong Kong’s waste system. In order to control this,
Hong Kong government implemented a series of construction waste management (CWM)
10
policies. According to the "polluter pays" principle, the Hong Kong government
implemented the Construction Waste Disposal Charging Scheme (CWDCS) in 2006. On
the basis of CWDCS, a levy of HK$125 (US$16) per ton of construction waste is disposed
of in a landfill. However, the levy will be HK$100 (US$13) per ton if the waste has first
been processed at off-site sorting facilities. Further, waste will be charged at just HK$27
(US$3.5) per ton if it consists of inert materials which are accepted by Public Fill
Reception Facilities.5 This policy plays a very positive role in Hong Kong, the total
amount of the construction waste has suddenly decreased from 2393 thousand tons (6556
tons per day) in 2005 to 1506 thousand tons (4,125 tons per day) in 2006.
Special waste in Table 1 includes animal carcasses, abattoir waste, condemned goods,
waterworks and sewage treatment sludge, sewage works screening, livestock waste,
clinical waste and chemical waste delivered to landfills. Special waste represents only 4%
of the total amount landfilled in 2016.
Table 1: Annual solid waste disposed of at Hong Kong landfills
Unit: Thousand Tons
Type 2004 2005 2006 2009 2010 2011 2012 2013 2014 2015 2016
5 Construction Waste - Hong Kong Style, Dr. Wilson W.S. Lu, Aug 15, 2013, web source:
https://waste-management-world.com/a/construction-waste-hong-kong-style
11
MSW: 3399 3423 3387 3271 3603 3284 3386 3485 3570 3708 3778
(1) Domestic 2569 2492 2421 2195 2239 2180 2294 2321 2343 2359 2332
(2) Commercial 611 692 753 846 858 861 825 879 936 1023 1106
(3) Industrial 219 239 213 230 229 242 267 285 292 326 339
Overall construction W 2407 2393 1506 1139 1308 1216 1256 1311 1439 1533 1613
Special waste 591 637 597 454 408 413 411 428 414 271 204
Total 6389 6453 5489 4864 5320 4912 5053 5224 5424 5512 5595
(Source: Hong Kong Environmental Protection Department, Web Source: www.epd.gov.hk)
Figure 2: Distribution of Hong Kong solid waste in 2016
2.2 Municipal Solid Waste in HK
2.2.1 Definition of MSW
Overall construction
waste 29%
Special waste 4% Municipal
solid waste 67%
12
Domestic, commercial and industrial wastes are collectively referred to as municipal
solid waste (MSW) in HK. Domestic solid waste, which comes from households and
public areas, including waste collected from residential buildings, litter bins, streets,
marine areas and country parks; Commercial solid waste, which comes from shops,
restaurants, hotels, offices and markets in private housing estates; Industrial solid waste,
which is generated by all industrial activities, but does not include construction and
demolition waste, chemical waste or other special waste.6
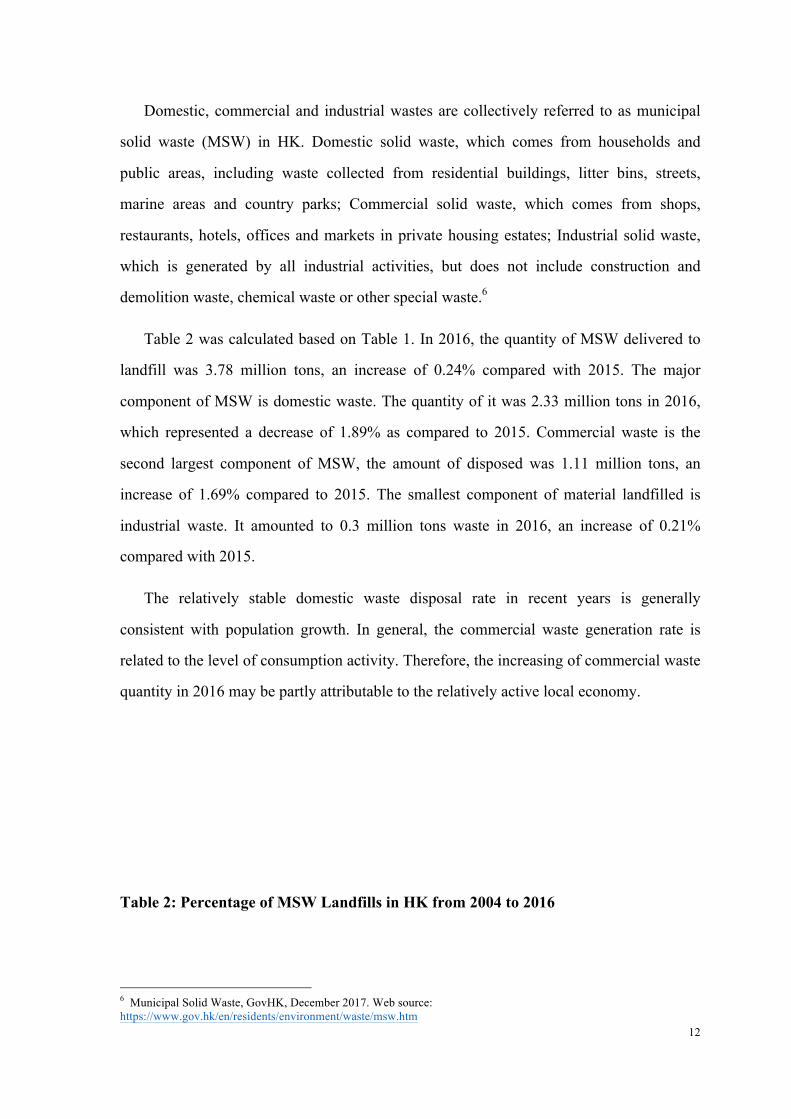
Table 2 was calculated based on Table 1. In 2016, the quantity of MSW delivered to
landfill was 3.78 million tons, an increase of 0.24% compared with 2015. The major
component of MSW is domestic waste. The quantity of it was 2.33 million tons in 2016,
which represented a decrease of 1.89% as compared to 2015. Commercial waste is the
second largest component of MSW, the amount of disposed was 1.11 million tons, an
increase of 1.69% compared to 2015. The smallest component of material landfilled is
industrial waste. It amounted to 0.3 million tons waste in 2016, an increase of 0.21%
compared with 2015.
The relatively stable domestic waste disposal rate in recent years is generally
consistent with population growth. In general, the commercial waste generation rate is
related to the level of consumption activity. Therefore, the increasing of commercial waste
quantity in 2016 may be partly attributable to the relatively active local economy.
Table 2: Percentage of MSW Landfills in HK from 2004 to 2016
6 Municipal Solid Waste, GovHK, December 2017. Web source: https://www.gov.hk/en/residents/environment/waste/msw.htm
13
Type 2004 2005 2006 2009 2010 2011 2012 2013 2014 2015 2016
Domestic 75.58% 72.82% 71.49% 67.11% 62.15% 66.40% 67.75% 66.61% 65.61% 63.63% 61.74%
Commercial 17.97% 20.21% 22.22% 25.87% 23.82% 26.23% 24.36% 25.22% 26.22% 27.59% 29.28%
Industrial 6.45% 6.97% 6.28% 7.02% 6.35% 7.37% 7.89% 8.17% 8.17% 8.78% 8.99%
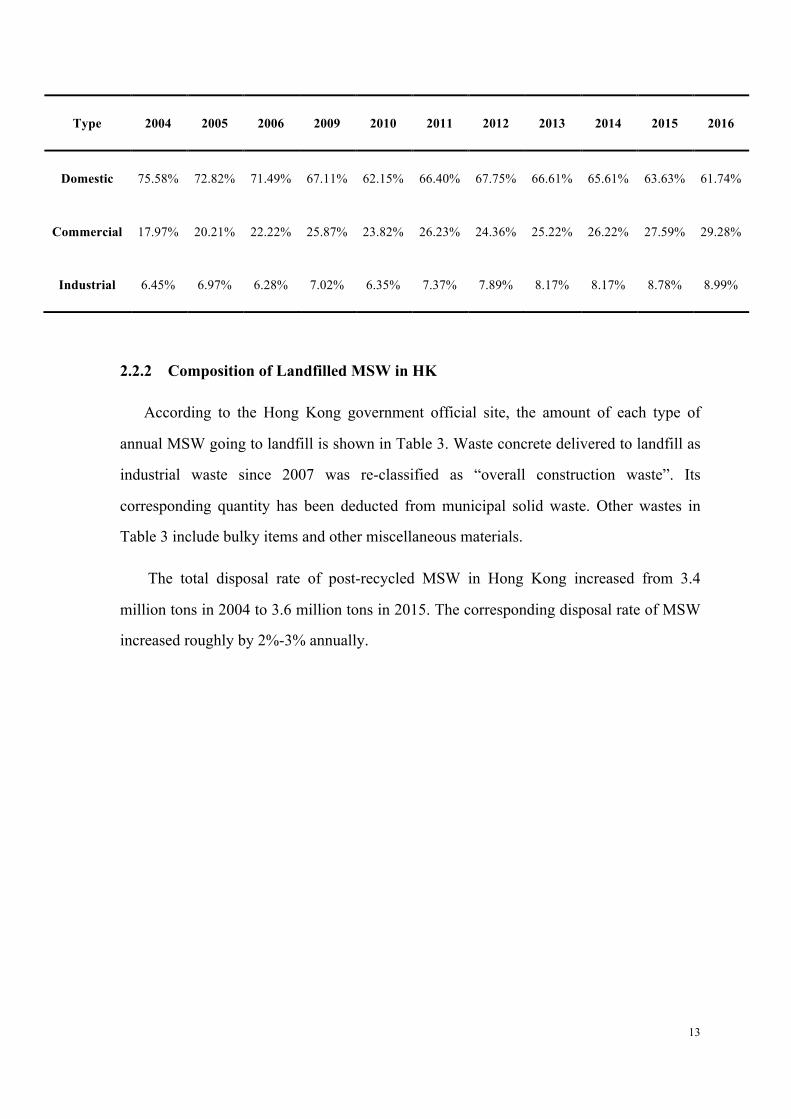
2.2.2 Composition of Landfilled MSW in HK
According to the Hong Kong government official site, the amount of each type of
annual MSW going to landfill is shown in Table 3. Waste concrete delivered to landfill as
industrial waste since 2007 was re-classified as “overall construction waste”. Its
corresponding quantity has been deducted from municipal solid waste. Other wastes in
Table 3 include bulky items and other miscellaneous materials.
The total disposal rate of post-recycled MSW in Hong Kong increased from 3.4
million tons in 2004 to 3.6 million tons in 2015. The corresponding disposal rate of MSW
increased roughly by 2%-3% annually.
14
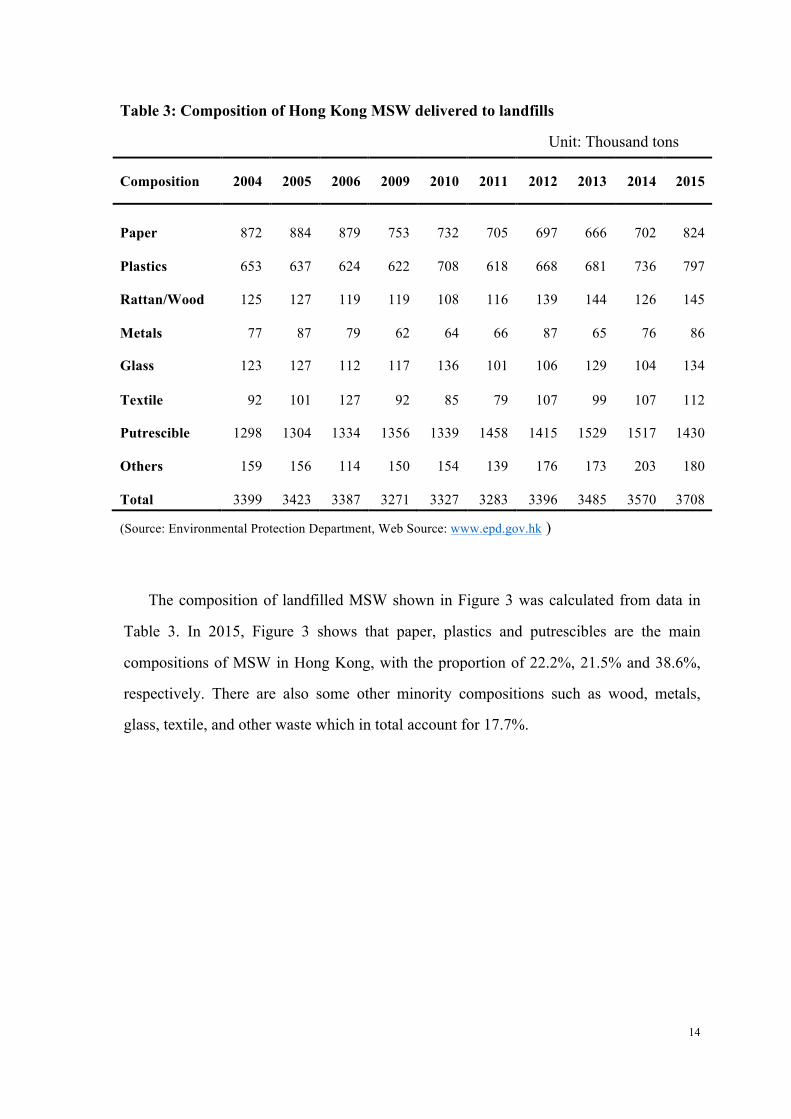
Table 3: Composition of Hong Kong MSW delivered to landfills
Unit: Thousand tons
Composition 2004 2005 2006 2009 2010 2011 2012 2013 2014 2015
Paper 872 884 879 753 732 705 697 666 702 824
Plastics 653 637 624 622 708 618 668 681 736 797
Rattan/Wood 125 127 119 119 108 116 139 144 126 145
Metals 77 87 79 62 64 66 87 65 76 86
Glass 123 127 112 117 136 101 106 129 104 134
Textile 92 101 127 92 85 79 107 99 107 112
Putrescible 1298 1304 1334 1356 1339 1458 1415 1529 1517 1430
Others 159 156 114 150 154 139 176 173 203 180
Total 3399 3423 3387 3271 3327 3283 3396 3485 3570 3708
(Source: Environmental Protection Department, Web Source: www.epd.gov.hk )
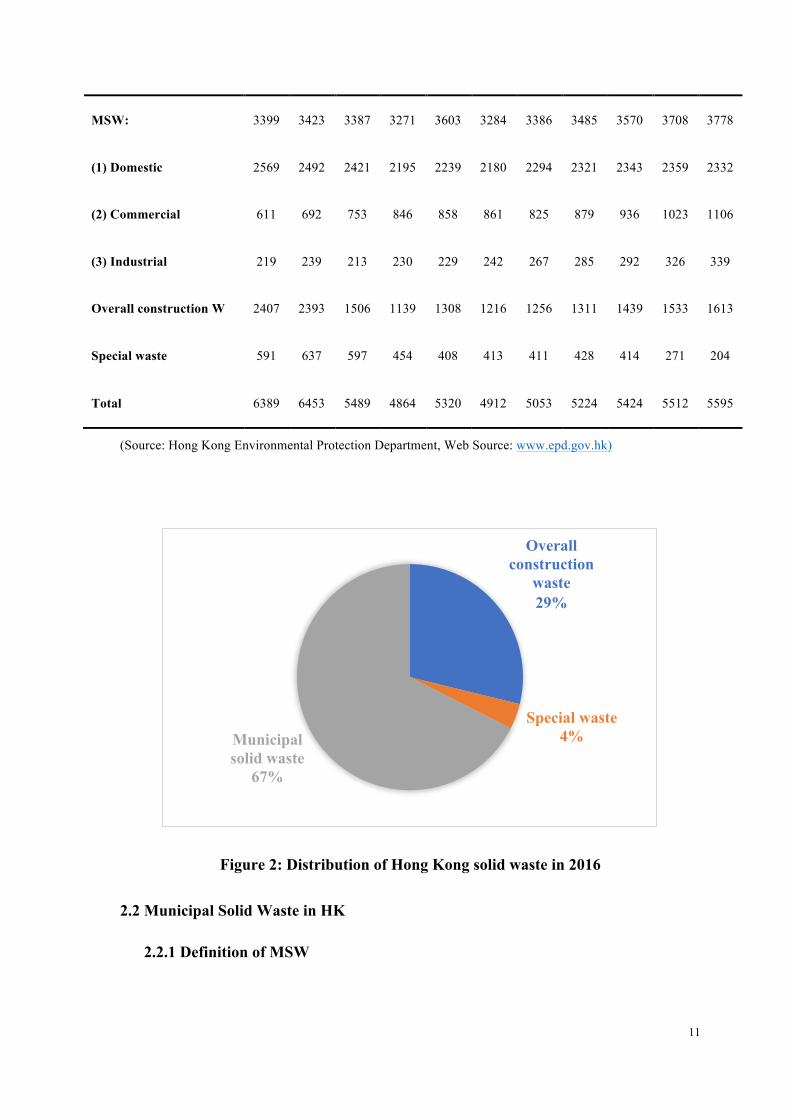
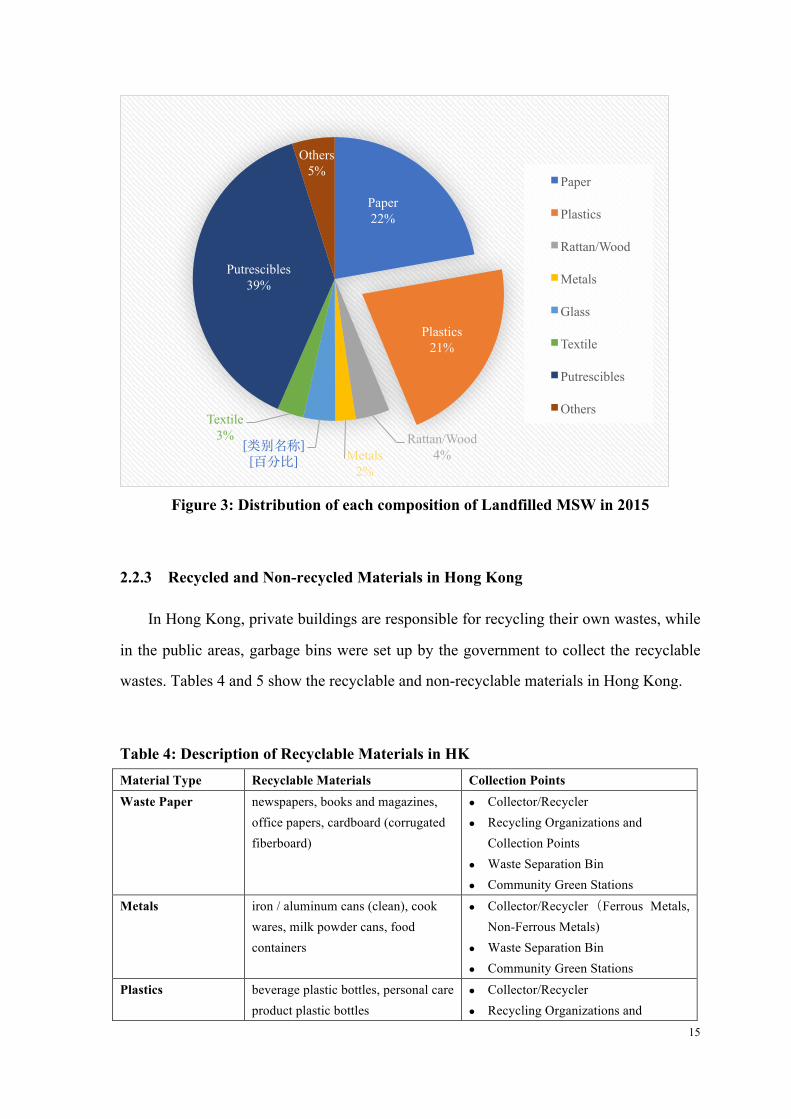
The composition of landfilled MSW shown in Figure 3 was calculated from data in
Table 3. In 2015, Figure 3 shows that paper, plastics and putrescibles are the main
compositions of MSW in Hong Kong, with the proportion of 22.2%, 21.5% and 38.6%,
respectively. There are also some other minority compositions such as wood, metals,
glass, textile, and other waste which in total account for 17.7%.
15
Figure 3: Distribution of each composition of Landfilled MSW in 2015
2.2.3 Recycled and Non-recycled Materials in Hong Kong
In Hong Kong, private buildings are responsible for recycling their own wastes, while
in the public areas, garbage bins were set up by the government to collect the recyclable
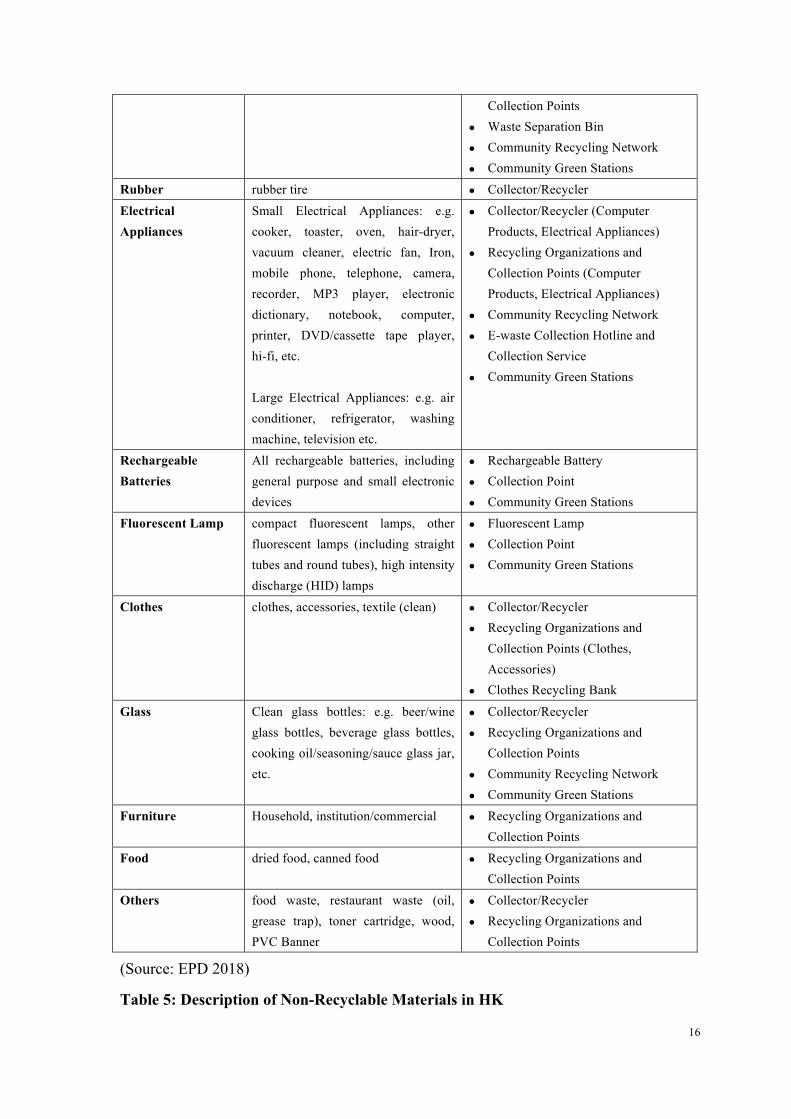
wastes. Tables 4 and 5 show the recyclable and non-recyclable materials in Hong Kong.
Table 4: Description of Recyclable Materials in HK Material Type Recyclable Materials Collection Points Waste Paper newspapers, books and magazines,
office papers, cardboard (corrugated fiberboard)
! Collector/Recycler ! Recycling Organizations and
Collection Points ! Waste Separation Bin ! Community Green Stations
Metals iron / aluminum cans (clean), cook wares, milk powder cans, food containers
! Collector/Recycler(Ferrous Metals, Non-Ferrous Metals)
! Waste Separation Bin ! Community Green Stations
Plastics beverage plastic bottles, personal care product plastic bottles
! Collector/Recycler ! Recycling Organizations and
Paper 22%
Plastics 21%
Rattan/Wood 4% Metals
2%
[类别名称] [百分⽐]
Textile 3%
Putrescibles 39%
Others 5%
Paper
Plastics
Rattan/Wood
Metals
Glass
Textile
Putrescibles
Others
16
Collection Points ! Waste Separation Bin ! Community Recycling Network ! Community Green Stations
Rubber rubber tire ! Collector/Recycler Electrical Appliances
Small Electrical Appliances: e.g. cooker, toaster, oven, hair-dryer, vacuum cleaner, electric fan, Iron, mobile phone, telephone, camera, recorder, MP3 player, electronic dictionary, notebook, computer, printer, DVD/cassette tape player, hi-fi, etc.
Large Electrical Appliances: e.g. air conditioner, refrigerator, washing machine, television etc.
! Collector/Recycler (Computer Products, Electrical Appliances)
! Recycling Organizations and Collection Points (Computer Products, Electrical Appliances)
! Community Recycling Network ! E-waste Collection Hotline and
Collection Service ! Community Green Stations
Rechargeable Batteries
All rechargeable batteries, including general purpose and small electronic devices
! Rechargeable Battery ! Collection Point ! Community Green Stations
Fluorescent Lamp compact fluorescent lamps, other fluorescent lamps (including straight tubes and round tubes), high intensity discharge (HID) lamps
! Fluorescent Lamp ! Collection Point ! Community Green Stations
Clothes clothes, accessories, textile (clean) ! Collector/Recycler ! Recycling Organizations and
Collection Points (Clothes, Accessories)
! Clothes Recycling Bank
Glass Clean glass bottles: e.g. beer/wine glass bottles, beverage glass bottles, cooking oil/seasoning/sauce glass jar, etc.
! Collector/Recycler ! Recycling Organizations and
Collection Points ! Community Recycling Network ! Community Green Stations
Furniture Household, institution/commercial ! Recycling Organizations and Collection Points
Food dried food, canned food ! Recycling Organizations and Collection Points
Others food waste, restaurant waste (oil, grease trap), toner cartridge, wood, PVC Banner
! Collector/Recycler ! Recycling Organizations and
Collection Points
(Source: EPD 2018)
Table 5: Description of Non-Recyclable Materials in HK
17
beverage or milk cartons with plastic or aluminum interior coatings
aerosol cans, chemical containers
mops, correction fluid containers or medicine containers
light-bulbs
(Source: EPD 2018)
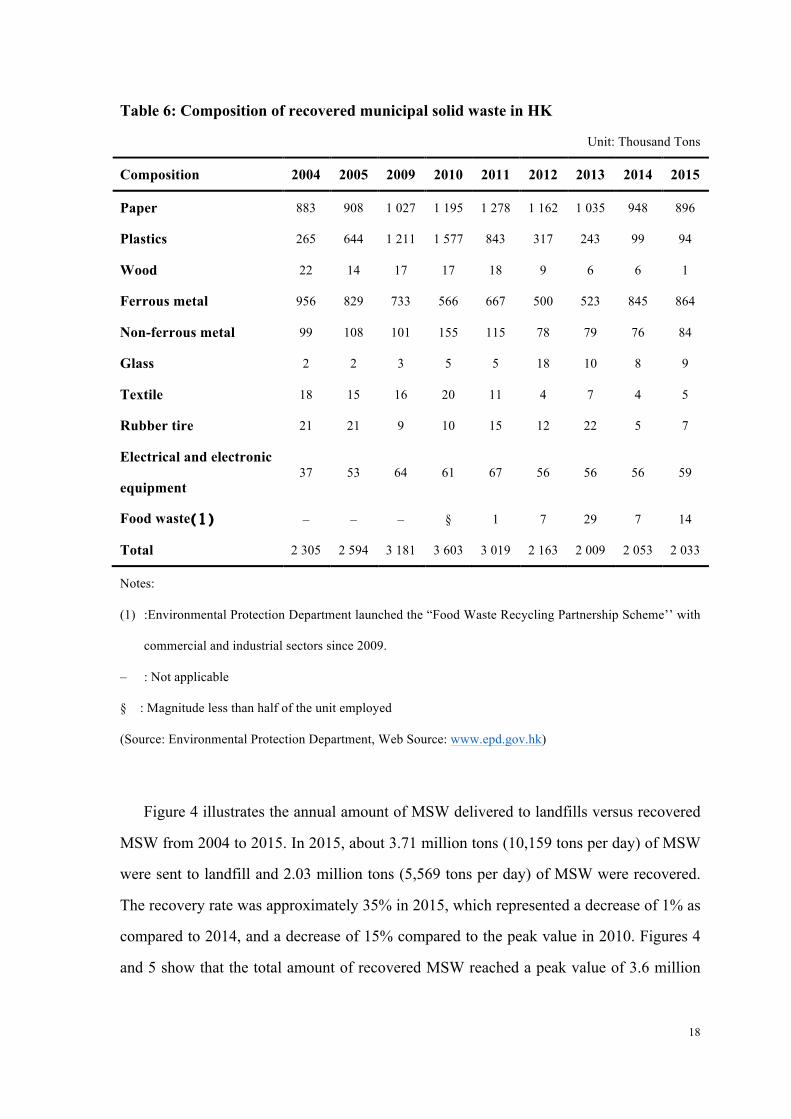
2.2.4 MSW Recovered Situation in HK
About 98% of the city’s “recyclable” (about 2 million tons in 2015) were transported
to mainland China and other countries. Table 6 shows the detailed composition of
recovered municipal solid waste. The major types of recyclable wastes recovered included
paper, plastics, ferrous metal and non-ferrous metal, which accounted for about 97% of
the waste recovered. The remaining 3% include electrical & electronic waste, wood,
textile, rubber tires and glass.7
7 Recovery and Recycling of Municipal Solid Waste in Hong Kong , Waste Reduction and EcoPark Group Environmental Protection Department , March 2012 , Web Source: https://www.wastereduction.gov.hk/sites/default/files/wr_msw.pdf
18
Table 6: Composition of recovered municipal solid waste in HK
Unit: Thousand Tons
Composition 2004 2005 2009 2010 2011 2012 2013 2014 2015
Paper 883 908 1 027 1 195 1 278 1 162 1 035 948 896
Plastics 265 644 1 211 1 577 843 317 243 99 94
Wood 22 14 17 17 18 9 6 6 1
Ferrous metal 956 829 733 566 667 500 523 845 864
Non-ferrous metal 99 108 101 155 115 78 79 76 84
Glass 2 2 3 5 5 18 10 8 9
Textile 18 15 16 20 11 4 7 4 5
Rubber tire 21 21 9 10 15 12 22 5 7
Electrical and electronic
equipment 37 53 64 61 67 56 56 56 59
Food waste(1) – – – § 1 7 29 7 14
Total 2 305 2 594 3 181 3 603 3 019 2 163 2 009 2 053 2 033
Notes:
(1) :Environmental Protection Department launched the “Food Waste Recycling Partnership Scheme’’ with
commercial and industrial sectors since 2009.
– : Not applicable
§ : Magnitude less than half of the unit employed
(Source: Environmental Protection Department, Web Source: www.epd.gov.hk)
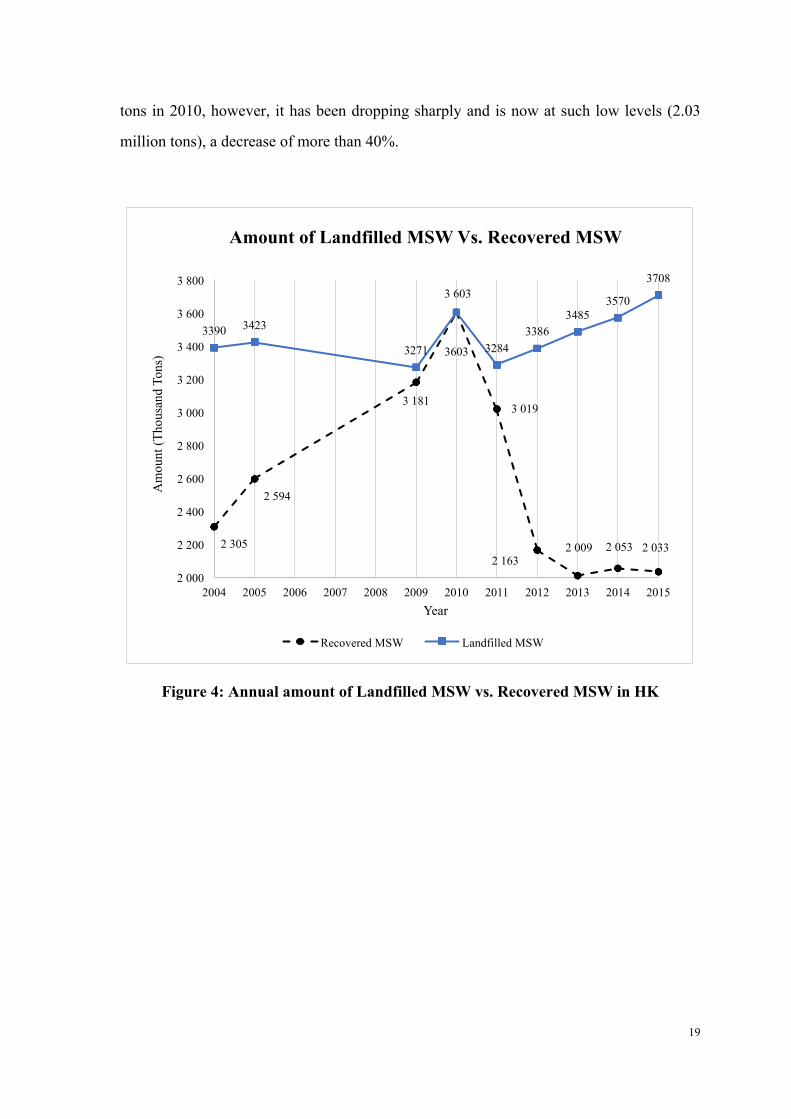
Figure 4 illustrates the annual amount of MSW delivered to landfills versus recovered
MSW from 2004 to 2015. In 2015, about 3.71 million tons (10,159 tons per day) of MSW
were sent to landfill and 2.03 million tons (5,569 tons per day) of MSW were recovered.
The recovery rate was approximately 35% in 2015, which represented a decrease of 1% as
compared to 2014, and a decrease of 15% compared to the peak value in 2010. Figures 4
and 5 show that the total amount of recovered MSW reached a peak value of 3.6 million
19
tons in 2010, however, it has been dropping sharply and is now at such low levels (2.03
million tons), a decrease of more than 40%.
Figure 4: Annual amount of Landfilled MSW vs. Recovered MSW in HK
2 305
2 594
3 181
3 603
3 019
2 163 2 009 2 053 2 033
3390 3423
3271 3603 3284 3386
3485 3570
3708
2 000
2 200
2 400
2 600
2 800
3 000
3 200
3 400
3 600
3 800
2004 2005 2006 2007 2008 2009 2010 2011 2012 2013 2014 2015
Am
ount
(Tho
usan
d To
ns)
Year
Amount of Landfilled MSW Vs. Recovered MSW
Recovered MSW Landfilled MSW
20
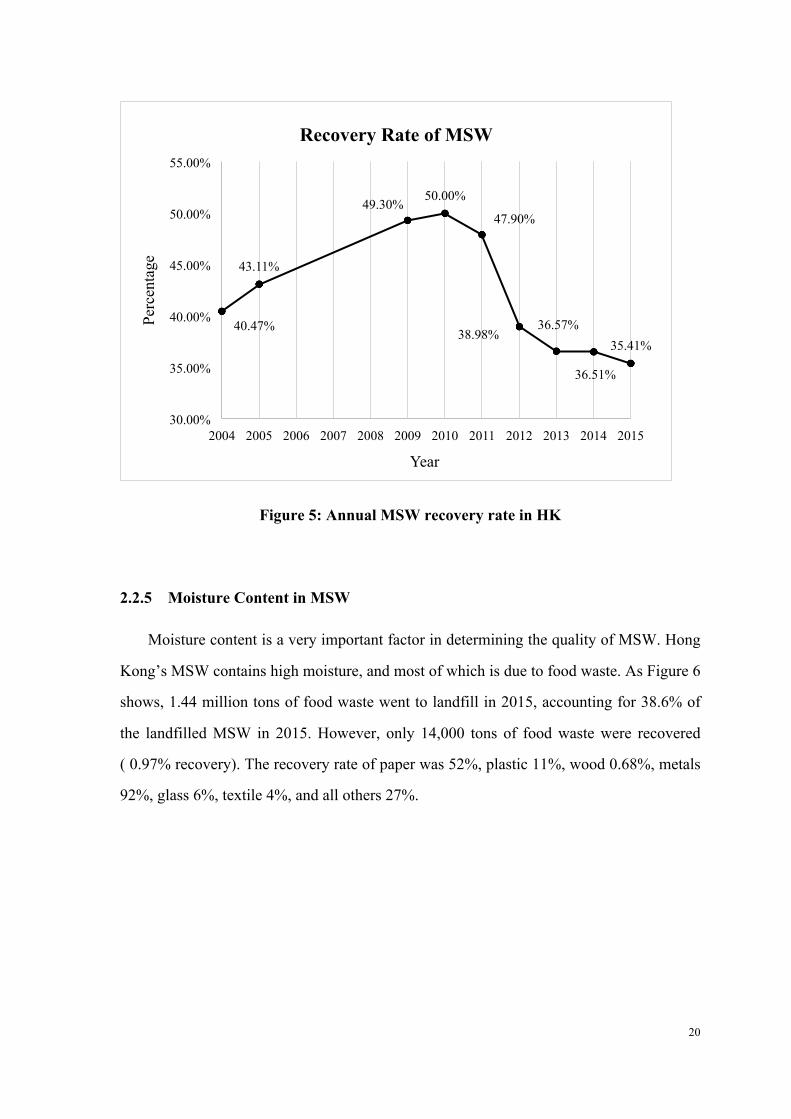
Figure 5: Annual MSW recovery rate in HK
2.2.5 Moisture Content in MSW
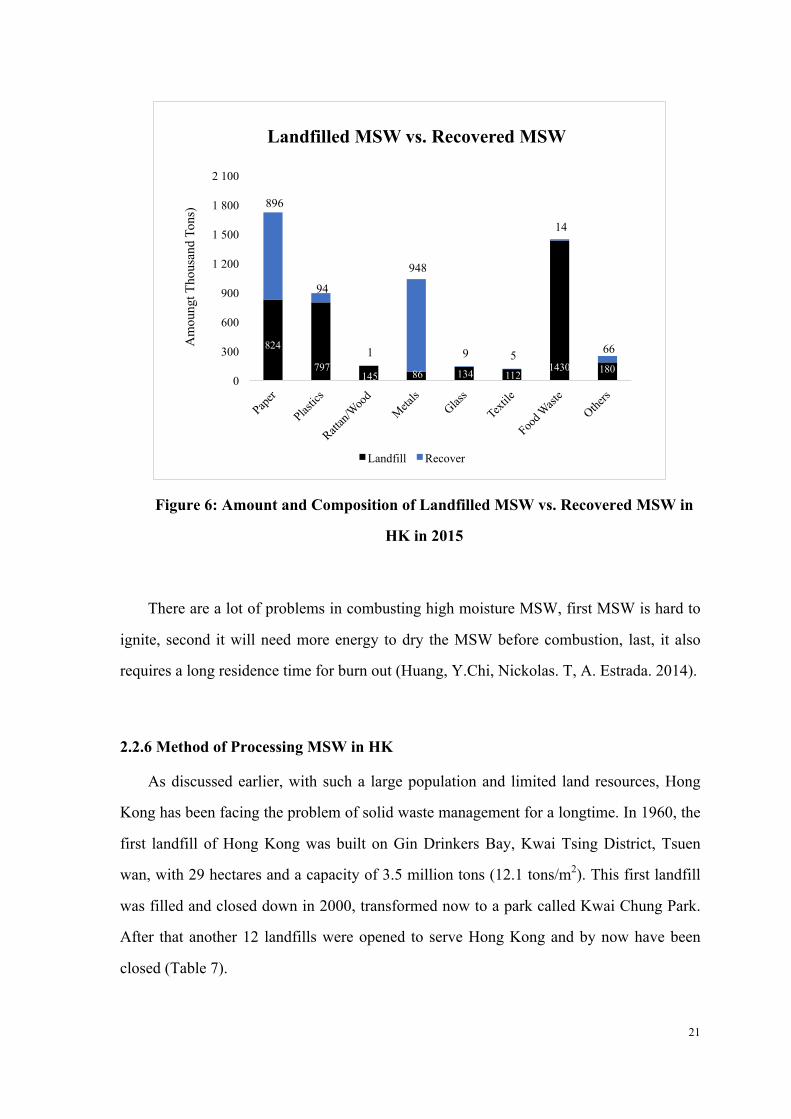
Moisture content is a very important factor in determining the quality of MSW. Hong
Kong’s MSW contains high moisture, and most of which is due to food waste. As Figure 6
shows, 1.44 million tons of food waste went to landfill in 2015, accounting for 38.6% of
the landfilled MSW in 2015. However, only 14,000 tons of food waste were recovered
( 0.97% recovery). The recovery rate of paper was 52%, plastic 11%, wood 0.68%, metals
92%, glass 6%, textile 4%, and all others 27%.
40.47%
43.11%
49.30% 50.00%
47.90%
38.98% 36.57%
36.51%
35.41%
30.00%
35.00%
40.00%
45.00%
50.00%
55.00%
2004 2005 2006 2007 2008 2009 2010 2011 2012 2013 2014 2015
Perc
enta
ge
Year
Recovery Rate of MSW
21
Figure 6: Amount and Composition of Landfilled MSW vs. Recovered MSW in
HK in 2015
There are a lot of problems in combusting high moisture MSW, first MSW is hard to
ignite, second it will need more energy to dry the MSW before combustion, last, it also
requires a long residence time for burn out (Huang, Y.Chi, Nickolas. T, A. Estrada. 2014).
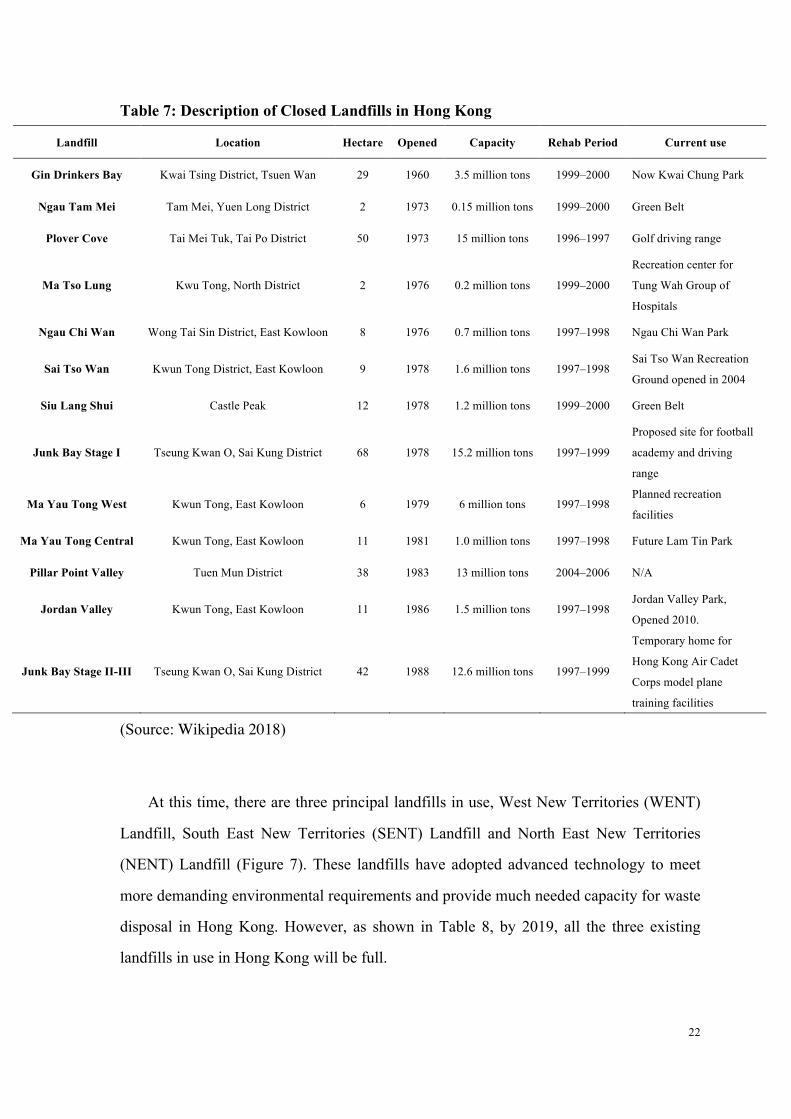
2.2.6 Method of Processing MSW in HK
As discussed earlier, with such a large population and limited land resources, Hong
Kong has been facing the problem of solid waste management for a longtime. In 1960, the
first landfill of Hong Kong was built on Gin Drinkers Bay, Kwai Tsing District, Tsuen
wan, with 29 hectares and a capacity of 3.5 million tons (12.1 tons/m2). This first landfill
was filled and closed down in 2000, transformed now to a park called Kwai Chung Park.
After that another 12 landfills were opened to serve Hong Kong and by now have been
closed (Table 7).
824
797 145 86 134 112
1430 180
896
94
1
948
9 5
14
66
0
300
600
900
1 200
1 500
1 800
2 100 A
mou
ngt T
hous
and
Tons
)
Landfilled MSW vs. Recovered MSW
Landfill Recover
22
Table 7: Description of Closed Landfills in Hong Kong
Landfill Location Hectare Opened Capacity Rehab Period Current use
Gin Drinkers Bay Kwai Tsing District, Tsuen Wan 29 1960 3.5 million tons 1999–2000 Now Kwai Chung Park
Ngau Tam Mei Tam Mei, Yuen Long District 2 1973 0.15 million tons 1999–2000 Green Belt
Plover Cove Tai Mei Tuk, Tai Po District 50 1973 15 million tons 1996–1997 Golf driving range
Ma Tso Lung Kwu Tong, North District 2 1976 0.2 million tons 1999–2000
Recreation center for
Tung Wah Group of
Hospitals
Ngau Chi Wan Wong Tai Sin District, East Kowloon 8 1976 0.7 million tons 1997–1998 Ngau Chi Wan Park
Sai Tso Wan Kwun Tong District, East Kowloon 9 1978 1.6 million tons 1997–1998 Sai Tso Wan Recreation
Ground opened in 2004
Siu Lang Shui Castle Peak 12 1978 1.2 million tons 1999–2000 Green Belt
Junk Bay Stage I Tseung Kwan O, Sai Kung District 68 1978 15.2 million tons 1997–1999
Proposed site for football
academy and driving
range
Ma Yau Tong West Kwun Tong, East Kowloon 6 1979 6 million tons 1997–1998 Planned recreation
facilities
Ma Yau Tong Central Kwun Tong, East Kowloon 11 1981 1.0 million tons 1997–1998 Future Lam Tin Park
Pillar Point Valley Tuen Mun District 38 1983 13 million tons 2004–2006 N/A
Jordan Valley Kwun Tong, East Kowloon 11 1986 1.5 million tons 1997–1998 Jordan Valley Park,
Opened 2010.
Junk Bay Stage II-III Tseung Kwan O, Sai Kung District 42 1988 12.6 million tons 1997–1999
Temporary home for
Hong Kong Air Cadet
Corps model plane
training facilities
(Source: Wikipedia 2018)
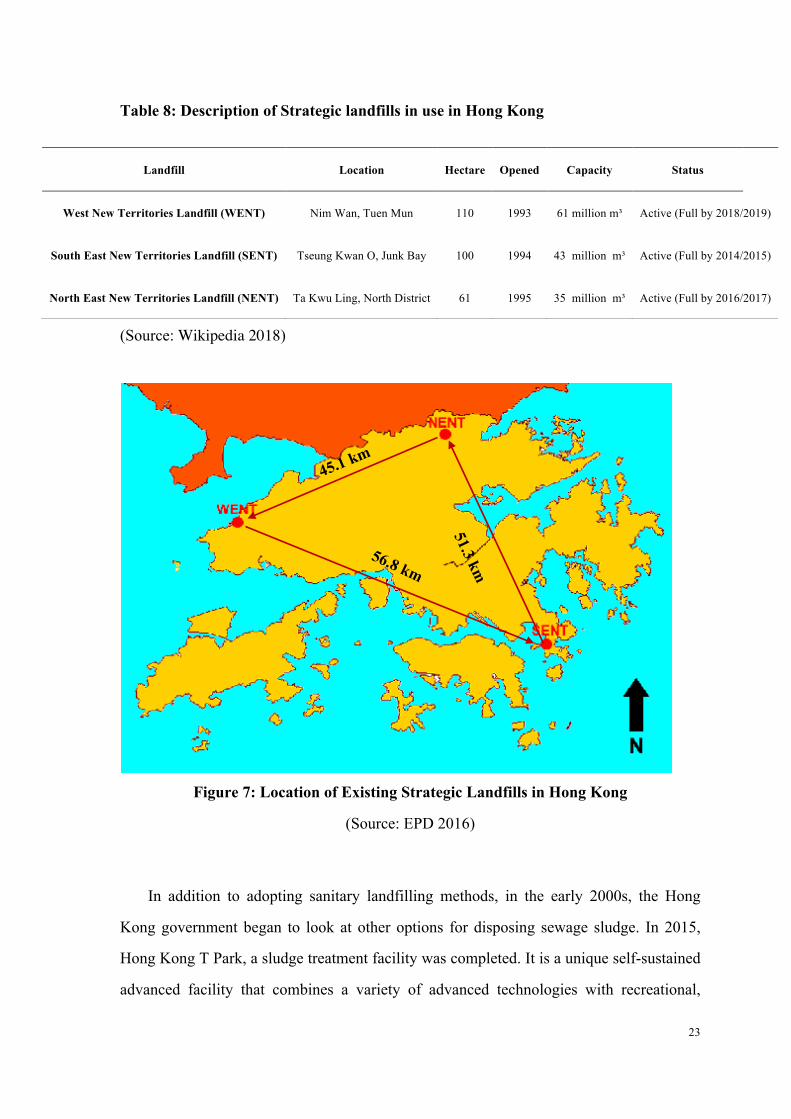
At this time, there are three principal landfills in use, West New Territories (WENT)
Landfill, South East New Territories (SENT) Landfill and North East New Territories
(NENT) Landfill (Figure 7). These landfills have adopted advanced technology to meet
more demanding environmental requirements and provide much needed capacity for waste
disposal in Hong Kong. However, as shown in Table 8, by 2019, all the three existing
landfills in use in Hong Kong will be full.
23
Table 8: Description of Strategic landfills in use in Hong Kong
(Source: Wikipedia 2018)
Figure 7: Location of Existing Strategic Landfills in Hong Kong
(Source: EPD 2016)
In addition to adopting sanitary landfilling methods, in the early 2000s, the Hong
Kong government began to look at other options for disposing sewage sludge. In 2015,
Hong Kong T Park, a sludge treatment facility was completed. It is a unique self-sustained
advanced facility that combines a variety of advanced technologies with recreational,
Landfill Location Hectare Opened Capacity Status
West New Territories Landfill (WENT) Nim Wan, Tuen Mun 110 1993 61 million m³ Active (Full by 2018/2019)
South East New Territories Landfill (SENT) Tseung Kwan O, Junk Bay 100 1994 43 million m³ Active (Full by 2014/2015)
North East New Territories Landfill (NENT) Ta Kwu Ling, North District 61 1995 35 million m³ Active (Full by 2016/2017)
51.3 km
45.1 km
56.8 km
24
educational and ecological features in a single complex. According to government
estimates, Hong Kong generates about 3 million cubic meters of sewage per day, resulting
in 1,200 tons of sludge per day. With four incineration trains in the facility, T Park can
handle a maximum capacity of 2,000 tons of sludge per day, i.e., 730,000 tons of sludge
per year. The total cost of T Park was at HK$5.5 billion (US$ 702 million).
2.3 Government Initiatives in Waste Reduction and Recycling
The Environmental Protection Department (EDP) of Hong Kong is involved and
works closely with several sectors, such as property management, education,
non-governmental organizations and industry, to reduce and recycle wastes in Hong Kong.
Many measures have been implemented, including Waste Separation Bins, Land
Allocation Policy, Amendment of Building Regulations, Program on Source Separation of
Domestic Waste, Program on Source Separation of Commercial and Industrial Waste,
Promotion Program on Source Separation of Waste, Community Recycling Network,
Cooperation with District Councils, Environment and Conservation Fund, Hong Kong
Awards for Environmental Excellence, Producer Responsibility Scheme, Recovery
Program for Waste Electrical and Electronic Equipment (WEEE), Mobile WEEE
Collection Centre Service (EPD 2012).
The Program on Source Separation of Domestic Waste is an example of these
measures. It was implemented in Hong Kong in 2005 to encourage more people to sort
their waste for recycling. The program encourages and assists property management
companies to provide waste separation facilities on each floor of a building, making it
easier for residents to sort waste at the source. It has also expanded the recyclable
categories of waste paper, plastic, metal, electrical and electronic equipment and used
clothing. Additional income can be earned by collecting and selling recyclable materials
which can be used to subsidize administrative expenses.
3.
25
4. HONG KONG’S PLASTIC WASTE
3.1 Definition of Plastic
Plastic is material consisting of any of a wide range of synthetic or semi-synthetic
organic compounds that are malleable and so can be molded into solid objects.8 Plastic
consists wholly or partly of a combination of carbon, oxygen, hydrogen, nitrogen, other
organic or inorganic elements. The name "plastic" refers to the property of plasticity,
which is the ability to deform without breaking. 9 There are two types of plastic
thermoplastics and thermosetting polymers. The main difference between them is their
behavior upon heating. Thermoplastics can be repeatedly melted and remolded. PS, PP,
PVC, PET, LDPE, and HDPE are the six major thermoplastic resins and constitute the
majority of plastics, about 80%. Thermosetting plastics, also known as thermosets, are
usually liquid or malleable before curing, and assume a permanent shape after curing.
In order to assist in the recycling of disposable items, the Plastic Bottle Institute of the
Society of the Plastics Industry designed a series of recycling number to mark plastic
bottles. Table 9 shows the detail of each type of recycling plastic.
8 Wikipedia, March 2001, Web Source: https://en.wikipedia.org/wiki/Plastic 9 What is Plastic? Definition in Chemistry, Web Source: https://www.thoughtco.com/plastic-chemical-composition-608930
26
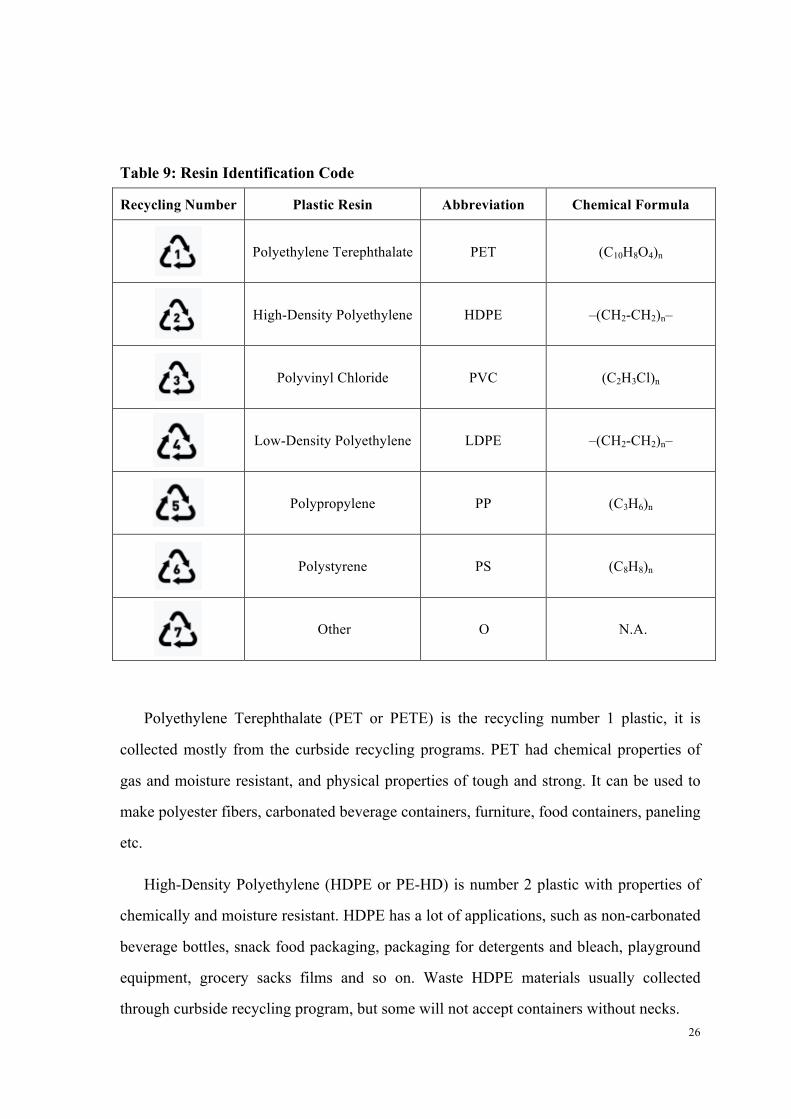
Table 9: Resin Identification Code
Recycling Number Plastic Resin Abbreviation Chemical Formula
Polyethylene Terephthalate PET (C10H8O4)n
High-Density Polyethylene HDPE –(CH2-CH2)n–
Polyvinyl Chloride PVC (C2H3Cl)n
Low-Density Polyethylene LDPE –(CH2-CH2)n–
Polypropylene PP (C3H6)n
Polystyrene PS (C8H8)n
Other O N.A.
Polyethylene Terephthalate (PET or PETE) is the recycling number 1 plastic, it is
collected mostly from the curbside recycling programs. PET had chemical properties of
gas and moisture resistant, and physical properties of tough and strong. It can be used to
make polyester fibers, carbonated beverage containers, furniture, food containers, paneling
etc.
High-Density Polyethylene (HDPE or PE-HD) is number 2 plastic with properties of
chemically and moisture resistant. HDPE has a lot of applications, such as non-carbonated
beverage bottles, snack food packaging, packaging for detergents and bleach, playground
equipment, grocery sacks films and so on. Waste HDPE materials usually collected
through curbside recycling program, but some will not accept containers without necks.
27
Polyvinyl Chloride (PVC or V) is number 3 recycling plastic. Due to the properties of
transparent, stable, chemically resistant, resistant to weathering, can be rigid or flexible, it
can be made of pipes, fittings, window profile, children’s toys, synthetic leather products
etc. Europe recycled PVC extensively. There were 481,000 tons of PVC been recycled in
2014 through Vinyl 2010 and Vinyl Plus initiatives.10
Low-Density Polyethylene (LDPE or PE-LD) also known as Linear Low-Density
Polyethylene is number 4 plastic. With the chemical and physical properties of tough,
flexible, transparent, stable electrical, it was applied to made shopping and grocery bags,
which can be returned to many stores for recycling. It can also use to make flexible bottles,
lids, various molded laboratory equipment, wires, cables etc. However, the curbside
program is not often accepting LDPE.
Polypropylene (PP) is number 5 recycling plastic. It can be made of industrial fibers,
food containers, dishware and so on because of its properties of heat and moisture resistant,
chemically resistant, can be rigid or flexible. This type of plastic can be recycled through
the curbside program.
Polystyrene (PS) is number 6 plastic with properties of clear, hard and brittle, it is an
excellent thermal insulator, and also can be rigid or expanded to foam cups, trays, take-out
containers, egg cartons etc. Medical packaging, food packaging, and labware also can be
made by PS. Recycle can be easily done by some curbside programs.
Other plastics will be recycling number 7. They include plastics such as nylon, acrylic,
polycarbonate, polylactic acid, and multilayer combinations of different plastics. It always
used in bottles, plastic lumber applications, headlight lenses, and safety shields or glasses.
This kind of plastics have usually not been recycled, however, some of the curbside
program will also collect some of them. (Demetra, 2013)
3.2 Plastic Waste in China
10 Resin Identification Code, Table of Resin Codes, 0ct 25,2018, Web Source: https://en.wikipedia.org/wiki/Resin_identification_code
28
According to the non-profit organization Plastic Oceans, the world produces nearly
300 million tons of plastic per year. More than 8 million tons of plastics ends up into
oceans each year and humanity uses more than one million plastic bags per minute.
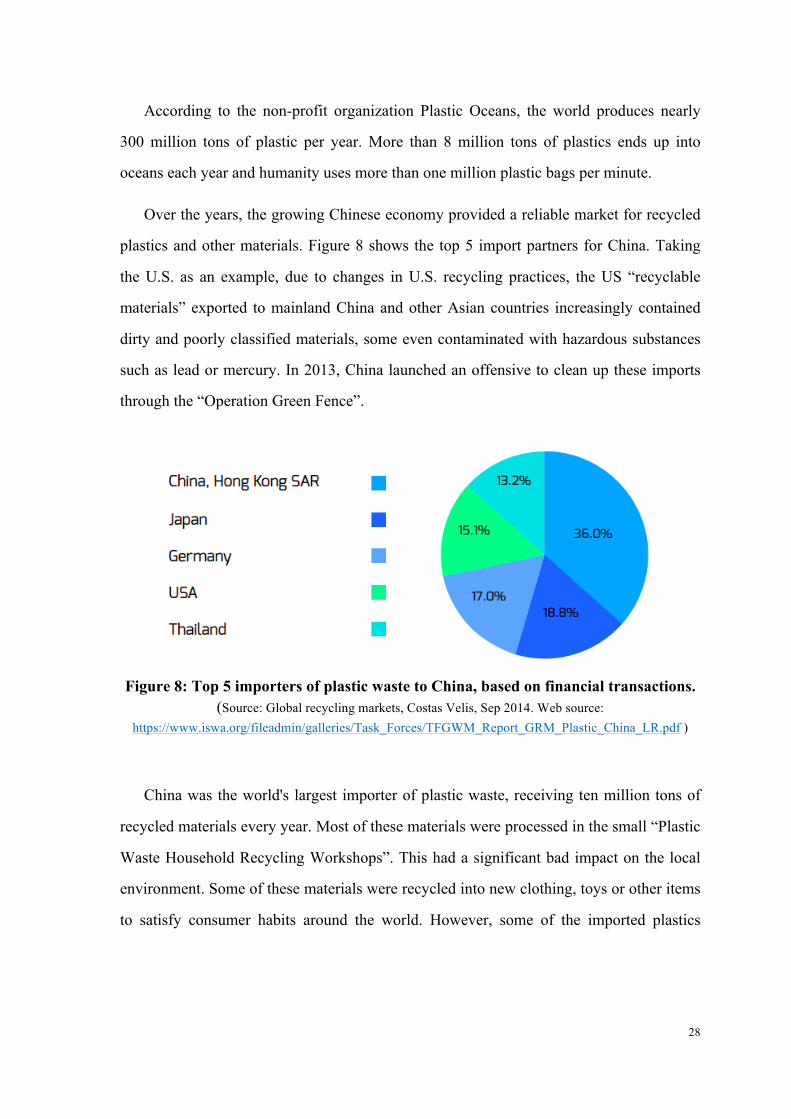
Over the years, the growing Chinese economy provided a reliable market for recycled
plastics and other materials. Figure 8 shows the top 5 import partners for China. Taking
the U.S. as an example, due to changes in U.S. recycling practices, the US “recyclable
materials” exported to mainland China and other Asian countries increasingly contained
dirty and poorly classified materials, some even contaminated with hazardous substances
such as lead or mercury. In 2013, China launched an offensive to clean up these imports
through the “Operation Green Fence”.
Figure 8: Top 5 importers of plastic waste to China, based on financial transactions.
(Source: Global recycling markets, Costas Velis, Sep 2014. Web source: https://www.iswa.org/fileadmin/galleries/Task_Forces/TFGWM_Report_GRM_Plastic_China_LR.pdf )
China was the world's largest importer of plastic waste, receiving ten million tons of
recycled materials every year. Most of these materials were processed in the small “Plastic
Waste Household Recycling Workshops”. This had a significant bad impact on the local
environment. Some of these materials were recycled into new clothing, toys or other items
to satisfy consumer habits around the world. However, some of the imported plastics
29
cannot be reprocessed and were discarded, polluting the environment and communities
around the “recycling” shops.11
3.3 Hong Kong’s Role in Plastic Waste Market.
3.3.1 Importer
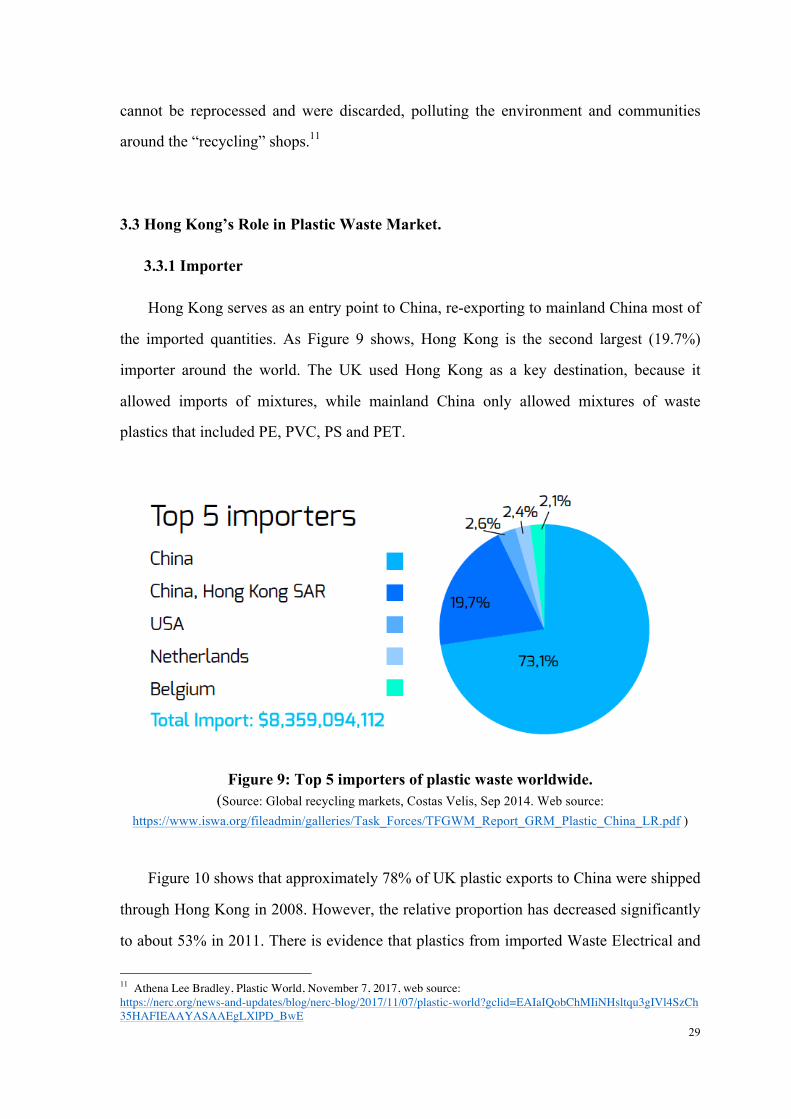
Hong Kong serves as an entry point to China, re-exporting to mainland China most of
the imported quantities. As Figure 9 shows, Hong Kong is the second largest (19.7%)
importer around the world. The UK used Hong Kong as a key destination, because it
allowed imports of mixtures, while mainland China only allowed mixtures of waste
plastics that included PE, PVC, PS and PET.
Figure 9: Top 5 importers of plastic waste worldwide. (Source: Global recycling markets, Costas Velis, Sep 2014. Web source:
https://www.iswa.org/fileadmin/galleries/Task_Forces/TFGWM_Report_GRM_Plastic_China_LR.pdf )
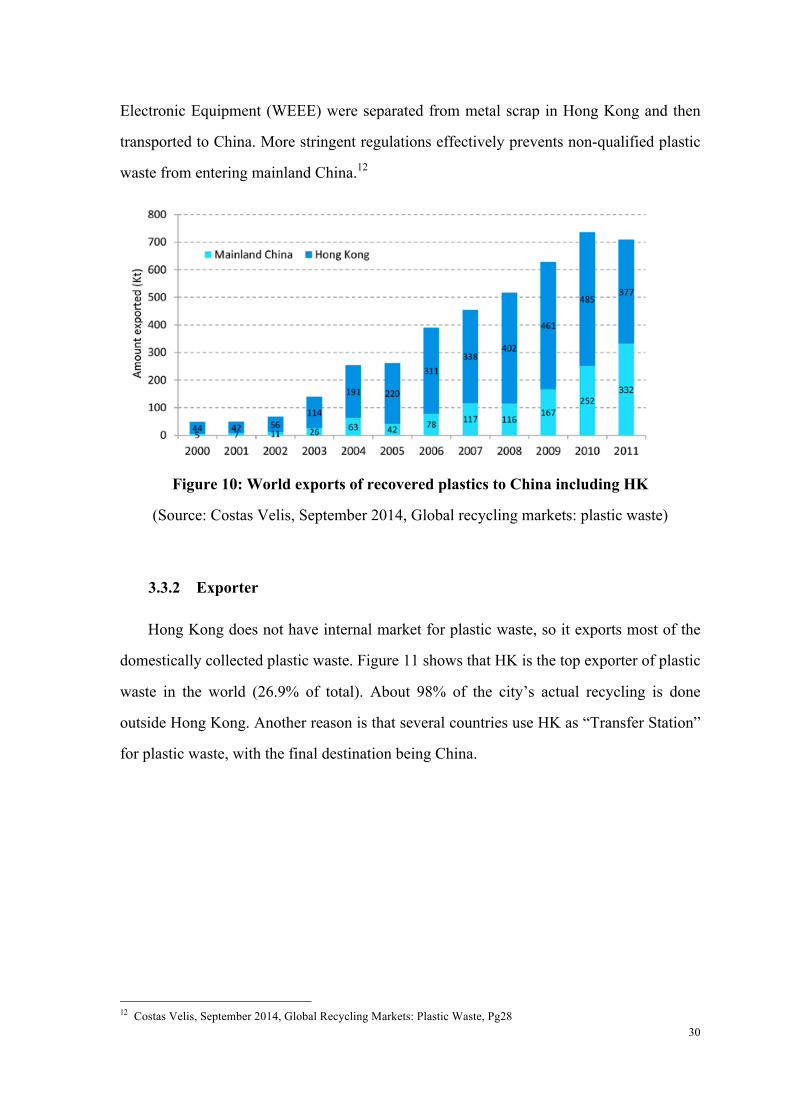
Figure 10 shows that approximately 78% of UK plastic exports to China were shipped
through Hong Kong in 2008. However, the relative proportion has decreased significantly
to about 53% in 2011. There is evidence that plastics from imported Waste Electrical and
11 Athena Lee Bradley, Plastic World, November 7, 2017, web source: https://nerc.org/news-and-updates/blog/nerc-blog/2017/11/07/plastic-world?gclid=EAIaIQobChMIiNHsltqu3gIVl4SzCh35HAFIEAAYASAAEgLXlPD_BwE
30
Electronic Equipment (WEEE) were separated from metal scrap in Hong Kong and then
transported to China. More stringent regulations effectively prevents non-qualified plastic
waste from entering mainland China.12
Figure 10: World exports of recovered plastics to China including HK
(Source: Costas Velis, September 2014, Global recycling markets: plastic waste)
3.3.2 Exporter
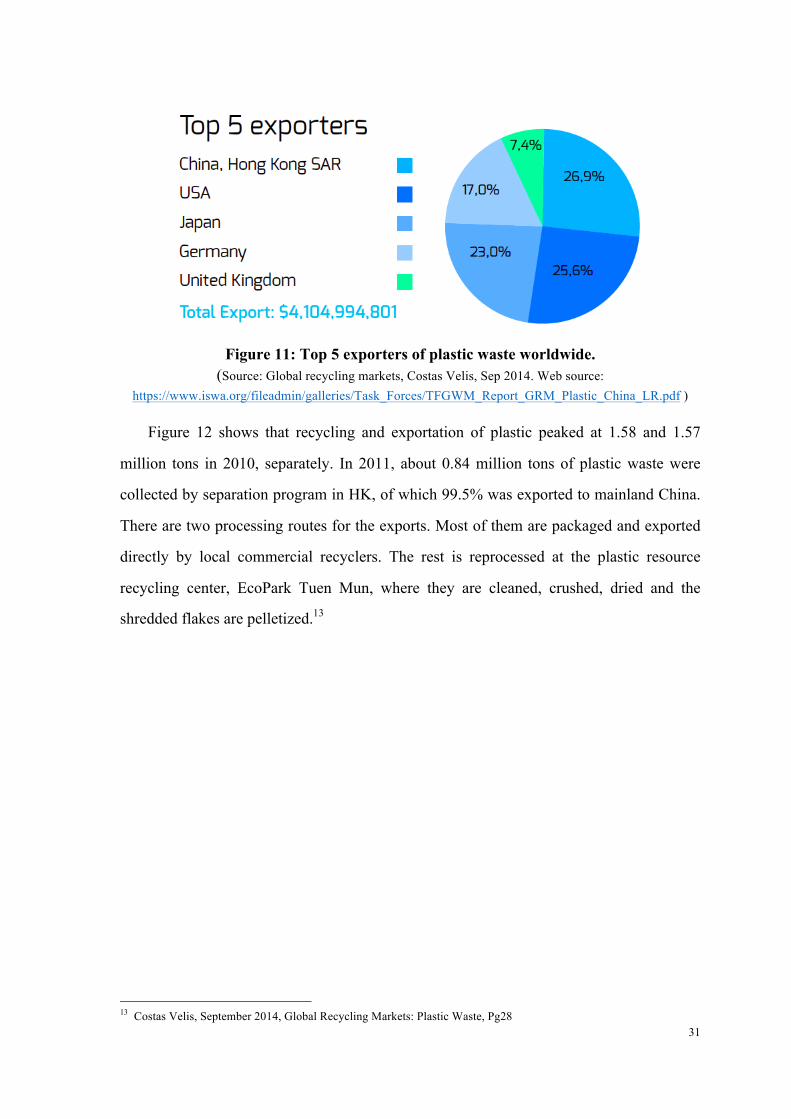
Hong Kong does not have internal market for plastic waste, so it exports most of the
domestically collected plastic waste. Figure 11 shows that HK is the top exporter of plastic
waste in the world (26.9% of total). About 98% of the city’s actual recycling is done
outside Hong Kong. Another reason is that several countries use HK as “Transfer Station”
for plastic waste, with the final destination being China.
12 Costas Velis, September 2014, Global Recycling Markets: Plastic Waste, Pg28
31
Figure 11: Top 5 exporters of plastic waste worldwide.
(Source: Global recycling markets, Costas Velis, Sep 2014. Web source: https://www.iswa.org/fileadmin/galleries/Task_Forces/TFGWM_Report_GRM_Plastic_China_LR.pdf )
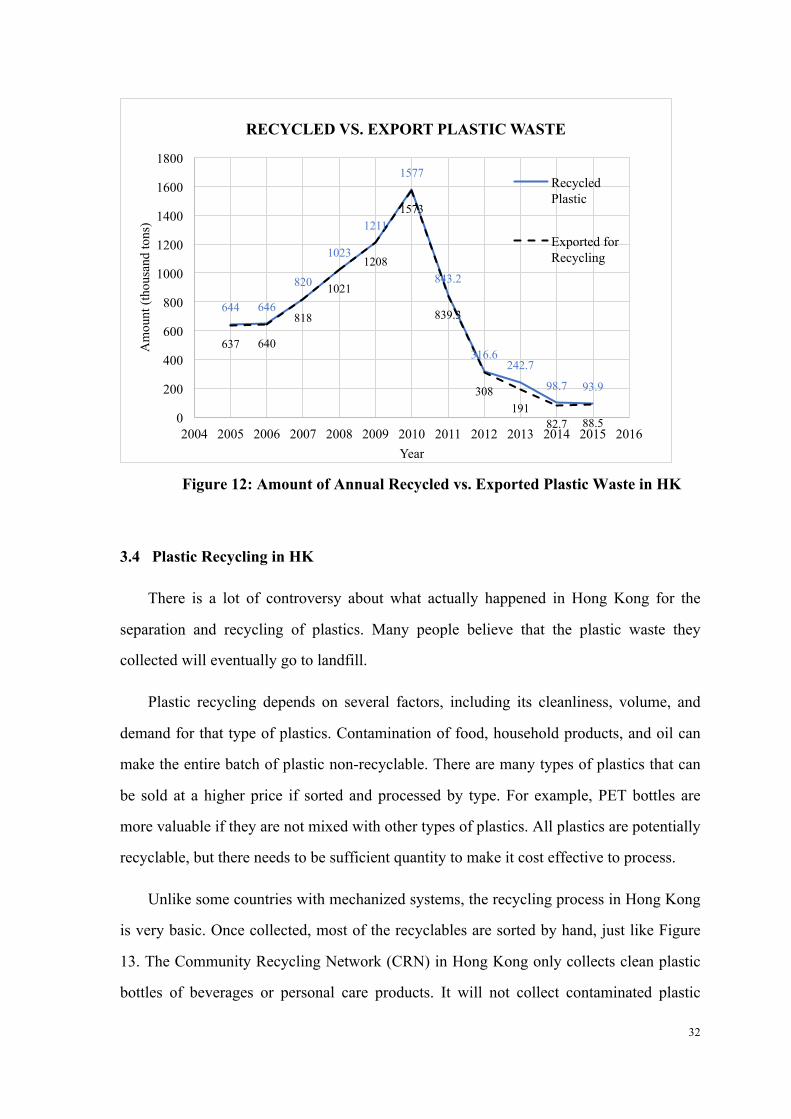
Figure 12 shows that recycling and exportation of plastic peaked at 1.58 and 1.57
million tons in 2010, separately. In 2011, about 0.84 million tons of plastic waste were
collected by separation program in HK, of which 99.5% was exported to mainland China.
There are two processing routes for the exports. Most of them are packaged and exported
directly by local commercial recyclers. The rest is reprocessed at the plastic resource
recycling center, EcoPark Tuen Mun, where they are cleaned, crushed, dried and the
shredded flakes are pelletized.13
13 Costas Velis, September 2014, Global Recycling Markets: Plastic Waste, Pg28
32
Figure 12: Amount of Annual Recycled vs. Exported Plastic Waste in HK
3.4 Plastic Recycling in HK
There is a lot of controversy about what actually happened in Hong Kong for the
separation and recycling of plastics. Many people believe that the plastic waste they
collected will eventually go to landfill.
Plastic recycling depends on several factors, including its cleanliness, volume, and
demand for that type of plastics. Contamination of food, household products, and oil can
make the entire batch of plastic non-recyclable. There are many types of plastics that can
be sold at a higher price if sorted and processed by type. For example, PET bottles are
more valuable if they are not mixed with other types of plastics. All plastics are potentially
recyclable, but there needs to be sufficient quantity to make it cost effective to process.
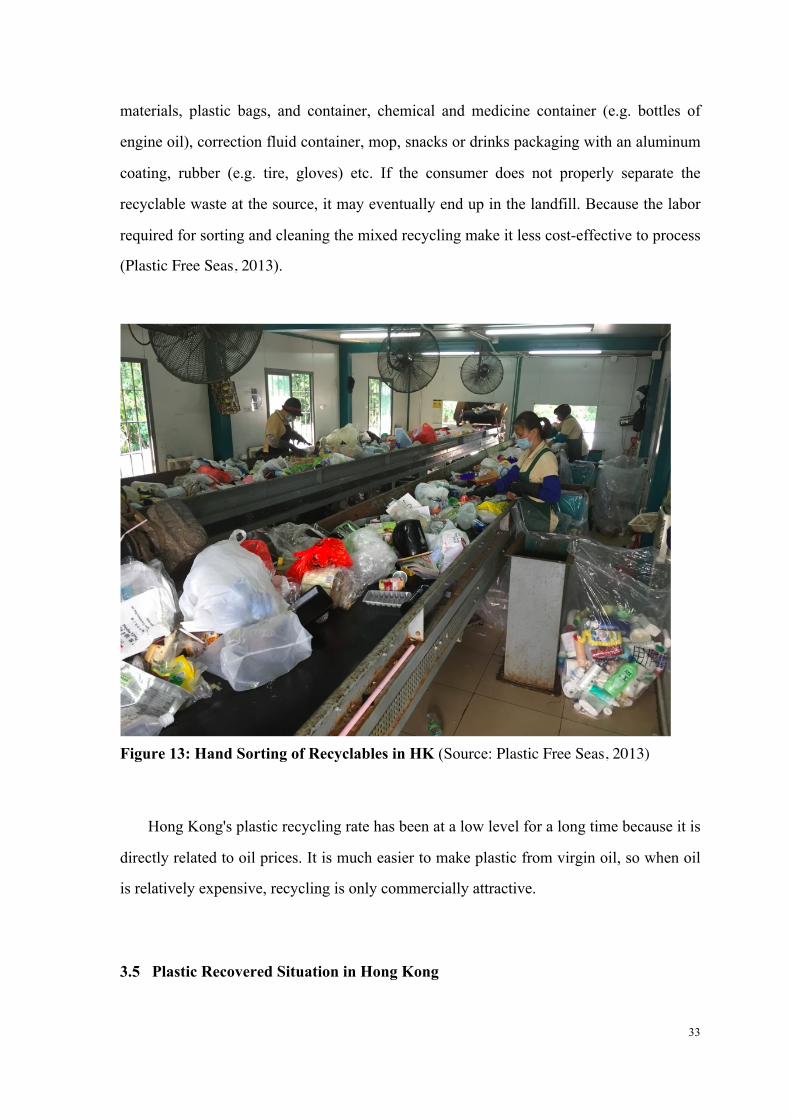
Unlike some countries with mechanized systems, the recycling process in Hong Kong
is very basic. Once collected, most of the recyclables are sorted by hand, just like Figure
13. The Community Recycling Network (CRN) in Hong Kong only collects clean plastic
bottles of beverages or personal care products. It will not collect contaminated plastic
644 646
820
1023
1211
1577
843.2
316.6 242.7
98.7 93.9
637 640
818
1021
1208
1573
839.3
308 191
82.7 88.5 0
200
400
600
800
1000
1200
1400
1600
1800
2004 2005 2006 2007 2008 2009 2010 2011 2012 2013 2014 2015 2016
Am
ount
(tho
usan
d to
ns)
Year
RECYCLED VS. EXPORT PLASTIC WASTE
Recycled Plastic
Exported for Recycling
33
materials, plastic bags, and container, chemical and medicine container (e.g. bottles of
engine oil), correction fluid container, mop, snacks or drinks packaging with an aluminum
coating, rubber (e.g. tire, gloves) etc. If the consumer does not properly separate the
recyclable waste at the source, it may eventually end up in the landfill. Because the labor
required for sorting and cleaning the mixed recycling make it less cost-effective to process
(Plastic Free Seas, 2013).
Figure 13: Hand Sorting of Recyclables in HK (Source: Plastic Free Seas, 2013)
Hong Kong's plastic recycling rate has been at a low level for a long time because it is
directly related to oil prices. It is much easier to make plastic from virgin oil, so when oil
is relatively expensive, recycling is only commercially attractive.
3.5 Plastic Recovered Situation in Hong Kong
34
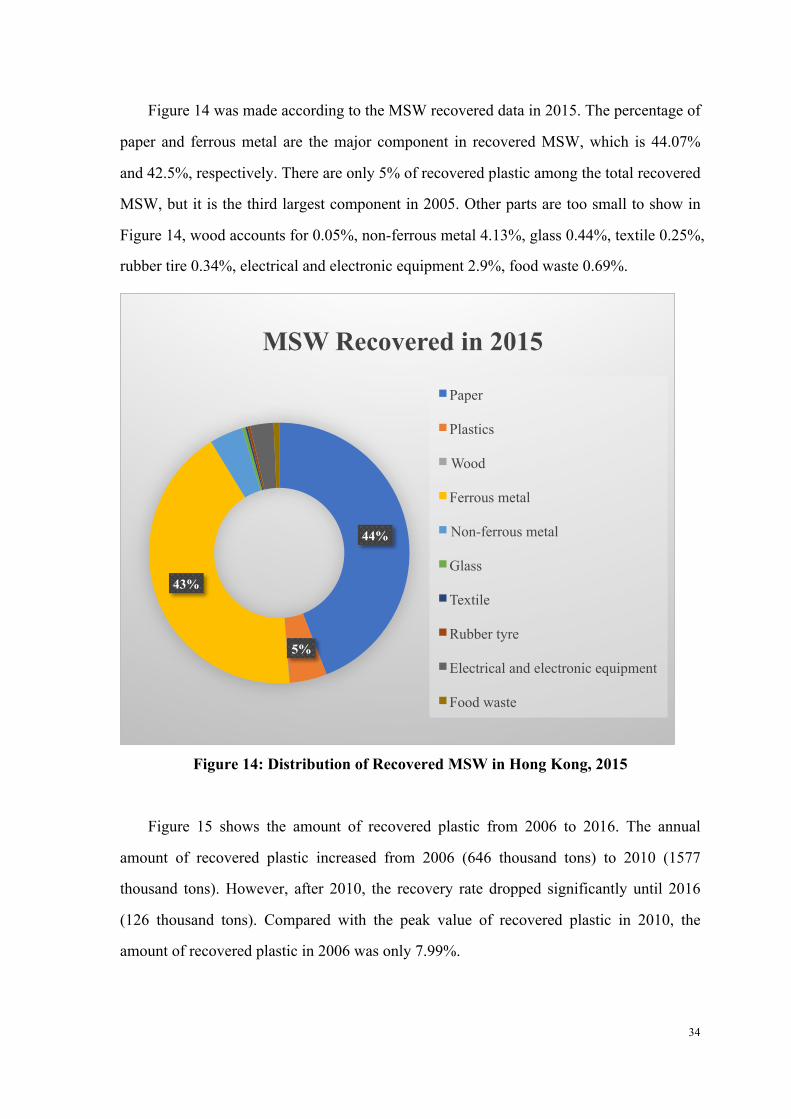
Figure 14 was made according to the MSW recovered data in 2015. The percentage of
paper and ferrous metal are the major component in recovered MSW, which is 44.07%
and 42.5%, respectively. There are only 5% of recovered plastic among the total recovered
MSW, but it is the third largest component in 2005. Other parts are too small to show in
Figure 14, wood accounts for 0.05%, non-ferrous metal 4.13%, glass 0.44%, textile 0.25%,
rubber tire 0.34%, electrical and electronic equipment 2.9%, food waste 0.69%.
Figure 14: Distribution of Recovered MSW in Hong Kong, 2015
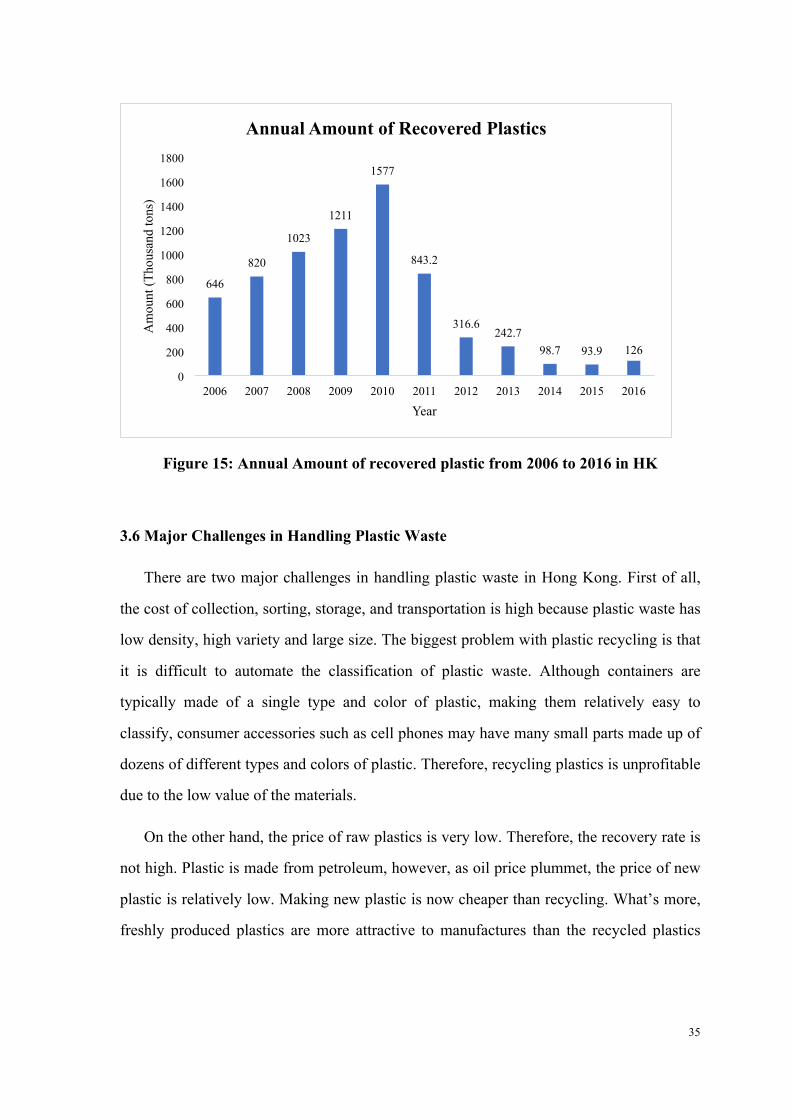
Figure 15 shows the amount of recovered plastic from 2006 to 2016. The annual
amount of recovered plastic increased from 2006 (646 thousand tons) to 2010 (1577
thousand tons). However, after 2010, the recovery rate dropped significantly until 2016
(126 thousand tons). Compared with the peak value of recovered plastic in 2010, the
amount of recovered plastic in 2006 was only 7.99%.
44%
5%
43%
MSW Recovered in 2015
Paper
Plastics
Wood
Ferrous metal
Non-ferrous metal
Glass
Textile
Rubber tyre
Electrical and electronic equipment
Food waste
35
Figure 15: Annual Amount of recovered plastic from 2006 to 2016 in HK
3.6 Major Challenges in Handling Plastic Waste
There are two major challenges in handling plastic waste in Hong Kong. First of all,
the cost of collection, sorting, storage, and transportation is high because plastic waste has
low density, high variety and large size. The biggest problem with plastic recycling is that
it is difficult to automate the classification of plastic waste. Although containers are
typically made of a single type and color of plastic, making them relatively easy to
classify, consumer accessories such as cell phones may have many small parts made up of
dozens of different types and colors of plastic. Therefore, recycling plastics is unprofitable
due to the low value of the materials.
On the other hand, the price of raw plastics is very low. Therefore, the recovery rate is
not high. Plastic is made from petroleum, however, as oil price plummet, the price of new
plastic is relatively low. Making new plastic is now cheaper than recycling. What’s more,
freshly produced plastics are more attractive to manufactures than the recycled plastics
646
820
1023
1211
1577
843.2
316.6 242.7
98.7 93.9 126
0
200
400
600
800
1000
1200
1400
1600
1800
2006 2007 2008 2009 2010 2011 2012 2013 2014 2015 2016
Am
ount
(Tho
usan
d to
ns)
Year
Annual Amount of Recovered Plastics
36
because the chemical composition is easier to distinguish, and improperly mixed plastics
can have issues, like rapid degradation or more limited uses.14
5. FLUIDIZED BED COMBUSTION (FBC) TECHNOLOGIES
4.1 Bubbling Fluidized Bed (BFB)
4.1.1 Introduction
BFB was the first version of FBC technology, and are often preferred in small scale
applications. BFB boiler is well suited for fuels with high moisture content, high ash
content and low volatile.
The first BFB test facility was commissioned in 1965 (Watson, 1997). In addition,
BFB boiler (<100 MWe) has been used in the aluminum and paper industry since 1970.
The first application of BFB technology in the utility segment (> 100 MWe) was in 1986.
Nevertheless, most of the BFB boilers are still installed in small to medium (25-100 MWe)
capacity range. In the early 1990s, BFB boilers spread rapidly in China, more than 2,000
BFB boilers were in operation at that time, however, the maximum capacity was still less
than 10 MW. Therefore, BFB technology is mainly applied in industrial and not in the
utility segment.
4.1.2 Babcock & Wilcox Enterprises, Inc. BFB
The combustion chamber is the core part of the BFB boiler, which has water-cooled
walls and bottom. Both of the lower parts of the wall and bottom has the refractory lining,
which protects the combustion chamber from high temperature, corrosion, and erosion
(Foster Wheeler, 2011). Since the ash, bed materials or non-combustible solids may gather
together to prevent the combustor from working properly, so the particle collection, and
circulation system is required (Joris Koornneef, 2006).
14 Sarah Kramer, Apr 5, 2016, the one thing that makes recycling plastic work is falling apart. Web Source: https://www.businessinsider.com/low-oil-prices-hurt-plastics-recycling-2016-4
37
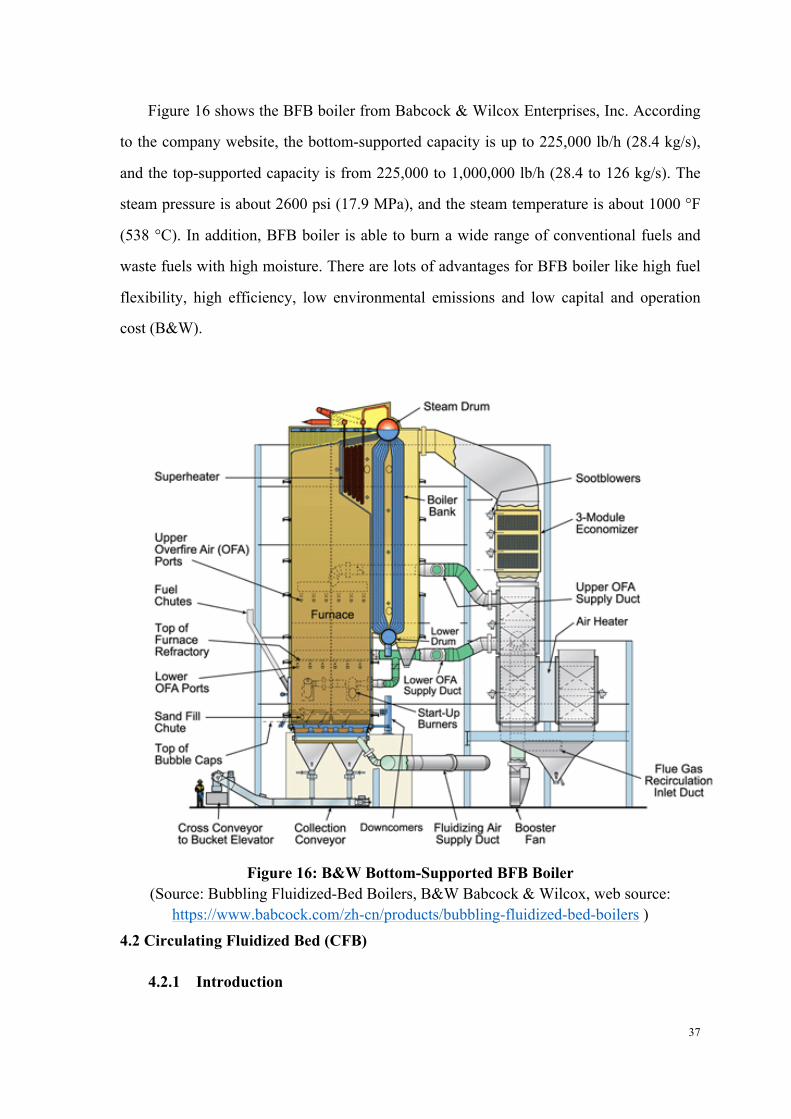
Figure 16 shows the BFB boiler from Babcock & Wilcox Enterprises, Inc. According
to the company website, the bottom-supported capacity is up to 225,000 lb/h (28.4 kg/s),
and the top-supported capacity is from 225,000 to 1,000,000 lb/h (28.4 to 126 kg/s). The
steam pressure is about 2600 psi (17.9 MPa), and the steam temperature is about 1000 °F
(538 °C). In addition, BFB boiler is able to burn a wide range of conventional fuels and
waste fuels with high moisture. There are lots of advantages for BFB boiler like high fuel
flexibility, high efficiency, low environmental emissions and low capital and operation
cost (B&W).
Figure 16: B&W Bottom-Supported BFB Boiler
(Source: Bubbling Fluidized-Bed Boilers, B&W Babcock & Wilcox, web source: https://www.babcock.com/zh-cn/products/bubbling-fluidized-bed-boilers )
4.2 Circulating Fluidized Bed (CFB)
4.2.1 Introduction
38
CFB is derived from the BFB technology. Compared with BFB, CFB has higher
efficiency and better sulfur removal technology. The first commercial small size CFB
boiler (5 MWe )was built in 1979 by Foster Wheeler (Engstrom F,1999). The first CFB
boiler (90 MWe) installed in the utility segment was in 1985 at Duisburg, Germany. CFB
boilers were accepted in the United States for non-utility scale applications in the early
1980s (Joris Koornneef, 2006).
The first CFB WTE plant In China was built by the Jin Jiang group of companies in
1998 in Hangzhou City, with a capacity of 1500 tons per day. This plant used the
differential density CFB technology developed by Zhejiang University. (Huang, 2013). By
now, the CFB combustion process has been developed and is widely used in China.
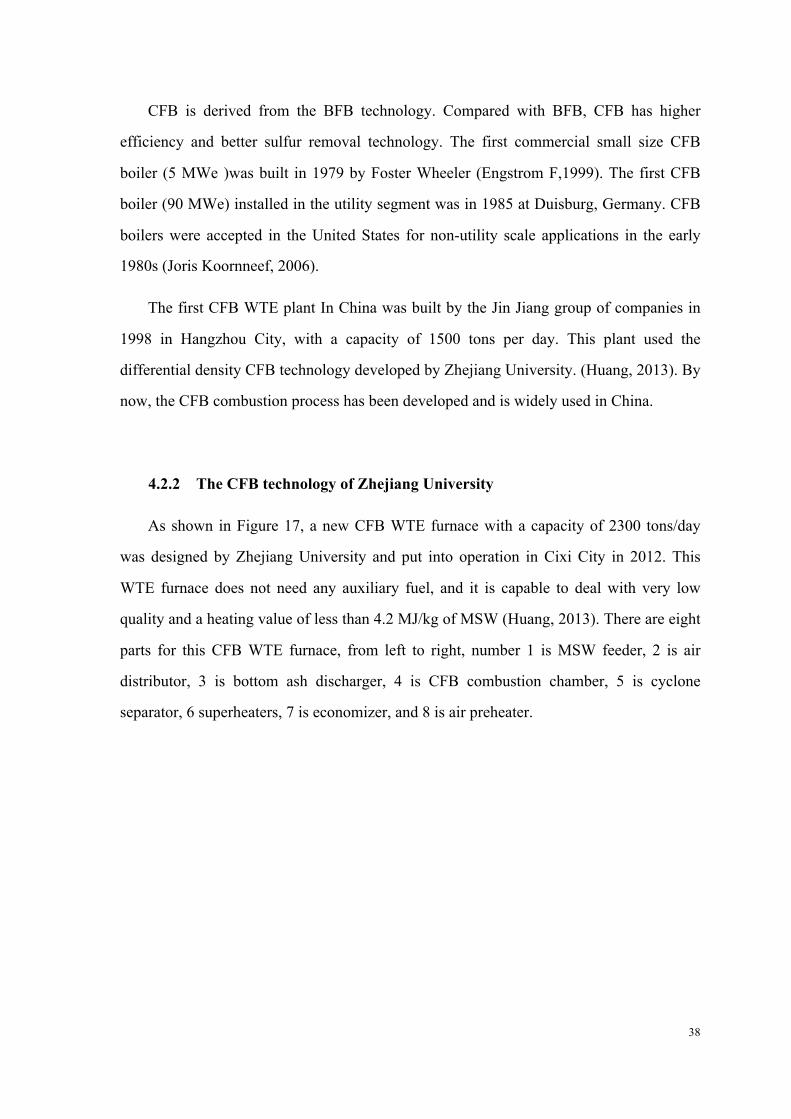
4.2.2 The CFB technology of Zhejiang University
As shown in Figure 17, a new CFB WTE furnace with a capacity of 2300 tons/day
was designed by Zhejiang University and put into operation in Cixi City in 2012. This
WTE furnace does not need any auxiliary fuel, and it is capable to deal with very low
quality and a heating value of less than 4.2 MJ/kg of MSW (Huang, 2013). There are eight
parts for this CFB WTE furnace, from left to right, number 1 is MSW feeder, 2 is air
distributor, 3 is bottom ash discharger, 4 is CFB combustion chamber, 5 is cyclone
separator, 6 superheaters, 7 is economizer, and 8 is air preheater.
39
Figure 17: Layout of 800 t/d CFB incinerator at Cixi city, Zhejiang province, China
(Source: Huang, 2013)
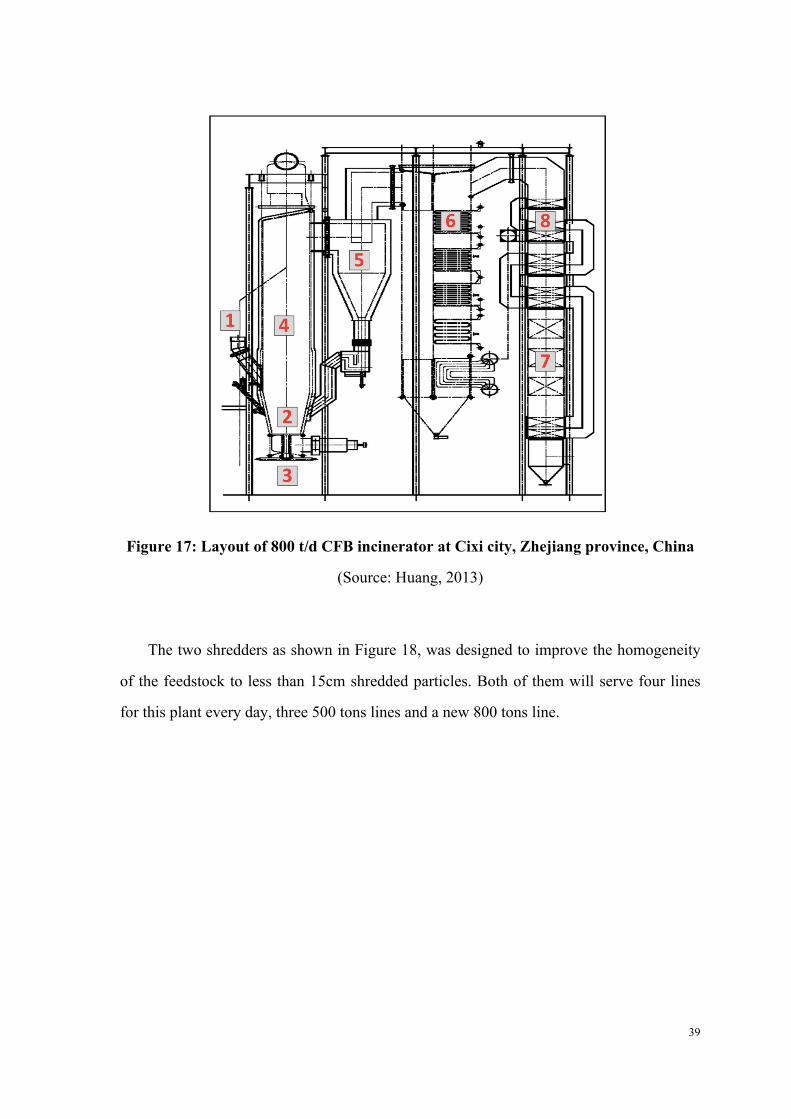
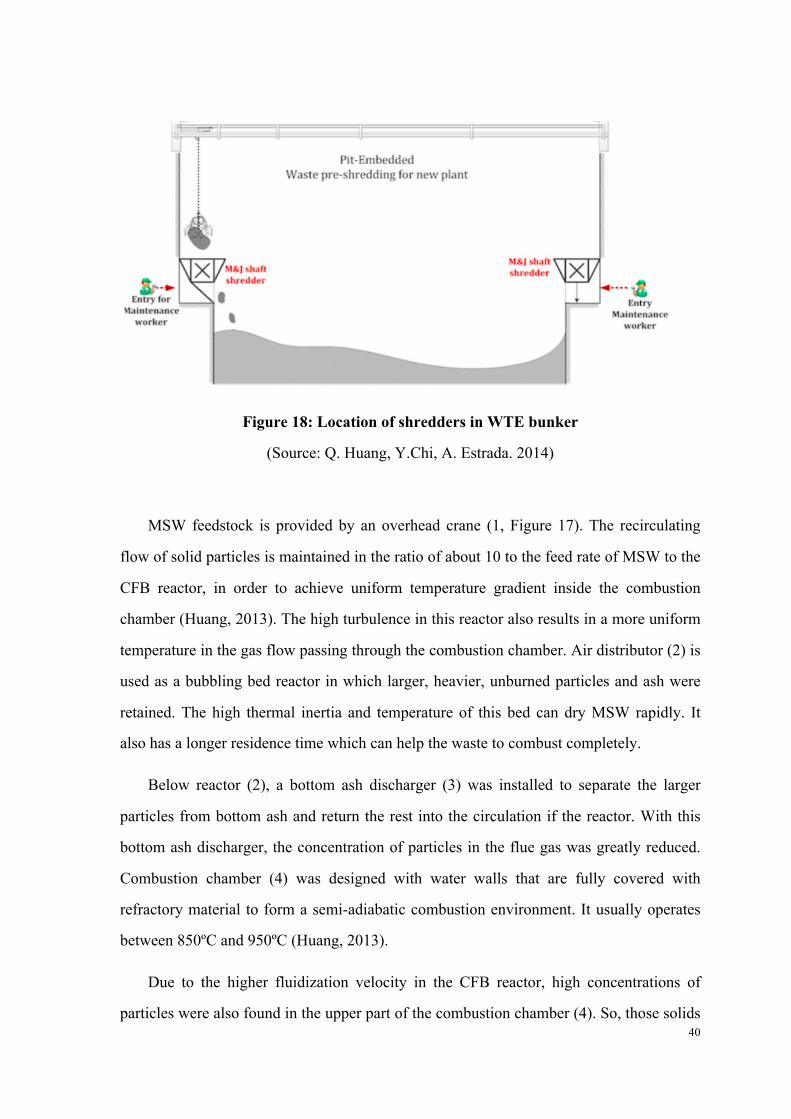
The two shredders as shown in Figure 18, was designed to improve the homogeneity
of the feedstock to less than 15cm shredded particles. Both of them will serve four lines
for this plant every day, three 500 tons lines and a new 800 tons line.
40
Figure 18: Location of shredders in WTE bunker
(Source: Q. Huang, Y.Chi, A. Estrada. 2014)
MSW feedstock is provided by an overhead crane (1, Figure 17). The recirculating
flow of solid particles is maintained in the ratio of about 10 to the feed rate of MSW to the
CFB reactor, in order to achieve uniform temperature gradient inside the combustion
chamber (Huang, 2013). The high turbulence in this reactor also results in a more uniform
temperature in the gas flow passing through the combustion chamber. Air distributor (2) is
used as a bubbling bed reactor in which larger, heavier, unburned particles and ash were
retained. The high thermal inertia and temperature of this bed can dry MSW rapidly. It
also has a longer residence time which can help the waste to combust completely.
Below reactor (2), a bottom ash discharger (3) was installed to separate the larger
particles from bottom ash and return the rest into the circulation if the reactor. With this
bottom ash discharger, the concentration of particles in the flue gas was greatly reduced.
Combustion chamber (4) was designed with water walls that are fully covered with
refractory material to form a semi-adiabatic combustion environment. It usually operates
between 850ºC and 950ºC (Huang, 2013).
Due to the higher fluidization velocity in the CFB reactor, high concentrations of
particles were also found in the upper part of the combustion chamber (4). So, those solids
41
(mainly unburned waste and bed material) must be separated from the flue gas before the
hot gas enters the convective pass (Joris Koornneef, 2006). The particles were collected
and separated from the gas in a cyclone separator (5) through centrifugal force. After the
cyclone separator (5), a superheater (6) was installed followed by air preheater (8) and
economizer (7). (8) is placed before (7) to increase the primary air temperature to 300 °C
and improve combustion in the CFB unit (Huang, 2013).
4.2.3 Advantages of CFB
CFB has the same high combustion efficiency as moving grate and also has high
adaptability to different kinds of MSW. So, CFB technology can combust almost all kinds
of MSW after shredding and has a lower capital cost in the meantime. The temperature in
the entire combustion chamber can be well controlled in the range of 800 to 950 °C. With
this uniform temperature gradient and long residence time, emission of pollutant gases
such as Oxynitride (NOx), HCl and SO2 can be effectively controlled. In addition, the high
turbulence in the CFB reactor can significantly improve the mixing of incoming cold
MSW with a high-temperature bed. CFB reactor also has outstanding load adjusting
capability and excellent capability of co-combustion (Huang, 2013).
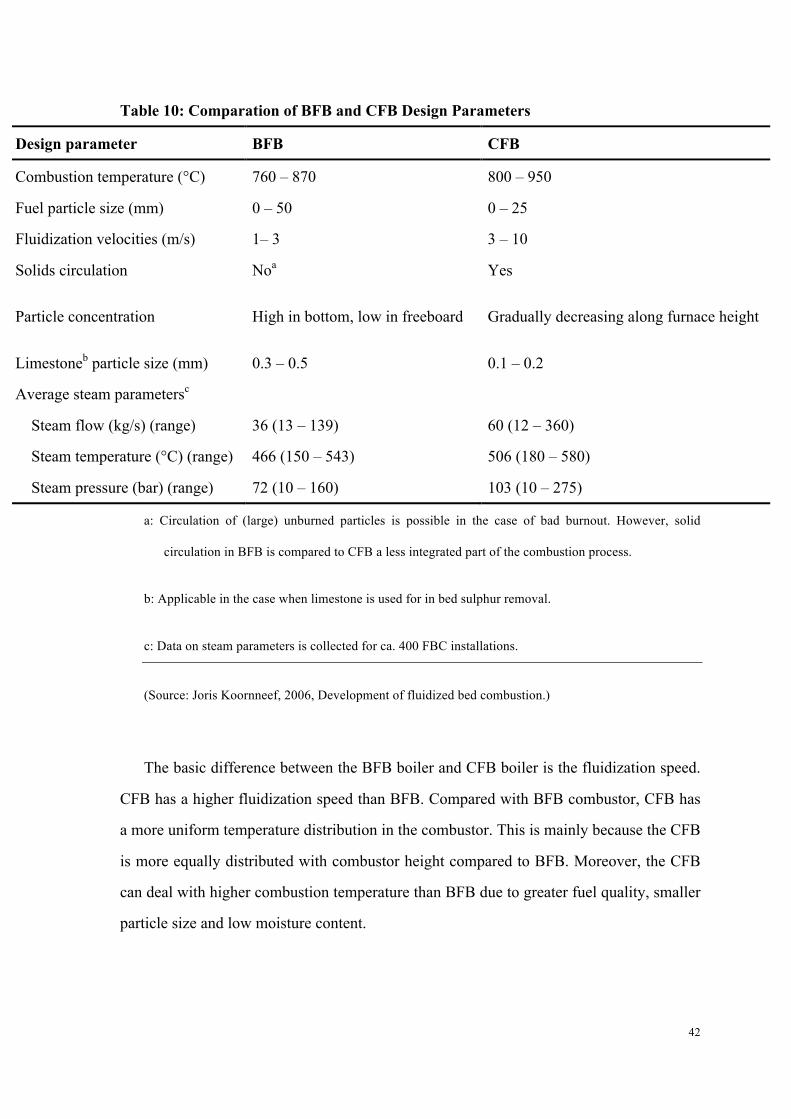
4.3 Comparation of BFB and CFB
Both Circulating Fluidized Bed (CFB) and Bubbling Fluidized Bed (BFB) are
variants of Fluidized Bed Combustion (FBC). Although they are based on the same
principle, the design parameters of installations vary widely. Table 10 shows the detailed
comparison of BFB and CFB boiler.
42
Table 10: Comparation of BFB and CFB Design Parameters
Design parameter BFB CFB
Combustion temperature (°C) 760 – 870 800 – 950
Fuel particle size (mm) 0 – 50 0 – 25
Fluidization velocities (m/s) 1– 3 3 – 10
Solids circulation Noa Yes
Particle concentration High in bottom, low in freeboard Gradually decreasing along furnace height
Limestoneb particle size (mm) 0.3 – 0.5 0.1 – 0.2
Average steam parametersc
Steam flow (kg/s) (range) 36 (13 – 139) 60 (12 – 360)
Steam temperature (°C) (range) 466 (150 – 543) 506 (180 – 580)
Steam pressure (bar) (range) 72 (10 – 160) 103 (10 – 275)
a: Circulation of (large) unburned particles is possible in the case of bad burnout. However, solid
circulation in BFB is compared to CFB a less integrated part of the combustion process.
b: Applicable in the case when limestone is used for in bed sulphur removal.
c: Data on steam parameters is collected for ca. 400 FBC installations.
(Source: Joris Koornneef, 2006, Development of fluidized bed combustion.)
The basic difference between the BFB boiler and CFB boiler is the fluidization speed.
CFB has a higher fluidization speed than BFB. Compared with BFB combustor, CFB has
a more uniform temperature distribution in the combustor. This is mainly because the CFB
is more equally distributed with combustor height compared to BFB. Moreover, the CFB
can deal with higher combustion temperature than BFB due to greater fuel quality, smaller
particle size and low moisture content.
43
The combustion efficiency is the ability of a furnace to burn carbon. Due to better
mixing of the bed mixture and smaller fuel particles, CFB has higher efficiency than BFB
boiler.
CFB is more effective in sulfur removal than BFB. In CFB beds, limestone particles
are more likely to collide with sulfur particles than BFB, resulting in better sulfur removal.
Right now, in a CFB boiler, more than 95% of sulfur can be removed by the technology of
in-bed sorbent injection.
5. PRE-FEASIBILITY ANALYSIS OF CFB WTE PLANT IN HK
5.1 Advantages of using WTE plant
Energy from waste offers recovery of energy by conversion of non-recyclable
materials through various processes including thermal and non-thermal technologies. The
energy that is produced in the form of electricity, heat or fuel using combustion, pyrolysis,
gasification or anaerobic digestion is clean and renewable energy, with reduced carbon
emissions and minimal environmental impact than any other form of energy.
Compared to Landfilling waste, Waste-to-Energy facilities offer several
advantages as follow:
● Resource savings and recovery greatly expanded.
● Waste to Energy facility generates power in the form of electricity or steam.
● Waste to Energy is a Net Greenhouse Gas Reducer.
● Landfill usage and landfill expansions greatly reduced.
● Trucking of waste long distances can be greatly reduced.
● Tipping fees remain in the community where the waste is generated.
● Enhancement of community economy by creating more full-time jobs.
5.2 Regulations
44
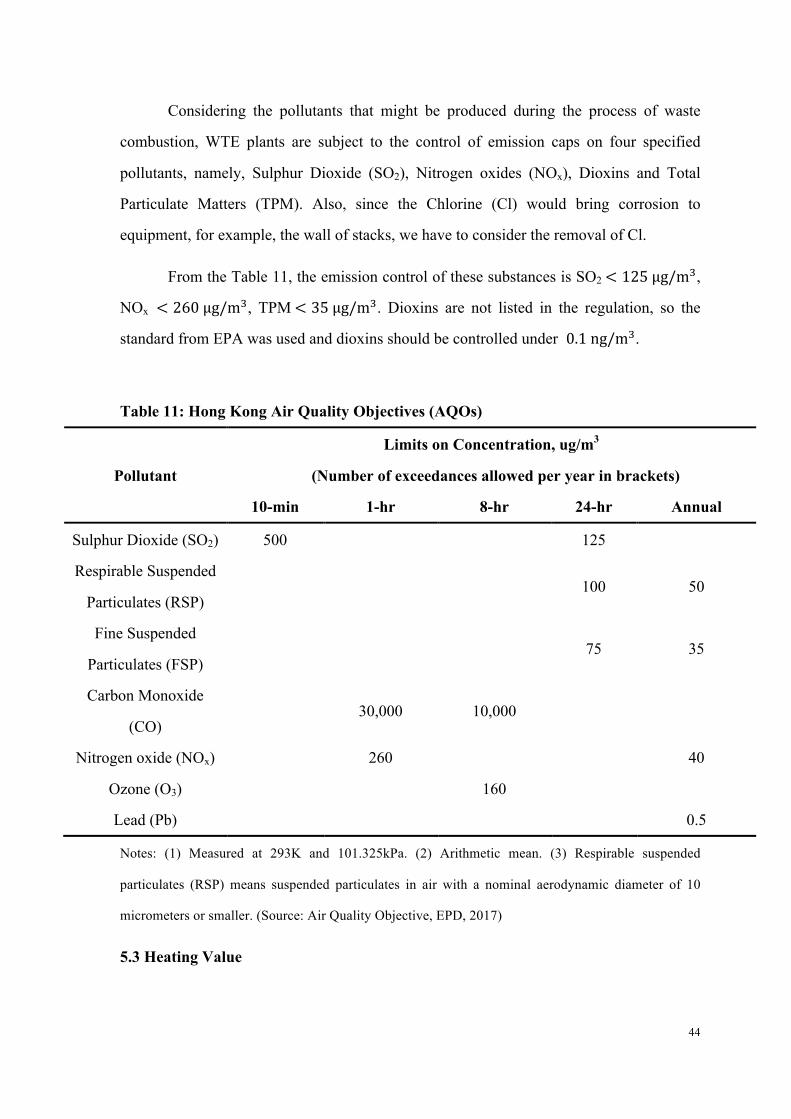
Considering the pollutants that might be produced during the process of waste
combustion, WTE plants are subject to the control of emission caps on four specified
pollutants, namely, Sulphur Dioxide (SO2), Nitrogen oxides (NOx), Dioxins and Total
Particulate Matters (TPM). Also, since the Chlorine (Cl) would bring corrosion to
equipment, for example, the wall of stacks, we have to consider the removal of Cl.
From the Table 11, the emission control of these substances is SO2 < 125 µg/m!,
NOx < 260 µg/m!, TPM < 35 µg/m!. Dioxins are not listed in the regulation, so the
standard from EPA was used and dioxins should be controlled under 0.1 ng/m!.
Table 11: Hong Kong Air Quality Objectives (AQOs)
Pollutant
Limits on Concentration, ug/m3
(Number of exceedances allowed per year in brackets)
10-min 1-hr 8-hr 24-hr Annual
Sulphur Dioxide (SO2) 500 125
Respirable Suspended
Particulates (RSP) 100 50
Fine Suspended
Particulates (FSP) 75 35
Carbon Monoxide
(CO) 30,000 10,000
Nitrogen oxide (NOx) 260 40
Ozone (O3) 160
Lead (Pb) 0.5
Notes: (1) Measured at 293K and 101.325kPa. (2) Arithmetic mean. (3) Respirable suspended
particulates (RSP) means suspended particulates in air with a nominal aerodynamic diameter of 10
micrometers or smaller. (Source: Air Quality Objective, EPD, 2017)
5.3 Heating Value
45
The heating value (or energy value or calorific value) of a substance, usually a fuel or
food (see food energy), is the amount of heat released during the combustion of a
specified amount of it.15 Energy from Waste (EfW) plants are capital intensive and have
high operating cost. Therefore, in order to make the concept economically attractive,
revenue from recycled products is used to offset some of the increased costs. A survey of
revenues for such a system shows that fuel can account for about 80% of the revenues,
while ferrous metals 10%, glass 5%, and aluminum 5%. Therefore, the heating value of
the fuel is a key factor for incomes. (STANLEY T.)
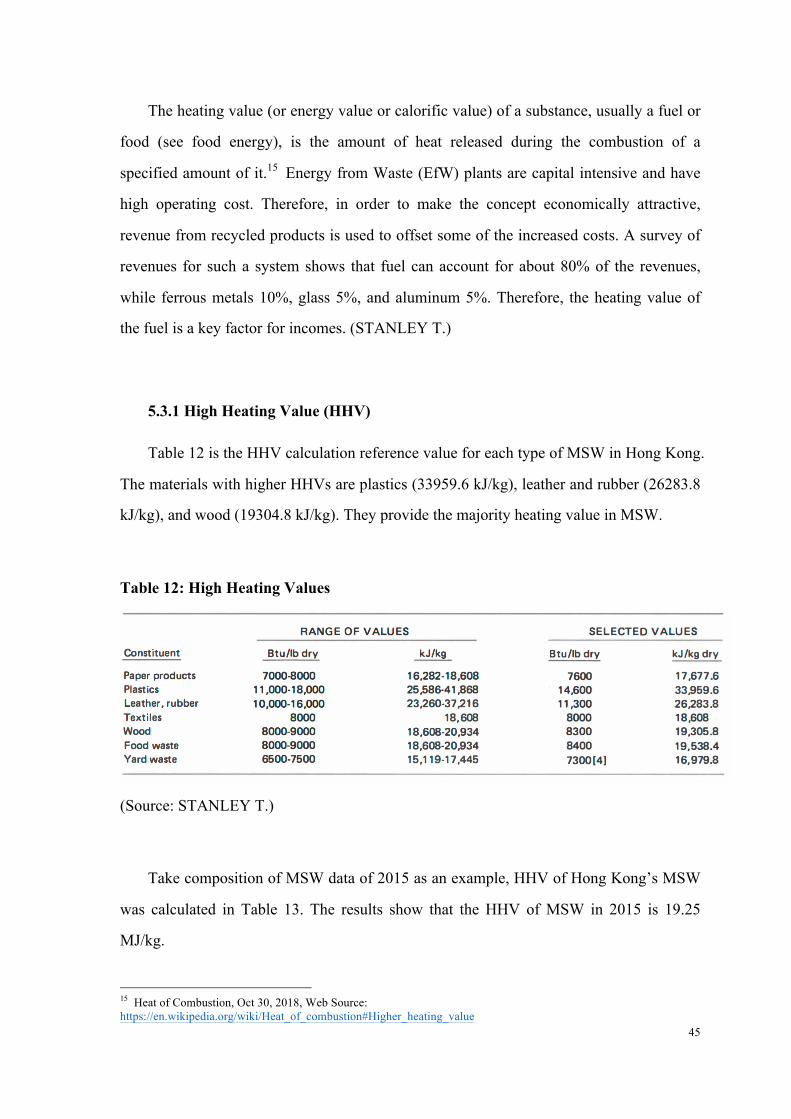
5.3.1 High Heating Value (HHV)
Table 12 is the HHV calculation reference value for each type of MSW in Hong Kong.
The materials with higher HHVs are plastics (33959.6 kJ/kg), leather and rubber (26283.8
kJ/kg), and wood (19304.8 kJ/kg). They provide the majority heating value in MSW.
Table 12: High Heating Values
(Source: STANLEY T.)
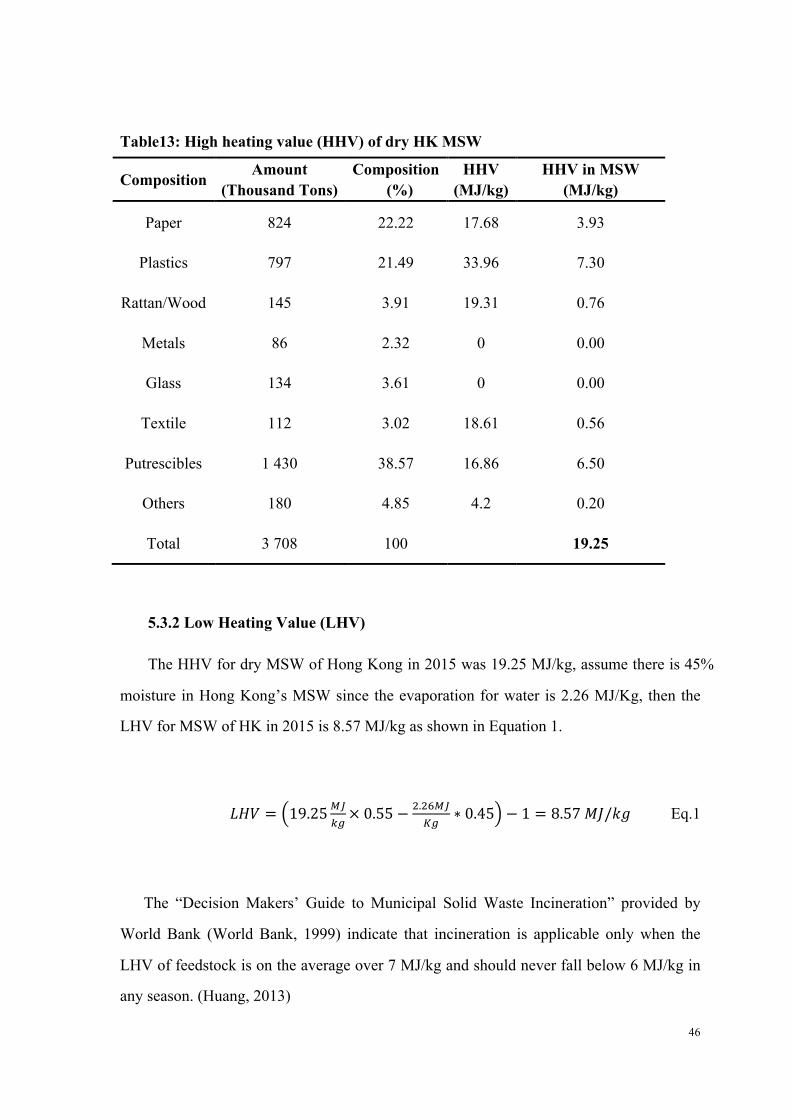
Take composition of MSW data of 2015 as an example, HHV of Hong Kong’s MSW
was calculated in Table 13. The results show that the HHV of MSW in 2015 is 19.25
MJ/kg.
15 Heat of Combustion, Oct 30, 2018, Web Source: https://en.wikipedia.org/wiki/Heat_of_combustion#Higher_heating_value
46
Table13: High heating value (HHV) of dry HK MSW
Composition Amount (Thousand Tons)
Composition (%)
HHV (MJ/kg)
HHV in MSW (MJ/kg)
Paper 824 22.22 17.68 3.93
Plastics 797 21.49 33.96 7.30
Rattan/Wood 145 3.91 19.31 0.76
Metals 86 2.32 0 0.00
Glass 134 3.61 0 0.00
Textile 112 3.02 18.61 0.56
Putrescibles 1 430 38.57 16.86 6.50
Others 180 4.85 4.2 0.20
Total 3 708 100 19.25
5.3.2 Low Heating Value (LHV)
The HHV for dry MSW of Hong Kong in 2015 was 19.25 MJ/kg, assume there is 45%
moisture in Hong Kong’s MSW since the evaporation for water is 2.26 MJ/Kg, then the
LHV for MSW of HK in 2015 is 8.57 MJ/kg as shown in Equation 1.
𝐿𝐻𝑉 = 19.25!"!"× 0.55− !.!"!"
!"∗ 0.45 − 1 = 8.57 𝑀𝐽/𝑘𝑔 Eq.1
The “Decision Makers’ Guide to Municipal Solid Waste Incineration” provided by
World Bank (World Bank, 1999) indicate that incineration is applicable only when the
LHV of feedstock is on the average over 7 MJ/kg and should never fall below 6 MJ/kg in
any season. (Huang, 2013)
47
As discussed earlier, the LHV of Hong Kong’s MSW is 8.57 MJ/kg, which means this
relatively low LHV reached the minimum standard of 6 MJ/kg, and slightly above the
average of 7 MJ/kg. The moisture content in MSW of Hong Kong is 45%. With such a
low heating value and high moisture content, the CFB WTE Plant seems to be the
optimum technology for Hong Kong’s current situation.
5.4 R1 Formula
According to the HHV calculated earlier, Heat Losses, Turbine losses, plant
consumption, and energy exported to the grid can be calculated through equation 2 to 6 as
shown.
𝐻𝐻𝑉 = 19.25!"!"×2.78×10!!" !"!
!×10! !
!"×10! !"
!"#= 5.35 𝑀𝑊ℎ/𝑡𝑜𝑛 Eq.2
𝐻𝑒𝑎𝑡 𝑙𝑜𝑠𝑠𝑒𝑠 = 5.35×0.1 = 0.54 Eq.3
𝑇𝑢𝑟𝑏𝑖𝑛𝑒 𝑙𝑜𝑠𝑠𝑒𝑠 = (5.35− 0.54)×0.72 = 3.46 Eq.4
𝑃𝑙𝑎𝑛𝑡 𝑐𝑜𝑛𝑠𝑢𝑚𝑝𝑡𝑖𝑜𝑛 = (5.35− 0.54− 3.46)×0.15 = 0.2 Eq.5
𝐸𝑛𝑒𝑟𝑔𝑦 𝑒𝑥𝑝𝑜𝑟𝑡𝑒𝑑 𝑡𝑜 𝑡ℎ𝑒 𝑔𝑟𝑖𝑑 = 5.35− (0.54+ 3.46+ 0.2) = 1.15 Eq.6
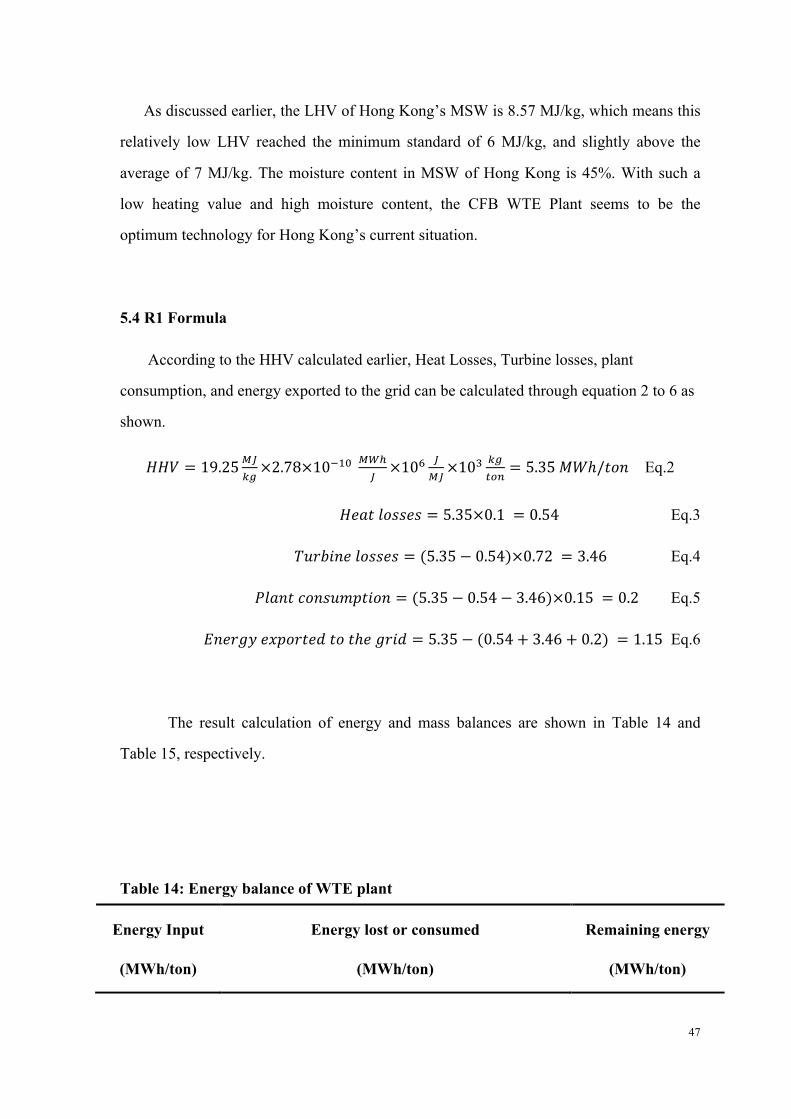
The result calculation of energy and mass balances are shown in Table 14 and
Table 15, respectively.
Table 14: Energy balance of WTE plant
Energy Input
(MWh/ton)
Energy lost or consumed
(MWh/ton)
Remaining energy
(MWh/ton)
48
Energy
in waste 5.35
Heat losses in furnace,
ash, and stack gases
(10%)
0.54
Energy
exported to
the grid
1.15 Turbine losses
3.46 (thermal efficiency
of the WTE steam
turbine is about 28%)
Plant consumption 0.2 (15% of electrical
energy)
Total 5.35 Total 4.2 Total 1.15
Table 15: Mass balance of WTE plant
Assume 60% of heat is being used in the factories near the plant, then R1 can be
calculated using equation 7.
𝑅! =!.!×!"# !"!#.! !.!×!"# !"#$!.!"×!"# !"#$%& !" !"#
= !.!×!.!"!!.!×!.!"×!.!!.!"×!.!"
= 0.91 Eq.7
Since R1 is larger than 0.65, therefore, the plant can be considered as an energy
recovery system. The best way of operating the plant in the real practice should be figured
out since the R1 formula is purely a mathematic calculation and European standard. And
Mass input (tons) Mass consumed during combustion (tons) Remaining mass (tons)
Waste 1 Mass consumed during combustion 0.75 Bottom ash 0.225
Fly ash 0.225
Total 1 Total 0.75 Total 0.225
49
this number has a close relationship with the composition of the MSW. Since the
government is promoting recycling, which indicates possible composition change in the
MSW, so this plant should always be operated under real situations.
5.5 Site Selection
Compared with landfills which are usually located at Greenfields far away from
inhabited areas, CFB WTE plants are normally sited where they can both functionally
improve nearby communities and esthetically be pleasing and attractive to visitors.
There are several factors that should be considered for the selection of the CFB
WTE plant site:
! Proximity to waste generation center
! Proximity to electricity connection lines
! Proximity to district heating or cooling
! Proximity to water
! Proximity to industrial steam consumers
! Proximity to landfill (for ash disposal)
! Access roads
! Transportation
! Utilities
After considering various factors such as topography, geology, and transportation,
Tai Chik Sha, Tseung Kwan, a location near South East New Territories (SENT) Landfill
as the final site (Figure 19).
50
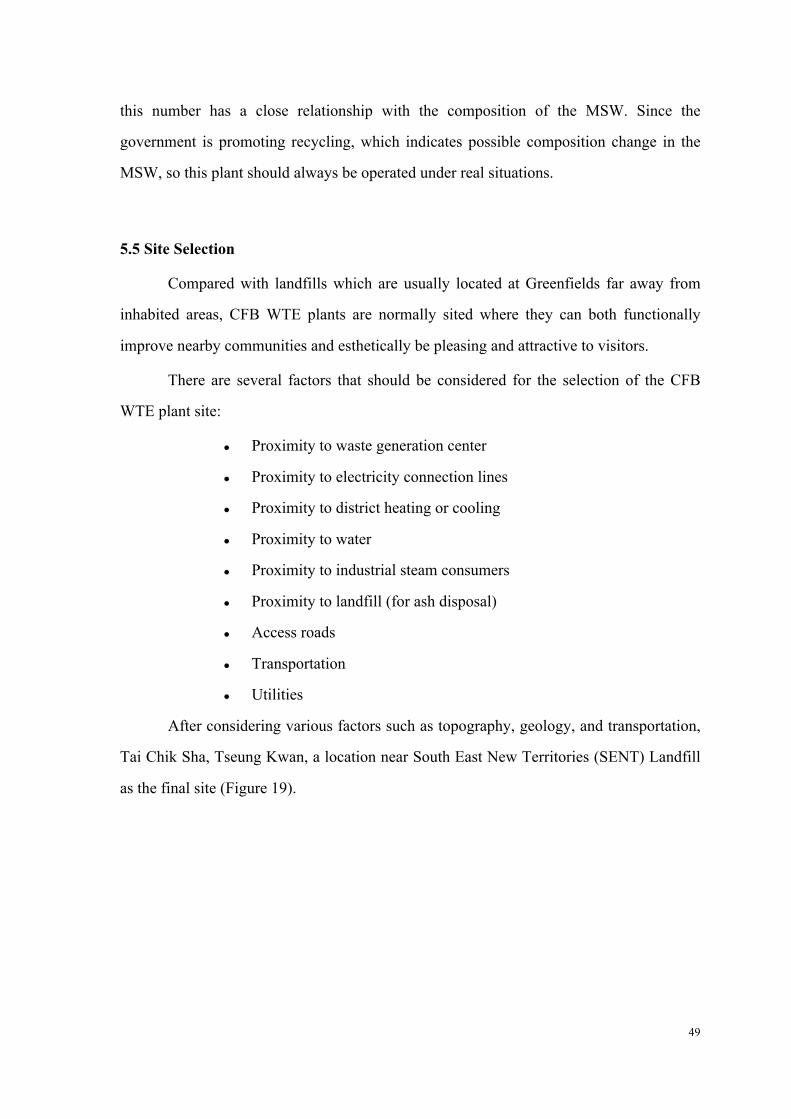
Figure 19: Route from Tai Chik Sha to SENT Landfill
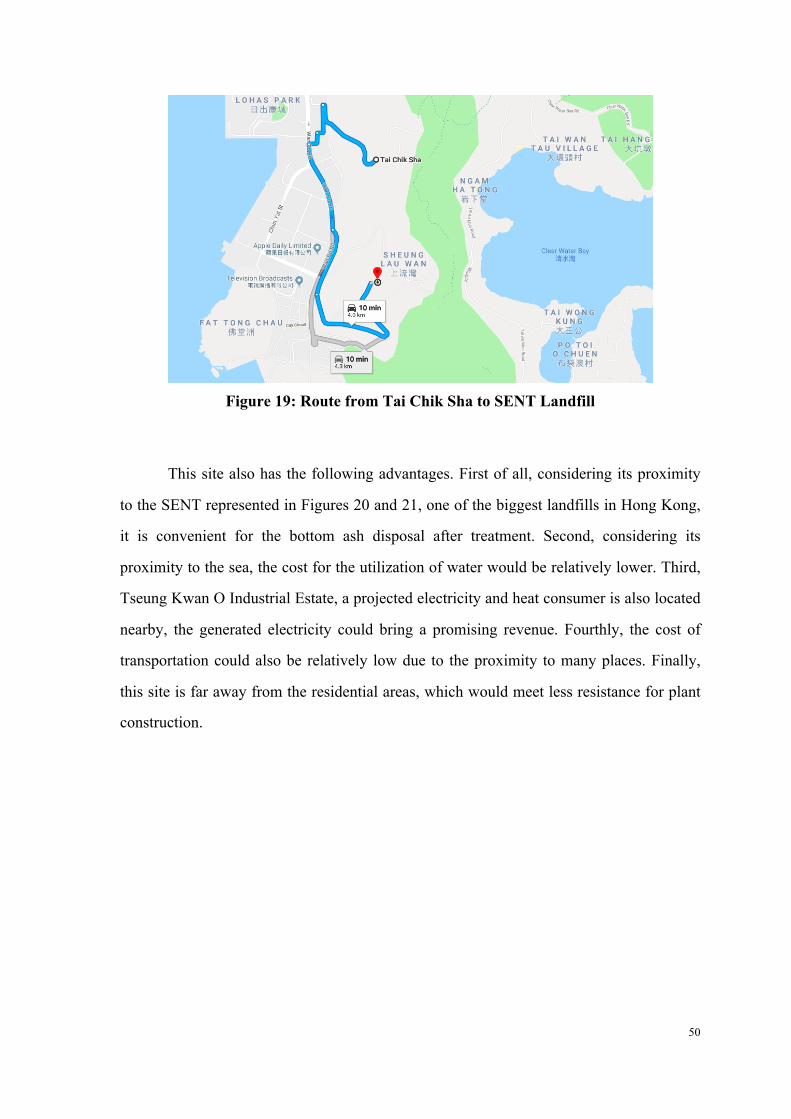
This site also has the following advantages. First of all, considering its proximity
to the SENT represented in Figures 20 and 21, one of the biggest landfills in Hong Kong,
it is convenient for the bottom ash disposal after treatment. Second, considering its
proximity to the sea, the cost for the utilization of water would be relatively lower. Third,
Tseung Kwan O Industrial Estate, a projected electricity and heat consumer is also located
nearby, the generated electricity could bring a promising revenue. Fourthly, the cost of
transportation could also be relatively low due to the proximity to many places. Finally,
this site is far away from the residential areas, which would meet less resistance for plant
construction.
51
Figure 20: Location of SENT in HK
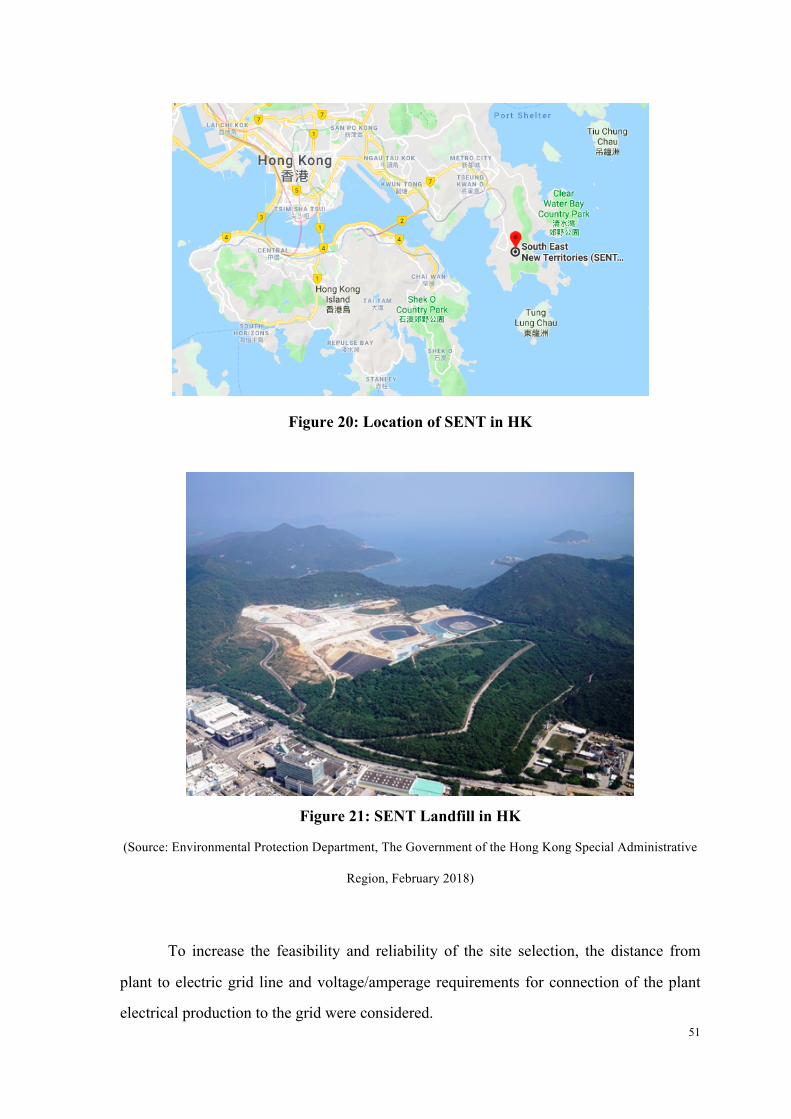
Figure 21: SENT Landfill in HK
(Source: Environmental Protection Department, The Government of the Hong Kong Special Administrative
Region, February 2018)
To increase the feasibility and reliability of the site selection, the distance from
plant to electric grid line and voltage/amperage requirements for connection of the plant
electrical production to the grid were considered.
52
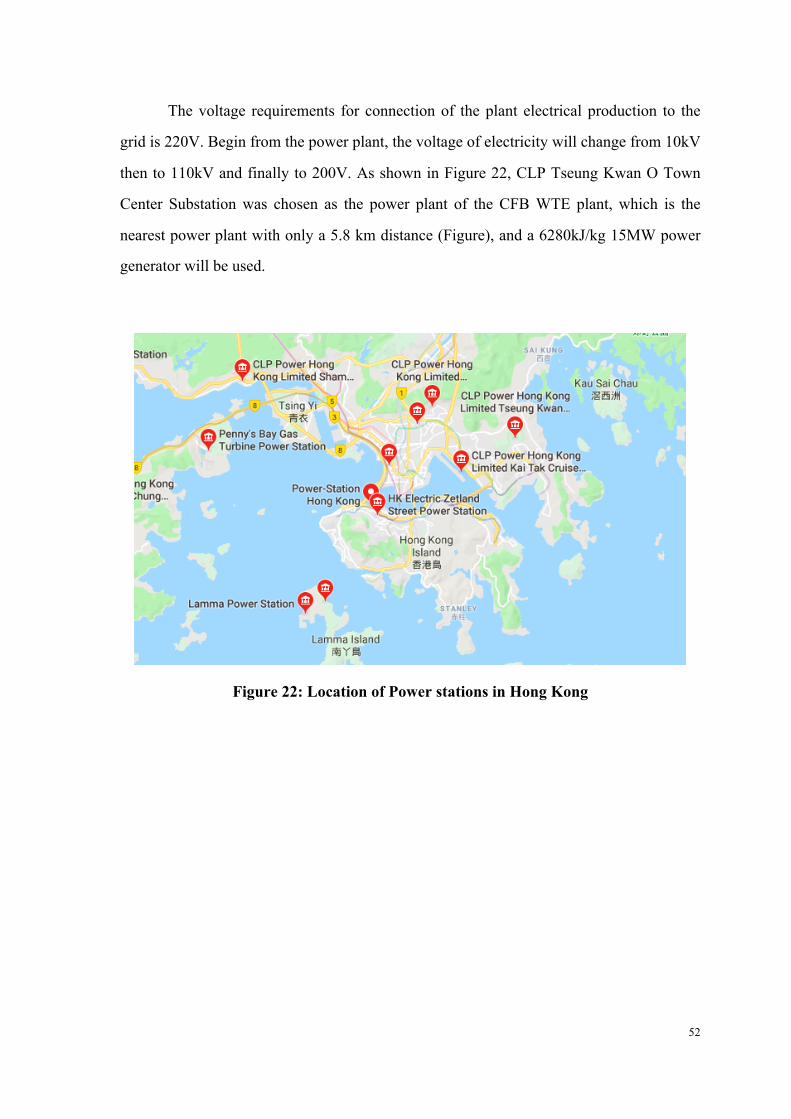
The voltage requirements for connection of the plant electrical production to the
grid is 220V. Begin from the power plant, the voltage of electricity will change from 10kV
then to 110kV and finally to 200V. As shown in Figure 22, CLP Tseung Kwan O Town
Center Substation was chosen as the power plant of the CFB WTE plant, which is the
nearest power plant with only a 5.8 km distance (Figure), and a 6280kJ/kg 15MW power
generator will be used.
Figure 22: Location of Power stations in Hong Kong
53
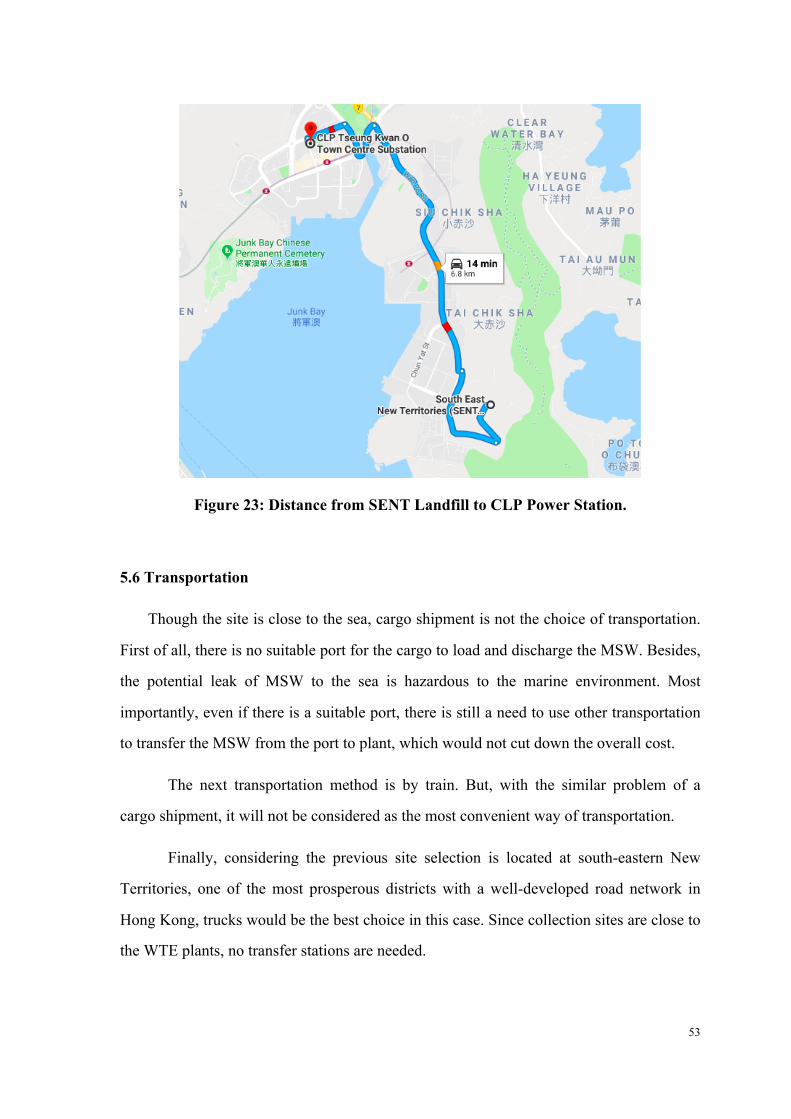
Figure 23: Distance from SENT Landfill to CLP Power Station.
5.6 Transportation
Though the site is close to the sea, cargo shipment is not the choice of transportation.
First of all, there is no suitable port for the cargo to load and discharge the MSW. Besides,
the potential leak of MSW to the sea is hazardous to the marine environment. Most
importantly, even if there is a suitable port, there is still a need to use other transportation
to transfer the MSW from the port to plant, which would not cut down the overall cost.
The next transportation method is by train. But, with the similar problem of a
cargo shipment, it will not be considered as the most convenient way of transportation.
Finally, considering the previous site selection is located at south-eastern New
Territories, one of the most prosperous districts with a well-developed road network in
Hong Kong, trucks would be the best choice in this case. Since collection sites are close to
the WTE plants, no transfer stations are needed.
54
6. CONCLUSION AND RECONMMENDATION
6.1 Conclusions
Hong Kong is a city with rapid economic growth and has the freest economy in the
world. It is currently the No. 2 importer of plastic waste worldwide (19.7%), and No. 1
exporter of plastic waste worldwide (26.9%). However, with China’s ban on importing
waste, the world’s pattern of waste disposal is about to change.
Landfilling is currently the main method of waste disposal in Hong Kong. In 2015, 5.5
million tons of solid waste were delivered to landfills, including 3.7 million tons (about
67%) of MSW. Food waste (1.4 million tons), paper (0.82 million tons), and plastic (0.80
million tons) were the top three constitutions of the MSW sent to landfills. The recovery
(recycling) rate from MSW in Hong Kong is relatively low, that is only 35.41% in 2015.
Among the materials recovered, metal recovery (92%), paper (52%), and plastic (11%) are
the top three.
Hong Kong’s operating landfills are almost full, and there is no land to build more
landfill sites. The MSW in Hong Kong contains high moisture of 45% and its Lower
Heating Value is 8.57 MJ/kg. Both the Bubbling Fluid Bed (BFB) and Circulating Fluid
Bed (CFB) technologies are well suited for high moisture content and low heating value.
In comparison to BFB, CFB has a more uniform temperature distribution in the combustor
and can be operated at higher combustion temperature. In addition, CFB has higher
efficiency, and it is more effective in sulfur removal than BFB. Moreover, BFB is only
preferred in small-scale applications. Therefore, a CFB WTE plant with a capacity of 2000
tons per day seems to be the optimum choice for Hong Kong. Tai Chik Sha, Tseung Kwan,
a location near the Sent landfill in South East New Territories, is considered to be a
suitable site for a WTE plant. Transportation of MSW to the CFB WTE plant will be by
truck.
55
6.2 Major Constraints and Recommendations on Waste Recovery/ Recycling
There are many factors that hinder the implementation of sustainable waste
management in Hong Kong.
(1) Public participation: although the public awareness of environmental protection has
increased significantly in recent years, their willingness to actively participate in waste
reduction still needs to be improved (EPD, 2012).
(2) Waste charging: according to the current situation in Hong Kong, it may not be
enough to purely promote waste avoidance on environmental reasons. Waste charging
is a key policy tool for avoiding and minimizing waste. By charging a certain fee for
generating waste, people’s waste habits and behaviors could be changed (EPD, 2012).
(3) Producer Responsibility Schemes (PRS): PRS is a key policy tool in waste
management strategy in HK; this policy requires stakeholders, including
manufacturers, importers, wholesalers, retailers, and consumers to share the
responsibility for the collection, recycling, treatment and disposal. This measure would
result in reducing the environmental impact of various products in the post-consumer
phase.16
(4) Market Demand: There are many problems with recycled materials, such as low value,
high transportation costs, and lack of market demand for recycled materials, especially
glass, wood, tires and organic materials (EPD, 2012). Therefore, the government
should encourage the use of recycled materials and give appropriate subsidies.
(5) Cost: high land prices and labor cost affect the economic viability of setting up local recycling
facilities.
6.2 Use of the WTE plant as Visitors/Education Center
The use of a WTE plant as Visitors/Education Center has lots of benefits. It could
become an excellent means for educating the general public as to the benefits of WTE and
16 Producer Responsibility, Oct 29, 2018, Environmental Protection Department, The Government of the Hong Kong Special Administrative Region, Web Source; https://www.epd.gov.hk/epd/english/environmentinhk/waste/pro_responsibility/index.html
56
sustainable waste management. In fact, in many communities, public acceptance is one of
the main obstacles to the construction of WTE plants. It is natural for residents who know
little about the WTE technique to feel anxious about it, especially with the facilities locate
near their communities.
With the help of the Visitors or Education Center, the residents could learn more
about the detailed working process of the whole plant, including some specific control
technologies of waste and emissions. For example, visitors might be surprised when
standing in front of the huge tank of waste but smell no undesirable odor. And they would
feel even safer when they get in touch with the real-time monitoring of all the emissions.
Also, both of the specialists and the public can benefit from such face-to-face
communication. For the public, concerns and questions could be solved when seeing how
the plant works with their own eyes. For the specialists, it is more direct and effective to
further understand what the public really fears, therefore the education center and CFB
WTE plant can be better improved.
Some special entertainment events and propaganda methods are encouraged to
apply to increase public acceptance as follow:
● Special days to promote environmental protection, such as environmental
protection day.
● Publish some posters and videos about the introduction of WTE plant to help
the public better understand the knowledge of the WTE plants.
● Environmental sports meetings
In general, it’s crucial to help the public realize that WTE is not only a better
treatment method compared with landfilling, but also offers other benefits, such as
conservation of land and reduction of greenhouse gases.
57
7. REFERENCES
Miller 2018: Terry Miller Anthony B. Kin James M. Roberts (2018). 2018 INDEX OF
ECONOMIC FREEDOM. Pag.214. From:
https://www.heritage.org/index/country/hongkong
EPD 2018: What can be recycled and Collection Points, Environmental Protection
Department, Feb 22, 2018, web source:
https://www.wastereduction.gov.hk/en/assistancewizard/recyc_note.htm
Wikipedia 2018: Waste management in Hong Kong, Nov 20, 2018, web source:
https://en.wikipedia.org/wiki/Waste_management_in_Hong_Kong
EPD 2016: Strategic Landfills, Environmental Protection Department, Oct 19, 2016, web
source:
https://www.epd.gov.hk/epd/english/environmentinhk/waste/prob_solutions/msw_strategi
c.html
Plastic Free Seas, 2013: Recycling in Hong Kong, Plastic Free Seas, 2013, Web Source:
http://plasticfreeseas.org/recycling-in-hong-kong.html
Foster Wheeler, 2011: Bubbling Fluidized Bed (BFB), When to use this technology? José
Alberto Pascual Peña, Foster Wheeler Global Power Group, Madrid, Spain. Presented at
IFSA 2011, Industrial Fluidization South Africa, Johannesburg, South Africa, 15-17
November 2011, TP_BFB_11_01
58
Tsiamis, 2013: Transforming the Non-Recycled Plastics of New York City to Synthetic
Oil, Demetra Tsiamis, March 2013, Department of Earth and Environmental Engineering
Fu Foundation School of Engineering & Applied Science.
Joris Koornneef, 2006: J. Koornneef, M. Junginger, A. Faaij, Development of fluidized
bed combustion - An overview of trends, performance and cost, Progress in Energy and
Combustion Science 33, pages 19– 55, 2006, Retrieved from
http://www.sciencedirect.com/science/article/pii/S0360128506000335
Lurgi Lentjes, 2004: Lurgi-Lentjes. Circulating fluidised bed, 2004 [cited; available from:
/http://www.lurgi-lentjes.de/english/nbsp/index.htmlS].
Huang, 2013: Q. Huang, Y. Chi, N. J. Themelis, A Rapidly Emerging WTE Technology:
Circulating Fluid Bed Combustion, Proceedings of International Thermal Treatment
Technologies (IT3), San Antonio TX, October 2013, Web Source:
http://www.seas.columbia.edu/earth/wtert/sofos/Rapid_Emerging_Tech_CFB.pdf
Q. Huang, Y.Chi, Nickolas. T, A. Estrada. (2014): Qunxing Huang, Yong Chi, Nickolas
Themelis, Andres Estrada. WTERT 2014 Bi-annual meeting. Rapid growth of CFB WTE
technology in China. New York, NY, USA. Web Source:
http://www.seas.columbia.edu/earth/wtert/meet2014/Proceedings/presentations/Huang_Es
trada.pdf
World bank, 1999: World bank, Decision Makers’ Guide to Municipal Solid Waste
Incineration, 1999
59
STANLEY T.: HEATING VALUE OF REFUSE DERIVED FUEL, STANLEY T.
MRUS, Burns and Roe Industrial Services Corp. Paramus, N.J., CLOVIS A.
PRENDERGAST, DSI/Resource Systems Group, Inc. Boston, Massachusetts. Web
Source:
http://www.seas.columbia.edu/earth/wtert/sofos/nawtec/1978-National-Waste-Processing-
Conference/1978-National-Waste-Processing-Conference-27.pdf
Yang, 2018: Study on the moisture content and its features for municipal solid waste
fractions in China. YANG Na1, SHAO Li-ming2, HE Pin-jing2 (1.Shenzhen Academy of
Environmental Science, Shenzhen 518001, China;2.Institute of Waste Treatment and
Reclamation, Tongji University, Shanghai 200092, China). China Environmental Science,
2018,38(3):1033~1038
EPD, 2012: Recovery and Recycling of Municipal Solid Waste in Hong Kong , section 1.5,
Waste Reduction and EcoPark Group Environmental Protection Department , March
2012 , Web Source: https://www.wastereduction.gov.hk/sites/default/files/wr_msw.pdf
Air Quality Objective, EPD, 2017: Hong Kong’s Air Quality Objectives, Environmental
Protection Department, The Government of the Hong Kong Special Administrative
Region, August 4, 2017, web source:
https://www.epd.gov.hk/epd/english/environmentinhk/air/air_quality_objectives/air_qualit
y_objectives.html
Engstrom F,1999: Engstrom F, Pai D. Fluidised bed combustion technology— the past,
the present, the future. Modern Power Systems, 1999. p. 21–26.
60
Watson, 1997: Watson WJ. Success in the electric power industry: combined cycle gas
turbines and fluidised beds. In: Science policy research unit. Sussex: University of Sussex;
1997.
B&W: Bubbling Fluidized-Bed Boilers, Burning Biomass and Low-Cost Fuels, Clean,
efficient, reliable, and easy to operate, B&W, web source:
https://www.babcock.com/products/-/media/7766c8a3e8a4418680419b95cb0b9c70.ashx