Embed Size (px)
Citation preview
11
Issues and Ideas in Education Vol-6, No-1 March 2018
pp. 11–28
https://doi.org/10.15415/iie.2018.61001
Applying Addie Model To Evaluate Faculty Development Program
ATUL BAMRARA
Academic Counselor School of Computer & Information SciencesIndira Gandhi National Open University
Email: [email protected]
Received: November 28, 2017| Revised: January 05, 2018| Accepted: January 08, 2018
Published online: March 05, 2018 The Author(s) 2018. This article is published with open access at www.chitkara.edu.in/publications
Abstract We exist in a technology era where everything is controlled via electronic devices and education is also highly impacted from ICT (Information and Communication Technology) tools (Bates, 2000). The present study is an attempt to highlight the training need analysis approach and its applicability. Further, it focuses on the application of information and communication technology tools to analyze the data patterns during training need. ADDIE (Analysis, Design, Development, Implementation, Evaluation) approach has been chosen to explore the correlation between techniques/ approaches of training need analysis and evaluation of training program for n=100. The respondents have been surveyed to express their views on five levels of ADDIE Model. Further, an association has been explored between the demographics of trainers and design & development process of the training programs.
Keywords: ADDIE, Instructional Design, Training, In-Service, SPSS
JEL CLASSIFICATION
M53, I21, I28
EDUCATION – AN INTRODUCTION
Education is provided by public and private institutions in India and it is the responsibility of central and state governments to provide educational facilities to compatriots. Since independence, different Commissions, Policies, Laws, Rules, and Regulations have been formulated both at the School level and at the level of higher education to improve the state of education. After independence, it was created by policymakers and in accordance with Article 45 of the Indian Constitution –
12
Bamrara, A “The State shall endeavor to provide, within a period of ten years from the commencement of this Constitution, for free and compulsory education for all children until they complete the age of fourteen years (MHRD, 2017).”1
Articles 15, 16, 19, 28, 25, 29, 46, 146, 244, 330 and 335 of the Indian Constitution contain various constitutional provisions regarding education and equity. Despite all these constitutional and legislative provisions, the result is not as healthy as it should be. The child is at the center of our entire educational system and teachers play a fundamental rule in the formation of the child’s ideology. The quality of education depends to a large extent on the quality of its teachers, but this observation has not been extended to the intention that quality teachers come out from the institutions where scholastic teacher educators exist. A significant contribution to teacher preparation in developing teachers’ aptitude for examining teaching from the point of view of students brings different experiences and similarities in the classroom (Darling-Hammond, 2000). However, there are serious drawbacks in teacher preparation programs both in the service and before the service. Teachers’ education persists with low “ecological validity” and underlines the tensions in the selection and technical experience of DIET staff and in their attitudes towards basic teachers, which limit their engagement in local contexts (Dyer et al., 2004). According to Anurag Behar, CEO of the Azim Premji Foundation, there are four methods to improve our education system2–
In order to perform better, the faculties must be paid better, which will then lead to improvement (Ballou & Podgursky, 1997).
Governments should attempt and attract scholastic fraternity to become teachers. Coherent salary packages, high standard recruitment practices and conditions to support professional satisfaction are some key areas which should be kept in consideration.
There is no alternate of a good teacher and the capacities of teachers must be developed to perform better via high quality teacher trainings.
The teachers who are more prepared for teaching are more confident and successful with students than those who have had little or none (Darling-Hammond, 2000). The research also indicates that the reforms in teacher training creating more tightly integrated programs with specialized coursework on teaching and learning construct teachers who are more effective as well as more 1 http://mhrd.gov.in/directive_principles_of_state_policy_article-452 http://www.livemint.com/Opinion/fneTCbkEoKXbS1DzaZur8M/How-to-
improve-education.html
Applying Addie Model To
Evaluate Faculty Development
Program
13
likely to come into and stay in teaching profession. The policies implemented by states regarding teacher training and professional development may create a significant difference in the qualifications and capacities that teachers bring to their profession (Darling-Hammond, 2000). Policy recommendations encompass the development and upgrading of teacher training programs in India as well as other developing countries, along with thorough research into the demographic, structural, and cultural framework for each program and focusing on the advancement of teacher knowledge and aptitude in specific subject areas (Husen et al., 1978).
1. REVIEW OF LITERATURE
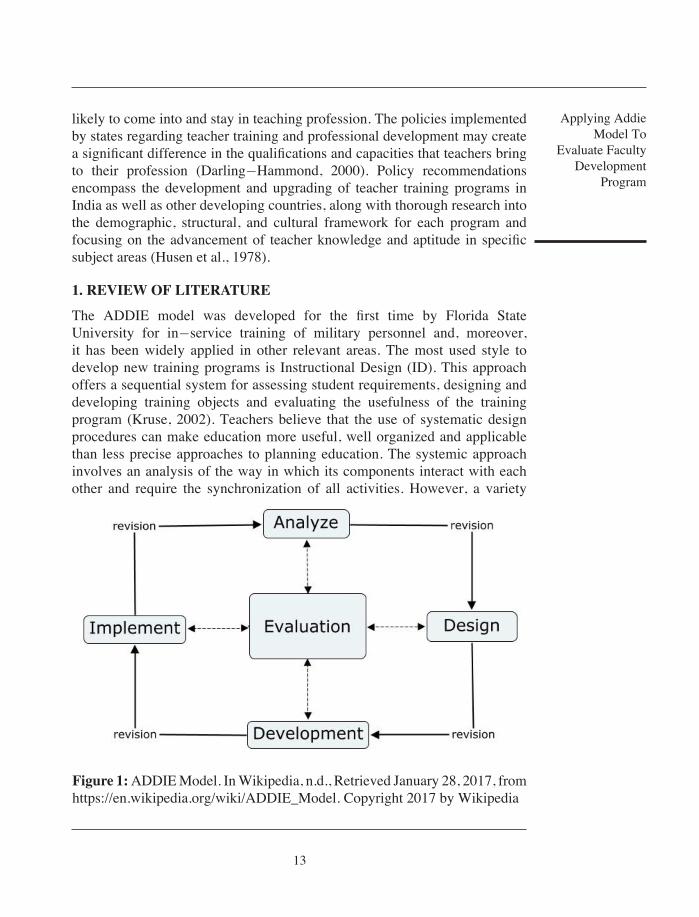
The ADDIE model was developed for the first time by Florida State University for in-service training of military personnel and, moreover, it has been widely applied in other relevant areas. The most used style to develop new training programs is Instructional Design (ID). This approach offers a sequential system for assessing student requirements, designing and developing training objects and evaluating the usefulness of the training program (Kruse, 2002). Teachers believe that the use of systematic design procedures can make education more useful, well organized and applicable than less precise approaches to planning education. The systemic approach involves an analysis of the way in which its components interact with each other and require the synchronization of all activities. However, a variety
Figure 1: ADDIE Model. In Wikipedia, n.d., Retrieved January 28, 2017, from https://en.wikipedia.org/wiki/ADDIE_Model. Copyright 2017 by Wikipedia
14
Bamrara, A of systematic identification processes have been illustrated (Dick and Carey, 1996, Gagne et al., 1974, Kemp et al. 1998, Smith and Ragan, 1998), but all descriptions include the basic components of Analysis, Design, development, implementation, and evaluation (ADDIE) to ensure the analogy between the objectives, strategies, evaluation, and effectiveness of the resulting education (Gustafson and Branch, 2002).
The ADDIE Model is a practical and easy framework for ID. The process can be applied in a multiplicity of settings, because of its methodical and generic structure. The facility provides trainers by recognizing the needs of apprentices and applies this information to the design and development of training programs (Petersen, 2003).
2. OBJECTIVES OF THE PROPOSED RESEARCH
After completing this research, we will be able-
To explore the correlation between the design/development of training and experience of trainers
To explain the relationship between the design/development of training program and academic background of the trainers
To understand the instructional design process through ADDIE Model
3. HYPOTHESIS
H0: There is no significant relationship between qualification of the trainers and Design of Training (DoT) ProgramH0: There is no significant relationship between Experience of trainers and Development of the Training Program
3. RESEARCH METHODOLOGY
ADDIE Model has been used for the purpose of research. A questionnaire has been developed using the various components of ADDIE Model, viz., Analysis, Design, Development, Implementation and Evaluation. Demographic profile of the respondents has been sought in the form of their age, work experience, designation and qualification, which will further assist the study. Respondents were supposed to supply their views on five point Likert Scale ranging from 1 - Strongly Agree (SA), 2 - Agree (A), 3 - Neutral (N), 4 - Disagree (D) and 5 - Strongly Disagree (SD). The collected data has been analyzed using R Programming to explore the necessary statistic (Chi Square Value and Karl Pearson Coefficient of Correlation) to relate various variables identified in the study.
Applying Addie Model To
Evaluate Faculty Development
Program
15
4. SAMPLING
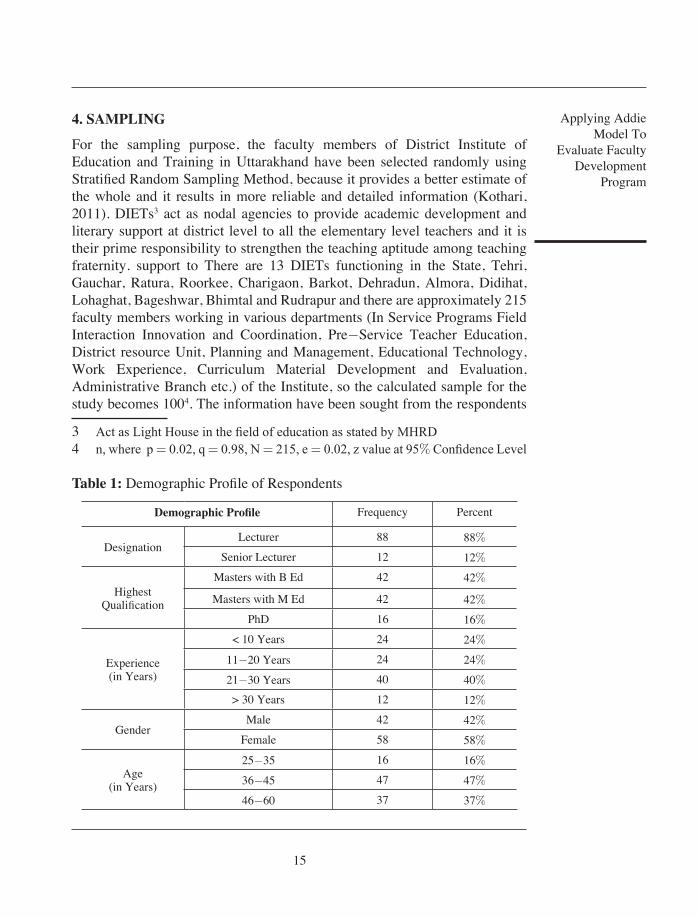
For the sampling purpose, the faculty members of District Institute of Education and Training in Uttarakhand have been selected randomly using Stratified Random Sampling Method, because it provides a better estimate of the whole and it results in more reliable and detailed information (Kothari, 2011). DIETs3 act as nodal agencies to provide academic development and literary support at district level to all the elementary level teachers and it is their prime responsibility to strengthen the teaching aptitude among teaching fraternity. support to There are 13 DIETs functioning in the State, Tehri, Gauchar, Ratura, Roorkee, Charigaon, Barkot, Dehradun, Almora, Didihat, Lohaghat, Bageshwar, Bhimtal and Rudrapur and there are approximately 215 faculty members working in various departments (In Service Programs Field Interaction Innovation and Coordination, Pre-Service Teacher Education, District resource Unit, Planning and Management, Educational Technology, Work Experience, Curriculum Material Development and Evaluation, Administrative Branch etc.) of the Institute, so the calculated sample for the study becomes 1004. The information have been sought from the respondents
3 Act as Light House in the field of education as stated by MHRD 4 n, where p = 0.02, q = 0.98, N = 215, e = 0.02, z value at 95% Confidence Level
Table 1: Demographic Profile of Respondents
Demographic Profile Frequency Percent
DesignationLecturer 88 88%
Senior Lecturer 12 12%
Highest Qualification
Masters with B Ed 42 42%
Masters with M Ed 42 42%PhD 16 16%
Experience(in Years)
< 10 Years 24 24%
11-20 Years 24 24%
21-30 Years 40 40%> 30 Years 12 12%
GenderMale 42 42%
Female 58 58%
Age (in Years)
25-35 16 16%
36-45 47 47%
46-60 37 37%
Bamrara, A
16
either personally, E-mail or Google Forms. The demographic profile of the respondents is presented in Table 1.
5. DATA ANALYSIS
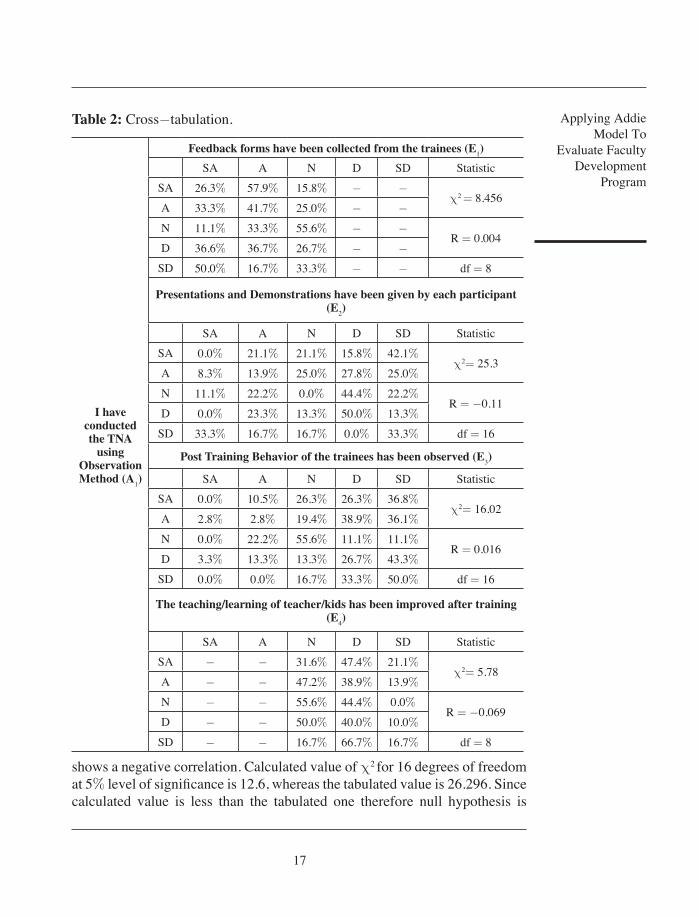
It is quite evident from Table 2 that the Karl Pearson Coefficient of Correlation for the variables A1 and E1 is 0.004 which shows a positive correlation. Calculated value of χ2 for 8 degrees of freedom at 5% level of significance is 8.456, whereas the tabulated value is 15.507. Since calculated value is less than the tabulated one therefore null hypothesis is accepted or it can be concluded that there is no significant relationship between conducting TNA using Observation method and feedback collection from trainees. The Karl Pearson Coefficient of Correlation for the variables A1 and E2 is -0.11 which shows a negative correlation. Calculated value of χ2 for 16 degrees of freedom at 5% level of significance is 25.3, whereas the tabulated value is 26.296. Since calculated value is less than the tabulated one therefore null hypothesis is accepted or it can be concluded that there is no significant relationship between conducting TNA using Observation method and demonstration of acquired skills by trainees.
The Karl Pearson Coefficient of Correlation for the variables A1 and E3 is 0.016 which shows a positive correlation. Calculated value of χ2 for 16 degrees of freedom at 5% level of significance is 16.02, whereas the tabulated value is 26.296. Since calculated value is less than the tabulated one therefore null hypothesis is accepted or it can be concluded that there is no significant relationship between conducting TNA using Observation method and post training behaviour of trainees. The Karl Pearson Coefficient of Correlation for the variables A1 and E4 is -0.069 which shows a negative correlation. Calculated value of χ2 for 8 degrees of freedom at 5% level of significance is 5.78, whereas the tabulated value is 15.507. Since calculated value is less than the tabulated one therefore null hypothesis is accepted or it can be concluded that there is no significant relationship between conducting TNA using Observation method and improvement in teaching/ learning.
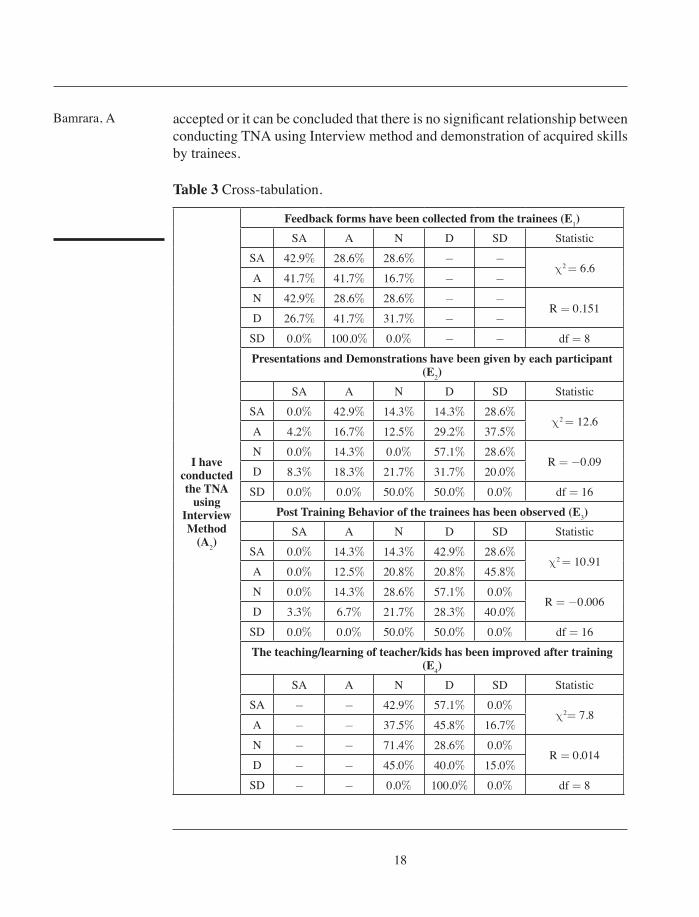
It is quite evident from Table 3 that the Karl Pearson Coefficient of Correlation for the variables A2 and E1 is 0.151 which shows a positive correlation. Calculated value of χ2 for 8 degrees of freedom at 5% level of significance is 0.151, whereas the tabulated value is 15.507. Since calculated value is less than the tabulated one therefore null hypothesis is accepted or it can be concluded that there is no significant relationship between conducting TNA using Interview method and feedback collection from trainees. The Karl Pearson Coefficient of Correlation for the variables A2 and E2 is -0.09 which
Applying Addie Model To
Evaluate Faculty Development
Program
17
Table 2: Cross-tabulation.
I have conducted the TNA
using Observation Method (A1)
Feedback forms have been collected from the trainees (E1)
SA A N D SD Statistic
SA 26.3% 57.9% 15.8% - -χ2 = 8.456
A 33.3% 41.7% 25.0% - -
N 11.1% 33.3% 55.6% - -R = 0.004
D 36.6% 36.7% 26.7% - -
SD 50.0% 16.7% 33.3% - - df = 8
Presentations and Demonstrations have been given by each participant (E2)
SA A N D SD Statistic
SA 0.0% 21.1% 21.1% 15.8% 42.1%χ2= 25.3
A 8.3% 13.9% 25.0% 27.8% 25.0%
N 11.1% 22.2% 0.0% 44.4% 22.2%R = -0.11
D 0.0% 23.3% 13.3% 50.0% 13.3%
SD 33.3% 16.7% 16.7% 0.0% 33.3% df = 16
Post Training Behavior of the trainees has been observed (E3)
SA A N D SD Statistic
SA 0.0% 10.5% 26.3% 26.3% 36.8%χ2= 16.02
A 2.8% 2.8% 19.4% 38.9% 36.1%
N 0.0% 22.2% 55.6% 11.1% 11.1%R = 0.016
D 3.3% 13.3% 13.3% 26.7% 43.3%
SD 0.0% 0.0% 16.7% 33.3% 50.0% df = 16
The teaching/learning of teacher/kids has been improved after training (E4)
SA A N D SD Statistic
SA - - 31.6% 47.4% 21.1%χ2= 5.78
A - - 47.2% 38.9% 13.9%
N - - 55.6% 44.4% 0.0%R = -0.069
D - - 50.0% 40.0% 10.0%
SD - - 16.7% 66.7% 16.7% df = 8
shows a negative correlation. Calculated value of χ2 for 16 degrees of freedom at 5% level of significance is 12.6, whereas the tabulated value is 26.296. Since calculated value is less than the tabulated one therefore null hypothesis is
Bamrara, A
18
accepted or it can be concluded that there is no significant relationship between conducting TNA using Interview method and demonstration of acquired skills by trainees.
Table 3 Cross-tabulation.
I have conducted the TNA
using Interview Method
(A2)
Feedback forms have been collected from the trainees (E1)
SA A N D SD Statistic
SA 42.9% 28.6% 28.6% - -χ2 = 6.6
A 41.7% 41.7% 16.7% - -
N 42.9% 28.6% 28.6% - -R = 0.151
D 26.7% 41.7% 31.7% - -
SD 0.0% 100.0% 0.0% - - df = 8
Presentations and Demonstrations have been given by each participant (E2)
SA A N D SD Statistic
SA 0.0% 42.9% 14.3% 14.3% 28.6%χ2 = 12.6
A 4.2% 16.7% 12.5% 29.2% 37.5%
N 0.0% 14.3% 0.0% 57.1% 28.6%R = -0.09
D 8.3% 18.3% 21.7% 31.7% 20.0%
SD 0.0% 0.0% 50.0% 50.0% 0.0% df = 16
Post Training Behavior of the trainees has been observed (E3)
SA A N D SD Statistic
SA 0.0% 14.3% 14.3% 42.9% 28.6%χ2 = 10.91
A 0.0% 12.5% 20.8% 20.8% 45.8%
N 0.0% 14.3% 28.6% 57.1% 0.0%R = -0.006
D 3.3% 6.7% 21.7% 28.3% 40.0%
SD 0.0% 0.0% 50.0% 50.0% 0.0% df = 16
The teaching/learning of teacher/kids has been improved after training (E4)
SA A N D SD Statistic
SA - - 42.9% 57.1% 0.0%χ2= 7.8
A - - 37.5% 45.8% 16.7%
N - - 71.4% 28.6% 0.0%R = 0.014
D - - 45.0% 40.0% 15.0%
SD - - 0.0% 100.0% 0.0% df = 8
Applying Addie Model To
Evaluate Faculty Development
Program
19
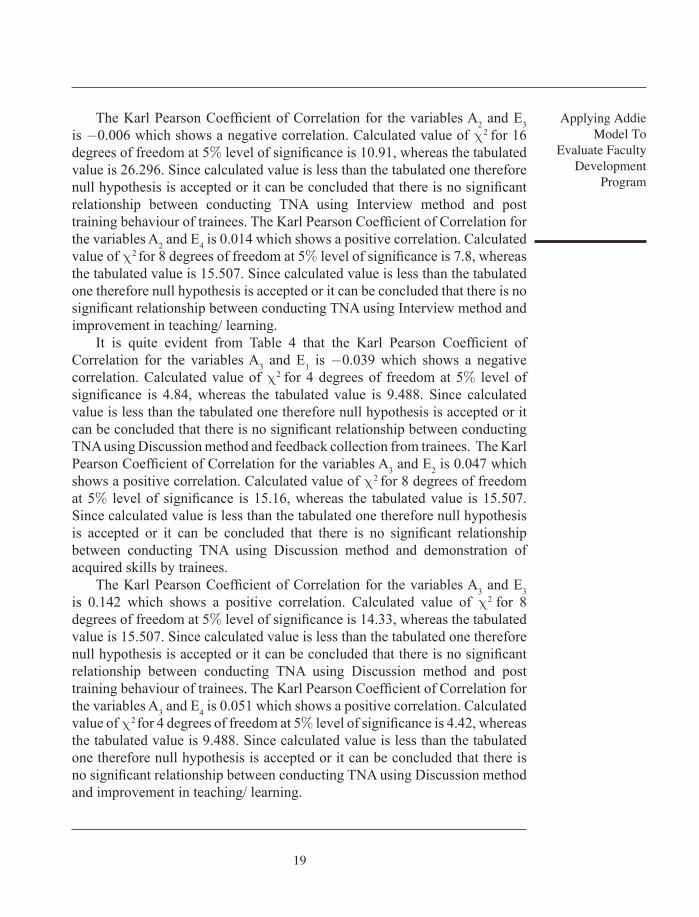
The Karl Pearson Coefficient of Correlation for the variables A2 and E3 is -0.006 which shows a negative correlation. Calculated value of χ2 for 16 degrees of freedom at 5% level of significance is 10.91, whereas the tabulated value is 26.296. Since calculated value is less than the tabulated one therefore null hypothesis is accepted or it can be concluded that there is no significant relationship between conducting TNA using Interview method and post training behaviour of trainees. The Karl Pearson Coefficient of Correlation for the variables A2 and E4 is 0.014 which shows a positive correlation. Calculated value of χ2 for 8 degrees of freedom at 5% level of significance is 7.8, whereas the tabulated value is 15.507. Since calculated value is less than the tabulated one therefore null hypothesis is accepted or it can be concluded that there is no significant relationship between conducting TNA using Interview method and improvement in teaching/ learning.
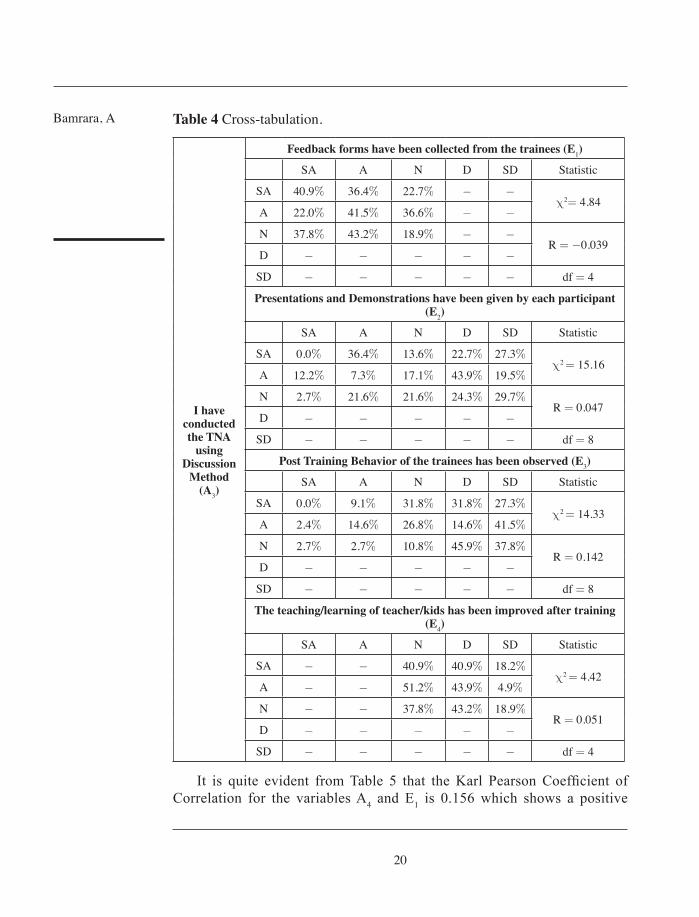
It is quite evident from Table 4 that the Karl Pearson Coefficient of Correlation for the variables A3 and E1 is -0.039 which shows a negative correlation. Calculated value of χ2 for 4 degrees of freedom at 5% level of significance is 4.84, whereas the tabulated value is 9.488. Since calculated value is less than the tabulated one therefore null hypothesis is accepted or it can be concluded that there is no significant relationship between conducting TNA using Discussion method and feedback collection from trainees. The Karl Pearson Coefficient of Correlation for the variables A3 and E2 is 0.047 which shows a positive correlation. Calculated value of χ2 for 8 degrees of freedom at 5% level of significance is 15.16, whereas the tabulated value is 15.507. Since calculated value is less than the tabulated one therefore null hypothesis is accepted or it can be concluded that there is no significant relationship between conducting TNA using Discussion method and demonstration of acquired skills by trainees.
The Karl Pearson Coefficient of Correlation for the variables A3 and E3 is 0.142 which shows a positive correlation. Calculated value of χ2 for 8 degrees of freedom at 5% level of significance is 14.33, whereas the tabulated value is 15.507. Since calculated value is less than the tabulated one therefore null hypothesis is accepted or it can be concluded that there is no significant relationship between conducting TNA using Discussion method and post training behaviour of trainees. The Karl Pearson Coefficient of Correlation for the variables A3 and E4 is 0.051 which shows a positive correlation. Calculated value of χ2 for 4 degrees of freedom at 5% level of significance is 4.42, whereas the tabulated value is 9.488. Since calculated value is less than the tabulated one therefore null hypothesis is accepted or it can be concluded that there is no significant relationship between conducting TNA using Discussion method and improvement in teaching/ learning.
Bamrara, A
20
Table 4 Cross-tabulation.
I have conducted the TNA
using Discussion
Method (A3)
Feedback forms have been collected from the trainees (E1)
SA A N D SD Statistic
SA 40.9% 36.4% 22.7% - -χ2= 4.84
A 22.0% 41.5% 36.6% - -
N 37.8% 43.2% 18.9% - -R = -0.039
D - - - - -
SD - - - - - df = 4
Presentations and Demonstrations have been given by each participant (E2)
SA A N D SD Statistic
SA 0.0% 36.4% 13.6% 22.7% 27.3%χ2 = 15.16
A 12.2% 7.3% 17.1% 43.9% 19.5%
N 2.7% 21.6% 21.6% 24.3% 29.7%R = 0.047
D - - - - -
SD - - - - - df = 8
Post Training Behavior of the trainees has been observed (E3)
SA A N D SD Statistic
SA 0.0% 9.1% 31.8% 31.8% 27.3%χ2 = 14.33
A 2.4% 14.6% 26.8% 14.6% 41.5%
N 2.7% 2.7% 10.8% 45.9% 37.8%R = 0.142
D - - - - -
SD - - - - - df = 8
The teaching/learning of teacher/kids has been improved after training (E4)
SA A N D SD Statistic
SA - - 40.9% 40.9% 18.2%χ2 = 4.42
A - - 51.2% 43.9% 4.9%
N - - 37.8% 43.2% 18.9%R = 0.051
D - - - - -
SD - - - - - df = 4
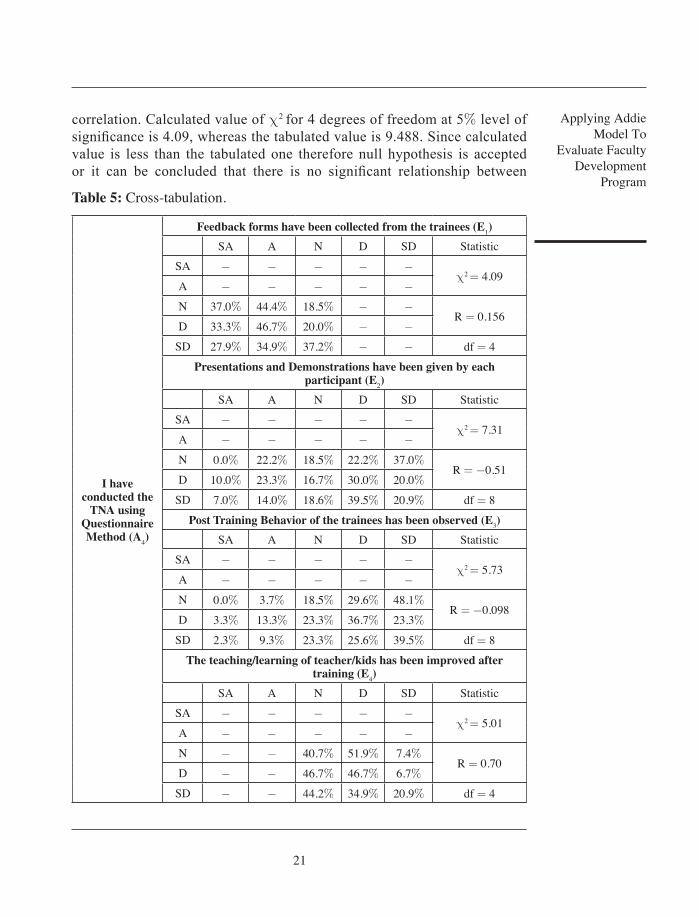
It is quite evident from Table 5 that the Karl Pearson Coefficient of Correlation for the variables A4 and E1 is 0.156 which shows a positive
Applying Addie Model To
Evaluate Faculty Development
Program
21
correlation. Calculated value of χ2 for 4 degrees of freedom at 5% level of significance is 4.09, whereas the tabulated value is 9.488. Since calculated value is less than the tabulated one therefore null hypothesis is accepted or it can be concluded that there is no significant relationship between
Table 5: Cross-tabulation.
I have conducted the
TNA using Questionnaire Method (A4)
Feedback forms have been collected from the trainees (E1)
SA A N D SD Statistic
SA - - - - -χ2 = 4.09
A - - - - -
N 37.0% 44.4% 18.5% - -R = 0.156
D 33.3% 46.7% 20.0% - -
SD 27.9% 34.9% 37.2% - - df = 4
Presentations and Demonstrations have been given by each participant (E2)
SA A N D SD Statistic
SA - - - - -χ2 = 7.31
A - - - - -
N 0.0% 22.2% 18.5% 22.2% 37.0%R = -0.51
D 10.0% 23.3% 16.7% 30.0% 20.0%
SD 7.0% 14.0% 18.6% 39.5% 20.9% df = 8
Post Training Behavior of the trainees has been observed (E3)
SA A N D SD Statistic
SA - - - - -χ2 = 5.73
A - - - - -
N 0.0% 3.7% 18.5% 29.6% 48.1%R = -0.098
D 3.3% 13.3% 23.3% 36.7% 23.3%
SD 2.3% 9.3% 23.3% 25.6% 39.5% df = 8
The teaching/learning of teacher/kids has been improved after training (E4)
SA A N D SD Statistic
SA - - - - -χ2 = 5.01
A - - - - -
N - - 40.7% 51.9% 7.4%R = 0.70
D - - 46.7% 46.7% 6.7%
SD - - 44.2% 34.9% 20.9% df = 4
Bamrara, A
22
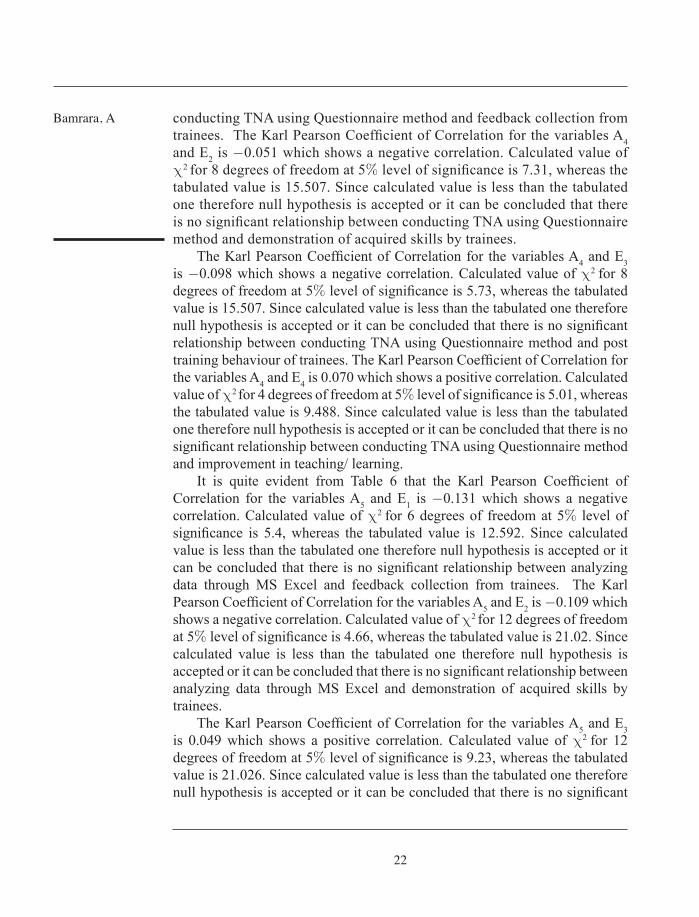
conducting TNA using Questionnaire method and feedback collection from trainees. The Karl Pearson Coefficient of Correlation for the variables A4 and E2 is -0.051 which shows a negative correlation. Calculated value of χ2 for 8 degrees of freedom at 5% level of significance is 7.31, whereas the tabulated value is 15.507. Since calculated value is less than the tabulated one therefore null hypothesis is accepted or it can be concluded that there is no significant relationship between conducting TNA using Questionnaire method and demonstration of acquired skills by trainees.
The Karl Pearson Coefficient of Correlation for the variables A4 and E3 is -0.098 which shows a negative correlation. Calculated value of χ2 for 8 degrees of freedom at 5% level of significance is 5.73, whereas the tabulated value is 15.507. Since calculated value is less than the tabulated one therefore null hypothesis is accepted or it can be concluded that there is no significant relationship between conducting TNA using Questionnaire method and post training behaviour of trainees. The Karl Pearson Coefficient of Correlation for the variables A4 and E4 is 0.070 which shows a positive correlation. Calculated value of χ2 for 4 degrees of freedom at 5% level of significance is 5.01, whereas the tabulated value is 9.488. Since calculated value is less than the tabulated one therefore null hypothesis is accepted or it can be concluded that there is no significant relationship between conducting TNA using Questionnaire method and improvement in teaching/ learning.
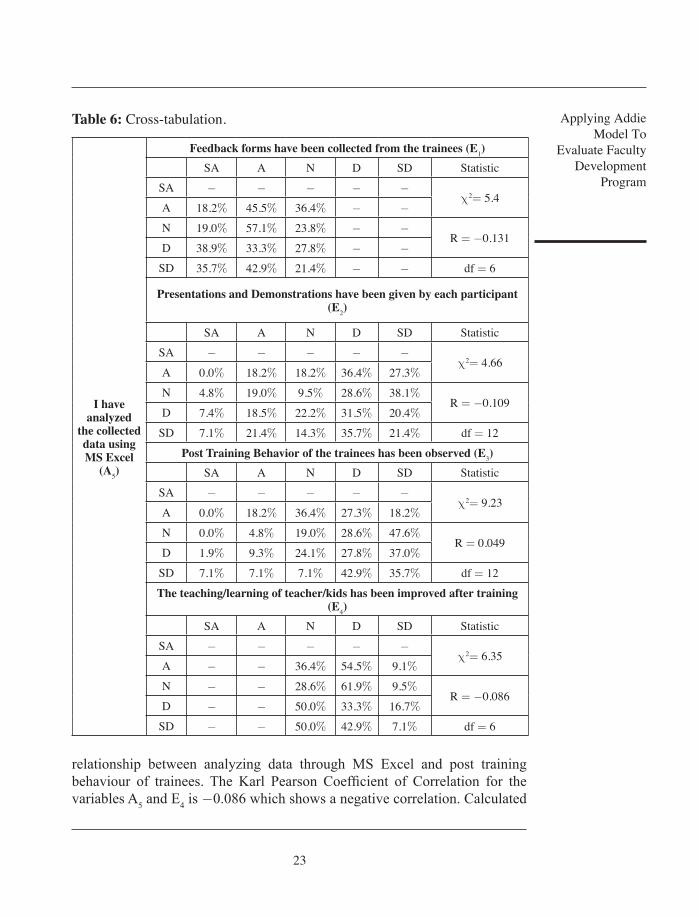
It is quite evident from Table 6 that the Karl Pearson Coefficient of Correlation for the variables A5 and E1 is -0.131 which shows a negative correlation. Calculated value of χ2 for 6 degrees of freedom at 5% level of significance is 5.4, whereas the tabulated value is 12.592. Since calculated value is less than the tabulated one therefore null hypothesis is accepted or it can be concluded that there is no significant relationship between analyzing data through MS Excel and feedback collection from trainees. The Karl Pearson Coefficient of Correlation for the variables A5 and E2 is -0.109 which shows a negative correlation. Calculated value of χ2 for 12 degrees of freedom at 5% level of significance is 4.66, whereas the tabulated value is 21.02. Since calculated value is less than the tabulated one therefore null hypothesis is accepted or it can be concluded that there is no significant relationship between analyzing data through MS Excel and demonstration of acquired skills by trainees.
The Karl Pearson Coefficient of Correlation for the variables A5 and E3 is 0.049 which shows a positive correlation. Calculated value of χ2 for 12 degrees of freedom at 5% level of significance is 9.23, whereas the tabulated value is 21.026. Since calculated value is less than the tabulated one therefore null hypothesis is accepted or it can be concluded that there is no significant
Applying Addie Model To
Evaluate Faculty Development
Program
23
Table 6: Cross-tabulation.
I have analyzed
the collected data using MS Excel
(A5)
Feedback forms have been collected from the trainees (E1)
SA A N D SD Statistic
SA - - - - -χ2= 5.4
A 18.2% 45.5% 36.4% - -
N 19.0% 57.1% 23.8% - -R = -0.131
D 38.9% 33.3% 27.8% - -
SD 35.7% 42.9% 21.4% - - df = 6
Presentations and Demonstrations have been given by each participant (E2)
SA A N D SD Statistic
SA - - - - -χ2= 4.66
A 0.0% 18.2% 18.2% 36.4% 27.3%
N 4.8% 19.0% 9.5% 28.6% 38.1%R = -0.109
D 7.4% 18.5% 22.2% 31.5% 20.4%
SD 7.1% 21.4% 14.3% 35.7% 21.4% df = 12
Post Training Behavior of the trainees has been observed (E3)
SA A N D SD Statistic
SA - - - - -χ2= 9.23
A 0.0% 18.2% 36.4% 27.3% 18.2%
N 0.0% 4.8% 19.0% 28.6% 47.6%R = 0.049
D 1.9% 9.3% 24.1% 27.8% 37.0%
SD 7.1% 7.1% 7.1% 42.9% 35.7% df = 12
The teaching/learning of teacher/kids has been improved after training (E4)
SA A N D SD Statistic
SA - - - - -χ2= 6.35
A - - 36.4% 54.5% 9.1%
N - - 28.6% 61.9% 9.5%R = -0.086
D - - 50.0% 33.3% 16.7%
SD - - 50.0% 42.9% 7.1% df = 6
relationship between analyzing data through MS Excel and post training behaviour of trainees. The Karl Pearson Coefficient of Correlation for the variables A5 and E4 is -0.086 which shows a negative correlation. Calculated
Bamrara, A
24
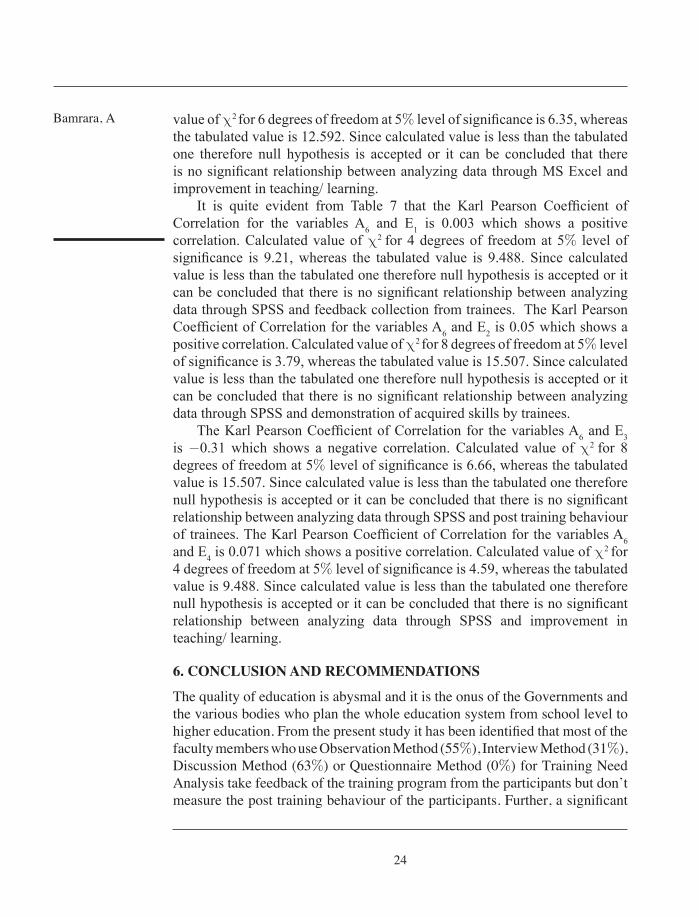
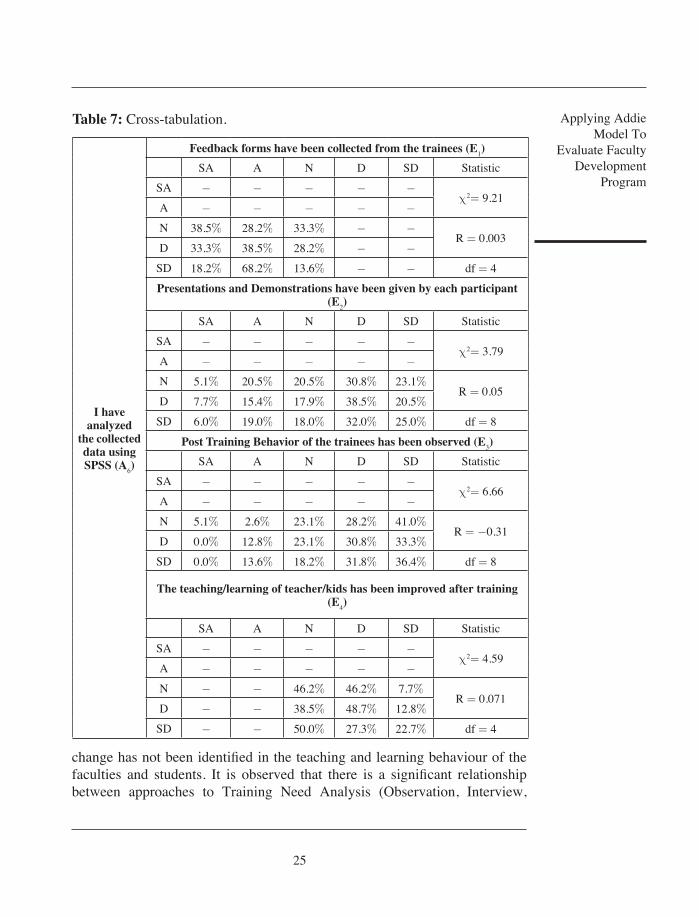
value of χ2 for 6 degrees of freedom at 5% level of significance is 6.35, whereas the tabulated value is 12.592. Since calculated value is less than the tabulated one therefore null hypothesis is accepted or it can be concluded that there is no significant relationship between analyzing data through MS Excel and improvement in teaching/ learning.
It is quite evident from Table 7 that the Karl Pearson Coefficient of Correlation for the variables A6 and E1 is 0.003 which shows a positive correlation. Calculated value of χ2 for 4 degrees of freedom at 5% level of significance is 9.21, whereas the tabulated value is 9.488. Since calculated value is less than the tabulated one therefore null hypothesis is accepted or it can be concluded that there is no significant relationship between analyzing data through SPSS and feedback collection from trainees. The Karl Pearson Coefficient of Correlation for the variables A6 and E2 is 0.05 which shows a positive correlation. Calculated value of χ2 for 8 degrees of freedom at 5% level of significance is 3.79, whereas the tabulated value is 15.507. Since calculated value is less than the tabulated one therefore null hypothesis is accepted or it can be concluded that there is no significant relationship between analyzing data through SPSS and demonstration of acquired skills by trainees.
The Karl Pearson Coefficient of Correlation for the variables A6 and E3 is -0.31 which shows a negative correlation. Calculated value of χ2 for 8 degrees of freedom at 5% level of significance is 6.66, whereas the tabulated value is 15.507. Since calculated value is less than the tabulated one therefore null hypothesis is accepted or it can be concluded that there is no significant relationship between analyzing data through SPSS and post training behaviour of trainees. The Karl Pearson Coefficient of Correlation for the variables A6 and E4 is 0.071 which shows a positive correlation. Calculated value of χ2 for 4 degrees of freedom at 5% level of significance is 4.59, whereas the tabulated value is 9.488. Since calculated value is less than the tabulated one therefore null hypothesis is accepted or it can be concluded that there is no significant relationship between analyzing data through SPSS and improvement in teaching/ learning.
6. CONCLUSION AND RECOMMENDATIONS
The quality of education is abysmal and it is the onus of the Governments and the various bodies who plan the whole education system from school level to higher education. From the present study it has been identified that most of the faculty members who use Observation Method (55%), Interview Method (31%), Discussion Method (63%) or Questionnaire Method (0%) for Training Need Analysis take feedback of the training program from the participants but don’t measure the post training behaviour of the participants. Further, a significant
Applying Addie Model To
Evaluate Faculty Development
Program
25
Table 7: Cross-tabulation.
I have analyzed
the collected data using SPSS (A6)
Feedback forms have been collected from the trainees (E1)
SA A N D SD Statistic
SA - - - - -χ2= 9.21
A - - - - -
N 38.5% 28.2% 33.3% - -R = 0.003
D 33.3% 38.5% 28.2% - -
SD 18.2% 68.2% 13.6% - - df = 4
Presentations and Demonstrations have been given by each participant (E2)
SA A N D SD Statistic
SA - - - - -χ2= 3.79
A - - - - -
N 5.1% 20.5% 20.5% 30.8% 23.1%R = 0.05
D 7.7% 15.4% 17.9% 38.5% 20.5%
SD 6.0% 19.0% 18.0% 32.0% 25.0% df = 8
Post Training Behavior of the trainees has been observed (E3)
SA A N D SD Statistic
SA - - - - -χ2= 6.66
A - - - - -
N 5.1% 2.6% 23.1% 28.2% 41.0%R = -0.31
D 0.0% 12.8% 23.1% 30.8% 33.3%
SD 0.0% 13.6% 18.2% 31.8% 36.4% df = 8
The teaching/learning of teacher/kids has been improved after training (E4)
SA A N D SD Statistic
SA - - - - -χ2= 4.59
A - - - - -
N - - 46.2% 46.2% 7.7%R = 0.071
D - - 38.5% 48.7% 12.8%
SD - - 50.0% 27.3% 22.7% df = 4
change has not been identified in the teaching and learning behaviour of the faculties and students. It is observed that there is a significant relationship between approaches to Training Need Analysis (Observation, Interview,
Bamrara, A
26
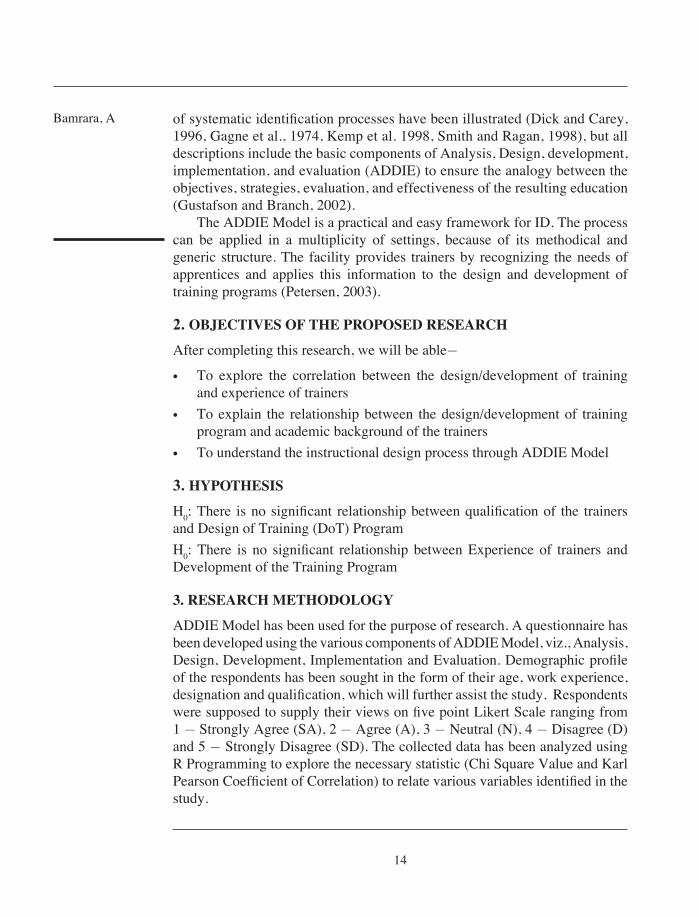
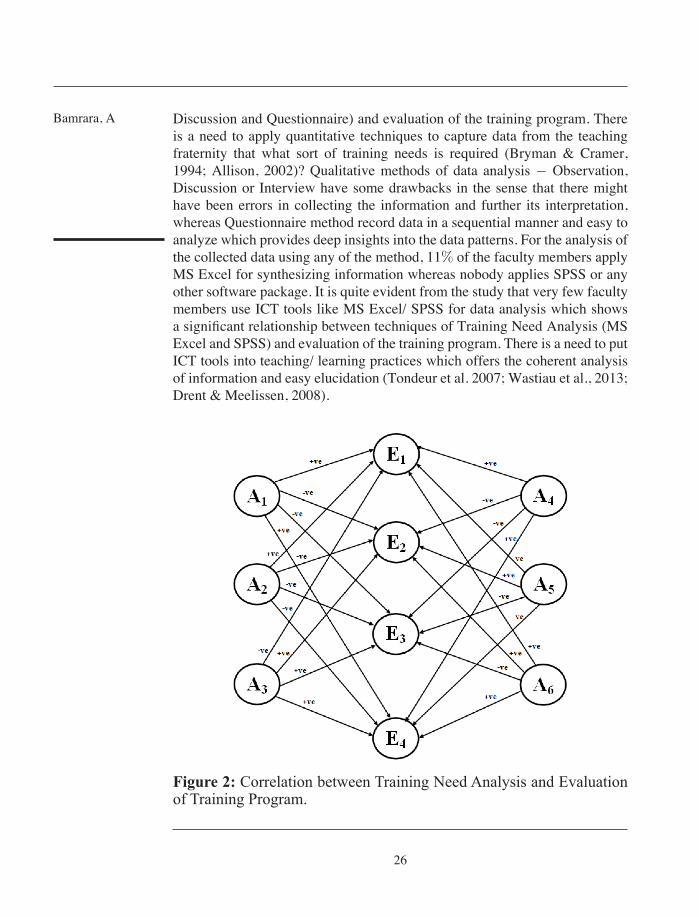
Discussion and Questionnaire) and evaluation of the training program. There is a need to apply quantitative techniques to capture data from the teaching fraternity that what sort of training needs is required (Bryman & Cramer, 1994; Allison, 2002)? Qualitative methods of data analysis - Observation, Discussion or Interview have some drawbacks in the sense that there might have been errors in collecting the information and further its interpretation, whereas Questionnaire method record data in a sequential manner and easy to analyze which provides deep insights into the data patterns. For the analysis of the collected data using any of the method, 11% of the faculty members apply MS Excel for synthesizing information whereas nobody applies SPSS or any other software package. It is quite evident from the study that very few faculty members use ICT tools like MS Excel/ SPSS for data analysis which shows a significant relationship between techniques of Training Need Analysis (MS Excel and SPSS) and evaluation of the training program. There is a need to put ICT tools into teaching/ learning practices which offers the coherent analysis of information and easy elucidation (Tondeur et al. 2007; Wastiau et al., 2013; Drent & Meelissen, 2008).
Figure 2: Correlation between Training Need Analysis and Evaluation of Training Program.
Applying Addie Model To
Evaluate Faculty Development
Program
27
REFERENCES
[1] Allison, P. D. (2002). Missing data: Quantitative applications in the social sciences. British Journal of Mathematical and Statistical Psychology, 55(1), 193-196. https://doi.org/10.4135/9781412985079
[2] Ballou, D., & Podgursky, M. J. (1997). Teacher pay and teacher quality. WE Upjohn Institute. https://doi.org/10.17848/9780585282961
[3] Bates, A. W. (2000). Managing Technological Change: Strategies for College and University Leaders. The Jossey-Bass Higher and Adult Education Series. Jossey-Bass Publishers, 350 Sansome St., San Francisco, CA 94104.
[4] Bryman, A., & Cramer, D. (1994). Quantitative data analysis for social scientists, Rev. Taylor & Frances/Routledge.
[5] Darling-Hammond, L. (2000). How teacher education matters. Journal of teacher education, 51(3), 166-173. https://doi.org/10.1177/0022487100051003002
[6] Darling-Hammond, L. (2000). Teacher quality and student achievement. Education policy analysis archives, 8, 1.https://doi.org/10.14507/epaa.v8n1.2000
[7] Dick, W., Carey, L., & Carey, J. O. (2006). The systematic design of instruction.[8] Drent, M., & Meelissen, M. (2008). Which factors obstruct or stimulate teacher
educators to use ICT innovatively?. Computers & Education, 51(1), 187-199.https://doi.org/10.1016/j.compedu.2007.05.001
[9] Dyer, C., Choksi, A., Awasty, V., Iyer, U., Moyade, R., Nigam, N., & Sheth, S. (2004). Knowledge for teacher development in India: the importance of ‘local knowledge’ for in-service education. International Journal of Educational Development, 24(1), 39-52. https://doi.org/10.1016/j.ijedudev.2003.09.003
[10] Husen, T., Saha, L. J., & Noonan, R. (1978). Teacher Training and Student Achievement in Less Developed Counties. World Bank Staff Working Paper No. 310.
[11] Gagne, R. M., & Briggs, L. J. (1974). Principles of instructional design. Holt, Rinehart & Winston.
[12] Gustafson, K. L., & Branch, R. M. (2002). What is instructional design. Trends and issues in instructional design and technology, 16-25.
[13] Kemp, J. E., Morrison, G. R., & Ross, S. M. (1998). Designing effective instruction. Columbus, Ohio, EEUU.
[14] Kruse, K. (2002). Introduction to instructional design and the ADDIE model. Retrieved January, 26, 2005.
[15] Peterson, C. (2003). Bringing ADDIE to life: Instructional design at its best. Journal of Educational Multimedia and Hypermedia, 12(3), 227-241.
[16] Raina, V. K. (1995). Teacher educators in India: in search of an identity. Journal of teacher education, 46(1), 45-52. https://doi.org/10.1177/0022487195046001008
[17] Smith, P. L., & Ragan, T. J. (1999). Instructional design (p. 3). New York: Wiley.
Bamrara, A
28
[18] Tondeur, Jo, Johan Van Braak, and Martin Valcke. “Curricula and the use of ICT in education: Two worlds apart?.” British Journal of Educational Technology 38.6 (2007): 962-976. https://doi.org/10.1111/j.1467-8535.2006.00680.x
[19] Wastiau, P., Blamire, R., Kearney, C., Quittre, V., Van de Gaer, E., & Monseur, C. (2013). The use of ICT in education: a survey of schools in Europe. European Journal of Education, 48(1), 11-27. https://doi.org/10.1111/ejed.12020