Embed Size (px)
Citation preview
Arlington Public Schools
Whom are we serving?
Who is providing the services?
What is changing?
How are the services provided?
October 2011
1
Whom are we serving?
2
3
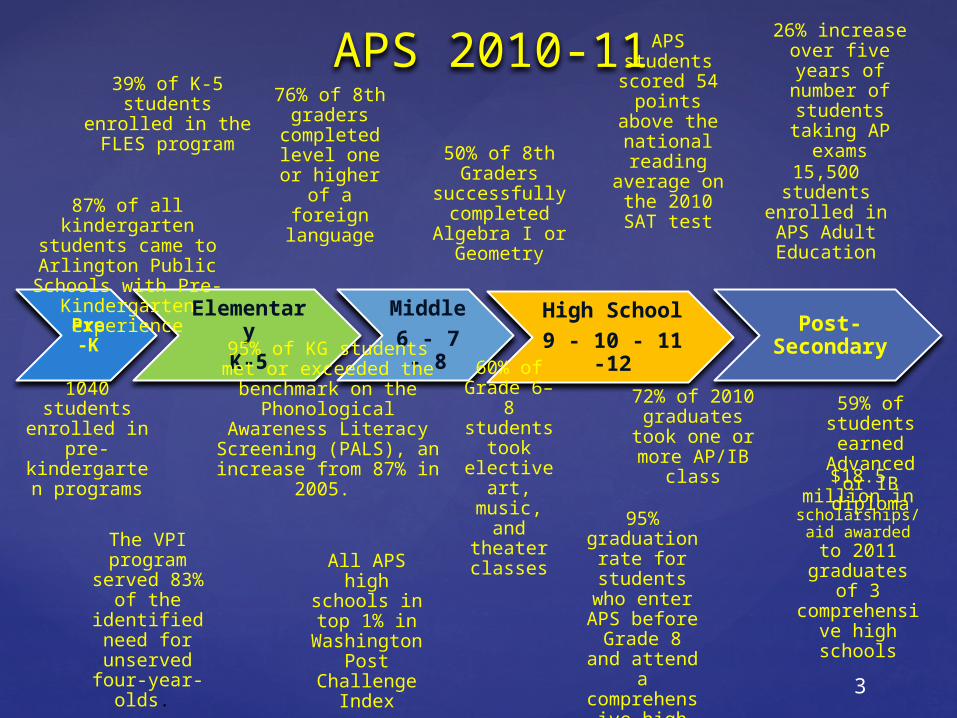
Pre-K
Elementary
K-5
Middle
6 - 7 - 8
High School9 - 10 - 11 -
12
Post-Secondary
APS 2010-11
59% of students earned
Advanced or IB diploma
76% of 8th graders
completed level one or higher of
a foreign language
50% of 8th Graders successfully
completed Algebra I or Geometry
APS students scored 54 points
above the national reading average on the 2010 SAT test
26% increase over five years of
number of students taking AP exams
15,500 students enrolled in APS Adult Education
1040 students enrolled in pre-
kindergarten programs
95% of KG students met or exceeded the benchmark on the Phonological Awareness Literacy Screening (PALS), an increase from 87% in 2005.
60% of Grade 6–8 students
took elective art, music, and
theater classes
The VPI program served 83% of the identified
need for unserved four-
year-olds.
All APS high schools in top
1% in Washington
Post Challenge Index
95% graduation rate for
students who enter APS
before Grade 8 and attend a
comprehensive high school
72% of 2010 graduates took one or more AP/IB class
$18.5 million in scholarships/aid
awarded to 2011 graduates of 3 comprehensive
high schools
39% of K-5 students enrolled in the FLES
program
87% of all kindergarten students came to Arlington
Public Schools with Pre-Kindergarten experience

• Who Are We?- Instructional Supervisors- Teacher Specialists
• How do we support schools?- Curriculum Content- Program Coordination- Instructional Support
Department of Instruction
4
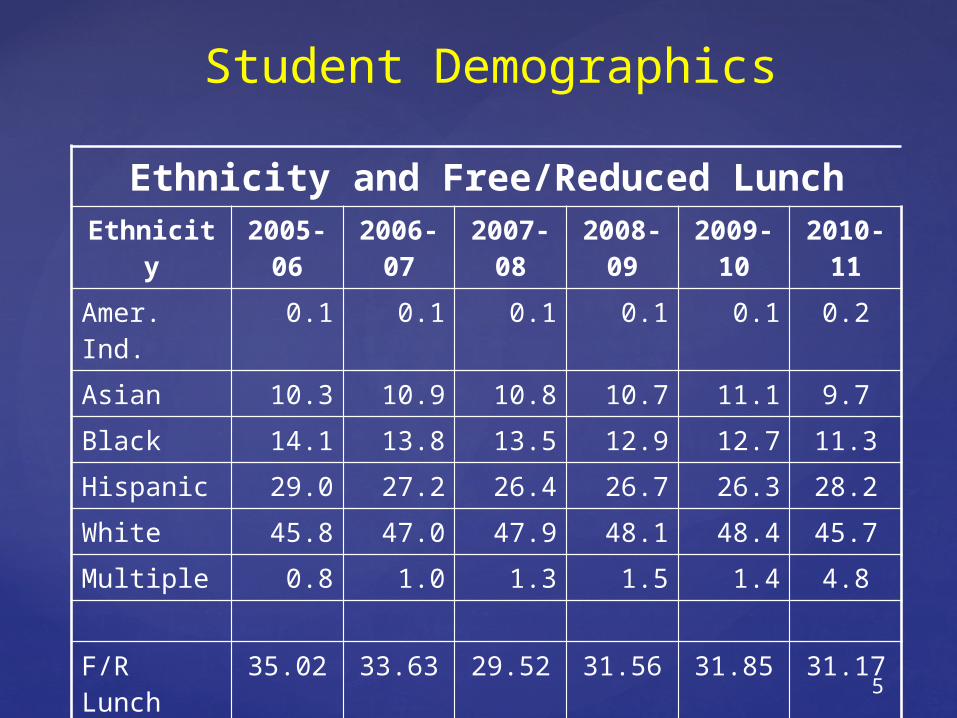
Student Demographics
Ethnicity and Free/Reduced LunchEthnicity 2005-06 2006-07 2007-08 2008-09 2009-10 2010-11
Amer. Ind. 0.1 0.1 0.1 0.1 0.1 0.2
Asian 10.3 10.9 10.8 10.7 11.1 9.7
Black 14.1 13.8 13.5 12.9 12.7 11.3
Hispanic 29.0 27.2 26.4 26.7 26.3 28.2
White 45.8 47.0 47.9 48.1 48.4 45.7
Multiple 0.8 1.0 1.3 1.5 1.4 4.8
F/R Lunch 35.02 33.63 29.52 31.56 31.85 31.17
5
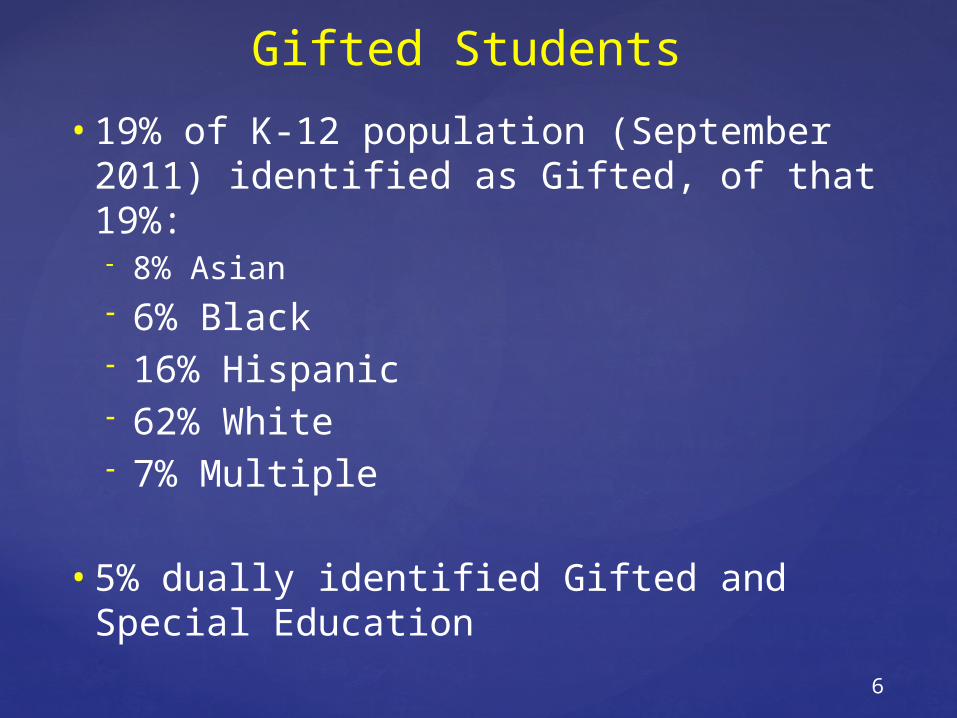
• 19% of K-12 population (September 2011) identified as Gifted, of that 19%:- 8% Asian- 6% Black- 16% Hispanic- 62% White- 7% Multiple
• 5% dually identified Gifted and Special
Education
Gifted Students
6

• 3228 students receive special education services (14% of September 2011 student population)
• All APS schools including alternative programs serve students with disabilities
Students with Disabilities
7

The following is a breakdown of disabilities:
• 31% Specific Learning Disability• 19% Other Health Impairment• 14% Speech or Language Impairment• 11% Autism• 7% Developmental Delay• 7% Emotional Disability • 4% Intellectual Disability
Students with Disabilities
8
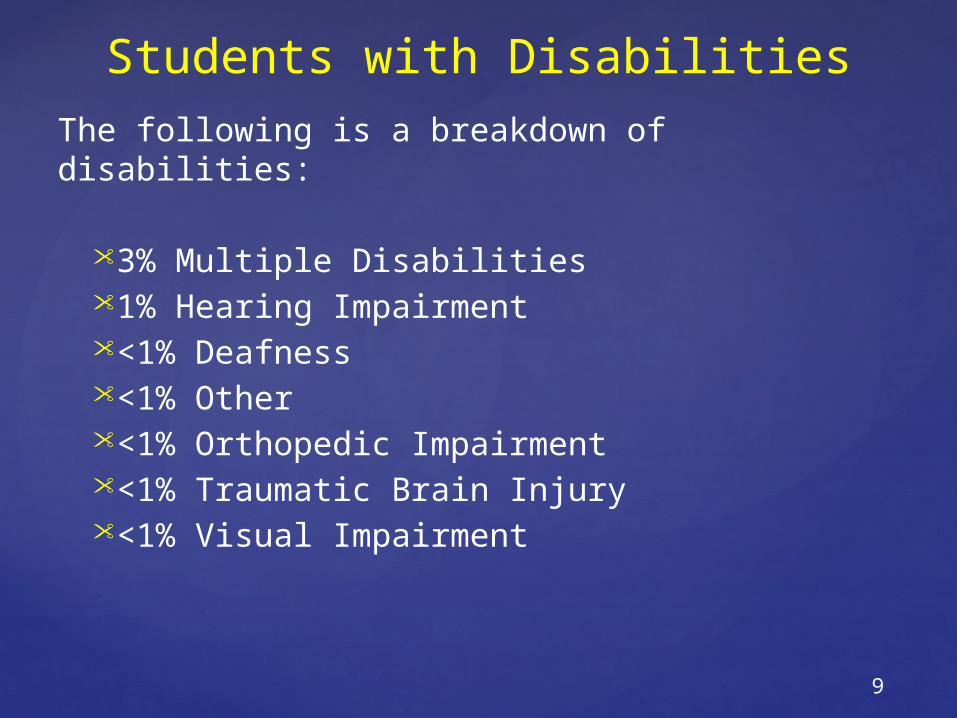
The following is a breakdown of disabilities:
• 3% Multiple Disabilities • 1% Hearing Impairment• <1% Deafness• <1% Other• <1% Orthopedic Impairment• <1% Traumatic Brain Injury• <1% Visual Impairment
Students with Disabilities
9
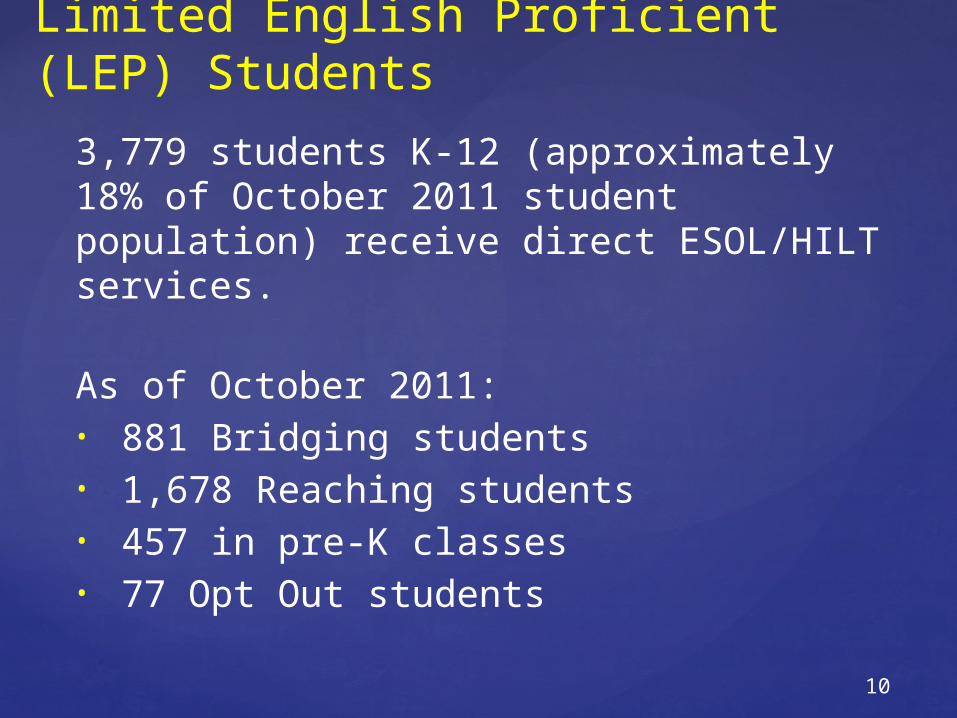
3,779 students K-12 (approximately 18% of October 2011 student population) receive direct ESOL/HILT services.
As of October 2011:• 881 Bridging students• 1,678 Reaching students• 457 in pre-K classes • 77 Opt Out students
Limited English Proficient (LEP) Students
10
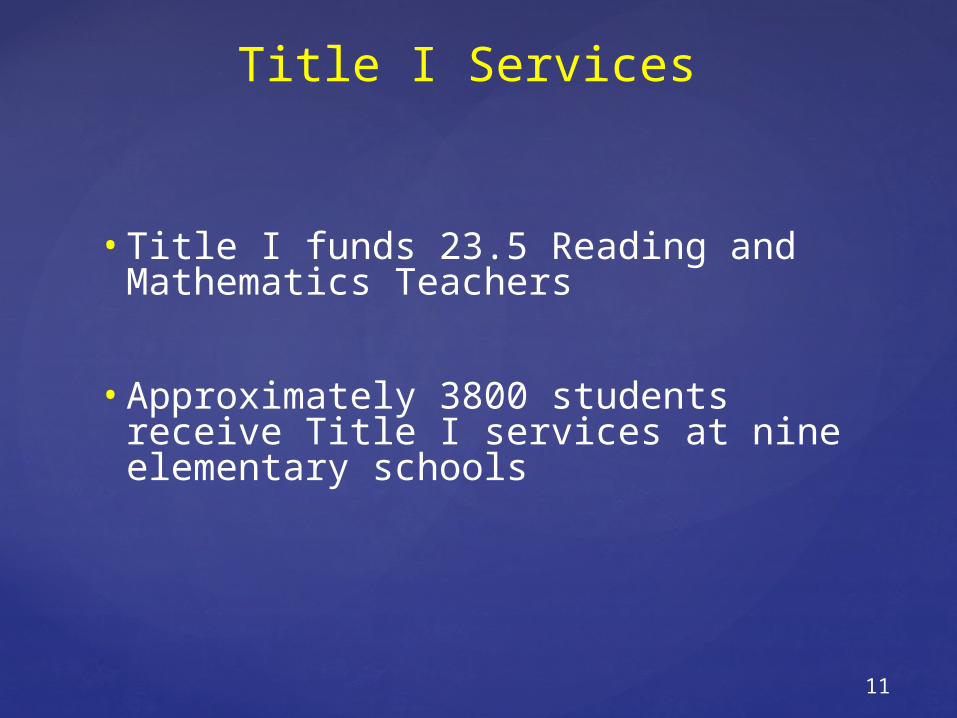
Title I Services
• Title I funds 23.5 Reading and Mathematics Teachers
• Approximately 3800 students receive Title I services at nine elementary schools
11
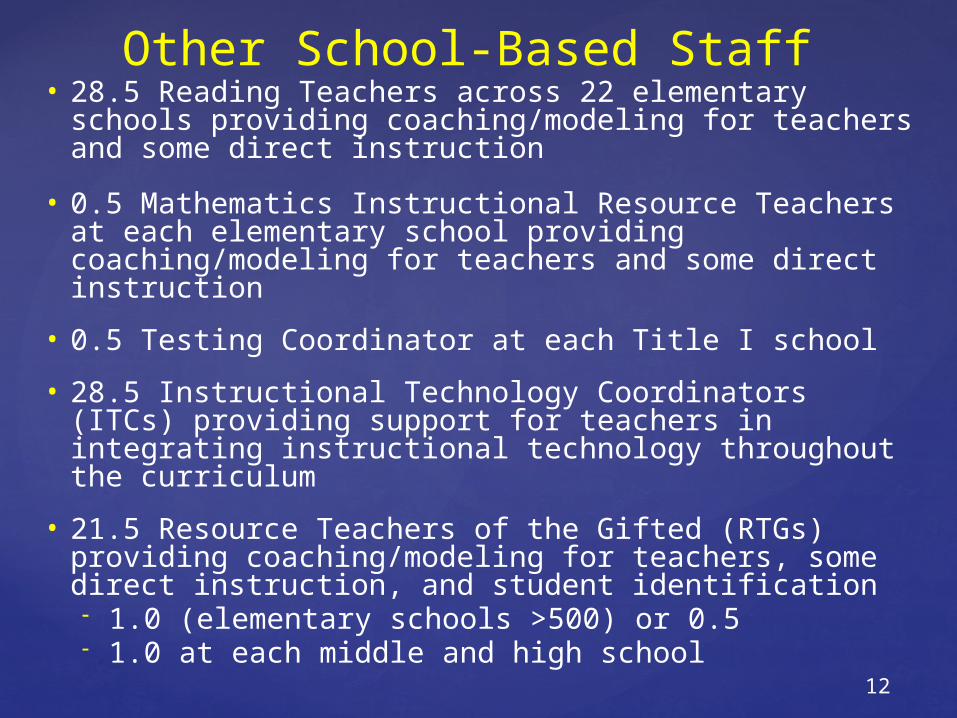
• 28.5 Reading Teachers across 22 elementary schools providing coaching/modeling for teachers and some direct instruction
• 0.5 Mathematics Instructional Resource Teachers at each elementary school providing coaching/modeling for teachers and some direct instruction
• 0.5 Testing Coordinator at each Title I school
• 28.5 Instructional Technology Coordinators (ITCs) providing support for teachers in integrating instructional technology throughout the curriculum
• 21.5 Resource Teachers of the Gifted (RTGs) providing coaching/modeling for teachers, some direct instruction, and student identification- 1.0 (elementary schools >500) or 0.5- 1.0 at each middle and high school
Other School-Based Staff
12
Free/Reduced Lunch:http://www.apsva.us/cms/lib2/VA01000586/Centricity/Domain/11/FREE_REDUCED_OCTOBER_31_2010.pdf
Civil Rights Statistics:http://www.apsva.us/site/Default.aspx?PageID=1116
Enrollment Data:http://www.apsva.us/site/Default.aspx?PageID=1110
Important Links -- Data
13
Who is providing the services?
14
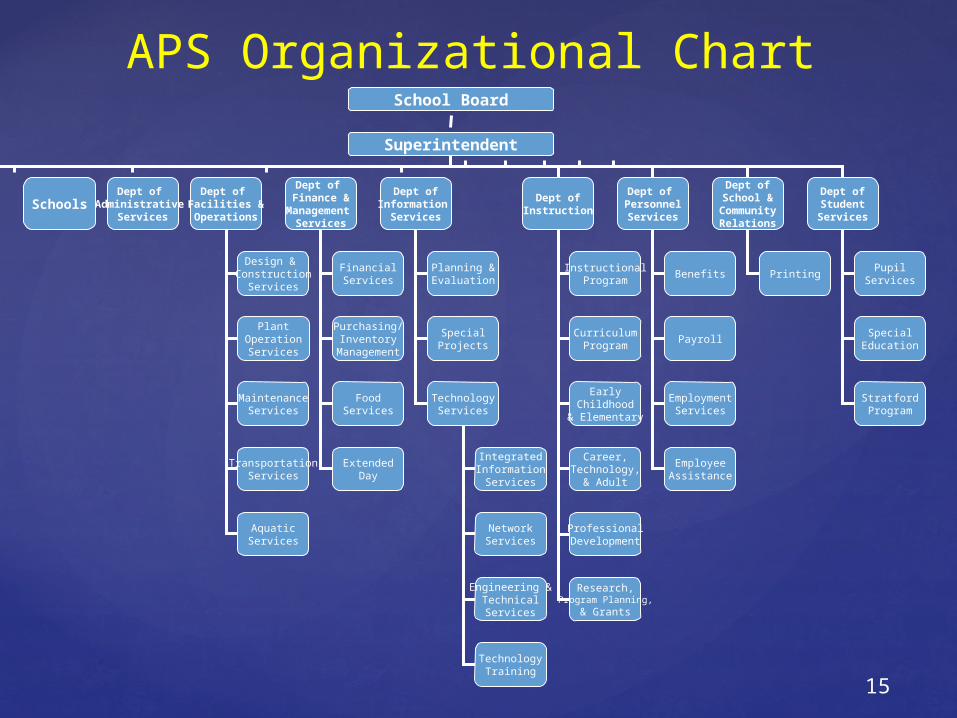
APS Organizational ChartSchool Board
Superintendent
SchoolsDept of
Administrative Services
Dept of Facilities &Operations
Dept of Finance &
Management Services
Dept ofInformation
Services
Dept ofInstruction
Dept of PersonnelServices
Dept ofSchool &
CommunityRelations
Dept ofStudentServices
InstructionalProgram
CurriculumProgram
EarlyChildhood
& Elementary
Career,Technology,
& Adult
ProfessionalDevelopment
Research,Program Planning,
& Grants
Planning &Evaluation
SpecialProjects
TechnologyServices
IntegratedInformation
Services
NetworkServices
Engineering &TechnicalServices
FinancialServices
Purchasing/Inventory
Management
FoodServices
ExtendedDay
Design & Construction
Services
PlantOperationServices
MaintenanceServices
TransportationServices
AquaticServices
Benefits
Payroll
EmploymentServices
EmployeeAssistance
PrintingPupil
Services
SpecialEducation
StratfordProgram
TechnologyTraining
15

Department of Instruction 2011-2012Assistant Superintendent
Early Childhood & Elementary Education College & Career-Ready Students
Director, Early Childhood &Elementary Education
Instructional Program Offices(Student Instruction/Support)
Curriculum Program Offices(Student Instruction/Content)
Director, Career, Technology, & Adult Education
Early Childhood(VPI and Montessori)
ESOL/HILT
Extended Instruction
Gifted Services
Library Media Services
Minority Achievement
Title I
Arts
English Language Arts/Reading
Health and P.E.
Mathematics
Science
Social Studies
World Languages
Adult Education
Business, Marketing, &Computer Sciences
Family & Consumer Sciences
REEP
Technology Education
YES
Intake Center
Summer School
Media Processing
Professional Library
Fine Arts Apprentice Program
Humanities Project
Outdoor Lab
Planetarium
GED
Teen Parenting
Professional Development
Research, Program Planning,& Grants
16

Important Links -- Program
Program of Studies:http://www.apsva.us/site/Default.aspx?PageID=2007
Four-Six Year Academic Plan:http://www.apsva.us/site/Default.aspx?PageID=2202
17

What is changing?
18

Selected Initiatives
• K-8 Formative Assessment• Middle School Restructuring• Hoffman-Boston Restructuring• Program Evaluations• Limited Early Release Model• UVA Executive Leadership
Program• Revised Secondary Grading • Professional Learning Day• Five-Year Gifted Services Plan• Capacity and Leased Space
19
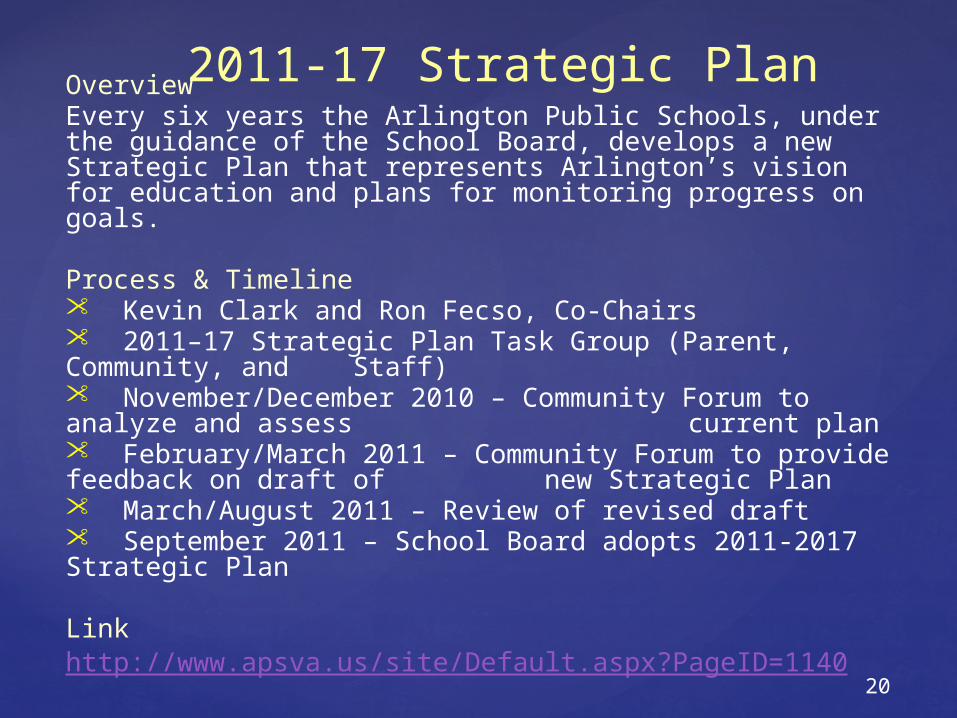
2011-17 Strategic PlanOverviewEvery six years the Arlington Public Schools, under the guidance of the School Board, develops a new Strategic Plan that represents Arlington’s vision for education and plans for monitoring progress on goals.
Process & Timeline• Kevin Clark and Ron Fecso, Co-Chairs• 2011–17 Strategic Plan Task Group (Parent, Community, and Staff)• November/December 2010 – Community Forum to analyze and assess
current plan• February/March 2011 – Community Forum to provide feedback on draft of
new Strategic Plan• March/August 2011 – Review of revised draft• September 2011 – School Board adopts 2011-2017 Strategic Plan
Linkhttp://www.apsva.us/site/Default.aspx?PageID=1140
20

How are the services provided?
21

• School Board provides guidance to the Superintendent • Revenue Sources
• Revenue Sharing Agreement with County
• Total Budget and Expenditures
• School Operating Fund
How Do We Pay For It?
22

Where Does the Money Come From? (FY12)
23
County Transfer
81.2% State10.7%
Federal2.8%
Carry Forward2.1%
Local Fees3.3%

Where Does the Money Go?(School Operating Fund Only)
24
Schools80.8%
Instructional Support
4.4%
Leadership0.7%
Management and Support Services
6.4%
Facilities7.7%`
Additional Information on the FY 2012 Adopted Budget, including Planning Factors:
http://www.apsva.us/budget
FY 2012 Washington Area Boards of Education (WABE) Guide:
http://www.apsva.us/budget
then click on “WABE Guide” under “Contents” on the left
Important Links -- Fiscal
25
Questions and Comments
26
• Which of the topics in APS 101 is most important to you, and why?
• What areas/topics do you want to know more about? • What are your top 4 or 5 priorities for the FY 2012
budget?• Where should APS focus its resources in FY 2012?• Do you have any cost-neutral ideas for changes in
APS Programs for FY 2012? • If necessary, where would you make reductions for
FY 2012?
Breakout Questions
27