Embed Size (px)
Citation preview
TIMBER SPECIAL IIA SQUARE
Opalesque Research 20 November 2008
www.opalesque.com
These are the perceived risks of investing in timber ... but, are they also the real risks? Do timberland investmentreturns suffer in a recession? What are the multiple return drivers? Non correlated biological growth led returns.Carbon Forestry and more ...
TIMBER SPECIAL IIA SQUARE
Issue 85 20.11.2008
Investing In Forests
A SQUARE Proprietary Research. Refer to attached disclaimer. ISSN 1450 4308 Copyright Opalesque Ltd. All rights reserved. © Authored by: Sona Blessing
1. Possible Return Drivers =Extraterrestrial (Timber & timber by products; Bio mass - alternative energy; Carbon sequestration - carboncredits; Environment - conservation rights)+Terrestrial (Value of real estate, leasing; Recreational benefits - e.g. hunting, fishing rights; Alternative energy -site for wind farms, solar energy stations etc.; Environment - conservation of soil; harbouring rare species -habitats, bio systems; soil related carbon credits)+Subterrestrial (Natural resources - gas, metal & mineral ores, mining rights etc.; C02 absorbing rock - carbonsequestration; root related carbon credits)
2. HeterogeneityNo 2 tress are alike x the different species - rate of growth, life cycles; end-use characteristics - density - hard/soft wood etc.; geographies grown across + wide variety of management regimes = a mind boggling number ofpermutations and combinations
• Which means that there is almost always likely to be an exception to the proverbial rule somewhere(i.e. unconstrained from a deal flow perspective )
• Inefficiencies - imperfect flow of information, generally the lack of reliable statistically significant data,lack of full transparency -Imply that exploitable risk premia exist and can be exploitedEg. globally investible timberland is currently being estimated at being USD 200bn or as much asUSD400+ bnFrom a timberland investor’s perspective - for instance the US, and Scandinavia - are well developed andclassified as efficient markets - making it is tendencially harder to extract returns.But here too (irrespective of the current financial market conditions), according to the experts, niches doexist and there is and will always be scope for opportunistic deals - at least in the US.This contrasts to returns that might be sought from emerging markets such as Angola (arguably therelatively higher returns should be commensurate to the relatively higher levels of risk being borne)
3. Source of exploitable risk premia lie outside financial markets - i.e. returns are driven by the biologicalgrowth of trees
4. “Storing value on the stump” - owing to the price elasticity exhibited by timber - timberlands can beharvested - managed to optimise yields (IRR)• Pursuing a 10 + year time horizon helps mitigate/dampen the risk associated with price volatility• Inventory management - if the assumption is that populations, globally, are growing, and that timberconsumption closely follows population growth - then the need for timber should be on the riseSupply shocks such as those caused by diseases, fires etc. could rapidly deplete inventory levels
5. Real risks vs. the perceived risk of investing in timberHistorically the average performance pullback associated with natural catastrophes has been negligible.Given that timberland related insurance is very expensive and seldom covered - the damage caused by suchshould not be under-estimated.Other risks, that can be controlled and are manageable, but affect the IRR significantly are:• Level of debt leverage used • Overpaying for land • If applicable currency related risk • Structure ofinvestment vehicle • Tax • Regulatory issues
6. Capital can be allocated at different points of the tree growing cycle to optimise IRR
TIMBER SPECIAL IIA SQUARE
Issue 85 20.11.2008
Factors in thinking about timberlandinvestments in this recession …
Are timberlands, specifically US TIMO, related returns expected to suffer during this recession?Historically, recessions have not shown a strong correlation with short-term US timberland returns. We believe this is partially due to the fact thattimberland assets are valued with long term timber harvests and have an income investment profile. The assumptions made in underwritingtimberland investments must trend across recessionary and expansionary economic cycles. On the other hand, longer-term return series such as a10 year timberland investment period have been somewhat higher for investors deciding to invest in timberland during recessionary periods as anentry point.
The relationship between prices of timberland and timber in the US• First, to be sure, US timberland values have climbed over the last several years while timber prices have weakened.• This can be viewed as an expansion of price-earnings multiples - as timber cash yields have shrunk, timberland values have remained firm oreven gone higher. Though again, timberland assets are very long lived and are priced across cycles. Hence, it would be inappropriate to pricetimberland based on current price-earnings multiples, or any other metric which takes a static view of current cash flows or earnings.
• A much more accurate valuation analysis, and the one on which most timberland managers rely, is a long-term discounted cash flow.A very significant part of that valuation is based on biological growth, which is something we know with near statistical certainty for most of ourplantation-based species.So while there is earnings volatility over the short-term, over the long-term we have far more visibility into earnings than just about any otherinvestment sector.
• It is important to note, however, that while price-earnings multiples have expanded in part due to short-term earnings weakness relative totimberlands’ longer-term earnings potential, market discount rates for timberland assets have shrunk over the last several years.Most timberland investors do their underwriting on a pre-inflation / “real” basis.Five or 10 years ago, the average market clearing discount rate was perhaps 8%. Today, it appears to be closer to 5.5%. That contraction ofdiscount rates is also part of why timberland values are up, irrespective of weak current timber prices. While the contraction of discount rates hasbeen significant, it is consistent with the fall in yields of US government securities, or our benchmark for the risk-free rate.
• While the current financial turmoil seems to have resulted in a re-pricing of risk generally, we have not seen much evidence in the privatetimberland markets of this occurring, though we would expect to see some softening of timberland prices in 2009. Public timberland vehicleshave, however, declined significantly in value over the last month or so, such as Plum Creek (PCL), Rayonier (RYN) and Potlach (PCH).
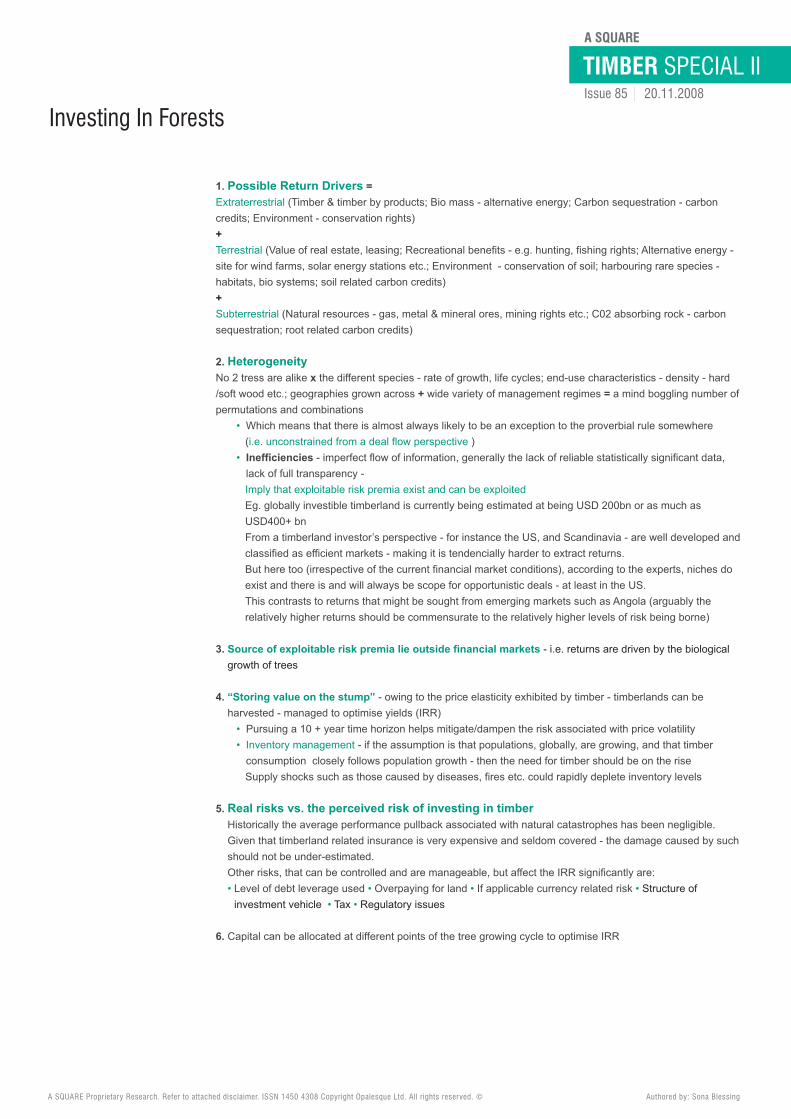
Does “timing” when to invest in timberland (please specify whether TIMO, REIT, or other vehicle) significantly impact theperformance that can be expected?• Based on our research, timberland investments have performed better when the entry point was during a recession - or more specifically - duringa low in US housing starts.
• Biological growth, which is the biggest single driver of timberland investment returns, occurs independent of any factor relating to broader financialmarkets - and that component of the return, investors will earn regardless of entry point.
A SQUARE Proprietary Research. Refer to attached disclaimer. ISSN 1450 4308 Copyright Opalesque Ltd. All rights reserved. © Authored by: Sona Blessing
Returns from investing in timber during recessions Returns from investing in timber during expansions
Shaded area indicate US recessions as determined by the NBER.2008 Federal Reserve Bank of St. Louis: research.stlouisfed.org Courtesy:Tim Corriero
Housing Starts: Total: New Privately Owned Housing Units Started (HOUST)Source: U.S. Department of Commerce: Census Bureau
TIMBER SPECIAL IIA SQUARE
Issue 85 20.11.2008
Valuations: in the context of investing in timberland is it an art or science?How can an investor determine if it the timberland is “over-priced”; “trading at fair value”, “under priced”?The significance of timberland valuations when viewed over a 10 year cycle?• Both.While we believe there is significant “standardisation” in timberland underwriting - with the key variables being growth and yield models, discountrates, timber price, and land sale assumptions - we also believe it is critical to have the “muddy boots” experience of managing an industrial forestin order to construct an informed acquisition analysis.
• While our acquisition models are quite robust, they must often be constrained somewhat by practical considerations. For example, if anacquisition model indicates we should harvest 5x in year 6 and 1x and year 7, the practical realities of local timber markets might suggest asmoother harvest schedule. This is the type of insight best gained from actual forest management experience.
• Investors can get some sense of how accurately timberland is priced by conducting due diligence on a manager’s underwriting process andassumptions.There are limits to this diligence - as a number of assumptions will require expertise not available to non-foresters. For example, knowing whethercertain growth and yield models are appropriately conservative for a given physiogeographic region is probably not something an investor willknow without accessing additional expertise. That being said, simply asking such informed questions can help highlight the level of expertise andconservativeness a manager applies.
• Acquisition pricing is critical in timberland investing, since the purchase price is probably the biggest determinant of ultimate return. Whileadvances in technology enable us to grow timber at rates which were unheard of just a generation ago, there are natural limits to rates ofbiological growth, and if you pay too much, it may be impossible to “grow your way out of the hole.”
“Supply shocks” - weather, climate change, pest/ epidemics, forest fires etc. - and their role in determining timber,respectively timberland prices … do you believe these “risk premia” are being compensated commensurately? Why orwhy not?• If you look over the long term of timberland investing in the US, supply shocks have resulted, most often, in very significant premium returns forinvestors.One of the best examples is the removal of US federal timberlands from timber markets in the 1990s in order to protect the historical habitat forthe Northern Spotted Owl, which drove returns to timberland investors well above 20% and 30% for several years.
• Such shocks; however, are not factored into underwriting because they are, by definition, relatively rare and largely unpredictable.
• Yet we’re not sure that’s always the case.For example, a supply shock to North American timberland is to be expected within the next five to 10 years: as a mountain pine beetle epidemicwill destroy unprecedented amounts of timber. This is a once-in-a-century event. The New York Times reported just this week: “British Columbiahas lost 33 million acres of Lodgepole Pine Forest, and a freak wind event last year blew mountain pine beetles, a species of bark beetle, overthe Continental Divide to Alberta. Experts fear that the beetles could travel all the way to the Great Lakes.”
• Perhaps counter-intuitively, and while recognising that this is devastating to that eco-system, southern US pine plantations and softwood forestsoff the US pacific northwest will come under intense demand pressure. It is important to note that the mountain pine beetle does not infestsouthern pine or doug fir/hemlock forests of the Pacific Northwest. Also, the management conditions (or lack of management) that permitted thebeetle plague in the interior west is very different to the mosaic of forests in the US south and northwest.
• So while we believe it is a conservative and an appropriate path to not factor “black swan” events into underwriting – we also believe that specificand foreseen supply shocks such as the mountain pine beetle are necessary to be factored into an informed acquisition underwriting.
A SQUARE Proprietary Research. Refer to attached disclaimer. ISSN 1450 4308 Copyright Opalesque Ltd. All rights reserved. © Authored by: Sona Blessing
Contact Information:FIA Timber PartnersManaging Director, Tim Corriero,
Phone: +1 510 3371155Email: [email protected]: http://www.forestinvest.com
Forest Investment AssociatesBroad Arrow Timber Company, Manager, Michael P. Cerchiaro
Phone: +1404 4958591Email: [email protected]: http://www.forestinvest.com
Contact Information:ForestEdge International LLCRobert W. Hagler - Principal and CEO
Phone: +1 703 6699221Email: [email protected]: http://www.ForestEdgeLLC.com
Robert Hagler’s insights on:• Traditional measure of risk - Timber Prices and Timberland Returns - the relationship -relevance/reliability - constraints• The role of multi-factor risk metrics - role, relevance-constraints
Traditional portfolio analysis involves looking at investments on a stand alone basis, and as components of aportfolio based on their risk/return metrics. There tends to be data available on returns for the investment, andon the volatility of those returns which is generally used to define risk.
In contrast, the challenge with international timber investments is that there is virtually no public dataavailable concerning their returns, and consequently no data available on volatility (managers with a long trackrecord in international investments like Global Forest Partners LLC probably have some good in-house data, butthis is not publically available and, the sample size may be too small to be meaningful for portfolio work).
Some timber investment managers have presented the case that volatility of timber prices (not timberinvestment returns), in a particular region is a good way to quantify the risk of investment in the region, as thereSHOULD be a strong relationship between timber prices and timberland returns. This is because the value of ahectare of timberland should reflect the value of the standing inventory, and the ability of that land to grow newinventory. However, in recent years this relationship has not been reliable for a number of reasons: droppingdiscount rates, rising rural real estate markets, etc. Over time, this relationship is likely to re-establish itself, andtimber price volatility should be one of several metrics one should consider when trying to understand a newtimber investment geography.
But there are others.• One needs to get a handle on how concentrated the market is in the region - e.g. how many mills will competefor the trees?
• Do markets exist for all parts of the tree that are harvested (large and small logs, logs for pulp production orenergy)?
• One must also account for generic investment risks such as land tenure and title issues (not so important ifone is investing in an auto plant but very important for an agricultural investment).
• How well established and reliable is the legal system in the country? The robustness of its economy over-all?
Most would agree that in the absence of traditional return data, a mix of timber price volatility metrics, marketmetrics, and generic risk measures should be used to try and quantify or rank the risk of timber investments in agiven region. This measure, combined with an estimate of the kind of returns that are available in a country(from a particular deal or series of deals) can be used to build a fairly simple risk/return model for a givengeography.
To add diversification to the portfolio, however, we must consider the type of investment (what is theprimary market focus of the end-product – sawlogs for construction or fiber for pulp production?), and theregional market that the investment will service (e.g. North America, Asia, Latin America). By slicing the wholeuniverse of possible investments with respect to product orientation or market orientation, we find that someareas would seemingly offer better investment prospects than others - i.e. in the context of the multi-factormeasures of risk being applied, and potential returns that can be expected.
The constraint in all analysis of timber investments is the lack of good data - not just on the returnfront - but also on timber prices, the structure of the forest product industry etc. The approach used byForestEdge attempts to formulate a comparable platform using data which is generally available to all.
TIMBER SPECIAL IIA SQUARE
Issue 85 20.11.2008
Timber Prices & Timberland Returns
A SQUARE Proprietary Research. Refer to attached disclaimer. ISSN 1450 4308 Copyright Opalesque Ltd. All rights reserved. © Authored by: Sona Blessing
TIMBER SPECIAL IIA SQUARE
Issue 85 20.11.2008
Biological Growth Led Returns ...
A SQUARE Proprietary Research. Refer to attached disclaimer. ISSN 1450 4308 Copyright Opalesque Ltd. All rights reserved. © Authored by: Sona Blessing
GrowthPlanting SurvivalPrepa-ration
HarvestTarget
Biotic
Currency
Type ofrisk
Tax
Political /legal /social
Land
Timber
Management
AbioticBiologicalgrowth
Market
Investmentcountry
Category
Zero
Zero
Low/medium
Medium/high
Low/high
medium
medium
Low/medium
Main driverof non-correlation
Additionalprofit(andloss) potential
Countryspecific(overlay) management
Expected correlation totraditional financial assets
“Premerch”“Merchantable”
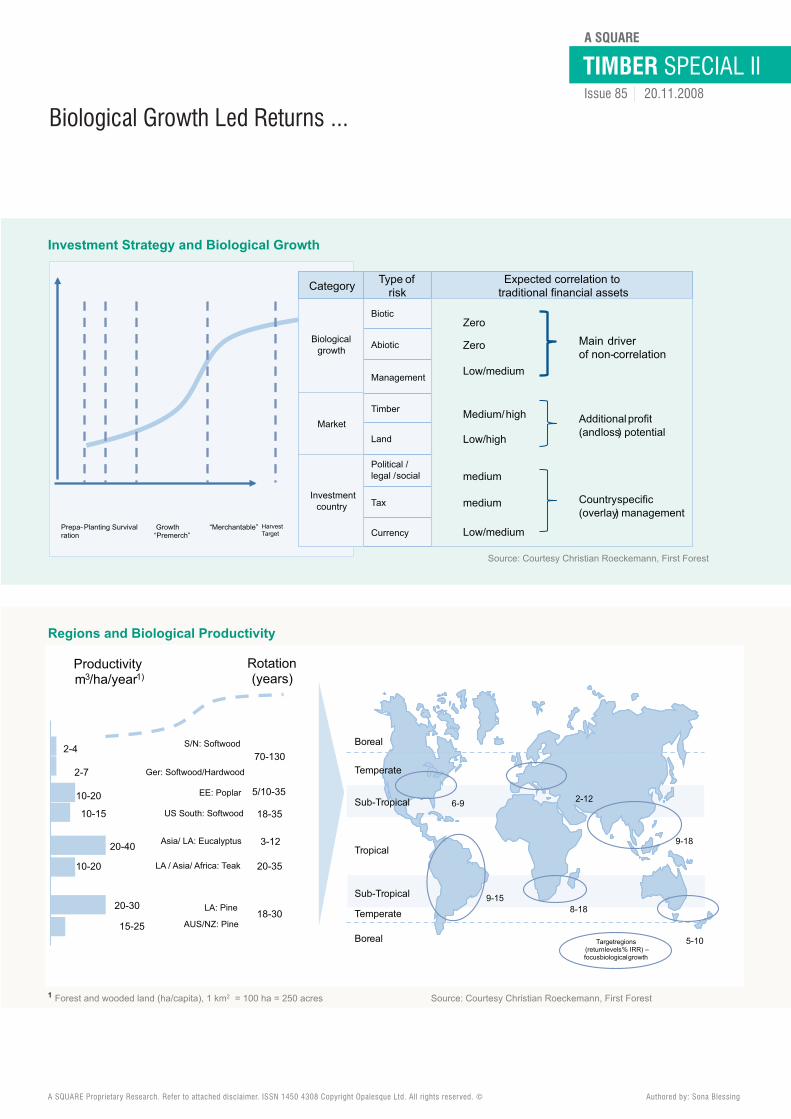
Investment Strategy and Biological Growth
Source: Courtesy Christian Roeckemann, First Forest
Targetregions(returnlevels% IRR) –focusbiologicalgrowth
Tropical
Sub-Tropical
Sub-Tropical
Temperate
Temperate
Boreal
Boreal
2-4
2-7
10-20
10-15
20-40
15-25
10-20
20-30
S/N: Softwood
Ger: Softwood/Hardwood
EE: Poplar
US South: Softwood
Asia/ LA: Eucalyptus
LA / Asia/ Africa: Teak
LA: Pine
AUS/NZ: Pine
Productivitym3/ha/year1)
Rotation(years)
5/10-35
18-35
70-130
3-12
20-35
18-30
6-9
9-15
2-12
8-18
9-18
5-10
Regions and Biological Productivity
1 Forest and wooded land (ha/capita), 1 km2 = 100 ha = 250 acres Source: Courtesy Christian Roeckemann, First Forest
TIMBER SPECIAL IIA SQUARE
Issue 85 20.11.2008
A SQUARE Proprietary Research. Refer to attached disclaimer. ISSN 1450 4308 Copyright Opalesque Ltd. All rights reserved. © Authored by: Sona Blessing
0
10,000
20,000
30,000
40,000
50,000
60,000
0 5 10 15 20 25 30 35 40
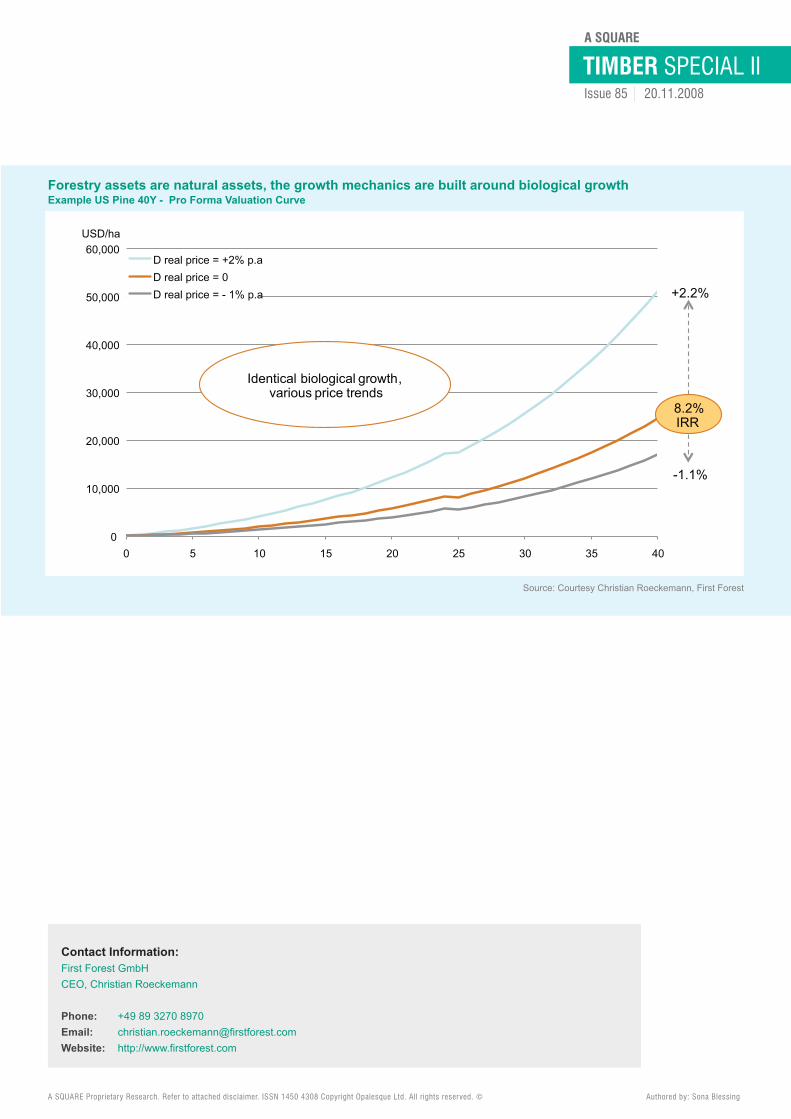
D real price = +2% p.aD real price = 0D real price = - 1% p.a
8.2%IRR
+2.2%
-1.1%
Identical biological growth,various price trends
USD/ha
Forestry assets are natural assets, the growth mechanics are built around biological growthExample US Pine 40Y - Pro Forma Valuation Curve
Source: Courtesy Christian Roeckemann, First Forest
Contact Information:First Forest GmbHCEO, Christian Roeckemann
Phone: +49 89 3270 8970Email: [email protected]: http://www.firstforest.com
TIMBER SPECIAL IIA SQUARE
Issue 85 20.11.2008
Perceived vs. Real Risks in Timberland investing -Insights from a US TIMO
A SQUARE Proprietary Research. Refer to attached disclaimer. ISSN 1450 4308 Copyright Opalesque Ltd. All rights reserved. © Authored by: Sona Blessing
With over 100 years of timber related experience The Molpus Woodlands Group , LLC has USD762mn value (approximately 732,000 acres) undermanagement -• primarily pine plantations and oaks in Southeastern US• primarily oaks, but contains many other hardwood species, Appliancian US• primarily hard maples, but contains many other hardwood species; in North Central US., Lake States region• primarily black cherry and walnut, but contains many other hardwood species, in North Eastern US, New England region
Drawing on his experience, Dick Molpus, president of the firm says, the misperception commonly prevalent among investors interested in timber asan asset class seems be the “loss “ caused by natural calamities. The real risk to IRR he points out, lurk in using too much debt leverage and inoverpaying for the timberland property being acquired. Using Molpus as an example he says , they have experienced a:• USD463,000 fire loss in 2000 - which brings the 10 year average loss to = 0.0024%• USD 12,000,000 weather related loss in 2005 – which brings the10 year average loss to= 0.06%Due to Hurricane Rita, September 24, 2005 and Hurricane Katrina, August 29, 2005, two of the land bases Molpus manages suffered timberdamage. However, owing to their vertically-integrated forest management structure they were able to minimise the effects of these hurricanes bysalvaging and selling downed timber in an expeditious manner
• Statistically the value percentage loss: Average annual loss for physical risk = 0.03% (source: Stats of major TIMOs, REITs and Weyerhaeuserper James W. Sewell)
Reviewed below are:The real and perceived risks associated with timber investing; examples of investment structures; pointers on how to choose a TIMO and how yieldscan be optimised …
Risks associated with investing in US timberland• Physical & Real risks: Physical risks can vary by region and generally include:
• Natural: fire, disease, ice damage, insect damage - including pine beetle, storms (i.e. tornados, hurricanes)• Not natural: fire, timber theft
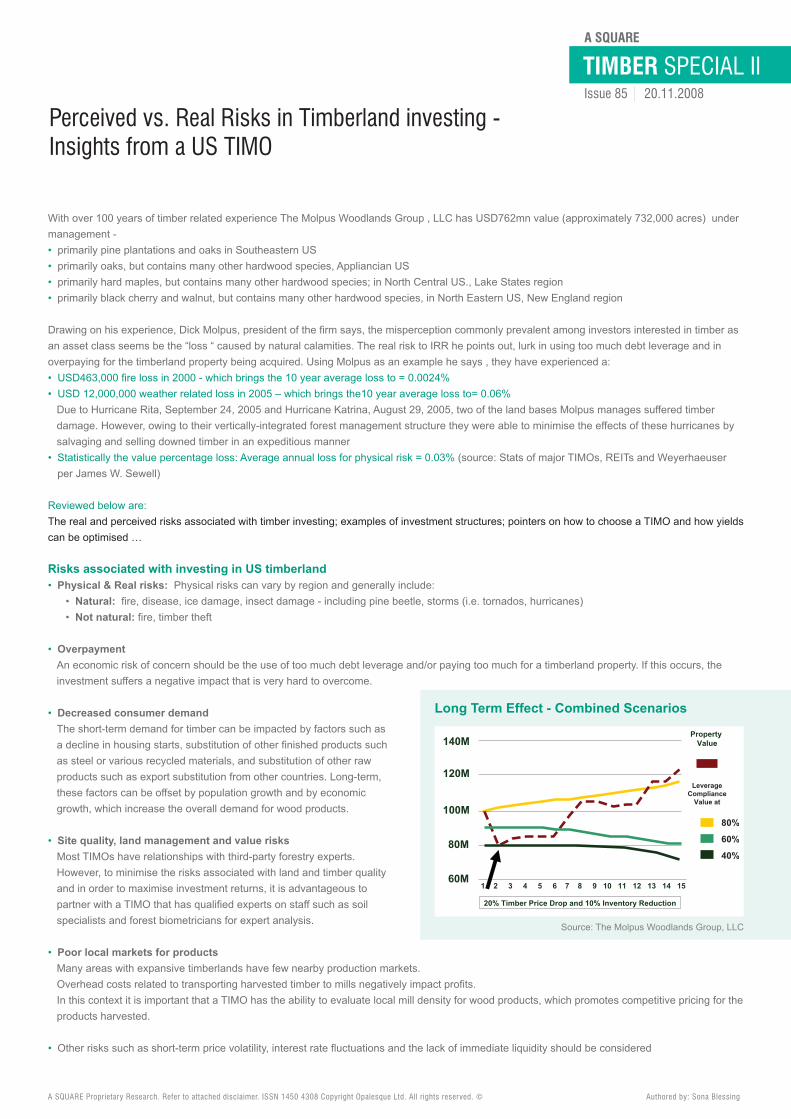
• OverpaymentAn economic risk of concern should be the use of too much debt leverage and/or paying too much for a timberland property. If this occurs, theinvestment suffers a negative impact that is very hard to overcome.
• Decreased consumer demandThe short-term demand for timber can be impacted by factors such asa decline in housing starts, substitution of other finished products suchas steel or various recycled materials, and substitution of other rawproducts such as export substitution from other countries. Long-term,these factors can be offset by population growth and by economicgrowth, which increase the overall demand for wood products.
• Site quality, land management and value risksMost TIMOs have relationships with third-party forestry experts.However, to minimise the risks associated with land and timber qualityand in order to maximise investment returns, it is advantageous topartner with a TIMO that has qualified experts on staff such as soilspecialists and forest biometricians for expert analysis.
• Poor local markets for productsMany areas with expansive timberlands have few nearby production markets.Overhead costs related to transporting harvested timber to mills negatively impact profits.In this context it is important that a TIMO has the ability to evaluate local mill density for wood products, which promotes competitive pricing for theproducts harvested.
• Other risks such as short-term price volatility, interest rate fluctuations and the lack of immediate liquidity should be considered
140M
120M
100M
80M
60M
PropertyValue
1 2 3 4 5 6 7 8 9 10 11 12 13 14 15
20% Timber Price Drop and 10% Inventory Reduction
LeverageCompliance
Value at
80%
60%
40%
Long Term Effect - Combined Scenarios
Source: The Molpus Woodlands Group, LLC
TIMBER SPECIAL IIA SQUARE
Issue 85 20.11.2008
Typical Investment StructureTimberland investments can be structured to meet a client’s specific needs. The typical investment structures are co-mingled funds and separateaccounts. From an investor perspective, separate accounts achieve superior control and flexibility and include land ownership and/or timber leasesheld directly by the institutional or individual investor through a special purpose entity (i.e. a limited liability company, limited partnership, etc.). Thetypical investment minimum for such an investment structure tends to be between USD50 mn - USD100 mn.
Co-mingled funds are composed of pooled investments for private and public institutional investors and private individuals preferring a co-mingled position within a managed timberland investment. A co-mingled fund, through its limited partnership entity, is the owner of the land and/ortimber leases in this investment. While this investment structure does not allow for maximum control for a single investor, it does allow investors topool assets for greater buying power and, as such, investment diversity through geographic regions, species, etc., which helps to enhance returns.
Know your TIMO:• Research key employees experience in the timber business• Speak with past and present clients• Fiduciary responsibility must be top priority• Understand modelling assumptions• Know the TIMO’s geographic acquisition strategy• Long-term timber manager or short-term financial engineer?• Compensation structure should match desired investment strategy• Vertically integrated?• Philosophy on acquisitions• Evaluate historical returns
Yield Optimisation measures in place at Molpus Timberland Management:Forest ManagementCombinations of mechanical and chemical site preparation, in conjunction with fertilisation, herbaceous weed control and genetically improvedseedlings are typically prescribed to regenerate a timber stand. Mid-rotation silvicultural practices that include thinning, fertilisation and understoryvegetation control are commonly prescribed to maximise a client's long-term investment goals.Their foresters are in place to provide land management administrative services that include managing hunting clubs, property boundary lines,ingress and egress issues, mineral interests and other land management matters.
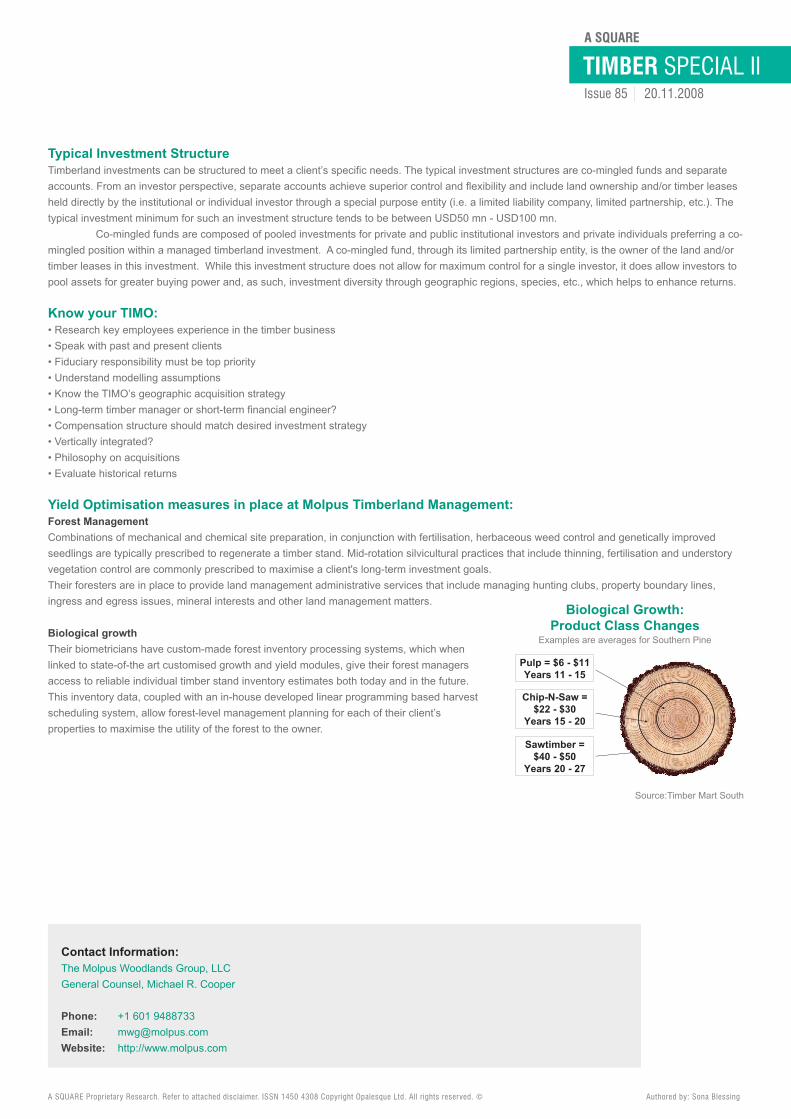
Biological growthTheir biometricians have custom-made forest inventory processing systems, which whenlinked to state-of-the art customised growth and yield modules, give their forest managersaccess to reliable individual timber stand inventory estimates both today and in the future.This inventory data, coupled with an in-house developed linear programming based harvestscheduling system, allow forest-level management planning for each of their client’sproperties to maximise the utility of the forest to the owner.
A SQUARE Proprietary Research. Refer to attached disclaimer. ISSN 1450 4308 Copyright Opalesque Ltd. All rights reserved. © Authored by: Sona Blessing
Sawtimber = $40 - $50
Years 20 - 27
Chip-N-Saw =$22 - $30
Years 15 - 20
Pulp = $6 - $11Years 11 - 15
Biological Growth:Product Class Changes
Examples are averages for Southern Pine
Source:Timber Mart South
Contact Information:The Molpus Woodlands Group, LLCGeneral Counsel, Michael R. Cooper
Phone: +1 601 9488733Email: [email protected]: http://www.molpus.com
TIMBER SPECIAL IIA SQUARE
Issue 85 20.11.2008
Forest Profile Across Europe
A SQUARE Proprietary Research. Refer to attached disclaimer. ISSN 1450 4308 Copyright Opalesque Ltd. All rights reserved. © Authored by: Sona Blessing
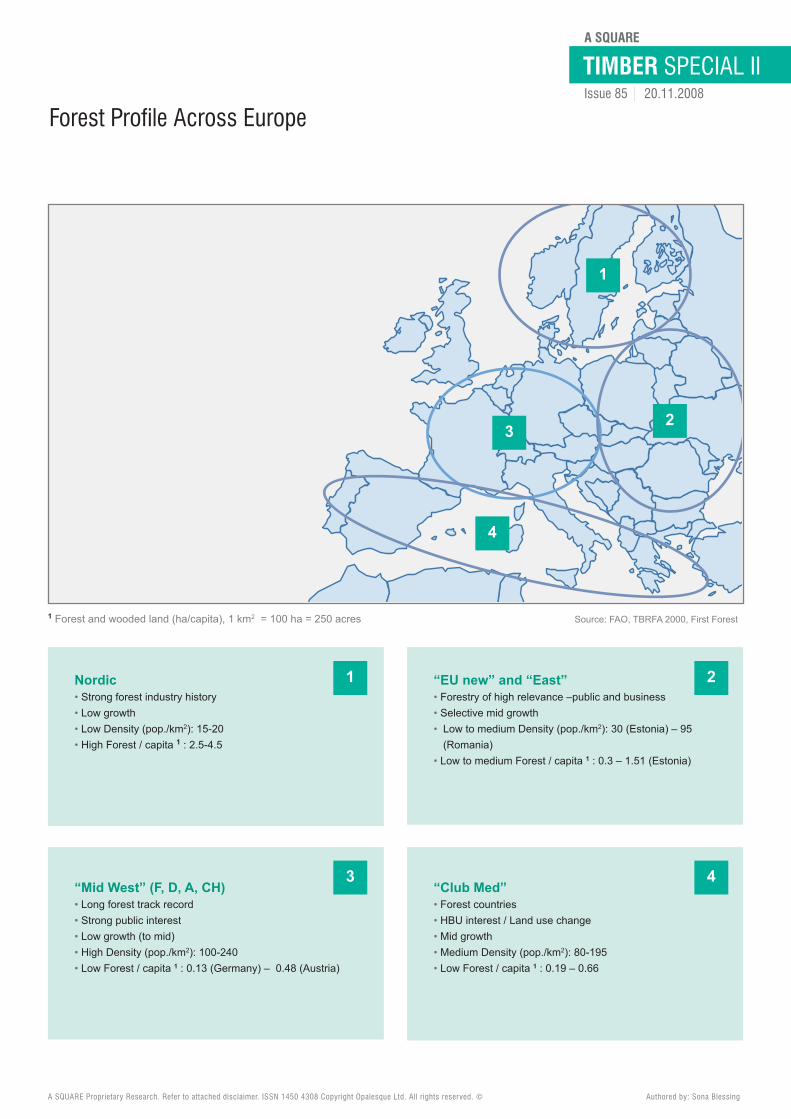
1 Forest and wooded land (ha/capita), 1 km2 = 100 ha = 250 acres Source: FAO, TBRFA 2000, First Forest
Nordic• Strong forest industry history• Low growth• Low Density (pop./km2): 15-20• High Forest / capita 1 : 2.5-4.5
“EU new” and “East”• Forestry of high relevance –public and business• Selective mid growth• Low to medium Density (pop./km2): 30 (Estonia) – 95(Romania)
• Low to medium Forest / capita 1 : 0.3 – 1.51 (Estonia)
“Mid West” (F, D, A, CH)• Long forest track record• Strong public interest• Low growth (to mid)• High Density (pop./km2): 100-240• Low Forest / capita 1 : 0.13 (Germany) – 0.48 (Austria)
“Club Med”• Forest countries• HBU interest / Land use change• Mid growth• Medium Density (pop./km2): 80-195• Low Forest / capita 1 : 0.19 – 0.66
1
1 2
3 4
23
4
TIMBER SPECIAL IIA SQUARE
Issue 85 20.11.2008
Forest Carbon Sequestration
What is carbon sequestration?Carbon sequestration refers to the process of uptake (capture) and storage of atmospheric CO2, either through bio-logical processes (e.g. tree growth), or geological processes through storage of CO2 in underground reservoirs.
Why Forest Carbon Sequestration?• Environmentally friendly• Socially acceptable• Known technology• Cost effective• Large abatement potential• 25% of the potential global abatement at a cost of up to EUR40 per metric ton
Forest Carbon Sequestration Rates:• Are directly related to tree growth rates• Up to 50 metric tons CO2 per ha per year• Additional considerations• Below ground tree carbon (20%)• Soil carbon• Harvesting• Carbon stored in forest products (longevity)
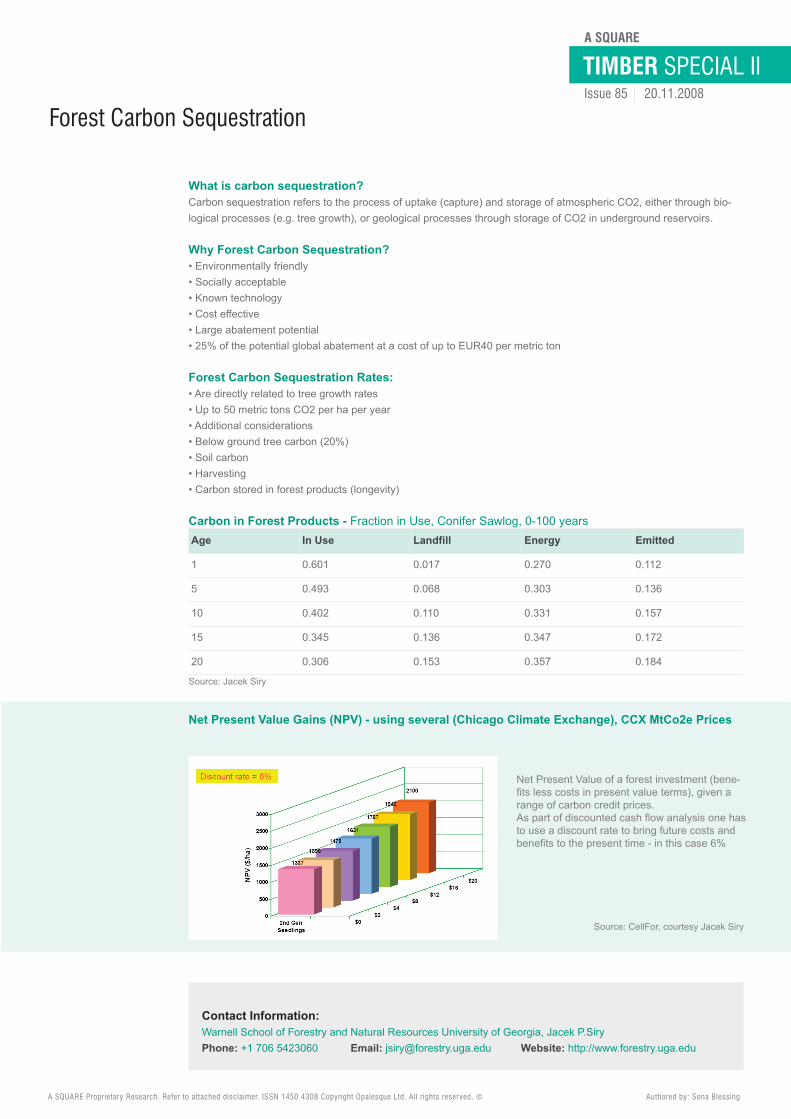
Carbon in Forest Products - Fraction in Use, Conifer Sawlog, 0-100 years
Source: Jacek Siry
A SQUARE Proprietary Research. Refer to attached disclaimer. ISSN 1450 4308 Copyright Opalesque Ltd. All rights reserved. © Authored by: Sona Blessing
Age In Use Landfill Energy Emitted
1 0.601 0.017 0.270 0.112
5 0.493 0.068 0.303 0.136
10 0.402 0.110 0.331 0.157
15 0.345 0.136 0.347 0.172
20 0.306 0.153 0.357 0.184
Net Present Value Gains (NPV) - using several (Chicago Climate Exchange), CCX MtCo2e Prices
Net Present Value of a forest investment (bene-fits less costs in present value terms), given arange of carbon credit prices.As part of discounted cash flow analysis one hasto use a discount rate to bring future costs andbenefits to the present time - in this case 6%
Source: CellFor, courtesy Jacek Siry
Contact Information:Warnell School of Forestry and Natural Resources University of Georgia, Jacek P.SiryPhone: +1 706 5423060 Email: [email protected] Website: http://www.forestry.uga.edu
TIMBER SPECIAL IIA SQUARE
Issue 85 20.11.2008
The International Tree-based Carbon EmissionsTrading Industry
Estimated market for carbon emissions:• Almost 60% result from fossil fuel burning• 18% from deforestation/decay• If Co2 emissions alone are considered - as opposed to all GHG, green house gases, then deforestation, decay forestry losses amount to morethan 25% of the global totalNot all GHG gases are created equal - on a measure of 1.0 for carbon dioxide, many other chemicals create far more climate change damage -• Including the common methane at 21• And sulphur hexafluoride at 23,900
How grave is the global warming situation?• If pro GHG scientists are to be believed then time is running out …• The chances of achieving global political agreement to mitigate the problem appear to be remote• Many developed nations have very high per capita GHG emissions• Whereas major developing countries - such as China which in absolute terms is the world’s largest emitter - still have very low per capitaemissions
Implementing standards - criteria, challenges, constraintsC02 trading schemes are based on standards that advocate how they ought to tackle compliance issues related to certification, registration,verification and tradingGenerally the tougher the standards, the more valuable a CO2-e unit is worth
• AdditionalityIs a significant factor in determining offset integrity - if a project is not additional - it cannot qualify as an offset in a compliance market. Forinstance it suggests reforestation following harvest in the US and Canada would not qualify because some states and provinces requirereforestation.
• VerifiabilityForest carbon sequestration must be real and measurable and includes:Measurement - subject to expense and sampling error
A SQUARE Proprietary Research. Refer to attached disclaimer. ISSN 1450 4308 Copyright Opalesque Ltd. All rights reserved. © Authored by: Sona Blessing
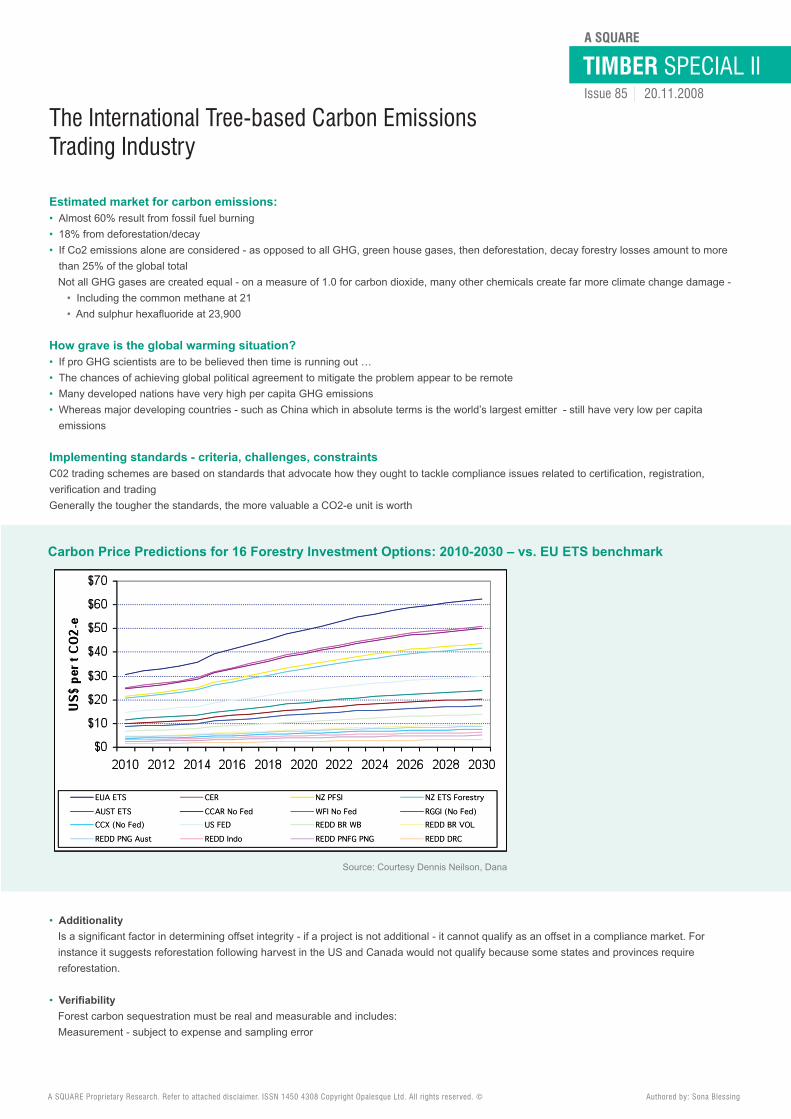
Carbon Price Predictions for 16 Forestry Investment Options: 2010-2030 – vs. EU ETS benchmark
Source: Courtesy Dennis Neilson, Dana
TIMBER SPECIAL IIA SQUARE
Issue 85 20.11.2008
• MonitoringThis is possible for small properties, but for regions countries - e.g. for REDD (Reduced Emissions fromDeforestation and Degradation) - a combination of remote sensing and on the ground verification may benecessary
• EnforcementCommonly the reality of a project is assured through an enforceable contract, such as a registeredeasement - and/or third party verification
• LeakageIn the context of forestry - related offsets, the leakage exists on two fronts - emission leakage and productleakageEmission leakageForestry projects - particularly those that sequester carbon by curbing logging - likely present the greatestrisk of leakage• Wood processors might simply shift their harvests• The only recognised solution is for a majority of landowners or countries to participate in a programmeto reduce deforestation
Product leakage - substation effectLumber and plywood - long term wood products - use much less energy than comparable quantities ofalternative products used to build homes and other structures, such as concrete and masonry walls, andsteel and aluminium framing.Thus avoided deforestation would lead to replacement of wood with other more energy intensive GHG-emitting products.
• PermanenceA concern for forestry-related projects is that the projected sequestration will be halted or reversed• Forestry offset projects are typically expected to generate offsets -via sequestration for decades• There is concern however that emission offsets will be subsequently negated by human activity -change in land use or a natural occurrence – e.g. forest fire, disease or pestilence
Permanence is especially problematic for forests because they are living organisms - that grow andeventually die- although at different rates• Southern yellow pines may grow for 200 years, Douglas fir and oak species for more than 4000 years.• However they may burn, get blown down or eaten long before they die of old age(This may be avoided by providing for a buffer against natural losses)
• Forward creditingAfforestation or reforestation projects present an unusual challenge because of the significant time gapbetween the initial project activity (e.g. planting trees) and the actual carbon sequestrationThis raises questions of how offsets should be distributed.As produced; or allotted up front which is referred to as forward crediting.Forward crediting risks can be mitigated through discounting, or through buffers.
Purists believe that emissions trading (swapping the right to continue to emit for the purchase of emissionsoffsets, including forestry sequestration) should not be allowed, as it does not fix the problem.Emission trading by definition is a zero sum game.However, the first emissions trading schemes were developed by the UN, under the Kyoto Protocol.
A SQUARE Proprietary Research. Refer to attached disclaimer. ISSN 1450 4308 Copyright Opalesque Ltd. All rights reserved. © Authored by: Sona Blessing
• The EU EMTS dominatescarbon trading, and it doesnot allow any tree basedtrades• The CDM is second and treebased trading here iseffectively non existent• The GGAS (NSW)programme is third, buteffectively 100% of itscommercial tree basedtrades are with a fellow NSWState Organisation (Stateforests, NSW)• CCX trades to date havebeen very modest• Other USA based schemesare also very modest,although New Forestsbelieves that these mayincrease substantially by2009-2012• REDD programmes could bea significant way fordeveloping countries toreward politicians for notselling their native trees - atleast not for a little while yet
The role of governments:• Real action to date has notbeen substantialEurope: in the 2005-2007Phase 1 ETS scheme bynaively over allocating carboncredits to emittersMany/most largely ignoredany reform - but hiked up theenergy prices to consumersin response to the EU caps -and made a fortune in sodoingNow in late 2008, when non-compliance penalties may beas high as a reported EUR100 per tCO2-e and emissionauctions are likely to bitefrom 2013, the squeals fromEuropean emitting industriesare reverberating around theglobeOne utility company emitsabout 22mn t/y CO2-e buthas only been allocated 9.5mn tonnes of credit in 2008.It must buy the balance fromthe market
Contact Information:DANA LimitedDirector, Dennis Neilson
Email: [email protected]: http://www.dana.co.nz
TIMBER SPECIAL IIA SQUARE
Issue 85 20.11.2008
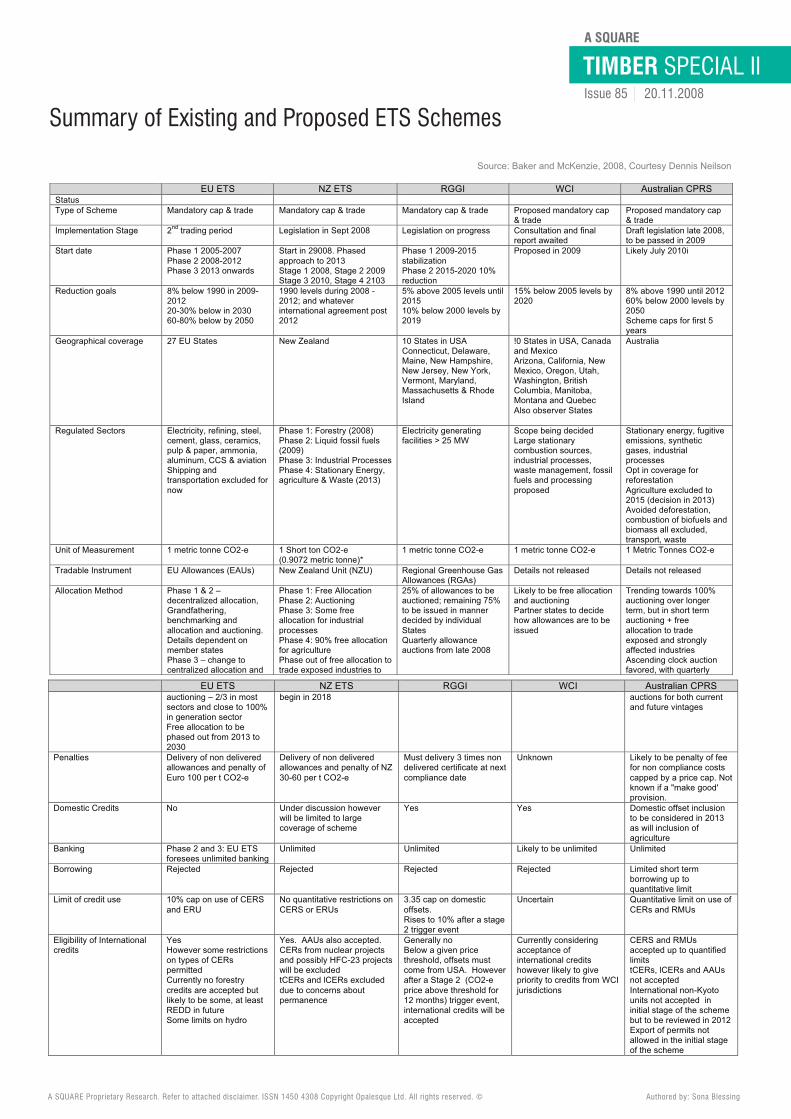
Summary of Existing and Proposed ETS Schemes
A SQUARE Proprietary Research. Refer to attached disclaimer. ISSN 1450 4308 Copyright Opalesque Ltd. All rights reserved. © Authored by: Sona Blessing
EU ETS NZ ETS RGGI WCI Australian CPRSStatus Type of Scheme Mandatory cap & trade Mandatory cap & trade Mandatory cap & trade Proposed mandatory cap
& tradeProposed mandatory cap& trade
Implementation Stage 2nd trading period Legislation in Sept 2008 Legislation on progress Consultation and finalreport awaited
Draft legislation late 2008,to be passed in 2009
Start date Phase 1 2005-2007Phase 2 2008-2012Phase 3 2013 onwards
Start in 29008. Phasedapproach to 2013Stage 1 2008, Stage 2 2009Stage 3 2010, Stage 4 2103
Phase 1 2009-2015stabilization Phase 2 2015-2020 10%reduction
Proposed in 2009 Likely July 2010i
Reduction goals 8% below 1990 in 2009-201220-30% below in 203060-80% below by 2050
1990 levels during 2008 -2012; and whatever international agreement post2012
5% above 2005 levels until201510% below 2000 levels by2019
15% below 2005 levels by2020
8% above 1990 until 201260% below 2000 levels by2050Scheme caps for first 5years
Geographical coverage 27 EU States New Zealand 10 States in USAConnecticut, Delaware, Maine, New Hampshire, New Jersey, New York, Vermont, Maryland,Massachusetts & RhodeIsland
!0 States in USA, Canadaand Mexico Arizona, California, New Mexico, Oregon, Utah,Washington, BritishColumbia, Manitoba,Montana and QuebecAlso observer States
Australia
Regulated Sectors Electricity, refining, steel, cement, glass, ceramics,pulp & paper, ammonia, aluminum, CCS & aviation Shipping andtransportation excluded for now
Phase 1: Forestry (2008)Phase 2: Liquid fossil fuels (2009)Phase 3: Industrial ProcessesPhase 4: Stationary Energy,agriculture & Waste (2013)
Electricity generatingfacilities > 25 MW
Scope being decidedLarge stationary combustion sources,industrial processes, waste management, fossilfuels and processingproposed
Stationary energy, fugitive emissions, synthetic gases, industrial processes Opt in coverage for reforestation Agriculture excluded to2015 (decision in 2013)Avoided deforestation,combustion of biofuels andbiomass all excluded,transport, waste
Unit of Measurement 1 metric tonne CO2-e 1 Short ton CO2-e (0.9072 metric tonne)*
1 metric tonne CO2-e 1 metric tonne CO2-e 1 Metric Tonnes CO2-e
Tradable Instrument EU Allowances (EAUs) New Zealand Unit (NZU) Regional Greenhouse Gas Allowances (RGAs)
Details not released Details not released
Allocation Method Phase 1 & 2 –decentralized allocation,Grandfathering,benchmarking andallocation and auctioning.Details dependent onmember states Phase 3 – change tocentralized allocation and
Phase 1: Free Allocation Phase 2: Auctioning Phase 3: Some freeallocation for industrial processes Phase 4: 90% free allocation for agriculture Phase out of free allocation totrade exposed industries to
25% of allowances to beauctioned; remaining 75%to be issued in mannerdecided by individualStates Quarterly allowanceauctions from late 2008
Likely to be free allocationand auctioning Partner states to decidehow allowances are to beissued
Trending towards 100%auctioning over longerterm, but in short term auctioning + freeallocation to tradeexposed and strongly affected industries Ascending clock auctionfavored, with quarterly
EU ETS NZ ETS RGGI WCI Australian CPRSauctioning – 2/3 in mostsectors and close to 100%in generation sectorFree allocation to bephased out from 2013 to2030
begin in 2018 auctions for both currentand future vintages
Penalties Delivery of non deliveredallowances and penalty of Euro 100 per t CO2-e
Delivery of non deliveredallowances and penalty of NZ 30-60 per t CO2-e
Must delivery 3 times nondelivered certificate at nextcompliance date
Unknown Likely to be penalty of feefor non compliance costs capped by a price cap. Not known if a "make good'provision.
Domestic Credits No Under discussion howeverwill be limited to largecoverage of scheme
Yes Yes Domestic offset inclusionto be considered in 2013as will inclusion of agriculture
Banking Phase 2 and 3: EU ETS foresees unlimited banking
Unlimited Unlimited Likely to be unlimited Unlimited
Borrowing Rejected Rejected Rejected Rejected Limited short term borrowing up toquantitative limit
Limit of credit use 10% cap on use of CERSand ERU
No quantitative restrictions onCERS or ERUs
3.35 cap on domestic offsets. Rises to 10% after a stage2 trigger event
Uncertain Quantitative limit on use ofCERs and RMUs
Eligibility of Internationalcredits
YesHowever some restrictionson types of CERspermittedCurrently no forestrycredits are accepted butlikely to be some, at leastREDD in futureSome limits on hydro
Yes. AAUs also accepted.CERs from nuclear projects and possibly HFC-23 projects will be excludedtCERs and lCERs excludeddue to concerns aboutpermanence
Generally noBelow a given pricethreshold, offsets mustcome from USA. However after a Stage 2 (CO2-eprice above threshold for 12 months) trigger event,international credits will beaccepted
Currently consideringacceptance of international credits however likely to givepriority to credits from WCI jurisdictions
CERS and RMUs accepted up to quantifiedlimitstCERs, lCERs and AAUsnot acceptedInternational non-Kyoto units not accepted in initial stage of the scheme but to be reviewed in 2012Export of permits notallowed in the initial stageof the scheme
Source: Baker and McKenzie, 2008, Courtesy Dennis Neilson
TIMBER SPECIAL IIA SQUARE
Issue 85 20.11.2008
Disclaimer
ASQUARE (hereafter, A2) contents are a result of research and analysis, that is independent. The contents of A2are not sponsored, endorsed or meant to be construed as promotional or advertising material. A2 is not compen-sated, financially or otherwise, by the entities featured. The contents express the author’s opinion, which may dif-fer from that or those held by the entities it features.
The publication has no regard to specific investment objectives, the financial situation or particular needs of anyspecific recipients. It is not written to be used for, and cannot be used by anyone, for the purpose of avoiding taxpenalties.A2 is a research product, published solely for informational purposes and is not construed as a solicitation or anoffer to buy or sell any financial instruments including all alternative investments.
This communication is directed only at persons that are sophisticated and/or have professional experience in mat-ters relating to investments, in hedge funds, alternative-alternatives, unregulated collective investment schemesor high net-worth persons, as the case might be. The content of this publication and research information basedon the content of prior issues that can be accessed via the archive relates to and is available only to such persons.Some of the financial instruments described in A2 may not be eligible for sale in all jurisdictions or to certain cat-egories of investors.
A2 must not be regarded by recipients as a substitute for the exercise of their own judgement. Any opinions ex-pressed in A2 are subject to change without prior notice and A2 is not under any obligation to update or keep theinformation contained herein. Options, derivative products, futures and all alternative asset classes are not suit-able for all investors. Investing and trading in these instruments is considered risky. Past performance of the forementioned are not necessarily indicative of future results. Foreign currency rates of exchange, interest rates, useof leverage, fraud, defaults, acts of terrorism, may adversely affect the value, price or income of any of financialinstruments or related alternative investments mentioned in the publication.A2 is based on information obtained from sources believed to be reliable but is not guaranteed as being accurate,nor is it meant to be a complete summary of the financial instruments, alternative investments, or developmentsreferred to in the publication. A2 accepts no liability whatsoever for any loss or damage of any kind arising out ofthe use of all or any part of this publication.
All content are provided on an “as is,” “as available” basis. Whether or not limited to acts of god, communicationsfailure or unauthorised access of this publication, A2 does not guarantee the timely receipt and cannot vouch forthe accuracy and completeness of the information received by the recipients. Possible errors or incompletenessof information do not constitute grounds for liability, either with regard to direct, indirect or consequential damages.
ISSN 1450-4308© Opalesque Ltd.
A SQUARE Proprietary Research. Refer to attached disclaimer. ISSN 1450 4308 Copyright Opalesque Ltd. All rights reserved. © Authored by: Sona Blessing
8 Samou StreetSt. OmologitesNicosia 1640Cyprus
Phone: +49-89-2351 3055Email: [email protected]

![Matematika I[.25 cm] (Obor: Informatika a logistika)[1 cm]Matematika I (Obor: Informatika a logistika) VÆclav Finìk c 2008 Vaclav.Finek@tul.cz 20.11.2008 CelÆ obrazovka ZaŁÆtek](https://img.pdfslide.net/doc/110x75/60be26ee10ec1b29584832fc/matematika-i25-cm-obor-informatika-a-logistika1-cm-matematika-i-obor-informatika.jpg)