Embed Size (px)
Citation preview
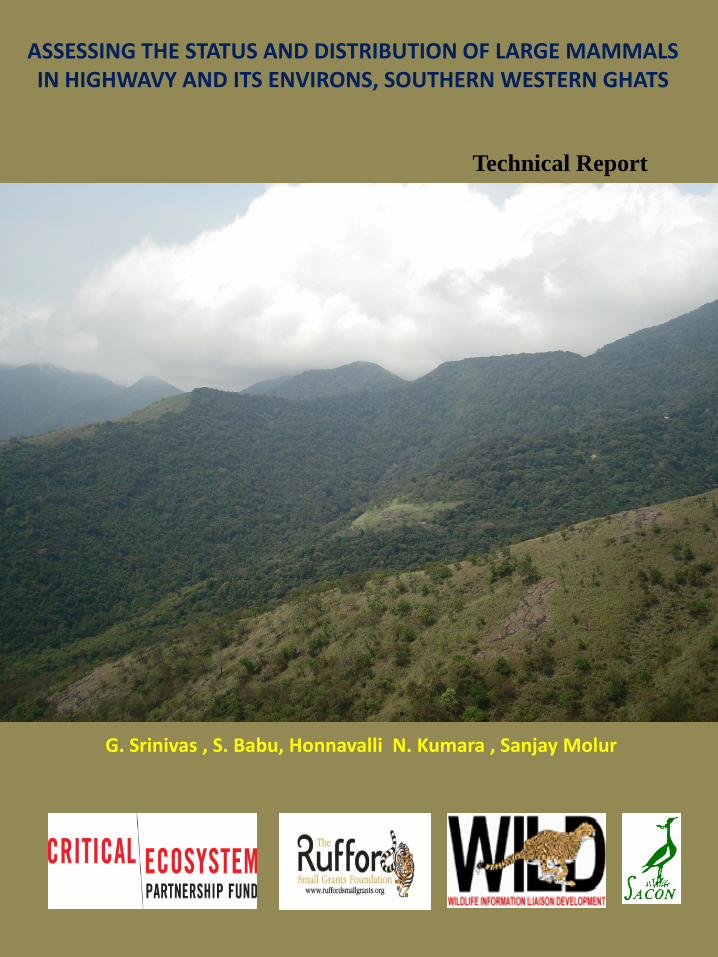
ASSESSING THE STATUS AND DISTRIBUTION OF LARGE MAMMALS IN HIGHWAVY AND ITS ENVIRONS, SOUTHERN WESTERN GHATS
Technical Report
G. Srinivas , S. Babu, Honnavalli N. Kumara , Sanjay Molur
Srinivas, G., Babu, S., Kumara, H.N and Molur, S. (2013). Assessing the status and
distribution of large mammals in Highwavy and its environs, Southern Western
Ghats, Technical Report submitted to CEPF-ATREE Small Grants and Rufford Small
Grants. Coimbatore, India.
Assessing the status and distribution of large mammals
in Highwavy and its environs, southern Western Ghats
Technical Report
Submitted to
CEPF-ATREE Western Ghats Small Grants Program, Bangalore
Rufford small grants Foundation, London
G. Srinivas
1, S. Babu
2, Honnavalli N. Kumara
2, Sanjay Molur
1
1 Wildlife Information Liaison Development (WILD) Society, 96, Kumudam Nagar,
Vilankurichi Road, Coimbatore 641 035, India. 2 Sálim Ali Centre for Ornithology and Natural History, Anaikatty (PO), Coimbatore 641108,
India
CONTENTS
Acknowledgements
Chapters
Page No.
Chapter – I Introduction, Objectives and Methods
`1
Chapter – II Mammals of Highwavy environs
6
Chapter – III Relative Abundance of Mammals in Highwavy environs
19
Chapter – IV Occupancy Estimation of Mammals in Highwavy environs
36
Chapter – V Conservation of Mammals in Highwavy environs
64
Acknowledgements
We are thankful to the Principal Chief Conservator of Forests (Wildlife) and Chief
Wildlife Warden Mr. Gowtam Dey, IFS, for granting permission to carry out the
present work in Theni Forest Division. Thanks are also due to Mr. Rakesh Vasisht, IFS
for extending the research permission. Thanks are also due to Mr. K. Ganesan, IFS,
District Forest Officer, Theni Forest Division, and Mr. Ashok Kumar, Wildlife
Warden, Srivilliputhur Grizzled Squirrel Wildlife Sanctuary for their constant support
throughout the study. Also we thank Mr. R. Venkatasami, Wildlife Warden, Megamalai
Wildlife Division. We acknowledge the support of forest range officers and other
department personnel of the Theni Forest Division and Srivilliputhur Grizzled Squirrel
Wildlife Sanctuary during the study.
The study was carried out with the funding from Critical Ecosystem Partnership Fund -
Ashoka Trust for Research in Ecology and the Environment, (CEPF-ATREE Small
Grants) Bangalore and Rufford Small Grant for Nature Conservation (RSG), London.
We would like to thank Dr. Jack Tordoff, Grant Director, Dr. Baskar Acharya, Co-
ordinator for their support. We also thank Josh Cole, Rufford Small Grants Director,
Jane Reymond, Trust Administrator, Rufford small grants, London for their support.
We thank Dr. P.A. Azeez, Director of Sálim Ali Centre for Ornithology and Natural
History (SACON), Coimbatore for the help and support throughout the study period.
Field work in the remote and hard terrain was possible and successful due to the
involvement by T. Karthik, B.M. Krishnakumar and R. Sasi. We also thank Dr. Sushma
and Dr.R.Suganthasakthivel for critical inputs while designing the study.
We thank graduate students Sunil Kumar, K.R Suraj Ben, Prvisha, N. Thulabamani and
Rooban for assisting and participating in field surveys. We also thank volunteers
Kathiresan, and P. Thiumalainathan for assisting in the field surveys.
We thank Mr. Marimuthu, Dr. Daniel, Latha, Radhika, Praveen, Arunkanagavel and
other supportive staffs of WILD society. We also thank local field assistants Yesudas
and Kumar helped us in the early stages of field work. Mr. Subramaniyan, Mr. Shyam
and Mr. Ramkumar (Saptur) of Wildlife Association of Rajapalayam (WAR) and
Vaigai Association for Nature And Mountain Ranges (VANAM) were helped in
various ways during the field study.
Srinivas, Babu, Kumara and Molur
1
Chapter I
Introduction, Objectives and Methods
The Western Ghats, a chain of mountains running parallel to the West Coast from river Tapti in
Gujarat to Kanyakumari the southernmost tip of the India, cover five percent of the country and
holds 30% of India’s biodiversity (Rodgers and Panwar, 1988). It is one of the biodiversity
hotspots of the World (Myers et al. 2000). About one-third of its area is still covered by natural
vegetation, including about 20,000 sq. km of rain forests (Collins, 1990). This hill range (1600
km) starting from 8 º20’N has only one major discontinuity, the Palghat Gap. Annual rainfall of
the Western Ghats may vary from 2350 to 7450 mm along the north-south gradient and the rainfall
is largely from the southwest monsoon (June - August). Unique geographic position and distinct
physiographic, edaphic and climatic gradients make the Western Ghats suitable for a wide array of
habitats that support unique sets of plant and animal species (Biju, 2001). Several forest operations
such as Coffee, Tea and Cardamom have been started during the 19th century resulting in clearing
of Semi Evergreen and Evergreen forests (Fischer, 1921).
Baseline data like occurrence, abundance and population dynamics are the key for the
conservation and planning of the management for any forests. However, such information is not
available for most the Indian forests except few protected areas with charismatic species like tiger,
elephant or lion. Same is true with many forested areas including few small protected areas of the
Western Ghats. Highwavy environs is one such area include one protected area i.e. Megamalai
(Highwavy) Wildlife Sanctuary which lack baseline information where systematic attempt has not
been made till date to document the many taxonomic groups including mammals.
The Highwavy Mountains
Theni Forest Division including Highwavy mountain is considered here as Highwavy environs
and it is geographically located between 90 30’to 10
0 30’ N and 77
0 to 78
0 30’ E in the political
boundary of Theni District of Tamil Nadu State (Fig 1.1). The area is surrounded by
Srivilliputhur Grizzled Squirrel Wildlife Sanctuary in the south, Palni hills in the northeast and
Periyar Tiger Reserve in the southwest. The total area of this division is 863.85 sq. km and a small
portion (269.11sq.km) of the division has been declared as Megamalai Wildlife Sanctuary and the

2
remaining large extent of forest areas are still under the reserved forest category. The altitude of
the division ranges from 300 to 2016 m. The Theni Forests receive rainfall from both Southwest
(June - August) and Northeast (September - November) monsoons, the later contributes more than
60% of the annual total. The region harbors variety of vegetation types; Montane shola and
Grassland, Open Rock with Grass, Wet Evergreen, Moist deciduous, Riverine and Dry deciduous
forest and Plantations such as Tea, coffee and Cardamom. This mountain range forms an
important catchment area for the rivers Vaigai and Suruliar that feed the dry eastern plains of the
south Tamil Nadu. However, the upper Vaigai catchment area is facing high level anthropogenic
pressure and lack of protection.
The Highwavy mountains are also known as the Megamalai Hills, (In Tamil: Megha = cloud,
Malai = hill). The Highwavy mountains are also known as Patchakumachi, (In Tamil: Patcha =
green, Kumachi = jungle). The name “Highwavy Mountains” was applied by the earlier explorers
who just noted the appearance from the Cumbam Valley. The elevated plateau constitutes a spur
from the Cardamom Hills oriented southeast-northeast. Megamalai Hill constitutes the western
edge of the Varusanad Hills along the deep Cumbam Valley. The present study area (Highwavy
environs) has undulating terrain and most of the area is steep.
The present study was planned based on our earlier study in lower taxa (amphibians and reptiles)
and a short-term survey on primate in the area. An exploration made at six decades ago by Angus.
F. Hutton (1949) also raised several interesting questions on mammals in the region. Further, the
region also expected to act as crucial corridor between Anamalai hills and Periyar-Agatiyamalai.
Thus, the present study was taken up with the financial support of CEPF-ATREE small grants and
Rufford Small Grants, through Wildlife Information Liaison Development (WILD) Society and
Sálim Ali Centre for Ornithology and Natural History (SACON), Coimbatore.

3
Figure 1.1 Map showing Theni Forest Division and Highwavy environs
Objectives
To prepare an inventory of large mammals in the Highwavy environs
To systematically assess the status and distribution of large mammals in the Highwavy
environs.
To identify nature and extend of threats to the conservation of large mammals in the
Highwavy environs
To identify high mammal rich zones in the mountain range through occupancy estimation.
To identify biological corridor and developing conservation action plan for conservation.
To transfer the knowledge of large mammals for better management of the Highwavy
environs to the managers and stakeholders.

4
Methods
Based on the above objectives the study was carried out from June 2011 to December 2012. Three
methods were adapted to address the proposed objectives. Among them, grid walk method was
followed as a major one. Four sq. km grids were overlaid on the base map of the study area to
identify the individual sampling units. All the full girds were selected and incomplete grids were
rejected. Within each selected grid, search trail with 0.5 km segment as spatial replicates, thus five
replicates (2.5 km) per grid were established. The detection history of direct and indirect sightings
like scats, pugmarks, pellets, dens, feeding evidences were recorded for each 100 m segment. At
every 100 m interval, habitat covariates were recorded in segment thereby five habitat covariate
points in each segment and a total of 25 points per grid. Threats including live anthropogenic
pressure and weed cover were recorded qualitatively.
Despite the search trails in the selected grids, camera traps were deployed to know the occurrence
of the nocturnal and elusive mammals in the grids. And also for nocturnal mammals (arboreal
mammals), spotlighting survey/night surveys were carried out in all the accessible grids.
Incidental data on all the sightings of mammals were maintained (species name, number of
individuals, GPS locations and habitat related parameters). All the sight records of all the species
from all the methods were used to prepare the inventory.
The Report
The present study was attempted to document the inventory of large mammals, estimate the
relative abundance and occupancy. Grids were considered as a minimum unit to understand the
distribution pattern and abundance. Chapter I has addressed the need of present study, frame work
for the project. Chapter II consolidated list of mammals in the Highwavy environs was prepared
based on primary and secondary data and information about the rare and first records obtained
from the present study. Chapter III provides the relative abundance of mammals as encounter rate
for large mammals and their abundance in various elevational categories, forest types and
disturbance levels. Chapter IV illustrates the area occupied by different species of mammals by
means of occupancy estimation in the Highwavy environs and Chapter V highlights the threats,
5
conservation issues and mitigation measures to be considered for the management of Highwavy
environs.
References
Biju, S.D. (2001). A synopsis of the frog fauna of the Western Ghats, India. Occasional
Publication of the Indian Society for Conservation Biology 1: 1-24.
Fischer, C.E.C. (1921). A survey of the flora of the Anamalai Hills in the Coimbatore District,
Madras Presidency. Records of Botanical Survey of India 9: 1 – 218.
Hutton, A.F. (1949). Notes on the snakes and mammals of the Highwavy Mountains, Madurai
District, South India. Part I: Snakes. Journal of the Bombay Natural History Society 48(3):
454-460.
Myers, N., R.A. Mittermeier, C.G. Mittermeier, C.A.B. da Fonseca & J. Kent (2000). Biodiversity
hotspots for conservation priorities. Nature 403. 853-858.
Rodgers, W. A. & H.S. Panwar (1988). Planning a wildlife Protected Area, Network India
(Volume I and II). A report prepared for the Department of Environment, Forests and
Wildlife. Government of India. Wildlife Institute of India, Dehra Dun.
6
Chapter II
Mammals of Highwavy environs
Introduction
Information such as presence or absence of any species co-relates to the habitat in which it lives.
However, baseline information is the basic requisite for any management action. It is basic
requisite for any management action. Since there are different taxa which constitute the
biodiversity of the area, effective documentation requires a basic knowledge of habits of animals,
its habitats and behaviour.
In many of the protected area such information is lacking or dating back to several decades one
such area is Highwavy (Megamalai). In spite of being an important wildlife corridor, updated data
on mammals of the landscape is lacking. While reviewing the available literature on mammals of
the landscape, it was found that mammal survey in the hill range was started in the beginning of
19th
century by Prater. He explored and collected mammals from the Cumbam Valley and the
northern slopes of Highwavy Mountains, and these specimens were preserved in Bombay Natural
History Society (BNHS) Museum collections. Subsequently, Wroughton (1917) wrote the
descriptions for collection made by Prater, from which he identified 24 species mainly rodents and
bats. After a lapse of three decades, Hutton (1949) collected and described the habit, habitat and
distribution of 56 mammal species including few range restricted and threatened species. More
than two decades later (1972), when working on the specimens of megachiropterans at BNHS,
Thonglongya had noticed that the specimen labelled Cynopterus sphinx, collected at the Highwavy
Mountains, was wrongly identified. He identified it as a new genus Latidens and named the
species as salimalii, after India’s eminent ornithologist Salim Ali. Latidens salimalii
(Thonglongya 1972) is endemic to south India. Subsequent survey by BNHS and Harrison
Zoological Museum rediscovered L. salimalii at the Highwavy Tea and Coffee Estates (Kardana
Coffee Estate) and suggested that it is located from two areas in southern Western Ghats (Muni
1993, Menon, 2009). In addition, few short surveys were also attempted to address the roost site
characteristics of the bat (Singaravelan & Marimuthu 2003 a, b). Kumara et al. (2011) highlighted
that the landscape hold one of the largest populations of globally threatened lion-tailed macaque
Macaca silenus with larger group size. Bhupathy et al. (2012) has highlighted the conservation
significance of the landscape using select vertebrates. Although the landscape has been well
7
explored in terms of mammals over the decades (1917 – 2012) through a series of short-term
studies at different time period (1917-2012), the updated list of mammals and their current status
(qualitative) in the landscape is meagre. In this context, we update the mammals of the Highwavy
based on primary (June 2011 – December 2012) and secondary information.
Methods
We have carried out a study on status and distribution of large mammals in the landscape between
June 2011 and December 2012. The entire landscape was gridded on the base map and each grid
was sampled for the presence -absence of the mammals by walking on pre-determined paths.
During this all the sighted animals were recorded, droppings on trail was recorded with species
identity, and also animals presence was recorded based on tracks and signs (We also conducted
night surveys using flashing the light or using a motor vehicle with light by driving slowly
recording animals found on either side of the forest (sampling effort 85 km) for recording species.
Further, we also reviewed the literature to prepare a comprehensive list for mammals for the
landscape (e.g. Wroughton 1917; Hutton 1949; Thonglongya 1974; Muni 1993; Singaravelan &
Marimuthu 2003 a, b). The status of each mammal species observed by Hutton was compared with
the current population status (consolidated from the study) to understand the influence of six
decades of disturbance on distribution of large mammals (41 Species). IUCN status, endemism
and schedule category in Indian Wildlife Protection Act (1972) were compiled to highlight the
conservation significance of the landscape in terms of mammals.
Results
A total of 133 grids (4 sq.km size) were sampled for tracks and signs of mammals, and 85 km road
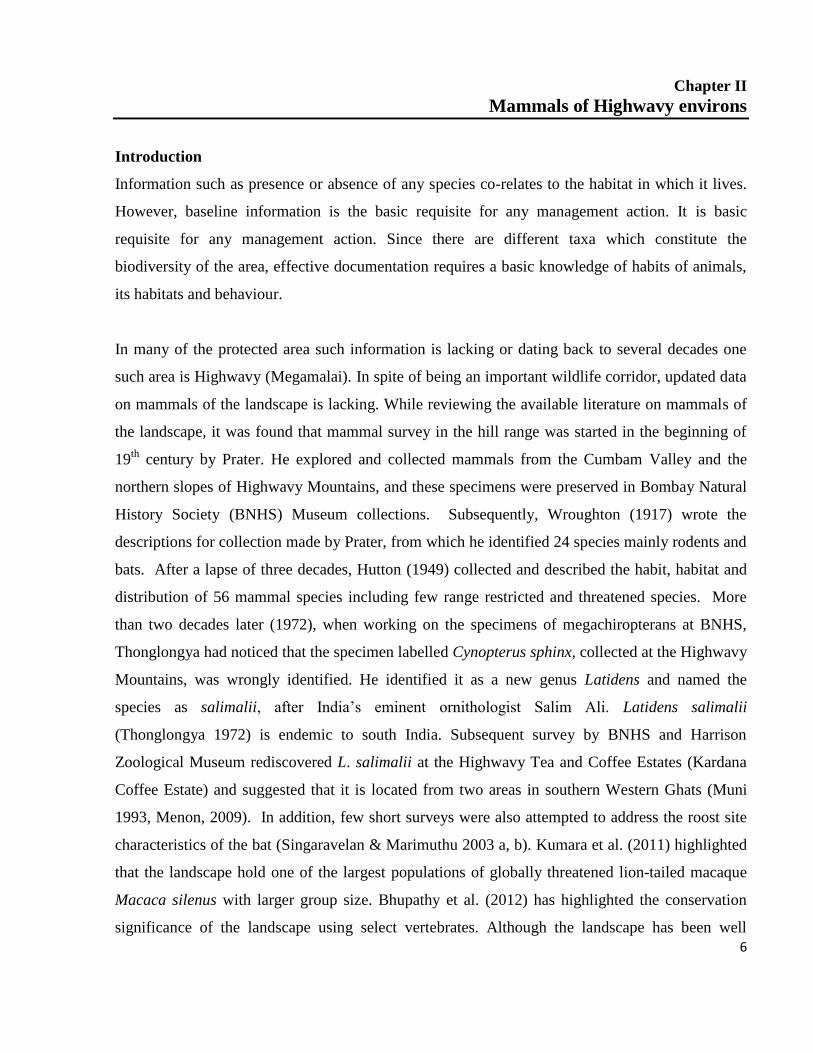
that intersect forests were surveyed for nocturnal mammals. Sixty three species of mammals
belongs to 24 families were recorded from the landscape (Table 1). The family muridae (rats and
mouse) was recorded with maximum number of species (Fig. 2.1) followed by sciuridae
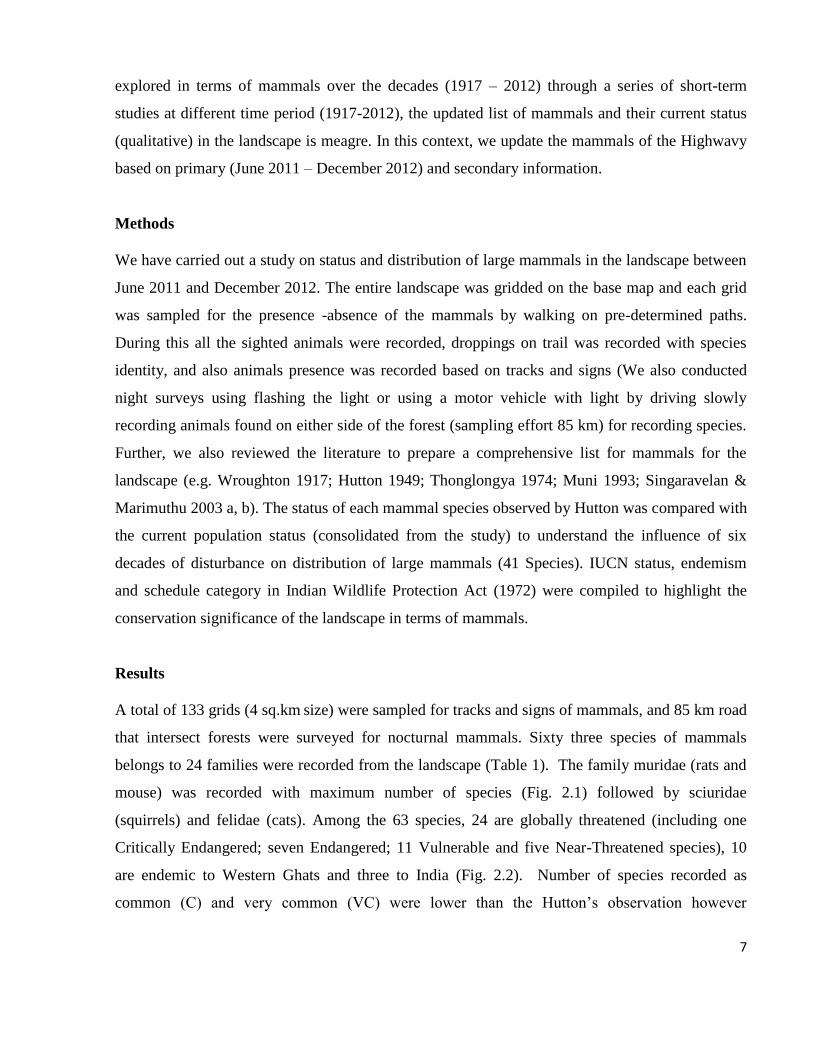
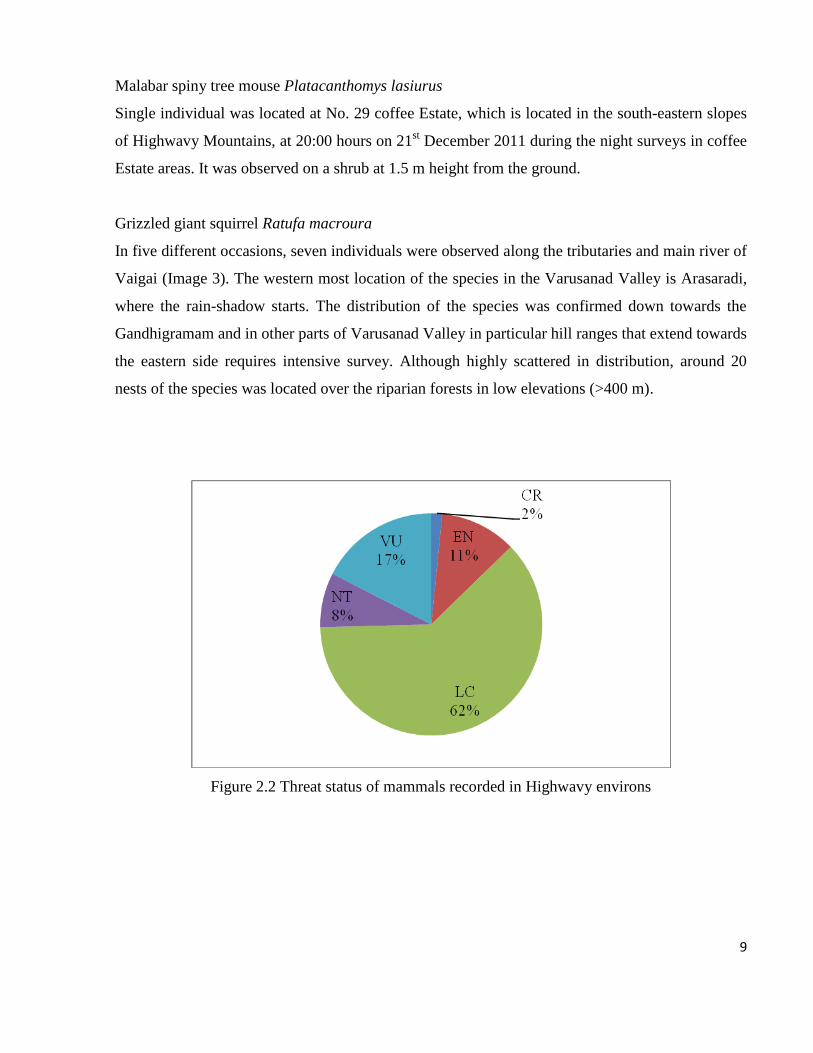
(squirrels) and felidae (cats). Among the 63 species, 24 are globally threatened (including one
Critically Endangered; seven Endangered; 11 Vulnerable and five Near-Threatened species), 10
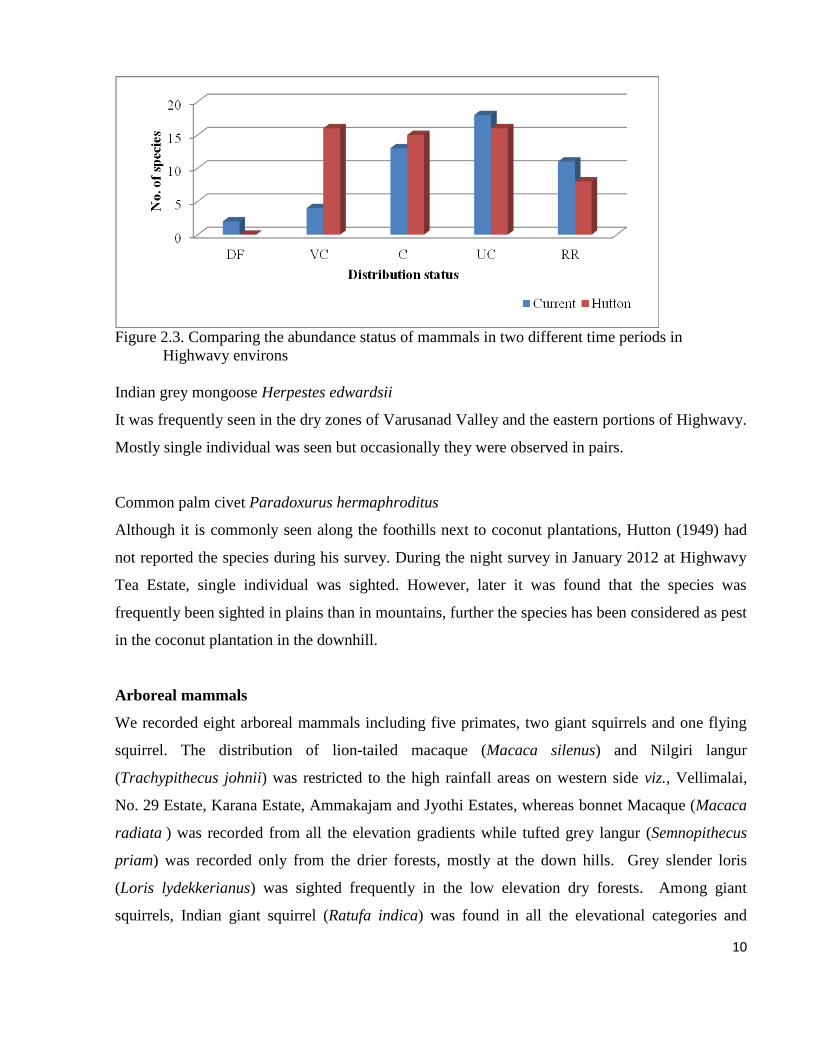
are endemic to Western Ghats and three to India (Fig. 2.2). Number of species recorded as
common (C) and very common (VC) were lower than the Hutton’s observation however
8
uncommon (UC) and rare (RR) were higher than the earlier observation (Fig. 2.3). Five species
viz., rusty-spotted cat, Malabar spiny tree mouse, Indian grey mongoose, grizzled giant squirrel
and common palm civet were added newly to the existing list of mammals in Highwavy. Further,
three species of bats viz., Sálim Ali fruit bat Latidens salimalii, lesser dog-faced fruit bat
Cynopterus brachyotis and rufous horseshoe bat Rhinolophus rouxii were not recorded by Hutton
but recorded by Singaravelan & Marimuthu (2003 a, b). Some of the sight records of earlier notes
arises doubts of its accuracy, in particular the sightings of Malabar civet and fishing cat. Detailed
species information, for each new site record, obtained from the present study is presented here.
Figure 2.1 Family wise species richness of mammals in Highwavy environs
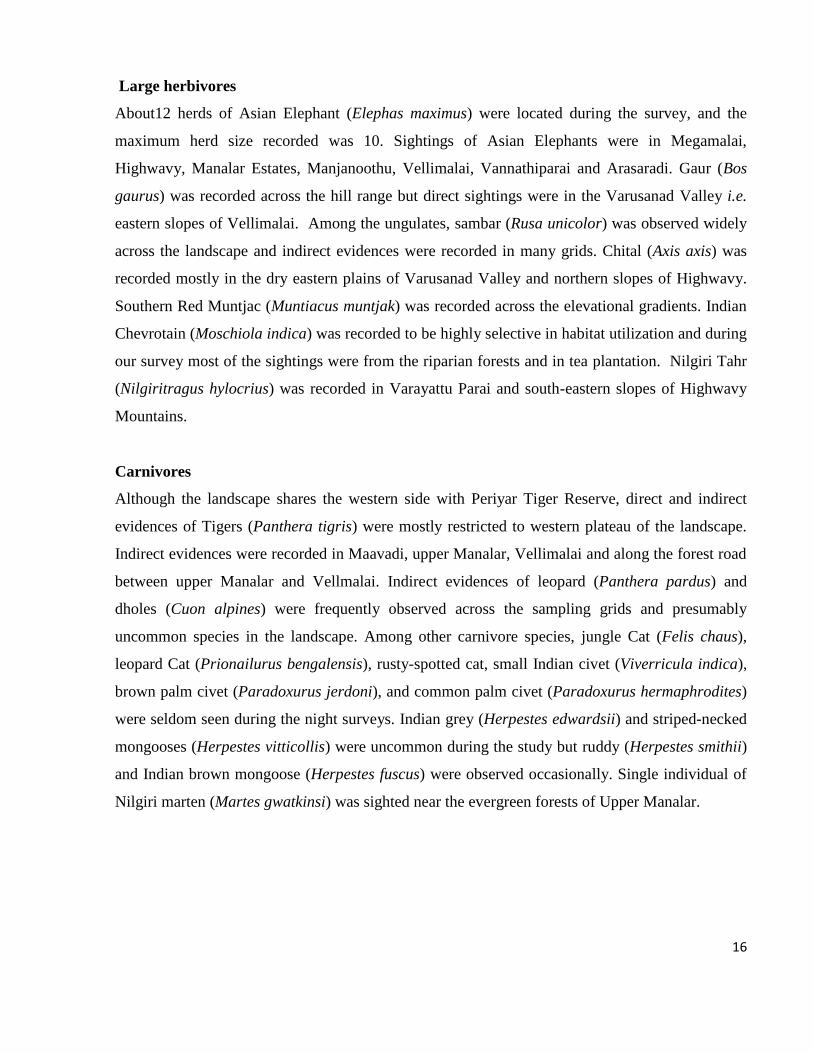
Rusty-spotted cat Prionailurus rubiginosus
Four observations of rusty-spotted cats were obtained during the present study. This included two
direct sightings (June 2012; Vannathiparai of Gudalur Range) and two indirect sightings (July
2012, a dead one was found at Manjanoothu of Varusanad Valley and a road kill near
Rajapalayam town). The species presumably prefers low elevation, leeward side and next to
human settlements in the Highwavy. 0
9
Malabar spiny tree mouse Platacanthomys lasiurus
Single individual was located at No. 29 coffee Estate, which is located in the south-eastern slopes
of Highwavy Mountains, at 20:00 hours on 21st December 2011 during the night surveys in coffee
Estate areas. It was observed on a shrub at 1.5 m height from the ground.
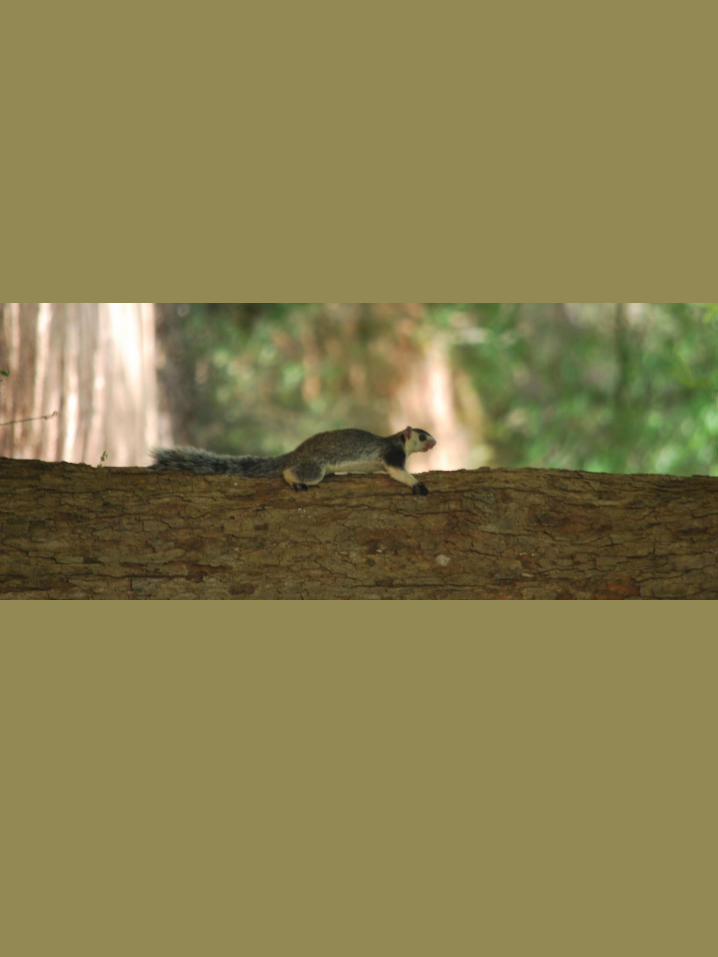
Grizzled giant squirrel Ratufa macroura
In five different occasions, seven individuals were observed along the tributaries and main river of
Vaigai (Image 3). The western most location of the species in the Varusanad Valley is Arasaradi,
where the rain-shadow starts. The distribution of the species was confirmed down towards the
Gandhigramam and in other parts of Varusanad Valley in particular hill ranges that extend towards
the eastern side requires intensive survey. Although highly scattered in distribution, around 20
nests of the species was located over the riparian forests in low elevations (>400 m).
Figure 2.2 Threat status of mammals recorded in Highwavy environs
10
Figure 2.3. Comparing the abundance status of mammals in two different time periods in
Highwavy environs
Indian grey mongoose Herpestes edwardsii
It was frequently seen in the dry zones of Varusanad Valley and the eastern portions of Highwavy.
Mostly single individual was seen but occasionally they were observed in pairs.
Common palm civet Paradoxurus hermaphroditus
Although it is commonly seen along the foothills next to coconut plantations, Hutton (1949) had
not reported the species during his survey. During the night survey in January 2012 at Highwavy
Tea Estate, single individual was sighted. However, later it was found that the species was
frequently been sighted in plains than in mountains, further the species has been considered as pest
in the coconut plantation in the downhill.
Arboreal mammals
We recorded eight arboreal mammals including five primates, two giant squirrels and one flying
squirrel. The distribution of lion-tailed macaque (Macaca silenus) and Nilgiri langur
(Trachypithecus johnii) was restricted to the high rainfall areas on western side viz., Vellimalai,
No. 29 Estate, Karana Estate, Ammakajam and Jyothi Estates, whereas bonnet Macaque (Macaca
radiata ) was recorded from all the elevation gradients while tufted grey langur (Semnopithecus
priam) was recorded only from the drier forests, mostly at the down hills. Grey slender loris
(Loris lydekkerianus) was sighted frequently in the low elevation dry forests. Among giant
squirrels, Indian giant squirrel (Ratufa indica) was found in all the elevational categories and
11
forest types, whereas small population of Grizzled giant squirrel (seven individuals observed) was
observed along the Vaigai River and its tributaries. Indian giant flying squirrel (Petaurista
philippensis) was recorded during the night surveys in thick canopied forests areas such as
Vellimalai and Highwavy Estates.
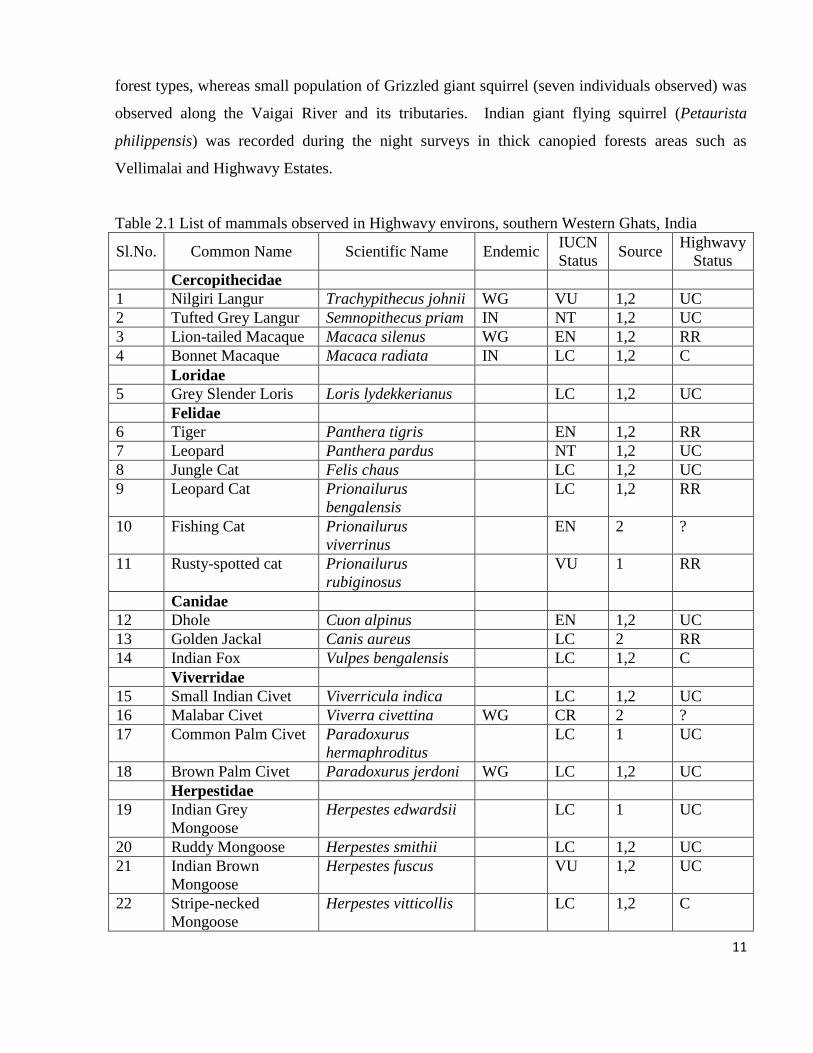
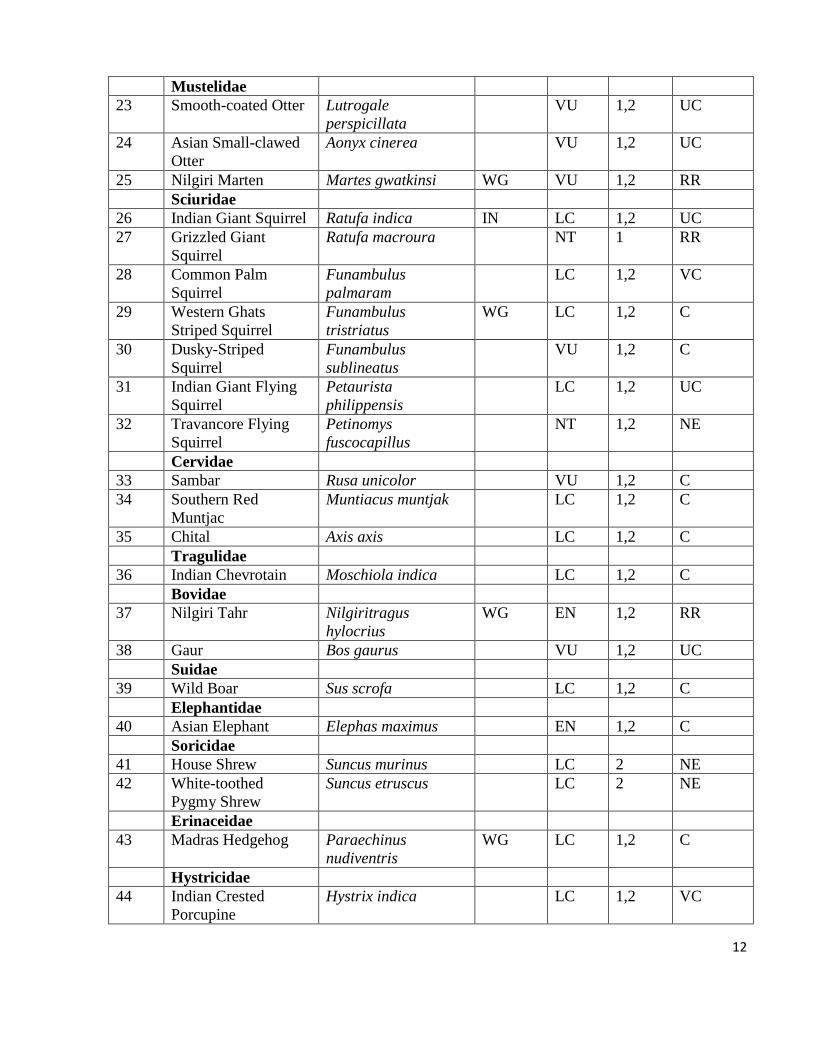
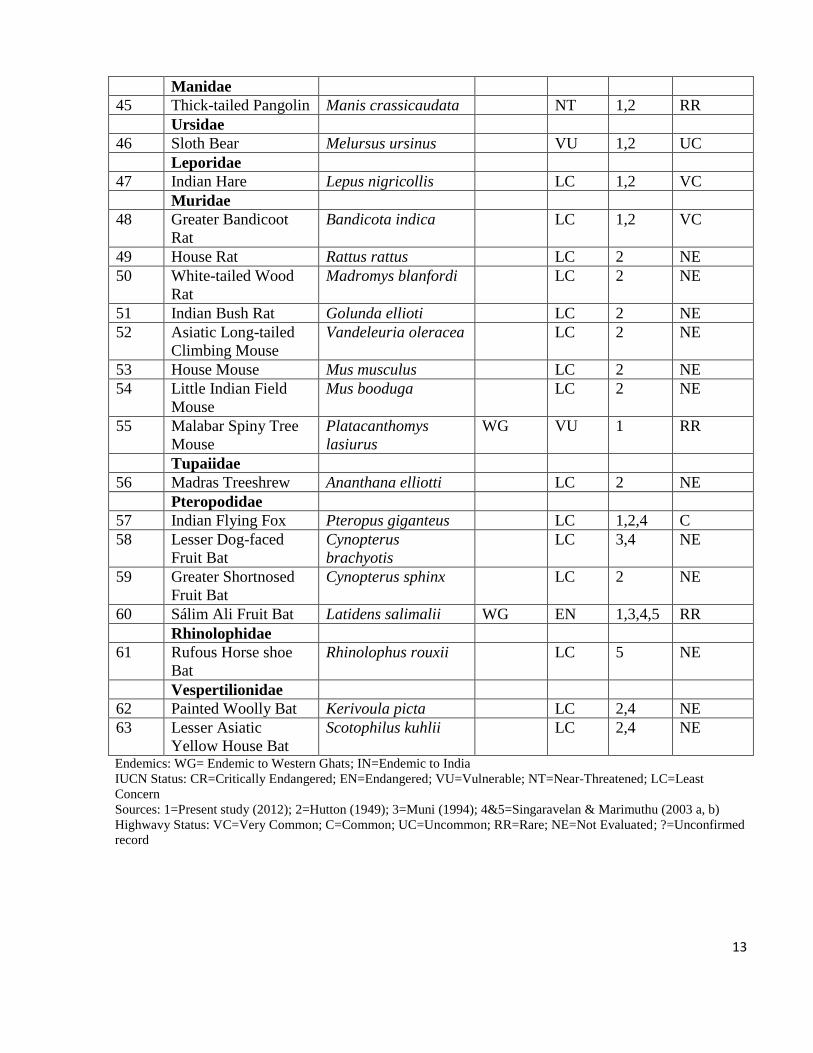
Table 2.1 List of mammals observed in Highwavy environs, southern Western Ghats, India
Sl.No. Common Name Scientific Name Endemic IUCN
Status Source
Highwavy
Status
Cercopithecidae
1 Nilgiri Langur Trachypithecus johnii WG VU 1,2 UC
2 Tufted Grey Langur Semnopithecus priam IN NT 1,2 UC
3 Lion-tailed Macaque Macaca silenus WG EN 1,2 RR
4 Bonnet Macaque Macaca radiata IN LC 1,2 C
Loridae
5 Grey Slender Loris Loris lydekkerianus LC 1,2 UC
Felidae
6 Tiger Panthera tigris EN 1,2 RR
7 Leopard Panthera pardus NT 1,2 UC
8 Jungle Cat Felis chaus LC 1,2 UC
9 Leopard Cat Prionailurus
bengalensis
LC 1,2 RR
10 Fishing Cat Prionailurus
viverrinus
EN 2 ?
11 Rusty-spotted cat Prionailurus
rubiginosus
VU 1 RR
Canidae
12 Dhole Cuon alpinus EN 1,2 UC
13 Golden Jackal Canis aureus LC 2 RR
14 Indian Fox Vulpes bengalensis LC 1,2 C
Viverridae
15 Small Indian Civet Viverricula indica LC 1,2 UC
16 Malabar Civet Viverra civettina WG CR 2 ?
17 Common Palm Civet Paradoxurus
hermaphroditus
LC 1 UC
18 Brown Palm Civet Paradoxurus jerdoni WG LC 1,2 UC
Herpestidae
19 Indian Grey
Mongoose
Herpestes edwardsii LC 1 UC
20 Ruddy Mongoose Herpestes smithii LC 1,2 UC
21 Indian Brown
Mongoose
Herpestes fuscus VU 1,2 UC
22 Stripe-necked
Mongoose
Herpestes vitticollis LC 1,2 C
12
Mustelidae
23 Smooth-coated Otter Lutrogale
perspicillata
VU 1,2 UC
24 Asian Small-clawed
Otter
Aonyx cinerea VU 1,2 UC
25 Nilgiri Marten Martes gwatkinsi WG VU 1,2 RR
Sciuridae
26 Indian Giant Squirrel Ratufa indica IN LC 1,2 UC
27 Grizzled Giant
Squirrel
Ratufa macroura NT 1 RR
28 Common Palm
Squirrel
Funambulus
palmaram
LC 1,2 VC
29 Western Ghats
Striped Squirrel
Funambulus
tristriatus
WG LC 1,2 C
30 Dusky-Striped
Squirrel
Funambulus
sublineatus
VU 1,2 C
31 Indian Giant Flying
Squirrel
Petaurista
philippensis
LC 1,2 UC
32 Travancore Flying
Squirrel
Petinomys
fuscocapillus
NT 1,2 NE
Cervidae
33 Sambar Rusa unicolor VU 1,2 C
34 Southern Red
Muntjac
Muntiacus muntjak LC 1,2 C
35 Chital Axis axis LC 1,2 C
Tragulidae
36 Indian Chevrotain Moschiola indica LC 1,2 C
Bovidae
37 Nilgiri Tahr Nilgiritragus
hylocrius
WG EN 1,2 RR
38 Gaur Bos gaurus VU 1,2 UC
Suidae
39 Wild Boar Sus scrofa LC 1,2 C
Elephantidae
40 Asian Elephant Elephas maximus EN 1,2 C
Soricidae
41 House Shrew Suncus murinus LC 2 NE
42 White-toothed
Pygmy Shrew
Suncus etruscus LC 2 NE
Erinaceidae
43 Madras Hedgehog Paraechinus
nudiventris
WG LC 1,2 C
Hystricidae
44 Indian Crested
Porcupine
Hystrix indica LC 1,2 VC
13
Manidae
45 Thick-tailed Pangolin Manis crassicaudata NT 1,2 RR
Ursidae
46 Sloth Bear Melursus ursinus VU 1,2 UC
Leporidae
47 Indian Hare Lepus nigricollis LC 1,2 VC
Muridae
48 Greater Bandicoot
Rat
Bandicota indica LC 1,2 VC
49 House Rat Rattus rattus LC 2 NE
50 White-tailed Wood
Rat
Madromys blanfordi LC 2 NE
51 Indian Bush Rat Golunda ellioti LC 2 NE
52 Asiatic Long-tailed
Climbing Mouse
Vandeleuria oleracea LC 2 NE
53 House Mouse Mus musculus LC 2 NE
54 Little Indian Field
Mouse
Mus booduga LC 2 NE
55 Malabar Spiny Tree
Mouse
Platacanthomys
lasiurus
WG VU 1 RR
Tupaiidae
56 Madras Treeshrew Ananthana elliotti LC 2 NE
Pteropodidae
57 Indian Flying Fox Pteropus giganteus LC 1,2,4 C
58 Lesser Dog-faced
Fruit Bat
Cynopterus
brachyotis
LC 3,4 NE
59 Greater Shortnosed
Fruit Bat
Cynopterus sphinx LC 2 NE
60 Sálim Ali Fruit Bat Latidens salimalii WG EN 1,3,4,5 RR
Rhinolophidae
61 Rufous Horse shoe
Bat
Rhinolophus rouxii LC 5 NE
Vespertilionidae
62 Painted Woolly Bat Kerivoula picta LC 2,4 NE
63 Lesser Asiatic
Yellow House Bat
Scotophilus kuhlii LC 2,4 NE
Endemics: WG= Endemic to Western Ghats; IN=Endemic to India
IUCN Status: CR=Critically Endangered; EN=Endangered; VU=Vulnerable; NT=Near-Threatened; LC=Least
Concern
Sources: 1=Present study (2012); 2=Hutton (1949); 3=Muni (1994); 4&5=Singaravelan & Marimuthu (2003 a, b)
Highwavy Status: VC=Very Common; C=Common; UC=Uncommon; RR=Rare; NE=Not Evaluated; ?=Unconfirmed
record
14
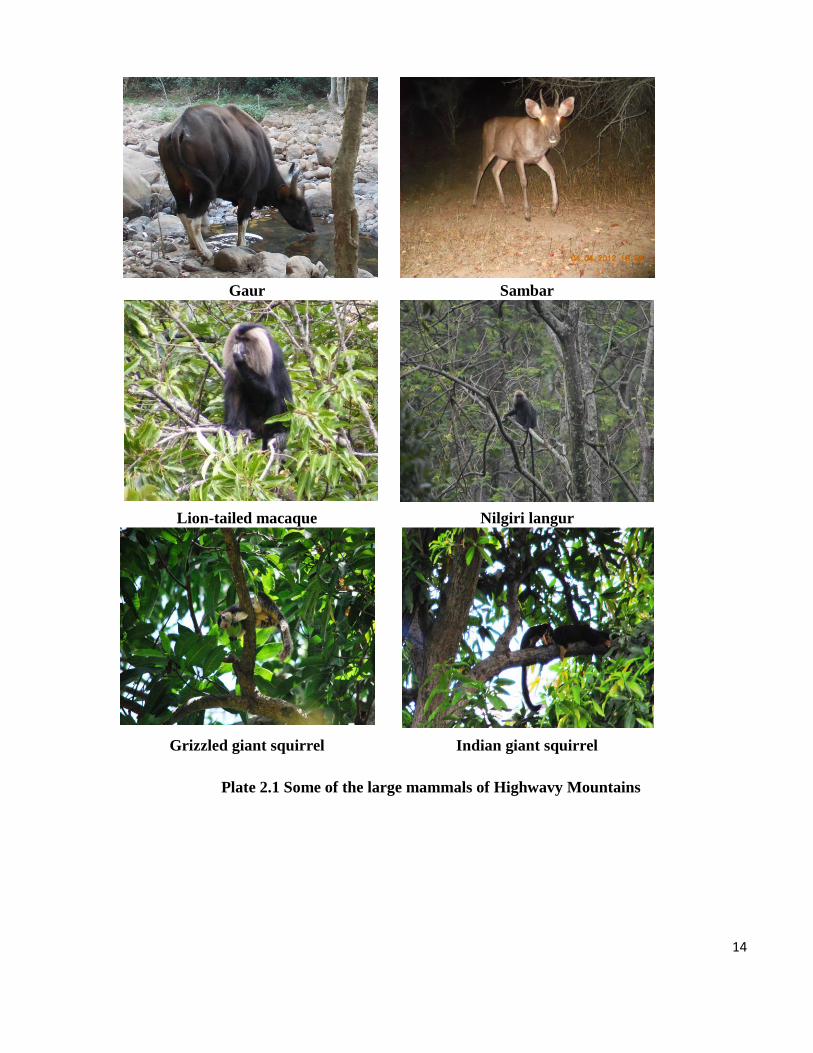
Gaur Sambar
Lion-tailed macaque Nilgiri langur
Grizzled giant squirrel Indian giant squirrel
Plate 2.1 Some of the large mammals of Highwavy Mountains
15
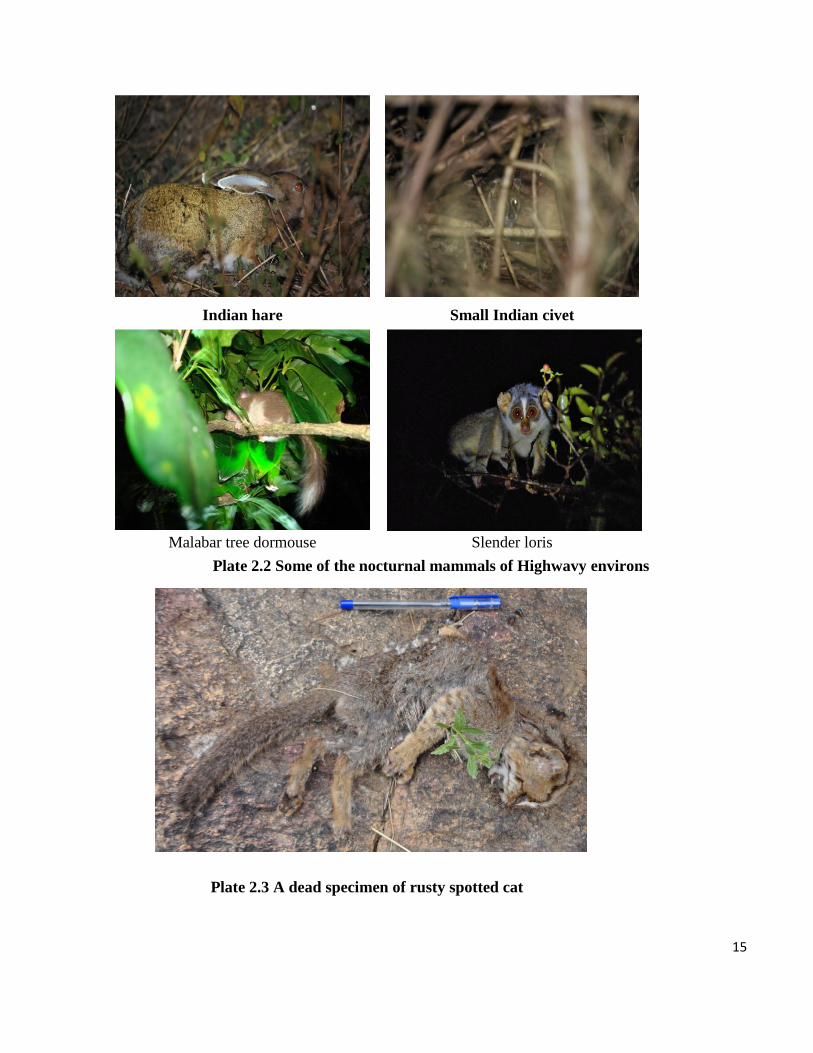
Indian hare Small Indian civet
Malabar tree dormouse Slender loris
Plate 2.2 Some of the nocturnal mammals of Highwavy environs
Plate 2.3 A dead specimen of rusty spotted cat
16
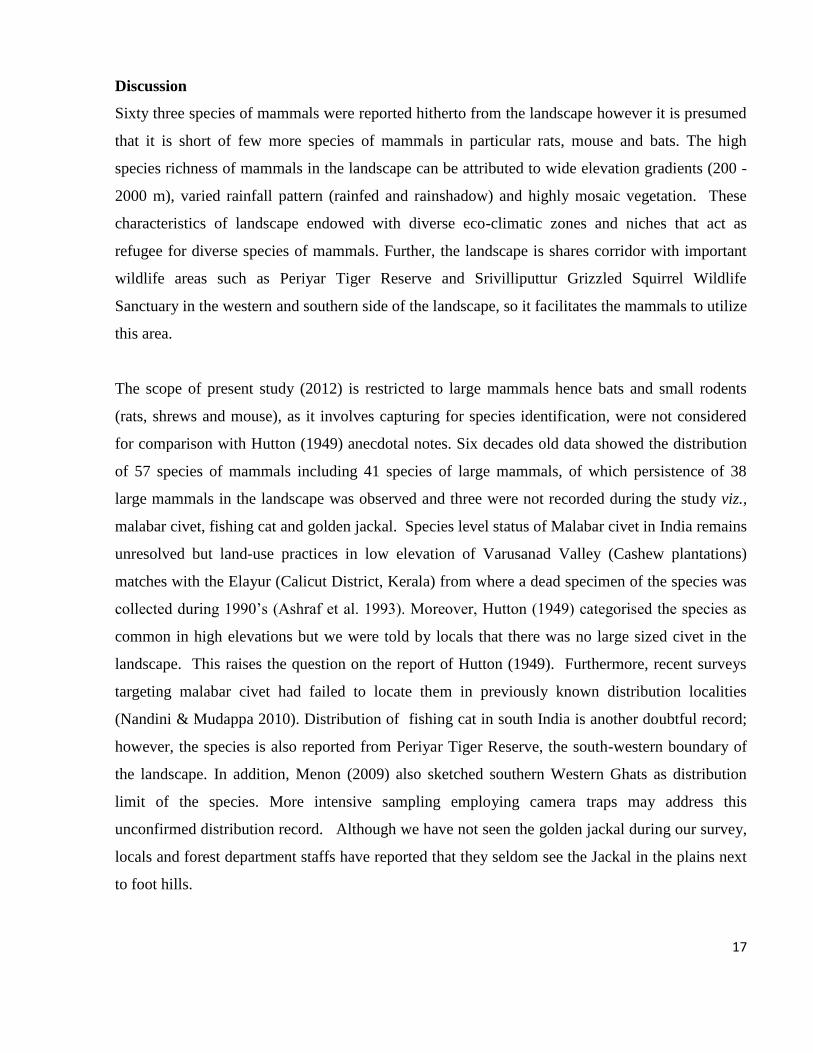
Large herbivores
About12 herds of Asian Elephant (Elephas maximus) were located during the survey, and the
maximum herd size recorded was 10. Sightings of Asian Elephants were in Megamalai,
Highwavy, Manalar Estates, Manjanoothu, Vellimalai, Vannathiparai and Arasaradi. Gaur (Bos
gaurus) was recorded across the hill range but direct sightings were in the Varusanad Valley i.e.
eastern slopes of Vellimalai. Among the ungulates, sambar (Rusa unicolor) was observed widely
across the landscape and indirect evidences were recorded in many grids. Chital (Axis axis) was
recorded mostly in the dry eastern plains of Varusanad Valley and northern slopes of Highwavy.
Southern Red Muntjac (Muntiacus muntjak) was recorded across the elevational gradients. Indian
Chevrotain (Moschiola indica) was recorded to be highly selective in habitat utilization and during
our survey most of the sightings were from the riparian forests and in tea plantation. Nilgiri Tahr
(Nilgiritragus hylocrius) was recorded in Varayattu Parai and south-eastern slopes of Highwavy
Mountains.
Carnivores
Although the landscape shares the western side with Periyar Tiger Reserve, direct and indirect
evidences of Tigers (Panthera tigris) were mostly restricted to western plateau of the landscape.
Indirect evidences were recorded in Maavadi, upper Manalar, Vellimalai and along the forest road
between upper Manalar and Vellmalai. Indirect evidences of leopard (Panthera pardus) and
dholes (Cuon alpines) were frequently observed across the sampling grids and presumably
uncommon species in the landscape. Among other carnivore species, jungle Cat (Felis chaus),
leopard Cat (Prionailurus bengalensis), rusty-spotted cat, small Indian civet (Viverricula indica),
brown palm civet (Paradoxurus jerdoni), and common palm civet (Paradoxurus hermaphrodites)
were seldom seen during the night surveys. Indian grey (Herpestes edwardsii) and striped-necked
mongooses (Herpestes vitticollis) were uncommon during the study but ruddy (Herpestes smithii)
and Indian brown mongoose (Herpestes fuscus) were observed occasionally. Single individual of
Nilgiri marten (Martes gwatkinsi) was sighted near the evergreen forests of Upper Manalar.
17
Discussion
Sixty three species of mammals were reported hitherto from the landscape however it is presumed
that it is short of few more species of mammals in particular rats, mouse and bats. The high
species richness of mammals in the landscape can be attributed to wide elevation gradients (200 -
2000 m), varied rainfall pattern (rainfed and rainshadow) and highly mosaic vegetation. These
characteristics of landscape endowed with diverse eco-climatic zones and niches that act as
refugee for diverse species of mammals. Further, the landscape is shares corridor with important
wildlife areas such as Periyar Tiger Reserve and Srivilliputtur Grizzled Squirrel Wildlife
Sanctuary in the western and southern side of the landscape, so it facilitates the mammals to utilize
this area.
The scope of present study (2012) is restricted to large mammals hence bats and small rodents
(rats, shrews and mouse), as it involves capturing for species identification, were not considered
for comparison with Hutton (1949) anecdotal notes. Six decades old data showed the distribution
of 57 species of mammals including 41 species of large mammals, of which persistence of 38
large mammals in the landscape was observed and three were not recorded during the study viz.,
malabar civet, fishing cat and golden jackal. Species level status of Malabar civet in India remains
unresolved but land-use practices in low elevation of Varusanad Valley (Cashew plantations)
matches with the Elayur (Calicut District, Kerala) from where a dead specimen of the species was
collected during 1990’s (Ashraf et al. 1993). Moreover, Hutton (1949) categorised the species as
common in high elevations but we were told by locals that there was no large sized civet in the
landscape. This raises the question on the report of Hutton (1949). Furthermore, recent surveys
targeting malabar civet had failed to locate them in previously known distribution localities
(Nandini & Mudappa 2010). Distribution of fishing cat in south India is another doubtful record;
however, the species is also reported from Periyar Tiger Reserve, the south-western boundary of
the landscape. In addition, Menon (2009) also sketched southern Western Ghats as distribution
limit of the species. More intensive sampling employing camera traps may address this
unconfirmed distribution record. Although we have not seen the golden jackal during our survey,
locals and forest department staffs have reported that they seldom see the Jackal in the plains next
to foot hills.
18
Species richness of mammals in the Highwavy mountains is comparable with other Protected
Areas/reserved forests in the eastern slopes of southern Western Ghats with a similar landscape
features viz., Kalakkad-Mundanthurai Tiger Reserve, Srivilliputtur Grizzled Squirrel Sanctuary,
Palni Hills and Anamalai Tiger Reserve. The distribution of mammals in Highwavy is also
comparable with few key sites in southern Western Ghats such as Periyar Tiger Reserve and
Parambikulam Tiger Reserve.
References
Ashraf, N.V.K., A. Kumar & A.J.T. Johnsingh. (1993). A survey of two endemic civets of the
Western Ghats: the Malabar Civet (Viverra civettina) and the Brown Palm Civet
(Paradoxurus jerdoni). Oryx 27: 109-114.
Bhupathy, S., G. Srinivas., N. Sathishkumar., M. Murugesan., S. Babu., R. Suganthasakthivel & P.
Sivakumar (2012). Diversity and conservation of selected biota of the Megamalai landscape,
Western Ghats, India. Current Science 102(4): 590-595.
Hutton, A.F. (1949). Notes on the snakes and mammals of the Highwavy mountains, Madura
District, South India. Part II-Mammals. Journal of Bombay Natural History Society 48: 681-
694.
Kumara, H.N., R. Sasi, R.Suganthasakthivel & G. Srinivas. (2011). Distribution,
abundance and conservation of primates in Highwavy Mountains of Western Ghats, Tamil
Nadu, India. Current Science 100: 1063-1067.
Menon, V. (2009). Mammals of India. Princeton University Press. p 200.
Muni, M. (1991). Rarest of the rare: Latidens salimalii. Hornbill (1): 28-32.
Nandini, R. & D. Mudappa. (2010). Mystery or myth: a review of history and conservation status
of the Malabar Civet Viverra civettina Blyth, 1862. Small Carnivore Conservation 43: 47-
59.
Singaravelan, N. & G. Marimuthu. (2003a). Discovery of a cave as the day roost of a rarest fruit
bat Latidens salimalii. Current Science 84: 1253-1256.
Singaravelan, N. & G. Marimuthu. (2003b). Mist net captures of the rarest fruit bat Latidens
salimalii. Current Science 84(1): 24-26.
Thonglongya, K. (1972). A new Genus and species of Fruit bat from south India (Chiroptera:
Pteropodidae). Journal of Bombay Natural History Society 69:151-158.
Wrougton, R.C. (1917). Bombay Natural History’s Mammal survey of India, Burma and Ceylon.
Report No.33. Highwavy mountain Madura district. Journal of Bombay Natural History
Society 27: 545-554.
19
Chapter III
Relative Abundance of Mammals in Highwavy environs
Introduction
Large herbivores are however, comparatively difficult to conserve owing to their large home range
needs, they are highly susceptible to loss of habitat and hunting pressure due to their body size
(Madhusudan & Karanth, 2002). Though the forests of Western Ghats has been recognised as one
of global biodiversity hotspots (Myers et al. 2000), it also has high human density (Cincotta et al.
2000). People living in the Ghats have been depending on natural resources obtained from the
forests including animal’s meat (Chandran et al. 1997). However, shrinking of forest cover and
increasing human population in forested landscapes have negatively affected the sustainable
harvest of many natural resources. Due to drastic decline in the forest cover and increase in the
human population negatively affected the sustainable harvest of many resources from the forest.
As a result of extensive use of natural resources, the population size of many species in the
Western Ghats declined drastically (Chandran et al. 1997). This also has lead drastic reduction in
population size of many animals in the Western Ghats (Kumara & Singh, 2004, Madhusudan &
Karanth, 2002), however, where ever the large and contiguous forest patches are left and protected
are only harbouring the remaining populations of many taxonomic groups. Unfortunately, from
many of the forest patches at outside protected areas do not have even the baseline data like
presence and abundance of inhabitants. Thus, such data on all the species is very important to
manage the forests and formulate future management strategies (Kumara et al. 2011).
Nilgiri Biosphere Reserve in Northern part of Western Ghats include major protected areas, viz.
Mudumalai Tiger Reserve, Bandipur Tiger Reserve, Nagarahole Tiger Reserve Biligiri
Rangaswamy Temple Tiger Reserve, Sathyamangalam Tiger Reserve and Wayanad Wildlife
Sanctuary the entire stretch of forest complex holds relatively high density of large mammals
(Kumara et al. 2012). However, though the southern part of Western Ghats includes (Anamalai
Tiger Reserve, Srivilliputhur Grizzled Giant Squirrel Sanctuary, Kalakkad-Mundanthurai Tiger
Reserve, Kanyakumari Wildlife Sanctuary) having various forests types from dry scrub forests at
eastern foot hills of the Western Ghats to montane shola at high altitude, but hold less density,
however, the diversity of mammals is more than north of Nilgiri Biosphere. Highwavy environs
20
are also a part of this chain of hills without any recent documentation at least for the last three/four
decades. Various commercial plantations like coffee, tea, cardamom plantations, and also
monoculture plantations like teak breaking the pristine habitats of Highwavy. Thus, the study was
carried out to document the status of large mammals in these hill systems, which are discussed in
the present chapter.
Methods
We used the animal sightings from grid walks (see chapter I for more details) to compute the
encounter rate for all the species. The grids were classified based on forest types, elevation
gradients and disturbance level. Based on the major vegetation type in the grid, the grids were
categorised for evergreen forests, savanna forests, dry deciduous forests and scrub forests.
Similarly, grids falling to a range of 200 m asl to 500 m asl as low elevation, 500 m asl to 1000 m
asl as mid elevation and ≥ 1000 m asl as high elevation. We broadly classified the disturbance
level as high, medium, low and no disturbed areas, by scoring the different disturbance factors like
human movement, grazing, firewood collection, lopping, timber extraction, grass collection and
hunting evidences. The scoring was done for each grid, and grouped them as low, medium and
high. Kruskal-Wallis test was used to test the difference between the encounter rate of animals.
The species which are strictly nocturnal were could not be assessed for their abundance during the
grid walk. So spotlight survey was carried out using metal road in the study site. During this
exercise a jeep was driven at low speed of about 10-20 km/hr to minimise the disturbance to
animals as well as for keen observation. At least three persons were involved in this study during
each drive, and the survey was carried out between 19:00 to 24:00 hrs. Survey was carried out in
Minnilayam to Lower camp, Minnilayam to 12th
Value House, Thenpazhani to Kardana, Kardana
to Upper Manalar, Manjanoothu to Vellimalai.

21
Results
A total of 285.6 km grid walk was made in 133 grids in Highwavy. Among the sampled grids, at
least one animal was encountered in 75 grids (56.39%) where in other grids (58 (43.61%) grids
did not encounter any animals. The species encountered in each grid varied between 1 and 5.
Highest of five species were recorded in two of grids, three species in 14 grids, two species in 18
grids and single species in 41 grids.
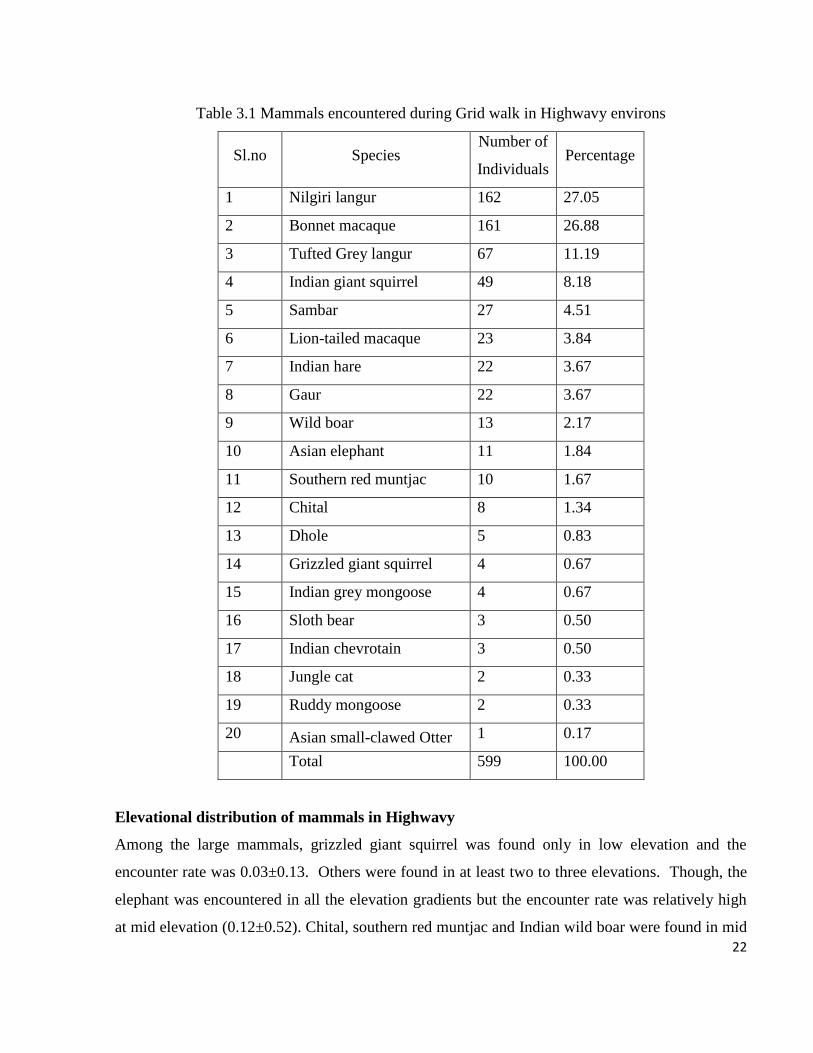
A total of 20 mammal species with 599 individuals were encountered during the grid walk.
Among the mammals Nilgiri langur was the most encountered species 162 (27%), followed by
bonnet macaque 161 (26.9%), tufted grey langur 67 (11.2%), Indian giant squirrel 49 (8.18%),
sambar 27 (4.51%), lion-tailed macaque 23 (3.84%), black-napped hare and gaur equally had 22
(3.67%), wild pig 13 (2.17%), elephant 11 (1.84%) and rest of the mammals encountered were
<10 individuals (Table 3.1).
Relative abundance of mammals in Highwavy
The relative abundance (mean animals per kilometre) of large mammals excluding primates viz.
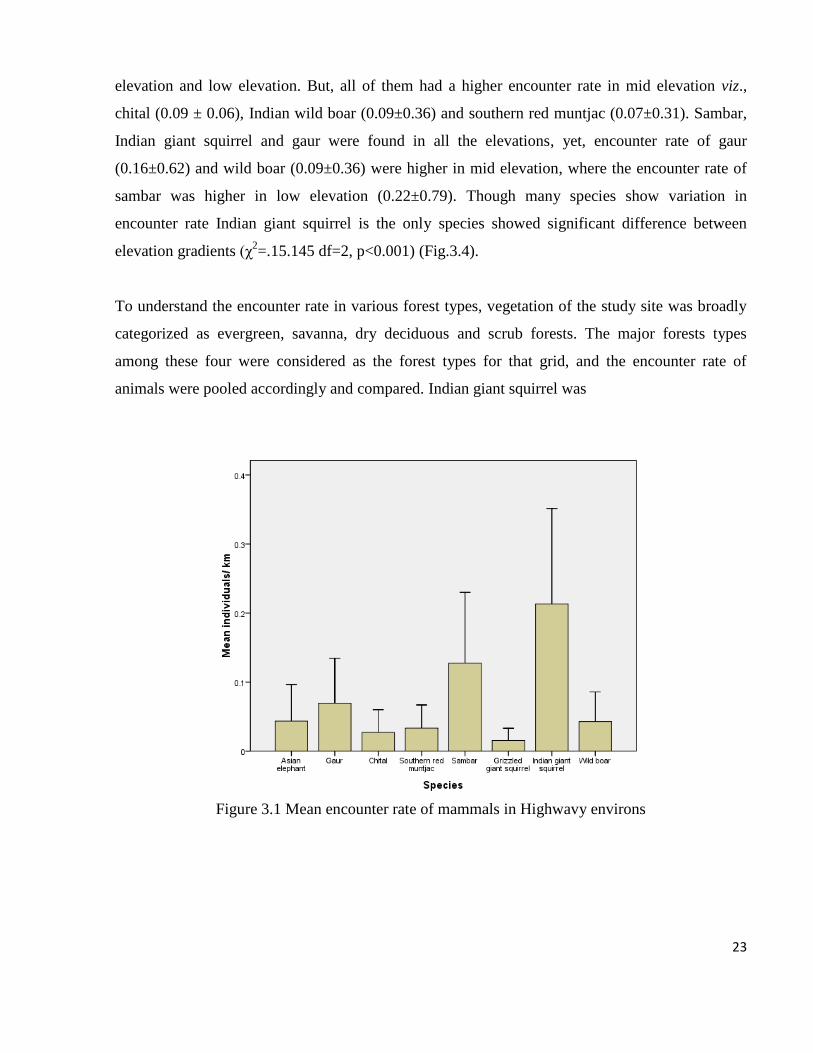
Indian giant squirrel was 0.21±0.81, sambar was 0.13±0.60, gaur was 0.07±0.38, wild pig was
0.04±0.25, elephant was 0.04±0.31, chital was 0.03±0.19 and Southern red muntjac was 0.03±0.20
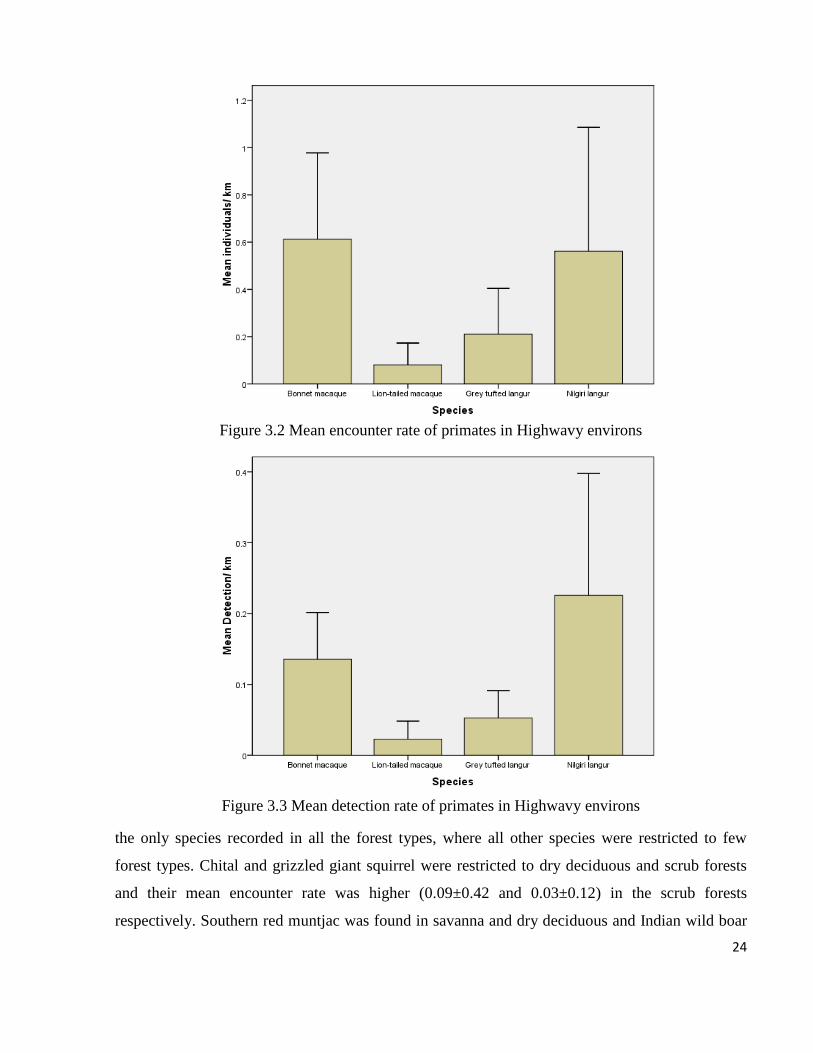
differed significantly (χ2=26.504, df=7, P<0.001) (Fig. 3.1). Among primate species the relative
abundance of bonnet macaque was 0.61±2.13, Nilgiri langur was 0.56±3.06, tufted grey langur
was 0.21±1.13 and lion-tailed macaque was 0.08±0.54 (Fig. 3.2). The relative abundance of
primates did not differ significantly (χ2=11.935, df=3, NS). However, the encounter rate of
primate groups viz. Nilgiri langur (0.23±1.0), lion-tailed macaque (0.02±0.14), bonnet macaque
(0.14±0.39) and tufted grey langur (0.05±0.22) was significantly differed (χ2=12.068, df=3,
P<0.05) (Fig.3.3).
22
Table 3.1 Mammals encountered during Grid walk in Highwavy environs
Sl.no Species Number of
Individuals Percentage
1 Nilgiri langur 162 27.05
2 Bonnet macaque 161 26.88
3 Tufted Grey langur 67 11.19
4 Indian giant squirrel 49 8.18
5 Sambar 27 4.51
6 Lion-tailed macaque 23 3.84
7 Indian hare 22 3.67
8 Gaur 22 3.67
9 Wild boar 13 2.17
10 Asian elephant 11 1.84
11 Southern red muntjac 10 1.67
12 Chital 8 1.34
13 Dhole 5 0.83
14 Grizzled giant squirrel 4 0.67
15 Indian grey mongoose 4 0.67
16 Sloth bear 3 0.50
17 Indian chevrotain 3 0.50
18 Jungle cat 2 0.33
19 Ruddy mongoose 2 0.33
20 Asian small-clawed Otter 1 0.17
Total 599 100.00
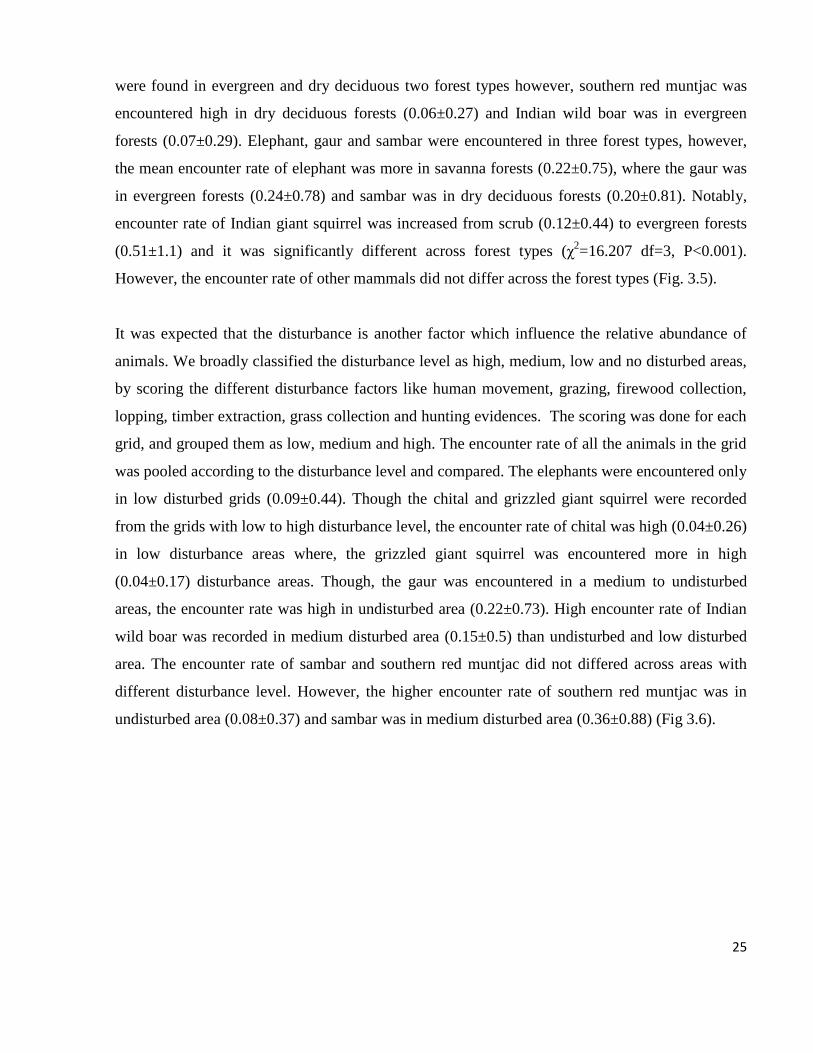
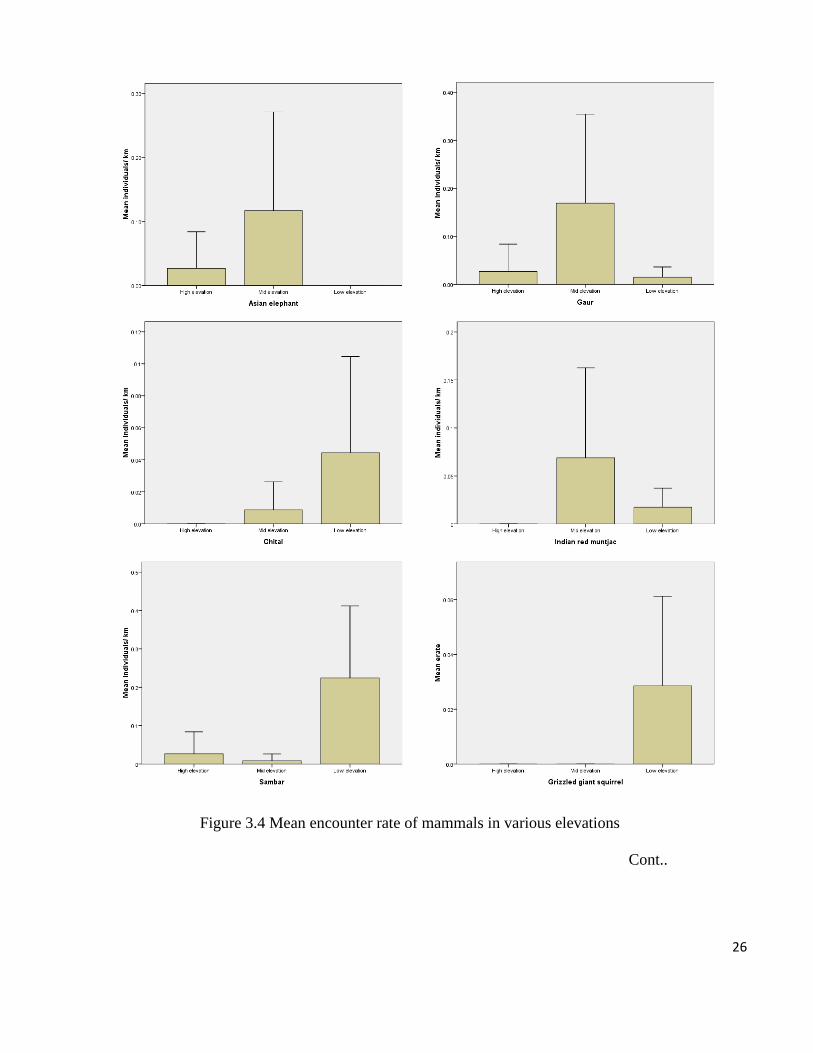
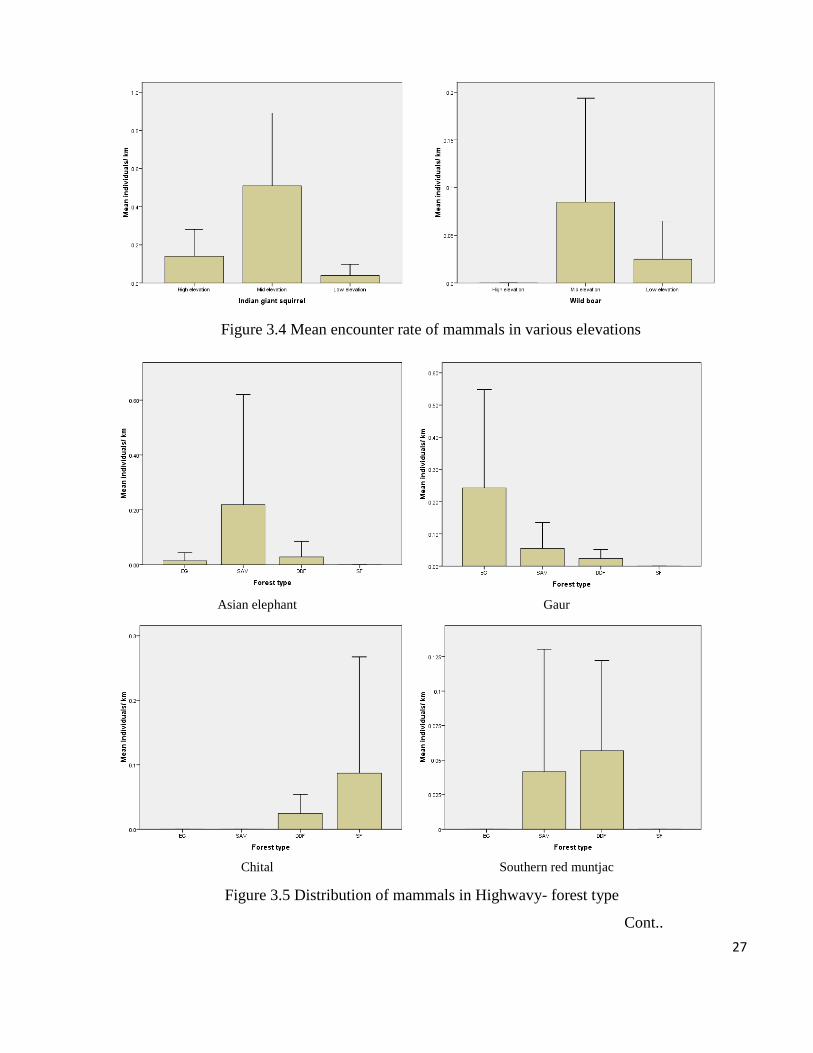
Elevational distribution of mammals in Highwavy
Among the large mammals, grizzled giant squirrel was found only in low elevation and the
encounter rate was 0.03±0.13. Others were found in at least two to three elevations. Though, the
elephant was encountered in all the elevation gradients but the encounter rate was relatively high
at mid elevation (0.12±0.52). Chital, southern red muntjac and Indian wild boar were found in mid
23
elevation and low elevation. But, all of them had a higher encounter rate in mid elevation viz.,
chital (0.09 ± 0.06), Indian wild boar (0.09±0.36) and southern red muntjac (0.07±0.31). Sambar,
Indian giant squirrel and gaur were found in all the elevations, yet, encounter rate of gaur
(0.16±0.62) and wild boar (0.09±0.36) were higher in mid elevation, where the encounter rate of
sambar was higher in low elevation (0.22±0.79). Though many species show variation in
encounter rate Indian giant squirrel is the only species showed significant difference between
elevation gradients (χ2=.15.145 df=2, p<0.001) (Fig.3.4).
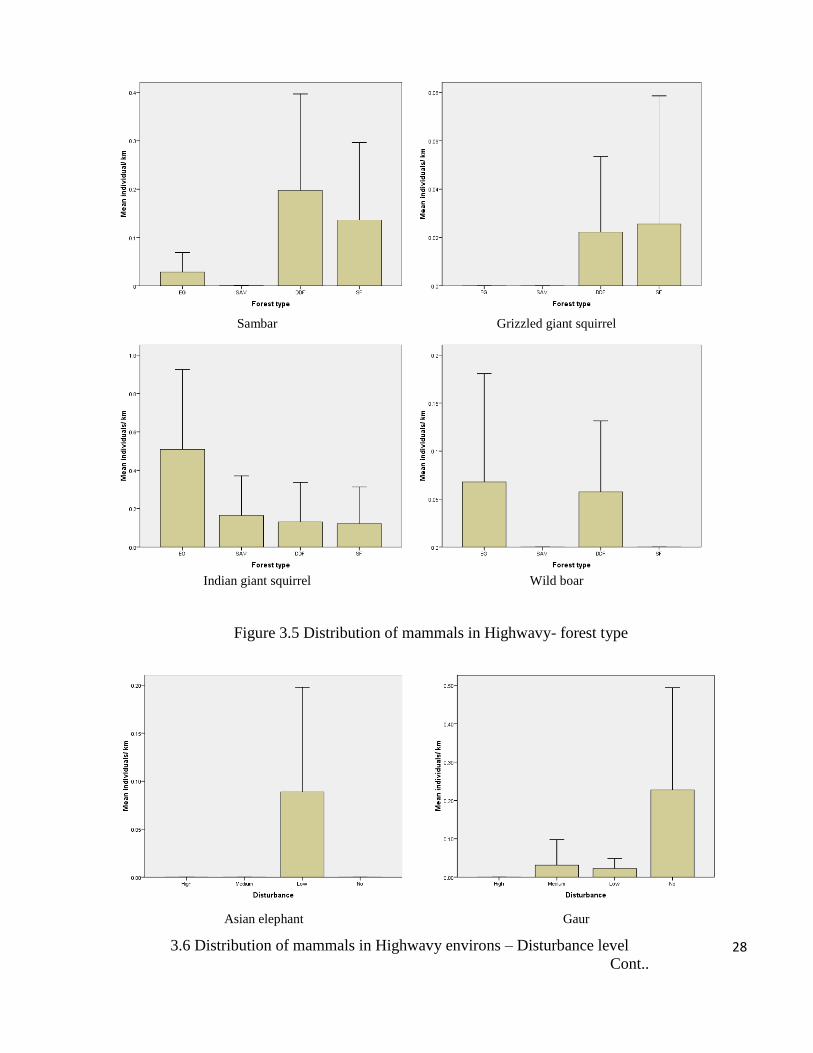
To understand the encounter rate in various forest types, vegetation of the study site was broadly
categorized as evergreen, savanna, dry deciduous and scrub forests. The major forests types
among these four were considered as the forest types for that grid, and the encounter rate of
animals were pooled accordingly and compared. Indian giant squirrel was
Figure 3.1 Mean encounter rate of mammals in Highwavy environs
24
Figure 3.2 Mean encounter rate of primates in Highwavy environs
Figure 3.3 Mean detection rate of primates in Highwavy environs
the only species recorded in all the forest types, where all other species were restricted to few
forest types. Chital and grizzled giant squirrel were restricted to dry deciduous and scrub forests
and their mean encounter rate was higher (0.09±0.42 and 0.03±0.12) in the scrub forests
respectively. Southern red muntjac was found in savanna and dry deciduous and Indian wild boar
25
were found in evergreen and dry deciduous two forest types however, southern red muntjac was
encountered high in dry deciduous forests (0.06±0.27) and Indian wild boar was in evergreen
forests (0.07±0.29). Elephant, gaur and sambar were encountered in three forest types, however,
the mean encounter rate of elephant was more in savanna forests (0.22±0.75), where the gaur was
in evergreen forests (0.24±0.78) and sambar was in dry deciduous forests (0.20±0.81). Notably,
encounter rate of Indian giant squirrel was increased from scrub (0.12±0.44) to evergreen forests
(0.51±1.1) and it was significantly different across forest types (χ2=16.207 df=3, P<0.001).
However, the encounter rate of other mammals did not differ across the forest types (Fig. 3.5).
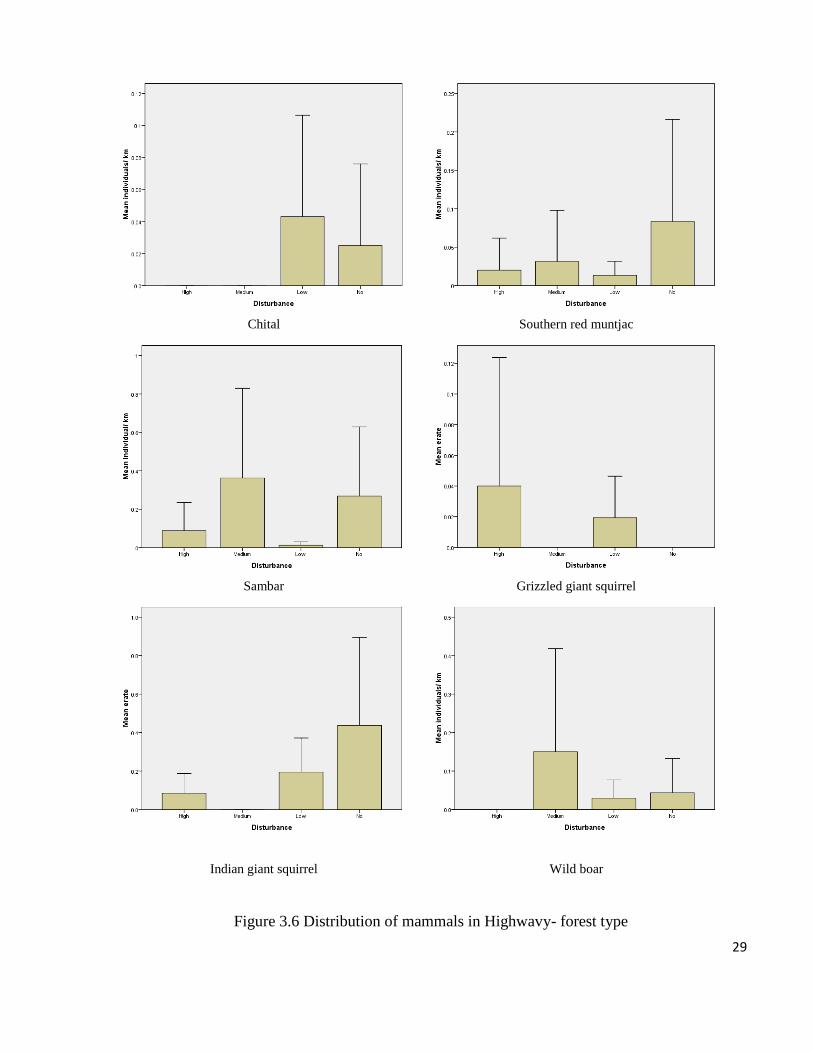
It was expected that the disturbance is another factor which influence the relative abundance of
animals. We broadly classified the disturbance level as high, medium, low and no disturbed areas,
by scoring the different disturbance factors like human movement, grazing, firewood collection,
lopping, timber extraction, grass collection and hunting evidences. The scoring was done for each
grid, and grouped them as low, medium and high. The encounter rate of all the animals in the grid
was pooled according to the disturbance level and compared. The elephants were encountered only
in low disturbed grids (0.09±0.44). Though the chital and grizzled giant squirrel were recorded
from the grids with low to high disturbance level, the encounter rate of chital was high (0.04±0.26)
in low disturbance areas where, the grizzled giant squirrel was encountered more in high
(0.04±0.17) disturbance areas. Though, the gaur was encountered in a medium to undisturbed
areas, the encounter rate was high in undisturbed area (0.22±0.73). High encounter rate of Indian
wild boar was recorded in medium disturbed area (0.15±0.5) than undisturbed and low disturbed
area. The encounter rate of sambar and southern red muntjac did not differed across areas with
different disturbance level. However, the higher encounter rate of southern red muntjac was in
undisturbed area (0.08±0.37) and sambar was in medium disturbed area (0.36±0.88) (Fig 3.6).
26
Figure 3.4 Mean encounter rate of mammals in various elevations
Cont..
27
Figure 3.4 Mean encounter rate of mammals in various elevations
Asian elephant Gaur
Chital Southern red muntjac
Figure 3.5 Distribution of mammals in Highwavy- forest type
Cont..
28
Sambar Grizzled giant squirrel
Indian giant squirrel Wild boar
Figure 3.5 Distribution of mammals in Highwavy- forest type
Asian elephant Gaur
3.6 Distribution of mammals in Highwavy environs – Disturbance level
Cont..
29
Chital Southern red muntjac
Sambar Grizzled giant squirrel
Indian giant squirrel Wild boar
Figure 3.6 Distribution of mammals in Highwavy- forest type
30
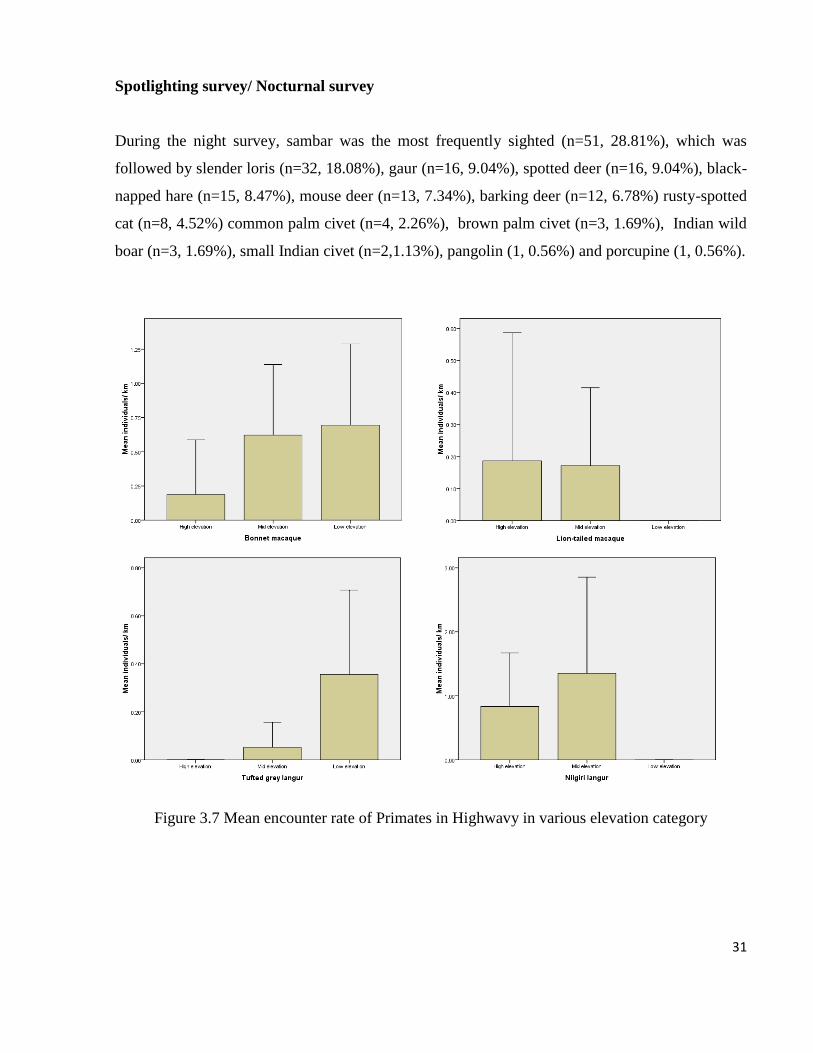
Primates
Among primate species, lion-tailed macaque, Nilgiri langur and tufted grey langur were restricted
to one or two elevation gradients where the bonnet macaque was encountered in all the elevation
gradients; however the encounter rate differed elevationally for all the species. Although, the lion-
tailed macaque and Nilgiri langur was encountered in high and mid elevation, but their encounter
rate was high in the high elevation 0.18±0.72 and 0.83±1.51 respectively. Where, the encounter
rate of bonnet macaque (0.69±2.52) and tufted grey langur (0.36±1.5) were more in the low
elevation. Although, the encounter rate of all the primates vary between the elevation gradients,
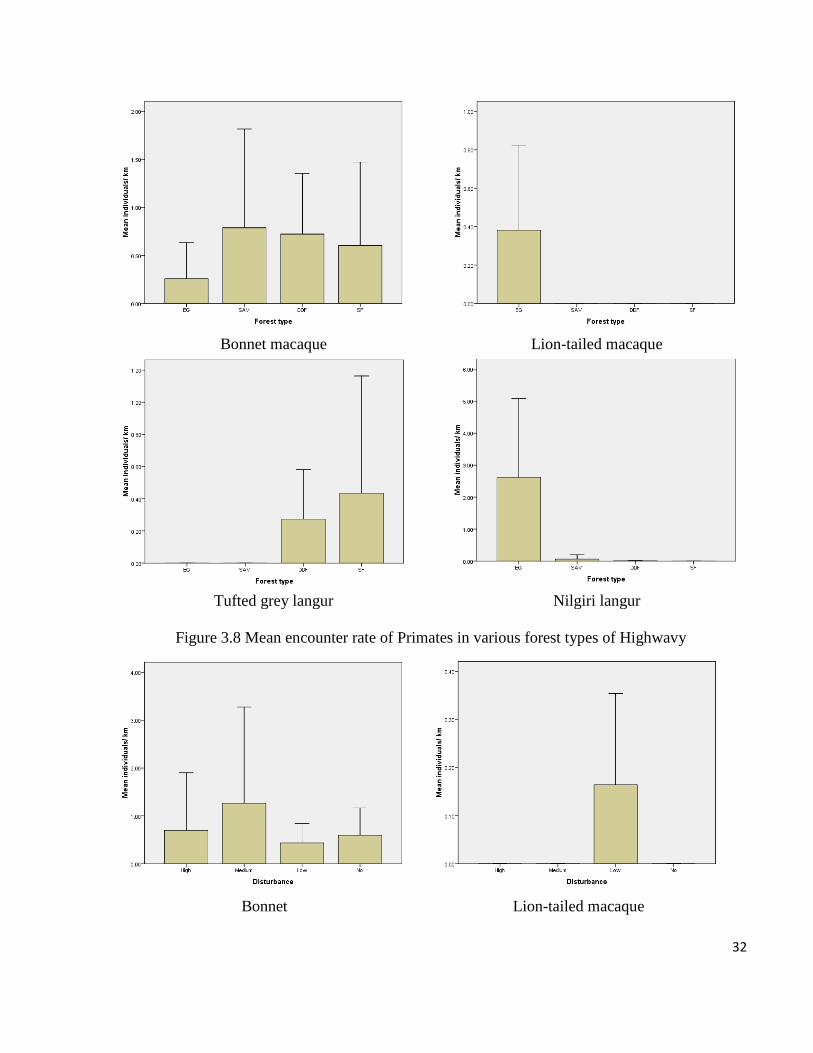
only Nilgiri langur differ significantly (χ2=20.232, df=2, P<0.001) (Fig 3.7). Similarly, the
encounter rate of lion-tailed macaque in evergreen forests (0.38±1.14), tufted grey langur in dry
deciduous (xx) and scrub forests (0.43±1.68) was higher than in other forests types. Although,
Nilgiri langur was encountered in evergreen, savanna and dry deciduous forests, but the highest
was in evergreen forests (2.62±6.34). Among the primates only Nilgiri langur showed significant
difference in the encounter rate in various forest type (χ2=40.521, df=3, P<0.001) (Fig. 3.8). The
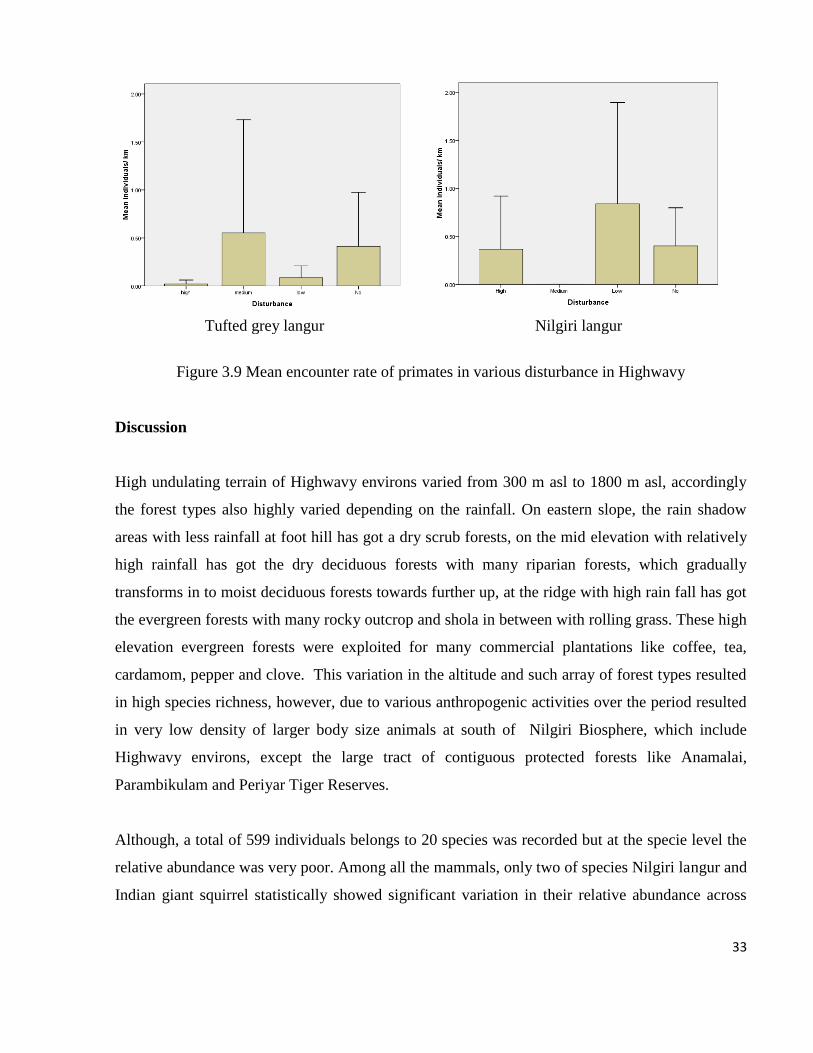
encounter rate of lion-tailed macaque (0.16±0.77) and Nilgiri langur (0.83±4.25) was more in the
low disturbed area, where, the bonnet macaque was more in highly disturbed area (0.69±2.57) (Fig
3.9).
Carnivores/ predators
Tiger was unseen in Highwavy. Only in few places indirect signs pugmarks, scratch, carrions were
found near Vellimalai, Mavadi (Vattathotti) and in between upper Manalar and 29th
estates all
these places were near or close to Periyar tiger Reserve in Kerala. During the entire study period
only once the leopard was sighted between upper Manalar and 29th
estate jeepable road. However,
in several places indirect signs scat and pugmarks were recorded. We had direct sighting of a pack
of dholes and also once the pack was captured by camera traps. Thrice bear was sighted near
Vellimalai.
31
Spotlighting survey/ Nocturnal survey
During the night survey, sambar was the most frequently sighted (n=51, 28.81%), which was
followed by slender loris (n=32, 18.08%), gaur (n=16, 9.04%), spotted deer (n=16, 9.04%), black-
napped hare (n=15, 8.47%), mouse deer (n=13, 7.34%), barking deer (n=12, 6.78%) rusty-spotted
cat (n=8, 4.52%) common palm civet (n=4, 2.26%), brown palm civet (n=3, 1.69%), Indian wild
boar (n=3, 1.69%), small Indian civet (n=2,1.13%), pangolin (1, 0.56%) and porcupine (1, 0.56%).
Figure 3.7 Mean encounter rate of Primates in Highwavy in various elevation category
32
Bonnet macaque Lion-tailed macaque
Tufted grey langur Nilgiri langur
Figure 3.8 Mean encounter rate of Primates in various forest types of Highwavy
Bonnet Lion-tailed macaque
33
Tufted grey langur Nilgiri langur
Figure 3.9 Mean encounter rate of primates in various disturbance in Highwavy
Discussion
High undulating terrain of Highwavy environs varied from 300 m asl to 1800 m asl, accordingly
the forest types also highly varied depending on the rainfall. On eastern slope, the rain shadow
areas with less rainfall at foot hill has got a dry scrub forests, on the mid elevation with relatively
high rainfall has got the dry deciduous forests with many riparian forests, which gradually
transforms in to moist deciduous forests towards further up, at the ridge with high rain fall has got
the evergreen forests with many rocky outcrop and shola in between with rolling grass. These high
elevation evergreen forests were exploited for many commercial plantations like coffee, tea,
cardamom, pepper and clove. This variation in the altitude and such array of forest types resulted
in high species richness, however, due to various anthropogenic activities over the period resulted
in very low density of larger body size animals at south of Nilgiri Biosphere, which include
Highwavy environs, except the large tract of contiguous protected forests like Anamalai,
Parambikulam and Periyar Tiger Reserves.
Although, a total of 599 individuals belongs to 20 species was recorded but at the specie level the
relative abundance was very poor. Among all the mammals, only two of species Nilgiri langur and
Indian giant squirrel statistically showed significant variation in their relative abundance across
34
elevation and forest types. One of the reasons can be preference of these animals for certain
elevation and forest types.
Grizzled giant squirrel was record with poor encounter rate, and also highly restricted to riparian
forests at low elevation dry deciduous and scrub forests. The species is also known to inhabit
riparian forests throughout its distribution range (Joshua & Johnsingh, 1994). Even in the
Highwavy environs also the species occupy similar habitat. Where, the Indian giant squirrel was
encountered from all the elevation gradients and forest types, which indicate that the species is
relatively generalist species than the grizzled giant squirrel.
Sambar and gaur were adapted to graze and browse, where the chital and southern red muntjac are
typical grazers. The availability and the distribution of browse and grass in the forest ecosystem
determines the habitat preferred by these species. Chital encounter rate was more in dry forests
with open wooded forests interspersed with grass, where other species since they adopted for
browse and graze, those animals were encountered in various forest types. However, encounter
rate of sambar was higher in dry forests compared to evergreen forests, where the encounter rate
of gaur increased from dry forests to evergreen forests. Elephants are known to survive in wide
variety of habitat starting from scrub to high elevation (Sukumar & Ramesh, 1995). Although
indirect evidences were found in all the elevation category and forest types. Highest encounter rate
was in medium elevation and at savanna forests. Since elephants show seasonal movement in
these hills, it is difficult to ascertain the proper reason for the variation in their abundance.
Primate’s being an arboreal mammal; require good canopy contiguity, however, species like
bonnet macaque has adopted to live in scrub forests of plains and human dominated landscapes to
high altitude evergreen forests (Kumara et al. 2010). Lion-tailed macaque is confined to medium
to high elevation evergreen forests and the encounter rate was very low. The probable reason for
the poor encounter rate may be due to restricted distribution, low population and confined to
private estates, however, Highwavy environs hold sizable population of ~ 250 animals (Kumara et
al. 2011). Nilgiri langur was encountered in medium to high elevations with evergreen, savanna
and dry deciduous forests; however the encounter rates decreased from evergreen to dry
deciduous. Compare to lion-tailed macaque, the Nilgiri langur is known to inhabit evergreen to
35
moist deciduous forests in its range of distribution, however, within moist deciduous forests they
inhabit relatively moist patches like riverine habitat or Valleys. Tufted grey langur replaces Nilgiri
langur by distributing in lower to medium hills yet confined to dry deciduous and scrub forests.
Rarity or no sightings of carnivores during the study is not surprising in Highwavy environs,
Hutton (1949) also stated that tiger is a visitor to the area and only during dry seasons, but
leopards were reported as residents to the hills. However, our sightings of leopard, dholes and bear
show their persistence in the hills. Sightings of slender loris (32) and rusty spotted cat (8) show the
presence of good populations of these animals in the hills. Sightings of brown palm civets at
higher elevation forests show their persistence in the hills.
References
Chandran, M.D.S. (1997). On the ecological history of the Western Ghats. Current Science 73:
146-155.
Cincotta R.P., J. Wisnewski & R. Engelman (2000). Human population in the biodiversity
hotspots. Nature 404: 990–992.
Joshua, J & A.J.T. Johnsingh (1994). Impact of biotic disturbances on the habitat and population
of the endangered grizzled giant squirrel Ratufa macroura in south India. Biological
Conservation 68: 29-34
Hutton, A.F. (1949). Notes on the snakes and mammals of the Highwavy Mountains, Madurai
District, South India. Part II: Mammals. Journal of the Bombay Natural History Society
48(4): 681-694.
Kumara, H.N., S.Kumar and M.Singh (2010). Of how much concern are the least concern species?
Distribution and conservation status of bonnet macaques, rhesus macaques and Hanuman
langurs in Karnataka, India. Primates 51: 37-42.
Kumara H.N., M.K.Saptagirish & M. Murugesan (2011). Assessment of occurrence of large
mammals, birds and woody plants in Bannerghatta National Park, Karnataka. Technical
report submitted to Karnataka Forest Department, Bannerghatta National Park, Bengaluru,
Karnataka, India.
Kumara, H.N., S.Rathnakumar, R.Sasi & M.Singh (2012). Conservation status of wild animals in
Biligir Rangaswamy Temple Wildlife Sanctuary, the Western Ghats, India. Current Science
103: 933-940.
Madhusudan M. D. & K.U. Karanth (2002). Local Hunting and the Conservation of Large
Mammals in India. Ambio 31(1): 49-54.
Myers, N., RA.Mittermeier, C.G. Mittermeier, C.A.B. da Fonseca & J. Kent (2000). Biodiversity
hotspots for conservation priorities. Nature 403: 853-858.
36
Chapter IV
Occupancy estimation for large mammals
Introduction
Around 25% of mammal species are experiencing extirpation and extinction globally (Ceabllos &
Ehrlich, 2002). Large mammals are particularly prone to extinction due to their greater body mass
and associated life history traits. A recent evaluation highlights that mammals with body mass
above 3 kg are more prone to extinction risk (Cardillo et al. 2004). The large body mass makes
them more vulnerable/susceptible to wide range of anthropogenic threats (Madhusudan & Mishra
2003). Differential hunting practices, habitat loss, fragmentation and degradation have been
affected the distribution and habitat use of large mammal in the tropics (Achard et al. 2002). In
this context, it is necessary to assess the status (Schipper et al. 2008) and habitat-species
interaction of large mammals live in human dominated landscape.
Distribution and habitat use of mammals is largely driven by a range of factors to suit their
biological requirements (Seidensticker 1976, Wrangham & Rubenstein 1986). Current distribution
patterns of these threatened mammals are largely unknown and the conservation efforts were
hampered by lack of data on species-habitat relationships (Krishna et al. 2008). Occurrence can
be modeled as a function of measured habitat covariates, allowing for testing of hypotheses on
species–habitat relationships (MacKenzie et al. 2002).
Monitoring programmes are being used increasingly to assess spatial and temporal trends of
biological diversity, with an emphasis on evaluating the efficiency of management policies
(Yoccoz et al. 2001). However, the accurate population abundance estimation requires
considerable amount of effort and resources. The alternate system state variables that are gathered
without much effort and time will be useful to monitor status of the species. Occupancy rate can
be used as a state variable using presence/absence surveys across several sampling sites
(MacKenzie et al. 2002). Occupancy, defined as the proportion of sites occupied by a species, is a
state variable commonly used in ecology for the modeling of habitat relationships, metapopulation
studies and wildlife monitoring programs. The issue of imperfect detection in the context of
occupancy studies has received much attention in recent years (MacKenzie et al. 2002; Guillera-
Arroita et al 2010).
37
In this context, occupancy rate of mammals in Highwavy environs was developed to address
habitat –species interaction and to identify species rich zones for prioritizing conservation area.
Methods
Sampling design
Base map of the study area was digitized using Survey of India (SOI) topographic sheets and
Government orders for Theni Forest Division and Megamalai Wildlife Sanctuary. The study area
window was used for generating 4 sq. km spatial grids and the same was over laid on the base map
to identify individual sampling units (grids). All the full grids were alone selected for sampling
and the incomplete grids were not considered for sampling. In addition, few in accessible grids
were left un-sampled. Large mammals were surveyed in 133 grids that covered 532 sq. km. In all
the selected grids, systematic grid walk was carried out with every 100 m as segment and every
500 m as spatial replicate. A minimum of five spatial replicates were sampled and thus 20
segments.
The selection of grid size (sampling unit) and spatial replicate should also corroborate with the
home range size of focal animal. Our focal animal’s (large mammals) body size is ranging from
few kilograms (Indian chevrotain) to tonnes (elephants) and the home range size of most of the
mammals in the Western Ghats has not been properly documented. Hence, we selected a flexible
window for both grid size and length of spatial replicate. In this way we selected 4 sq. km as
spatial unit and with respect to the size of the animal the grid size can be increased by merging
four grids together i.e. 16 km. Similarly, the replicate size can be modified according to the size
of the animal.
In this background, within each segment (100 m length), all tracks and signs (pellets, feeding
signs, scratch marks, kill etc.) were recorded along with site (that influence the distribution of
species) and sampling covariates (that influence the detectability of species or its sign). The
presence and absence of direct and indirect evidences of large mammals were recorded in each
spatial replicate.
38
Sampling covariates
The soil characteristics such as texture (loamy, sandy, lateritic) and nature (wet and dry) were
recorded for each detection of tracks/pugmarks and in each 100 m segments, the percent of
composition of these soil characteristics were qualitatively assessed to understand the availability
pattern. However, due to inadequate sampling we could not really use the data as such. Other than
these, understory characteristics such as shrub height, shrub cover, grass height, grass cover, litter
cover and invasive weed’s height and cover were also quantified systematically (details provided
in methodology section).
Site covariates
Tree and understory structural characteristics of each segment were assessed using point-centred
quarter method of Dumbois & Ellenberg (1974).
Point-Centred quarter method
Point-Centred Quarter method (PCQ) is the most commonly used distance sampling method for
the estimation of plant communities, in particular the forest plant communities. In each segment,
minimum of one sampling point was taken and within each sampling point four quarters were
marked. Within each quarter, nearest tree with more than 20 cm GBH was selected and the
distance from the sampling point was measured. Similarly, distance to nearest trees was estimated
in all four quarters. The measured distances of four trees were used for calculating tree density.
The formulae used to estimate tree density were obtained from various published sources (Mark &
Esler, 1970; Dombois & Ellenberg, 1974; Kevin, 2005). Details of habitat covariates
estimated/derived are presented in table 4.1.

39
Table 4.1 Brief details of habitat covariates used in occupancy estimation of mammals and its
method of quantification
Sl.No. Parameters Method of
measurement
Scale/ Unit of
measurement
1 Tree covariates (Arboreal)
tree density PCQ method Hectares
tree height Visual assessment Meter
GBH Visual assessment Meter
canopy cover Visual assessment Percent
canopy contiguity Visual assessment Percent
2 Understory covariates
(Herbivore)
Visual assessment Percent
under story height Visual assessment Meter
understory cover Visual assessment Percent
grass height Visual assessment Meter
grass cover Visual assessment Percent
weed height Visual assessment Meter
weed cover Visual assessment Percent
3 Spatial variable (Herbivore
& Arboreal)
mean of NDVI Derived from spot-
vegetation
cv of NDVI Derived from spot-
vegetation
Spatial covariates
Field habitat covariates provide data for a small proportion of land mass that may not provide clear
picture for the large mammals hence few remotely sensed data were derived to address broader
scale questions. We have chosen two covariates namely mean Normalized difference in vegetation
index (highly correlating with certain vegetation related parameters) and coefficient of variation in
NDVI (indicates the degree of variation in NDVI which is low for evergreen forests and high for
40
dry forests). Multi season satellite data were used to extract NDVI values and its coefficient of
variations, which is helpful in identifying different forest types.
Threats including live stock grazing, illegal hunting, conflict with wild animals, NTFP collection,
fuel wood, fodder extraction and presence of human settlements in each segment and the grids
were recorded qualitatively.
Data scrutiny
All the continuous habitat and sampling covariates were transformed to meaningful categories by
ensuring equal number of values for each category.
Analysis
History of detection of droppings/signs of mammals contributed to detection histories for each
grid, where ‘1’ indicates detection of the animal, ‘0’ indicates non-detection and ‘-’ indicates a
missing observation. For example, a detection history of ’00-1000000000001’ indicates that the
animal dropping/sign was detected only in the fourth and sixteenth plots whereas the third plot
was not sampled. We constructed detection histories for all grids and the two model parameters;
the probability that a grid is occupied by the species (ψ) and the detection probability (p) were
estimated using likelihood functions (MacKenzie et al. 2002). The program PRESENCE ver. 3.0
was used to derive maximum likelihood estimates of the model parameters.
Model selection, computation of model weights, and averaging of parameters followed the
framework of Burnham & Anderson (2002). We calculated model-averaged parameters using
Akaike weights for proportion of sites used and detection probabilities. To infer the relative
influence of each covariate on occurrence, model weights were summed over all models
containing the particular covariate. Akaike weights are equivalent to Bayesian posterior model
probabilities and indicate the relative support of a model (Burnham & Anderson 2002).
Results

41
A total of 133 grids were sampled for large mammals in the Highwavy environs. The transect
length was ranged from 1.5 to 2.5 km. In this way, a total of 285.6 km were sampled in 532 sq. km
(133 X 4) area. Twenty species of mammals were recorded from the grid walk; indirect evidences
of cats and civets were not identified up to species level but herbivore and large carnivores were
identified up to species level. Direct sighting of large mammals were low compared to indirect
evidences. Maximum of five species of mammals were recorded from a grid.
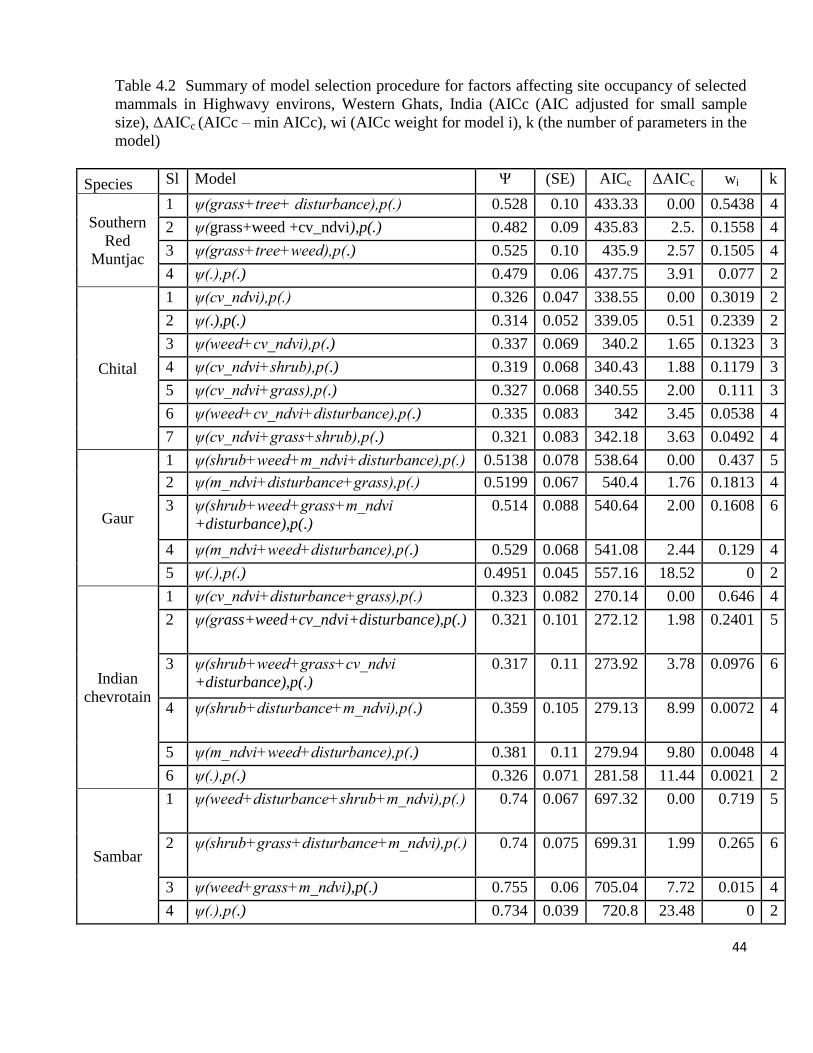
Southern Red Muntjac: The detection probability of the species was 0.29. Of the sampling
covariate, none of the covariates affected the detection probability of indirect evidences of
Southern Red Muntjac. Results of the occupancy model were presented in the table 4.2. The
constant model, ψ (.) p(.), performed poorly as it is evidenced by summary statistics of the models.
The subsequent models were developed with an assumption that the detection probability was not
affected by any sampling covariate. Among the developed occupancy models, the candidate model
indicated that grass coverage and disturbance negatively influenced the distribution however tree
structural characteristics (GBH, Tree Canopy Cover and Tree Height) positively influenced the
distribution of Southern Red Muntjac (Table 4.4). This model is corroborated with the earlier
observations that Southern Red Muntjac prefers dense forests with intermediate openings. The
average occupancy estimate corresponds to a difference of 46% from the naive estimate of
occupancy.
Chital: The average occupancy and detection probability of the species were 0.326 (SE = 0.052)
and 0.31 respectively (Table 4.2). This occupancy estimate is 31% higher than the naive estimate
of occupancy. Not much difference in AICc weight was found between candidate model and
constant model (ψ(.),p(.)) so we did model averaging and summed model weights, which indicate
that CV_NDVI supported the distribution of Chital (Table 4.4). The high CV_NDVI indicates that
the habitat is dry forests and Chital prefers such habitat.
Sambar: The average occupancy and detection probability of sambar was comparatively higher
than other herbivore (ψ= 0.7218, p=0.635). The occupancy estimate is 2.77% higher than the
naive estimate (Table 4.2). The results of summed model weight indicate that the weed coverage
42
and M_NDVI positively influenced but shrub cover and disturbance negatively influenced sambar
(Table 4.4).
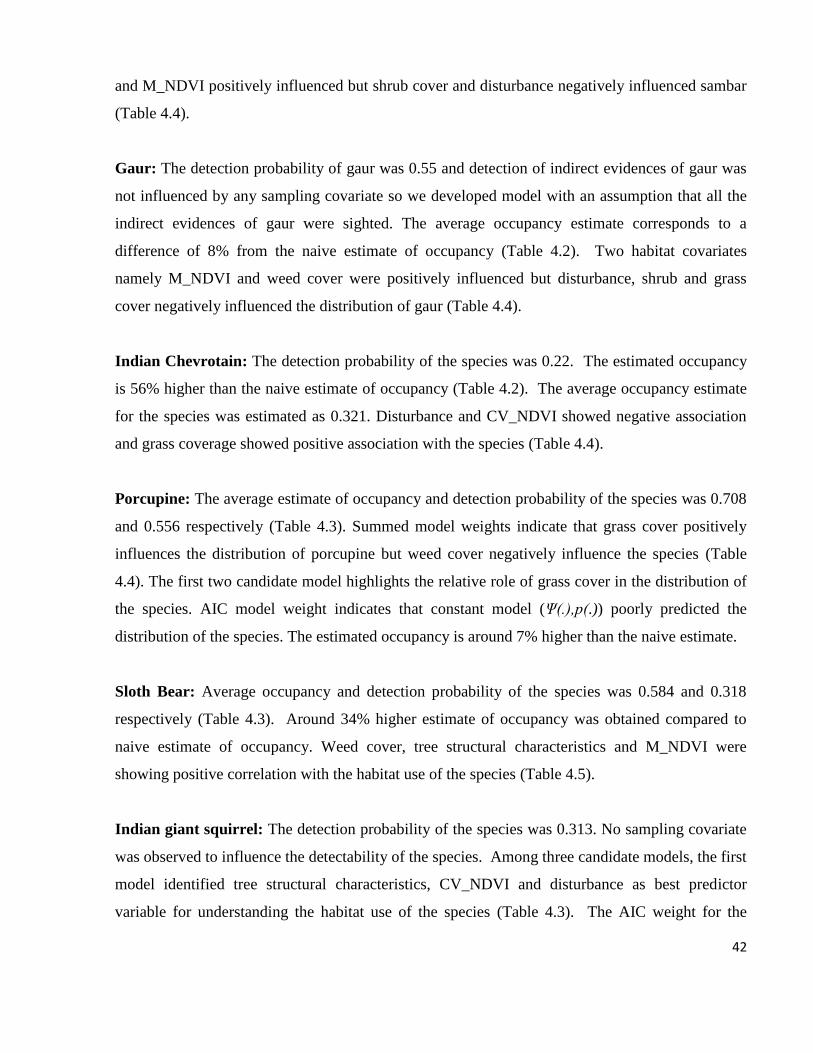
Gaur: The detection probability of gaur was 0.55 and detection of indirect evidences of gaur was
not influenced by any sampling covariate so we developed model with an assumption that all the
indirect evidences of gaur were sighted. The average occupancy estimate corresponds to a
difference of 8% from the naive estimate of occupancy (Table 4.2). Two habitat covariates
namely M_NDVI and weed cover were positively influenced but disturbance, shrub and grass
cover negatively influenced the distribution of gaur (Table 4.4).
Indian Chevrotain: The detection probability of the species was 0.22. The estimated occupancy
is 56% higher than the naive estimate of occupancy (Table 4.2). The average occupancy estimate
for the species was estimated as 0.321. Disturbance and CV_NDVI showed negative association
and grass coverage showed positive association with the species (Table 4.4).
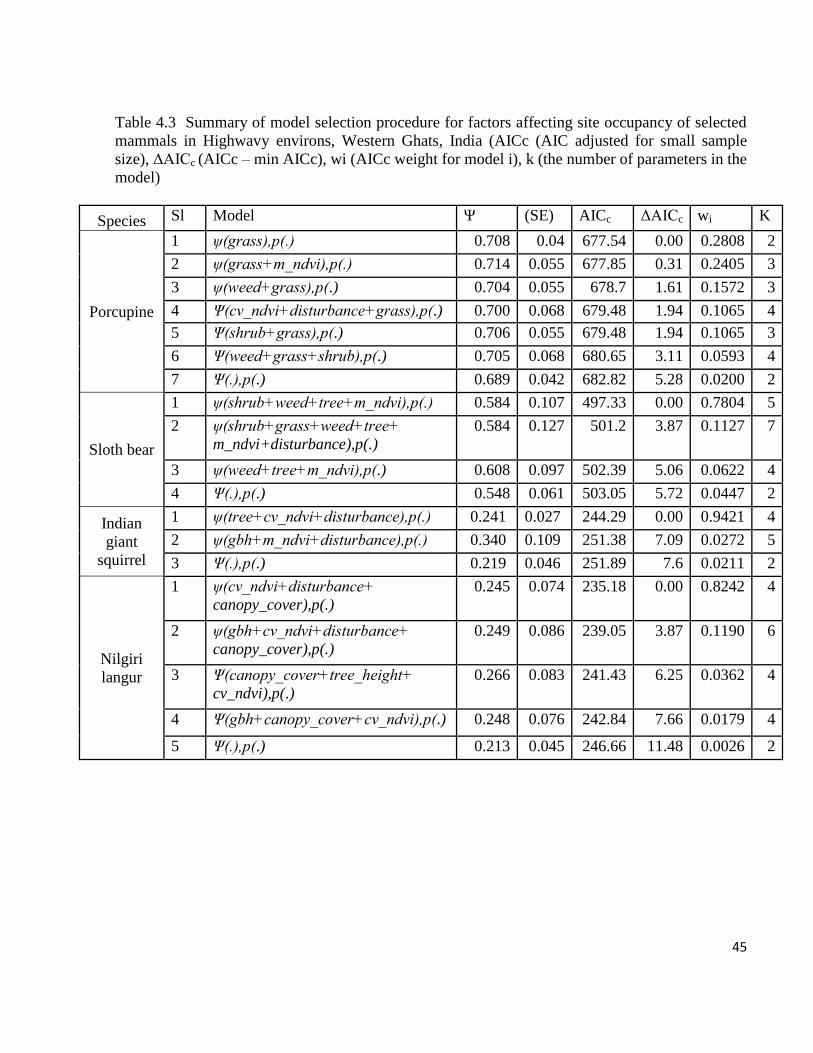
Porcupine: The average estimate of occupancy and detection probability of the species was 0.708
and 0.556 respectively (Table 4.3). Summed model weights indicate that grass cover positively
influences the distribution of porcupine but weed cover negatively influence the species (Table
4.4). The first two candidate model highlights the relative role of grass cover in the distribution of
the species. AIC model weight indicates that constant model (Ψ(.),p(.)) poorly predicted the
distribution of the species. The estimated occupancy is around 7% higher than the naive estimate.
Sloth Bear: Average occupancy and detection probability of the species was 0.584 and 0.318
respectively (Table 4.3). Around 34% higher estimate of occupancy was obtained compared to
naive estimate of occupancy. Weed cover, tree structural characteristics and M_NDVI were
showing positive correlation with the habitat use of the species (Table 4.5).
Indian giant squirrel: The detection probability of the species was 0.313. No sampling covariate
was observed to influence the detectability of the species. Among three candidate models, the first
model identified tree structural characteristics, CV_NDVI and disturbance as best predictor
variable for understanding the habitat use of the species (Table 4.3). The AIC weight for the

43
candidate model was very high compared to other models, which is also evidenced in summed
model weights (Table 4.5). The estimated average occupancy is around 40% higher than the naive
estimate.
Nilgiri langur: The detection probability of the species was 0.301. Among the five models,
constant model had poorly predicted the habitat use of Nilgiri Langur which is evidenced by low
AIC values (Table 4.3). Summed model weights indicate that CV_NDVI and disturbance showed
negative association with habitat use however canopy cover showed strong positive association
with the species (Table 4.5). The average occupancy estimate is 48% higher than the naive
estimate. The grid wise estimated occupancy of each mammal species is presented in Figure 4.1 to
4.9.
44
Table 4.2 Summary of model selection procedure for factors affecting site occupancy of selected
mammals in Highwavy environs, Western Ghats, India (AICc (AIC adjusted for small sample
size), ΔAICc (AICc – min AICc), wi (AICc weight for model i), k (the number of parameters in the
model)
Species Sl Model Ψ (SE) AICc ΔAICc wi k
Southern
Red
Muntjac
1 ψ(grass+tree+ disturbance),p(.) 0.528 0.10 433.33 0.00 0.5438 4
2 ψ(grass+weed +cv_ndvi),p(.) 0.482 0.09 435.83 2.5. 0.1558 4
3 ψ(grass+tree+weed),p(.) 0.525 0.10 435.9 2.57 0.1505 4
4 ψ(.),p(.) 0.479 0.06 437.75 3.91 0.077 2
Chital
1 ψ(cv_ndvi),p(.) 0.326 0.047 338.55 0.00 0.3019 2
2 ψ(.),p(.) 0.314 0.052 339.05 0.51 0.2339 2
3 ψ(weed+cv_ndvi),p(.) 0.337 0.069 340.2 1.65 0.1323 3
4 ψ(cv_ndvi+shrub),p(.) 0.319 0.068 340.43 1.88 0.1179 3
5 ψ(cv_ndvi+grass),p(.) 0.327 0.068 340.55 2.00 0.111 3
6 ψ(weed+cv_ndvi+disturbance),p(.) 0.335 0.083 342 3.45 0.0538 4
7 ψ(cv_ndvi+grass+shrub),p(.) 0.321 0.083 342.18 3.63 0.0492 4
Gaur
1 ψ(shrub+weed+m_ndvi+disturbance),p(.) 0.5138 0.078 538.64 0.00 0.437 5
2 ψ(m_ndvi+disturbance+grass),p(.) 0.5199 0.067 540.4 1.76 0.1813 4
3 ψ(shrub+weed+grass+m_ndvi
+disturbance),p(.)
0.514 0.088 540.64 2.00 0.1608 6
4 ψ(m_ndvi+weed+disturbance),p(.) 0.529 0.068 541.08 2.44 0.129 4
5 ψ(.),p(.) 0.4951 0.045 557.16 18.52 0 2
Indian
chevrotain
1 ψ(cv_ndvi+disturbance+grass),p(.) 0.323 0.082 270.14 0.00 0.646 4
2 ψ(grass+weed+cv_ndvi+disturbance),p(.) 0.321 0.101 272.12 1.98 0.2401 5
3 ψ(shrub+weed+grass+cv_ndvi
+disturbance),p(.)
0.317 0.11 273.92 3.78 0.0976 6
4 ψ(shrub+disturbance+m_ndvi),p(.) 0.359 0.105 279.13 8.99 0.0072 4
5 ψ(m_ndvi+weed+disturbance),p(.) 0.381 0.11 279.94 9.80 0.0048 4
6 ψ(.),p(.) 0.326 0.071 281.58 11.44 0.0021 2
Sambar
1 ψ(weed+disturbance+shrub+m_ndvi),p(.) 0.74 0.067 697.32 0.00 0.719 5
2 ψ(shrub+grass+disturbance+m_ndvi),p(.) 0.74 0.075 699.31 1.99 0.265 6
3 ψ(weed+grass+m_ndvi),p(.) 0.755 0.06 705.04 7.72 0.015 4
4 ψ(.),p(.) 0.734 0.039 720.8 23.48 0 2
45
Table 4.3 Summary of model selection procedure for factors affecting site occupancy of selected
mammals in Highwavy environs, Western Ghats, India (AICc (AIC adjusted for small sample
size), ΔAICc (AICc – min AICc), wi (AICc weight for model i), k (the number of parameters in the
model)
Species Sl Model Ψ (SE) AICc ΔAICc wi K
Porcupine
1 ψ(grass),p(.) 0.708 0.04 677.54 0.00 0.2808 2
2 ψ(grass+m_ndvi),p(.) 0.714 0.055 677.85 0.31 0.2405 3
3 ψ(weed+grass),p(.) 0.704 0.055 678.7 1.61 0.1572 3
4 Ψ(cv_ndvi+disturbance+grass),p(.) 0.700 0.068 679.48 1.94 0.1065 4
5 Ψ(shrub+grass),p(.) 0.706 0.055 679.48 1.94 0.1065 3
6 Ψ(weed+grass+shrub),p(.) 0.705 0.068 680.65 3.11 0.0593 4
7 Ψ(.),p(.) 0.689 0.042 682.82 5.28 0.0200 2
Sloth bear
1 ψ(shrub+weed+tree+m_ndvi),p(.) 0.584 0.107 497.33 0.00 0.7804 5
2 ψ(shrub+grass+weed+tree+
m_ndvi+disturbance),p(.)
0.584 0.127 501.2 3.87 0.1127 7
3 ψ(weed+tree+m_ndvi),p(.) 0.608 0.097 502.39 5.06 0.0622 4
4 Ψ(.),p(.) 0.548 0.061 503.05 5.72 0.0447 2
Indian
giant
squirrel
1 ψ(tree+cv_ndvi+disturbance),p(.) 0.241 0.027 244.29 0.00 0.9421 4
2 ψ(gbh+m_ndvi+disturbance),p(.) 0.340 0.109 251.38 7.09 0.0272 5
3 Ψ(.),p(.) 0.219 0.046 251.89 7.6 0.0211 2
Nilgiri
langur
1 ψ(cv_ndvi+disturbance+
canopy_cover),p(.)
0.245 0.074 235.18 0.00 0.8242 4
2 ψ(gbh+cv_ndvi+disturbance+
canopy_cover),p(.)
0.249 0.086 239.05 3.87 0.1190 6
3 Ψ(canopy_cover+tree_height+
cv_ndvi),p(.)
0.266 0.083 241.43 6.25 0.0362 4
4 Ψ(gbh+canopy_cover+cv_ndvi),p(.) 0.248 0.076 242.84 7.66 0.0179 4
5 Ψ(.),p(.) 0.213 0.045 246.66 11.48 0.0026 2
46
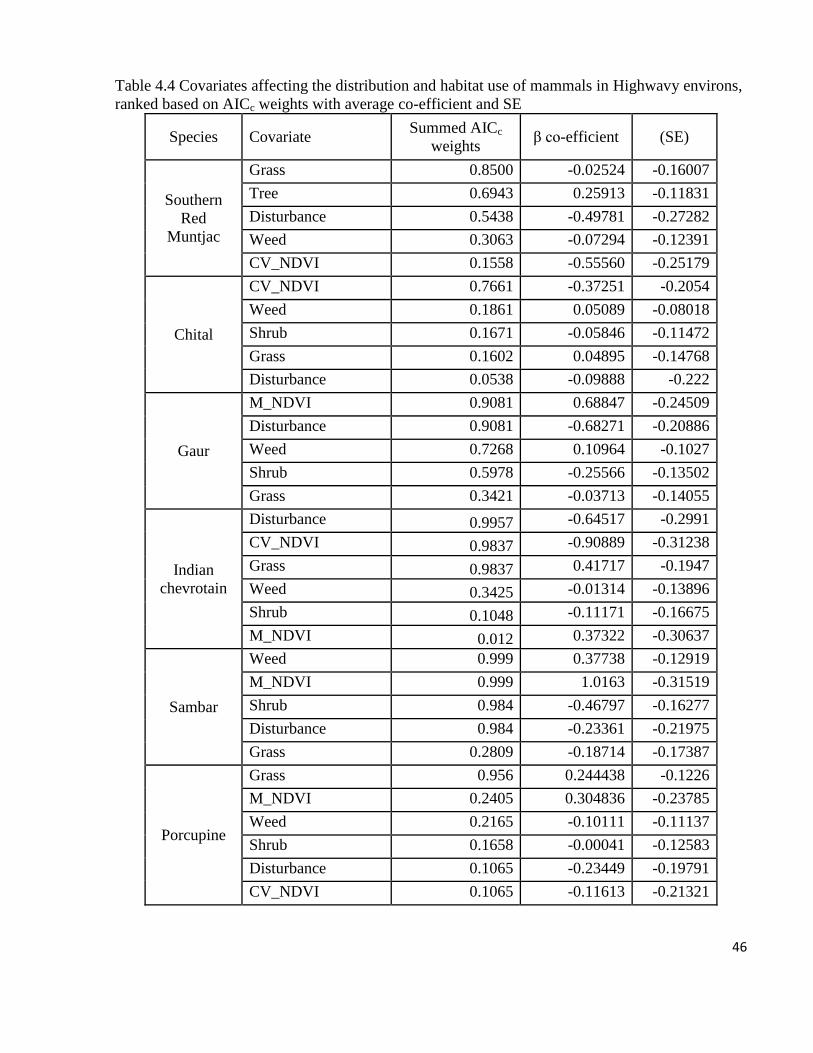
Table 4.4 Covariates affecting the distribution and habitat use of mammals in Highwavy environs,
ranked based on AICc weights with average co-efficient and SE
Species Covariate Summed AICc
weights β co-efficient (SE)
Southern
Red
Muntjac
Grass 0.8500 -0.02524 -0.16007
Tree 0.6943 0.25913 -0.11831
Disturbance 0.5438 -0.49781 -0.27282
Weed 0.3063 -0.07294 -0.12391
CV_NDVI 0.1558 -0.55560 -0.25179
Chital
CV_NDVI 0.7661 -0.37251 -0.2054
Weed 0.1861 0.05089 -0.08018
Shrub 0.1671 -0.05846 -0.11472
Grass 0.1602 0.04895 -0.14768
Disturbance 0.0538 -0.09888 -0.222
Gaur
M_NDVI 0.9081 0.68847 -0.24509
Disturbance 0.9081 -0.68271 -0.20886
Weed 0.7268 0.10964 -0.1027
Shrub 0.5978 -0.25566 -0.13502
Grass 0.3421 -0.03713 -0.14055
Indian
chevrotain
Disturbance 0.9957 -0.64517 -0.2991
CV_NDVI 0.9837 -0.90889 -0.31238
Grass 0.9837 0.41717 -0.1947
Weed 0.3425 -0.01314 -0.13896
Shrub 0.1048 -0.11171 -0.16675
M_NDVI 0.012 0.37322 -0.30637
Sambar
Weed 0.999 0.37738 -0.12919
M_NDVI 0.999 1.0163 -0.31519
Shrub 0.984 -0.46797 -0.16277
Disturbance 0.984 -0.23361 -0.21975
Grass 0.2809 -0.18714 -0.17387
Porcupine
Grass 0.956 0.244438 -0.1226
M_NDVI 0.2405 0.304836 -0.23785
Weed 0.2165 -0.10111 -0.11137
Shrub 0.1658 -0.00041 -0.12583
Disturbance 0.1065 -0.23449 -0.19791
CV_NDVI 0.1065 -0.11613 -0.21321

47
Table 4.5 Covariates affecting the distribution and habitat use of mammals in Highwavy environs,
ranked based on AICc weights with average co-efficient and SE
Species
Covariate Summed AICc
weights
β co-efficient (SE)
Indian giant
squirrel
Disturbance 0.9693 -0.8739 -0.33199
Tree 0.9421 0.175085 -0.08393
CV_NDVI 0.9421 -0.77813 -0.24015
GBH 0.0272 -1.37096 -0.77194
Tree height 0.0272 1.521839 -0.79325
M_NDVI 0.0272 0.037224 -0.42103
Nilgiri langur
CV_NDVI 0.9973 -0.95847 -0.26464
Canopy cover 0.9973 0.34310 -3.37542
GBH 0.1369 -0.02933 -0.44042
Disturbance 0.1190 -0.92344 -0.37790
Tree height 0.0362 0.65751 -0.55961
Sloth bear
Weed 0.9553 0.073934 -0.13062
Tree 0.9553 0.100004 -0.13091
M_NDVI 0.9553 0.528818 -0.3538
Shrub 0.8931 -0.42135 -0.17573
Grass 0.1127 0.073496 -0.20313
Disturbance 0.1127 0.005958 -0.23287
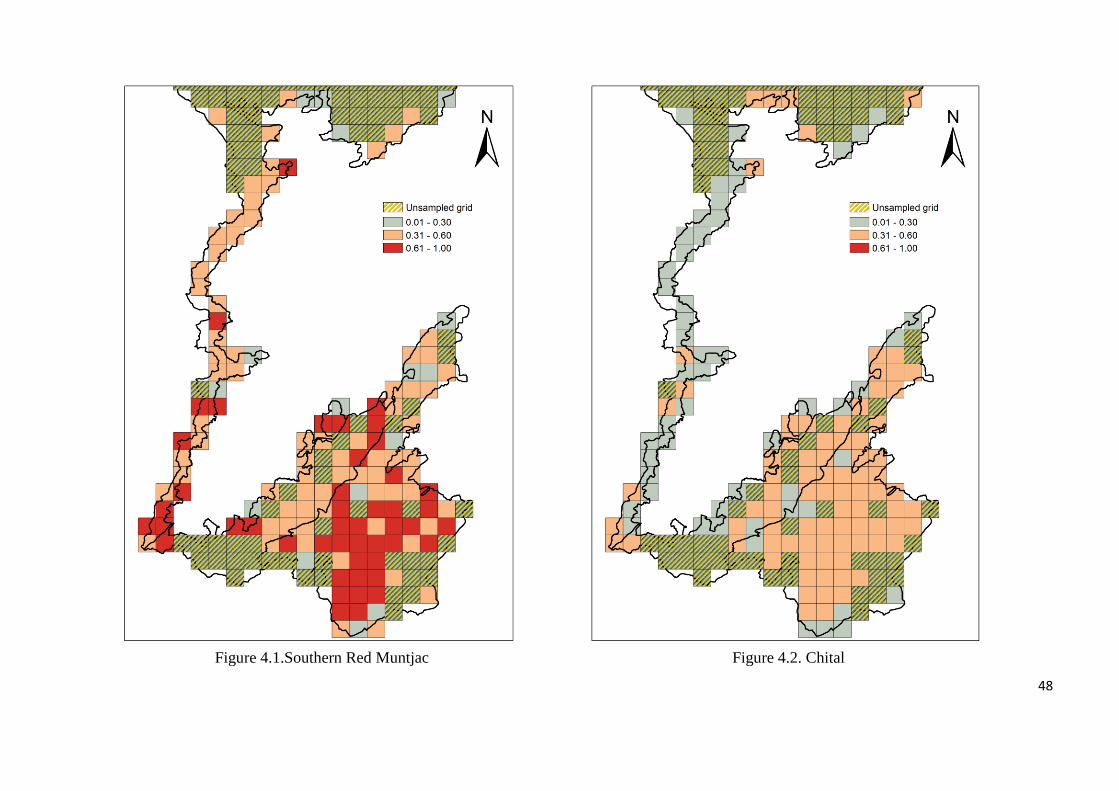
48
Figure 4.1.Southern Red Muntjac Figure 4.2. Chital
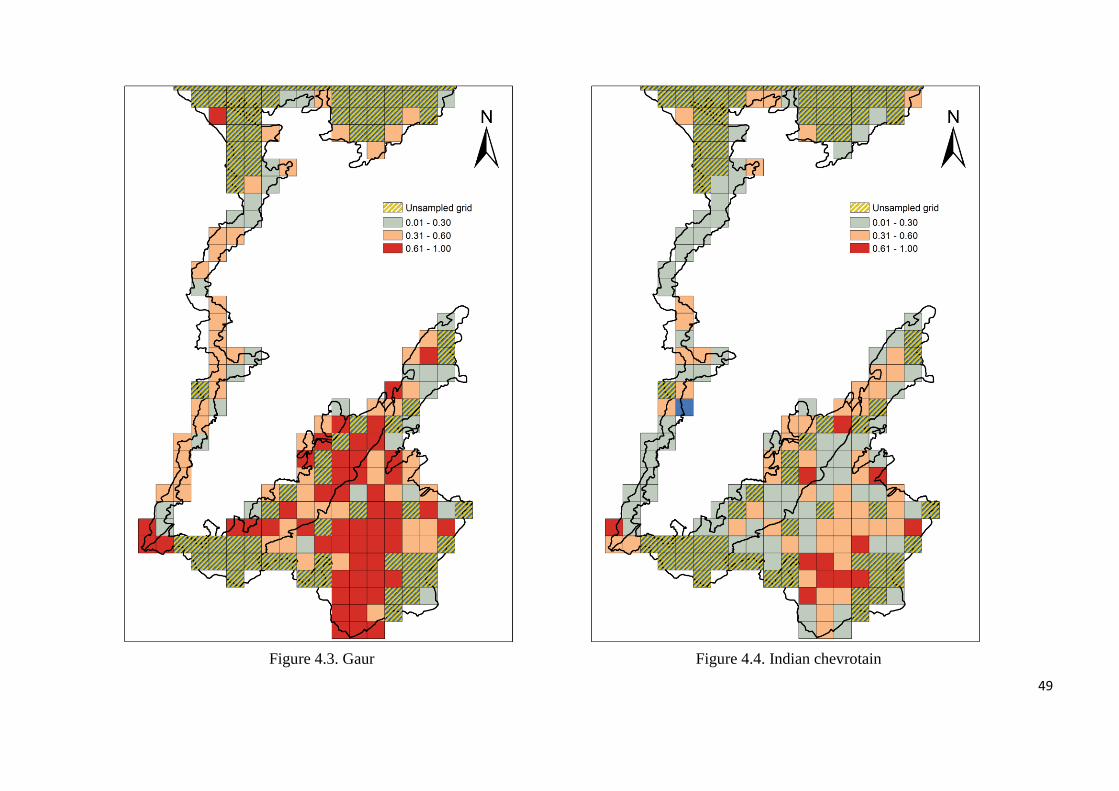
49
Figure 4.3. Gaur Figure 4.4. Indian chevrotain
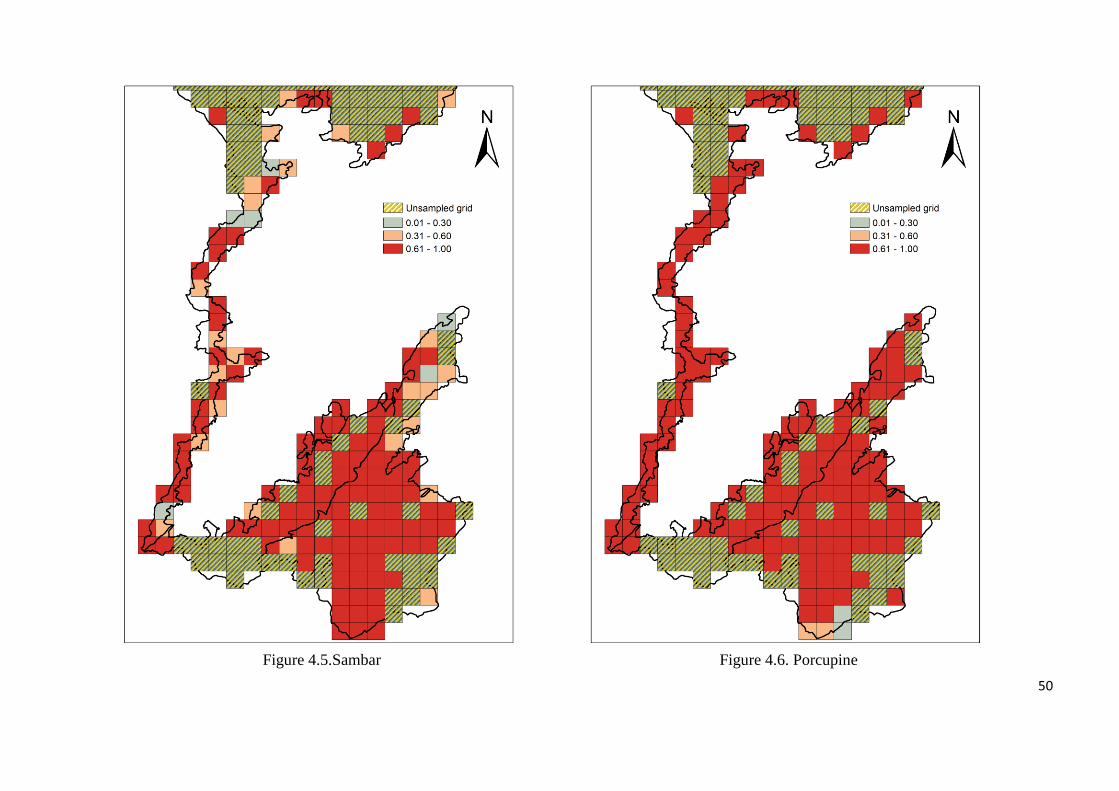
50
Figure 4.5.Sambar Figure 4.6. Porcupine
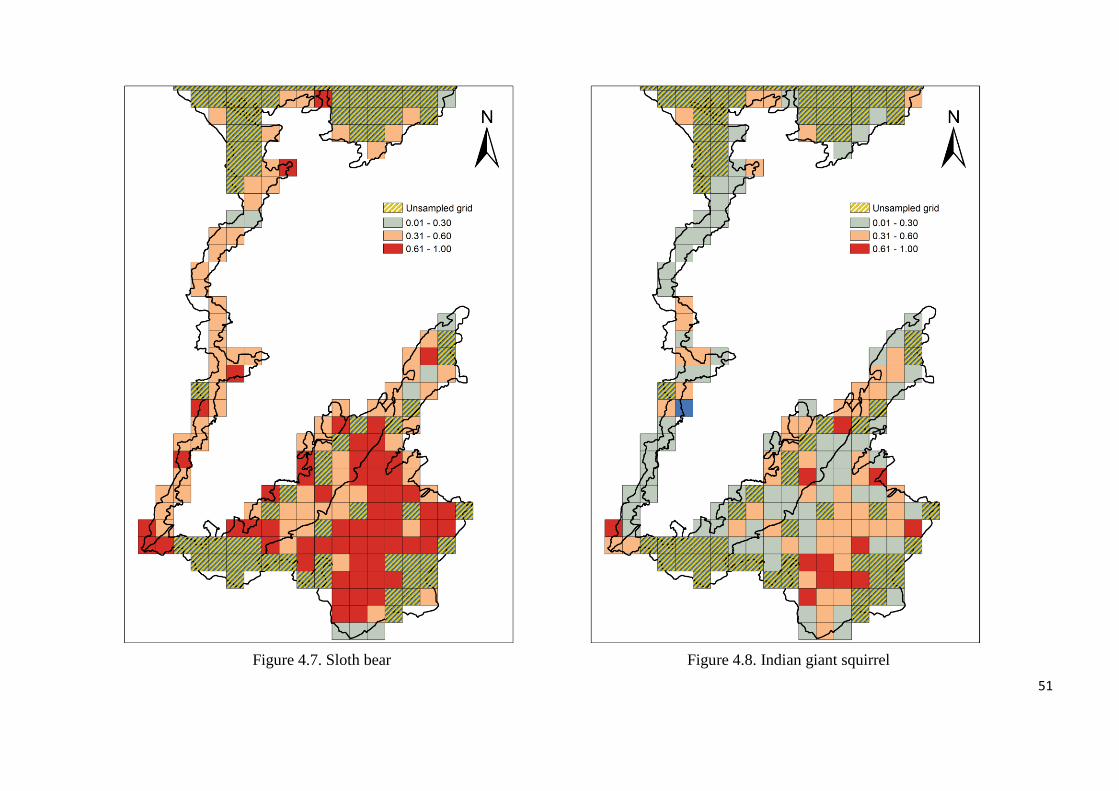
51
Figure 4.7. Sloth bear Figure 4.8. Indian giant squirrel
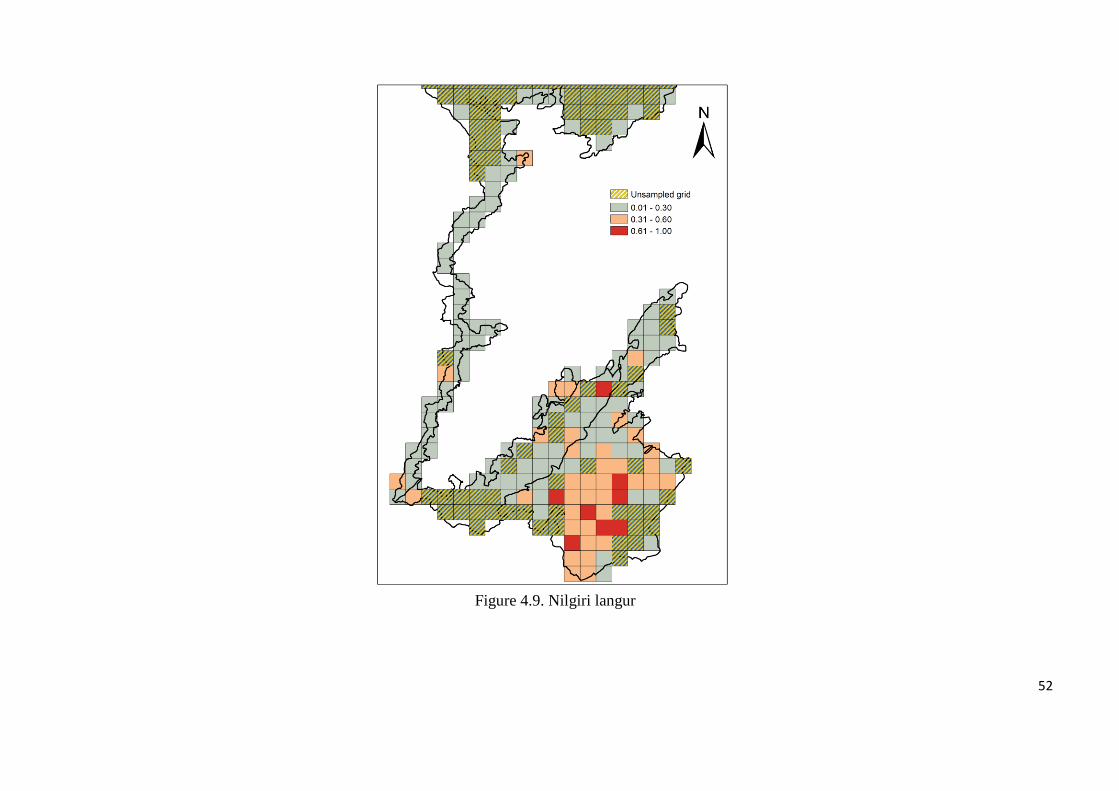
52
Figure 4.9. Nilgiri langur
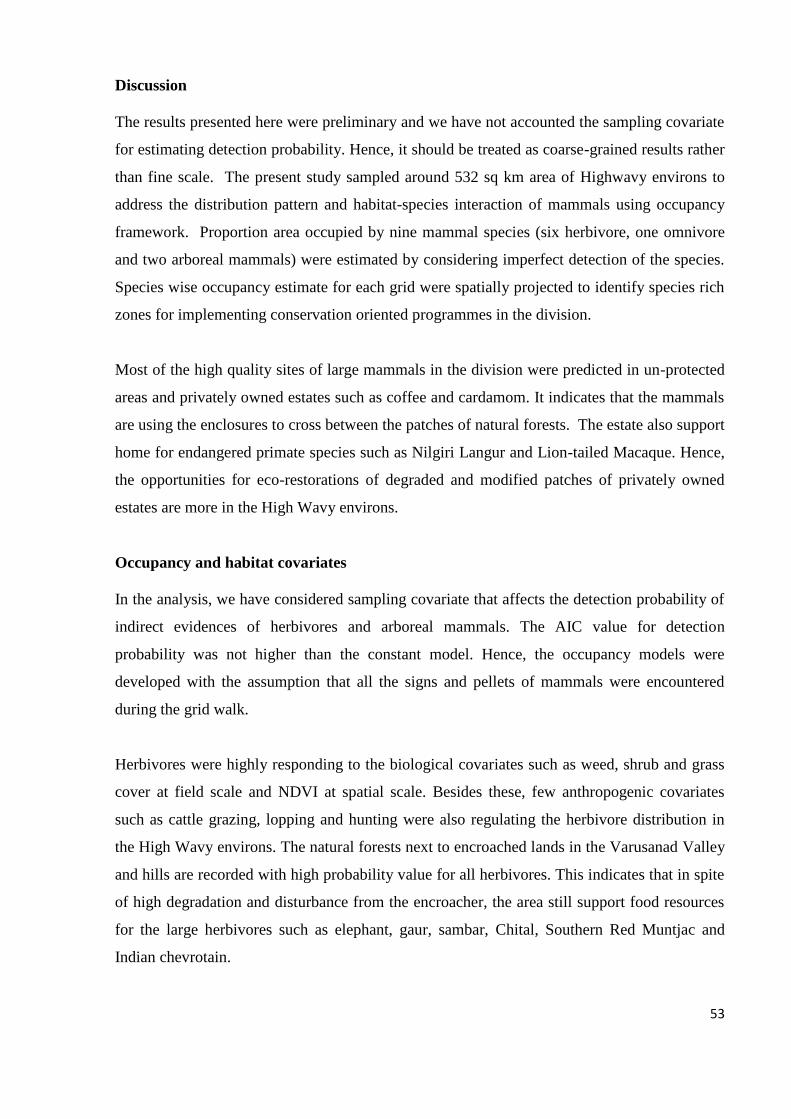
53
Discussion
The results presented here were preliminary and we have not accounted the sampling covariate
for estimating detection probability. Hence, it should be treated as coarse-grained results rather
than fine scale. The present study sampled around 532 sq km area of Highwavy environs to
address the distribution pattern and habitat-species interaction of mammals using occupancy
framework. Proportion area occupied by nine mammal species (six herbivore, one omnivore
and two arboreal mammals) were estimated by considering imperfect detection of the species.
Species wise occupancy estimate for each grid were spatially projected to identify species rich
zones for implementing conservation oriented programmes in the division.
Most of the high quality sites of large mammals in the division were predicted in un-protected
areas and privately owned estates such as coffee and cardamom. It indicates that the mammals
are using the enclosures to cross between the patches of natural forests. The estate also support
home for endangered primate species such as Nilgiri Langur and Lion-tailed Macaque. Hence,
the opportunities for eco-restorations of degraded and modified patches of privately owned
estates are more in the High Wavy environs.
Occupancy and habitat covariates
In the analysis, we have considered sampling covariate that affects the detection probability of
indirect evidences of herbivores and arboreal mammals. The AIC value for detection
probability was not higher than the constant model. Hence, the occupancy models were
developed with the assumption that all the signs and pellets of mammals were encountered
during the grid walk.
Herbivores were highly responding to the biological covariates such as weed, shrub and grass
cover at field scale and NDVI at spatial scale. Besides these, few anthropogenic covariates
such as cattle grazing, lopping and hunting were also regulating the herbivore distribution in
the High Wavy environs. The natural forests next to encroached lands in the Varusanad Valley
and hills are recorded with high probability value for all herbivores. This indicates that in spite
of high degradation and disturbance from the encroacher, the area still support food resources
for the large herbivores such as elephant, gaur, sambar, Chital, Southern Red Muntjac and
Indian chevrotain.
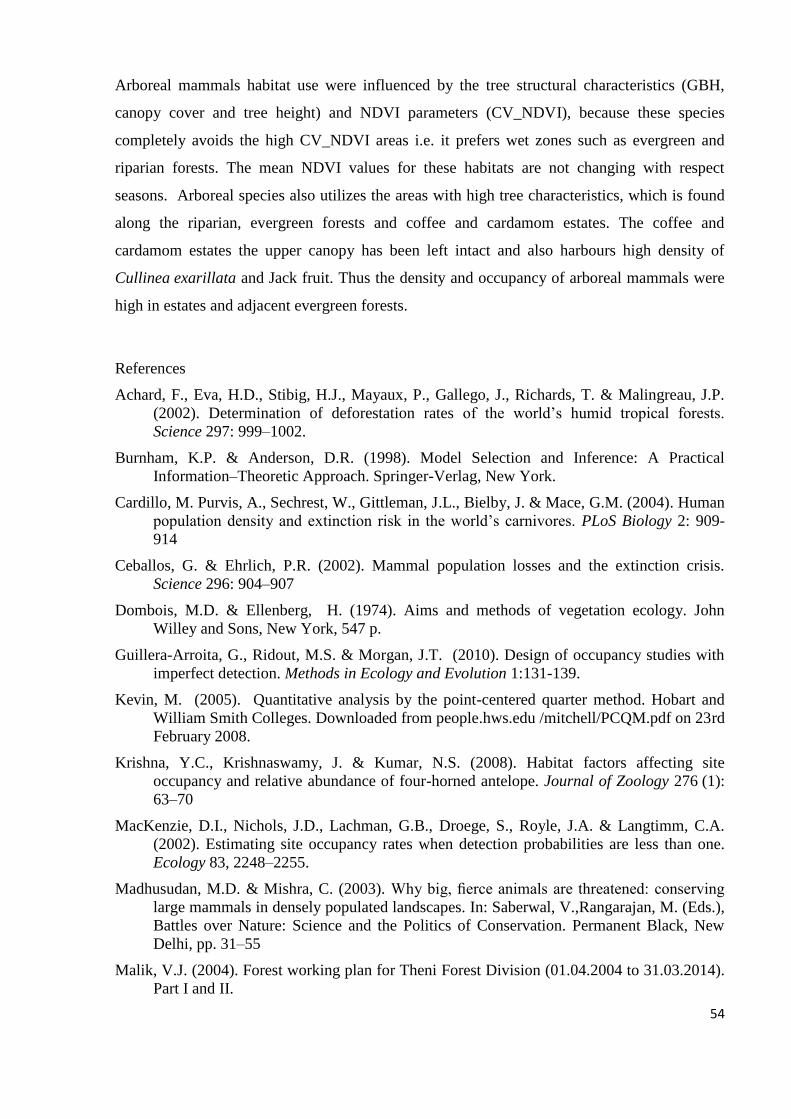
54
Arboreal mammals habitat use were influenced by the tree structural characteristics (GBH,
canopy cover and tree height) and NDVI parameters (CV_NDVI), because these species
completely avoids the high CV_NDVI areas i.e. it prefers wet zones such as evergreen and
riparian forests. The mean NDVI values for these habitats are not changing with respect
seasons. Arboreal species also utilizes the areas with high tree characteristics, which is found
along the riparian, evergreen forests and coffee and cardamom estates. The coffee and
cardamom estates the upper canopy has been left intact and also harbours high density of
Cullinea exarillata and Jack fruit. Thus the density and occupancy of arboreal mammals were
high in estates and adjacent evergreen forests.
References
Achard, F., Eva, H.D., Stibig, H.J., Mayaux, P., Gallego, J., Richards, T. & Malingreau, J.P.
(2002). Determination of deforestation rates of the world’s humid tropical forests.
Science 297: 999–1002.
Burnham, K.P. & Anderson, D.R. (1998). Model Selection and Inference: A Practical
Information–Theoretic Approach. Springer-Verlag, New York.
Cardillo, M. Purvis, A., Sechrest, W., Gittleman, J.L., Bielby, J. & Mace, G.M. (2004). Human
population density and extinction risk in the world’s carnivores. PLoS Biology 2: 909-
914
Ceballos, G. & Ehrlich, P.R. (2002). Mammal population losses and the extinction crisis.
Science 296: 904–907
Dombois, M.D. & Ellenberg, H. (1974). Aims and methods of vegetation ecology. John
Willey and Sons, New York, 547 p.
Guillera-Arroita, G., Ridout, M.S. & Morgan, J.T. (2010). Design of occupancy studies with
imperfect detection. Methods in Ecology and Evolution 1:131-139.
Kevin, M. (2005). Quantitative analysis by the point-centered quarter method. Hobart and
William Smith Colleges. Downloaded from people.hws.edu /mitchell/PCQM.pdf on 23rd
February 2008.
Krishna, Y.C., Krishnaswamy, J. & Kumar, N.S. (2008). Habitat factors affecting site
occupancy and relative abundance of four-horned antelope. Journal of Zoology 276 (1):
63–70
MacKenzie, D.I., Nichols, J.D., Lachman, G.B., Droege, S., Royle, J.A. & Langtimm, C.A.
(2002). Estimating site occupancy rates when detection probabilities are less than one.
Ecology 83, 2248–2255.
Madhusudan, M.D. & Mishra, C. (2003). Why big, fierce animals are threatened: conserving
large mammals in densely populated landscapes. In: Saberwal, V.,Rangarajan, M. (Eds.),
Battles over Nature: Science and the Politics of Conservation. Permanent Black, New
Delhi, pp. 31–55
Malik, V.J. (2004). Forest working plan for Theni Forest Division (01.04.2004 to 31.03.2014).
Part I and II.
55
Mark, F. & Esler, A. E. (1970). An assessment of the point-centred quarter method of plot less
sampling in some New Zealand forests. Proceedings of the New Zealand Ecological
Society 17: 106-110.
Schipper, J. et al., (2008). The status of the world’s land and marine mammals: diversity, threat
and knowledge. Science 322: 225–230.
Seidensticker, J. (1976). On the ecological separation between tigers and leopards. Biotropica
8: 225–234.
Wrangham, R.W. & Rubenstein, D.I. (1986). Social evolution in birds and mammals. Pages
452–470 in D.I.Rubenstein and R.W. Wrangham, editors. Ecological aspects of social
evolution. Princeton University Press, Princeton, New Jersey, USA.
Yoccoz, N.G., J.D. Nichols, & Boulinier, T. (2001). Monitoring of biological diversity in space
and time. Trends in Ecology and Evolution 16(8): 446-453.
56
Chapter V
Conservation of Mammals in Highwavy environs
Introduction
Declining biodiversity is a major environmental problem everywhere on the Earth, including
developed countries (Hanski, 2004). Worldwide, national parks and reserves increasingly serve
as critical refuges for native species and ecosystems, often harbouring the last vestiges of
natural environments (Baron, 2004).
Generally long-term wildlife monitoring programs are listed as a fundamental component of
Protected Area (PA) management (Dominik et al. 2011). As quoted by Redford (1992)
“satellites passing overhead may reassuringly register them as forest, they are empty of much
of the faunal richness valued by humans”. Conserving lower taxa (for example ant) is equally
important as conserving higher taxa (e.g. Elephant). Also conserving prey species ultimately
will conserve the predators. Many large animals ecologically gone extinct one such example is
Cheetah, once it was wide spread in India. As quoted by Janzen (1988) forests full of trees fool
us into believing that all is well however, "living dead". Once a Protected Area officially
gazetted, monitoring programs are essential to evaluate whether or not the protection of
Wildlife has improved (Nichols & Williams, 2006).
India has rich traditions of nature conservation as well as a vigorous official program of
protection of nature reserves developed over the last 40 years (Gadgil, 1992). In India, Western
Ghats is a one area that has been particularly affected by human population growth and hunting
(Kumara & Singh, 2004; Madhusudan & Karanth, 2002). Mammals are in the apex of
vertebrate group, requires more protection than any other taxa. Large herbivores are
particularly difficult to conserve in this context, because of their relatively low densities,
unique habitat requirements, crop raiding tendencies, and their consumption by local people
(Karanth & Sunquist 1992). Researchers from various parts of the world listed out many
causes for the decline of wildlife ranging from lower taxa to higher taxa. However, hunting by
local communities is among the most general threats to Indian wildlife, yet, the understanding
of its nature, extent, and its impacts on wildlife has been poor (Madhusudan & Karanth, 2002).
In the present chapter the conservation issues of mammals in Highwavy are discussed.
57
Major management issues at the Highwavy environs:
Based on the results obtained from the present study, the following suggestions are
recommended for the conservation of Highwavy environs.
(1) Upper manalar-Vellimalai-Ammagajam contiguity
Long back, large tract natural forest was given on lease to different companies for a fixed
period. Those forests were converted as commercial plantations such as tea, coffee and
cardamom; the estates include Vellimalai, Ammagajam, Jyothi, Highwavy, Megamalai,
Venniyar, Manalar, Eravangalar, Kardana etc. These estates are interspersed with rain forests,
which harbour high diversity of animals including large mammals.
1. The above mentioned area hold good regional population of certain key species of
mammals viz., Lion-tailed macaque, Nilgiri langur, gaur, tiger, leopard, dhole, Nilgiri
tahr, Nilgiri marten and other south Indian ungulates.
2. Around 266 individuals of Lion-tailed macaque (Kumara et al. 2011) and 100
individuals of Nilgiri tahr (Davidar, 1978) were also recorded from this tract of forests.
3. The area also experience severe interruption of locals for cattle grazing, which increases
the chance of spreading diseases from cattle to wild ungulates. Furthermore, the area is
located next to Periyar Tiger Reserve and transmitting diseases from cattle to wild
ungulates become a serious issue for the prey base of Tiger in the landscape.
4. By increasing protection in the above landscape would also reduces the hunters entering
into Periyar tiger reserve through above mentioned landscape and that would facilitate
the tiger to occupy these areas in near future, although there were few sporadic records.
5. This patch is contiguous with adjacent protected areas such as Srivilliputtur Grizzled
Squirrel Wildlife Sanctuary in northern side, Periyar Tiger Reserve in western and south
western side and Megamalai Wildlife Sanctuary in the northern side; this patch is also
connecting Megamalai Wildlife Sanctuary with Srivilliputtur Grizzled Squirrel Wildlife
Sanctuary and this is one of the area in the southern Western Ghats where large portion
of high elevation forests (>1400 m) still persist, which is supporting high richness of
endemic and threatened vertebrates (Bhupathy et al. 2012). In this context, we
recommend that the lease period of these estates should not be further extended and
should be gradually acquired and restored. Further, we suggest to add the above
mentioned area into Megamalai Wildlife Sanctuary or to create new wildlife sanctuary
for the conservation of imperative wildlife area in the Western Ghats.
58
(2) Varusanad Valley and Hills: A potential patch for “Conservation Reserve” program
According to forest working plan (2004-2014), there are around 5911 hectares of 2896
encroachments spread across the landscape: Varusanad range with 2060 hectares (1802
encroachments) followed by Megamalai (1721 hectare- 399) and Bodi ranges (1607
hectare=490) (Malik, 2004). Among the encroachments in the Highwavy environs, Varusanad
range i.e. Varusanad Valley and hills were highly exploited to create monoculture plantations
(silk cotton) by the encroachers, which are moved from dry plains of erstwhile Madurai
district. The lands were encroached by these people around three to four decades ago. Hence,
resettling these people from the Valley and hills of Varusand will be a troublesome work and
that may also lead to conflict between forest department and the local residents. The Valley
also holds a minor population of threatened grizzled giant squirrel and diverse number of birds
(around 253 species). The encroached plantations and adjacent riparian and other natural
forests support diverse species of vertebrates. In this background, it is recommended to
propose the Varusanad Valley and hills as “conservation reserve” so that the people inside the
Valley will not be excavated and the same time biodiversity in the landscape can also be
protected in sustainable way (Fig. 5.1). The sustainable way for solving the conflict between
people and wildlife in the area requires detailed study.
(3) Living critical link: Requires conservation attention
The critical link between ‘Periyar-Agastiyamalai’ and ‘Anamalai-Palni’ Corridor fall in the
Theni Division. The critical link was intersected by Cumbam to Kumuly road, Cumbam to
Cumbam Mettu, Bodi to Munnar roads and also penstock made for the power generation
breaking the critical link. Present study shows persistence of large mammals like elephant,
leopard, porcupine and sambar in these corridors of mountain, further which was evidenced by
the moderate to high occupancy rate of nine species of large mammals. The indirect evidences
of carnivores such as dhole and leopard were also recorded from the critical link. Further, dry
eastern slopes of the critical link also connect the Mathikettan Shola National Park of Kerala in
the western side. The critical link is highly disturbed and fragmented for establishing the
physical structures (construction of road, penstock and deep gorge). At present,
administratively, major part of this corridor is under the Theni Forest Division. Local people
revealed crop raiding by elephants and wild boar along the foot hills of the corridor. This may
be due to very narrow stretch of forest left, thus the animals have tendency to move out of the
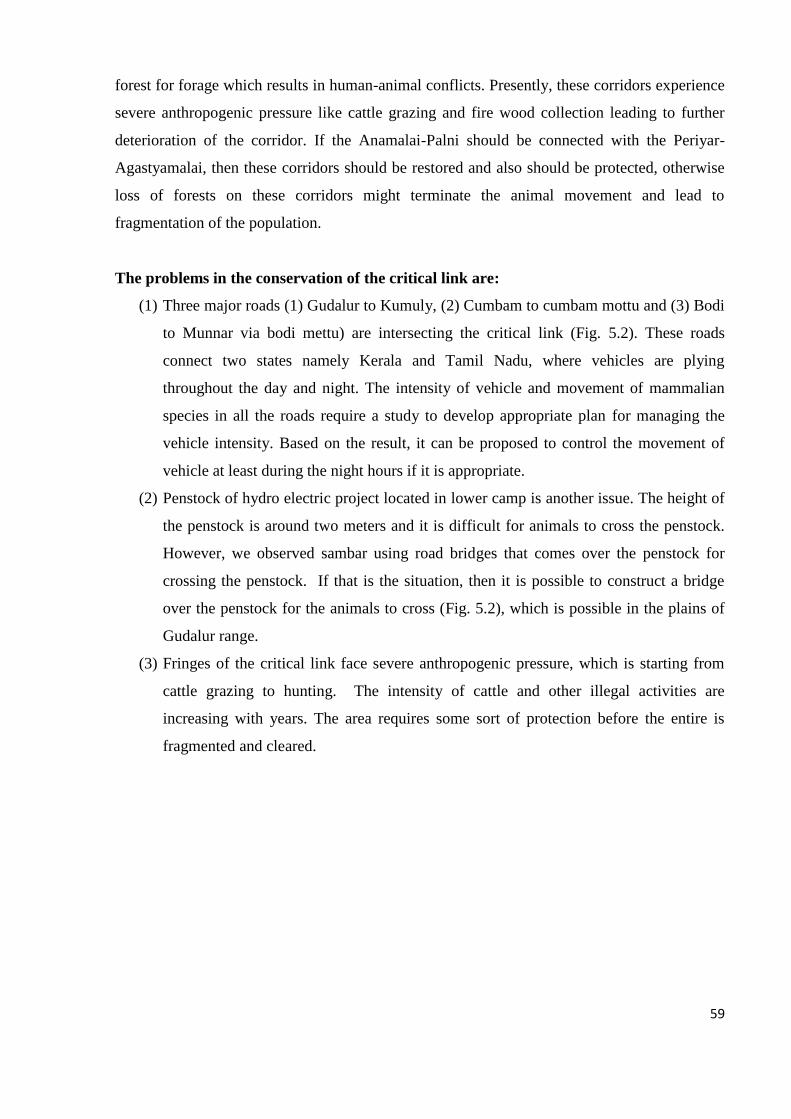
59
forest for forage which results in human-animal conflicts. Presently, these corridors experience
severe anthropogenic pressure like cattle grazing and fire wood collection leading to further
deterioration of the corridor. If the Anamalai-Palni should be connected with the Periyar-
Agastyamalai, then these corridors should be restored and also should be protected, otherwise
loss of forests on these corridors might terminate the animal movement and lead to
fragmentation of the population.
The problems in the conservation of the critical link are:
(1) Three major roads (1) Gudalur to Kumuly, (2) Cumbam to cumbam mottu and (3) Bodi
to Munnar via bodi mettu) are intersecting the critical link (Fig. 5.2). These roads
connect two states namely Kerala and Tamil Nadu, where vehicles are plying
throughout the day and night. The intensity of vehicle and movement of mammalian
species in all the roads require a study to develop appropriate plan for managing the
vehicle intensity. Based on the result, it can be proposed to control the movement of
vehicle at least during the night hours if it is appropriate.
(2) Penstock of hydro electric project located in lower camp is another issue. The height of
the penstock is around two meters and it is difficult for animals to cross the penstock.
However, we observed sambar using road bridges that comes over the penstock for
crossing the penstock. If that is the situation, then it is possible to construct a bridge
over the penstock for the animals to cross (Fig. 5.2), which is possible in the plains of
Gudalur range.
(3) Fringes of the critical link face severe anthropogenic pressure, which is starting from
cattle grazing to hunting. The intensity of cattle and other illegal activities are
increasing with years. The area requires some sort of protection before the entire is
fragmented and cleared.

60
Figure 5.1 Prioritized conservation area in the Highwavy environs
Figure 5.2 Position of penstock and road in critical link and the wildlife cross points
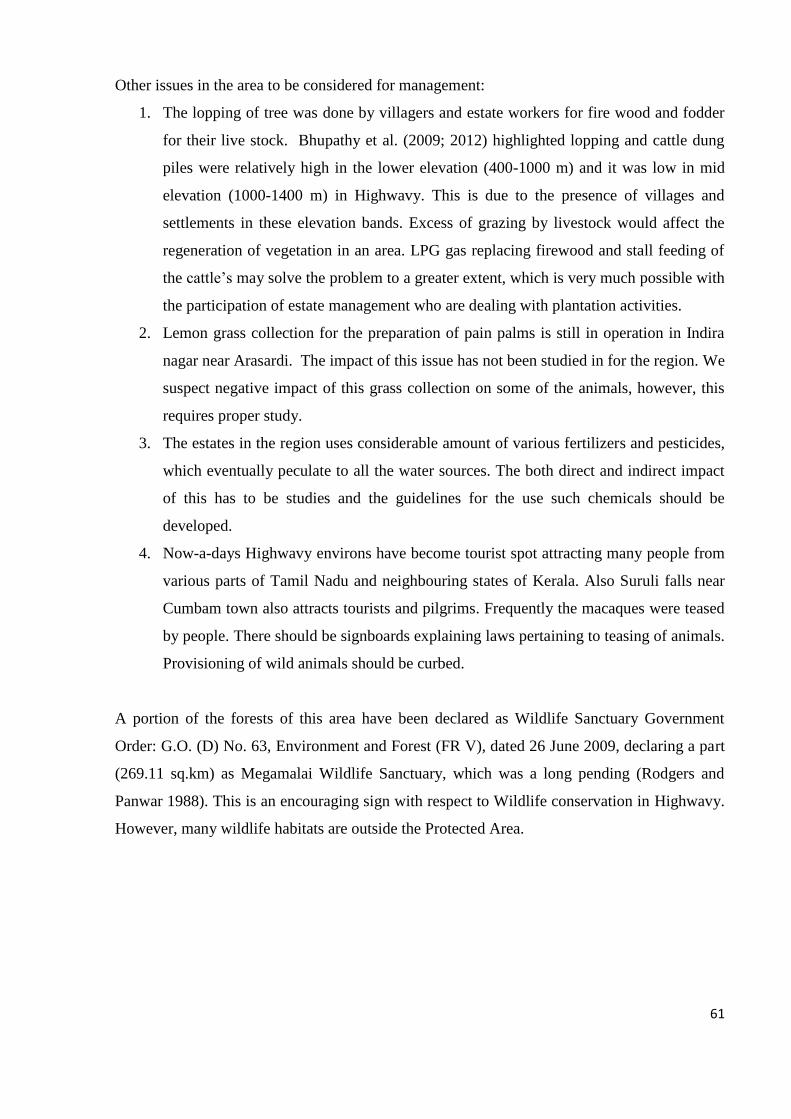
61
Other issues in the area to be considered for management:
1. The lopping of tree was done by villagers and estate workers for fire wood and fodder
for their live stock. Bhupathy et al. (2009; 2012) highlighted lopping and cattle dung
piles were relatively high in the lower elevation (400-1000 m) and it was low in mid
elevation (1000-1400 m) in Highwavy. This is due to the presence of villages and
settlements in these elevation bands. Excess of grazing by livestock would affect the
regeneration of vegetation in an area. LPG gas replacing firewood and stall feeding of
the cattle’s may solve the problem to a greater extent, which is very much possible with
the participation of estate management who are dealing with plantation activities.
2. Lemon grass collection for the preparation of pain palms is still in operation in Indira
nagar near Arasardi. The impact of this issue has not been studied in for the region. We
suspect negative impact of this grass collection on some of the animals, however, this
requires proper study.
3. The estates in the region uses considerable amount of various fertilizers and pesticides,
which eventually peculate to all the water sources. The both direct and indirect impact
of this has to be studies and the guidelines for the use such chemicals should be
developed.
4. Now-a-days Highwavy environs have become tourist spot attracting many people from
various parts of Tamil Nadu and neighbouring states of Kerala. Also Suruli falls near
Cumbam town also attracts tourists and pilgrims. Frequently the macaques were teased
by people. There should be signboards explaining laws pertaining to teasing of animals.
Provisioning of wild animals should be curbed.
A portion of the forests of this area have been declared as Wildlife Sanctuary Government
Order: G.O. (D) No. 63, Environment and Forest (FR V), dated 26 June 2009, declaring a part
(269.11 sq.km) as Megamalai Wildlife Sanctuary, which was a long pending (Rodgers and
Panwar 1988). This is an encouraging sign with respect to Wildlife conservation in Highwavy.
However, many wildlife habitats are outside the Protected Area.

62
Plate 5.1 Showing tea plantation in Highwavy environs
Plate 5.2 Forest fire in dry forests of Highwavy environs near Arasardi
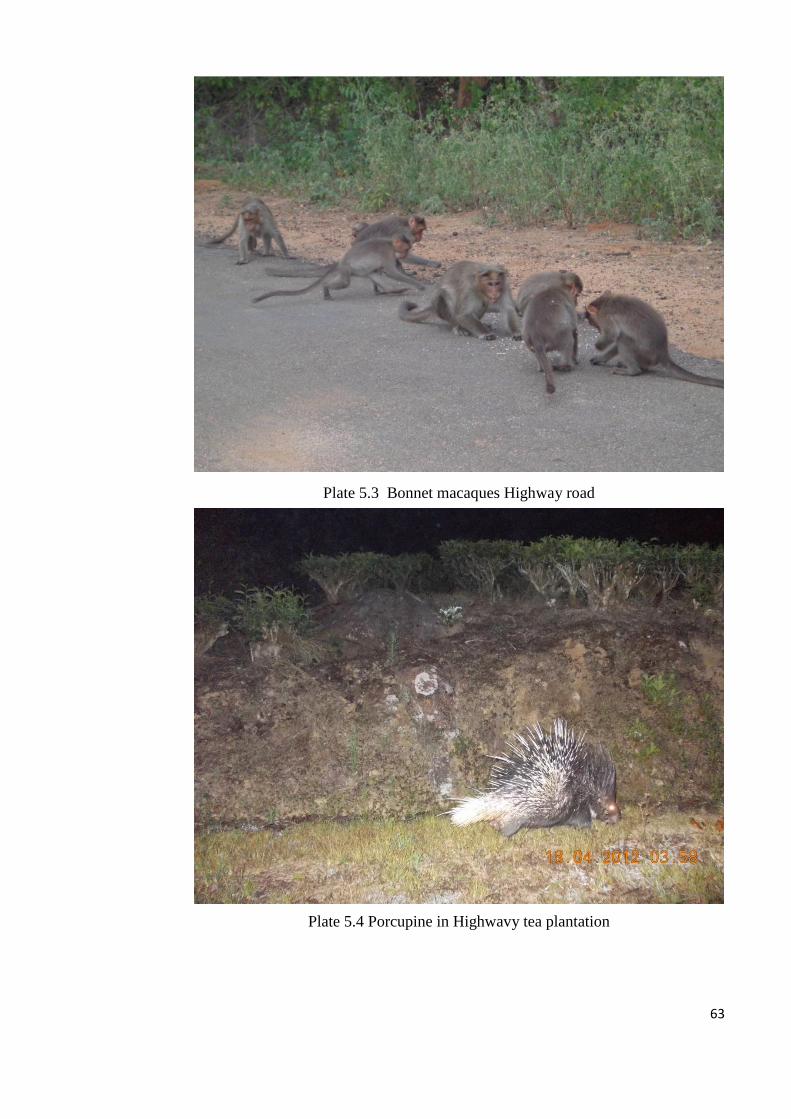
63
Plate 5.3 Bonnet macaques Highway road
Plate 5.4 Porcupine in Highwavy tea plantation
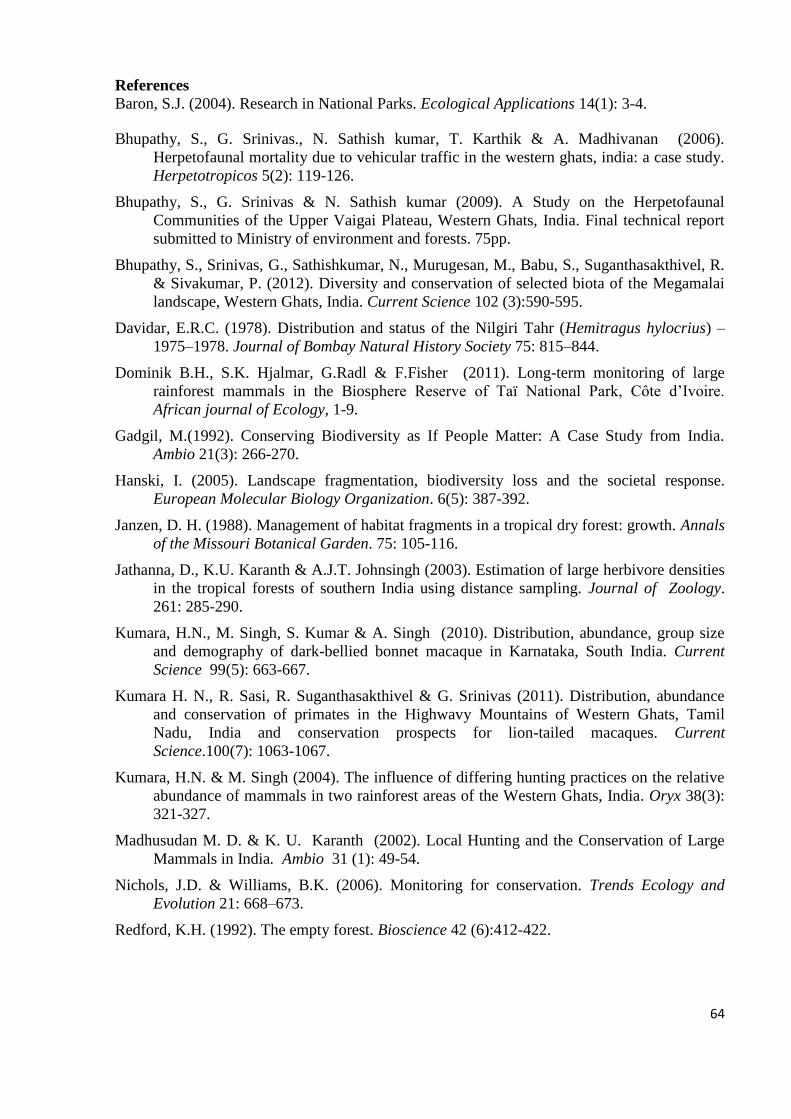
64
References
Baron, S.J. (2004). Research in National Parks. Ecological Applications 14(1): 3-4.
Bhupathy, S., G. Srinivas., N. Sathish kumar, T. Karthik & A. Madhivanan (2006).
Herpetofaunal mortality due to vehicular traffic in the western ghats, india: a case study.
Herpetotropicos 5(2): 119-126.
Bhupathy, S., G. Srinivas & N. Sathish kumar (2009). A Study on the Herpetofaunal
Communities of the Upper Vaigai Plateau, Western Ghats, India. Final technical report
submitted to Ministry of environment and forests. 75pp.
Bhupathy, S., Srinivas, G., Sathishkumar, N., Murugesan, M., Babu, S., Suganthasakthivel, R.
& Sivakumar, P. (2012). Diversity and conservation of selected biota of the Megamalai
landscape, Western Ghats, India. Current Science 102 (3):590-595.
Davidar, E.R.C. (1978). Distribution and status of the Nilgiri Tahr (Hemitragus hylocrius) –
1975–1978. Journal of Bombay Natural History Society 75: 815–844.
Dominik B.H., S.K. Hjalmar, G.Radl & F.Fisher (2011). Long-term monitoring of large
rainforest mammals in the Biosphere Reserve of Taï National Park, Côte d’Ivoire.
African journal of Ecology, 1-9.
Gadgil, M.(1992). Conserving Biodiversity as If People Matter: A Case Study from India.
Ambio 21(3): 266-270.
Hanski, I. (2005). Landscape fragmentation, biodiversity loss and the societal response.
European Molecular Biology Organization. 6(5): 387-392.
Janzen, D. H. (1988). Management of habitat fragments in a tropical dry forest: growth. Annals
of the Missouri Botanical Garden. 75: 105-116.
Jathanna, D., K.U. Karanth & A.J.T. Johnsingh (2003). Estimation of large herbivore densities
in the tropical forests of southern India using distance sampling. Journal of Zoology.
261: 285-290.
Kumara, H.N., M. Singh, S. Kumar & A. Singh (2010). Distribution, abundance, group size
and demography of dark-bellied bonnet macaque in Karnataka, South India. Current
Science 99(5): 663-667.
Kumara H. N., R. Sasi, R. Suganthasakthivel & G. Srinivas (2011). Distribution, abundance
and conservation of primates in the Highwavy Mountains of Western Ghats, Tamil
Nadu, India and conservation prospects for lion-tailed macaques. Current
Science.100(7): 1063-1067.
Kumara, H.N. & M. Singh (2004). The influence of differing hunting practices on the relative
abundance of mammals in two rainforest areas of the Western Ghats, India. Oryx 38(3):
321-327.
Madhusudan M. D. & K. U. Karanth (2002). Local Hunting and the Conservation of Large
Mammals in India. Ambio 31 (1): 49-54.
Nichols, J.D. & Williams, B.K. (2006). Monitoring for conservation. Trends Ecology and
Evolution 21: 668–673.
Redford, K.H. (1992). The empty forest. Bioscience 42 (6):412-422.