Embed Size (px)
Citation preview
International Journal of Scientific & Engineering Research, Volume 7, Issue 4, April-2016 1610
ISSN 2229-5518
IJSER © 2016
http://www.ijser.org
ASSESSMENT OF CLIMATE CHANGE AND VARIABILITY IN TEMPERATURE, PRECIPITATION AND FLOWS IN UPPER INDUS BASIN
Moien Ahsan1, Abdul SattarShakir
2, Sonia Zafar
3 and Ghulam Nabi
4
1PhD Water Resource Engineering Scholar, Centre of Excellence in Water Resource
Engineering (CEWRE), University of Engineering and Technology, Lahore, Pakistan.
2Professors and Dean Faculty of Civil Engineering, University of Engineering and
Technology, Lahore, Pakistan. [email protected], 3Deputy District Officer Own Farm Water Management Directorate
Lahore,[email protected] 4Assistant Professor, Centre of Excellence in Water Resources Engineering, University of
Engineering and Technology, Lahore, Pakistan. [email protected],
Corresponding Author: Engr. Moien Ahsan, PhD Water Resource Engineering Scholar, CEWRE,UET, Lahore, Pakistan. E-mail: moien_ag_2232yahoo.com, Contact No: 0092-334-4415225
ABSTRACT: Population of Pakistan increasing day by day but the storage of water is not enough to fulfill the any drought. Being an
agricultural country with heavy population growth, there is a great stress on water resources to meet the food and fiber
requirement for the people. The elevation of Upper Indus Basin (UIB) ranges from 254 m to 8570 m above mean sea level.
All the minor and major river of Pakistan falls into Indus River at different locations. This study examines the climate change
and related hydrological impacts resulting from altitudinal variability. Variability analysis in annual temperature, precipitation
and stream flow has been made by and climate change has been predicted. The results of this study indicate that
maximum and mean temperature have warming trends and have increased with increased in elevation whereas minimum
has the reverse situation. Annual precipitation has more decreasing rate in higher mountainous catchments. The impact of
altitudinal variability under changing climate yields that Annual stream flows in River Indus (at Br. Khairabad and Kharmong,
Alam), and Kabul (at Nowshera) Swat (at Kalam) have decreased whereas in River Hunza, Shigar, Astore Chitral, Shoyk.
and Gilgit have increased. The prevailing trends and variability, caused by climate change, have an effect on the flows that
should be considered by the water managers for better water management in a water scarcity country like Pakistan. On the
basis of collected real time data analysis, an awareness regarding present Integrated Water Management (IWM) and steps
should be taken to adopt Integrated Watershed Management up-to-date techniques for effective water on-going reform
process.
Keyword: Upper Indus Basin; Variability in trends, Climate change; Stream flows, Statistical
test, Time series analysis, Annual Temperature, Annual Rainfall
1. INTRODUCTION
A per Intergovernmental Panel on Climate Change [1] Earth’s over-all temperature has been intensified up to 0.89 °C over the time period 1901 to 2012. Research studies conducted by [2] and reports published by IPCC [3] have identified significant warming up of the Earth’s surface over the past 100-years period or so. Moreover, global circulation patterns are affected by warming up but directly affect local climatic settings with changes in distribution and characteristics of precipitation and temperature. Hydrological impacts by climate change may significant affect water resources availability and may cause changes in the hydrological cycle [4]. Changes vary in space and time domains as affected by local climatic and topographic settings. IPCC [1] reported that that climate changes are accelerated and that impacts may become more extreme. This aspect of climate change has motivated this study where we aim to assess possible acceleration of climate changes and related hydrological impacts for
Upper Indus Basin in Pakistan. This system is of high importance to sustainable water supply for large populations in the lower Indus in Pakistan. The climate in Pakistan has a large regional variation, categorized by hot summers and cold winters. The temperature difference between day and night is extremely important. During summer season the temperature in the southern part rises up to 45°C or even more. Lack of precipitation made the dry and deserted place. Northern Pakistan is usually cold because of the snowcapped mountains, while the southern part is dry, with deserts around. Changing of climate greatly affecting the sources of water like Glaciers and Streams. Glaciers are melting rapidly because of the increasing temperature flows of stream are also affecting as well as pattern of rain fall has also change because of climate change.
Investigations of past shows that climate on Earth is
continuous in changing process. The pace of change and
the nature of the consequential nature resulting effects
will fluctuate with time and throughout the country by
impacting life on Earth. In an effort to reduce emissions
IJSER
International Journal of Scientific & Engineering Research, Volume 7, Issue 4, April-2016 1611
ISSN 2229-5518
IJSER © 2016
http://www.ijser.org
of greenhouse, it is necessary to adapt to the effects of
climate change. Learn what climate change will mean
that Pakistan is the only one step in this direction. In
most global climate models predict the magnitude of
future climate change will lead to a significant impact
on our water resources, and later affect the sustainability
of the food supply, health, industry, transport and
ecosystems. Problem because of the stress is exacerbated
by the change in the supply and demand due to climate
change, it takes a load on resources , is most likely to
occur in already the southern part of the country .
Pakistan’s economy is based on agriculture that “is
highly dependent on Indus Basin Irrigation system” [5]
Stated by Archer, [6], “the irrigation system assists an
area of 22.2 million hectares and irrigated land for 85%
of all crop/food production”. Pakistan has three major
reservoirs (Tarbela, Mangla and Chasma), which have
original storage capacity of 19.43 BM3. Future
assessment of water resources in Pakistan under climate
change is a prerequisite for the planning and operation
of hydraulic equipment [7]. Seasonal flow forecasting in
relation to climate change would have been an effective
tool to water resource management authority in an
timely warning to an excess or deficit in power
generation [8], further it will be helpful for planners As
per previous studies, due to wide variation in
topographic and meteorological parameters, different
trends has been observed in different climatic regions of
the country [9]. The elevation of UIB ranges from 254 m
to 8570 m above mean sea level. There are so many
rivers which contribute water to main Indus River. The
main sub basins like Chitral, Swat, Kabul, Hunza, Gilgit,
Astore, Shigar, Shyok are lying at different elevation
raging in “three hydrological regimes: a regime depends
on the melting of the winter snow, a glacial regime and
the precipitation regime depends on simultaneous
rainfall [11] studied long-term precipitation and
temperature series (1895 to 1999) from 17 stations in the
UIB described that records exhibit a complex season-
dependent spatial correlation structure. Results, as such,
indicate large differences in climate change as affected
by local climatic and topographic settings. Keeping in
view, hydro-climatic variability and related
hydrological impacts resulting from altitudinal
variability under changing climate was analyzed in this
study. The results of this study will also be helpful for
decision makers to develop the strategies for planning
and development of water resources under different
climatic scenarios to overcome their adverse impact.
Khalida et al (10) also analyzed the annual rainfall data
of upper Indus basin.
2. STUDY AREA
The Upper Indus Basin is selected to investigate
study. The Catchment of this basin falls in range 33º,
40ʹto 37º, 12ʹ N latitude and 70º, 30ʹ to 77º, 30ʹ E, longitude. Due to unavailability of data in China and
India, so study area was confined in catchment
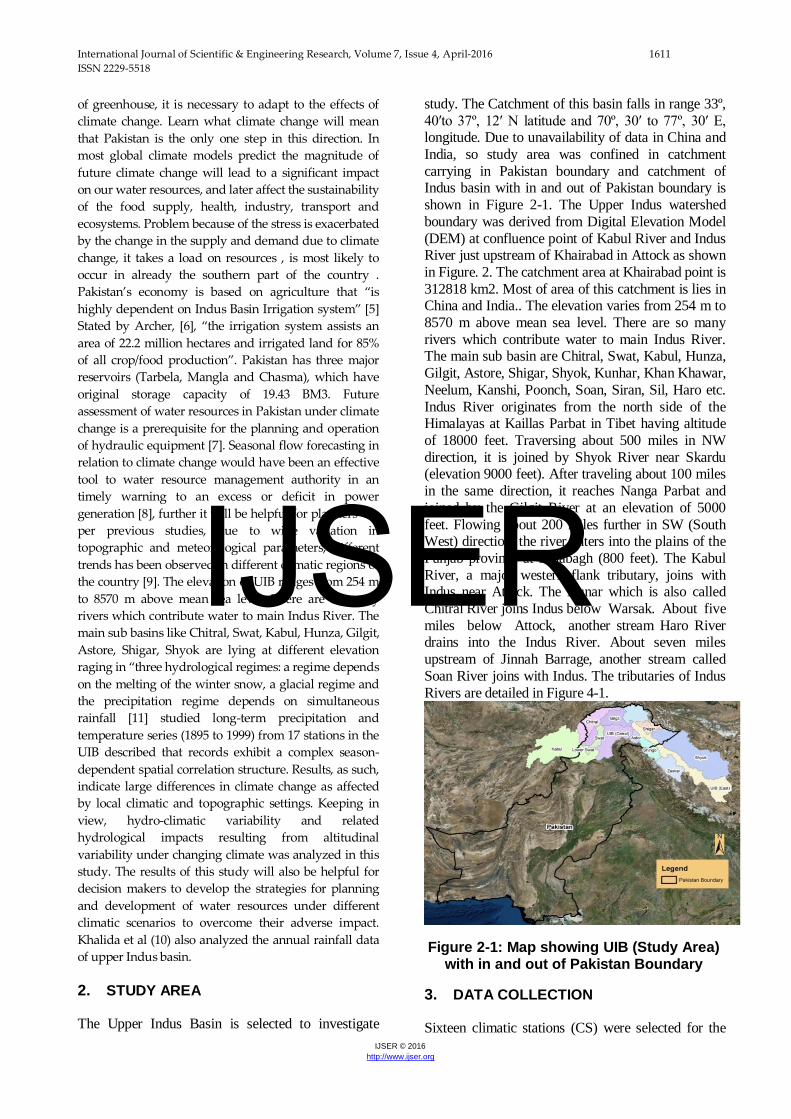
carrying in Pakistan boundary and catchment of Indus basin with in and out of Pakistan boundary is
shown in Figure 2-1. The Upper Indus watershed
boundary was derived from Digital Elevation Model
(DEM) at confluence point of Kabul River and Indus River just upstream of Khairabad in Attock as shown
in Figure. 2. The catchment area at Khairabad point is
312818 km2. Most of area of this catchment is lies in China and India.. The elevation varies from 254 m to
8570 m above mean sea level. There are so many
rivers which contribute water to main Indus River. The main sub basin are Chitral, Swat, Kabul, Hunza,
Gilgit, Astore, Shigar, Shyok, Kunhar, Khan Khawar,
Neelum, Kanshi, Poonch, Soan, Siran, Sil, Haro etc.
Indus River originates from the north side of the Himalayas at Kaillas Parbat in Tibet having altitude
of 18000 feet. Traversing about 500 miles in NW
direction, it is joined by Shyok River near Skardu (elevation 9000 feet). After traveling about 100 miles
in the same direction, it reaches Nanga Parbat and
joined by the Gilgit River at an elevation of 5000
feet. Flowing about 200 miles further in SW (South West) direction, the river enters into the plains of the
Punjab province at Kalabagh (800 feet). The Kabul
River, a major western flank tributary, joins with Indus near Attock. The Kunar which is also called
Chitral River joins Indus below Warsak. About five
miles below Attock, another stream Haro River drains into the Indus River. About seven miles
upstream of Jinnah Barrage, another stream called
Soan River joins with Indus. The tributaries of Indus
Rivers are detailed in Figure 4-1.
Figure 2-1: Map showing UIB (Study Area) with in and out of Pakistan Boundary
3. DATA COLLECTION
Sixteen climatic stations (CS) were selected for the
IJSER
International Journal of Scientific & Engineering Research, Volume 7, Issue 4, April-2016 1612
ISSN 2229-5518
IJSER © 2016
http://www.ijser.org
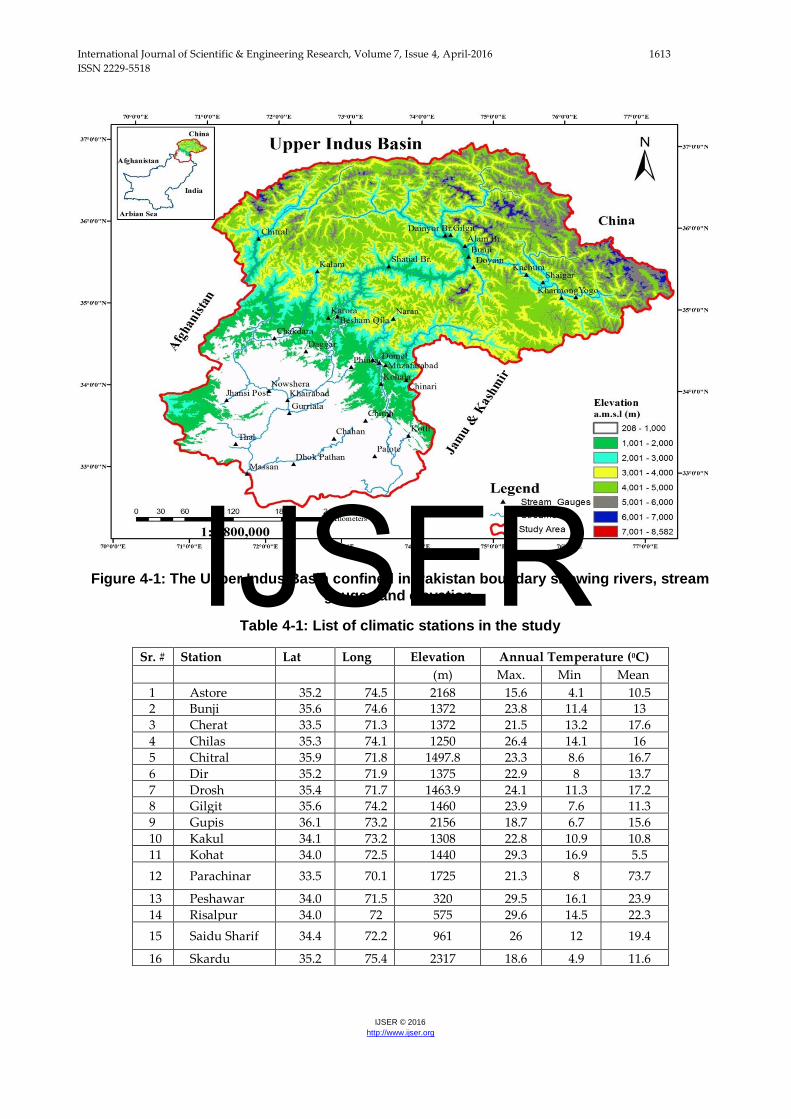
analysis and the selected stations location, elevation
and annual temperature is shown in Table 4-1 and climatic stations location is given in Figure 4-1. The
data of these stations were collected from Pakistan
Surface water Hydrology Project (SWHP), Water and Power Development Authority (WAPDA), and
Pakistan Meteorological Department (PMD) for
period (1960 to 2013). The mean monthly maximum
and minimum were calculated for each year of the daily maximum daily minimum and daily average
temperatures. The data is also missing replaced via
mean linking the earlier year data with subsequent years. Stream-flow measurement in UIB is of the
WAPDA-SWHP project conceded starting in 1960
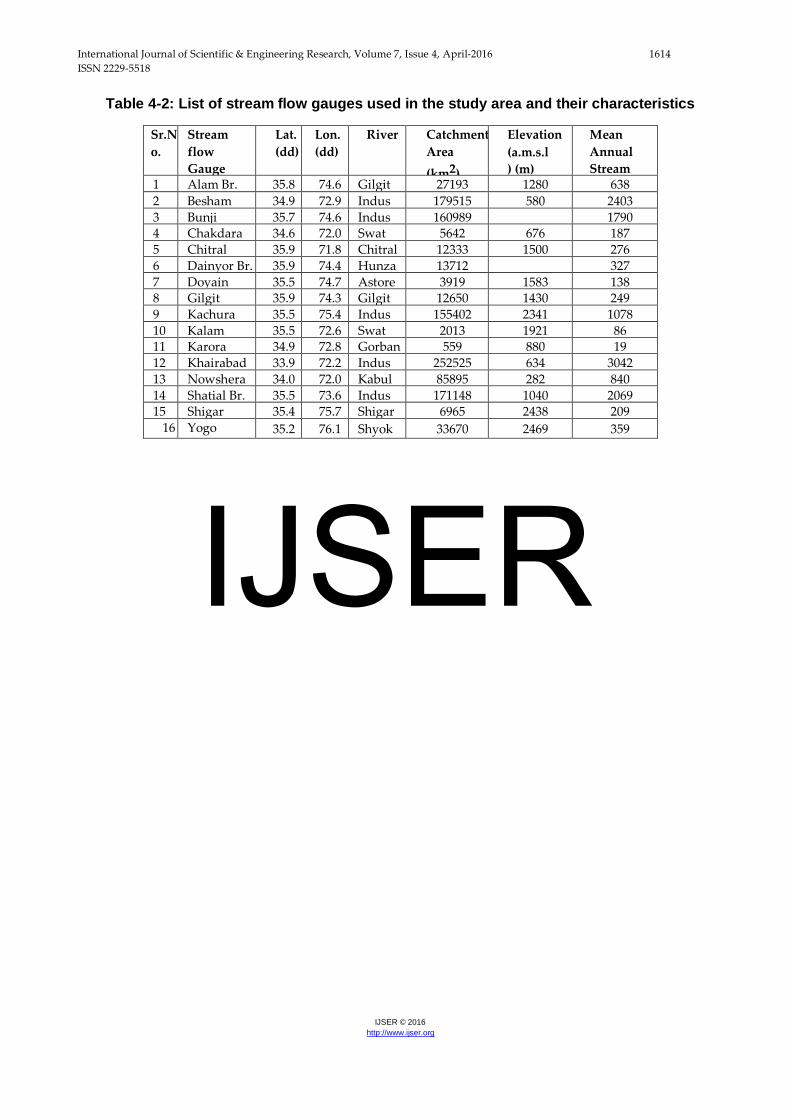
with original records. Stream flow data of selected sixteen climate stations is shown in Table 4-2. The
stream flow gauges are installed in all sub-basins of
UIB at different locations which are shown in Figure
4-1. The stream gauges have a wide range of drainage area from 262 km2 to 286,000 km2. Sixteen
flow gauges stations were selected as installed in all
sub-basins of UIB. The characteristics/information of selected flow sites are given in Table 4-2. The data of
these sites were for period 1961 to 2013.
4. METHODOLOGY
The rationale of the documentation trend is to
determine whether the value of the random variable
usually decreasing / increasing over a certain time [12].
Parametric or nonparametric statistical tests have been
used to solve, whether the trend is statistically
significant [13]. The analysis was carried out for the
time series mean values; these steps include essentially:
(i) the Analyze of serial correlation effect; (ii)
Identification “of trends by using the Mann - Kendall
test” [14] Spearman test and linear trend methods; (iii)
Estimation of the trend value by applying Sen‟s
estimator.
4.1 Serial Correlation Effect
In time series analysis, it is essential to consider
correlation “or serial correlation, defined as the
correlation of a variable with itself over successive time
intervals, before the test for trend” [15]. In particular,
[16] stated, “if there is a positive serial correlation
(persistence) in the time series, then the non-
parametric test is a significant trend in a time series
that is random more often than specified by the
significance level” .To do this [16] explained that “the
time series should be „pre-whitened‟ in order to
eliminate the effect of serial correlation before applying
the Mann- Kendall test” or any trend detection test.
Tabari, [17] has revealed the elimination of serial
correlation of pre-whitening used to efficiently
eliminate the “serial correlation” remove impact of its
test series on MW test. Tabari, [18] have also amended
the process of pre-whiting where exist substantial
serial correlation. “TFPW method has been applied in
the most recent studies to detect trends in the
hydrological and meteorological parameters” by
Tabari, [19]. We have integrated the recommendations
in this study and accordingly prospective statistically
considerable trends in temperature examination (x1,
x2. . . xn) [16] and scrutinized procedures as follows:-
For a given time series of interest, the slope of the trend
(β) by the use of robust slope estimator is estimated
method of Sen. Then the time series is de-trended,
assuming a linear trend [27] as
1
Compute the lag-1 serial correlation coefficient
(designated by r1)” [16]. Should the designed r1 prove
not to be meaningful at 5% level, statistical tests would
then be employed to the primary data sets of the time
series. Ramadan, et al; [21] analyzed “If the calculated
r1 is significant, prior to application tests, then the
„pre-whitened‟ time series could be obtained” [22]:
2
. IJSER
International Journal of Scientific & Engineering Research, Volume 7, Issue 4, April-2016 1613
ISSN 2229-5518
IJSER © 2016
http://www.ijser.org
Figure 4-1: The Upper Indus Basin confined in Pakistan boundary showing rivers, stream gauges and elevation.
Table 4-1: List of climatic stations in the study
Sr. # Station Lat Long Elevation Annual Temperature (0C)
(m) Max. Min Mean
1 Astore 35.2 74.5 2168 15.6 4.1 10.5 2 Bunji 35.6 74.6 1372 23.8 11.4 13
3 Cherat 33.5 71.3 1372 21.5 13.2 17.6
4 Chilas 35.3 74.1 1250 26.4 14.1 16
5 Chitral 35.9 71.8 1497.8 23.3 8.6 16.7
6 Dir 35.2 71.9 1375 22.9 8 13.7
7 Drosh 35.4 71.7 1463.9 24.1 11.3 17.2 8 Gilgit 35.6 74.2 1460 23.9 7.6 11.3
9 Gupis 36.1 73.2 2156 18.7 6.7 15.6
10 Kakul 34.1 73.2 1308 22.8 10.9 10.8
11 Kohat 34.0 72.5 1440 29.3 16.9 5.5
12 Parachinar 33.5 70.1 1725 21.3 8 73.7
13 Peshawar 34.0 71.5 320 29.5 16.1 23.9
14 Risalpur 34.0 72 575 29.6 14.5 22.3
15 Saidu Sharif 34.4 72.2 961 26 12 19.4
16 Skardu 35.2 75.4 2317 18.6 4.9 11.6
IJSER
International Journal of Scientific & Engineering Research, Volume 7, Issue 4, April-2016 1614
ISSN 2229-5518
IJSER © 2016
http://www.ijser.org
Table 4-2: List of stream flow gauges used in the study area and their characteristics
Sr.N
o.
Stream
flow
Gauge
Lat.
(dd)
Lon.
(dd)
River Catchment
Area
(km2)
Elevation
(a.m.s.l
) (m)
Mean
Annual
Stream
flow
(cusec)
1 Alam Br. 35.8 74.6 Gilgit 27193 1280 638
2 Besham
Qila
34.9 72.9 Indus 179515 580 2403
3 Bunji 35.7 74.6 Indus 160989 1790 4 Chakdara 34.6 72.0 Swat 5642 676 187
5 Chitral 35.9 71.8 Chitral 12333 1500 276
6 Dainyor Br. 35.9 74.4 Hunza 13712 327
7 Doyain 35.5 74.7 Astore 3919 1583 138 8 Gilgit 35.9 74.3 Gilgit 12650 1430 249
9 Kachura 35.5 75.4 Indus 155402 2341 1078
10 Kalam 35.5 72.6 Swat 2013 1921 86 11 Karora 34.9 72.8 Gorban
d
559 880 19
12 Khairabad 33.9 72.2 Indus 252525 634 3042
13 Nowshera 34.0 72.0 Kabul 85895 282 840
14 Shatial Br. 35.5 73.6 Indus 171148 1040 2069 15 Shigar 35.4 75.7 Shigar 6965 2438 209
16
Yogo 35.2 76.1 Shyok 33670 2469 359
IJSER
International Journal of Scientific & Engineering Research, Volume 7, Issue 4, April-2016 1615
ISSN 2229-5518
IJSER © 2016
http://www.ijser.org
4.2 Mann Kendall test
Zhang, [23] pointed that Mann initially performed MK
test, Kendall [24] are then derived the distribution of
the test statistic. Extensively used Mann Kendall test is
manipulated for investigate trends within
climatological studies by [25],. Yi et al; [26] analyzed
that there are two advantages to using this test. Wang,
et al; [25] submitted, “It is a non - parametric test and
does not require the data to be normally distributed”.
Hossein, [27] suggested, minimal sensitivity of the test
to disruptions due to inhomogeneous time series. This
test has been found as an excellent tool for the trends
detection [23]. According to Yu [28] “the number of
annual values of the data series is denoted by n”. To
compute the Mann-Kendall statistics, difference in
annual x value were determined; S was computed
using equation 4:
∑ ∑
3
Where sgn (xj - xk) is “an indicator function that takes
on the values 1, 0 or -1 according to sign of difference
(xj - xk), where j > k” [29 and 30 ].
[
] 4
Yan, [31] analyzed, the values “xj and xk are the annual
values in the year j and k” respectively. The variance S
was computed by the following equation applied by
Ramadan, et al; [21]:
[ ∑
] 5
q= the No. of tied groups and tp is the No. of data in
the group p [31]. Before computing VAR(S) the data
was checked all the local groups and the data extent in
each cluster are connected. “S and VAR(S) were used
to compute the test statistic Z” [32]:
[
]
6
The trend was evaluated using Z values. positive
value of Z an upward (warming) trend while negative
value downward trend (cooling trend)”. Statistics “Z
has a normal distribution” [32]. The insignificant
assumption, Ho stands true if there is no trend and
thus uses standard normal table to decide whether to
reject Ho. For investigation whichever upward or
downward trend (“a two-tailed test”) inference
identical Ho remains “rejected if the absolute value of
Z is greater than Z 1-a/2, where Z 1-a/2, was obtained
from standard normal” tables [32]. In this study
existence and importance of trend was evaluated with
α values that is α ≤ 0.1.
3.1. Sen’s estimator slope
Tabari, [23] analyzed “if a linear trend is present in a
time series, then the slope (change per unit time) can be
estimated by using a simple nonparametric
procedure”. Slope values of pairs of data of N were
initially calculated by Tabari, [17] as follows:
7
“Where xj and xk are the annual values in the year j and
k respectively” described by Xuedong (2008) Suggested
by Sujatha, [33], the “Sen‟s estimator of slope is the
median of these N values of Q”. Yu, [1993] noted,
“median of the slope estimates (N) was obtained in the
usual way”. Yan, [31], “N values of Qi were ranked
from smallest to largest and the Sen‟s estimator” was
computed as follow:
[ ]
[
]
Finally, by consulting Tabari, [34], Qmed was verified
with double-sided test at 100 (1 - α) % confidence
interval for testing and has been through non-
parametric test of the true slope while data were
processed using an Excel macro named MAKESENS.
5. RESULTS AND DISCUSSIONS
The trend analysis and changes in precipitation,
temperature and stream flow in the climatic stations
and stream gauges of UIB at different locations were
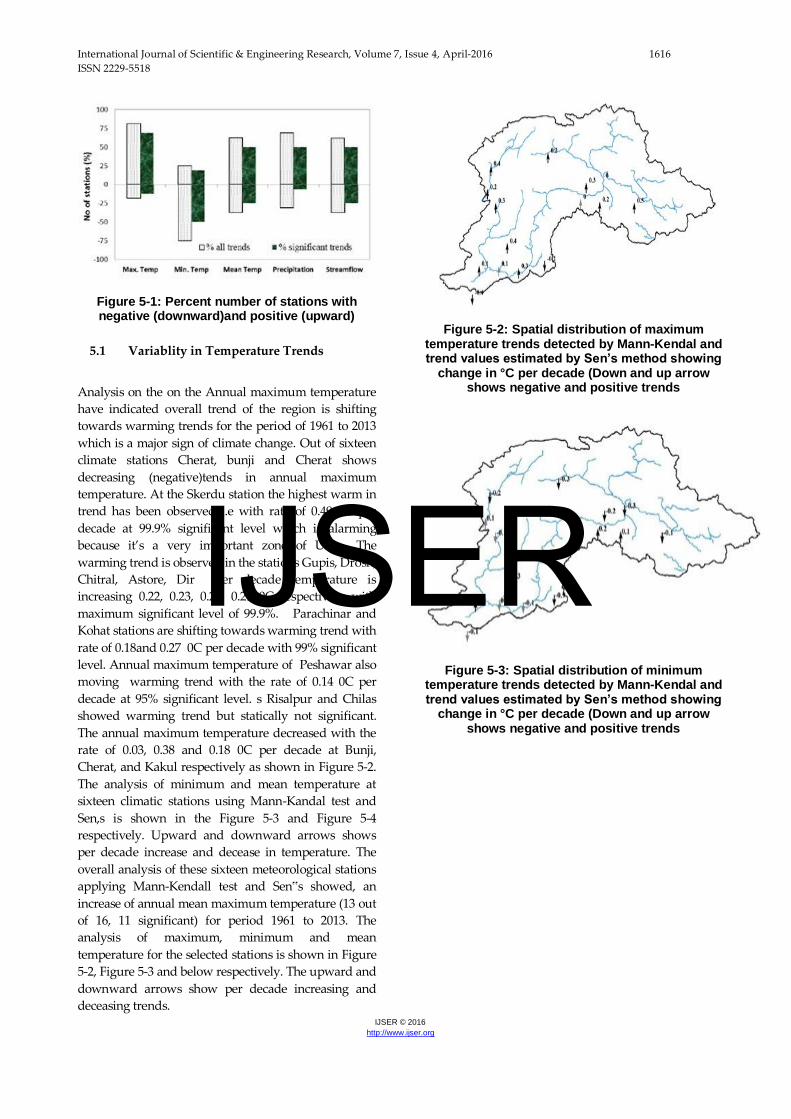
found over the periods 1961-2013. The analysis has
been carried out on annual time series. The percentage
of stations with decreasing and increasing trends as
well as significant trends is shown in Figure 5-1. To
examine the spatial consistency of the observed trends,
maps have been created displaying with increasing and
decreasing trends. The spatial distribution of trends and
changes in precipitation, temperature and stream flow
are discussed in preceding sections.
IJSER
International Journal of Scientific & Engineering Research, Volume 7, Issue 4, April-2016 1616
ISSN 2229-5518
IJSER © 2016
http://www.ijser.org
Figure 5-1: Percent number of stations with negative (downward)and positive (upward)
5.1 Variablity in Temperature Trends
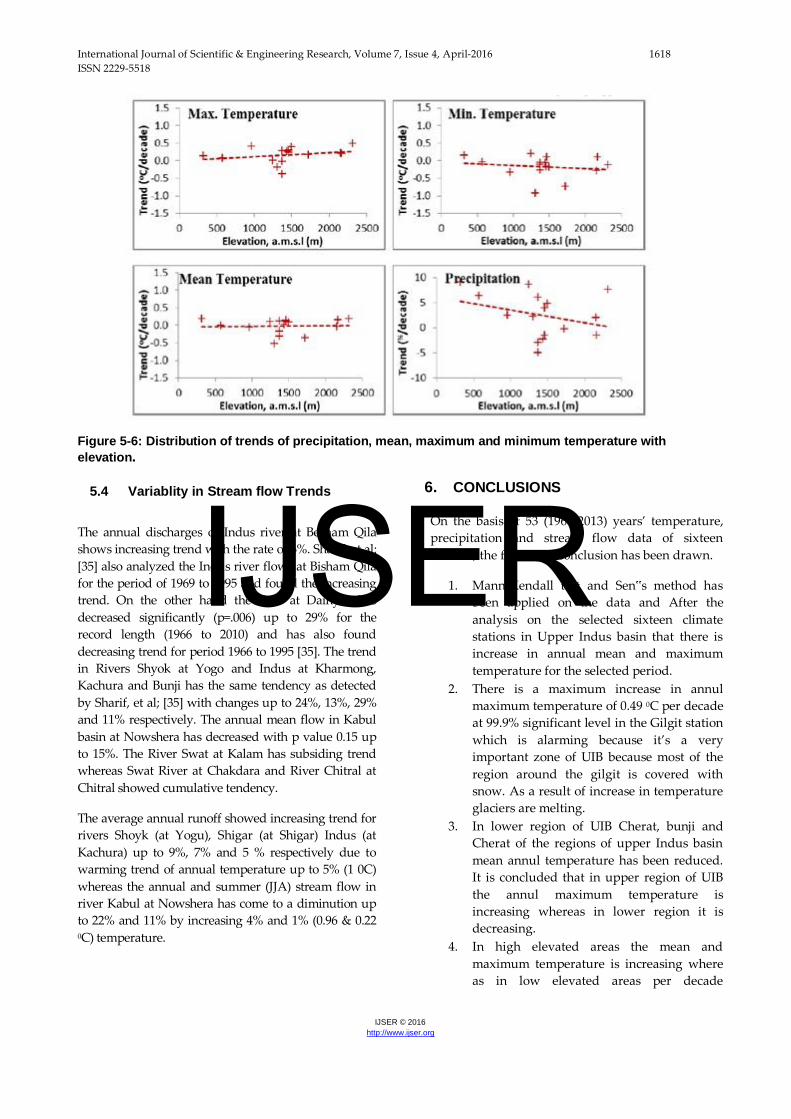
Analysis on the on the Annual maximum temperature
have indicated overall trend of the region is shifting
towards warming trends for the period of 1961 to 2013
which is a major sign of climate change. Out of sixteen
climate stations Cherat, bunji and Cherat shows
decreasing (negative)tends in annual maximum
temperature. At the Skerdu station the highest warm in
trend has been observed i.e with rate of 0.49 0C per
decade at 99.9% significant level which is alarming
because it’s a very important zone of UIB. The
warming trend is observed in the stations Gupis, Drosh,
Chitral, Astore, Dir per decade temperature is
increasing 0.22, 0.23, 0.28, 0.21 0C respectively with
maximum significant level of 99.9%. Parachinar and
Kohat stations are shifting towards warming trend with
rate of 0.18and 0.27 0C per decade with 99% significant
level. Annual maximum temperature of Peshawar also
moving warming trend with the rate of 0.14 0C per
decade at 95% significant level. s Risalpur and Chilas
showed warming trend but statically not significant.
The annual maximum temperature decreased with the
rate of 0.03, 0.38 and 0.18 0C per decade at Bunji,
Cherat, and Kakul respectively as shown in Figure 5-2.
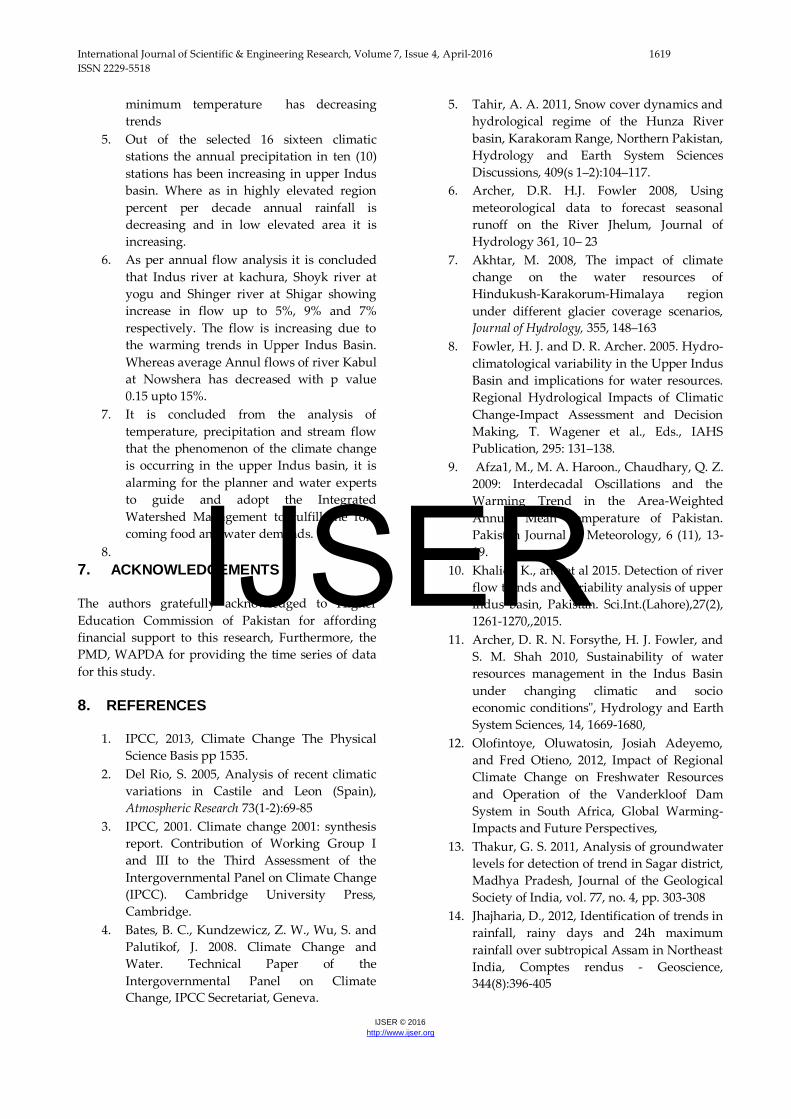
The analysis of minimum and mean temperature at
sixteen climatic stations using Mann-Kandal test and
Sen,s is shown in the Figure 5-3 and Figure 5-4
respectively. Upward and downward arrows shows
per decade increase and decease in temperature. The
overall analysis of these sixteen meteorological stations
applying Mann-Kendall test and Sen‟s showed, an
increase of annual mean maximum temperature (13 out
of 16, 11 significant) for period 1961 to 2013. The
analysis of maximum, minimum and mean
temperature for the selected stations is shown in Figure
5-2, Figure 5-3 and below respectively. The upward and
downward arrows show per decade increasing and
deceasing trends.
Figure 5-2: Spatial distribution of maximum temperature trends detected by Mann-Kendal and trend values estimated by Sen’s method showing
change in °C per decade (Down and up arrow shows negative and positive trends
Figure 5-3: Spatial distribution of minimum temperature trends detected by Mann-Kendal and trend values estimated by Sen’s method showing
change in °C per decade (Down and up arrow shows negative and positive trends
IJSER

International Journal of Scientific & Engineering Research, Volume 7, Issue 4, April-2016 1617
ISSN 2229-5518
IJSER © 2016
http://www.ijser.org
Figure 5-4: Spatial distribution of mean temperature trends detected by Mann-Kendal and trend values estimated by Sen’s method showing
change in °C per decade (Down and up arrow shows negative and positive trends
5.2 Variablity in Precipitation Trends
The results of analysis by applying Mann-Kendall
besides Sen slope estimation methods; annual rainfall
were summarized in Figure 5-5. At ten (10) stations out
of sixteen (16) stations, the annual n precipitation has
been increased for the period 1961 to 2013.At the
stations Risalpur, Bunji, Chilas, and Peshawar and
Risalpur annual precipitation with highest significance
level (99.9%) was observed with the rate 40.24 (6%) ,
16.41 (9%), 40.33 (9%) and 9.41 (6%) mm per decade
respectively. At the stations Skardu, Giligit and Gupis
increasing trend of annual precipitation has been
observed with 99% % significance level and per decade
increase in annual rainfall is 16.81(8%), 5.18 (4%),and
3.72 (2%) respectively. Chitral station showed 95%
significance level with rate of 22.65 (5%) mm per
decade. There are also some stations where annul
maximum rainfall is decreased for period 1960-2013. At
the stations Parachinar, Drosh, Cherat, Dir, Kohat and
Astore 1.84 (1%) 9 (1%),30 (5%),41 (3%), 12.49 (2%)
and 7.27 (1%), mm per decade respectively but all these
were statistically inconsequential. The spatial
distribution of annual rainfall trends in shown in Figure
5-5. The upward and downward arrows shows
perdecade increasing and deceasing trends.
Figure 5-5: Spatial distribution of annual rainfall trends detected by Mann-Kendal and trend values estimated by Sen’s method showing
change in % per decade (Down and up arrow shows decrease and increase trends)
5.3 Altitudinal Impact on Climate Change
Variation in Climate Change with
Elevation
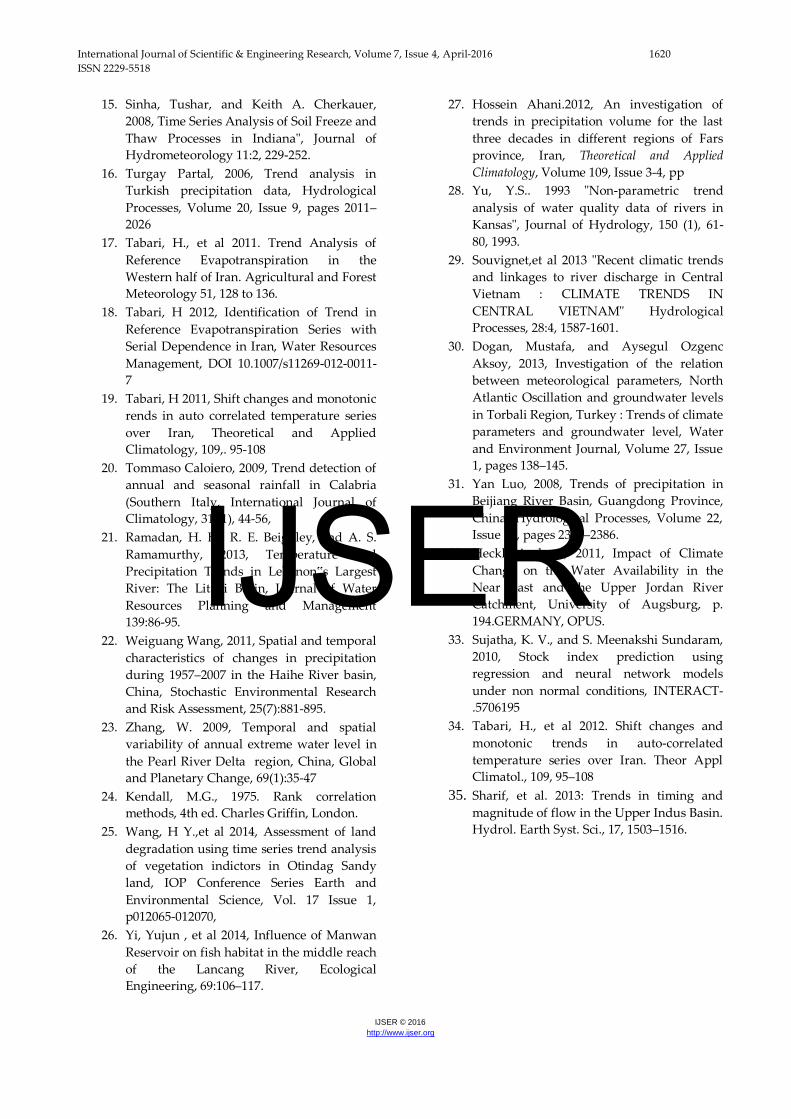
Analysis of maximum, minimum, mean temperature
and annual rainfall has been made with elevation
which is shown in Figure 5-6 below percent per decade
in maximum temperature increase with increase in
elevation whereas minimum temperature deceases
with increase in elevation. Mean Temperature is also
increasing with elevation. Analysis on the relation
between elevation and maximum and mean
temperature indicate increasing trends with higher
temperatures whereas decreasing trend for the
minimum temperature. The maximum and mean
temperature has higher trends in high mountainous
region. The low elevated region (<1300 m) of UIB has
the positive trends ranging from 2% to 9% in annual
precipitation whereas the high mountainous region
(>1300 m) has the cooling trends. The most of sub-
basins of UIB have the increasing trends.
IJSER
International Journal of Scientific & Engineering Research, Volume 7, Issue 4, April-2016 1618
ISSN 2229-5518
IJSER © 2016
http://www.ijser.org
Figure 5-6: Distribution of trends of precipitation, mean, maximum and minimum temperature with
elevation.
5.4 Variablity in Stream flow Trends
The annual discharges of Indus river at Besham Qila
shows increasing trend with the rate of 6%. Sharif, et al;
[35] also analyzed the Indus river flows at Bisham Qila
for the period of 1969 to 1995 and found the increasing
trend. On the other hand the flow at Dainyor has
decreased significantly (p=.006) up to 29% for the
record length (1966 to 2010) and has also found
decreasing trend for period 1966 to 1995 [35]. The trend
in Rivers Shyok at Yogo and Indus at Kharmong,
Kachura and Bunji has the same tendency as detected
by Sharif, et al; [35] with changes up to 24%, 13%, 29%
and 11% respectively. The annual mean flow in Kabul
basin at Nowshera has decreased with p value 0.15 up
to 15%. The River Swat at Kalam has subsiding trend
whereas Swat River at Chakdara and River Chitral at
Chitral showed cumulative tendency.
The average annual runoff showed increasing trend for
rivers Shoyk (at Yogu), Shigar (at Shigar) Indus (at
Kachura) up to 9%, 7% and 5 % respectively due to
warming trend of annual temperature up to 5% (1 0C)
whereas the annual and summer (JJA) stream flow in
river Kabul at Nowshera has come to a diminution up
to 22% and 11% by increasing 4% and 1% (0.96 & 0.22 0C) temperature.
6. CONCLUSIONS
On the basis of 53 (1960-2013) years’ temperature,
precipitation and stream flow data of sixteen
stations, the following conclusion has been drawn.
1. Mann-Kendall test and Sen‟s method has
been applied on the data and After the
analysis on the selected sixteen climate
stations in Upper Indus basin that there is
increase in annual mean and maximum
temperature for the selected period.
2. There is a maximum increase in annul
maximum temperature of 0.49 0C per decade
at 99.9% significant level in the Gilgit station
which is alarming because it’s a very
important zone of UIB because most of the
region around the gilgit is covered with
snow. As a result of increase in temperature
glaciers are melting.
3. In lower region of UIB Cherat, bunji and
Cherat of the regions of upper Indus basin
mean annul temperature has been reduced.
It is concluded that in upper region of UIB
the annul maximum temperature is
increasing whereas in lower region it is
decreasing.
4. In high elevated areas the mean and
maximum temperature is increasing where
as in low elevated areas per decade
IJSER
International Journal of Scientific & Engineering Research, Volume 7, Issue 4, April-2016 1619
ISSN 2229-5518
IJSER © 2016
http://www.ijser.org
minimum temperature has decreasing
trends
5. Out of the selected 16 sixteen climatic
stations the annual precipitation in ten (10)
stations has been increasing in upper Indus
basin. Where as in highly elevated region
percent per decade annual rainfall is
decreasing and in low elevated area it is
increasing.
6. As per annual flow analysis it is concluded
that Indus river at kachura, Shoyk river at
yogu and Shinger river at Shigar showing
increase in flow up to 5%, 9% and 7%
respectively. The flow is increasing due to
the warming trends in Upper Indus Basin.
Whereas average Annul flows of river Kabul
at Nowshera has decreased with p value
0.15 upto 15%.
7. It is concluded from the analysis of
temperature, precipitation and stream flow
that the phenomenon of the climate change
is occurring in the upper Indus basin, it is
alarming for the planner and water experts
to guide and adopt the Integrated
Watershed Management to fulfill the fore
coming food and water demands.
8.
7. ACKNOWLEDGEMENTS
The authors gratefully acknowledged to Higher
Education Commission of Pakistan for affording
financial support to this research, Furthermore, the
PMD, WAPDA for providing the time series of data
for this study.
8. REFERENCES
1. IPCC, 2013, Climate Change The Physical
Science Basis pp 1535.
2. Del Rio, S. 2005, Analysis of recent climatic
variations in Castile and Leon (Spain),
Atmospheric Research 73(1-2):69-85
3. IPCC, 2001. Climate change 2001: synthesis
report. Contribution of Working Group I
and III to the Third Assessment of the
Intergovernmental Panel on Climate Change
(IPCC). Cambridge University Press,
Cambridge.
4. Bates, B. C., Kundzewicz, Z. W., Wu, S. and
Palutikof, J. 2008. Climate Change and
Water. Technical Paper of the
Intergovernmental Panel on Climate
Change, IPCC Secretariat, Geneva.
5. Tahir, A. A. 2011, Snow cover dynamics and
hydrological regime of the Hunza River
basin, Karakoram Range, Northern Pakistan,
Hydrology and Earth System Sciences
Discussions, 409(s 1–2):104–117.
6. Archer, D.R. H.J. Fowler 2008, Using
meteorological data to forecast seasonal
runoff on the River Jhelum, Journal of
Hydrology 361, 10– 23
7. Akhtar, M. 2008, The impact of climate
change on the water resources of
Hindukush-Karakorum-Himalaya region
under different glacier coverage scenarios,
Journal of Hydrology, 355, 148–163
8. Fowler, H. J. and D. R. Archer. 2005. Hydro-
climatological variability in the Upper Indus
Basin and implications for water resources.
Regional Hydrological Impacts of Climatic
Change-Impact Assessment and Decision
Making, T. Wagener et al., Eds., IAHS
Publication, 295: 131–138.
9. Afza1, M., M. A. Haroon., Chaudhary, Q. Z.
2009: Interdecadal Oscillations and the
Warming Trend in the Area-Weighted
Annual Mean Temperature of Pakistan.
Pakistan Journal of Meteorology, 6 (11), 13-
19.
10. Khalida K., and et al 2015. Detection of river
flow trends and variability analysis of upper
indus basin, Pakistan. Sci.Int.(Lahore),27(2),
1261-1270,,2015.
11. Archer, D. R. N. Forsythe, H. J. Fowler, and
S. M. Shah 2010, Sustainability of water
resources management in the Indus Basin
under changing climatic and socio
economic conditions", Hydrology and Earth
System Sciences, 14, 1669-1680,
12. Olofintoye, Oluwatosin, Josiah Adeyemo,
and Fred Otieno, 2012, Impact of Regional
Climate Change on Freshwater Resources
and Operation of the Vanderkloof Dam
System in South Africa, Global Warming-
Impacts and Future Perspectives,
13. Thakur, G. S. 2011, Analysis of groundwater
levels for detection of trend in Sagar district,
Madhya Pradesh, Journal of the Geological
Society of India, vol. 77, no. 4, pp. 303-308
14. Jhajharia, D., 2012, Identification of trends in
rainfall, rainy days and 24h maximum
rainfall over subtropical Assam in Northeast
India, Comptes rendus - Geoscience,
344(8):396-405
IJSER
International Journal of Scientific & Engineering Research, Volume 7, Issue 4, April-2016 1620
ISSN 2229-5518
IJSER © 2016
http://www.ijser.org
15. Sinha, Tushar, and Keith A. Cherkauer,
2008, Time Series Analysis of Soil Freeze and
Thaw Processes in Indiana", Journal of
Hydrometeorology 11:2, 229-252.
16. Turgay Partal, 2006, Trend analysis in
Turkish precipitation data, Hydrological
Processes, Volume 20, Issue 9, pages 2011–
2026
17. Tabari, H., et al 2011. Trend Analysis of
Reference Evapotranspiration in the
Western half of Iran. Agricultural and Forest
Meteorology 51, 128 to 136.
18. Tabari, H 2012, Identification of Trend in
Reference Evapotranspiration Series with
Serial Dependence in Iran, Water Resources
Management, DOI 10.1007/s11269-012-0011-
7
19. Tabari, H 2011, Shift changes and monotonic
rends in auto correlated temperature series
over Iran, Theoretical and Applied
Climatology, 109,. 95-108
20. Tommaso Caloiero, 2009, Trend detection of
annual and seasonal rainfall in Calabria
(Southern Italy, International Journal of
Climatology, 31 (1), 44-56,
21. Ramadan, H. H., R. E. Beighley, and A. S.
Ramamurthy, 2013, Temperature and
Precipitation Trends in Lebanon‟s Largest
River: The Litani Basin, Journal of Water
Resources Planning and Management
139:86-95.
22. Weiguang Wang, 2011, Spatial and temporal
characteristics of changes in precipitation
during 1957–2007 in the Haihe River basin,
China, Stochastic Environmental Research
and Risk Assessment, 25(7):881-895.
23. Zhang, W. 2009, Temporal and spatial
variability of annual extreme water level in
the Pearl River Delta region, China, Global
and Planetary Change, 69(1):35-47
24. Kendall, M.G., 1975. Rank correlation
methods, 4th ed. Charles Griffin, London.
25. Wang, H Y.,et al 2014, Assessment of land
degradation using time series trend analysis
of vegetation indictors in Otindag Sandy
land, IOP Conference Series Earth and
Environmental Science, Vol. 17 Issue 1,
p012065-012070,
26. Yi, Yujun , et al 2014, Influence of Manwan
Reservoir on fish habitat in the middle reach
of the Lancang River, Ecological
Engineering, 69:106–117.
27. Hossein Ahani.2012, An investigation of
trends in precipitation volume for the last
three decades in different regions of Fars
province, Iran, Theoretical and Applied
Climatology, Volume 109, Issue 3-4, pp
28. Yu, Y.S.. 1993 "Non-parametric trend
analysis of water quality data of rivers in
Kansas", Journal of Hydrology, 150 (1), 61-
80, 1993.
29. Souvignet,et al 2013 "Recent climatic trends
and linkages to river discharge in Central
Vietnam : CLIMATE TRENDS IN
CENTRAL VIETNAM" Hydrological
Processes, 28:4, 1587-1601.
30. Dogan, Mustafa, and Aysegul Ozgenc
Aksoy, 2013, Investigation of the relation
between meteorological parameters, North
Atlantic Oscillation and groundwater levels
in Torbali Region, Turkey : Trends of climate
parameters and groundwater level, Water
and Environment Journal, Volume 27, Issue
1, pages 138–145.
31. Yan Luo, 2008, Trends of precipitation in
Beijiang River Basin, Guangdong Province,
China, Hydrological Processes, Volume 22,
Issue 13, pages 2377–2386.
32. Heckl, Andreas, 2011, Impact of Climate
Change on the Water Availability in the
Near East and the Upper Jordan River
Catchment, University of Augsburg, p.
194.GERMANY, OPUS.
33. Sujatha, K. V., and S. Meenakshi Sundaram,
2010, Stock index prediction using
regression and neural network models
under non normal conditions, INTERACT-
.5706195
34. Tabari, H., et al 2012. Shift changes and
monotonic trends in auto-correlated
temperature series over Iran. Theor Appl
Climatol., 109, 95–108
35. Sharif, et al. 2013: Trends in timing and
magnitude of flow in the Upper Indus Basin.
Hydrol. Earth Syst. Sci., 17, 1503–1516.
IJSER