Embed Size (px)
Citation preview

Enhanced precipitation variability effects on water lossesand ecosystem functioning: differential response of aridand mesic regions
Osvaldo E. Sala1,2,3& Laureano A. Gherardi1,3 &
Debra P. C. Peters3,4
Received: 26 June 2014 /Accepted: 15 March 2015 /Published online: 3 April 2015# Springer Science+Business Media Dordrecht 2015
Abstract Climate change will result in increased precipitation variability with more extremeevents reflected in more frequent droughts as well as more frequent extremely wet conditions.The increase in precipitation variability will occur at different temporal scales from intra tointer-annual and even longer scales. At the intra-annual scale, extreme precipitation events willbe interspersed with prolonged periods in between events. At the inter-annual scale, dry yearsor multi-year droughts will be combined with wet years or multi-year wet conditions.Consequences of this aspect of climate change for the functioning ecosystems and their abilityto provide ecosystem services have been underexplored. We used a process-based ecosystemmodel to simulate water losses and soil-water availability at 35 grassland locations in thecentral US under 4 levels of precipitation variability (control, +25, +50+75 %) and sixtemporal scales ranging from intra- to multi-annual variability. We show that the scale oftemporal variability had a larger effect on soil-water availability than the magnitude ofvariability, and that inter- and multi-annual variability had much larger effects than intra-annual variability. Further, the effect of precipitation variability was modulated by meanannual precipitation. Arid-semiarid locations receiving less than about 380 mm yr−1 meanannual precipitation showed increases in water availability as a result of enhanced precipitationvariability while more mesic locations (>380 mm yr−1) showed a decrease in soil water
Climatic Change (2015) 131:213–227DOI 10.1007/s10584-015-1389-z
Electronic supplementary material The online version of this article (doi:10.1007/s10584-015-1389-z)contains supplementary material, which is available to authorized users.
* Osvaldo E. [email protected]
1 School of Life Sciences, Arizona State University, Tempe, AZ 85287-4501, USA2 School of Sustainability, Arizona State University, Tempe, AZ 85287-4501, USA3 Jornada Basin Long Term Ecological Research Program, New Mexico State University, Las Cruces,
NM 88003, USA4 USDA-ARS, Jornada Experimental Range, Las Cruces, NM 88003, USA

availability. The beneficial effects of enhanced variability in arid-semiarid regions resultedfrom a deepening of the soil-water availability profile and a reduction in bare soil evaporation.The deepening of the soil-water availability profile resulting from increase precipitationvariability may promote future shifts in species composition and dominance to deeper-rooted woody plants for ecosystems that are susceptible to state changes. The break point,which has a mean of 380-mm with a range between 440 and 350 mm, is remarkably similar tothe 370-mm threshold of the inverse texture hypothesis, below which coarse-texture soils hadhigher productivity than fine-textured soils.
1 Introduction
Major droughts and floods will become more frequent (Solomon et al. 2007; Field 2012)because of the increase in greenhouse gas concentration, as predicted by models (Singh et al.2013) and as already observed in several regions around the world (Easterling et al. 2000;Christensen and Christensen 2003; Seneviratne et al. 2006; Lewis et al. 2011; Janssen et al.2014). There will be larger precipitation events interspersed with longer periods of droughtswithin a year (Hennessy et al. 1997; Trenberth et al. 2003; Kharin et al. 2007), and there willbe sequences of extreme dry years followed by multi-year extremely wet periods (Seneviratneet al. 2006; Lewis et al. 2011). Mechanisms for the increased precipitation variability at theintra- and inter-annual scales are different (Trenberth et al. 2003). At the intra-annual scale,increased precipitation variability results from the warming of the atmosphere and its increasedwater-holding capacity yielding increases in variability that range from 2.5 % whenconstrained by the troposphere energy budget (Liu et al. 2013) to 7 % per degree Kelvin aspredicted by Clausius-Clapeyron relationship (Trenberth et al. 2003; Kharin et al. 2007).Greenhouse-gas-induced global warming results in increased precipitation variability at theinter-annual scale through other mechanisms, such as intensification of El Niño (Easterlinget al. 2000; Lewis et al. 2011) or large-scale rearrangements of atmospheric circulation such asdisplacement of intertropical convergence (Malhi et al. 2008) or northward shift of climaticzones (Seneviratne et al. 2006).
Effects of changes in precipitation amount and its interactions with other global changedrivers have been explored using experiments and models (Luo et al. 2008). Effects ofprecipitation variability have been studied in plants at short temporal scales (Robinson andGross 2010; Reyer et al. 2013). However, the effects of increased precipitation variability onthe functioning of plants and ecosystems at a continental scale have received much lessattention than effects of directional changes in temperature, precipitation and CO2 concentra-tion (Field 2012). Consequently, there is not a clear understanding of the differential effects ofinter- and intra-annual precipitation variability, or whether increased precipitation variabilitywill have negative or positive effects on ecosystem functioning. The relatively small scientificattention paid to consequences of precipitation variability contrasts with the fact that this topicis now part of the public narrative of climate change. A recent poll reported that 82percent of Americans report that they personally experienced one type of extremeweather in the last year, and a large majority, ranging from 59 to 72 %, believes thatglobal warming made several high profile weather events worse (Leiserowitz et al.2012). Our objective was to elucidate the differential effects of intra- and inter-annualprecipitation variability on soil-water availability, the major determinant of functioningin grasslands, a spatially-extensive ecosystem type that covers nearly 41 % of the
214 Climatic Change (2015) 131:213–227

Earth’s land surface and accounts for an important fraction of the global carbonbudget (Reynolds et al. 2007; Poulter et al. 2014).
We focused on the dry ecoregion of North America including deserts, steppes, mixedgrasslands and temperate prairies (Bailey 1998) (Fig. 1). This 3,200,000 km2 region is an idealsystem to address effects of intra- and inter-annual precipitation variability on water availabil-ity at the continental scale because it has a strong W-E precipitation gradient (100–900 mm)orthogonal to an N-S temperature gradient (11–24 °C). Precipitation ranges from smallamounts and high variability in desert grasslands (mean PPT=240 mm, PPT CV=32 %) tosub-humid grasslands receiving large amounts of precipitation and small variability (meanPPT=835 mm, PPT CV=12 %).
Soil-water availability, as the major determinant of the functioning of ecosystems, limitsplant and microbial growth, and results from a balance between inputs and outputs. The majorinput is precipitation, and major outputs are plant transpiration, bare soil evaporation, and deeppercolation beyond rooting depth. At the plot scale, run-on and runoff have negligible effects.Plant transpiration depends on: (1) evaporative demand that is determined by air temperature,radiation, humidity, and wind speed, and (2) soil water availability (Jackson et al. 2000). Thelatter depends on the amount of water, its distribution in the soil profile, and the distribution ofactive roots in the soil profile (Schulze et al. 1996). A mismatch between the distribution ofactive roots and soil water in the profile can severely constrain transpiration. Bare soilevaporation occurs mostly from the uppermost soil layers and therefore depends on
Fig. 1 Location of the sites where the simulation model was run on a background map of mean annualprecipitation. Site code, name and state are SPOK Spokane, WA; BOI Boise, ID; WINN Winnemucca, NV;LVG Las Vegas, NV; SGM Granite Mountains, CA; DCD Deep Canyon Desert, CA; KING Kingman, AZ, CAPCentral Arizona Phoenix LTER, AZ ; SRE Santa Rita Experimental Range, AZ; WGE Walnut Gulch Experi-mental Range, AZ; SRS Southwest Research Station, CA; JRN Jornada Basin LTER NM; SEV Sevilleta LTER,NM; NWK; CPER Central Plains Experimental Range LTER, CO; CAS Casper, WY; BILL Billings, MO; FTKFort Keogh, MO; SHIELDS Shields, ND; BTN Britton, SD; MINN; CDR Cedar Creek LTER, MN; OMAHOmaha, NE; GOOD Goodland, KS; HAYS Hays Experimental Range, KS; GUY Guymon, OK; SPR SouthernPlains Range Research Station, OK; GRL Grazinglands Research Laboratory, OK; MIDMidland, TX; ROBLEERobert Lee, TX; GSW Grassland Soil and Water Research Laboratory, TX; BBNP Big Bend National Park, TX
Climatic Change (2015) 131:213–227 215
evaporative demand and water availability in those layers. Finally, when upper layers aresaturated and inputs exceed root absorption and soil evaporation, water moves downwardbeyond the layers explored by roots (deep percolation).
This work aimed at addressing four fundamental questions. (1) How are majorpaths of ecosystem-water loss (transpiration, soil evaporation, deep percolation) af-fected by the magnitude of precipitation variability from natural to increased variabil-ity up to 75 %? (2) How are the paths of water loss affected by the scale ofprecipitation variability from intra- to inter annual and longer? (3) How do the effectsof magnitude of variability and its temporal scale on water losses change alongregional gradients of mean annual precipitation (MAP)? (4) How do MAP, variabilitymagnitude, and temporal scale affect water available to plants?
We addressed these questions by performing experimental simulations using aprocess-based model (SOILWAT(Parton 1978)) in which we manipulated the magni-tude of precipitation variability (control, enhanced by 25, 50, or 75 %) and its scale(intra- and inter-annual at 1, 3, 6, 9 and 12 year scales) for 35 grassland locations(Fig. 1). For example, we enhanced intra-annual variability by 25 % by multiplyingeach odd precipitation event by 1.25 and even precipitation event by 0.75 such that atthe end of each year, the total amount was not modified but the variability wasenhanced (S1). In other words, in a hypothetical site that has 30 rainfall events peryear, events 1, 3 …29 were multiplied by 1.25 and events 2, 4, 6…30 by 0.75.Similarly, to enhance variability at the inter-annual or multi-year scale, we multipliedtotal precipitation in each year or group of years by multipliers according to targetvariability magnitudes. Response variables were transpiration, soil evaporation, deeppercolation, and soil water availability for 9 different soil layers. For each locationand experimental simulation, we ran the model for 100 years of modified precipitationwhile maintaining temperature at the recorded levels. Four variability magnitudes * 6temporal scales * 35 sites * 12 response variables * 365 days * 100 years yielded3.67 x 108 outputs for analysis.
Our approach was based on the conceptual framework (eq 1) that the impact of climateEq 1 Impact of climate change=ƒ (Climate Change, Ecosystem Sensitivity)change on ecosystem processes is a function of the degree of climate change and
the sensitivity of ecosystems. In our case, the impact on ecosystem functioningdepends on ecosystem sensitivity to precipitation variability and the degree thatprecipitation variability will increase, which in turn will vary with time into thefuture and magnitude of climate change drivers. Our objective was to assess thesecond part of equation 1, the sensitivity of ecosystems to enhanced precipitationvariability. We chose to explore a range of precipitation variability that wouldencompass changes predicted by global circulation models under various scenarios(Seneviratne et al. 2012). The IPCC special report on extreme events (Seneviratneet al. 2012) predicts for North America a reduction in the 20-yr precipitation returnperiod, relative to late 20th century for the period 2081–2100, ranging from 10 to7 years for the B1 and A2 scenarios. Our experimental simulations reduced the 20-yrreturn time of annual precipitation from 18 years up to 3 years (Fig. 2). Theexperimental return period depended on the scale at which we modified precipitationvariability and the magnitude of the manipulation. Intra-annual variability had asmaller effect than interannual; and the higher the simulated precipitation variabilitythe smaller the return period.
216 Climatic Change (2015) 131:213–227

2 Materials and methods
2.1 Modeling approach
We used the simulation model SOILWAT (Parton 1978) that has been used extensively inseveral ecosystems around the world encompassing different vegetation types from deserts andgrassland to shrublands and forests (Parton et al. 1987; Parton et al. 1988; Sala et al. 1992;Lauenroth et al. 1993; Lauenroth et al. 1994; Coffin and Lauenroth 1996; Peters 2000 ; Partonet al. 2001a; Parton et al. 2001b; Lauenroth and Bradford 2009; 2012; Lauenroth et al. 2014).This model has proven to be a reliable tool to examine relationships among variables anddrivers, to integrate experimental results, and to explore ecosystem responses beyond thespatial and temporal domain of the experiments. We used the ecosystem model SOILWAT(Parton 1978) in all 35 locations in our study area (Fig. 1) under both current climate andscenarios of enhanced precipitation variability.
2.2 Model description
SOILWAT is a multi-layer, daily time-step model that simulates soil water content (SWC) bydepth in the soil profile (Parton 1978; Peters et al. 2010). Processes simulated in SOILWATinclude water interception and subsequent evaporation from the plant canopy and litter, waterinfiltration into the soil, vertical water flow among soil layers, evaporation and transpirationfrom each soil layer, and soil water content by layer. SOILWAT does not model run-on and run
Fig. 2 Return period (in years) of extreme events for all modeled climate treatments. Extreme wet (a) and dry(b) events are defined as precipitation years wetter than the 95th and drier than the 5th percentile of the ambientprecipitation normal distribution. Dashes indicate the mean return period for the 100-year modeled climate foreach treatment
Climatic Change (2015) 131:213–227 217
off assuming that they cancel each other and/or that the simulated plots are located on flatterrain. While run off is important to address watershed-scale questions, it is not necessary forthe current study that focuses on the plot scale. Evaporation only occurs from the uppermostlayers of the soil. SOILWAT requires input information about weather, soil properties andvegetation. Weather inputs include daily precipitation and temperature, and monthly relativehumidity, wind speed and cloud cover. Soil properties for each of nine layers (0–5 cm, 5–10 cm, 10–15 cm, 15–20 cm, 20–30 cm, 30–40, 40–50, 50–80 , 80–100 cm) consist of texture(% sand, silt, clay) and % rocks by volume. Field capacity and wilting point are calculated foreach layer based on texture of the soil volume.
2.3 Experimental simulations
First, we run the model SOILWAT for average climate conditions for 100 years. Then, weperformed several experiments by generating future climate with increased precipitationvariability. We increased intra-annual precipitation variability by 25, 50, and 75 %. In orderto increase variability by 25 %, in a 100-yr sequence of precipitation events, we added 25 % toodd events and subtracted 25 % from even events. So at the end, each treatment had the sametotal precipitation than the control but the variability was enhanced (See ElectronicSupplementary material S1). We repeated the same exercise with 50 and 75 % enhancedvariance. A second experiment comprised altering variability at the inter-annual scale. In thiscase, we added 25 % to all the events in odd years and subtracted 25 % to all events in evenyears in the 100-year record, so at the end of the 100-year period total precipitation was thesame as control but the variability was 25 % higher (S1). We repeated the experiment for 50and 75 % increased variability. Finally, we enhanced precipitation variability at the 3, 6, 9 and12-year scale. For example, in the 3-year case, we added 25 % to each event in the first 3 years(years 1–3), subtracted 25 % in the following 3 years (years 4–6), and added 25 % for years 7–9. We followed the same pattern until the end of the 100 year period and increased variabilityfor 6, 9 and 12-year variability treatments following the same procedure. We repeated thisexercise for 35 locations that encompass the climatic variability of North American arid to sub-humid ecosystems that range from deserts to temperate grasslands (Fig. 1). This regionrepresents most of the climatic variability of global drylands (Bailey 1998).
2.4 Statistical analyses
All data analyses were performed in R v. 2.12 (R Development Core Team 2012). We ranANCOVA analyses for each response variable at each variability temporal scale. Each linearmodel included one response variable (transpiration, evaporation, percolation or wet-soil days)as a function of one continuous variable (mean annual precipitation) and one categoricalvariable (variability magnitude treatments: control, +25, +50 and +75 %) as a covariate. Thecontrol treatment was used as a baseline to which we contrasted all other levels of increasedprecipitation variability. Interaction terms between each increased precipitation variability andmean annual precipitation were included in all cases but dropped when they were notsignificant. In order to test the significance of the break point we also ran separate analysesfor sites where MAP falls below (Site MAP<38 cm) around (28 cm<Site MAP<48 cm) andabove (Site MAP>38) the break point. We used 5 % significance level for single test analysesand adjusted our alpha value in order to maintain a 5 % family wise significance level onmulti-test analyses using the Bonferroni adjusted p-value (Wright 1992). Supplementary tables
218 Climatic Change (2015) 131:213–227

present analyses on transpiration and evaporation (S2) and percolation and wet-soildays (S2b).
2.5 Model parameterization
We collected daily precipitation and temperature, and monthly relative humidity, wind speedand cloud cover data for the 35 locations (Fig. 1) from US National Climate Data Center(NCDC; (http://www.ncdc.noaa.gov/oa/ncdc.html). Then, we used these data in a first-orderMarkov analysis to generate 100 years of daily climate variables for each site (Minnick andCoffin 1999; Peters 2000). A Markov analysis retains the pattern of rainfall amount observedin the historic data. To avoid confounding continental climate and soil patterns, the model useda single soil profile representing a sandy-loam soil (58 % sand, 19 % clay). Given that ourquestions were about precipitation variability, we kept soil characteristics constant. Werepeated the same analysis with clay-loam soils (32 % sand, 34 % clay) and found the samepatterns. Consequently, clay-loam results are not reported here. We used SOILWAT to modelthe effect of precipitation variability on several ecosystem-level variables across a broad rangeof climatic conditions. Although those conditions coincide with different vegetation types froma biogeographical point of view (Bailey 1998), SOILWAT was not parameterized differentlyfor each vegetation type assuming that ecosystem characteristics do not change independentlyof climate but they are determined by climate.
2.6 Response variables
Runs of SOILWAT for 100 years and experiments generated a large volume of data. In order toaddress the central questions of this work, we report on a synthetic variable of soil-wateravailability and the three major losses of water from the soil: plant transpiration, soil evapo-ration, and deep percolation. Because it was difficult to report soil water content for everysingle layer, day and experimental condition, we chose to use the number days in which thesoil water potential was above −1 MPa. Changing this threshold to define wet conditions to−1.5 MPa did not modify any of the results and conclusions.
3 Results
Transpiration increased with mean annual precipitation (MAP) from arid to semiarid and sub-humid ecosystems (Fig. 3a-c and S2 a-c). The magnitude of precipitation variability haddifferent effects on transpiration depending on the scale of variability and the MAP of the site.At the intra-annual scale, we found no effect of increased precipitation variability on transpi-ration. However, at the inter-annual scales, enhanced variability resulted in an increase intranspiration for sites with low MAP and reduced transpiration for sites with high MAP. TheMAP value at which the enhanced variability model crossed the control, or the MAP at whichthere was no effect between control and enhanced precipitation variability, ranged between 440and 350 mm yr−1 for the different treatments with a mean of 380 mm yr−1.
A detailed statistical analysis that divided the precipitation gradient in three segments,<380, 280–480, >380 mm yr−1, reinforced the pattern reported above regarding the effects ontranspiration of magnitude of precipitation variability and the scale of variability, from intra-annual to inter-annual and multi-year (Table 1). Sites with MAP below 380 mm yr−1 showed
Climatic Change (2015) 131:213–227 219

Fig. 3 Effects of precipitation variability and its scale on plant transpiration, soil evaporation, deep percolationand soil water availability for 35 locations along a gradient of mean annual precipitation. a-c plant transpiration(cm yr−1), d-f soil evaporation (cm yr−1), g-i deep percolation(cm yr−1) and j-l soil water availability (number ofdays per year when average soil water potential was greater than −1 MPa). ). a,d,g,j show results of changes inintra-annual variability; b,e,h k show results of enhanced precipitation at the 3-year scale and c,f,i,l show resultsat the 6-year scale. Each data point represents one of the 35 locations for each treatment and lines are regressionlines per treatment. Control (black dots and lines), enhanced precipitation variability by 25 % (green), 50 %(blue) and 75 % (red). Slope of each model is indicated as b and R squared values correspond to overallANCOVA R squared for each variable at each variability scale. Different letters associated with the slopesindicate significant (p<0.05) differences versus control. Details of statistical analyses can be found in S2a andS2b
220 Climatic Change (2015) 131:213–227

Tab
le1
Estim
ates
ofslopes
oflin
earregression
modelsof
ANCOVAcoefficientsfortranspirationas
functio
nof
meanannualprecipitatio
nforthreelevelsof
precipitatio
nvariability
(control,+25,+50,+75
%)forandtwotemporalscales
ofprecipitationvariability
(Intra-annualandsix-year
inter-annual).The
sameanalysiswas
repeated
forsitesbelow
38cm
,between28
cmand48
cm,and
over
38cm
meanannualprecipitatio
n.Estim
ates
arethemeandifference
ofeach
treatm
enttothecontrol(Tcm
yr-1/cm
yr-1
MAP).P
ositive
values
indicate
that
theregression
lineforatreatm
entisabovethecontrolandnegativevalues
indicate
theopposite.Asterisks
indicate
significantdifferencesat
5%
andperiod
indicate
significantdifference
at10%
familywiselevelof
significance
SiteMAP<38
cmTranspiration
Evaporatio
nPercolation
Wet-soildays
Variabilityscale
Variabilityscale
Variabilityscale
Variabilityscale
Variabilitymagnitude
Intra-annual
6-year
inter-annual
Intra-annual
6-year
inter-annual
Intra-annual
6-year
inter-annual
Intra-annual
6-year
inter-annual
25%
0.21
ns
0.45
ns
−0.18
ns
−0.31
ns0.01
ns0.09
ns
2.08
ns
2.5
ns
50%
0.86
ns
1.32
.−0
.8ns
−1.27
.0.05
ns0.44
ns
7.98
ns
7.83
ns
75%
1.85
*2.45
*−1
.68
*−2
.76
*0.14
ns1.19
*16.98
*14.28
*
28<SiteMAP<48
cm
Variabilityscale
Variabilityscale
Variabilityscale
Variabilityscale
Variabilitymagnitude
Intra-annual
6-year
inter-annual
Intra-annual
6-year
inter-annual
Intra-annual
6-year
inter-annual
Intra-annual
6-year
inter-annual
25%
0.18
ns
0.15
ns
−0.18
ns
−0.26
ns0.04
ns0.48
ns
1.84
ns
0.75
ns
50%
0.75
ns
0.26
ns
−0.72
ns
−1.24
*0.15
ns1.84
.6.76
ns
−0.81
ns
75%
1.68
ns
0.94
ns
−1.37
*−3
.17
*0.39
ns3.96
*14.69
ns
−1.09
ns
SiteMAP>38
cm
Variabilityscale
Variabilityscale
Variabilityscale
Variabilityscale
Variabilitymagnitude
Intra-annual
6-year
inter-annual
Intra-annual
6-year
inter-annual
Intra-annual
6-year
inter-annual
Intra-annual
6-year
inter-annual
25%
0.17
ns
−0.74
ns
−0.08
ns
−0.19
ns0.13
ns1.6
ns
1.44
ns
−6.62
ns
50%
0.61
ns
−2.75
*−0
.33
ns
−0.97
.0.58
ns5.5
*4.02
ns
−27.22
*
75%
1.58
ns
−3.86
*−0
.53
ns
−2.63
*1.58
*10.47
*8.69
ns
−40.32
*
Climatic Change (2015) 131:213–227 221
an increase in transpiration with increasing precipitation variability; sites receivingbetween 280 and 480 mm of annual precipitation showed no effect of variability, andsites above 380 mm yr−1 showed a negative effect of precipitation variability. Anotherimportant aspect of this analysis is that the effect of the scale of variability is largerthan the effect of the magnitude of variability. At the intra-annual scale, there was asignificant effect only at 75 % enhanced precipitation variability in the<380 mm yr−1
group. In the case of the six-year inter-annual scale of variability, there were signif-icant differences in both regions below and above 380 mm yr−1, and for 50 and 75 %enhanced precipitation variability.
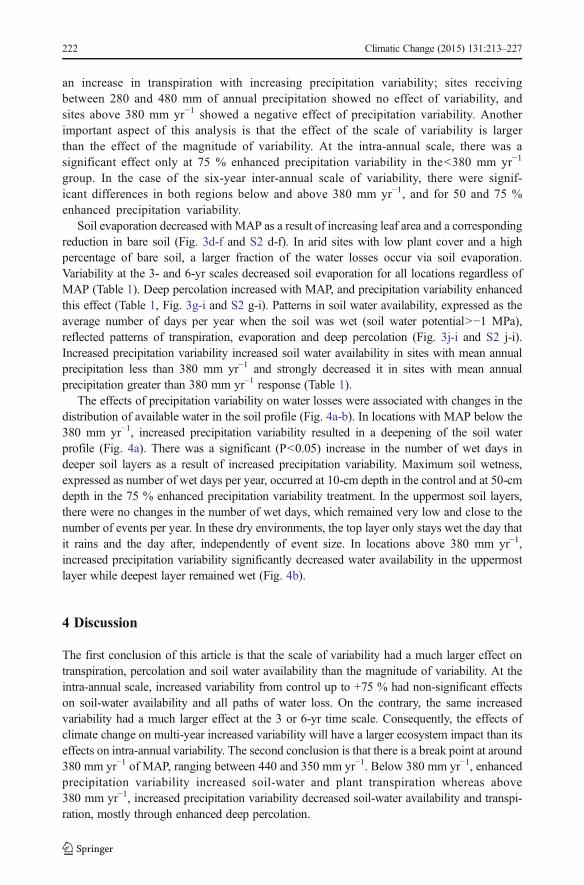
Soil evaporation decreased with MAP as a result of increasing leaf area and a correspondingreduction in bare soil (Fig. 3d-f and S2 d-f). In arid sites with low plant cover and a highpercentage of bare soil, a larger fraction of the water losses occur via soil evaporation.Variability at the 3- and 6-yr scales decreased soil evaporation for all locations regardless ofMAP (Table 1). Deep percolation increased with MAP, and precipitation variability enhancedthis effect (Table 1, Fig. 3g-i and S2 g-i). Patterns in soil water availability, expressed as theaverage number of days per year when the soil was wet (soil water potential>−1 MPa),reflected patterns of transpiration, evaporation and deep percolation (Fig. 3j-i and S2 j-i).Increased precipitation variability increased soil water availability in sites with mean annualprecipitation less than 380 mm yr−1 and strongly decreased it in sites with mean annualprecipitation greater than 380 mm yr−1 response (Table 1).
The effects of precipitation variability on water losses were associated with changes in thedistribution of available water in the soil profile (Fig. 4a-b). In locations with MAP below the380 mm yr−1, increased precipitation variability resulted in a deepening of the soil waterprofile (Fig. 4a). There was a significant (P<0.05) increase in the number of wet days indeeper soil layers as a result of increased precipitation variability. Maximum soil wetness,expressed as number of wet days per year, occurred at 10-cm depth in the control and at 50-cmdepth in the 75 % enhanced precipitation variability treatment. In the uppermost soil layers,there were no changes in the number of wet days, which remained very low and close to thenumber of events per year. In these dry environments, the top layer only stays wet the day thatit rains and the day after, independently of event size. In locations above 380 mm yr−1,increased precipitation variability significantly decreased water availability in the uppermostlayer while deepest layer remained wet (Fig. 4b).
4 Discussion
The first conclusion of this article is that the scale of variability had a much larger effect ontranspiration, percolation and soil water availability than the magnitude of variability. At theintra-annual scale, increased variability from control up to +75 % had non-significant effectson soil-water availability and all paths of water loss. On the contrary, the same increasedvariability had a much larger effect at the 3 or 6-yr time scale. Consequently, the effects ofclimate change on multi-year increased variability will have a larger ecosystem impact than itseffects on intra-annual variability. The second conclusion is that there is a break point at around380 mm yr−1 of MAP, ranging between 440 and 350 mm yr−1. Below 380 mm yr−1, enhancedprecipitation variability increased soil-water and plant transpiration whereas above380 mm yr−1, increased precipitation variability decreased soil-water availability and transpi-ration, mostly through enhanced deep percolation.
222 Climatic Change (2015) 131:213–227

The mechanism of the effects of precipitation variability on water availability with differ-ential effects on arid and mesic grasslands is related to its effects on water distribution in thesoil profile (Fig. 4a-b). In ecosystems with MAP below 380 mm yr−1, enhanced variability at 3and 6-years shifted the soil-water profile downwards (Fig. 4a). Consequently, there was areduction in bare soil evaporation, which occurs only from the uppermost layer, and anincrease in transpiration. Because the total amount of precipitation is low, enhanced precipi-tation variability did not affect deep percolation, which in all cases was negligible. Ingrasslands with MAP above 380 mm yr−1, enhanced precipitation variability also shifted thesoil-water availability profile downwards with a reduction in soil water in the uppermostlayers. This change in the distribution of soil water towards deeper soil layers significantlyincreased deep percolation and had small effect on soil evaporation, which is already verysmall in humid ecosystems with high plant cover and minimum bare soil. The increased in
Fig. 4 Effects of precipitation variability on the distribution of water in the soil profile as modulated by meanannual precipitation. a for all sites with mean annual precipitation below 380 mm yr−1 and b for sites with meanannual precipitation above 380 mm yr−1. Soil water availability is expressed as the average number of days whensoil water potential was above -1 MPa. Control (black line), enhanced precipitation variability at the 9-yr scale by25 % (green), 50 % (blue) and 75 % (red). Comparisons among variability treatments for each depth are depictedby letters. Each letter indicates the significance difference of each treatment represented by the color at eachdepth. ns indicates non-significant differences at the indicated depth
Climatic Change (2015) 131:213–227 223
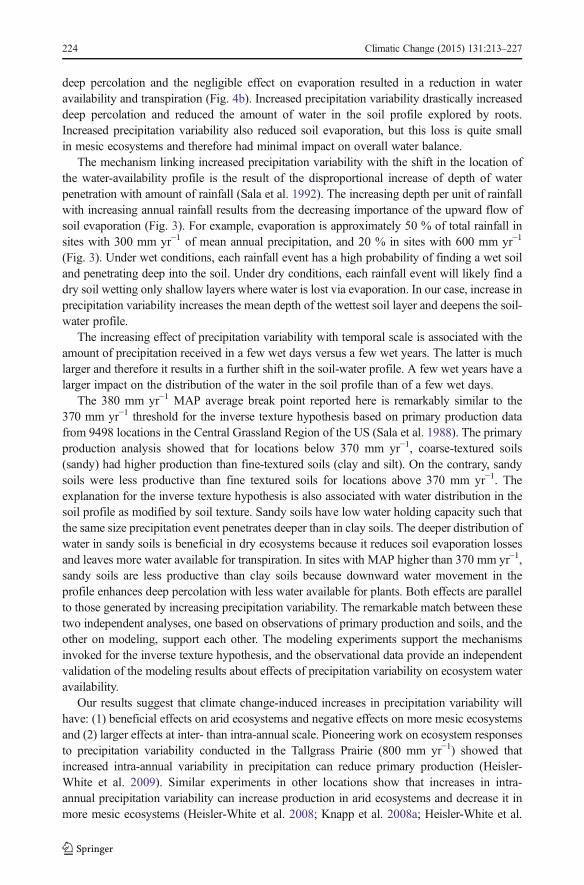
deep percolation and the negligible effect on evaporation resulted in a reduction in wateravailability and transpiration (Fig. 4b). Increased precipitation variability drastically increaseddeep percolation and reduced the amount of water in the soil profile explored by roots.Increased precipitation variability also reduced soil evaporation, but this loss is quite smallin mesic ecosystems and therefore had minimal impact on overall water balance.
The mechanism linking increased precipitation variability with the shift in the location ofthe water-availability profile is the result of the disproportional increase of depth of waterpenetration with amount of rainfall (Sala et al. 1992). The increasing depth per unit of rainfallwith increasing annual rainfall results from the decreasing importance of the upward flow ofsoil evaporation (Fig. 3). For example, evaporation is approximately 50 % of total rainfall insites with 300 mm yr−1 of mean annual precipitation, and 20 % in sites with 600 mm yr−1
(Fig. 3). Under wet conditions, each rainfall event has a high probability of finding a wet soiland penetrating deep into the soil. Under dry conditions, each rainfall event will likely find adry soil wetting only shallow layers where water is lost via evaporation. In our case, increase inprecipitation variability increases the mean depth of the wettest soil layer and deepens the soil-water profile.
The increasing effect of precipitation variability with temporal scale is associated with theamount of precipitation received in a few wet days versus a few wet years. The latter is muchlarger and therefore it results in a further shift in the soil-water profile. A few wet years have alarger impact on the distribution of the water in the soil profile than of a few wet days.
The 380 mm yr−1 MAP average break point reported here is remarkably similar to the370 mm yr−1 threshold for the inverse texture hypothesis based on primary production datafrom 9498 locations in the Central Grassland Region of the US (Sala et al. 1988). The primaryproduction analysis showed that for locations below 370 mm yr−1, coarse-textured soils(sandy) had higher production than fine-textured soils (clay and silt). On the contrary, sandysoils were less productive than fine textured soils for locations above 370 mm yr−1. Theexplanation for the inverse texture hypothesis is also associated with water distribution in thesoil profile as modified by soil texture. Sandy soils have low water holding capacity such thatthe same size precipitation event penetrates deeper than in clay soils. The deeper distribution ofwater in sandy soils is beneficial in dry ecosystems because it reduces soil evaporation lossesand leaves more water available for transpiration. In sites with MAP higher than 370 mm yr−1,sandy soils are less productive than clay soils because downward water movement in theprofile enhances deep percolation with less water available for plants. Both effects are parallelto those generated by increasing precipitation variability. The remarkable match between thesetwo independent analyses, one based on observations of primary production and soils, and theother on modeling, support each other. The modeling experiments support the mechanismsinvoked for the inverse texture hypothesis, and the observational data provide an independentvalidation of the modeling results about effects of precipitation variability on ecosystem wateravailability.
Our results suggest that climate change-induced increases in precipitation variability willhave: (1) beneficial effects on arid ecosystems and negative effects on more mesic ecosystemsand (2) larger effects at inter- than intra-annual scale. Pioneering work on ecosystem responsesto precipitation variability conducted in the Tallgrass Prairie (800 mm yr−1) showed thatincreased intra-annual variability in precipitation can reduce primary production (Heisler-White et al. 2009). Similar experiments in other locations show that increases in intra-annual precipitation variability can increase production in arid ecosystems and decrease it inmore mesic ecosystems (Heisler-White et al. 2008; Knapp et al. 2008a; Heisler-White et al.
224 Climatic Change (2015) 131:213–227
2009; Thomey et al. 2011). These results at the intra-annual scale support the findings of ourmodeling experiments. However, we are not aware of experimental manipulations of precip-itation variability at the inter-annual scale across a range of grassland types. We speculate thatplant community dynamics, which were not included in our modeling effort, will become moreimportant at the inter-annual scale. Death of individuals or plant parts during prolongeddrought (Reichmann et al. 2013; Reichmann and Sala 2014) may constrain the ability of aridecosystems from benefiting from increased water availability associated with higher precipi-tation variability. Our simulation model yields results that are compatible with the Knappconceptual model (2008b) although both are different. Knapp’s model is based on plantphysiology concepts, while ours is based on first principles of soil physics. The Knapp modelassumes that there are anoxia and drought thresholds and that plants in xeric systems underambient conditions are mostly below the drought threshold and increasing precipitationvariability puts them above this threshold. In hydric systems and under ambient conditions,plants are between the anoxia and drought thresholds and increasing precipitation variabilityputs them above the anoxia threshold.
Another consequence of climate-change-induced increased precipitation variability and theresulting downward shift in the soil water profile is that it may lead to changes in plant-speciescomposition favoring deep rooted over shallow rooted species. These circumstances mayaccelerate the process of woody-plant encroachment (Barger et al. 2011) where shallow-rooted grasses are being replaced by deep-rooted woody plants. This phenomenon is alreadyprevalent with woody-cover increasing at a rate of ranging from 0.5 to 2 % per year andcosting large sums of money in several control practices, such as burning or herbicide spraying(Archer and Predick 2014; Ratajczak et al. 2014). Just in the US and between 2005 and 2009,the Natural Resource Conservation Service has spent $127 M in brush control (Tanaka et al.2011). A recent study reported that woody-plant encroachment in North and South Americaresults in significant decreases in livestock production, which is one of the major ecosystemservices of drylands (Anadón et al. 2014). Regardless of the current origin of this phenomenon,our results suggest that it will be accelerated as a result of the expected increase in precipitationvariability.
Acknowledgments The authors thank Haitao Huang for model simulations, reviewers and editor for positivesuggestions that significantly improved the manuscript and finally G.A. Gil and D. Correa for assistance andguidance. This research was financially supported by NSF DEB 09–17668 and DEB 12–35828.
References
Anadón JD, Sala OE, Turner BL, Bennett EM (2014) The effect of woody-plant encroachment on livestockproduction in North and South America. Proc Natl Acad Sci U S A 111:12948–12953. doi:10.1073/pnas.1320585111
Archer SR, Predick KI (2014) An ecosystem services perspective on brush management: research priorities forcompeting land-use objectives. J Ecol 102:1394–1407. doi:10.1111/1365-2745.12314
Bailey RG (1998) Ecoregions: the ecosystem geography of the oceans and continents. Springer, New YorkBarger NN, Archer SR, Campbell JL, Huang Cy, Morton JA, Knapp AK (2011) Woody plant proliferation in
North American drylands: a synthesis of impacts on ecosystem carbon balance Journal of GeophysicalResearch 116
Christensen JH, Christensen OB (2003) Climate modelling: severe summertime flooding in Europe. Nature 421:805–806. doi:10.1038/421805a
Coffin D, Lauenroth W (1996) Transient responses of North-American grasslands to changes in climate. ClimChang 34:269–278. doi:10.1007/bf00224638
Climatic Change (2015) 131:213–227 225

Easterling DR, Meehl GA, Parmesan C, Changnon SA, Karl TR, Mearns LO (2000) Climate extremes:observations, modeling, and impacts. Science 289:2068–2074
Field CB (2012) Managing the risks of extreme events and disasters to advance climate change adaptation:special report of the intergovernmental panel on climate change. Cambridge University Press, Cambridge
Heisler-White JL, Knapp AK, Kelly EF (2008) Increasing precipitation event size increases aboveground netprimary productivity in a semi-arid grassland. Oecologia 158:129–140. doi:10.1007/s00442-008-1116-9
Heisler-White JL, Blair JM, Kelly EF, Harmoney K, Knapp AK (2009) Contingent productivity responses tomore extreme rainfall regimes across a grassland biome. Glob Change Biol 15:2894–2904. doi:10.1111/j.1365-2486.2009.01961.x
Hennessy KJ, Gregory JM, Mitchell JFB (1997) Changes in daily precipitation under enhanced greenhouseconditions. Clim Dyn 13:667–680. doi:10.1007/s003820050189
Jackson RB, Sperry JS, Dawson TE (2000) Root water uptake and transport: using phisiological processes inglobal predictions. Trends Plant Sci 5:482–488
Janssen E, Wuebbles DJ, Kunkel KE, Olsen SC, Goodman A (2014) Observational‐and model‐based trends andprojections of extreme precipitation over the contiguous United States Earth’s. Future 2:99–113
Kharin VV, Zwiers FW, Zhang XB, Hegerl GC (2007) Changes in temperature and precipitation extremes in theIPCC ensemble of global coupled model simulations. J Clim 20:1419–1444. doi:10.1175/jcli4066.1
Knapp AK et al (2008a) Consequences of more extreme precipitation regimes for terrestrial ecosystems.Bioscience 58:811–821. doi:10.1641/b580908
Knapp AK et al (2008b) Shrub encroachment in North American grasslands: shifts in growth form dominancerapidly alters control of ecosystem carbon inputs. Glob Change Biol 14:615–623
Lauenroth WK, Bradford JB (2009) Ecohydrology of dry regions of the United States: precipitation pulses andintraseasonal drought. Ecohydrology 2:173–181. doi:10.1002/eco.53
Lauenroth WK, Bradford JB (2012) Ecohydrology of dry regions of the United States: water balance conse-quences of small precipitation events. Ecohydrology 5:46–53. doi:10.1002/eco.195
Lauenroth WK, Urban DL, Coffin DP, Parton WJ, Shugart HH, Kirchner TB, Smith TM (1993) Modelingvegetation structure-ecosystem process interactions across sites and ecosystems. Ecol Model 67:49–80. doi:10.1016/0304-3800(93)90099-E
Lauenroth WK, Sala OE, Coffin CP, Kirchner TB (1994) The importance of soil water in the recruitment ofBouteloua gracilis in the shortgrass steppe. Ecol Appl 4:741–749
Lauenroth WK, Schlaepfer DR, Bradford JB (2014) Ecohydrology of dry regions: storage versus pulse soil.Water Dynam Ecosyst 17:1469–1479. doi:10.1007/s10021-014-9808-y
Leiserowitz A, Maibach E, Roser-Renouf C, Hmielowski JD (2012) Extreme weather. Climate & Preparednessin the American Mind, New Haven
Lewis SL, Brando PM, Phillips OL, van der Heijden GMF, Nepstad D (2011) The 2010 amazon drought. Science331:554–554. doi:10.1126/science.1200807
Liu J, Wang B, Cane MA, Yim S-Y, Lee J-Y (2013) Divergent global precipitation changes induced by naturalversus anthropogenic forcing. Nature 493:656–659
Luo Yet al (2008) Modeled interactive effects of precipitation, temperature, and [CO2] on ecosystem carbon andwater dynamics in different climatic zones. Glob Change Biol 14:1986–1999. doi:10.1111/j.1365-2486.2008.01629.x
Malhi Y, Roberts JT, Betts RA, Killeen TJ, Li WH, Nobre CA (2008) Climate change, deforestation, and the fateof the Amazon. Science 319:169–172. doi:10.1126/science.1146961
Minnick TJ, Coffin DP (1999) Geographic patterns of simulated establishment of two Bouteloua species:implications for distributions of dominants and ecotones. J Veg Sci 10:343–356
Parton WJ (1978) Abiotic section of ELM. In: Innis GS (ed) Grassland simulation model, vol ecological studies,26th edn. Springer, New York, pp 31–53
Parton W, Schimel DS, Cole C, Ojima D (1987) Analysis of factors controlling soil organic matter levels in GreatPlains grasslands. Soil Sci Soc Am J 51:1173–1179
Parton WJ, Stewart JW, Cole CV (1988) Dynamics of C, N, P and S in grassland soils: a model. Biogeochemistry5:109–131
Parton W et al (2001a) Generalized model for NOx and N2O emissions from soils. J Geophys Res 106:17403–17419
Parton WJ, Morgan JA, Kelly RH, Ojima DS (2001b) Modeling soil C responses to environmental change ingrassland ecosystems. CRC Press, Boca Raton
Peters D (2000) Climatic variation and simulated patterns in seedling establishment of two dominant grasses at asemiarid-arid grassland ecotone. J Veg Sci 11:493–504
Peters DPC, Herrick JE, Monger HC, Huang HT (2010) Soil-vegetation-climate interactions in arid landscapes:effects of the North American monsoon on grass recruitment. J Arid Environ 74:618–623. doi:10.1016/j.jaridenv.2009.09.015
226 Climatic Change (2015) 131:213–227

Poulter B et al. (2014) Contribution of semi-arid ecosystems to interannual variability of the global carbon cycleNature advance online publication doi:10.1038/nature13376
R Development Core Team (2012) R: a language and environment for statistical computing, version: 2.14, 2ndedn. R Foundation for Statistical Computing, Vienna
Ratajczak Z, Nippert JB, Briggs JM, Blair JM (2014) Fire dynamics distinguish grasslands, shrublands andwoodlands as alternative attractors in the Central Great Plains of North America. J Ecol 102:1374–1385. doi:10.1111/1365-2745.12311
Reichmann LG, Sala OE (2014) Differential sensitivities of grassland structural components to changes inprecipitation mediate productivity response in a desert ecosystem. Funct Ecol 28:1292–1298. doi:10.1111/1365-2435.12265
Reichmann LG, Sala OE, Peters DPC (2013) Precipitation legacies in desert-grassland primary production occurthrough previous-year tiller density. Ecology 94:435–443. doi:10.1890/12-1237.1
Reyer CP et al (2013) A plant’s perspective of extremes: terrestrial plant responses to changing climaticvariability. Glob Chang Biol 19:75–89
Reynolds JF et al (2007) Global desertification: building a science for dryland development. Science 316:847–851
Robinson TM, Gross KL (2010) The impact of altered precipitation variability on annual weed species. Am J Bot97:1625–1629
Sala OE, Parton WJ, Lauenroth WK, Joyce LA (1988) Primary production of the central grassland region of theUnited States. Ecology 69:40–45. doi:10.2307/1943158
Sala OE, Lauenroth WK, Parton WJ (1992) Long term soil water dynamics in the shortgrass steppe. Ecology 73:1175–1181
Schulze ED et al (1996) Rooting depth, water availability, and vegetation cover along an aridity gradient inPatagonia. Oecologia 108:503–511
Seneviratne SI, Luthi D, Litschi M, Schar C (2006) Land-atmosphere coupling and climate change in Europe.Nature 443:205–209. doi:10.1038/nature05095
Seneviratne SI et al. (2012) Changes in climate extremes and their impacts on the natural physical environmentManaging the risks of extreme events and disasters to advance climate change adaptation:109–230
Singh D, Tsiang M, Rajaratnam B, Diffenbaugh NS (2013) Precipitation extremes over the continental UnitedStates in a transient, high‐resolution, ensemble climate model experiment. J Geophys Res: Atmospher 118:7063–7086
Solomon S et al (eds) (2007) Climate change 2007: the physical science basis. Cambridge University Press,Cambridge
Tanaka JA, Brunson M, Torell LA (2011) A social and economic assessment of rangeland conservation practices.In: Briske DD (ed) Conservation benefits of rangeland practices: assessment, recommendations, andknowledge gaps. Natural Resources Conservation Service, Washington, DC, pp 371–422
Thomey ML, Collins SL, Vargas R, Johnson JE, Brown RF, Natvig DO, Friggens MT (2011) Effect ofprecipitation variability on net primary production and soil respiration in a Chihuahuan Desert grassland.Glob Change Biol 17:1505–1515. doi:10.1111/j.1365-2486.2010.02363.x
Trenberth KE, Dai A, Rasmussen RM, Parsons DB (2003) The changing character of precipitation. Bull AmMeteorol Soc 84:1205–1218
Wright SP (1992) Adjusted p-values for simultaneous inference Biometrics:1005–1013
Climatic Change (2015) 131:213–227 227