Embed Size (px)
Citation preview
I
Assessment of Heavy Metals Pollution of Wadi Gaza, Eastern
Mediterranean Coast, Palestine
السبحل الشرقي للبحر الابيض الوتوسط،ةلتلوث ببلوعبدى الثقيلت لوادي غزتقيين ا
فلسطيي -
By
Mohammed Falah El-Turk
Supervisor
Prof. Mohammad R. Al-Agha
A Thesis Submitted in Partial Fulfillment of the Requirement for the
Degree of Master of Science in Environmental Sciences
The Islamic University – Gaza – Palestine
2014
زةـــــــــغ –الجبهعت الاسلاهيت
بــــــــــــــعوبدة الدراسبث العلي
ومــــــــت العلـــــــــــــليـــــــــــك
يتـبربهج هبجستير العلوم البيئ
يتــــــت البيئــــــوراقبالادارة وال
Islamic University - Gaza
Deanship of Graduate Studies
Faculty of Science
Master of Environmental
Sciences
Environmental Monitoring
and Management
II
بسم الله الرحمن الرحيم
الله شفع ) ا انز كهى آيه ي انز ا ره ه أه الله دسجبد ى انع ب ث
هه ( خج ش رع
11آخ سقىسسح انجبدنخ
III
First of all I praise Allah for blessings and guidance in fulfilling
this goal.
I would like to take this opportunity to sincerely thank all
individuals who have helped me in this effort. Primarily, I would
like to thank my supervisor Prof. Mohammad R. Al-Agha. for
his unlimited guidance, encouragement, and support. I am really
indebted to this man for his valuable advice and his vision which
inspired this research.
Special appreciation to teaching members committee in
Environmental Sciences Programme, Dr. Zeyad Abu Heen,
Dr.Wesam Almadhon, Dr. Yassir Al Nahhal, Mr. Raafat
Mortaja, Mr. Alaa Aljubb, Mr. Samir Hararah and Mr.
Mazen Albana for the ethical and scientific knowledge that is
transferred to me. Special thanks to my special friends, Mr.
Mahmoud Badawi. Many thanks to Dr.Khalid Ubeid who many
times answered questions and gave assistance for me. Special
thanks to Mr. Maher Abo Kmail. The continuous thanks to Mr.
Samy Lubad and Mr. Mohammed Al Khatibe for their help
during laboratory analysis process.

IV
To:
My Father and Mother for their love pray,
and continuous sacrifices…
To all of my brothers and sisters, Ahmed,
Alaa, Mariam, Iman, Aya, Israa, and Noor …
TO ALL OF MY FRIENDS AND COLLEAGUES…
V
Wadi Gaza is the most important wetland in Gaza Strip reaching a length 105 km from its
source to its end. Due to the difficult economic conditions, the Israeli occupation and lack
of the resources, Wadi Gaza became a place for solid and liquid waste disposal from
surrounding provinces.
The aim of this study is to assess the heavy metals in the sediments of the Wadi Gaza,
North, and South downstream of its . This was achieved through sediment sampling
along the course of the Wadi and analyzing the samples in the Ministry of Health. The
sampling locations were: Wadi Gaza, North and South downstream.
In this study, Concentrations of Zinc, Lead, Cadmium, Manganese, Copper and Nickel
were determined in the sediments, using atomic absorption spectrophotometer.
The results were as follows(ppm): Cu: 12.78-0.47, Zn: 190.73-7.23, Mn: 48.33-2.78, Ni:
88.54-1.26,Pb: 2.55-0.2, Cd: 2.53-0.19, Ni mean is 31.380±22.81, Zn mean 49.33±48.55,
Pb mean 0.76±0.54, Cd mean 1.72±0.62, Cu mean 3.38±3.78 and Mn 16.04±12.89.
All the results were compared with USEPA and the Ministry of Environment
and Energy, Ontario, Canada. The result are below the limits of standard for
sediments (Mn, Cd, Cu, Pb) but Ni and Zn are moderate pollutant compared
with USEPA and MOE Canada.
The distribution patterns for Zn, Ni clearly indicate that sediment contamination
is due to anthropogenic factors, and may become alarming if mitigation
measures are not taken .
The study recommends to stop the flow of sewage into the marine environment, which is
the main source of pollution in study area. The effluent discharge method should be
reconsidered. Strengthening the scientific research efforts to improve Wadi Gaza
monitoring programs and consequently to improve wetland quality.
Keywords: Palestine, Gaza Strip, Wadi Gaza, Mediterranean Coast, Heavy Metals, Gaza
Wetland .
VI
يسزخهض
ظدشا. كدى يد يجعد دزد بزد105ددان اند جهد غدضح قطدب فد اددذ ادى اندبال انشاجدخ غضح اد
يد نهدزخهض بيكبد غدضح اد أطدجخ انداسد، ردفش عدذو الإسشائه الادزلالثسجت انظعجخ الاقزظبدخ نهظشف
.ث انذطخ انذبفظبد ي انسبئهخ انظهجخ انفببد
عهد شدبا غدضح اد يظدت جدة شدبلكدزن غدضح اد فد انثقهدخ انعبطدش رقى ان انذساسخ ز فرذ
ردى رذهدم انداد يظدت جدة شدبل اناد يجش ي انشسثبد عبد جع خلال ي رن رى. انزسط
.انظذخ صاسح ف انعبد
رند ،انشسدثبد فد انكم انذبط انغض انكبديو انشطبص انض رشكضاد رذذذ رى انذساسخ ز ف
.انزس الايزظبص يطبفخ ثبسزخذاو جبص
-12.78: انذدبط: ى(كغد/ هجدىي) انزدبن انذد عهد كبدذ انعدبد يسدزبد انذساسدخ، يطقخ ف انزبئج رظش
،0.2-2.55: انشطدددددددبص 1.26-88.54: انكدددددددم ،2.78-48.33: انغدددددددض ،7.23-190.73: انضددددددد ،0.47
، 22.81± ،31.380 انكددددددددددم: ددددددددددذ انزسددددددددددطبد نهعددددددددددبد كبنزددددددددددبن:كب ،0.19-2.53: انكددددددددددبديو
، انجدددض: 3.78±3.83، انذدددبط: 0.62±1.72انكدددبديو ،0.54±0.76، انشطدددبص: 48.85±49.33انضددد :
16.04±12.89 .
،كدذا أزدبس، انطبقدخ، انجئدخ صاسح انجئدخ دبدخ كبندخ قجدم ي سح ثجع انزبئج كبذ اقم ي انذذ ان
اعه ي انذذ انسح ثد كبذ انض رشاكض انكم نك انشطبص انذبط انكبديو انجض: ثبنشاست
ثبنعبش انزكسح اعلا. يقبسخ
ثسدجت فد انطقدخ انشسدثبد رهدس أ إند ثضدح شدش انشاسدت يد انعذذ ف انكم انض رصع ا ط
.انلاصيخ زذاثشان ارخبر زى نى إرا ثبنخطش زس أطجخ قذ اصدبد، ف انجششخ انعايم
نهزهدس انشئسد انظدذس رعزجدش انزد انجذشخ، انجئخ ف انظذ انظشف يب رذفل قف ان انذساسخ أطذقذ
نزذسد انعهد انجذدش جدد انسدبئهخ . رعضدض انفببد رظشف اشقخ ف انظش إعبدح جغ. انذساسخ ف يطقخ
انزخظظدخ انذساسدبد يد ذزدب اند انضدذ. انشاجدخ الأساضد عخ رذس ثبنزبن غضح، ناد انشطذ ثشايج
.غضح اد رهس انظذ انظشف يب ث انعلاقخ نزذذذ
.ف غضح ، انبال انشاجخانثقهخ انعبد ، انزسط انجذش ح، سبدمغض اد غضح، قطب فهسط،: انجذش كهبد
VII
DEDICATION ............................................................................................................................. IV
VI ....................................................................................................................................... يسزخهض
TABLE OF CONTENTS............................................................................................................ VII
LIST OF TABLES ....................................................................................................................... XI
LIST OF FIGURES .................................................................................................................... XII
ABBREVIATIONS .................................................................................................................. XIII
LIST OF ELEMENTS NAMES AND THEIR SYMBOLS ....................................................XIV
CHAPTER ONE ............................................................................................................................. I
INTRODUCTION AND LITERATURE REVIEW .................................................................... I
1.1 GENERAL OVERVIEW ........................................................................................................ 1
1.2 GAZA ENVIRONMENTAL SITUATION ......................................................................... 2
1.2.1 Coastal and Sea Water Pollution ..................................................................................................... 3
1.2.2 Groundwater Quality ...................................................................................................................... 3
1.2.3 Hazardous Waste and Landfills ........................................................................................................ 3
1.2.4 Air pollution .................................................................................................................................... 4
1.2.5 Soil Salinization ............................................................................................................................... 4
1.2.6 High-Electricity Voltage ................................................................................................................... 5
1.2.7 Radioactive Hazards ........................................................................................................................ 5
1.2.8 Noise Pollution ................................................................................................................................ 6
1.3 GAZA COAST......................................................................................................................... 6
VIII
1.4 WETLAND IN GAZA ............................................................................................................ 7
1.5 WADI GAZA ......................................................................................................................... 7
1.5.1 Climate of the Wadi Gaza ................................................................................................................ 8
1.5.2 The problem of the Wadi Gaza ........................................................................................................ 9
1.6 HEAVY METALS POLLUTION ....................................................................................... 10
1.6.1 Definition of heavy metals ............................................................................................................ 10
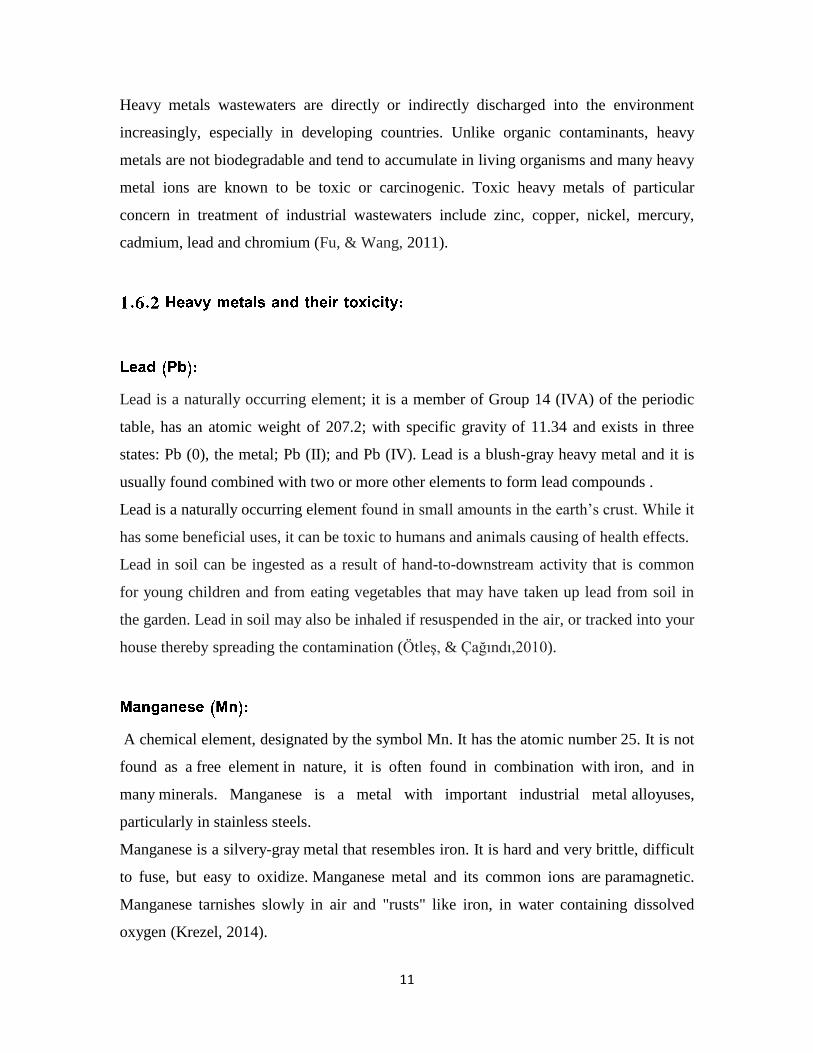
1.6.2 Heavy metals and their toxicity: .................................................................................................... 11
Lead (Pb): ............................................................................................................................................... 11
Manganese (Mn): ................................................................................................................................... 11
Cadmium (Cd): ....................................................................................................................................... 12
Copper (Cu): ........................................................................................................................................... 12
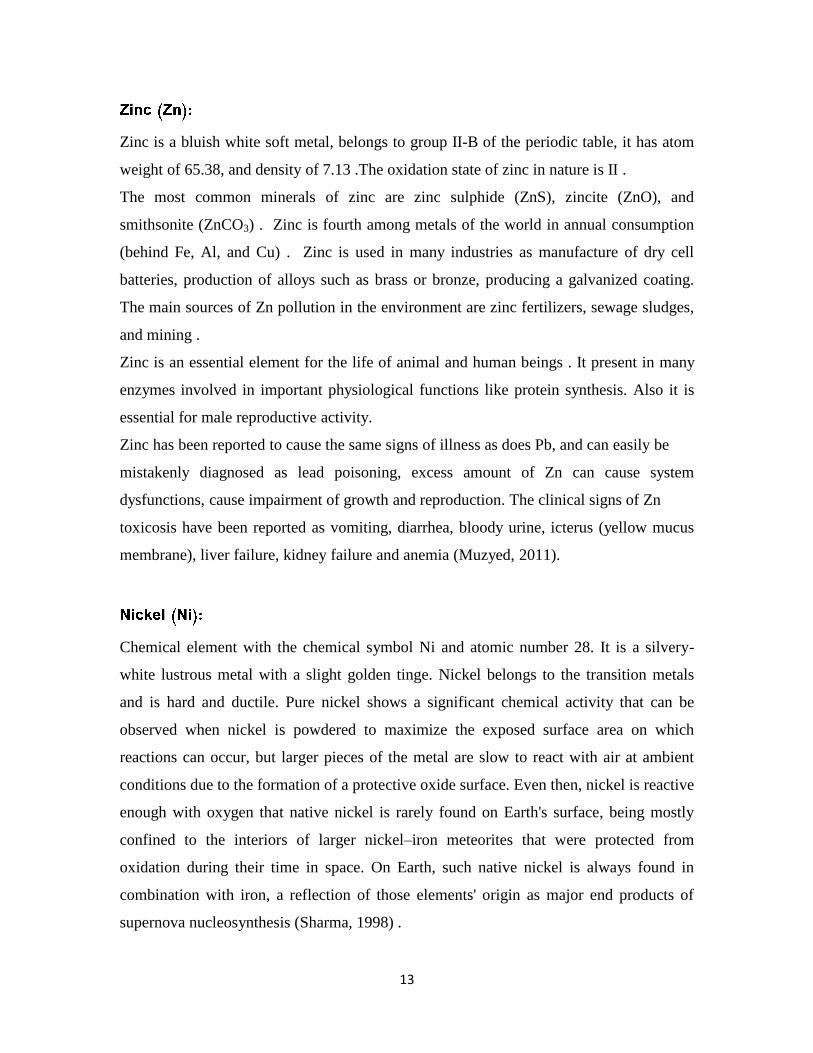
Zinc (Zn): ................................................................................................................................................ 13
Nickel (Ni): ............................................................................................................................................. 13
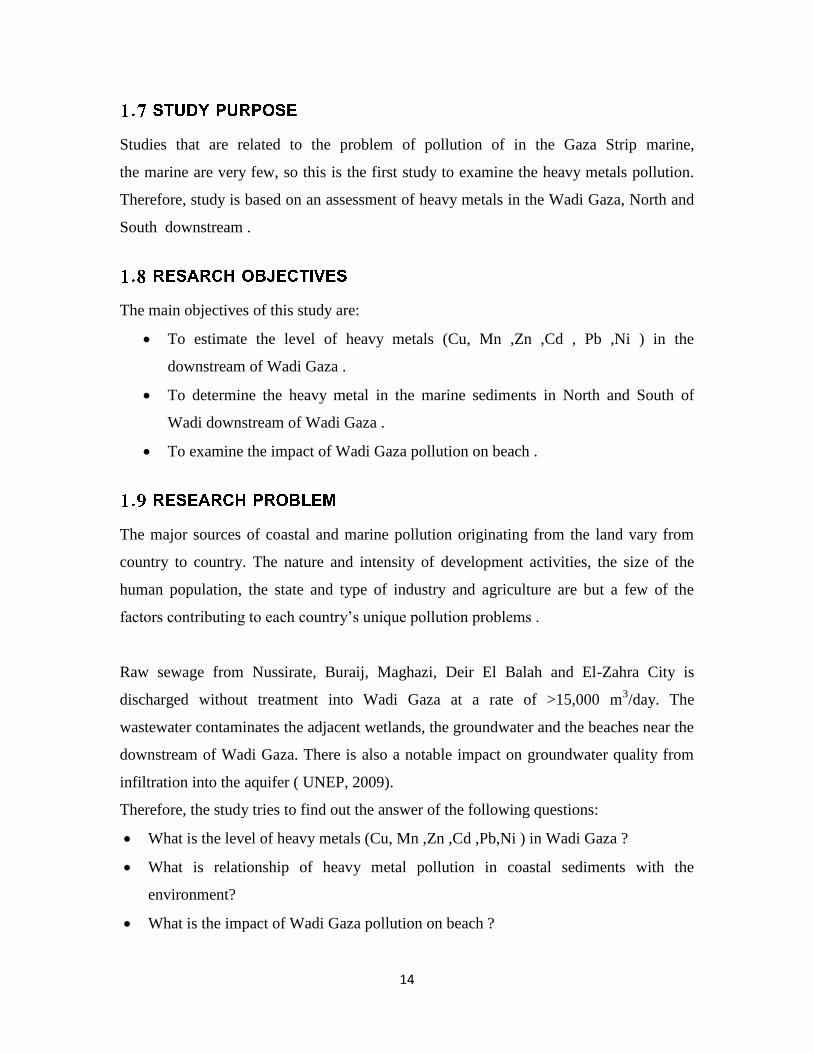
1.7 STUDY PURPOSE ............................................................................................................. 14
1.8 RESARCH OBJECTIVES ................................................................................................... 14
1.9 RESEARCH PROBLEM .................................................................................................... 14
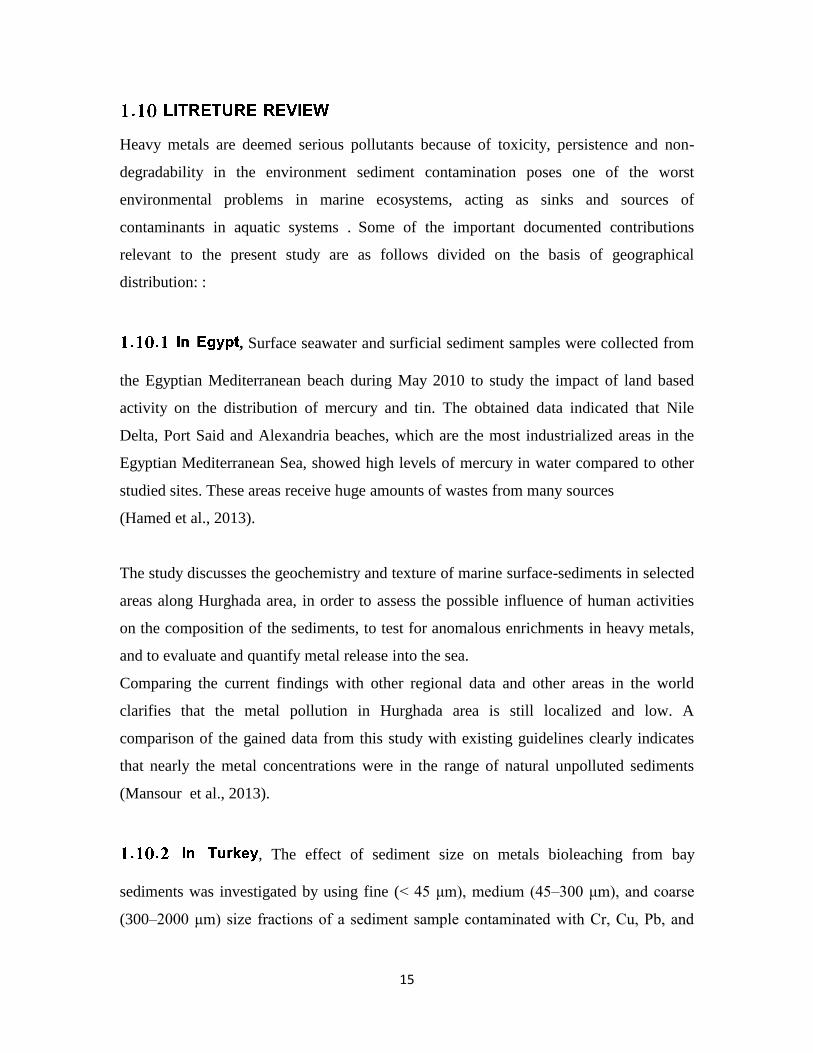
1.10 LITRETURE REVIEW .................................................................................................... 15
1.10.1 In Egypt ....................................................................................................................................... 15
1.10.2 In Turkey ..................................................................................................................................... 15
1.10.3 In Spain, ...................................................................................................................................... 16
1.10.4 In France ..................................................................................................................................... 16
1.10.5 In Japan, ...................................................................................................................................... 17
1.10.6 In Korea, ...................................................................................................................................... 17

IX
1.10.7 In Chaina, .................................................................................................................................... 18
1.10.8 In India ........................................................................................................................................ 18
1.10.9 In Brazil ....................................................................................................................................... 19
1.10.10 Studies concerning heavy metals in Gaza Strip .......................................................................... 19
CHAPTER TWO ........................................................................................................................ 21
MATERIALS AND METHODS ............................................................................................... 21
2.1. FIELD WORK .................................................................................................................... 22
2.1.1 Sample collection .......................................................................................................................... 22
2.2 SAMPLING SITE ................................................................................................................ 22
2.3 LABORATORY ANALYSIS ............................................................................................. 24
2.3.1 Sample preparation ....................................................................................................................... 24
2.3.2 Reagents ....................................................................................................................................... 26
2.3 DIGESTION PROCEDURES ............................................................................................ 26
2.3.1 Digestion of sediment samples ...................................................................................................... 26
2.3.2 Atomic Absorption Spectrophotometer (AAS) ............................................................................... 26
2.3.3 Calibration setting ......................................................................................................................... 27
2.4 OFFICE WORK .................................................................................................................. 28
2.5 STATISTICAL MANIPULATION: .................................................................................. 28
CHAPTER THREE .................................................................................................................... 29
RESULTS AND DISCUSSION ................................................................................................. 29
3.1 RESULTS OF HEAVY METAL CONCENTRATIONS : ................................................ 30
X
3.1.1 Heavy metal concentrations ......................................................................................................... 30
3.2 ASSESSMENT OF HEAVY METAL POLLUTION BY SEDIMENT QUALITY
GUIDELINES (SQGS) ............................................................................................................... 38
3.3 CORRELATION ANALYSIS ............................................................................................. 43
3.3.1 In Wadi Gaza ................................................................................................................................. 43
3.3.2 Heavy Metals in North downstream of Wadi Gaza ........................................................................ 45
3.3.3 Heavy Metals in South downstream of Wadi Gaza ........................................................................ 47
3.3.4 Heavy Metals in total area of Wadi Gaza ....................................................................................... 48
3.3.5 Testing the difference between the means of each metal due to area of the Wadi by using One
way ANOVA. .......................................................................................................................................... 53
3.3.6 Testing the difference in the means of metals in each area in Wadi Gaza ..................................... 54
CHAPTER FOUR ...................................................................................................................... 55
CONCLUSIONS AND RECOMMENDATION ....................................................................... 55
CONCLUSIONS .......................................................................................................................... 56
RECOMMENDATION .............................................................................................................. 57
REFERENCES ............................................................................................................................ 58
XI
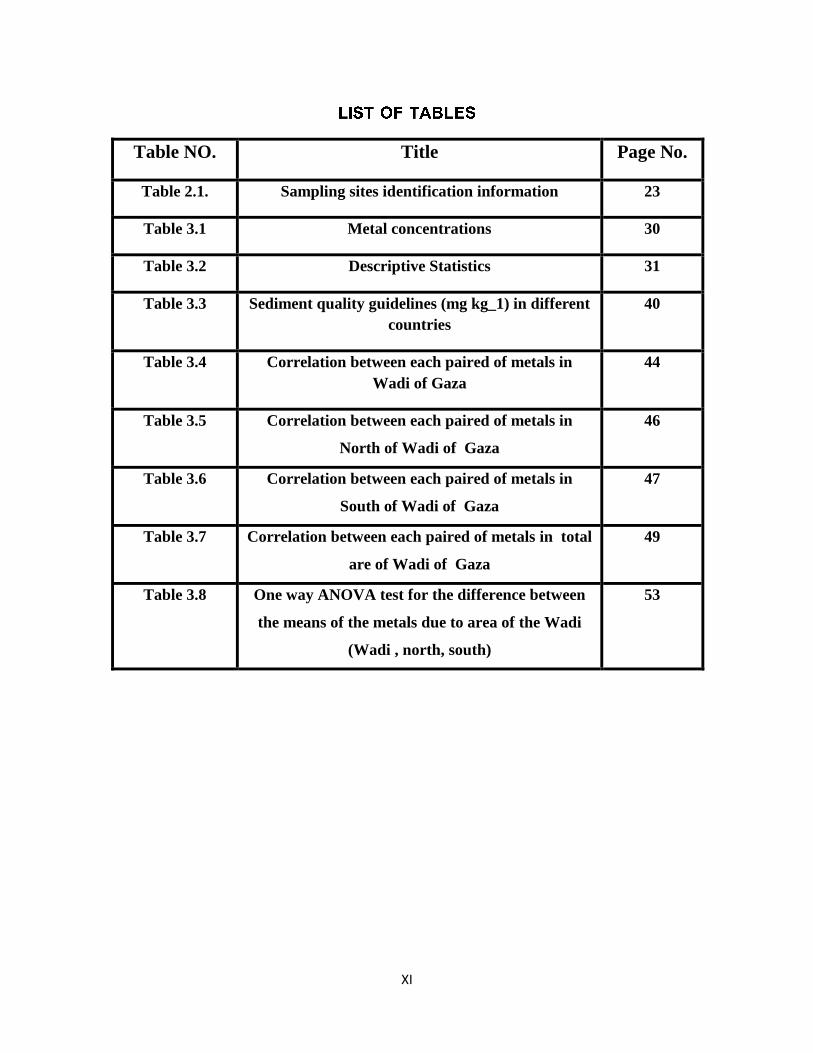
Table NO. Title Page No.
Table 2.1. Sampling sites identification information 23
Table 3.1 Metal concentrations 30
Table 3.2 Descriptive Statistics 31
Table 3.3 Sediment quality guidelines (mg kg_1) in different
countries
40
Table 3.4 Correlation between each paired of metals in
Wadi of Gaza
44
Table 3.5 Correlation between each paired of metals in
North of Wadi of Gaza
46
Table 3.6 Correlation between each paired of metals in
South of Wadi of Gaza
47
Table 3.7 Correlation between each paired of metals in total
are of Wadi of Gaza
49
Table 3.8 One way ANOVA test for the difference between
the means of the metals due to area of the Wadi
(Wadi , north, south)
53
XII
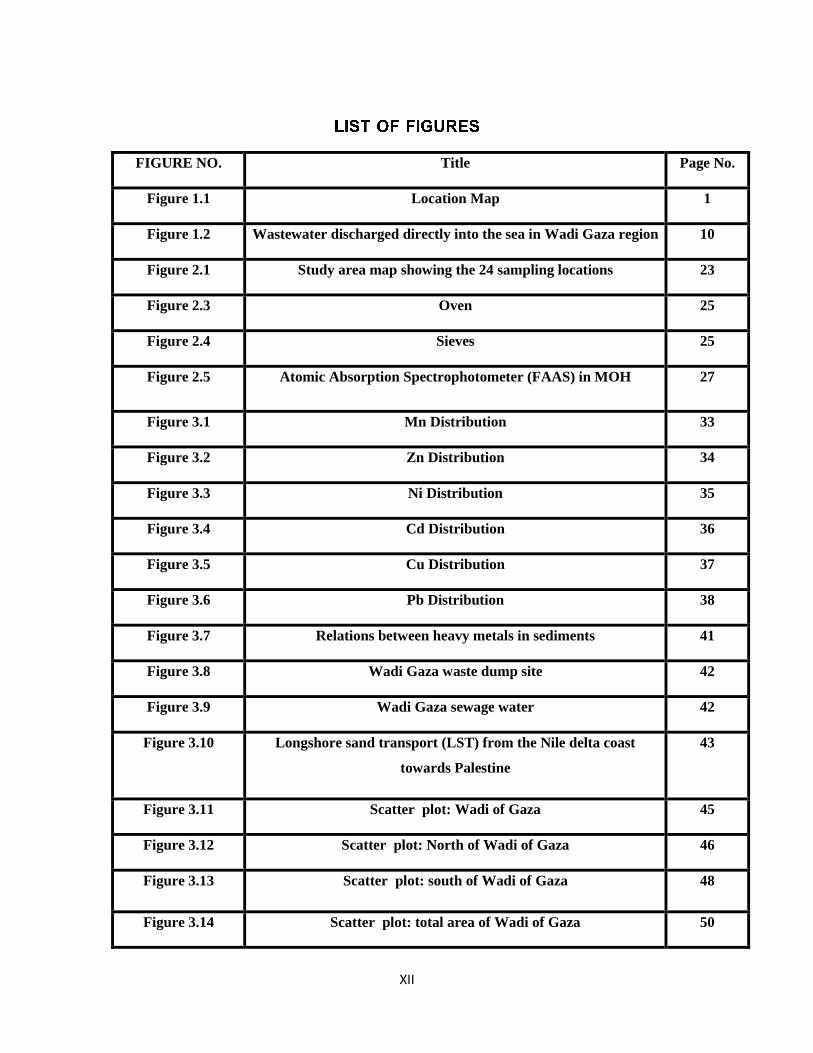
FIGURE NO. Title Page No.
Figure 1.1 Location Map 1
Figure 1.2 Wastewater discharged directly into the sea in Wadi Gaza region 10
Figure 2.1 Study area map showing the 24 sampling locations 23
Figure 2.3 Oven 25
Figure 2.4 Sieves 25
Figure 2.5 Atomic Absorption Spectrophotometer (FAAS) in MOH
27
Figure 3.1 Mn Distribution 33
Figure 3.2 Zn Distribution 34
Figure 3.3 Ni Distribution 35
Figure 3.4 Cd Distribution 36
Figure 3.5 Cu Distribution 37
Figure 3.6 Pb Distribution 38
Figure 3.7 Relations between heavy metals in sediments 41
Figure 3.8 Wadi Gaza waste dump site 42
Figure 3.9 Wadi Gaza sewage water 42
Figure 3.10 Longshore sand transport (LST) from the Nile delta coast
towards Palestine
43
Figure 3.11 Scatter plot: Wadi of Gaza 45
Figure 3.12 Scatter plot: North of Wadi of Gaza 46
Figure 3.13 Scatter plot: south of Wadi of Gaza 48
Figure 3.14 Scatter plot: total area of Wadi of Gaza 50
XIII
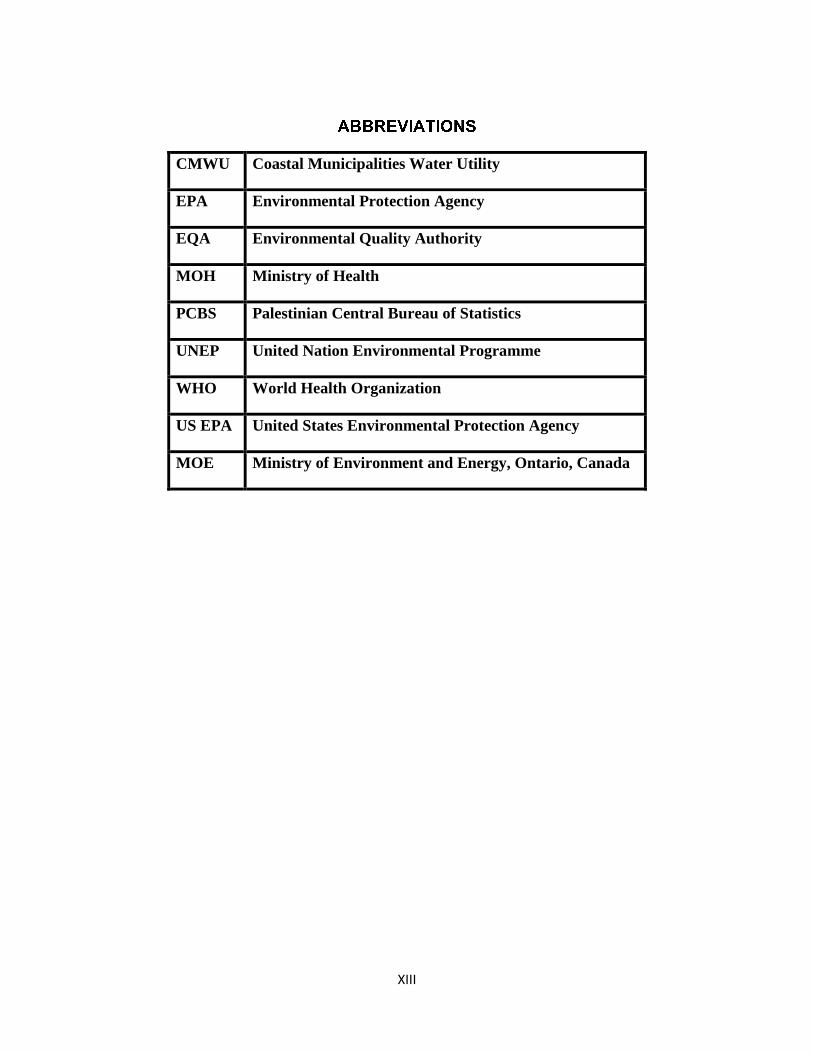
CMWU Coastal Municipalities Water Utility
EPA Environmental Protection Agency
EQA Environmental Quality Authority
MOH Ministry of Health
PCBS Palestinian Central Bureau of Statistics
UNEP United Nation Environmental Programme
WHO World Health Organization
US EPA United States Environmental Protection Agency
MOE Ministry of Environment and Energy, Ontario, Canada
XIV
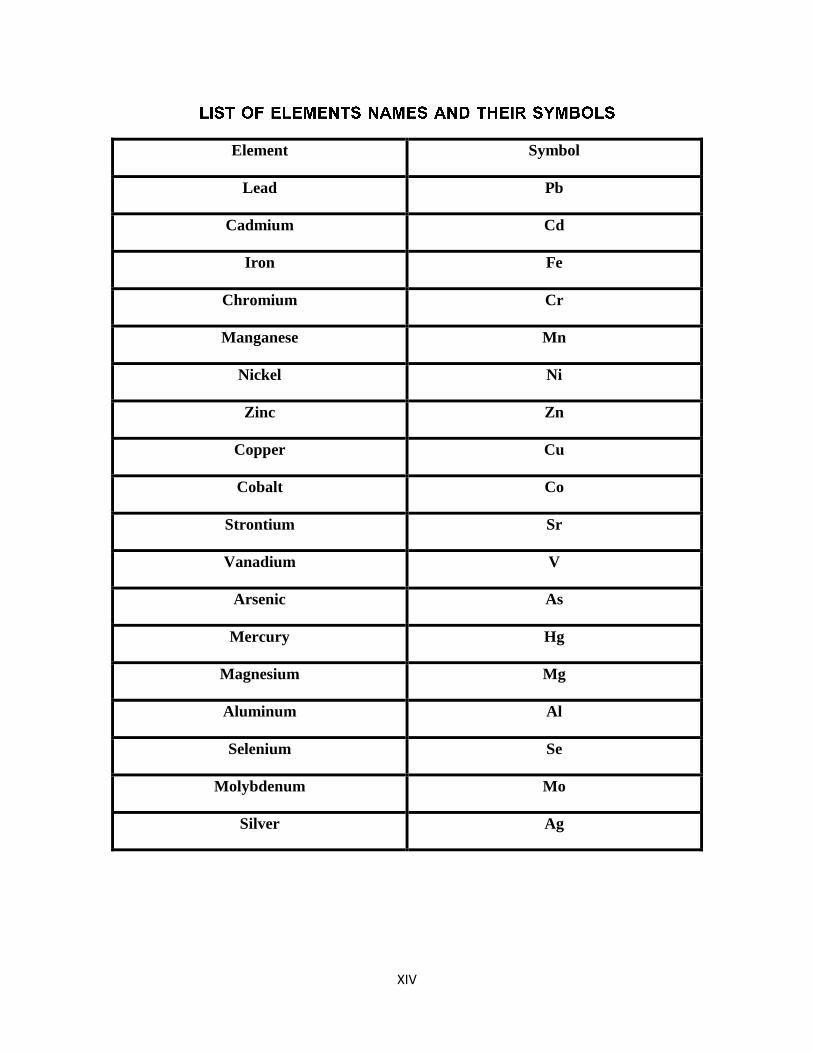
Element Symbol
Lead Pb
Cadmium Cd
Iron Fe
Chromium Cr
Manganese Mn
Nickel Ni
Zinc Zn
Copper Cu
Cobalt Co
Strontium Sr
Vanadium V
Arsenic As
Mercury Hg
Magnesium Mg
Aluminum Al
Selenium Se
Molybdenum Mo
Silver Ag

I
1
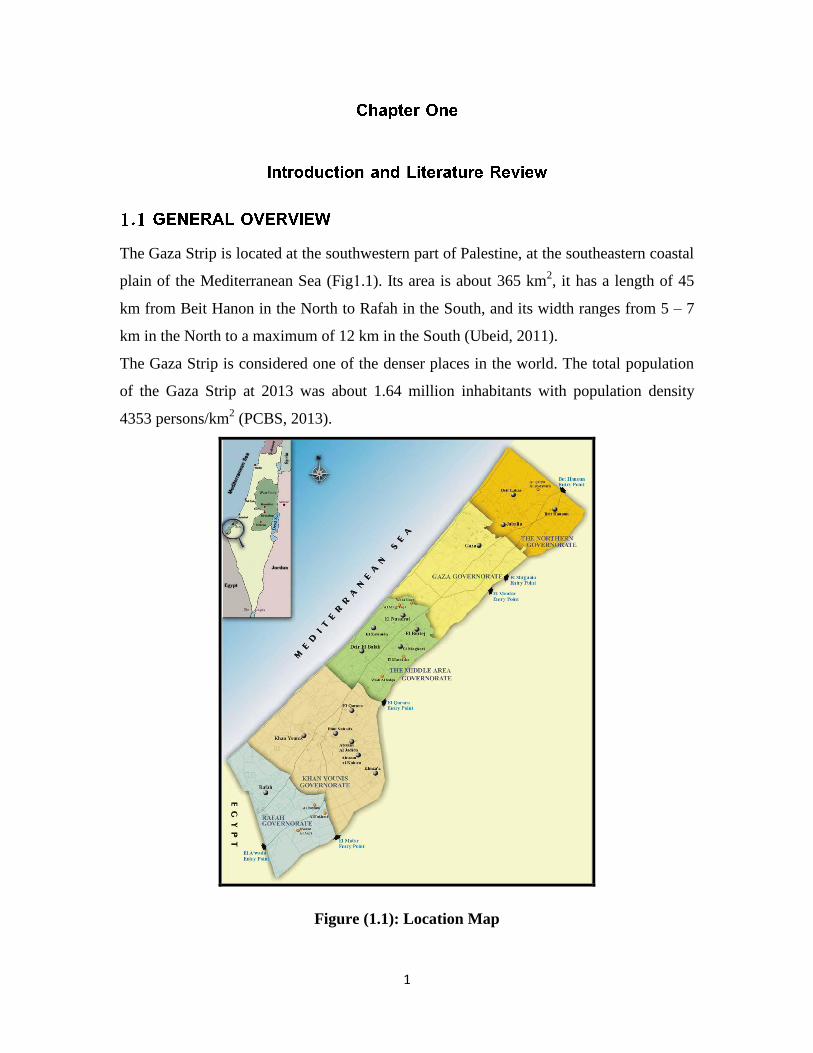
The Gaza Strip is located at the southwestern part of Palestine, at the southeastern coastal
plain of the Mediterranean Sea (Fig1.1). Its area is about 365 km2, it has a length of 45
km from Beit Hanon in the North to Rafah in the South, and its width ranges from 5 – 7
km in the North to a maximum of 12 km in the South (Ubeid, 2011).
The Gaza Strip is considered one of the denser places in the world. The total population
of the Gaza Strip at 2013 was about 1.64 million inhabitants with population density
4353 persons/km2 (PCBS, 2013).
Figure (1.1): Location Map
2
The environmental situation in the Gaza Strip already serious due to underinvestment in
environmental systems, lack of progress on priority environmental projects and increased
the pressure on environmental facilities and institutions (UNEP, 2009)
The Gaza Strip is decades behind Israel and the adjacent countries in the Middle East in
terms of environmental policy, development, and protection. In all honesty, a realistic
environmental management plan for the Strip must begin from point zero. We must hope
that this challenging fact does not dampen the motivation of the authorities and people in
the Gaza Strip to safeguard their environmental future (Al-Agha, 2000).
Several serious environmental problems currently affect the Gaza Strip. Because these
problems have received no serious study during the last three Decades. Many, indeed, all
of them need urgent study to suggest appropriate protection policy.
These problems include (1) air pollution, (2) groundwater pollution, (3) coastal and sea
water pollution, (4) soil salinization, (5) land pollution, (6) high electricity voltage, (7)
possible radioactive hazards, (8) and the consequent destruction of local birds and
animals due to their exposure to poisonous materials used as rodent control (A1-Agha,
1997).
Adverse environmental impacts include the widespread destruction of agricultural areas,
damage to smaller industrial enterprises and an increase in pollution discharged into the
Mediterranean and into the groundwater, Utilities infrastructure in energy (fuel and
electricity), transportation and telecommunications and wastewater systems (CMWU,
2010).
The matter of greatest concern is the effect the input have in the marine environment .
Marine pollution is the introduction by man directly or indirectly of substances or energy
to the marine environmental resulting in deleterious effects such as: hazards to human
health hindrance of marine activities including fishing impairment of the quality for the
use of seawater and reduction of amenities . the focus is therefore on human rather than
natural inputs to the sea and on the damaging effects of waste (Clark, 2001 ).
3
The Gaza Strip is located along the coast of the Mediterranean Sea (about 40 km). The
sandy and sunny coast of the Gaza Strip is one of the most beautiful in the world.
However, several spots along the coast are used as waste disposal and landfills.
According to the municipal sources in Gaza, some million cubic meters of waste water
are disposed of in the Mediterranean annually.
This contamination can be prevented by the introduction of waste water recycling and
reuse in the Gaza Strip. The introduction of these industries will require considerable
financial, technical, and managerial efforts, but will contribute greatly to solving the
water pollution and related economic problems in the area (A1-Agha, 1997).
Contamination of groundwater in the Gaza Strip is one of the most serious environmental
problems facing the society. Sources of contamination are anthropogenic and natural. The
anthropogenic sources include landfill and waste disposal decay, fertilizers, and sewage.
The natural sources include sea water intrusion into the main coastal aquifier. In the Gaza
Strip, very few areas have sewage systems. Even in these areas the construction of a
municipal water supply has proceeded faster than that of a sewage system, which
contributes to the complexity of the problem.
In many areas in the Gaza Strip, nitrate concentration is more than 45 ppm which is the
maximum international acceptable value (A1-Agha 1993).
It is suspected that several diseases are being spread among the Palestinians through the
consumption of poor-quality groundwater. There have been no systematic and scientific
studies regarding this point (A1-Agha, 1995).
The quantity of wastes produced in the Gaza Strip is relatively very high, and there is no
recycling whatsoever. About four to six million tons of waste are disposed of annually in
the Gaza Strip in vacant areas or along roads and streets. People sometimes burn the
4
wastes to make room for future disposals; waste burning produces more gaseous and
solid air pollutants.
There are no disposal management organizations or institutions in the Gaza Strip. Even
the municipalities are not well organized in this respect, and it is very common to see
their sanitation crews emptying wastes in places near population centers. The
introduction of low-waste-producing technologies should be encouraged by the
Palestinian authorities in the Gaza Strip, otherwise the problem will escalate.
The disposal of municipal waste is very problematic because of the exhaustion of the
landfill capacity. All the landfills do not satisfy environmental protection standards by
any means (A1-Agha, 1997).
Air quality is considerably worse due to pollution from several sources.The transportation
system plays an important role in damaging air quality in the Gaza Strip. High
concentrations of carbon monoxides, sulphur and particulate pollutants, lead, and
nitrogen-oxide are believed to be above the ambient levels permitted in the developed
world. The ambient concentrations of hydrocarbons are also high along heavily used
streets of cities and along the main roads crossing smaller towns. However, the nature
and standard of living, characterized by low-income levels, also contributes to air
pollution (A1-Agha, 1997).
Soil is the most important natural resource in the Gaza Strip because the Palestinians
depend on agricultural products as a main source of income and food. Compared to the
West Bank, the proportion of available arable land is high, about 60% of the area.
However, in the last two decades, the areas utilized for farming have been considerably
reduced due to problems in marketing and Israeli export regulations. These regulations
give the Israelis the right to prevent the Palestinian farmers from exporting their products
at any time.
5
Furthermore, many areas of agricultural land have been used for housing, which has
become an escalating and complicated problem in the Gaza Strip. Given the difficult
economic conditions in the area, many agricultural land owners have sold their holdings
in the last two decades to other Palestinians. More than 90% of the land sold has been
developed for housing.
Soil salinization has been a serious problem in the last two decades; it has become one of
the most damaging processes affecting agricultural land and production. The source of
salts in the soil is the highly saline water used to irrigate vegetables and citrus in the Gaza
Strip. Three main sources of salts in groundwater are believed to affect soil salinity in the
Gaza Strip: Mediterranean Sea water intrusion into the main coastal aquifier (A1-Agha,
1995); salt water intrusion into the Gazan aquifer from beyond the Israeli border; and the
pumping of groundwater in the Gaza Strip, which causes
an increase in salinity. These three sources of groundwater salinization, and
consequently, soil salinization have never been studied and no protective steps have been
taken to prevent such contamination (A1-Agha, 1995).
In the early 1970s, a high-voltage electricity net was constructed in the Gaza Strip. While
it improved the general quality of life, it was not constructed in a proper and safe way. In
many areas, high-voltage electricity passes above the populated areas. Many homes are
affected by high-voltage electricity 24 hours a day. Some recent reports in the United
Kingdom and USA suggest a relation between brain cancer and high-voltage electricity,
especially in children; however, these effects have not yet been investigated in the Gaza
Strip (A1-Agha, 1995).
An Israeli nuclear reactor (Dimona) is located some tens of miles to the east of the Gaza
Strip. Several miles to the north is the much smaller Soriq nuclear reactor. Despite the
usual safety measures in and around these reactors, there is always the danger of radiation
leakage. Also, nuclear wastes stored in Israel may have some effect on the environment

6
in the Gaza Strip and adjacent countries. Therefore, a radioactive pollution monitoring
system should be established in the Gaza Strip soon to warn the government and the
public of any possible radioactive risks.
Noise pollution resulting from transportation affects more than 90% of the Palestinian
population in the Gaza Strip. This is due to its limited and small area and the extreme
overpopulation. Use of the old "second-hand" cars imported from Israel is a serious and
dangerous source of noise in the Gaza Strip. The severe economic conditions in the Gaza
Strip during the Israeli occupation have made it impossible for Palestinians to purchase
newer, more environmentally friendly cars for transportation. Many Palestinian small
industries, for example, steel design, building stones, wood design,
car repairs, etc., are located in the populated areas in the cities and villages, causing more
noise and trouble to the people (A1-Agha, 1995).
Its coastal zone is a band of water and land along the marine shoreline in which different
activities interact. It includes sand dunes in the south and north, coastal kurkar cliffs in
the middle to the north, non urban areas, and part of Gaza valley, which is also called
Wadi Gaza. The coastal zone covers approximately 74 km2, of which 2.7 km2 are
beaches (Ali, 2002).
The coastline has a straight and sandy shore. The near-coast continental shelf slopes
down with a gradient of 1:100. The irregular and rocky seabed of the coastal shelf to the
depth of 100 m is 28 km wide in the south and 14 km wide in the north. The seabed drops
quickly beyond the depth of 100 m. Its sediments consist mainly of sand 25 m deep, with
muddy places near the Wadi Gaza (Ubeid, 2010).

7
Sedimentologists tend to use grain-size distribution to elucidate transport dynamics. Such
diverse factors as waves, winds, longshore currents, and beach relief control littoral
sediments textural composition (Ubeid, 2011).
Wadi Gaza is wetland area, wetlands are buffer zones in which intensive ecological
interactions between aquatic and terrestrial ecosystem occur. These zones often act as
important sinks for heavy metals from river water or upland by the process of adsorption
and sedimentation.
The capacity of wetlands to accumulate heavy metals depends on the combined effects
of water, soils and plants through a combination of physical, chemical and biological
processes.
Wetlands have a large capacity to retain heavy metals from upland and river water.
Studies on the function of vegetation in wetlands also indicated that the plant-covered
wetlands play an important role in reducing heavy metals by storing them in various parts
such as roots and shoots
Wadi Gaza occupies a key position in the geology and geomorphology of the area
(MedWetCoast, 2001), Wadi Gaza is an indispensable part of natural life in Palestine and
has an interesting history and rich biodiversity in terms of fauna and flora (Abd Rabou,
et al., 2008a).
The Wadi floor descends from 30 m above sea level at its eastern limits its downstream.
Located in a transitional zone between the Mediterranean, Negev and Sinai regions, the
area is characterized by a semi-arid climate (AbdRabou, et al., 2008b).
The length of the Wadi Gaza from source to downstream is about 105 km of which the
last 9 km is located in the Gaza Strip from the armistice line in the East to the
Mediterranean coast in the West. The general elevation of the topography on both sides
8
of the Wadi ranges from 20 to 40 m above sea level, the Wadi floor descends from 30 m
above sea level at its eastern limits its downstream, Located in a transitional zone
between the Mediterranean, Negev and Sinai regions, the area is characterized by a semi-
arid climate (MedWetCoast, 2001).
The width and depth of Wadi Gaza vary a lot, being 40–60 m wide in its eastern and
middle ranges, it becomes more than 400 m wide at its downstream in the West. The
depth varies from 5 to 10 m in the East to 4–3 m in the West at the downstream.
(Zaineldeen & Aish, 2012).
Wadi Gaza wetland area is located at the down end of the Wadi at the Wadi's
downstream. It is covering a small area compared to other wetlands in the world (about
25 hectares). Yet it is very rich in biodiversity and of great significance to migrating birds
from Europe to Africa in autumn (MedWetCoast, 2001).
In recognition to its importance as a natural area and as the only wetland in the Palestine
coast, Wadi Gaza was declared a nature reserve in June 2000 by the Palestinian National
Authority (Abd Rabou, et al., 2007)
The amount of groundwater feeding the wetland ecosystem is estimated to be from
65,000 to 81,000m3 . Another source of freshwater supplying the wetland ecosystem is
storm water that accumulates during the rainy season. Untreated wastewater is discharged
in Wadi Gaza and hence its wetland from the adjacent residential masses. The total
quantity of this wastewater ranges between 5000-7000 m3 per day (Abd Rabou, et al.,
2008a) .
The Wadi Gaza as well as the whole Gaza Strip area are located in the transitional zone
between the temperate Mediterranean climate to the East and North and the arid desert
climate of the Negev and Sinai to the East and South. As a result the Wadi Gaza area
undergoes a characteristically semi-arid climate with a welldefined wet season starting in
9
October and extending into April, and a dry season from May to September. Peak months
of rainfall are December and January. The average daily mean temperature ranges from
25 C° in summer to 13 C° in winter, with an average
daily maximum from 29 C° to 17 C°, and a minimum temperature range from 21 _C° to 9
C°, in summer and winter respectively. The daily relative humidity fluctuates between
65% in daytime and 85% at night in summer and between 60% and 80% respectively in
winter.
The mean annual rainfall in the Gaza Strip generally varies from 150 to 300 mm/yr. The
average annual rainfall decreases to 50% from the north to the south of the Gaza Strip
(Aish, 2004).
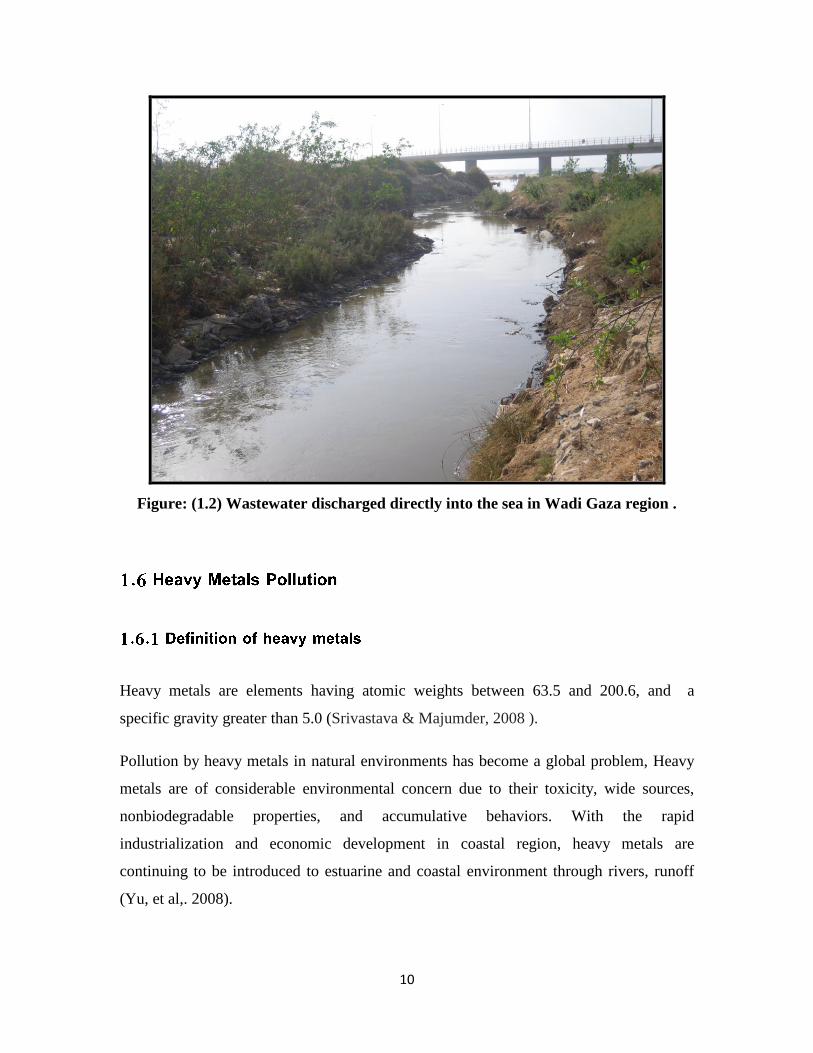
There are two types of pollutants in Wadi Gaza exist; point source and non-point source.
A point source of pollution stems from a single discrete location, such as an outflow pipe,
untreated wastewater discharge into Wadi Gaza is the first major and the most destructive
pollution source, which is seriously and rabidly damaging all kinds of habitats, wildlife
and the unique ecosystem of Wadi Gaza (UNEP, 2009).
The history of wastewater discharge to Wadi Gaza starts with the construction of the grey
wastewater collection system by the United Nations Refugee Work and Relief Agency
(UNRWA), to serve the three refugee camps of the Middle Area: namely Al-Nusairat,
Al-Bureije, and Al-Maghazi in 1974. This open channel collection system was collecting
the grey wastewater of these three residential areas and discharging it to Wadi Gaza
through two outlets. After the construction of Al-Zahra City at the Northwestern edge of
Wadi Gaza, it started to discharge its raw wastewater through
closed pipe collection system to the Wadi (Taleb, 2014) .
10
Figure: (1.2) Wastewater discharged directly into the sea in Wadi Gaza region .
Heavy metals are elements having atomic weights between 63.5 and 200.6, and a
specific gravity greater than 5.0 (Srivastava & Majumder, 2008 ).
Pollution by heavy metals in natural environments has become a global problem, Heavy
metals are of considerable environmental concern due to their toxicity, wide sources,
nonbiodegradable properties, and accumulative behaviors. With the rapid
industrialization and economic development in coastal region, heavy metals are
continuing to be introduced to estuarine and coastal environment through rivers, runoff
(Yu, et al,. 2008).
11
Heavy metals wastewaters are directly or indirectly discharged into the environment
increasingly, especially in developing countries. Unlike organic contaminants, heavy
metals are not biodegradable and tend to accumulate in living organisms and many heavy
metal ions are known to be toxic or carcinogenic. Toxic heavy metals of particular
concern in treatment of industrial wastewaters include zinc, copper, nickel, mercury,
cadmium, lead and chromium (Fu, & Wang, 2011).
Lead is a naturally occurring element; it is a member of Group 14 (IVA) of the periodic
table, has an atomic weight of 207.2; with specific gravity of 11.34 and exists in three
states: Pb (0), the metal; Pb (II); and Pb (IV). Lead is a blush-gray heavy metal and it is
usually found combined with two or more other elements to form lead compounds .
Lead is a naturally occurring element found in small amounts in the earth’s crust. While it
has some beneficial uses, it can be toxic to humans and animals causing of health effects.
Lead in soil can be ingested as a result of hand-to-downstream activity that is common
for young children and from eating vegetables that may have taken up lead from soil in
the garden. Lead in soil may also be inhaled if resuspended in the air, or tracked into your
house thereby spreading the contamination (Ötleş, & Çağındı,2010).
A chemical element, designated by the symbol Mn. It has the atomic number 25. It is not
found as a free element in nature, it is often found in combination with iron, and in
many minerals. Manganese is a metal with important industrial metal alloyuses,
particularly in stainless steels.
Manganese is a silvery-gray metal that resembles iron. It is hard and very brittle, difficult
to fuse, but easy to oxidize. Manganese metal and its common ions are paramagnetic.
Manganese tarnishes slowly in air and "rusts" like iron, in water containing dissolved
oxygen (Krezel, 2014).

12
Manganese is an important metal for human health, being absolutely necessary for
development, metabolism, and the antioxidant system. Nevertheless, excessive exposure
or intake may lead to a condition known as manganism, a neurodegenerative disorder that
causes dopaminergic neuronal death and parkinsonian- like symptoms (Emsley, 2011)
Cadmium is a metal from group II B that has an atomic weight of 112.41with specific
gravity of 8.65; the ionic form of cadmium (Cd+2
) is usually combined with ionic forms of
oxygen (cadmium oxide, CdO), chlorine (cadmium chloride, CdCl2), or sulfur (cadmium
sulfate, CdSO4).
Toxicity symptoms induced by cadmium include gastrointestinal disorders, kidney failure
and hypertension. It is also reported that, intoxication with Cd in pregnant women has
been related to reduced pregnancy length and newborn weight and, recently, to disorders
of the endocrine and/or immune system in children (Koppen et al., 2009)
Copper belongs to group I-B of the periodic table, it has an atomic weight of 63.55 with a
specific gravity of 8.96 with oxidation states of +2, +1. The important ores of Cu are
Chalcocite (CuFeS2), Cuprite (Cu2O) and Malachite [CuCO3. Cu(OH)2]. Copper is
widely used for wire production and in the electrical industry. Its main alloys are brass
(with zinc) and bronze (with tin). Other applications are kitchenware, water delivery
systems, and copper fertilizers (Sarkar, 2002).
Copper is considered as an essential constituent of metalloenzymes of living organisms
and is required in hemoglobin synthesis and in catalysis of metabolic reactions. It plays a
crucial role in many biological enzyme systems that catalyze oxidation/ reducetion
reactions. However, if present at relatively high concentrations in the environment,
toxicity to aquatic organisms may occur. Copper under ionic forms Cu+2, Cu2OH+ and
CuOH+ is toxic to fish . High copper levels lead to an increase in the rate of free radical
formation teratogenicity , and chromosomal aberrations (Ötleş, & Çağınd,2010).
13
Zinc is a bluish white soft metal, belongs to group II-B of the periodic table, it has atom
weight of 65.38, and density of 7.13 .The oxidation state of zinc in nature is II .
The most common minerals of zinc are zinc sulphide (ZnS), zincite (ZnO), and
smithsonite (ZnCO3) . Zinc is fourth among metals of the world in annual consumption
(behind Fe, Al, and Cu) . Zinc is used in many industries as manufacture of dry cell
batteries, production of alloys such as brass or bronze, producing a galvanized coating.
The main sources of Zn pollution in the environment are zinc fertilizers, sewage sludges,
and mining .
Zinc is an essential element for the life of animal and human beings . It present in many
enzymes involved in important physiological functions like protein synthesis. Also it is
essential for male reproductive activity.
Zinc has been reported to cause the same signs of illness as does Pb, and can easily be
mistakenly diagnosed as lead poisoning, excess amount of Zn can cause system
dysfunctions, cause impairment of growth and reproduction. The clinical signs of Zn
toxicosis have been reported as vomiting, diarrhea, bloody urine, icterus (yellow mucus
membrane), liver failure, kidney failure and anemia (Muzyed, 2011).
Chemical element with the chemical symbol Ni and atomic number 28. It is a silvery-
white lustrous metal with a slight golden tinge. Nickel belongs to the transition metals
and is hard and ductile. Pure nickel shows a significant chemical activity that can be
observed when nickel is powdered to maximize the exposed surface area on which
reactions can occur, but larger pieces of the metal are slow to react with air at ambient
conditions due to the formation of a protective oxide surface. Even then, nickel is reactive
enough with oxygen that native nickel is rarely found on Earth's surface, being mostly
confined to the interiors of larger nickel–iron meteorites that were protected from
oxidation during their time in space. On Earth, such native nickel is always found in
combination with iron, a reflection of those elements' origin as major end products of
supernova nucleosynthesis (Sharma, 1998) .
14
Studies that are related to the problem of pollution of in the Gaza Strip marine,
the marine are very few, so this is the first study to examine the heavy metals pollution.
Therefore, study is based on an assessment of heavy metals in the Wadi Gaza, North and
South downstream .
The main objectives of this study are:
To estimate the level of heavy metals (Cu, Mn ,Zn ,Cd , Pb ,Ni ) in the
downstream of Wadi Gaza .
To determine the heavy metal in the marine sediments in North and South of
Wadi downstream of Wadi Gaza .
To examine the impact of Wadi Gaza pollution on beach .
The major sources of coastal and marine pollution originating from the land vary from
country to country. The nature and intensity of development activities, the size of the
human population, the state and type of industry and agriculture are but a few of the
factors contributing to each country’s unique pollution problems .
Raw sewage from Nussirate, Buraij, Maghazi, Deir El Balah and El-Zahra City is
discharged without treatment into Wadi Gaza at a rate of >15,000 m3/day. The
wastewater contaminates the adjacent wetlands, the groundwater and the beaches near the
downstream of Wadi Gaza. There is also a notable impact on groundwater quality from
infiltration into the aquifer ( UNEP, 2009).
Therefore, the study tries to find out the answer of the following questions:
What is the level of heavy metals (Cu, Mn ,Zn ,Cd ,Pb,Ni ) in Wadi Gaza ?
What is relationship of heavy metal pollution in coastal sediments with the
environment?
What is the impact of Wadi Gaza pollution on beach ?
15
Heavy metals are deemed serious pollutants because of toxicity, persistence and non-
degradability in the environment sediment contamination poses one of the worst
environmental problems in marine ecosystems, acting as sinks and sources of
contaminants in aquatic systems . Some of the important documented contributions
relevant to the present study are as follows divided on the basis of geographical
distribution: :
, Surface seawater and surficial sediment samples were collected from
the Egyptian Mediterranean beach during May 2010 to study the impact of land based
activity on the distribution of mercury and tin. The obtained data indicated that Nile
Delta, Port Said and Alexandria beaches, which are the most industrialized areas in the
Egyptian Mediterranean Sea, showed high levels of mercury in water compared to other
studied sites. These areas receive huge amounts of wastes from many sources
(Hamed et al., 2013).
The study discusses the geochemistry and texture of marine surface-sediments in selected
areas along Hurghada area, in order to assess the possible influence of human activities
on the composition of the sediments, to test for anomalous enrichments in heavy metals,
and to evaluate and quantify metal release into the sea.
Comparing the current findings with other regional data and other areas in the world
clarifies that the metal pollution in Hurghada area is still localized and low. A
comparison of the gained data from this study with existing guidelines clearly indicates
that nearly the metal concentrations were in the range of natural unpolluted sediments
(Mansour et al., 2013).
, The effect of sediment size on metals bioleaching from bay
sediments was investigated by using fine (< 45 μm), medium (45–300 μm), and coarse
(300–2000 μm) size fractions of a sediment sample contaminated with Cr, Cu, Pb, and

16
Zn. Chemical speciation of the metals in bulk and size fractions of sediment were studied
before and after bioleaching.
The changes in the chemical forms of metals were determined and most of the metal
releases were observed from the reducible and organic fractions independent from grain
size. Higher concentrations were monitored in the residual fraction after bioleaching
period, suggesting they are trapped in this fraction, and cannot be solubilized under
natural conditions (Guven & Akinci, 2014).
Concentrations of heavy metals were measured in sediment and water
from Malaga Bay (South Spain). In the later twentieth century, cities such as Malaga,
have suffered the impact of mass summer tourism. The ancient industrial activities, and
the actual urbanization and coastal development, recreation and tourism, wastewaters
treatment facilities, have been sources of marine pollution. In sediments, Ni was the
most disturbing metal because Ni concentrations exceeded the effects range low (ERL),
concentration at which toxicity could start to be observed in 85% of the samples
analyzed. The metal bioavailability decreased in the order: Cd > Ni > Pb > Cu > Cr
(Alonso Castillo et al., 2013).
, Concentrations of cadmium, chromium, copper, iron, lead,
manganese, nickel, strontium and zinc were determined in water, sediment and fish
tissues (gills, liver, muscle and bones) of the common roach(Rutilus rutilus) in the
Etueffont landfill draining system pond (Belfort, France), during summer and autumn in
2011. Metal concentrations in the water were higher in summer, whereas in sediment
they were higher in autumn, except for lead. In fish tissues, the trend in the mean metal
concentrations was:Zn > Fe > Sr > Mn > Cu > Cr > Cd ≈ Pb ≈ Ni for gills and muscle.
Gills and liver showed greater accumulation than muscle and bones, while bones were
subjected to concentrations of metals known to interact with calcium such as Mn, Sr and
Zn. The tissues accumulated essential metals such as Fe, Zn, Cu, Mn and Sr ,which are
also found in high concentrations in both sediment and water (Ben Salem et al,. 2014).
17
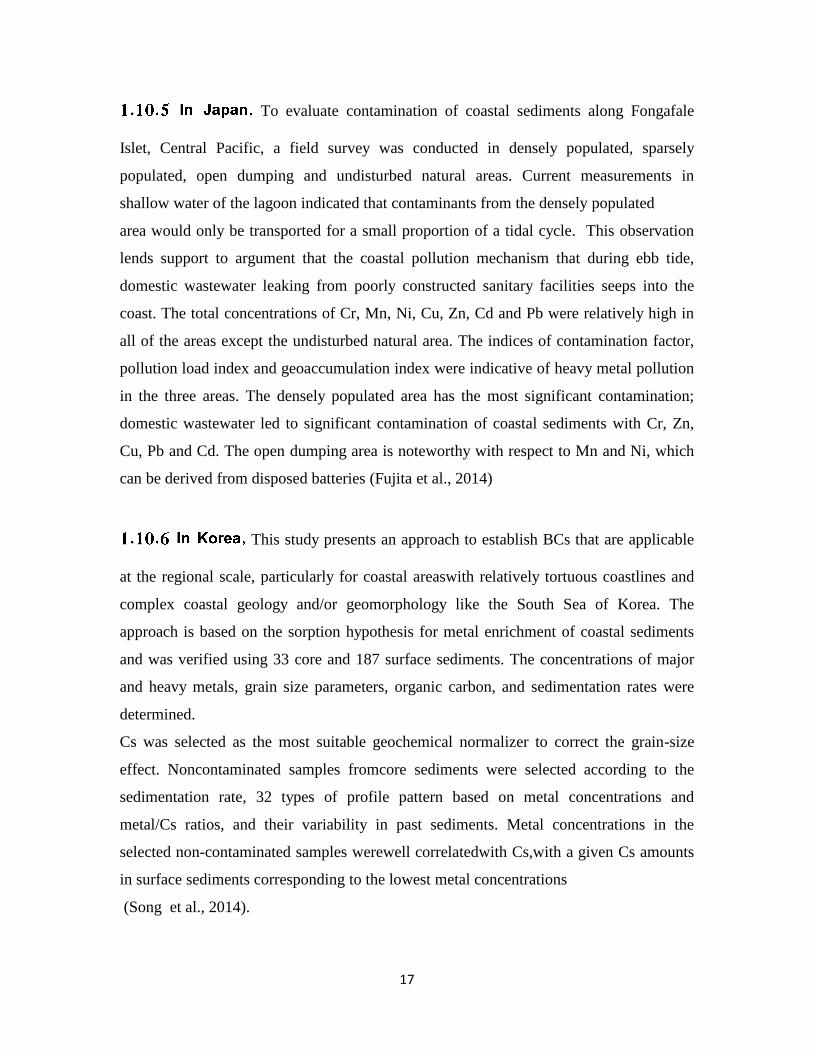
To evaluate contamination of coastal sediments along Fongafale
Islet, Central Pacific, a field survey was conducted in densely populated, sparsely
populated, open dumping and undisturbed natural areas. Current measurements in
shallow water of the lagoon indicated that contaminants from the densely populated
area would only be transported for a small proportion of a tidal cycle. This observation
lends support to argument that the coastal pollution mechanism that during ebb tide,
domestic wastewater leaking from poorly constructed sanitary facilities seeps into the
coast. The total concentrations of Cr, Mn, Ni, Cu, Zn, Cd and Pb were relatively high in
all of the areas except the undisturbed natural area. The indices of contamination factor,
pollution load index and geoaccumulation index were indicative of heavy metal pollution
in the three areas. The densely populated area has the most significant contamination;
domestic wastewater led to significant contamination of coastal sediments with Cr, Zn,
Cu, Pb and Cd. The open dumping area is noteworthy with respect to Mn and Ni, which
can be derived from disposed batteries (Fujita et al., 2014)
This study presents an approach to establish BCs that are applicable
at the regional scale, particularly for coastal areaswith relatively tortuous coastlines and
complex coastal geology and/or geomorphology like the South Sea of Korea. The
approach is based on the sorption hypothesis for metal enrichment of coastal sediments
and was verified using 33 core and 187 surface sediments. The concentrations of major
and heavy metals, grain size parameters, organic carbon, and sedimentation rates were
determined.
Cs was selected as the most suitable geochemical normalizer to correct the grain-size
effect. Noncontaminated samples fromcore sediments were selected according to the
sedimentation rate, 32 types of profile pattern based on metal concentrations and
metal/Cs ratios, and their variability in past sediments. Metal concentrations in the
selected non-contaminated samples werewell correlatedwith Cs,with a given Cs amounts
in surface sediments corresponding to the lowest metal concentrations
(Song et al., 2014).
18
Soils were sampled in three types of wetlands from the young (A)
and old (B) reclaimed regions of the Pearl River Estuary. They were analyzed for total
concentrations of heavy metals to investigate their distributions and pollution levels in
both regions. Results showed that most heavy metals in ditch and riparian wetlands did
not significantly differ from those in reclaimed wetlands in A region, while
significantly lower for Cd, Cu, Pb, and Zn in reclaimed wetlands in B region, suggesting
higher effects of long-term reclamation. Iron, Cr and Cu were identified as metal
pollutants of primary concern and had higher contributions to the total toxic units
compared to other metals. Almost all metals exceeded their lowest effect levels and Fe
and Cr even exceeded the severe effect levels. Multivariate analysis shows that
Fe and Mn are controlled by parent rocks and other metals mainly originate from
anthropogenic source ( Bai et al., 2011) .
, Most heavy metals are well-known toxic and carcinogenic agents and
when discharged into the wastewater represent a serious threat to the human population
and the fauna and flora of the receiving water bodies. In the present review paper, the
sources have discussed the industrial source of heavy metals contamination in water, their
toxic effects on the fauna and flora and the regulatory threshold limits of these heavy
metals. The various parameters of the biofiltration processes, their mechanism for heavy
metals removal along with the kinetics of biofilters and its modeling aspects
have been discussed. The comparison of various physico-chemical treatment and the
advantages of biofiltration over other conventional processes for treatment of heavy
metals contaminated wastewater have also been discussed. The applications of genetic
engineering in the modification of the microorganisms for increasing the efficiency of the
biofiltration process for heavy metals removal have been critically analyzed. The results
show that the efficiency of the process can be increased three to six folds with the
application of recombinant microbial treatment (Srivastava et al., 2008) .
19
, The distribution of the elements Al, Fe and selected heavy metals (Pb,
Zn, Cd, Cu and Cr) plus the organic matter in the sedimentary substratum of the
mangrove ecosystem that surrounds the estuary of the Sauípe River (Bahia, Brazil) is
presented. Mangrove sediments were collected from six stations from where each sample
was collected from the interface water-sediment till the depth of 50 cm and its location
was in accordance to the inter-tidal transection in order to characterize the three
mangrove stands (proximal, intermediate and distal spatial position in relation to the main
river channel). The results are important to subsidize any further studies in this region
that require local geochemical references. The substratum of the Sauípe River's mangrove
is in accordance with the other mangroves that occur in the Bahia State where there is no
evidence of anthropic source of pollution (Reitermajer et al., 2011).
Generally, studies concerning heavy metals concentrations in Gaza Strip are rather little.
In 2009 an assessment were performed by United Nations Environment Programmer
(UNEP), to evaluate heavy metal concentrations in soil, drinking water and sewage water
following the last war in December 2008. Results showed that untreated (and even partly
treated) sewage sludge contains large quantities of pathogen as well as elevated levels of
heavy metals (UNEP, 2009).
Performed a study to detect some heavy metals ( Zn, Cu, Ag, Pb, Hg and Cd ) levels in
some fruit and leaves grown in the polluted soil due to sewage water diffusion into
planted land of Um Al Nasser village. Results showed a significant pollution of plants
with some of the studied metals, which exceeded in some cases the allowed values
approved by WHO and FAO (Nejem et al., 2009).
Heavy metal concentrations in commercially available fishes in Gaza Strip markets
concentrations of Zinc, Lead, Cadmium, Manganese, Copper and Nickel were determined
in the muscles of six commercial fish species available in Gaza Strip markets, using
20
atomic absorption spectroscopy after a modified wet digestion process. The estimated
maximum total dietary intakes of all metals from the studied fishes were below the
maximum acceptable daily intake values set by WHO (1993) and USA National Research
Council (1989). Results showed that according to metals levels, consumption of studied
fish had no threat to consumers health (Muzyed, 2011).
21
22
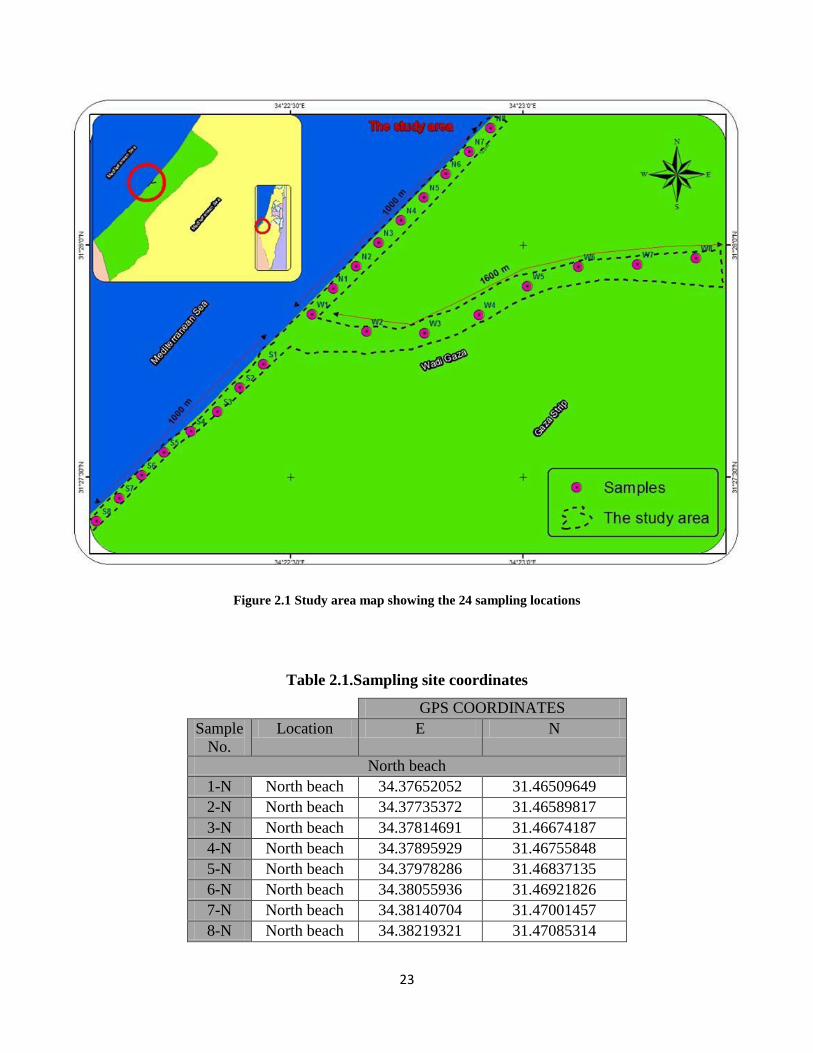
Sediment samples were collected from three study areas in: Wadi Gaza and the north and
south of the mouth of Wadi Gaza, where the samples were collected in March 2014.
Total of twenty four sample locations collected for the assessment of heavy metal (Fig
2.1).
The distribution of samples are as follows:
a) Eight samples from the area of Wadi Gaza, the distance between the each sample and
the other about 200 m.
b) Eight samples from the mouth North of Wadi Gaza (Gaza beach), distance between
the sample and other about 120 m.
c) eight samples downstream from South Wadi Gaza (Gaza beach), distance between
the sample and the other about120 m.
The sediment samples were taken from Wadi Gaza and the beach. The sediment sampling
sites selected for these investigations were diverse in terms of depositional environment,
approximately ~1 kg of sediment was collected .
Samples were placed in polyethylene bags, and transported to the laboratory.
Based on the evaluation, a set of maps were create . It included details of the most
severely locations and environmental priority sites (wastewater treatment plants,
dumping sites, agro-industrial facilities). Figure 2.1 The maps show all points of
concern, using Global Positioning System (GPS) devices (Garmin 72 and Garmin Oregon
400),Table 2.1 Show record of the coordinates of sites visited and sampling points,
researcher also used Camera (Nikon CoolPix 6000).
23
Figure 2.1 Study area map showing the 24 sampling locations
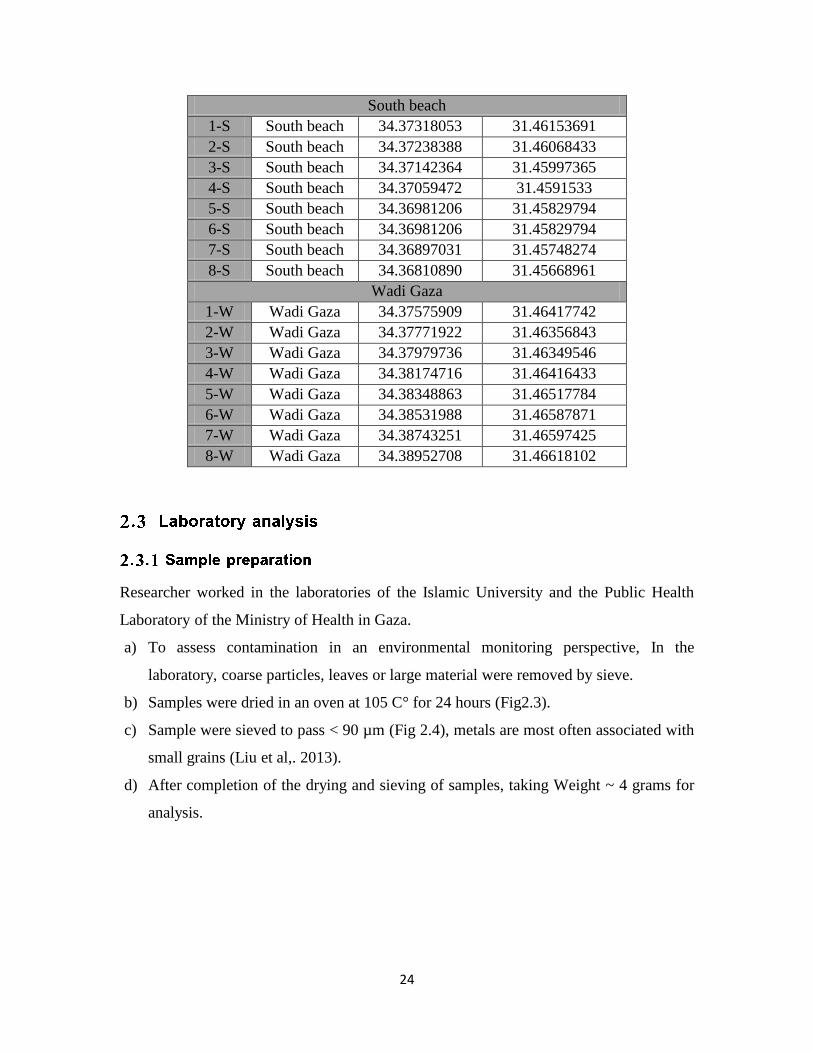
Table 2.1.Sampling site coordinates
GPS COORDINATES
Sample
No.
Location E N
North beach
1-N North beach 34.37652052 31.46509649
2-N North beach 34.37735372 31.46589817
3-N North beach 34.37814691 31.46674187
4-N North beach 34.37895929 31.46755848
5-N North beach 34.37978286 31.46837135
6-N North beach 34.38055936 31.46921826
7-N North beach 34.38140704 31.47001457
8-N North beach 34.38219321 31.47085314
24
South beach
1-S South beach 34.37318053 31.46153691
2-S South beach 34.37238388 31.46068433
3-S South beach 34.37142364 31.45997365
4-S South beach 34.37059472 31.4591533
5-S South beach 34.36981206 31.45829794
6-S South beach 34.36981206 31.45829794
7-S South beach 34.36897031 31.45748274
8-S South beach 34.36810890 31.45668961
Wadi Gaza
1-W Wadi Gaza 34.37575909 31.46417742
2-W Wadi Gaza 34.37771922 31.46356843
3-W Wadi Gaza 34.37979736 31.46349546
4-W Wadi Gaza 34.38174716 31.46416433
5-W Wadi Gaza 34.38348863 31.46517784
6-W Wadi Gaza 34.38531988 31.46587871
7-W Wadi Gaza 34.38743251 31.46597425
8-W Wadi Gaza 34.38952708 31.46618102
Researcher worked in the laboratories of the Islamic University and the Public Health
Laboratory of the Ministry of Health in Gaza.
a) To assess contamination in an environmental monitoring perspective, In the
laboratory, coarse particles, leaves or large material were removed by sieve.
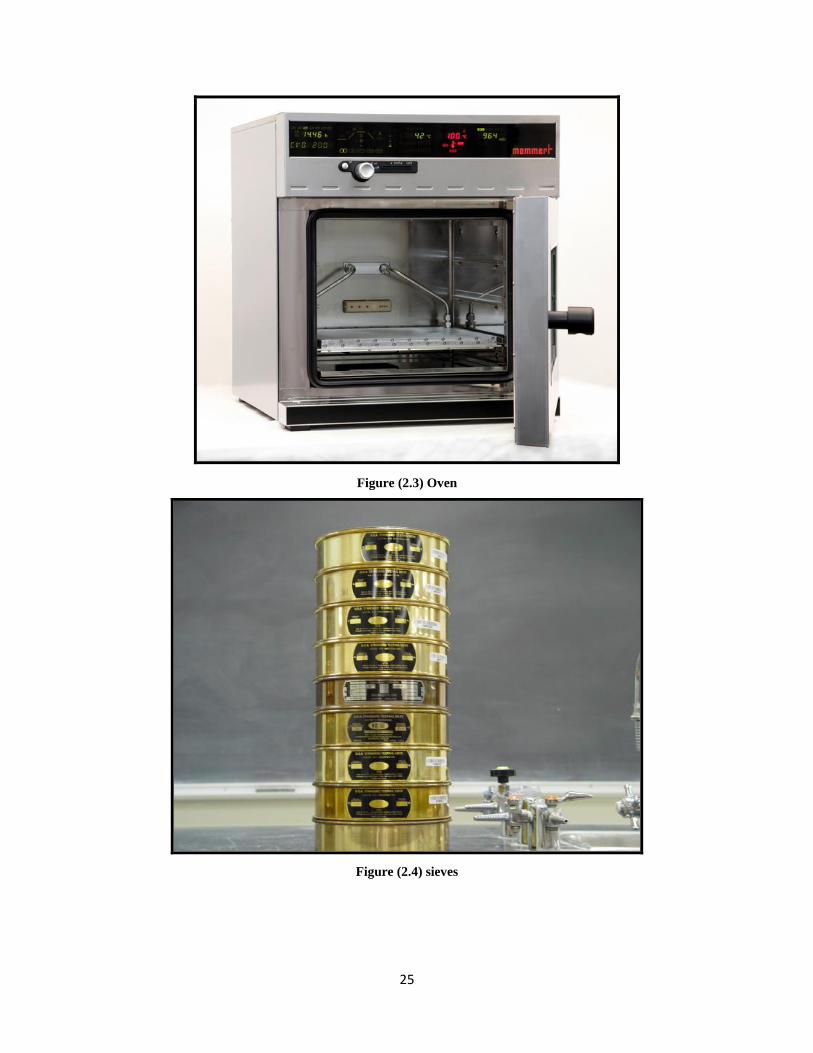
b) Samples were dried in an oven at 105 C° for 24 hours (Fig2.3).
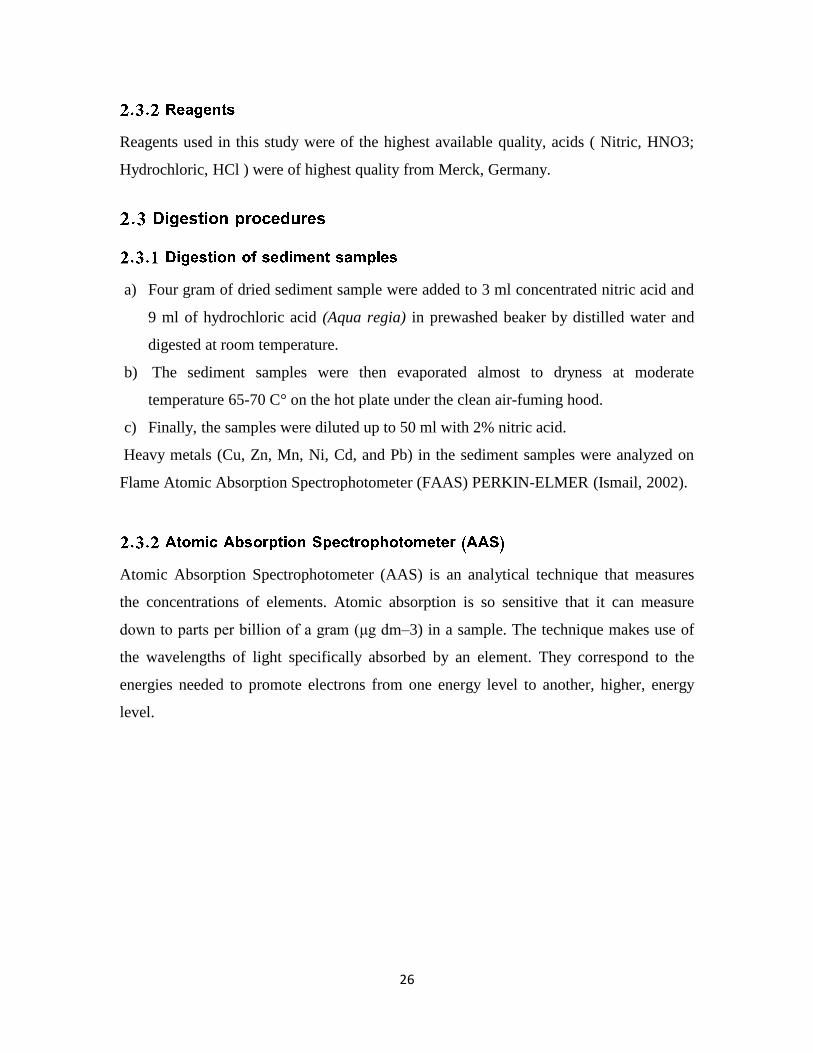
c) Sample were sieved to pass < 90 µm (Fig 2.4), metals are most often associated with
small grains (Liu et al,. 2013).
d) After completion of the drying and sieving of samples, taking Weight ~ 4 grams for
analysis.
25
Figure (2.3) Oven
Figure (2.4) sieves
26
Reagents used in this study were of the highest available quality, acids ( Nitric, HNO3;
Hydrochloric, HCl ) were of highest quality from Merck, Germany.
a) Four gram of dried sediment sample were added to 3 ml concentrated nitric acid and
9 ml of hydrochloric acid (Aqua regia) in prewashed beaker by distilled water and
digested at room temperature.
b) The sediment samples were then evaporated almost to dryness at moderate
temperature 65-70 C° on the hot plate under the clean air-fuming hood.
c) Finally, the samples were diluted up to 50 ml with 2% nitric acid.
Heavy metals (Cu, Zn, Mn, Ni, Cd, and Pb) in the sediment samples were analyzed on
Flame Atomic Absorption Spectrophotometer (FAAS) PERKIN-ELMER (Ismail, 2002).
Atomic Absorption Spectrophotometer (AAS) is an analytical technique that measures
the concentrations of elements. Atomic absorption is so sensitive that it can measure
down to parts per billion of a gram (μg dm–3) in a sample. The technique makes use of
the wavelengths of light specifically absorbed by an element. They correspond to the
energies needed to promote electrons from one energy level to another, higher, energy
level.
27
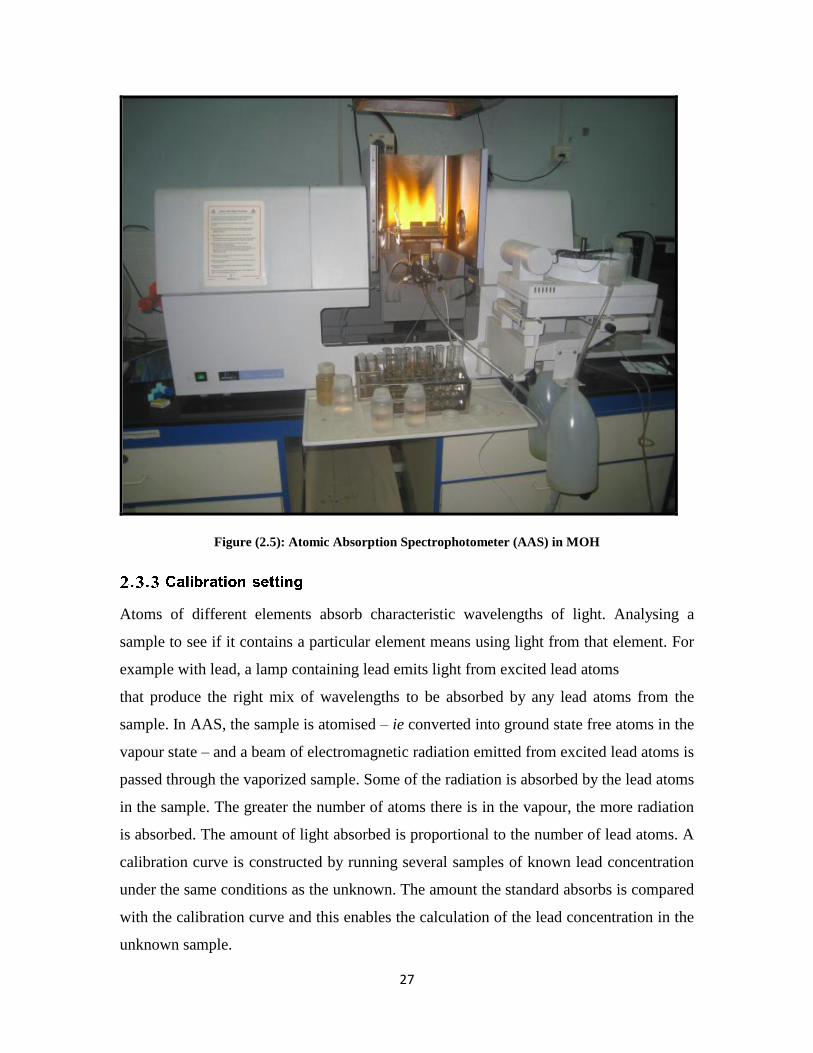
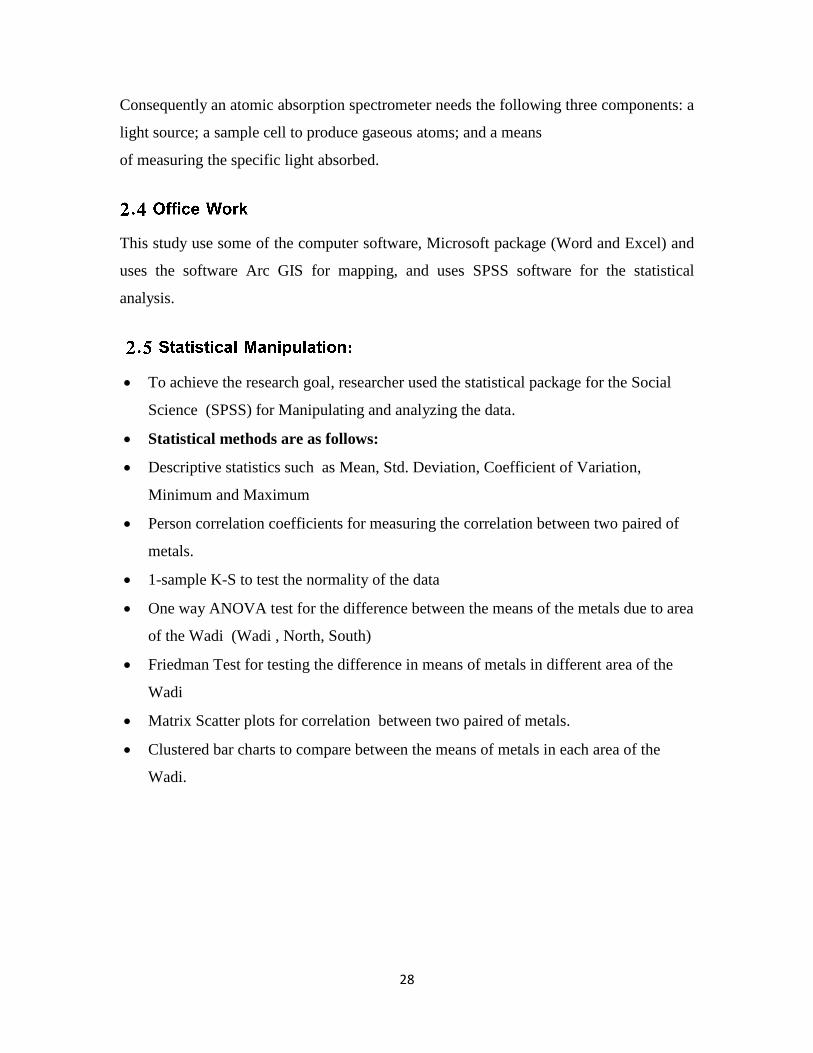
Figure (2.5): Atomic Absorption Spectrophotometer (AAS) in MOH
Atoms of different elements absorb characteristic wavelengths of light. Analysing a
sample to see if it contains a particular element means using light from that element. For
example with lead, a lamp containing lead emits light from excited lead atoms
that produce the right mix of wavelengths to be absorbed by any lead atoms from the
sample. In AAS, the sample is atomised – ie converted into ground state free atoms in the
vapour state – and a beam of electromagnetic radiation emitted from excited lead atoms is
passed through the vaporized sample. Some of the radiation is absorbed by the lead atoms
in the sample. The greater the number of atoms there is in the vapour, the more radiation
is absorbed. The amount of light absorbed is proportional to the number of lead atoms. A
calibration curve is constructed by running several samples of known lead concentration
under the same conditions as the unknown. The amount the standard absorbs is compared
with the calibration curve and this enables the calculation of the lead concentration in the
unknown sample.
28
Consequently an atomic absorption spectrometer needs the following three components: a
light source; a sample cell to produce gaseous atoms; and a means
of measuring the specific light absorbed.
This study use some of the computer software, Microsoft package (Word and Excel) and
uses the software Arc GIS for mapping, and uses SPSS software for the statistical
analysis.
To achieve the research goal, researcher used the statistical package for the Social
Science (SPSS) for Manipulating and analyzing the data.
Statistical methods are as follows:
Descriptive statistics such as Mean, Std. Deviation, Coefficient of Variation,
Minimum and Maximum
Person correlation coefficients for measuring the correlation between two paired of
metals.
1-sample K-S to test the normality of the data
One way ANOVA test for the difference between the means of the metals due to area
of the Wadi (Wadi , North, South)
Friedman Test for testing the difference in means of metals in different area of the
Wadi
Matrix Scatter plots for correlation between two paired of metals.
Clustered bar charts to compare between the means of metals in each area of the
Wadi.
29
30
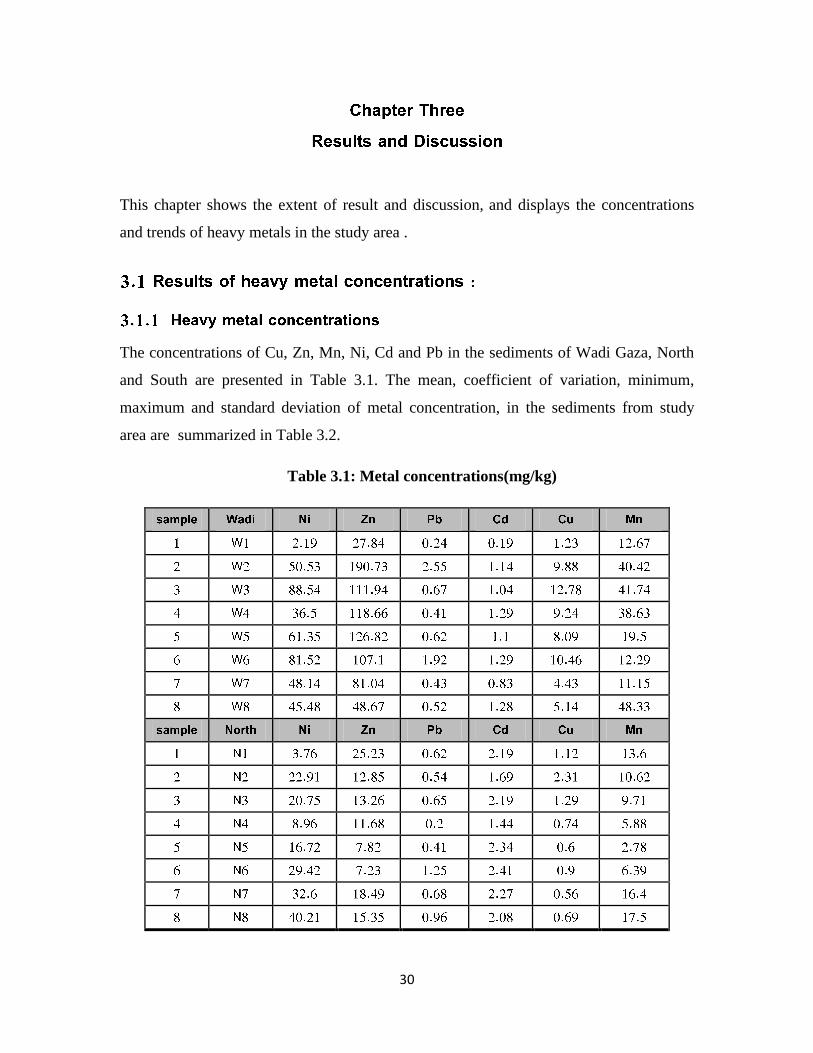
This chapter shows the extent of result and discussion, and displays the concentrations
and trends of heavy metals in the study area .
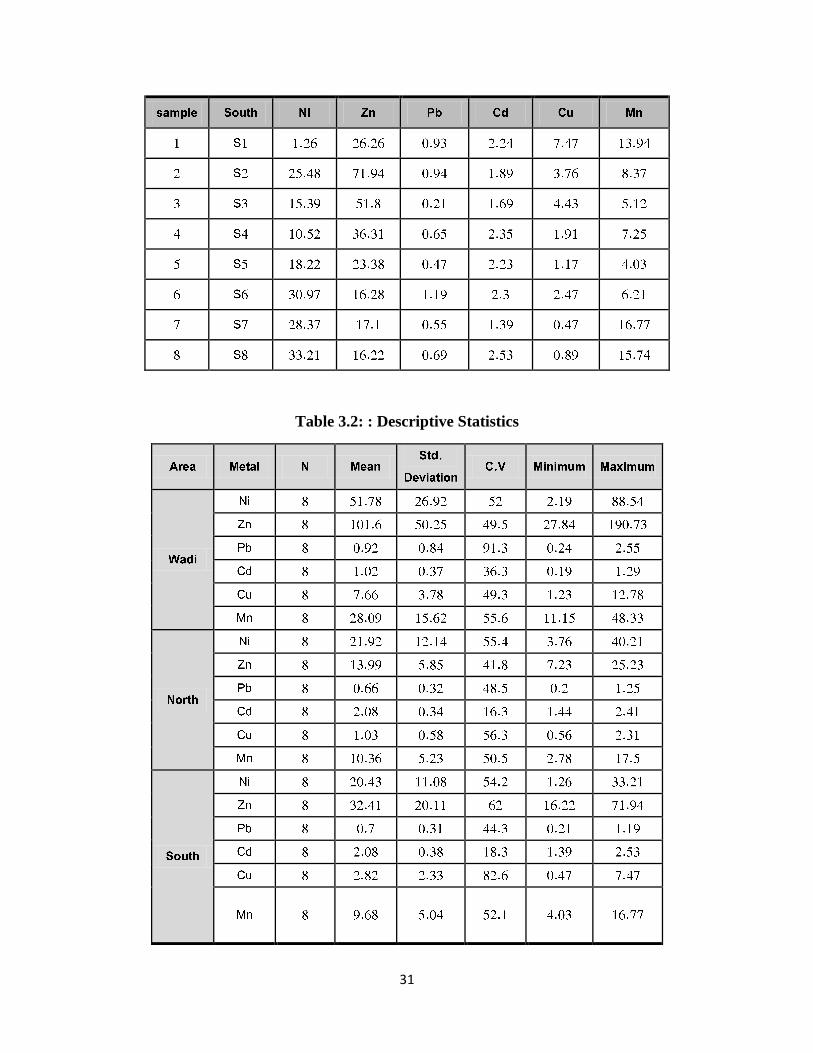
The concentrations of Cu, Zn, Mn, Ni, Cd and Pb in the sediments of Wadi Gaza, North
and South are presented in Table 3.1. The mean, coefficient of variation, minimum,
maximum and standard deviation of metal concentration, in the sediments from study
area are summarized in Table 3.2.
Table 3.1: Metal concentrations(mg/kg)
31
Table 3.2: : Descriptive Statistics
32
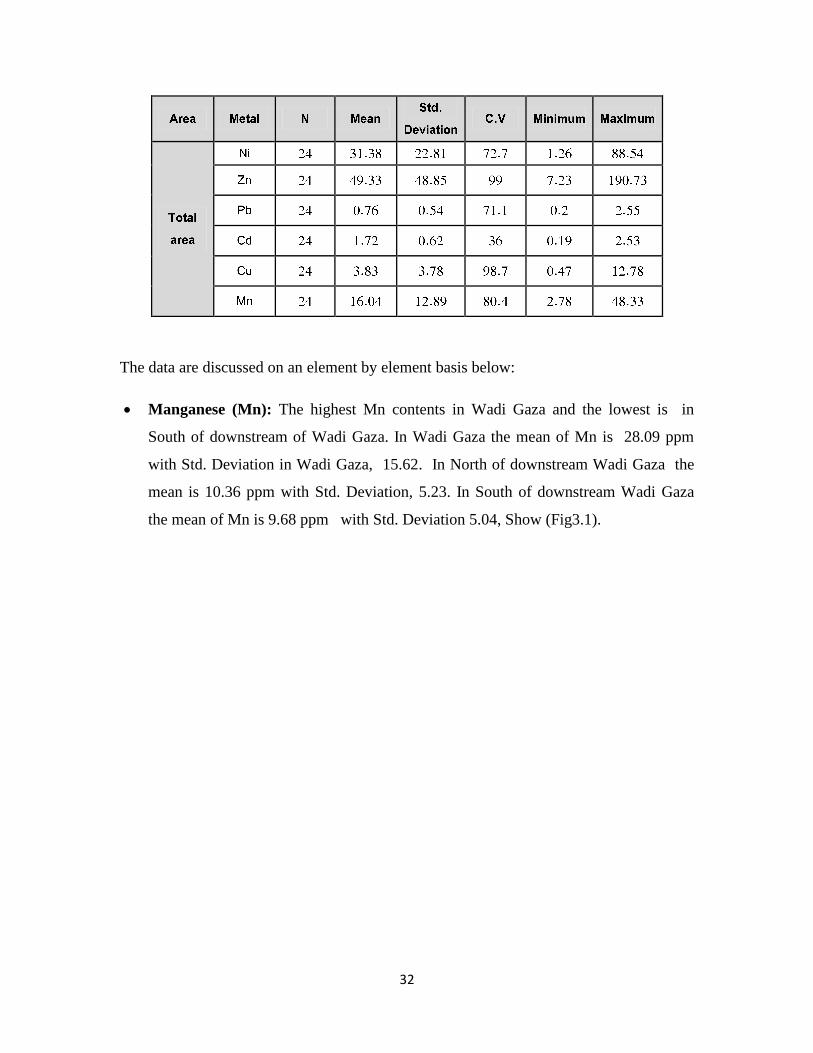
The data are discussed on an element by element basis below:
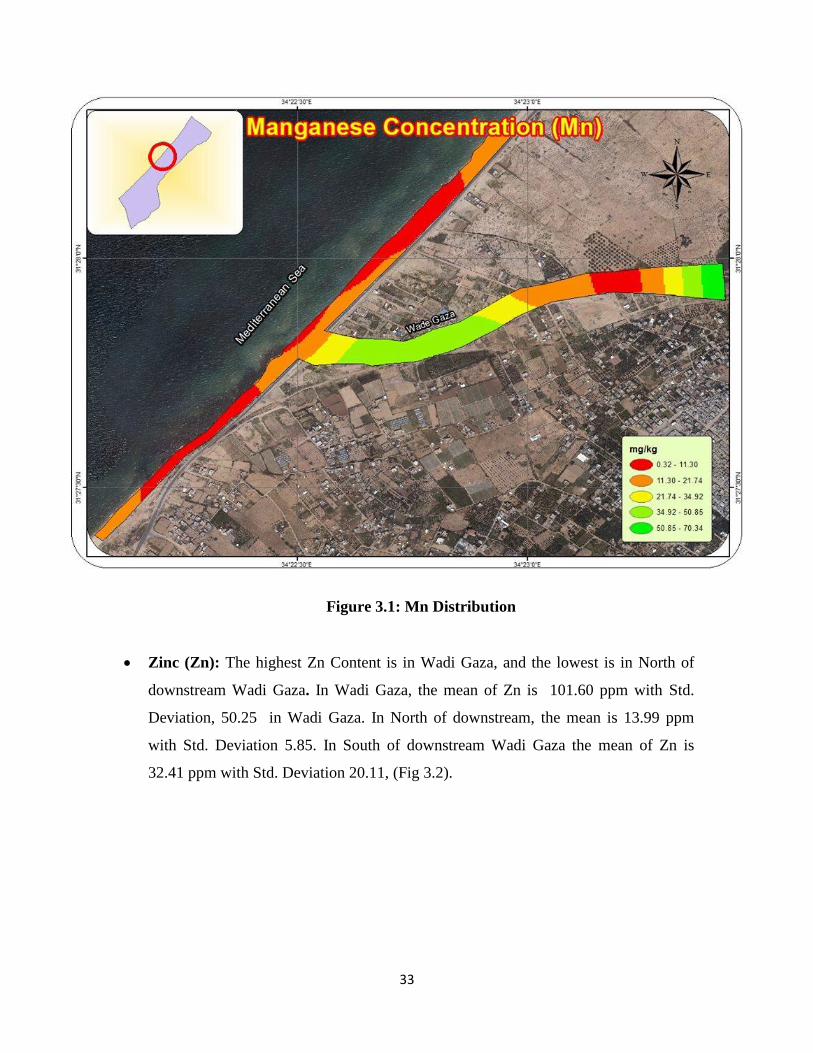
Manganese (Mn): The highest Mn contents in Wadi Gaza and the lowest is in
South of downstream of Wadi Gaza. In Wadi Gaza the mean of Mn is 28.09 ppm
with Std. Deviation in Wadi Gaza, 15.62. In North of downstream Wadi Gaza the
mean is 10.36 ppm with Std. Deviation, 5.23. In South of downstream Wadi Gaza
the mean of Mn is 9.68 ppm with Std. Deviation 5.04, Show (Fig3.1).
33
Figure 3.1: Mn Distribution
Zinc (Zn): The highest Zn Content is in Wadi Gaza, and the lowest is in North of
downstream Wadi Gaza. In Wadi Gaza, the mean of Zn is 101.60 ppm with Std.
Deviation, 50.25 in Wadi Gaza. In North of downstream, the mean is 13.99 ppm
with Std. Deviation 5.85. In South of downstream Wadi Gaza the mean of Zn is
32.41 ppm with Std. Deviation 20.11, (Fig 3.2).

34
Figure 3.2: Zn Distribution
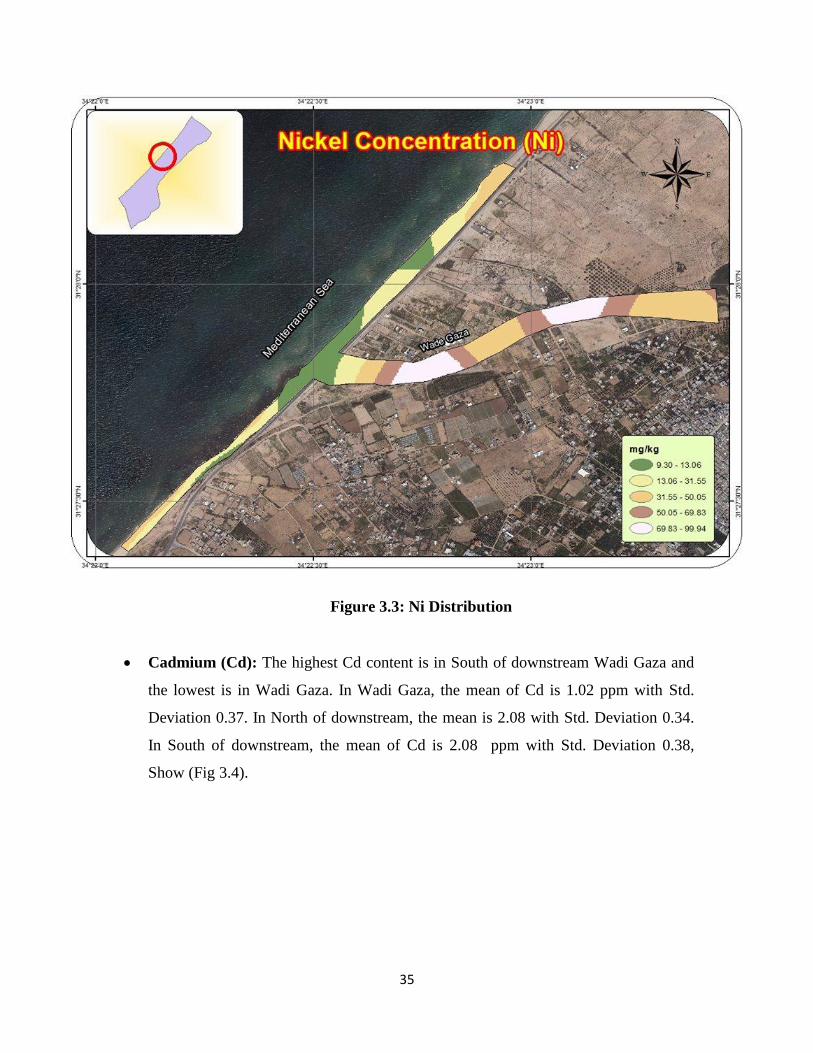
Nickel (Ni): The highest Ni Content is in Wadi Gaza and the lowest is in South of
downstream Wadi Gaza. In Wadi Gaza, the mean of Ni is 51.78 ppm with Std.
Deviation in Wadi Gaza 26.92. In North of downstream Wadi Gaza, the mean is
21.92 ppm with Std. Deviation 12.14. In South of downstream Wadi Gaza, the mean
of Ni is 20.43 ppm with Std. Deviation 11.08, Show (Fig 3.3).
35
Figure 3.3: Ni Distribution
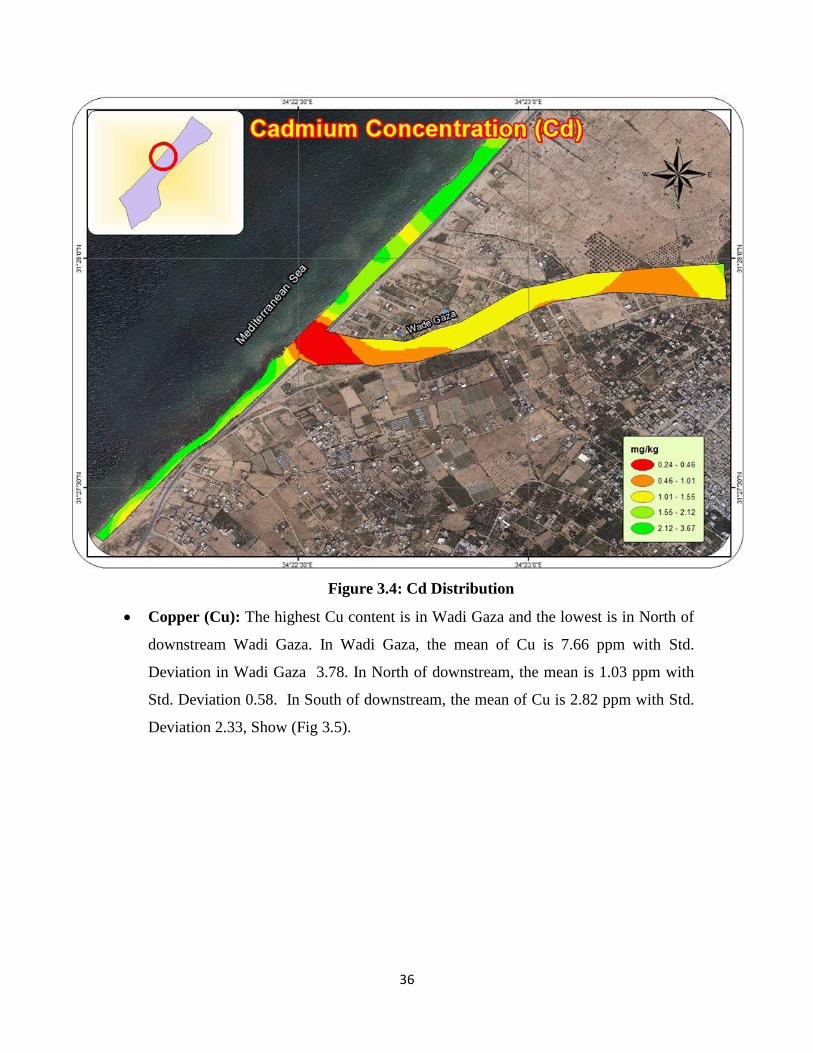
Cadmium (Cd): The highest Cd content is in South of downstream Wadi Gaza and
the lowest is in Wadi Gaza. In Wadi Gaza, the mean of Cd is 1.02 ppm with Std.
Deviation 0.37. In North of downstream, the mean is 2.08 with Std. Deviation 0.34.
In South of downstream, the mean of Cd is 2.08 ppm with Std. Deviation 0.38,
Show (Fig 3.4).
36
Figure 3.4: Cd Distribution
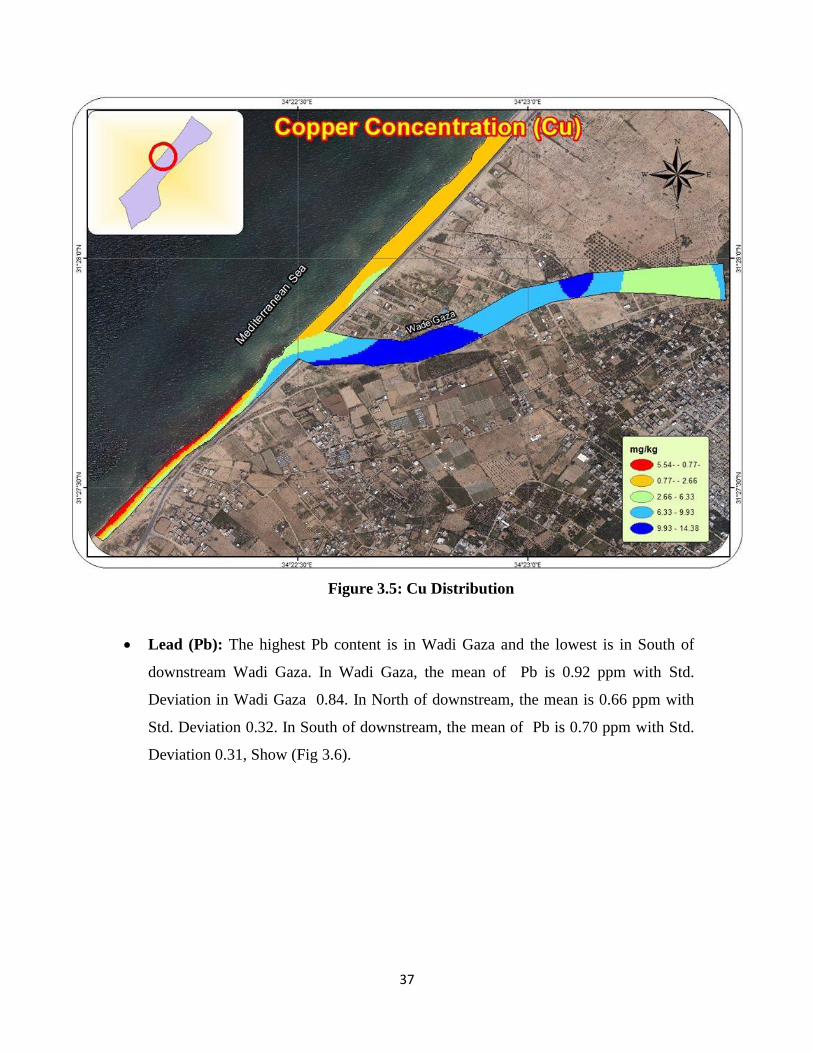
Copper (Cu): The highest Cu content is in Wadi Gaza and the lowest is in North of
downstream Wadi Gaza. In Wadi Gaza, the mean of Cu is 7.66 ppm with Std.
Deviation in Wadi Gaza 3.78. In North of downstream, the mean is 1.03 ppm with
Std. Deviation 0.58. In South of downstream, the mean of Cu is 2.82 ppm with Std.
Deviation 2.33, Show (Fig 3.5).
37
Figure 3.5: Cu Distribution
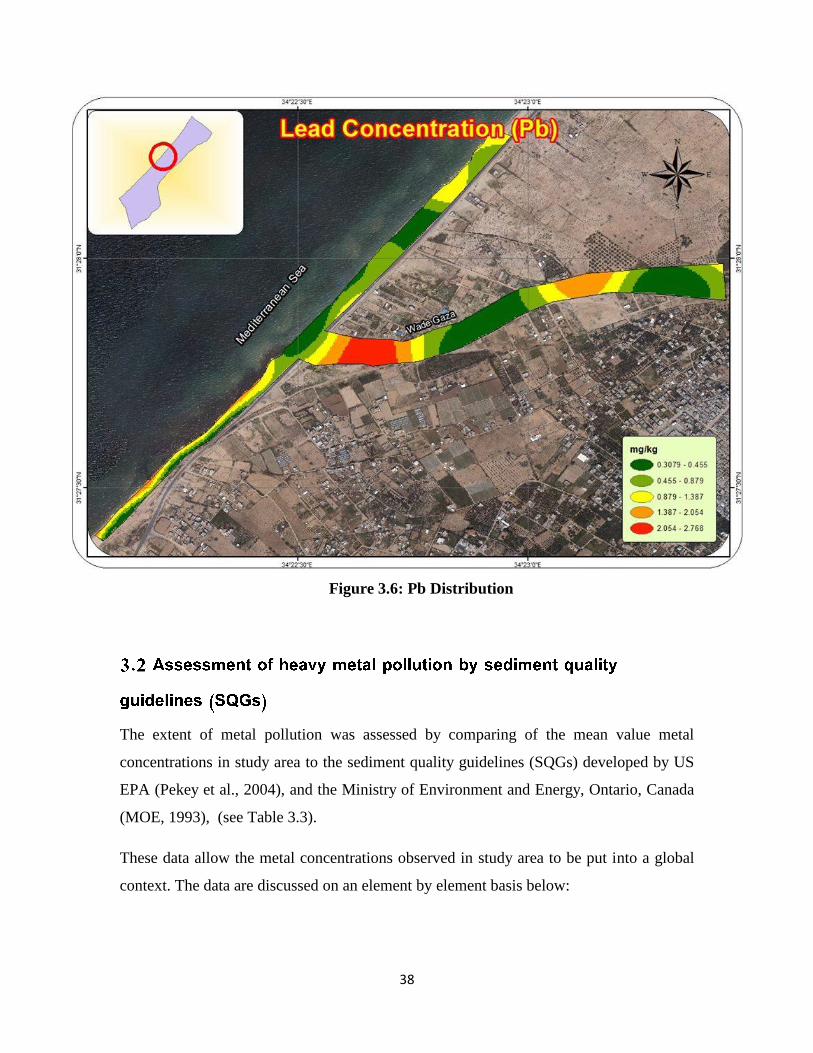
Lead (Pb): The highest Pb content is in Wadi Gaza and the lowest is in South of
downstream Wadi Gaza. In Wadi Gaza, the mean of Pb is 0.92 ppm with Std.
Deviation in Wadi Gaza 0.84. In North of downstream, the mean is 0.66 ppm with
Std. Deviation 0.32. In South of downstream, the mean of Pb is 0.70 ppm with Std.
Deviation 0.31, Show (Fig 3.6).
38
Figure 3.6: Pb Distribution
The extent of metal pollution was assessed by comparing of the mean value metal
concentrations in study area to the sediment quality guidelines (SQGs) developed by US
EPA (Pekey et al., 2004), and the Ministry of Environment and Energy, Ontario, Canada
(MOE, 1993), (see Table 3.3).
These data allow the metal concentrations observed in study area to be put into a global
context. The data are discussed on an element by element basis below:
39
.Manganese (Mn): The Ontario guidelines indicated that Mn concentration in Wadi
Gaza, North and South of downstream Wadi Gaza the lowest effect level below .
Zinc (Zn): The Ontario guidelines indicate that Zn concentration in Wadi Gaza,
North and South of downstream Wadi Gaza the lowest effect level. The US EPA
guidelines, on the other hand, indicates that the Zn in Wadi Gaza samples was
moderate polluted, North and South of downstream Wadi Gaza were non-polluted.
Nickel (Ni): The Ontario guidelines indicate that Ni concentration in Wadi Gaza and
North and South of downstream Wadi Gaza exceeded the lowest effect level. The US
EPA guidelines, on the other hand, indicates that the Ni in Wadi Gaza samples was
moderate polluted, North and South of downstream Wadi Gaza were non-polluted.
Cadmium (Cd): The Ontario guidelines indicate that Cd concentration in Wadi
Gaza and North and South of downstream Wadi Gaza exceeded the lowest effect
level. The US EPA guidelines, on the other hand, indicates that the Cd in Wadi
Gaza, North and South of downstream Wadi Gaza were non-polluted.
Copper (Cu): The Ontario guidelines indicate that Cu concentration in Wadi Gaza
and North and South of downstream Wadi Gaza the lowest effect level. The US EPA
guidelines, on the other hand, indicates that the Cu in Wadi Gaza, North and South
of downstream Wadi Gaza were non-polluted.
Lead (Pb): The Ontario guidelines indicate that Pb concentration in Wadi Gaza and
North and South of downstream Wadi Gaza the lowest effect level. The US EPA
guidelines, on the other hand, indicates that the Pb in Wadi Gaza, North and South
of downstream Wadi Gaza were non-polluted.
40
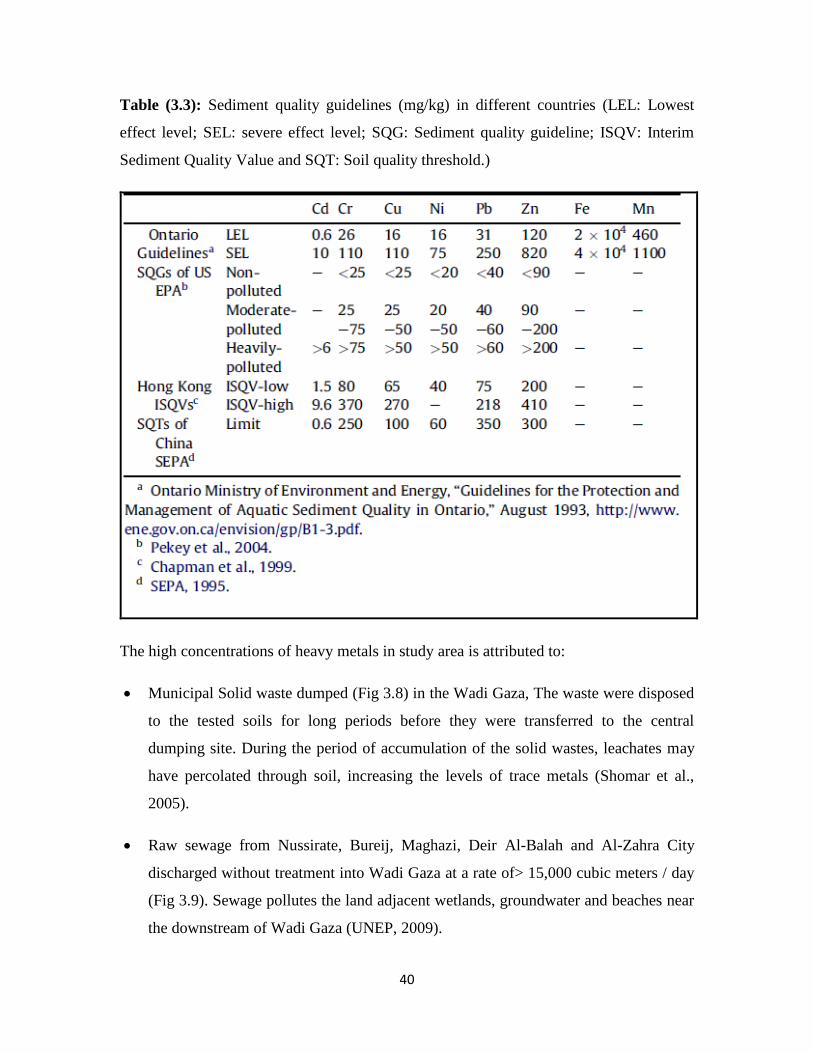
Table (3.3): Sediment quality guidelines (mg/kg) in different countries (LEL: Lowest
effect level; SEL: severe effect level; SQG: Sediment quality guideline; ISQV: Interim
Sediment Quality Value and SQT: Soil quality threshold.)
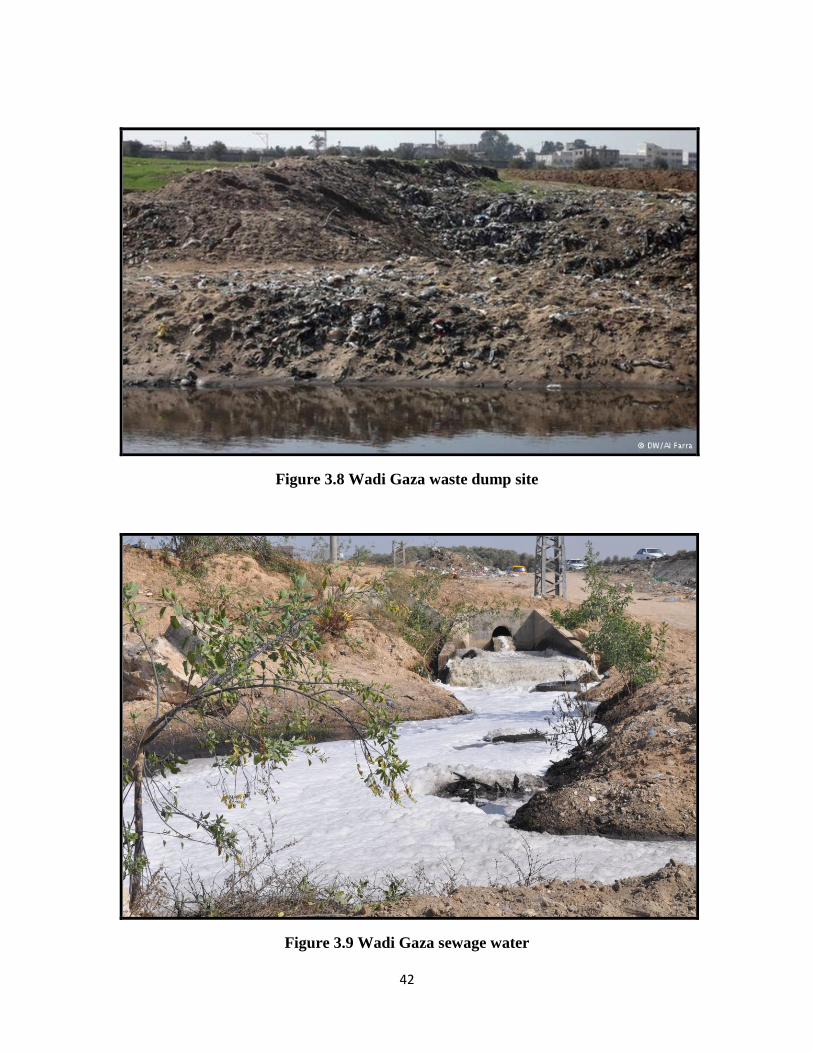
The high concentrations of heavy metals in study area is attributed to:
Municipal Solid waste dumped (Fig 3.8) in the Wadi Gaza, The waste were disposed
to the tested soils for long periods before they were transferred to the central
dumping site. During the period of accumulation of the solid wastes, leachates may
have percolated through soil, increasing the levels of trace metals (Shomar et al.,
2005).
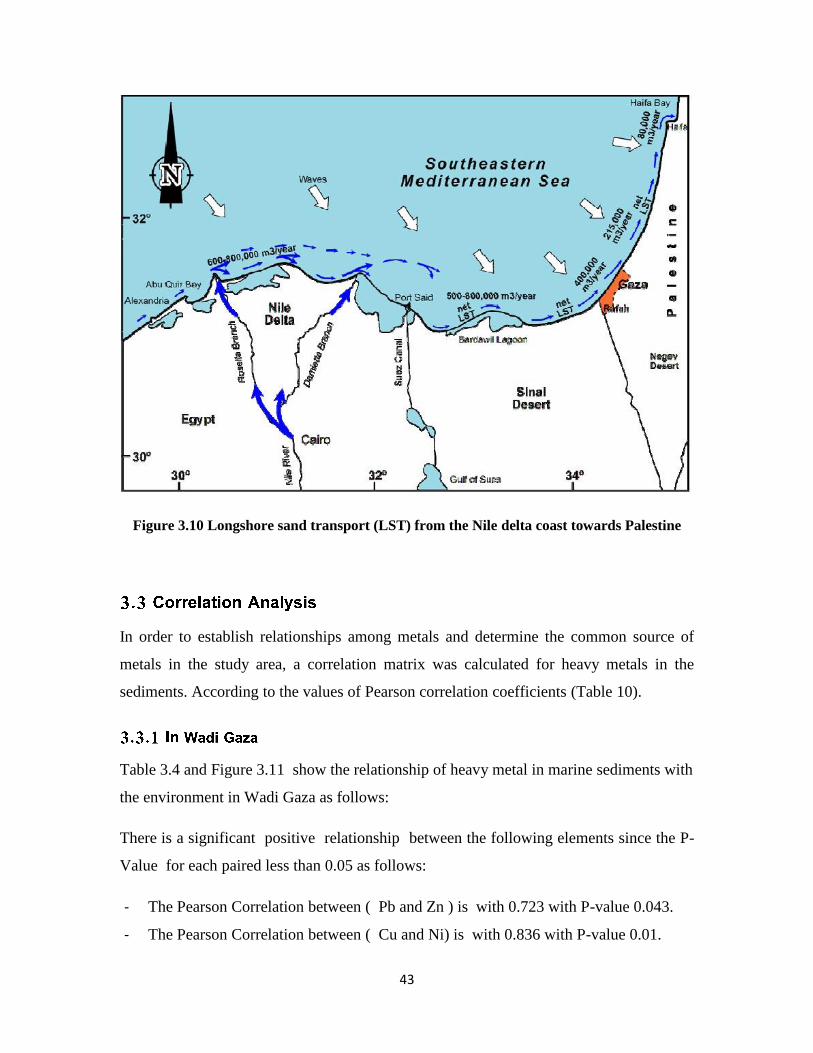
Raw sewage from Nussirate, Bureij, Maghazi, Deir Al-Balah and Al-Zahra City
discharged without treatment into Wadi Gaza at a rate of> 15,000 cubic meters / day
(Fig 3.9). Sewage pollutes the land adjacent wetlands, groundwater and beaches near
the downstream of Wadi Gaza (UNEP, 2009).
41
The presence of heavy metal in the region of the south Wadi Gaza caused by
sewage dumped into the sea, Three pumps located on the beach (EQA, 2014) .
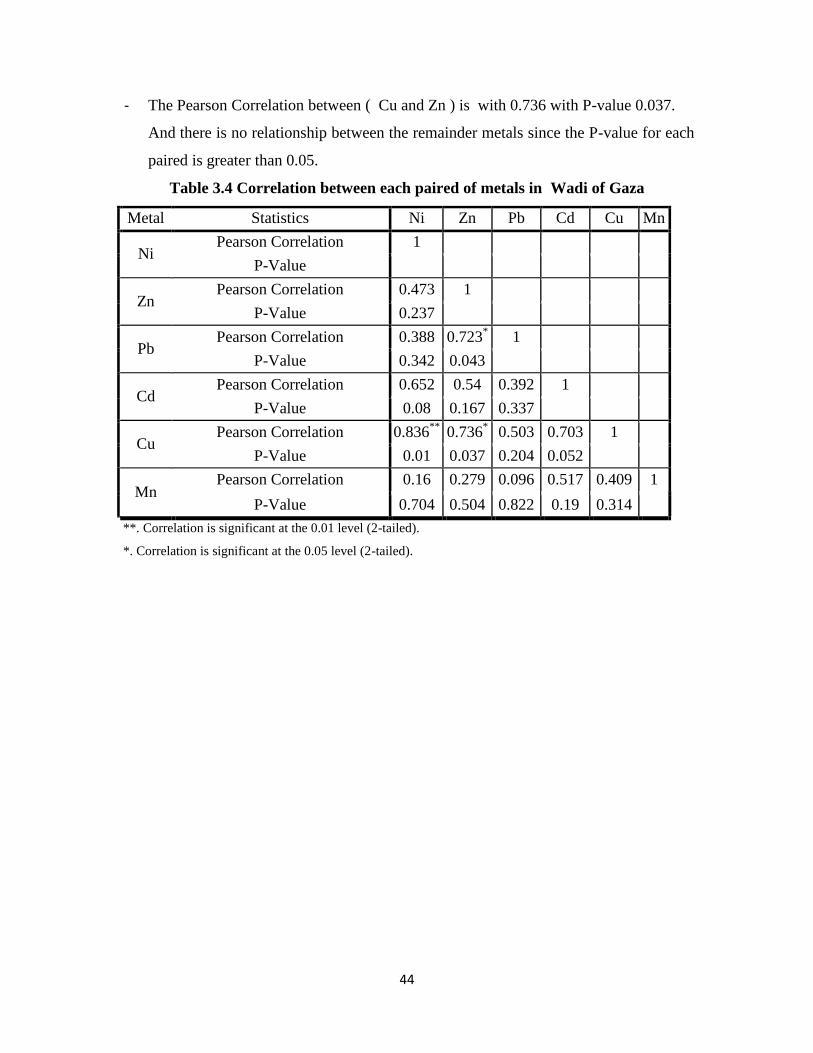
Pollutants resulting from the transfer of marine currents coming from the Nile Delta,
these currents appear to affect the transport of sediment more strongly than other
mechanisms. Its transportation northward along the Mediterranean coast results from
larger waves approaching from the WSW and SW than those from the WNW and
NW (Figure 3.10) (Ubeid, 2011).
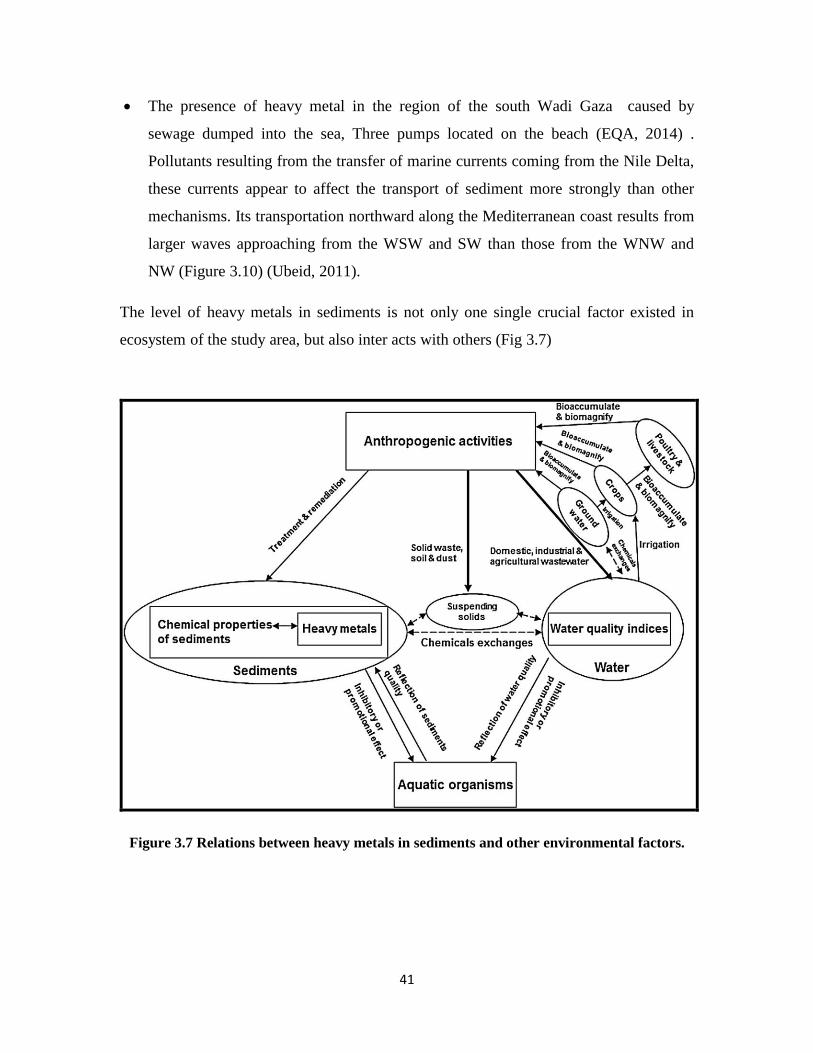
The level of heavy metals in sediments is not only one single crucial factor existed in
ecosystem of the study area, but also inter acts with others (Fig 3.7)
Figure 3.7 Relations between heavy metals in sediments and other environmental factors.
42
Figure 3.8 Wadi Gaza waste dump site
Figure 3.9 Wadi Gaza sewage water
43
Figure 3.10 Longshore sand transport (LST) from the Nile delta coast towards Palestine
In order to establish relationships among metals and determine the common source of
metals in the study area, a correlation matrix was calculated for heavy metals in the
sediments. According to the values of Pearson correlation coefficients (Table 10).
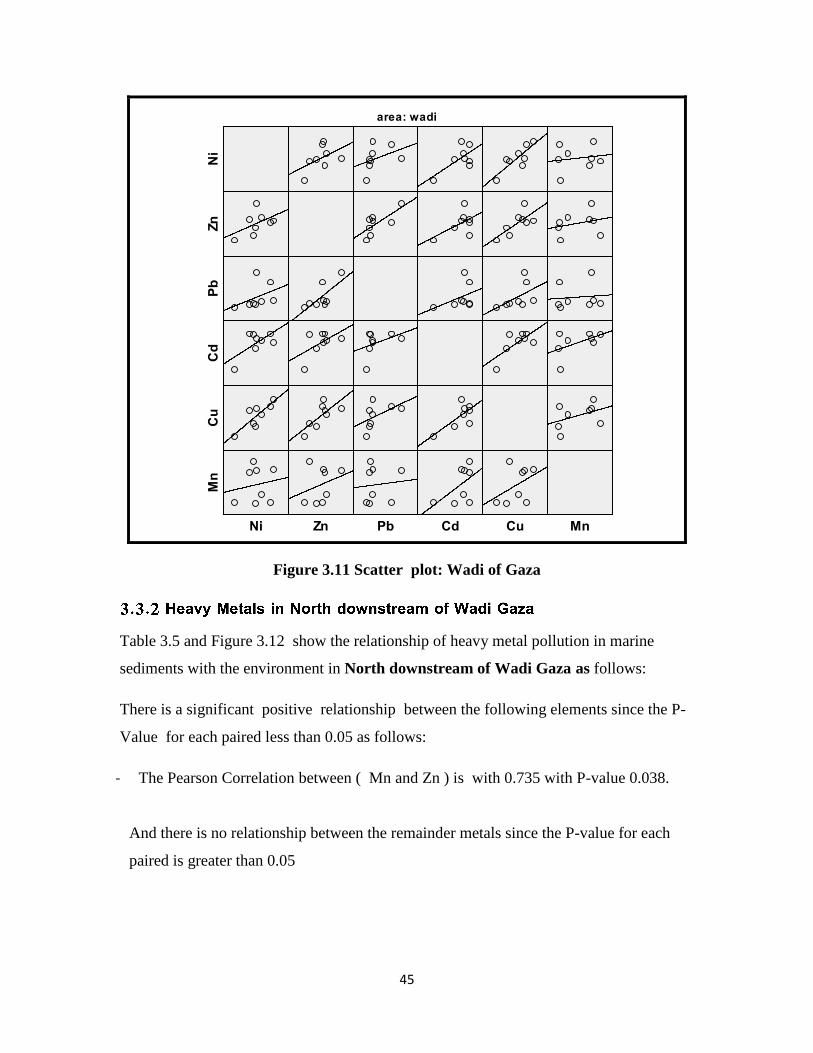
Table 3.4 and Figure 3.11 show the relationship of heavy metal in marine sediments with
the environment in Wadi Gaza as follows:
There is a significant positive relationship between the following elements since the P-
Value for each paired less than 0.05 as follows:
- The Pearson Correlation between ( Pb and Zn ) is with 0.723 with P-value 0.043.
- The Pearson Correlation between ( Cu and Ni) is with 0.836 with P-value 0.01.
44
- The Pearson Correlation between ( Cu and Zn ) is with 0.736 with P-value 0.037.
And there is no relationship between the remainder metals since the P-value for each
paired is greater than 0.05.
Table 3.4 Correlation between each paired of metals in Wadi of Gaza
Metal Statistics Ni Zn Pb Cd Cu Mn
Ni Pearson Correlation 1
P-Value
Zn Pearson Correlation 0.473 1
P-Value 0.237
Pb Pearson Correlation 0.388 0.723
* 1
P-Value 0.342 0.043
Cd Pearson Correlation 0.652 0.54 0.392 1
P-Value 0.08 0.167 0.337
Cu Pearson Correlation 0.836
** 0.736
* 0.503 0.703 1
P-Value 0.01 0.037 0.204 0.052
Mn Pearson Correlation 0.16 0.279 0.096 0.517 0.409 1
P-Value 0.704 0.504 0.822 0.19 0.314
**. Correlation is significant at the 0.01 level (2-tailed).
*. Correlation is significant at the 0.05 level (2-tailed).
45
Figure 3.11 Scatter plot: Wadi of Gaza
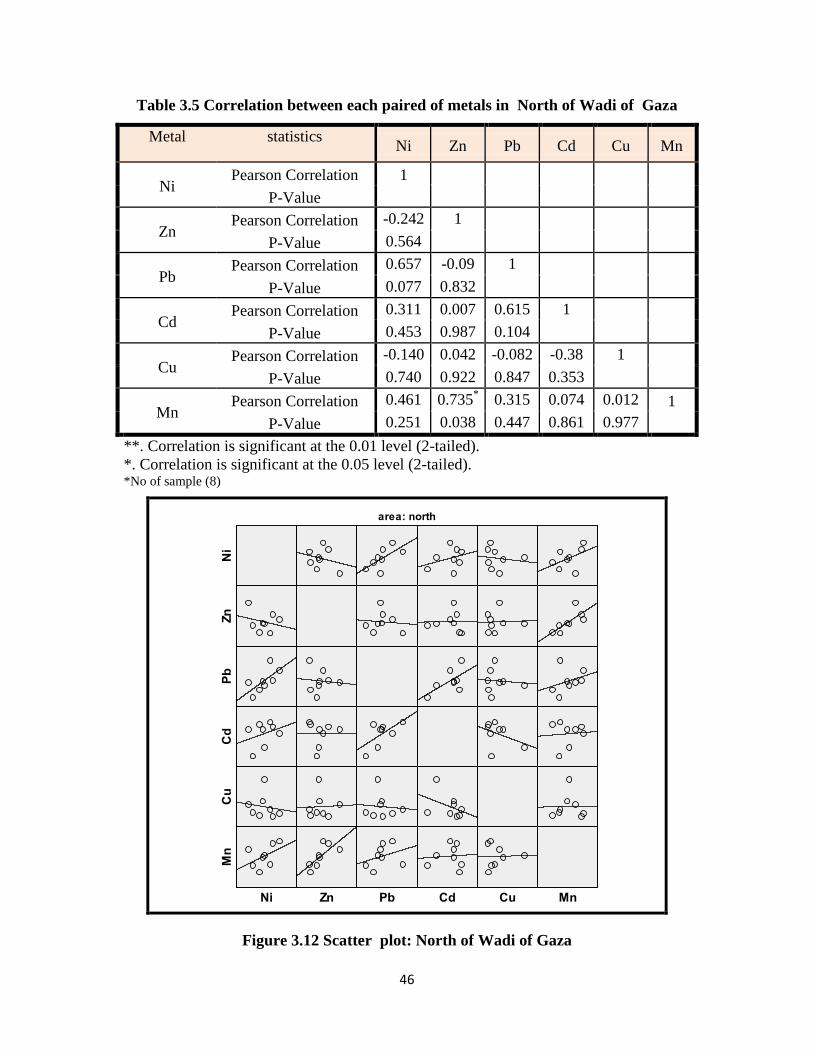
Table 3.5 and Figure 3.12 show the relationship of heavy metal pollution in marine
sediments with the environment in North downstream of Wadi Gaza as follows:
There is a significant positive relationship between the following elements since the P-
Value for each paired less than 0.05 as follows:
- The Pearson Correlation between ( Mn and Zn ) is with 0.735 with P-value 0.038.
And there is no relationship between the remainder metals since the P-value for each
paired is greater than 0.05
46
Table 3.5 Correlation between each paired of metals in North of Wadi of Gaza
Metal statistics Ni Zn Pb Cd Cu Mn
Ni Pearson Correlation 1
P-Value
Zn Pearson Correlation -0.242 1
P-Value 0.564
Pb Pearson Correlation 0.657 -0.09 1
P-Value 0.077 0.832
Cd Pearson Correlation 0.311 0.007 0.615 1
P-Value 0.453 0.987 0.104
Cu Pearson Correlation -0.140 0.042 -0.082 -0.38 1
P-Value 0.740 0.922 0.847 0.353
Mn Pearson Correlation 0.461 0.735
* 0.315 0.074 0.012 1
P-Value 0.251 0.038 0.447 0.861 0.977
**. Correlation is significant at the 0.01 level (2-tailed).
*. Correlation is significant at the 0.05 level (2-tailed). *No of sample (8)
Figure 3.12 Scatter plot: North of Wadi of Gaza
47
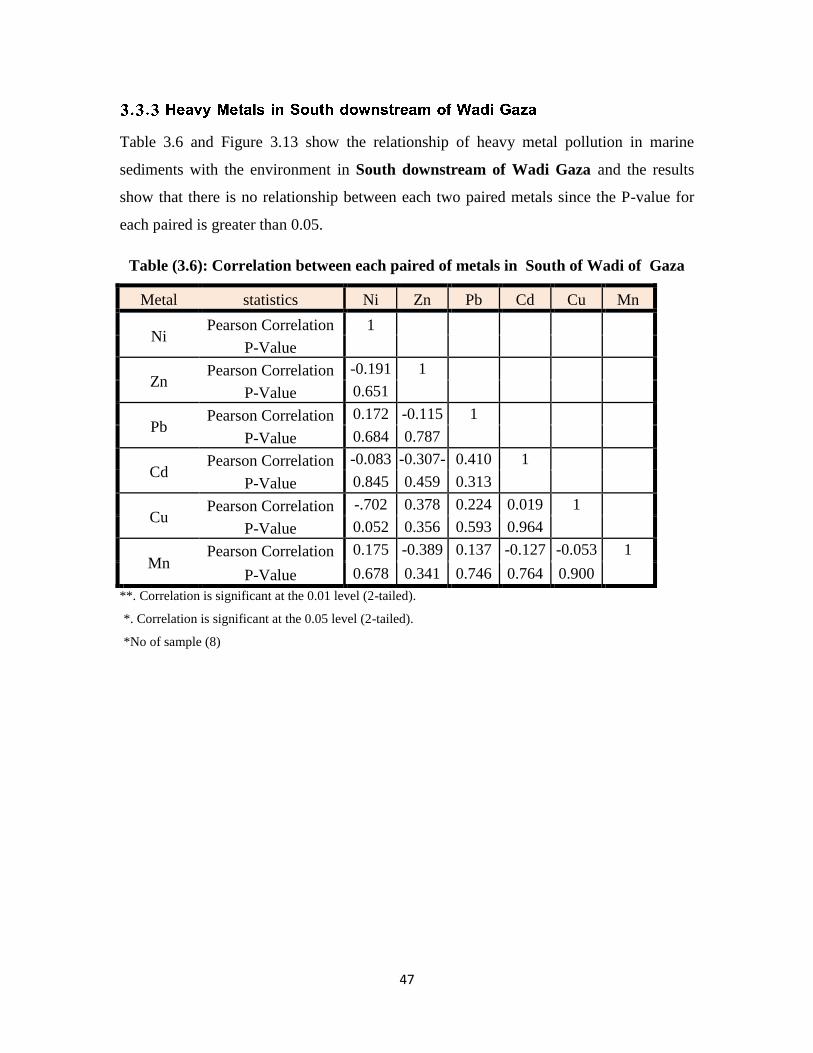
Table 3.6 and Figure 3.13 show the relationship of heavy metal pollution in marine
sediments with the environment in South downstream of Wadi Gaza and the results
show that there is no relationship between each two paired metals since the P-value for
each paired is greater than 0.05.
Table (3.6): Correlation between each paired of metals in South of Wadi of Gaza
Metal statistics Ni Zn Pb Cd Cu Mn
Ni Pearson Correlation 1
P-Value
Zn Pearson Correlation -0.191 1
P-Value 0.651
Pb Pearson Correlation 0.172 -0.115 1
P-Value 0.684 0.787
Cd Pearson Correlation -0.083 -0.307- 0.410 1
P-Value 0.845 0.459 0.313
Cu Pearson Correlation -.702 0.378 0.224 0.019 1
P-Value 0.052 0.356 0.593 0.964
Mn Pearson Correlation 0.175 -0.389 0.137 -0.127 -0.053 1
P-Value 0.678 0.341 0.746 0.764 0.900
**. Correlation is significant at the 0.01 level (2-tailed).
*. Correlation is significant at the 0.05 level (2-tailed).
*No of sample (8)
48
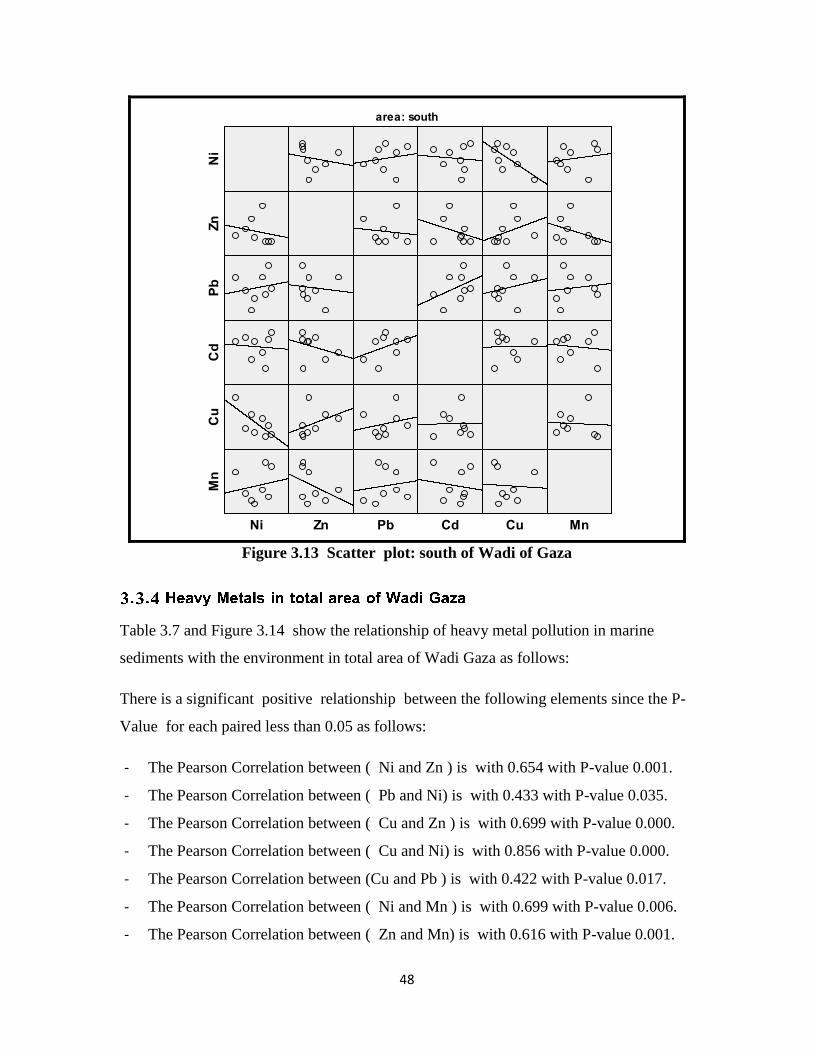
Figure 3.13 Scatter plot: south of Wadi of Gaza
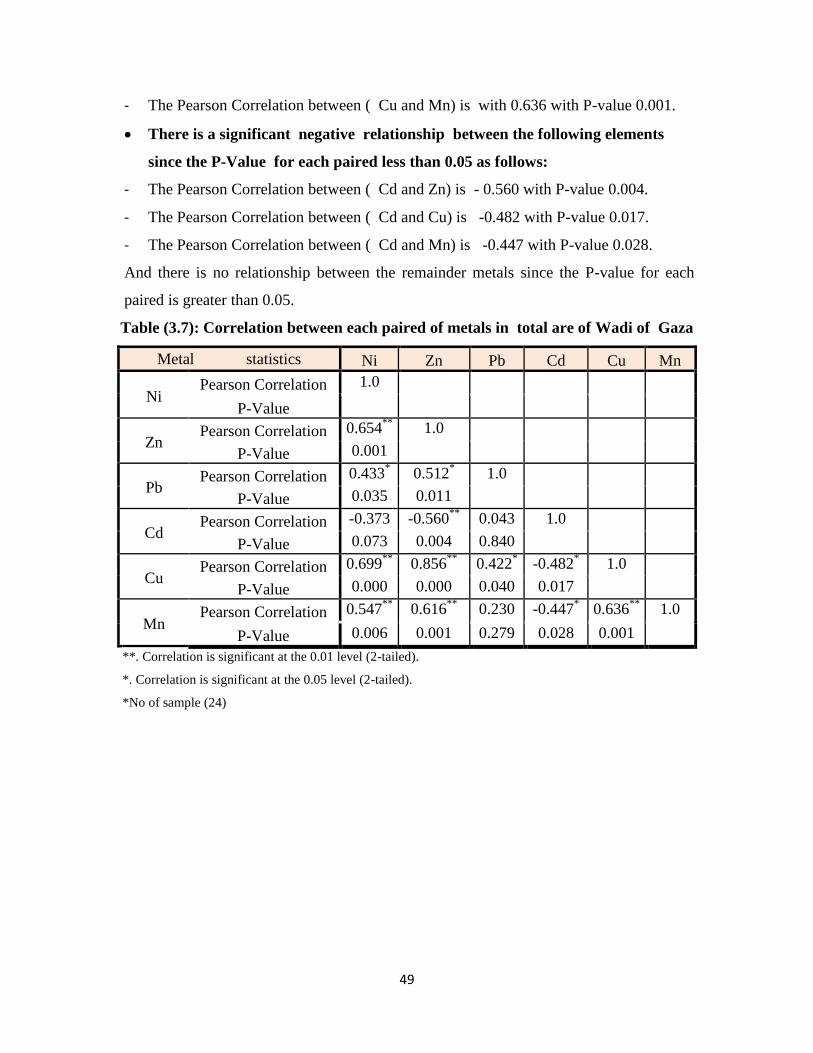
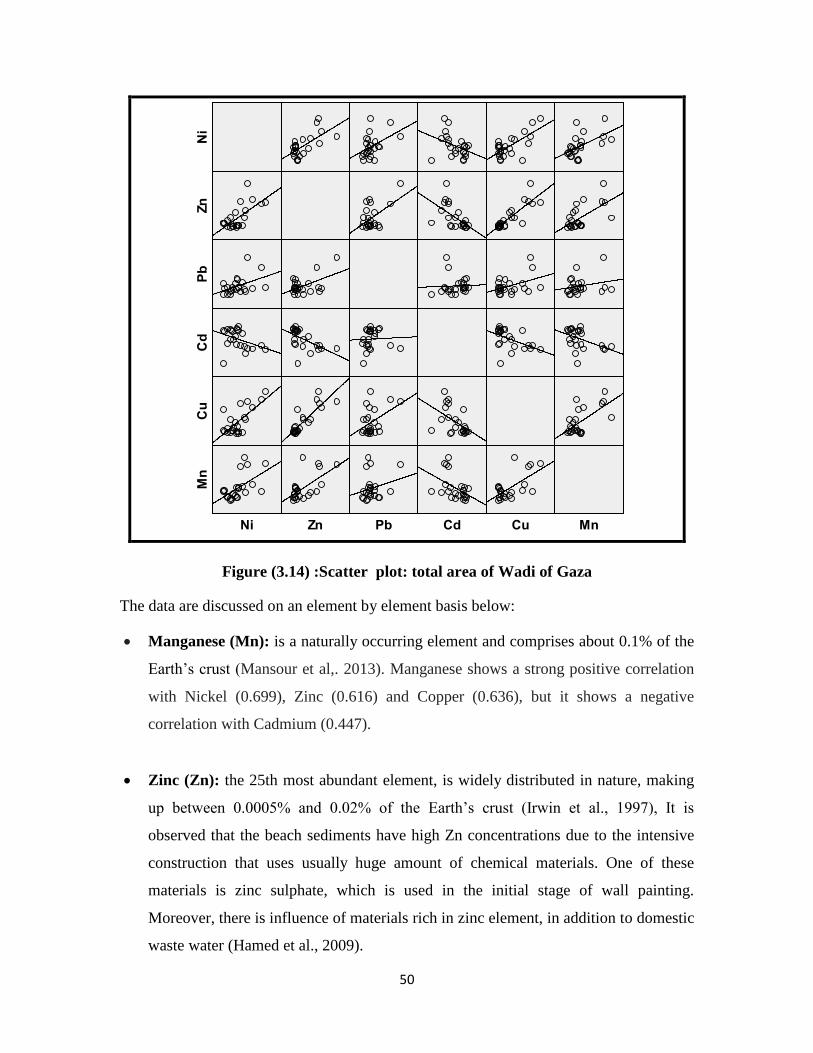
Table 3.7 and Figure 3.14 show the relationship of heavy metal pollution in marine
sediments with the environment in total area of Wadi Gaza as follows:
There is a significant positive relationship between the following elements since the P-
Value for each paired less than 0.05 as follows:
- The Pearson Correlation between ( Ni and Zn ) is with 0.654 with P-value 0.001.
- The Pearson Correlation between ( Pb and Ni) is with 0.433 with P-value 0.035.
- The Pearson Correlation between ( Cu and Zn ) is with 0.699 with P-value 0.000.
- The Pearson Correlation between ( Cu and Ni) is with 0.856 with P-value 0.000.
- The Pearson Correlation between (Cu and Pb ) is with 0.422 with P-value 0.017.
- The Pearson Correlation between ( Ni and Mn ) is with 0.699 with P-value 0.006.
- The Pearson Correlation between ( Zn and Mn) is with 0.616 with P-value 0.001.
49
- The Pearson Correlation between ( Cu and Mn) is with 0.636 with P-value 0.001.
There is a significant negative relationship between the following elements
since the P-Value for each paired less than 0.05 as follows:
- The Pearson Correlation between ( Cd and Zn) is - 0.560 with P-value 0.004.
- The Pearson Correlation between ( Cd and Cu) is -0.482 with P-value 0.017.
- The Pearson Correlation between ( Cd and Mn) is -0.447 with P-value 0.028.
And there is no relationship between the remainder metals since the P-value for each
paired is greater than 0.05.
Table (3.7): Correlation between each paired of metals in total are of Wadi of Gaza
Metal statistics Ni Zn Pb Cd Cu Mn
Ni Pearson Correlation 1.0
P-Value
Zn Pearson Correlation 0.654
** 1.0
P-Value 0.001
Pb Pearson Correlation 0.433
* 0.512
* 1.0
P-Value 0.035 0.011
Cd Pearson Correlation -0.373 -0.560
** 0.043 1.0
P-Value 0.073 0.004 0.840
Cu Pearson Correlation 0.699
** 0.856
** 0.422
* -0.482
* 1.0
P-Value 0.000 0.000 0.040 0.017
Mn Pearson Correlation 0.547
** 0.616
** 0.230 -0.447
* 0.636
** 1.0
P-Value 0.006 0.001 0.279 0.028 0.001
**. Correlation is significant at the 0.01 level (2-tailed).
*. Correlation is significant at the 0.05 level (2-tailed).
*No of sample (24)
50
Figure (3.14) :Scatter plot: total area of Wadi of Gaza
The data are discussed on an element by element basis below:
Manganese (Mn): is a naturally occurring element and comprises about 0.1% of the
Earth’s crust (Mansour et al,. 2013). Manganese shows a strong positive correlation
with Nickel (0.699), Zinc (0.616) and Copper (0.636), but it shows a negative
correlation with Cadmium (0.447).
Zinc (Zn): the 25th most abundant element, is widely distributed in nature, making
up between 0.0005% and 0.02% of the Earth’s crust (Irwin et al., 1997), It is
observed that the beach sediments have high Zn concentrations due to the intensive
construction that uses usually huge amount of chemical materials. One of these
materials is zinc sulphate, which is used in the initial stage of wall painting.
Moreover, there is influence of materials rich in zinc element, in addition to domestic
waste water (Hamed et al., 2009).

51
Zn shows a positive correlation with Ni (0.654), Cu (0.699) and Mn (0.616) On the
other hand, Zn shows negative correlation with Cd (0.560).
Copper (Cu): is an essential nutrient (Mansour et al., 2007), the copper
concentrations attributed that to the anthropogenic impact by landfilling, The high
concentration of copper is a result of ship constructions, renewing the old ships,
removing rust and old metal parts and painting the ship bodies in the area (Madkour
and Dar, 2007).
The copper correlated positively with Ni (�0.856), Zn (0.699) and Mn (0.636), it
correlated negatively with Cd (0.482).
Lead (Pb): lead is effectively removed from the water column to the sediment by
adsorption on organic matter and clay minerals (Irwin et al. (1997b).
Demonstrated that Wadi Gaza have the highest values of Pb contents compared to
the rest of the study area, attributed to anthropogenic activities, these include oil
spills, motor boats, and untreated wastes, in addition to landfilling operations.
The correlation matrix shows a positive correlation between Ni (0.433) and Cu
(0.422) .
Nickel (Ni): This indicates that the main source of nickel is the terrestrial sediments,
either naturally by wadis or by human activities due to construction and dredging
activities (Madkour, 2011). Sediments sampled from Wadi Gaza has the highest
values of nickel contents compared to the rest of the study area.
This may attribute to wastewater discharge. Also, this is due to landfilling and
dredging operations at study area.
The correlation matrix shows a positive correlation between Ni and Zn(.654), Pb
(0.433), Cu (0.856) and Mn (0.616).
52
Cadmium (Cd): The Cd concentrations in the sediments of study area may be
attributed to the increase of human activities in the region such as tourism,
landfilling.
The correlation coefficient of the studied sediments indicates that Cd has a negative
correlation with Zn (0.560), Cu ( 0.482) and Mn (0.447) .
Positive correlation between heavy metals suggests that metals have common sources,
mutual dependence and identical behavior during transport.
Negative correlations between heavy metals suggest that it does not share the above
specifically metal traits with others.
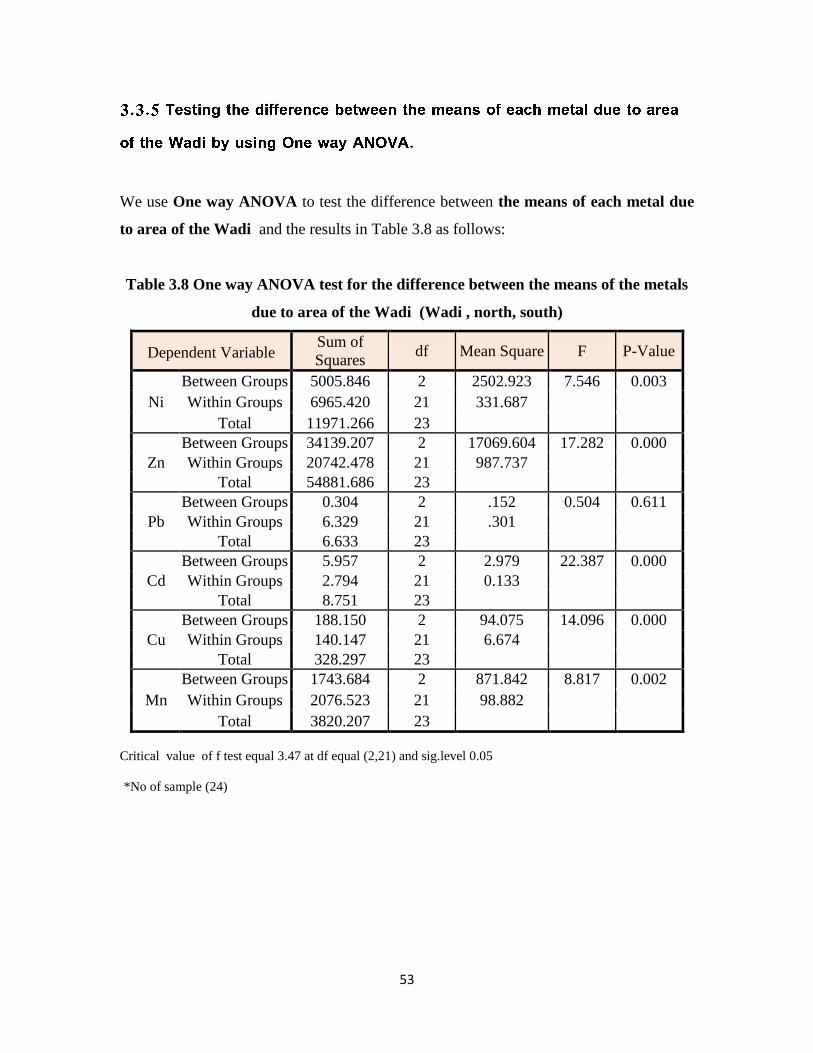
53
We use One way ANOVA to test the difference between the means of each metal due
to area of the Wadi and the results in Table 3.8 as follows:
Table 3.8 One way ANOVA test for the difference between the means of the metals
due to area of the Wadi (Wadi , north, south)
Dependent Variable Sum of
Squares df Mean Square F P-Value
Ni
Between Groups 5005.846 2 2502.923 7.546 0.003
Within Groups 6965.420 21 331.687
Total 11971.266 23
Zn
Between Groups 34139.207 2 17069.604 17.282 0.000
Within Groups 20742.478 21 987.737
Total 54881.686 23
Pb
Between Groups 0.304 2 .152 0.504 0.611
Within Groups 6.329 21 .301
Total 6.633 23
Cd
Between Groups 5.957 2 2.979 22.387 0.000
Within Groups 2.794 21 0.133
Total 8.751 23
Cu
Between Groups 188.150 2 94.075 14.096 0.000
Within Groups 140.147 21 6.674
Total 328.297 23
Mn
Between Groups 1743.684 2 871.842 8.817 0.002
Within Groups 2076.523 21 98.882
Total 3820.207 23
Critical value of f test equal 3.47 at df equal (2,21) and sig.level 0.05
*No of sample (24)
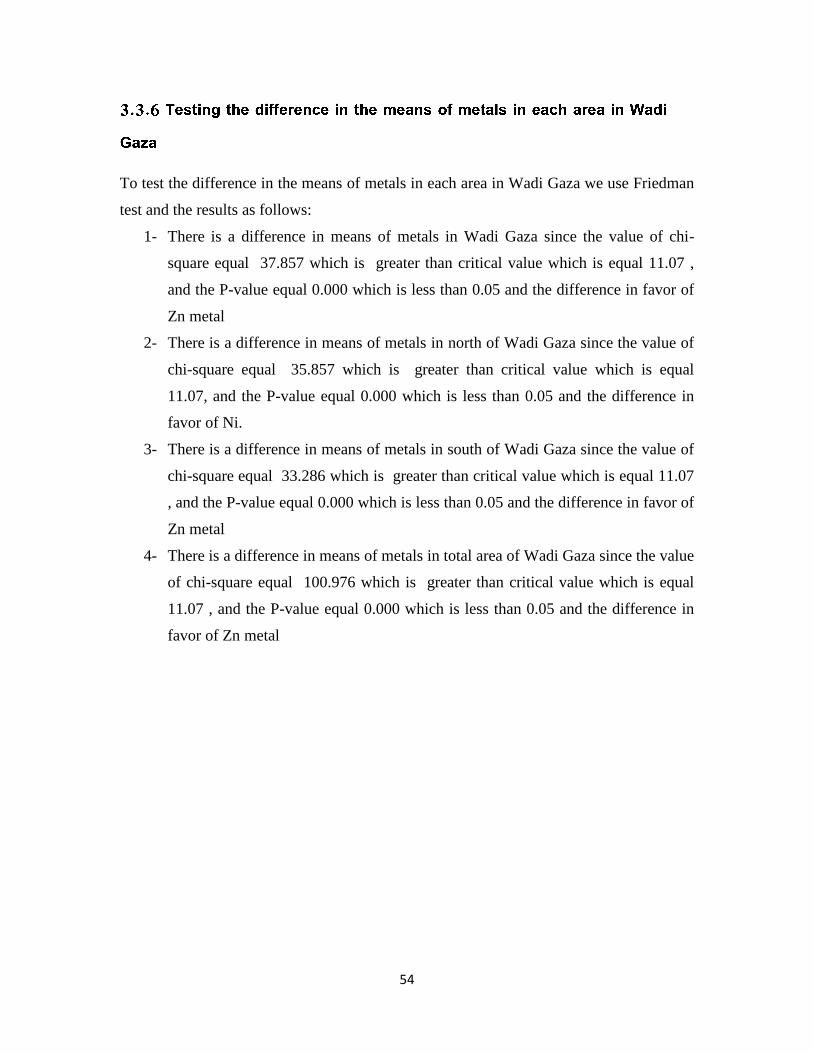
54
To test the difference in the means of metals in each area in Wadi Gaza we use Friedman
test and the results as follows:
1- There is a difference in means of metals in Wadi Gaza since the value of chi-
square equal 37.857 which is greater than critical value which is equal 11.07 ,
and the P-value equal 0.000 which is less than 0.05 and the difference in favor of
Zn metal
2- There is a difference in means of metals in north of Wadi Gaza since the value of
chi-square equal 35.857 which is greater than critical value which is equal
11.07, and the P-value equal 0.000 which is less than 0.05 and the difference in
favor of Ni.
3- There is a difference in means of metals in south of Wadi Gaza since the value of
chi-square equal 33.286 which is greater than critical value which is equal 11.07
, and the P-value equal 0.000 which is less than 0.05 and the difference in favor of
Zn metal
4- There is a difference in means of metals in total area of Wadi Gaza since the value
of chi-square equal 100.976 which is greater than critical value which is equal
11.07 , and the P-value equal 0.000 which is less than 0.05 and the difference in
favor of Zn metal

55
56
1. Generally, heavy metals Pb, Zn, Cu, Mn, Ni, and Cd concentrations are found in
different sampling sites, However, the higher content of heavy metals is identified in
wetlands due to long-term domestic sewage and agrochemicals discharge.
2. The area of Wadi Gaza, the most higher concentration of heavy metals than other
areas, and the highest concentration .
3. In the results, Ni mean is 31.380±22.81, Zn mean 49.33±48.55, Pb mean 0.76±0.54,
Cd mean 1.72±0.62, Cu mean 3.38±3.78 and Mn 16.04±12.89.
4. In the results of the study found that the concentrations of Zn is (190.73mg/kg) and
Ni is (88.54 mg/kg) in Wadi Gaza above the USEPA standards .
5. Comparing the concentrations of heavy metals in sediment by MOE Canada, Ni and
Zn are identified as metal pollutants of primary concern, Cd, Pb, Cu and Mn are of
moderate concern .
6. The distribution pattern for Zn, Cd, Ni ,Mn, Pb and Cu in several sediment clearly
indicates that contamination of sediment .
57
Discontinue the flow of sewage into the marine environment, which is the main
source of pollution to both seawater and sand beach according to the results of this
study.
Conduct similar studies to check contamination with other toxic heavy metals such
as mercury, chromium, cobalt and arsenic in Wadi Gaza.
Establishment of suitable Palestinian standards for sediment quality according to
international guidelines is required.
Strengthen the scientific research efforts to improve Wadi Gaza monitoring programs
and consequently the improve wetland quality. More specialized studies to determine
the relationship between sewage water and Wadi Gaza pollution.
58
A1-Agha, M.R. (1993). Environmental nitrate groundwater contamination in the
Gaza Strip. In: Perspective for Environmental Geochemistry in Tropical Countries
Abrao, J.J., Wasserman, J.C., and Filho, E.V.S. (eds). held November 29- December
12, 1993, Brazil.
Al-Agha, M. R. (1995). Environmental contamination of groundwater in the Gaza
Strip. Environmental geology, 25(2), 109-113.
Al-Agha, M. R. (1997). Environment management in the Gaza Strip.
ENVIRONMENTAL POLICY MAKING, 17:65-76.
Al-Agha, M. R. (2000). Access to the coast and erosion control: use of wastes on
local engineering works in the coast of Gaza City. Environmental Geology, 39(3-4),
405-410
Abd Rabou, A. F. N. A., Yassin, M. M., Al-Agha, M. R., Hamad, D. M., & Ali, A. K.
S.(2007). The Avifauna of Wadi Gaza Nature Reserve, Gaza Strip-Palestine. The
Islamic University Journal. Vol. 15 , No.1, pp 39-85
Abd Rabou, A. F. N. A., Yassin, M. M., Al-Agha, M. R., Madi, M. I., Al-Wali, M.
M., Ali, A. K. S., & Hamad, D. M,(2008a) . Notes on some common flora and its uses
in Wadi Gaza, Gaza Strip. The Islamic University Journal. Vol.16, No. 1, pp 31-63
Abd Rabou, A. F. N. A., Yassin, M. M., Sharif, F. A., Al-Agha, M. R., Daher, K. S.
A., Ali, A. K. S., & Hamad, D. M.(2008b) . Inhabitants' knowledge on mosquito
proliferation and control in the wetland ecosystem of Wadi Gaza, Gaza Strip,
Palestine. The Islamic University Journal. Vol.16, No.2, pp 41-61
59
Ali, M. (2002). The coastal zone of Gaza strip-Palestine management and problems.
In Presentation for MANA first kick-off meeting pp. 11-13.
Aish, A. (2004). ―Hydro geological Study and Artificial Recharge Modeling of the
Gaza Coastal Aquifer Using GIS and MODFLOW‖, PhD Dissertation, Vrije
Universities Brussel, Belgium, 196p
Alonso Castillo, M. L., Sánchez Trujillo, I., Vereda Alonso, E., García de Torres, A.,
& Cano Pavón, J. M. (2013). Bioavailability of heavy metals in water and sediments
from a typical Mediterranean Bay (Málaga Bay, Region of Andalucía, Southern
Spain). Marine pollution bulletin, 76(1), 427-434.
Bai, J., Xiao, R., Cui, B., Zhang, K., Wang, Q., Liu, X., & Huang, L. (2011).
Assessment of heavy metal pollution in wetland soils from the young and old
reclaimed regions in the Pearl River Estuary, South China. Environmental
Pollution, 159(3), 817-824.
Ben Salem, Z., Capelli, N., Laffray, X., Elise, G., Ayadi, H., & Aleya, L. (2014).
Seasonal variation of heavy metals in water, sediment and roach tissues in a landfill
draining system pond (Etueffont, France). Ecological Engineering, 69, 25-37.
Chapman, P.M., Allard, P.J., Vigers, G.A., (1999). Development of sediment quality
values for Hong Kong special administrative region: a possible model for other
jurisdictions. Marine Pollution Bulletin 38, 161-169.
Clark, R. B. (2001). Marine pollution. Fourth edition, Oxford, UK: Oxford University
Press. pp. 231
CMWU, (2010). "Water Status in the Gaza Strip and Future Plans". CMWU Annual
Report on Water Status in the Gaza Strip.
60
Emsley, John (2011). "Manganese". Nature's Building Blocks: An A-Z Guide to the
Elements. Oxford, UK: Oxford University Press. pp. 310-315.
Fu, F., & Wang, Q. (2011). Removal of heavy metal ions from wastewaters: a
review. Journal of Environmental Management, 92(3), 407-418.
Fujita, M., Ide, Y., Sato, D., Kench, P. S., Kuwahara, Y., Yokoki, H., & Kayanne, H.
(2014). Heavy metal contamination of coastal lagoon sediments: Fongafale Islet,
Funafuti Atoll, Tuvalu. Chemosphere, 95, 628-634.
Guven, D. E., & Akinci, G. (2013). Effect of sediment size on bioleaching of heavy
metals from contaminated sediments of Izmir Inner Bay. Journal of Environmental
Sciences, 25(9), 1784-1794.
Hamed, M.A., Lotfy, H.R., Kandawa-Schulz, M., (2009). Chemical forms of copper,
zinc, lead and cadmium in sediments of the northern part of the Red Sea, Egypt.
Namibia Dev. J. 2, 1–14.
Hamed, M. A., Mohamedein, L. I., El-Sawy, M. A., & El-Moselhy, K. M. (2013).
Mercury and tin contents in water and sediments along the Mediterranean shoreline of
Egypt. The Egyptian Journal of Aquatic Research, 39(2), 75-81.
Irwin, R.J., Mouwerik, M.V., Stevens, L., Seese, M.D., Basham, W., (1997a).
Environmental Contaminants Encyclopedia: Zinc Entry. National Park Service, Water
Resources Division, Fort Collins, CO. Available from:
<http://www.Nature.nps.gov/hazardssafety/toxic/zinc.pdf>.
Irwin, R.J., Mouwerik, M.V., Stevens, L., Seese, M.D., Basham, W., (1997b).
Environmental Contaminants Encyclopedia: Lead Entry. National Park Service,
Water Resources Division, Fort Collins, CO. Available from:
<http://www.nature.nps.gov./hazardssafety/ toxic/lead.pdf>.
61
Ismail, S. (2002). Assessment of heavy metal pollution in mangrove habitat of
karachi and vicinity. Unpublished PhD thesis, Botany Department, Karachi
University.
Koppen, G., Den Hond, E., Nelen, V., Van De Mieroop, E., Bruckers, L., Bilau, M.,
& Schoeters, G. (2009). Organochlorine and heavy metals in newborns: results from
the Flemish Environment and Health Survey (FLEHS 2002–2006).Environment
international, 35(7), 1015-1022.
Krezel, A. (2014). Metal Ions in Life Sciences, Vol. 12: Metallomics and the Cell.
Edited by Lucia Banci.
Liu, X., Song, Q., Tang, Y., Li, W., Xu, J., Wu, J.,& Brookes, P. C. (2013). Human
health risk assessment of heavy metals in soil–vegetable system: A multi-medium
analysis. Science of the Total Environment, 463, 530-540.
MedWetCoast Project, (2001),"Wadi Gaza Wetland Area The Hydrological Study
The Draft Report. Project for the Conservation of Wetland and Coastal Ecosystems in
the Mediterranean Region, pp. 40
Madkour, H.A., Dar, M.A., (2007). The anthropogenic effluents of the human
activities on the Red Sea coast at Hurghada Harbour (case study). Egypt. J. Aquat.
Res. 33 (1), 43–58.
Madkour, H.A., (2011). Impacts of human activities and natural inputs on heavy
metal contents of many coral reef environments along the Egyptian Red Sea coast.
Arab. J. Geosci. http://dx.doi.org/10.1007/s12517-011-0482-5.

62
Mansour, A.M., Mohamed, A.W., El Dien, G.K., Sayed, S.M., (2007).
Sedimentological and environmental impacts of development projects along the coast
of Hurghada, Red Sea, Egypt. Egypt. J. Aquat. Res. 33 (1), 59–84.
Mansour, A. M., Askalany, M. S., Madkour, H. A., & Assran, B. B. (2013).
Assessment and comparison of heavy-metal concentrations in marine sediments in
view of tourism activities in Hurghada area, northern Red Sea, Egypt. The Egyptian
Journal of Aquatic Research, 39(2), 91-103.
Muzyed, S. K. (2011). Heavy Metal Concentrations in Commercially Available
Fishes in Gaza Strip Markets (Master dissertation, The Islamic University of Gaza).
Nejem, R. M., El-Ashgar, N. M., Issa, M. M., & Al-Slieby, M. (2009). Detection of
some heavy metals due to sewage water diffusion into planted land. Journal of
Environmental Science and Technology, 2(2), 88-94.
Ontario Ministry of the Environment (MOE), (1993). Guidelines for the Protection
and Management of Aquatic Sediment Quality in Ontario. Queen’s Printer for
Ontario, Ontario.
Ötleş, S., & Çağındı, Ö. (2010). Health importance of arsenic in drinking water and
food. Environmental geochemistry and health, 32(4), 367-371.
Pekey, H., Karaka, D., Ayberk, S., Tolun, L., Lu, M.B., (2004). Ecological risk
assessment using trace elements from surface sediments of Izmit Bay (Northeastern
Marmara Sea) Turkey. Marine Pollution Bulletin 48, 946e953.
PCBS, Palestinian Central Bureau of Statistics, (2013). Annual Palestine Statistics
Book, No. 16, Ramallah, Palestine.
63
Reitermajer, D., Celino, J. J., & Queiroz, A. D. S. (2011). Heavy metal distribution in
the sediment profiles of the Sauípe River Estuary, north seashore of the Bahia State,
Brazil. Microchemical Journal, 99(2), 400-405.
Sarkar, B. (2002). Heavy metals in the environment. CRC Press. pp 712.
Sharma, N. P. (1998). Dictionary of Chemistry. Gyan Publishing House. pp 208.
Shomar, B. H., Müller, G., & Yahya, A. (2005). Geochemical features of topsoils in
the Gaza Strip: natural occurrence and anthropogenic inputs. Environmental
Research, 98(3), 372-382.
State Environmental Protection Administration (SEPA), (1995). Environmental
Quality Standard for Soils. State Environmental Protection Administration, China.
GB15618e1995 (in Chinese).
Srivastava, N. K., & Majumder, C. B. (2008). Novel biofiltration methods for the
treatment of heavy metals from industrial wastewater. Journal of hazardous
materials, 151(1), 1-8.
Song, Y., Choi, M. S., Lee, J. Y., & Jang, D. J. (2014). Regional background
concentrations of heavy metals (Cr, Co, Ni, Cu, Zn, Pb) in coastal sediments of the
South Sea of Korea. Science of The Total Environment, 482, 80-91.
Taleb, K. J. (2014). Characterization of the Potential Water-Borne Diseases in Wadi
Gaza–Gaza Strip (Master dissertation, Islamic University of Gaza).
Ubeid, K. F. (2010). Marine Lithifacies and Depositional Zones Analysis Along
Coastal Ridge in Gaza Strip, Palestine. Journal of Geography and Geology,2(1), P68.
64
Ubeid, K. F. (2011). Sand Characteristics and Beach Profiles of the Coast of Gaza
Strip, Palestine. Serie Correlación Geológica, 27 (2): 125-136
UNEP, (2009). Environmental Assessment of the Gaza Strip (following the escalation
of hostilities in December 2008–January 2009), ISBN: 978-92-807-3041-8.
Yu, R., Yuan, X., Zhao, Y., HU, G., & TU, X. (2008). Heavy metal pollution in
intertidal sediments from Quanzhou Bay, China. Journal of Environmental
Sciences, 20(6), 664-669.
Zaineldeen, U., & Aish, A. (2012). Geology, geomorphology and hydrology of the
Wadi Gaza catchment, Gaza Strip, Palestine. Journal of African Earth Sciences, 76,
1-7.