Embed Size (px)
Citation preview

University of Massachusetts AmherstScholarWorks@UMass AmherstEnvironmental & Water Resources EngineeringMasters Projects Civil and Environmental Engineering
5-2012
Assessment of Iron and Manganese SequestrationDanielle VolpeUniversity of Massachusetts - Amherst
Follow this and additional works at: https://scholarworks.umass.edu/cee_ewre
Part of the Environmental Engineering Commons
This Article is brought to you for free and open access by the Civil and Environmental Engineering at ScholarWorks@UMass Amherst. It has beenaccepted for inclusion in Environmental & Water Resources Engineering Masters Projects by an authorized administrator of ScholarWorks@UMassAmherst. For more information, please contact [email protected].
Volpe, Danielle, "Assessment of Iron and Manganese Sequestration" (2012). Environmental & Water Resources Engineering MastersProjects. 53.https://doi.org/10.7275/HA5A-GG93
Assessment of Iron and Manganese Sequestration
A Master’s Report Presented
By
Danielle Volpe
Submitted to the Department of Civil and Environmental Engineering of the University of Massachusetts Amherst in partial fulfillment
of the requirements for the degree of
MASTER OF SCIENCE IN ENVIRONMENTAL ENGINEERING
May 2012
Department of Civil and Environmental Engineering


iii
Acknowledgments I would like to first thank Aquarion Water Company (AWC) for their financial support for this
project. I would especially like to thank Gary Kaminski for his involvement and assistance
during site visits to the Hamill well facility and Oxford well facility.
Additionally I would also like to thank my advisor John Tobiason for his support, guidance, and
encouragement throughout the course of this project. I would also like to thank Dr. David
Reckhow for sitting on my committee as well as the other professors at the University of
Massachusetts Amherst.
I would especially like to thank my fellow graduate students who truly made my time here at
UMass a great experience. A special thanks to Jonathan Chihoski for helping with numerous
field sampling trips and laboratory experiments.
Lastly, I would like to thank my friends and family for their love and support and especially
Andrew Teixeira for his love and encouragement.

iv
Abstract For drinking water with low to moderate levels of iron (Fe) and manganese (Mn) (at or
somewhat above the SMCL), sequestration is a less expensive treatment alternative compared to
metal oxidation and removal. Sequestration complexes Fe and Mn to prevent precipitation and
subsequent water quality problems (turbidity, color, staining, etc.). Despite the widespread use of
sequestering agents, research has not resulted in a successful method to directly assess the
complexation of Mn and Fe. This study was conducted to develop a method for assessing
sequestering agent effectiveness and to assess the effectiveness of several phosphate based
sequestering agents for several groundwater sources with varying iron and manganese
concentrations.
The effectiveness of three different phosphate based sequestering agents was determined at three
dosages (100%, 150%, and 200% stoichiometric). Source waters had a pH between 7 and 8 as
well as varying concentrations of iron, manganese, alkalinity, calcium, magnesium, and total
organic carbon. For this study, an operational method to measure sequestering agent
effectiveness was developed based on metal fractionation. Raw water samples were carefully
collected under anoxic conditions to mimic system operating conditions and prevent inadvertent
iron oxidation. Raw waters were dosed with polyphosphate followed by free chlorine. pH
adjustment was also conducted when necessary (pH less than 7). After a reaction period of 48
hours at 12°C, samples were fractionated to measure total, particulate, colloidal, and dissolved
iron and manganese. Metals in the colloidal and dissolved forms were assumed to be effectively
sequestered.
Results show that sequestering agents were more effective for manganese than for iron. As much
as 85% of total manganese at concentrations as high as 0.68 mg/L was sequestered whereas for
iron 66% of total iron was sequestered at a total iron concentration of 0.18 mg/L. The majority of
the sequestered manganese was in the dissolved form, whereas the majority of the sequestered
iron was in the colloidal form. As polyphosphate dosages increased in concentration, generally
more metal was sequestered. Sequestration was ineffective for source waters containing high
total hardness (273 mg/L as CaCO3) probably due to competition between cations (e.g. Ca2+,
Mg2+ vs. Fe2+ and Mn2+) for the sequestering agents. Conversely, sequestration was most
effective for source waters containing low hardness levels (30 mg/L as CaCO3). Although there

v
were differences in effectiveness between sequestering agents, no consistent trends with respect
to water quality were observed. Ultimately the effectiveness of sequestering agents depends on
source water quality in addition to Mn and Fe levels. Bench or pilot scale testing must be
completed prior to addition of sequestering agents.

vi
Table of Contents
Acknowledgments.......................................................................................................................... iii
Abstract .......................................................................................................................................... iv
List of Figures .............................................................................................................................. viii
List of Tables ................................................................................................................................. ix
Chapter 1 INTRODUCTION .................................................................................................... 1
1.1 PROBLEM STATEMENT ...................................................................................................... 1
1.2 OBJECTIVE ........................................................................................................................ 1
1.3 SCOPE OF WORK ............................................................................................................... 2
Chapter 2 BACKGROUND ...................................................................................................... 3
2.1 IRON AND MANGANESE IN DRINKING WATER ................................................................... 3
2.1.1 Iron ............................................................................................................................ 3
2.1.2 Manganese ................................................................................................................ 5
2.2 SEQUESTRATION ................................................................................................................ 7
2.2.1 Complexation of Metals ............................................................................................ 8
2.2.2 Sequestering Agents................................................................................................ 10
2.3 SEQUESTRATION EFFECTIVENESS .................................................................................... 11
Chapter 3 MATERIALS AND METHODS ............................................................................ 13
3.1 EXPERIMENTAL METHODS .............................................................................................. 13
3.1.1 Field Sampling ........................................................................................................ 14
3.1.2 Dosing Considerations ............................................................................................ 14
3.1.3 Laboratory Investigation ......................................................................................... 15
3.2 ANALYTICAL METHODS .................................................................................................. 16
3.2.1 Metal Concentration Measurements ....................................................................... 16
Chapter 4 RESULTS AND DISCUSSION ............................................................................. 20

vii
4.1 SOURCE WATER AND HISTORICAL DATA ........................................................................ 20
4.1.1 Aquarion Water Company Hamill Well ................................................................. 20
4.1.2 Aquarion Water Company Oxford Well #4 ............................................................ 23
4.1.3 Amherst, Massachusetts Raw Water (Well #4) ...................................................... 26
4.1.4 Hadley, Massachusetts Raw Water ......................................................................... 26
4.1.5 Comparison of Source Waters ................................................................................ 27
4.2 METHOD DEVELOPMENT FOR DETERMINING SEQUESTERANT EFFECTIVENESS ............... 27
4.2.1 Variations on HACH Low Range Total Manganese Method ................................. 27
4.2.2 Weak Cation Exchange Resin ................................................................................. 28
4.2.3 Metal Filterability Method ...................................................................................... 29
4.3 CASE STUDIES FOR MEASURING SEQUESTRATION EFFECTIVENESS ................................. 31
4.3.1 Aquarion Water Company Hamill Well Site .......................................................... 31
4.3.2 Aquarion Water Company Oxford Well #4 Site ..................................................... 48
4.3.3 Amherst Well Site Visit October 21, 2011 ............................................................. 52
4.3.4 Hadley Site Visit November 11, 2011 .................................................................... 55
4.4 COMPARISONS OF EFFECTIVENESS OF SEQUESTERING AGENTS FOR VARIOUS SOURCE
WATERS ..................................................................................................................................... 58
4.5 KINETIC STUDY CONDUCTED FOR OXFORD FEBRUARY 2012 .......................................... 60
4.6 CHLORINE AND POLYPHOSPHATE ADDITION WITH TIME VARIATION .............................. 62
Chapter 5 SUMMARY, CONCLUSIONS, AND RECOMMENDATIONS.......................... 64
5.1 SUMMARY ....................................................................................................................... 64
5.2 CONCLUSIONS ................................................................................................................. 64
5.3 RECOMMENDATIONS ....................................................................................................... 65
References ..................................................................................................................................... 66
Appendix ....................................................................................................................................... 68

viii
List of Figures Figure 1: Orthophosphate ............................................................................................................... 8
Figure 2: Hamill Wells TP Raw Tap ............................................................................................ 21
Figure 3: Turbidity Data for Hamill Wells TP Raw Tap .............................................................. 21
Figure 4: Hamill Wells TP Eff Tap............................................................................................... 22
Figure 5: Turbidity Data Hamill Wells TP Eff Tap ...................................................................... 22
Figure 6: Oxford Well PW #4 Raw Tap ....................................................................................... 24
Figure 7: Turbidity Data for Oxford Well #4 Raw Tap ................................................................ 24
Figure 8: Oxford #4 Eff ................................................................................................................ 25
Figure 9: Turbidity Data for Oxford #4 Eff .................................................................................. 26
Figure 10: Synthetic Water 24 Hour Reaction Period .................................................................. 30
Figure 11: Synthetic Water 48 Hour Reaction Period .................................................................. 31
Figure 12: Manganese Concentrations Hamill Wells June 2011, Lab Study ............................... 35
Figure 13: Iron Concentrations Hamill Wells June 2011, Lab Study ........................................... 35
Figure 14: Manganese Concentrations Hamill Wells July 2011, Lab Study ................................ 40
Figure 15: Iron Concentrations Hamill Wells July 2011, Lab Study ........................................... 40
Figure 16: Manganese Concentrations Hamill September 2011 .................................................. 42
Figure 17: Iron Concentrations Hamill September 2011 .............................................................. 43
Figure 18: Hamill Manganese Concentrations (Raw, Effluent, and Distribution Points) Oct 2011
....................................................................................................................................................... 45
Figure 19: Hamill Iron Concentrations (Raw, Effluent, and Distribution Points) Oct 2011 ........ 46
Figure 20: Manganese Concentrations Hamill October 2011 ....................................................... 47
Figure 21: Iron Concentrations Hamill October 2011 .................................................................. 47
Figure 22: Manganese Concentrations Oxford December 2011 ................................................... 49
Figure 23: Iron Concentration Oxford December 2011 ................................................................ 49
Figure 24: Manganese Concentrations Oxford February 2012 ..................................................... 51
Figure 25: Iron Concentrations Oxford February 2012 ................................................................ 52
Figure 26: Manganese Concentration Amherst October 2011 ..................................................... 54
Figure 27: Iron Concentration Amherst October 2011 ................................................................. 54
Figure 28: Manganese Concentrations for Hadley November 2011 ............................................ 56
Figure 29: Iron Concentrations for Hadley November 2011 ........................................................ 56

ix
Figure 30: Manganese Concentrations Hadley December 2011 ................................................... 58
Figure 31: Kinetic Study (Mn) Oxford February 2012 ................................................................. 61
Figure 32: Kinetic Study (Fe) Oxford February 2012 .................................................................. 62
Figure 33: Effect of Polyphosphate Reaction Time Prior to Chlorine .......................................... 63
List of Tables Table 1: Recommended Dietary Allowances for Iron for Infants, Children, and Adults (Institute
of Medicine Food and Nutrition Boar, 2001) ................................................................................. 4
Table 2: Adequate Intake Values of Manganese (ASTDR 2008) ................................................... 6
Table 3: Polyphosphate Chemistry ................................................................................................. 9
Table 4: Polyphosphate Characteristics ........................................................................................ 10
Table 5: Summary of Historical Data for Hamill Wells from January 2007 to November 2011 . 20
Table 6: Summary of Historical Data for Oxford Wells from January 2007 to November 2011 23
Table 7: Water Quality Parameters for Sources ........................................................................... 27
Table 8: Hach Method with and without Ascorbic Acid .............................................................. 28
Table 9: Raw Water Quality Hamill June 2011 ........................................................................... 33
Table 10: Dosing of Polyphosphates June 21st Hamill Water ..................................................... 34
Table 11: Raw Water Quality Hamill July 2011 .......................................................................... 38
Table 12: Raw Water Quality Hamill Sept 2011 .......................................................................... 41
Table 13: Summary of Hamill Well September 2011 .................................................................. 43
Table 14: Raw Water Quality Hamill October 2011 .................................................................... 44
Table 15: Raw Water Quality Oxford December 2011, pH 6.02, 11.2 °C, Chlorine Dose 2.5
mg/L Cl2 ........................................................................................................................................ 48
Table 16: Raw Water Quality Oxford February 2012, pH 6 ........................................................ 50
Table 17: Raw Water Quality Amherst October 2011, pH 8, 10.9°C .......................................... 53
Table 18: Raw Water Quality Hadley November 2011, pH 7.49, 16.8°C .................................... 55
Table 19: Raw Water Quality Hadley December 2011, pH 7.65, 13.4°C .................................... 57
Table 20: Water Quality Parameters for Source Waters ............................................................... 59
Table 21: Summary of Sequestering Effectiveness ...................................................................... 59
Table 22: Hamill Well Data June 2011 ......................................................................................... 68
Table 23: Hamill Well Data July 2011 ......................................................................................... 69

x
Table 24: Hamill Well Data September 2011 ............................................................................... 70
Table 25: Hamill Well Data October 2011 ................................................................................... 72
Table 26: Oxoford Well Data December 2011 ............................................................................. 73
Table 27: Oxford Well Data February 2012 ................................................................................. 74
Table 28: Amherst Well Data October 2011 ................................................................................ 76
Table 29: Hadley Well Data November 2011 ............................................................................... 78
Table 30: Hadley Well Data December 2011 ............................................................................... 79

1
Chapter 1 INTRODUCTION
1.1 PROBLEM STATEMENT
Iron and manganese are two common metals found in drinking water that cause aesthetic
problems like metallic taste and staining of laundry and fixtures. Iron has never been attributed to
health concerns; however recent studies have been conducted linking high manganese intake
concentrations in humans to neurological problems. The United States Environmental Protection
Agency (EPA) has instituted Secondary Maximum Contaminant Levels (SMCL) for both metals;
the SMCL for iron is 0.3 mg/L and the SMCL for manganese is 0.05 mg/L.
Conventional treatment processes for iron include oxidation and precipitation with oxygen,
chlorine, potassium permanganate or other oxidants followed by removal of particles through
clarification and filtration. Common manganese removal processes include adsorption of
manganese onto manganese oxide coated media that is continuously reactivated by the addition
of chlorine as well as oxidation and precipitation by a strong oxidant such as permanganate
followed by particle removal. These conventional treatment processes for iron and manganese
involve removal of the metal. However for drinking water with low to moderate levels of iron
(Fe) and manganese (Mn) (at or somewhat above the SMCL), sequestration is a less expensive
treatment alternative.
Sequestration complexes Fe and Mn to prevent precipitation and subsequent water quality
problems (turbidity, color, staining, etc.). Despite the widespread use of sequestering agents,
research has not resulted in a successful method to directly assess the complexation of Mn and
Fe by sequestration chemicals.
1.2 OBJECTIVE This study was conducted to develop a method for assessing sequestering agent effectiveness and
to assess the effectiveness of several phosphate based sequestering agents for several
groundwater sources. These source waters differed in composition with varying concentrations
of iron, manganese, alkalinity, hardness and total organic carbon (TOC).

2
1.3 SCOPE OF WORK This study was conducted both on-site at the specific groundwater sources as well as in the
laboratory at the University of Massachusetts Amherst. Preliminary studies were conducted in
the laboratory with synthetic water to determine the method by which effectiveness of the
sequestering agents would be analyzed.
Raw water was sampled from each groundwater source and dosed on-site with polyphosphate,
chlorine, and sodium hydroxide for pH adjustment if necessary. Samples were then held for 48
hours in a cold, dark, constant temperature room to mimic groundwater and distribution system
conditions. After the 48 hour reaction period, laboratory experiments were conducted to
fractionate metals and measure iron and manganese concentrations. Total, particulate, colloidal,
and dissolved iron and manganese, pH, chlorine residual, and temperature were measured both
on-site and in the laboratory setting.

3
Chapter 2 BACKGROUND This chapter provides information about iron and manganese in drinking water including
chemistry, aesthetic and health effects, regulations, and current treatment processes. Additionally
this chapter discusses the chemistry of polyphosphates and their complexation with metals.
2.1 IRON AND MANGANESE IN DRINKING WATER
2.1.1 Iron
Iron is a transition metal that makes up five percent of the earth’s crust. It exists in two forms in
relation to water: soluble iron known as ferrous iron or insoluble iron known as ferric iron. Iron
is often found in groundwater due to its abundant presence in geological structures and often
reducing conditions in groundwater. As rainfall travels through the soil it may dissolve iron and
transport it to groundwater sources (US EPA 2012).
2.1.1.1 Chemistry of Iron
Iron exists in several different oxidation states of -2, 0, +1, +2, +3, +4, and +6, however the
oxidation states of +2 and +3 are the most common forms in drinking water supplies. Iron in the
+2 oxidation state (ferrous iron) or iron (II) is the soluble form and iron in the +3 oxidation state
(ferric iron) is the insoluble form. Iron (III) is the most common form of the metal because of its
stability. Iron (II) is readily oxidized in the presence of oxygen or any other oxidant to form iron
(III) (Benjamin, 2010).
2.1.1.2 Aesthetic and Health Effects
Iron is an essential mineral necessary for human health. The Dietary Reference Intakes (DRIs)
developed by the Institute of Medicine of the National Academy of Sciences created
Recommended Daily Allowances (RDA) for iron intake. These allowances are displayed in
Table 1.

4
Table 1: Recommended Dietary Allowances for Iron for Infants, Children, and Adults (Institute of Medicine Food and Nutrition Boar, 2001)
According to the EPA, iron does not exhibit direct, adverse health effects. In fact, if the
appropriate intake of iron is not met, iron deficiency or anemia can develop. Although iron is
necessary and essential, increased levels can accumulate in the body as little iron is released
through excretion from the human body (Institute of Medicine Food and Nutrition Board, 2001).
Although iron may not have any adverse health effects, it does have negative aesthetic effects.
Iron concentrations greater than 0.3 mg/L result in noticeable metallic taste and a rusty color.
The colored water can cause staining of laundry and household appliances. Iron in water also
results from problems with corrosion as it oxidizes and leaches into distribution systems from
iron based piping materials (US EPA, 2012); (Cantor et al., 2000).
2.1.1.3 Iron Regulations
Health based iron regulations have not been officially mandated by the EPA because iron does
not directly cause adverse health effects. However, the EPA has implemented an SMCL as a
guideline for water treatment facilities. Because metallic taste and staining are observed at iron
concentrations of 0.3 mg/L or greater, the SMCL has been set at this level (US EPA, 2012).
2.1.1.4 Conventional Iron Treatment Processes
Conventional iron treatment processes involve removal by oxidation and precipitation. For
example, water can be aerated to oxidize soluble iron (II) to particulate form. Common oxidants
used in the iron removal process include oxygen, potassium permanganate, chlorine, or ozone.
Following oxidation, particulate iron is removed from water most commonly by sand, anthracite,

5
or dual-media filtration. Concentrations of iron exceeding levels of 6 mg/L may require an
additional step such as clarification where particles can settle prior to filtration (Siemens Water
Technologies, 2009).
2.1.2 Manganese
Manganese, like iron, is a transition metal and makes up approximately 0.1% of the earth’s crust.
It is naturally occurring and found mostly in compound form with oxygen, sulfur, or chlorine.
Inorganic manganese is used to produce ceramics, steel, batteries, and dietary supplements while
organic manganese is used in pesticides, fertilizers, and a gasoline additive
(methlcyclopentadienyl) (US EPA, 2006).
Manganese is found in groundwater and surface water sources due to erosion of rocks and soil
and contamination from industrial facilities. A study conducted in 1978 showed the mean
concentration of dissolved manganese found in 286 rivers and streams in the United States was
24 μg/L (Smith et al., 1987).
2.1.2.1 Chemistry of Manganese
Manganese exists at oxidation states of 0, +1, +2, +3, +4, +5, +6, and +7. Oxidation states of +2
and +4 are commonly seen in raw and finished drinking water, and +7 state is found in treatment
chemicals. Manganese in the +2 and +7 oxidation states are soluble while manganese in the +4
oxidation state is very insoluble. In the compound potassium permanganate, manganese has an
oxidation state of +7. Permanganate is a strong oxidant that is used for removal of iron and
manganese. With addition of permanganate (Mn7+), dissolved Mn2+ is oxidized and forms
insoluble Mn4+ which can be removed from water sources (Benjamin, 2002). At the same time,
the Mn7+ in permanganate is reduced to Mn4+ forming more insoluble manganese.
Manganese reducing and oxidizing bacteria in lakes and groundwater can convert insoluble
manganese to soluble manganese or vice versa. According to Carlson et al. (1997), manganese
reducing bacteria can cause increases in dissolved manganese in surface water sources. In the
upper layer of lakes, manganese species exist in the insoluble form while in groundwater or the
bottom layers of lakes under anoxic conditions, the soluble species of manganese exists. Under
anoxic conditions, manganese reducing bacteria use solid manganese oxides (MnOX(s), with

6
Mn(III) and Mn(IV)) as electron acceptors and produce the soluble form of manganese (Mn(II)).
In contrast, manganese oxidizing bacteria use the dissolved reduced manganese (Mn(II)) and
produce oxidized insoluble manganese (e.g. MnO2(s)) (Carlson, 1989).
2.1.2.2 Aesthetic and Health Effects
Manganese, like iron, is an essential nutrient needed for human health. The World Health
Organization estimated that the average adult consumes between 0.7 and 10.9 mg of manganese
per day. Manganese is used in the human body to form healthy cartilage and bones. In addition
manganese is used in the urea cycle and aids in wound healing (ASTDR 2008). Although, it is a
necessary and important nutrient, high concentrations within the human body can have damaging
effects to the brain. Average adequate intake manganese concentrations are displayed in Table 2.
Table 2: Adequate Intake Values of Manganese (ASTDR 2008)
High concentrations of manganese may deposit in the brain and cause impaired neurological and
neuromuscular control, muscle stiffness, lack of coordination, and difficulties breathing or
swallowing (US EPA, 2006). Additionally, results of a recent study associate lower IQ scores in
children exposed to levels as low as 34 μg/L of manganese (Bouchard et al., 2011).
Manganese also has aesthetic effects including metallic taste of water as well as staining of
clothing and fixtures. When soluble manganese is oxidized by chlorine or other oxidants it
converts to an insoluble form leaving a brown-black residue (US EPA, 2006).

7
2.1.2.3 Manganese Regulations
Manganese can cause neurological damage at high concentrations; however, the EPA to date has
placed an aesthetic based SMCL of 0.05 mg/L on this metal. Additionally the World Health
Organization (WHO) has placed a health based guideline of 0.5 mg/L for manganese (WHO,
2008).
2.1.2.4 Conventional Manganese Treatment Processes
Conventional manganese treatment processes involve oxidation of dissolved manganese to the
insoluble form which is then removed by clarification, filtration, or by adsorption to oxide coated
media, frequently with subsequent surface catalyzed oxidation.
Unlike iron, manganese is not readily oxidized and therefore, a longer detention time and a
higher dose of oxidant is required for complete oxidation of manganese (Kohl et al., 2006). A
common oxidant used in the removal of iron and manganese is chlorine. However, Knocke
(1990) determined that oxidation of soluble manganese from 1.0 mg/l to 0.7 mg/L at a pH of 7
required four times the stoichiometric dose (1.3 mg Cl2/ mg Mn) with a detention time of 3
hours. From Knocke’s study (1990) it was determined that further treatment is required for
manganese removal using manganese oxide coated media.
Manganese oxide coated media is first conditioned with an oxidant like chlorine or potassium
permanganate to activate sites for adsorption of manganese. If an oxidant is added continuously,
as manganese passes through the contactor, more adsorption sites become available due to the
surface oxidation of adsorbed Mn(II) which produces more available Mn(IV) sites.
2.2 SEQUESTRATION As an alternative to oxidation and filtration processes to remove iron and manganese,
sequestration can be used in specific situations to slow the process of particulate metal
formation. During sequestration, metals are complexed with polyphosphates, but not removed.
The following sections discuss the chemistry of sequestration as well as specific characteristics
of the sequestering agents used in the experimental work for the current study.

8
2.2.1 Complexation of Metals
Sequestering agents, typically polyphosphates, complex Fe(II) and Mn(II) to prevent
oxidation/precipitation and subsequent water quality problems (turbidity, color, staining, etc.).
Complexation occurs when a ligand or an electron donor binds to a metal therefore forming a
complex. These stable strong, complexes form by either strong ion association or covalent
bonding (Rashchi and Finch, 2000).
2.2.1.1 Polyphosphate Chemistry
Orthophosphate is a compound which contains one phosphorous atom linked to four oxygen
atoms with a net negative charge of 3 (at pH > 12.35) as displayed in Figure 1. In drinking water
treatment, the dosing of polyphosphates is usually expressed as mass of phosphate. The
molecular weight of a phosphate ion is 95 g/mole while the atomic weight of a phosphorous
atom is 31 g/mole. Therefore, the mass as phosphorous is approximately equivalent to one third
of the mass as phosphate.
Figure 1: Orthophosphate
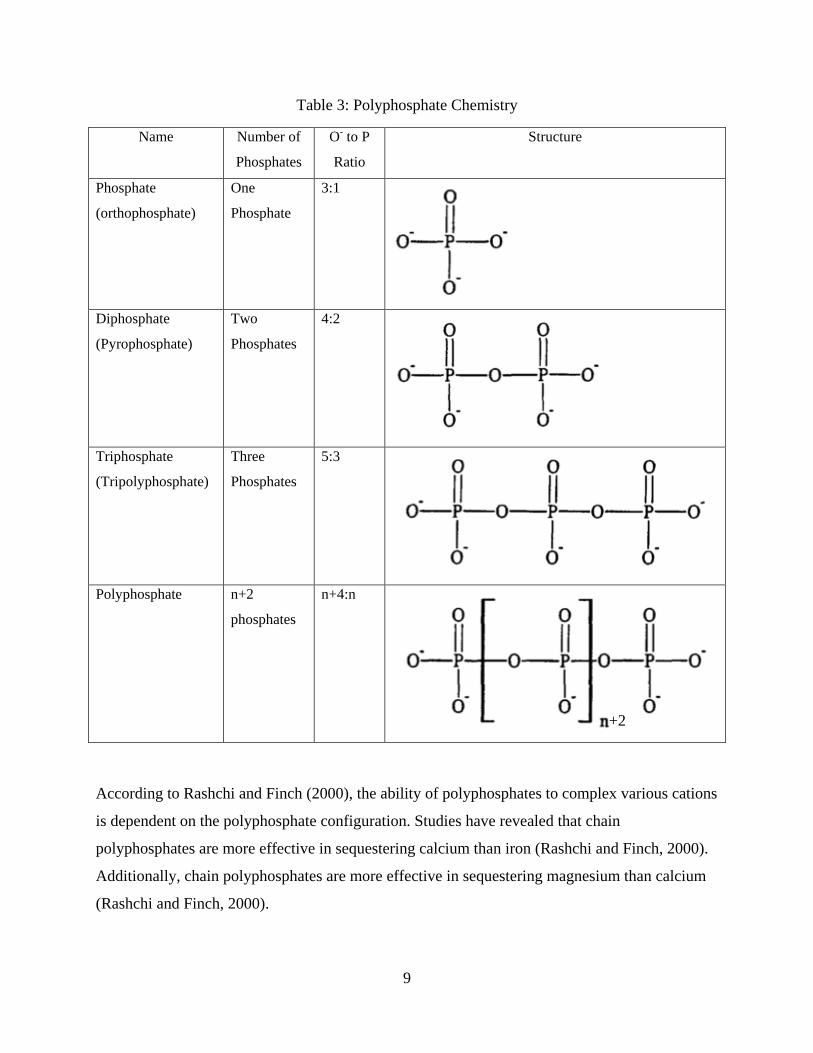
Polyphosphates consist of chains of phosphates linked by oxygen bonds. Table 3 displays
various configurations of polyphosphates. When polyphosphates have a large number of
phosphates linked in a chain (greater than 4), the molecular formula for the polyphosphate is
[(PO3)n-1PO4](n+2)-. However, this formula is indistinguishable from the ring formation
(metaphosphate) of a polyphosphate with the molecular formula of (PO3)nn-. Each configuration
of polyphosphates has a different number of potential binding sites for the metal (Rashchi and
Finch, 2000).
9
Table 3: Polyphosphate Chemistry
Name Number of
Phosphates
O- to P
Ratio
Structure
Phosphate
(orthophosphate)
One
Phosphate
3:1
Diphosphate
(Pyrophosphate)
Two
Phosphates
4:2
Triphosphate
(Tripolyphosphate)
Three
Phosphates
5:3
Polyphosphate n+2
phosphates
n+4:n
According to Rashchi and Finch (2000), the ability of polyphosphates to complex various cations
is dependent on the polyphosphate configuration. Studies have revealed that chain
polyphosphates are more effective in sequestering calcium than iron (Rashchi and Finch, 2000).
Additionally, chain polyphosphates are more effective in sequestering magnesium than calcium
(Rashchi and Finch, 2000).
+2

10
Degradation of the polyphosphate chains in water is not significant over a 72 hour period and
therefore, polyphosphates are used in drinking water treatment, since water usually does not
remain in the distribution system for more than three days (Klueh and Robinson, 1989)
2.2.2 Sequestering Agents
Three different sequestering agents were studied in the current research project. These
sequestering agents include Carus 3350, Innophos tetrapotassium pyrophosphate, and AquaMag
9000. Table 4 describes the composition of the three polyphosphates used in this study.
Table 4: Polyphosphate Characteristics
Product
% as Phosphate by Mass Composition
Carus Aquamag
9000 26.7
Polyphosphate blend (triphosphoric acid , pentasodium salt, diphosphoric acid, tetrapotassium salt)
Carus 3350 66.9 Zinc polyphosphate (zinc sulfate, polyphosphoric acids, sodium salts, sodium bisulfate)
Innophos TKPP 57 Tetrapotassium pyrophosphate (pyrophosphoric acid,
tetrapotassium salt; Rhodia Phos TKPP; TKPP)
2.2.2.1 Carus AquaMag 9000
AquaMag 9000 is a blended polyphosphate composed of triphosphoric acid, diphosphoric acid
and tetrapotassium salt. It is a colorless, odorless liquid not known to exhibit any hazards (MSDS
AquaMag 9000 Blended Phosphate, 2007).
2.2.2.2 Carus 3350
Carus 3350 is a zinc polyphosphate with a 10 to 1 mass ratio of phosphate to zinc. It is a white
granular solid with a bulk density of 90 lbs/ft3. Carus 3350 is toxic to aquatic life at
concentrations between 1 and 10 mg/L over a period of 96 hours (MSDS Carus 3350 Water
Treatment Chemical, 2009).

11
2.2.2.3 Innnophos Tetrapotassium Pyrophosphate
Tetrapotassium pyrophosphate (TKPP) is a chain of two phosphates with a molecular formula of
K4P2O7 and a molecular weight of 330.4 g/mole. TKPP is an odorless solid, white crystalline
powder, composed of pyrophosphoric acid and a tetrapotassium salt. The OSHA Permissible
Exposure Level for TKPP is 10 mg/m3 (MSDS Tetrapotassium Pyrophosphate Innophos, 2010).
2.3 SEQUESTRATION EFFECTIVENESS Although sequestering agents are commonly used as a treatment alternative for metals such as
iron and manganese, significant research has not been conducted to determine the effectiveness
of these sequestering agents. Most studies conducted occurred in the late 1980s early 1990s. The
following studies were used to help develop a method for measuring sequestering agent
effectiveness.
An early study conducted by Illig (1960) examined The Use of Sodium Hexametaphosphate in
Manganese Stabilization. The author claimed that the hexametaphosphate forms complexes with
iron and manganese which hold these metals in solution. Additionally dispersed colloidal
suspensions are also formed which prevent full precipitation of metals. Analysis of effectiveness
of the polyphosphate was based on consumer complaints.
The colloidal dispersion theory was also observed in the study conducted by Lytle and Snoeyink
(2002) on the Effect of Ortho-and Polyphosphates on the properties of Iron Particles and
Suspensions. For the addition of polyphosphates to water with iron, the polyphosphates may not
actually “sequester” the iron, but rather create interferences so iron particles cannot aggregate
completely and remain in the colloidal form. A study conducted by Robinson et al. (1987) also
supports this claim. Robinson et al. examined the sequestering ability of sodium silicate for iron.
This studied concluded that an iron and silica complex was not formed. Rather iron precipitates
and the silica disperses the iron colloids by giving them negative surface charges therefore,
creating smaller particle sizes. Additionally, the presence of calcium and other multivalent
cations interferes with the ability of silica to destabilize the iron particles; therefore more silica is
needed in the presence of calcium, in order to sequester iron. The Robinson et al (1987) study
concludes that more research is necessary to support the colloidal dispersion theory.

12
Another study (Robinson and Ronk, 1987) examined the sequestering ability of sodium silicate for
manganese. Sodium silicate and sodium hypochlorite were added to the water and samples were
taken on day 0, 1, 3, 5, 7, and 10. To determine the effectiveness of the sequestering agent, a
filterability test using a 0.1 micrometer membrane was conducted. The effectiveness of the
sequestering agent correlated directly to the percent filterability (fraction of metal that passes through
the filter); the greater the percent filterability, the more effective the sequestering agent. The
experiment was conducted at pH 7 and pH 8. Results showed better results for the experiment
conducted at pH 7; however, the greatest percent filterability was observed when neither chlorine nor
sodium silicate was added to the water because of such slow oxidation of manganese by oxygen. It
was hypothesized that manganese is oxidized faster at pH 8 than 7 but not fast enough to form
colloids prior to silica depolymerization. And therefore, it was concluded sodium silicate was not an
effective sequestering agent for manganese.
In 1989 a study was conducted by Klueh and Robinson, Sequestration of Iron in Groundwater by
Polyphosphates. The purpose of the study was to determine the effectiveness of sequestration for iron
control, as well as to compare the effectiveness of two different sequestering agents. The
experimental method involved dosing synthetic water with polyphosphates and chlorine under anoxic
conditions which is important to minimize oxidation of iron. The effectiveness of the sequestering
agent was determined by the filterability of iron through a 0.1 µm filter. Higher filterability of iron
corresponded to more effective sequestering. Samples were collected for five days and measured for
total iron, filterable iron, turbidity, and pH on each of these days. Experiments were also conducted
to understand polyphosphate depolymerization and to determine the effect of time and chlorine
addition with respect to sequestration.
The results of these experiments revealed that groundwater free of calcium was more suitable for
sequestration of iron displaying a filterability of 95% for dosages as low as 1 mg of phosphate per 2
mg of iron. The conclusion that calcium inhibits sequestration effectiveness has also been supported
in another study conduct by Robinson, Minear, and Holden (1987), Effects of Several Ions on
Treatment by Sodium Silicate and Hypochlorite.
In Klueh and Robinson’s study (1989) sequestration was not as effective for lower dosages of 1 mg
of phosphate per 4 mg of iron. Also, when the pore size of the filter decreased, less filterability was
observed. Experiments also showed that polyphosphate depolymerization should not be a problem

13
in distribution systems since depolymerization does not occur until well after 5 days. Lastly, the
experiments proved that polyphosphate addition should occur prior to chlorine addition.
The American Water Works Association Research Foundation (AWWARF) published a report in
1990 on Sequestering Methods of Iron and Manganese Treatment. In this report, research was
conducted at the University of Tennessee to further understand sequestration. Results showed that
when sodium silicate and chlorine were added nearly simultaneously, the effectiveness of iron
sequestration was improved. However, sodium silicate does not effectively sequester manganese.
Manganese is sequestered more effectively by polyphosphates.
Additionally, sequestering becomes less effective as time increases, so distribution systems with long
detention times may require a higher dose of sodium silicate. The study also concluded that higher
hardness levels and higher iron levels require addition of more sodium silicate. Temperature also
effects sequestering ability. Sequestering by sodium silicate became less effective at higher
temperatures.
In 1992 a study conducted by Robinson, Reed, and Frazier examined Iron and Manganese
Sequestration Facilities using Sodium Silicate. Similarly to the previous studies mentioned,
sequestration effectiveness was measured by the filterability of iron and manganese after sodium
silicate addition. Conclusions drawn from this study indicated that iron and manganese precipitated
in hot water heaters even with sodium silicate addition. Also, manganese is not as effectively
sequestered by sodium silicate as iron. Lastly, sequestration was unsuccessful at a facility where the
sodium silicate and chlorine were not added simultaneously.
Chapter 3 MATERIALS AND METHODS This chapter discusses the materials and methods used to complete experimentation.
3.1 EXPERIMENTAL METHODS The experimental methods section describes the procedure used to determine sequestering agent
effectiveness. The results section of this report discusses method development results for
determining sequestering agent effectiveness while the experimental methods section describes
the most successful method chosen to complete this task.

14
3.1.1 Field Sampling
Sampling was conducted on-site at four groundwater source locations including Amherst, MA,
Hadley, MA, Litchfield, CT, and Oxford CT. Total manganese, total iron, chlorine residual, and
pH were measured on-site for all raw water samples. In addition, samples were filtered through a
0.2 µm Millipore 25 mm diameter membrane filter using a syringe; metal levels in the filtrate
(colloidal plus dissolved) were measured. Samples were also processed through a 63 mm
diameter Millipore YM30 ultrafilter (UF) using nitrogen gas and an Amicon 8200 200 mL
ultrafilter cell; metal concentrations in the UF filtrate (dissolved) were measured.
Raw water samples were carefully collected under anoxic conditions to mimic system operating
conditions and prevent inadvertent iron oxidation. Samples were collected in 300 mL clear glass
BOD vials. Two holes were drilled into a plastic cap that fit over the neck of a BOD vial for
insertion of a nitrogen line and a groundwater line. The 300 mL BOD vials were first purged
with nitrogen. Nitrogen was continuously applied to the bottle as groundwater was added. The
groundwater line was removed and the BOD vial was placed on a stir plate for injection of
polyphosphate. The water was continuously stirred for one minute after polyphosphate addition
and then chlorine was added to the vials. The vials were then stirred for 15 more seconds. When
pH adjustment was necessary (raw water pH <7), sodium hydroxide was added to the samples.
3.1.2 Dosing Considerations
3.1.2.1 Sequestering Agent Dosing
A separate raw water sample was used to determine appropriate dosing for chlorination and pH
adjustment. Three sequestering agents were added, each at three dosages. Carus 3350, Innophos
tetrapotassium pyrophosphate (TKPP, K4P2O7), and AquaMag 9000 were typically added to
samples at dosages of 100%, 150%, and 200% of the stoichiometric dose (as explained below).
Two samples of raw water were used as untreated controls.
Dosages of polyphosphates were determined based on the total concentration of iron and
manganese in the raw water sample. Calculations for sequestering agent additions were made
based on the assumption that approximately 2 mg/L of phosphate is required to sequester 1 mg/L
of metal (Fe and Mn); this is equivalent to a stoichiometry of one mole of phosphorous per mole

15
of divalent metal as shown in Reactions 1 and 2. According to Reactions 1 and 2, 3.01 mg of
TKPP is required to sequester 1 mg of manganese and 2.96 mg of TKPP is required to sequester
1 mg of iron.
2𝑀𝑛+2 + 𝐾4𝑃2𝑂7 → 𝑀𝑛2𝑃2𝑂7 + 4K+ Reaction 1
1 𝑚𝑜𝑙𝑒 𝑀𝑛54940 𝑚𝑔 𝑀𝑛
×1 𝑚𝑜𝑙𝑒 𝐾4𝑃2𝑂7
2 𝑚𝑜𝑙𝑒 𝑀𝑛×
330400 𝑚𝑔 𝐾4𝑃2𝑂7𝑚𝑜𝑙𝑒 𝐾4𝑃2𝑂7
= 3.01𝑚𝑔 𝐾4𝑃2𝑂7𝑚𝑔 𝑀𝑛
2𝐹𝑒+2 + 𝐾4𝑃2𝑂7 → 𝐹𝑒2𝑃2𝑂7 Reaction 2
1 𝑚𝑜𝑙𝑒 𝐹𝑒55845 𝑚𝑔 𝐹𝑒
×1 𝑚𝑜𝑙𝑒 𝐾4𝑃2𝑂7
2 𝑚𝑜𝑙𝑒 𝐹𝑒×
330400 𝑚𝑔 𝐾4𝑃2𝑂7𝑚𝑜𝑙𝑒 𝐾4𝑃2𝑂7
= 2.96 𝑚𝑔 𝐾4𝑃2𝑂7𝑚𝑔 𝐹𝑒
All sequestering agents were dosed as product. For example, Carus 3350 contains 66.9%
phosphate; therefore Reaction 3 was used to determine the dose for Carus 3350 as product.
According to the reaction, 2.99 mg of Carus 3350 is required to sequester 1 mg of metal (Mn and
Fe). The approach in reaction 3 was used to determine dosages as products for all sequestering
agents.
2𝑚𝑔𝐿 𝑃𝑂4% mass phosphate of polyphosphate
= 𝑚𝑔 𝑃𝑟𝑜𝑑𝑢𝑐𝑡𝑚𝑔 (𝑀𝑛 + 𝐹𝑒)
Reaction 3
3.1.2.2 Chlorine Dosing
Chlorine was added to raw water at dosages ranging between 1.5 and 2.5 mg/L as Cl2. A kinetic
study was conducted at each groundwater source location. The chlorine residual was measured
instantaneously, one hour after addition, and two hours after addition. The dose which resulted in
a chlorine residual of approximately 1 mg/L after a two hour period was chosen as the
appropriate chlorine dose. This residual was selected because it is a typical treatment plant
effluent chlorine residual for the Aquarion Water Company.
3.1.3 Laboratory Investigation
Field collected and prepared samples were allowed to react for 48 hours at 12°C in a dark room
to mimic groundwater conditions. Samples were then fractionated to measure total, particulate,
colloidal, and dissolved iron and manganese. The fraction of metals in the colloidal and
dissolved form after the 48 hour reaction period was considered to be sequestered. Two samples

16
that were not dosed with polyphosphates were used as controls for the experiment. It was
expected that for samples without polyphosphate addition, all or most of the metal would be in
the particulate form after the 48 hour reaction period. Metal concentrations were determined
using a hand held HACH spectrophotometer and an ICP-MS instrument. Raw water samples
from each groundwater source were also collected for analysis of calcium, magnesium,
potassium, sodium and total organic carbon.
3.1.3.1 Fractionation of Iron and Manganese
Metals were fractionated into particulate, colloidal, and dissolved forms. Samples were filtered
through a 25 mm diameter 0.2 μm pore size Millipore membrane filter using a 60 mL plastic
syringe. The filtrate from the syringe filter contained colloidal and dissolved fractions of metal,
as the particulate metals were removed by the filter. An Amicon 8200 200 mL ultrafilter cell
with a Millipore YM30 ultrafilter was used to remove particulate and colloidal fractions of metal
from samples. Nitrogen gas was applied to pressurize the system at 30 psi and to prevent
oxidation of metals. The filtrate from the ultrafilter membrane was assumed to contain only
dissolved metals. In order to determine the fraction of particulate metal, the combined colloidal
and dissolved metal concentration was subtracted from the total metal concentration. In order to
determine the fraction of colloidal metal, the concentration of dissolved metal (filtrate from
ultrafilter) was subtracted from the combined colloidal and dissolved concentration (filtrate from
the syringe filter). The fraction of dissolved metal was determined as the concentration of metal
in the filtrate of the ultrafilter divided by the total metal concentration. A study conducted by
Carlson et al. (1997) used fractionation of metals and examined various sizes of ultrafilters. The
study showed the 30 K ultrafilter was the optimal size because most colloidal manganese was
captured and only negligible amounts of natural organic matter were removed.
3.2 ANALYTICAL METHODS
3.2.1 Metal Concentration Measurements
All BOD vials used for sample collection were placed in a 10% sulfuric acid bath for at least 24
hours and rinsed three times with DI water. Vials used for ICP-MS were placed in a 2% nitric
acid bath for at least 24 hour and rinsed three times with DI water. On-site metal and chlorine
concentrations were measured using HACH handheld pocket colorimeters. HACH handheld

17
instruments were also used in laboratory testing. ICP-MS measurements were also made for
comparison purposes.
3.2.1.1 HACH Low Range Manganese Pocket Colorimeter Test Kit Method
Manganese concentrations were determined using the HACH low range total manganese pocket
colorimeter test kit. The low range pocket colorimeter test kit measures concentrations of
manganese between 0.01 to 0.7 mg/L (Method 8149). The following procedure was used to
determine manganese concentrations. 10 mL of sample were collected in the sample cell vial.
One packet of ascorbic acid was added to the sample to reduce metals to the Mn2+ form. 12 drops
of alkaline-cyanide reagent were then added to the sample in order to mask interference by other
metals. 12 drops of PAN indicator solution were then added to the sample. The sample was then
shaken and left to react for two minutes. The PAN indicator solution complexes with the Mn2+
and displays a yellow-orange color. The intensity of the color corresponds to the concentration of
metal within the sample. A blank is also prepared following the same procedure as the sample,
using deionized water instead of sample water in order to zero the instrument. After the two
minute reaction time, the blank is placed in the instrument and then the instrument is zeroed. The
sample is then placed in the instrument and analyzed. The instrument displays concentration in
mg/L based on measured light absorbance and an internal calibration curve.
3.2.1.2 HACH Total Iron (FerroVer) Pocket Colorimeter Test Kit Method
Iron concentrations were measured both on-site and in the laboratory using the HACH iron
pocket colorimeter test kit method (Method 8008). The iron pocket colorimeter test kit measures
iron in the range of 0.02 to 5.00 mg/L. Two samples cells were each filled with 10 mL of sample.
One packet of FerroVer powder pillow reagent was added to one of the sample cells. The sample
was allowed to react for three minutes. In the presence of iron, the FerroVer powder pillow
complexes with iron and displays a pink color. The intensity of the color corresponds to the
concentration of iron within the sample. The sample without the FerroVer powder pillow was
used as the blank to zero the instrument. The sample with the powder pillow was then analyzed.
The instrument displays iron concentration in mg/L based on light absorbance and an internal
calibration curve.

18
3.2.1.3 Inductively Coupled Plasma Mass Spectroscopy (ICP-MS)
The ICP-MS was used to determine manganese and iron concentrations in the laboratory setting
in conjunction with the HACH handheld test kits. Results from the HACH and ICP-MS were
compared to determine the accuracy of the HACH instruments. Prior to use of the ICP-MS,
samples were acidified with 2% nitric acid and stored in a constant temperature room at 4°C. A
set of standards was prepared from stock solution of 1 g/L manganese and iron purchased from
Perkin Elmer. The standards were prepared at concentrations of 0.01, 0.1, 0.2, 0.3, 0.4, and 0.5
mg/L. Prior to use, the instrument’s performance was measured using a daily performance
solution containing various analytes to determine the level of intensity detected for the atomic
mass of each analyte.
3.2.1.4 pH
A Thermo Electron Corp. Orion 520A bench top pH meter was used as well as a Thermo Orion
pH probe for pH measurements. The instruments were calibrated with certified buffer solutions
at a pH of 4, 7, and 10 prior to each use.
3.2.1.5 Dissolved Oxygen (DO)
A YSI 5000 bench top dissolved oxygen meter was used to determine the dissolved oxygen in
the raw water samples. The instrument was calibrated by placing the probe in air at 100%
relative humidity. To achieve 100% relative humidity, the DO probe was placed in a BOD bottle
with approximately 1 inch of water.
3.2.1.6 Chlorine Residual
Chlorine residuals were measured using a HACH or HF Scientific free chlorine pocket
colorimeter test kit. Some laboratory experiments were conducted using the DPD titration
method, in part to confirm the accuracy of the pocket colorimeter test kit.
3.2.1.7 HACH/ HF Scientific Free Chlorine Pocket Colorimeter Test Kit
The measurement range of the free chlorine test kit was 0.01 to 10 mg/L. 10 mL of sample was
poured into the sample cell. The cell was then placed in the instrument and the reading was
zeroed. The cell was then removed and a DPD free chlorine powder pillow was added to the

19
sample cell and the cell was capped and shaken. The chlorine residual was then measured. The
DPD free chlorine powder pillow causes the sample to turn pink in the presence of free chlorine.
The intensity of the color corresponds to the concentration of free chlorine in the sample. The
instrument displays chlorine concentration in mg/L as Cl2 based on light absorbance and an
internal calibration curve.
3.2.1.8 DPD Titration Method
Prior to performing the DPD titration method, all glassware was placed in a chlorine bath and
rinsed with distilled water three times upon removal. 100 mL of sample was placed in a 100 mL
volumetric flask. 5 mL of buffer solution was added to 125 mL Erlenmeyer flask and 5 mL of
DPD indicator solution was also added to the Erlenmeyer flask. The 100 mL of sample was then
added to the flask. Standardized FAS was used for titration and was titrated until the pink color
of the sample turned clear. The volume of the titrant used was recorded. The concentration of
chlorine in mg/L is equal to the volume of titrant used multiplied by the FAS factor.
3.2.1.9 Total Organic Carbon (TOC)
The Shimadzu TOC/V analyzer was used for TOC measurements. Samples were collected and
acidified to a pH of 2 by addition of 50 μL of 6N HCl. The instrument was calibrated using four
calibration standards at concentrations of 0, 2, 5, and 10 mg/L. A primary stock solution of 1000
mg/L was prepared by drying approximately 0.75 g of Potassium Hydrogen Phthalate (KHP) in
an oven at 103-110°C for 30 minutes. The KHP was then placed in the dessicator for 20-30
minutes. Exactly 0.5413 g of the KHP was then measured using an analytical balance. A 250 mL
volumetric flask was filled halfway with Super-Q water and the KHP was added to the flask. The
flask was filled to the mark with Super-Q water and stirred. An intermediate standard was
prepared by dilution of the stock solution to 10 mg/L. The intermediate standard was used by the
analyzer to prepare the four calibration standards of 0, 2, 5, and 10 mg/L.

20
Chapter 4 RESULTS AND DISCUSSION The following chapter presents historical data for each of the four groundwater sources, the
method used to determine the effectiveness of sequestering agents, and results from
polyphosphate addition at each source location.
4.1 SOURCE WATER AND HISTORICAL DATA The four source water locations used in experimentation include Hamill (CT), Oxford (CT),
Amherst (MA), and Hadley (MA). Historical data for these sites are described in this section.
4.1.1 Aquarion Water Company Hamill Well
The Hamill Wells treatment facility located on South Lake Street in Litchfield Connecticut treats
groundwater by the addition of Carus 3350 and sodium hypochlorite. The average addition of
Carus 3350 for May 2011 was 1.47 mg/L as phosphate and the average dose of sodium
hypochlorite was 2.75 mg/L as Cl2. The addition of 2.75 mg/L as Cl2 provides for a chlorine
residual of approximately 1.35 mg/L.
Table 5 displays a summary of historical data for the Hamill Wells from January 2007 to
November 2011. The manganese concentrations over the four year period averaged 0.06 mg/L
for both raw water and treated water, a level slightly above the secondary maximum contaminant
level (SMCL) of 0.05 mg/L. The average iron concentrations over the four year period are 0.20
mg/L for the raw water and 0.22 mg/L for the treated water which both fall below the SMCL of
0.3 mg/L.
Table 5: Summary of Historical Data for Hamill Wells from January 2007 to November 2011
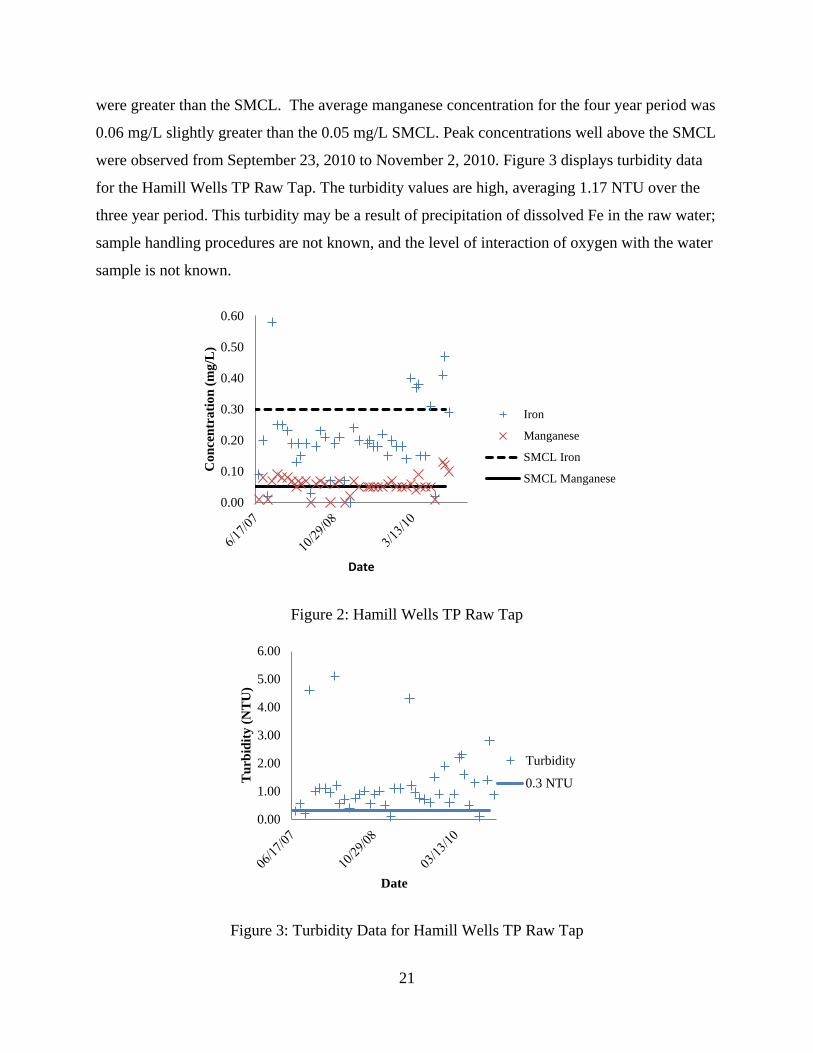
Figure 2 shows levels of iron and manganese for the Hamill Wells TP Raw Tap from January
2007 to November 2011. The average iron concentration measured at the Hamill Well TP Raw
Tap during this time period was 0.20 mg/L, however a peak concentration of 0.58 mg/L of iron
occurred on October 3, 2007. Also from July 8, 2010 to November 2, 2010 iron concentrations
Source pH Manganese (mg/L) Iron (mg/L) Turbidity (NTU) Mean Min Max Mean Min Max Mean Min Max Mean Min Max
Hamill Wells TP Raw Tap 7.6 7.2 7.9 0.06 0 0.13 0.20 0 0.58 1.17 0.10 5.10 Hamill Wells TP Eff Tap 7.7 6.9 8.0 0.06 0 0.12 0.22 0 0.62 1.67 0.05 13.50
21
were greater than the SMCL. The average manganese concentration for the four year period was
0.06 mg/L slightly greater than the 0.05 mg/L SMCL. Peak concentrations well above the SMCL
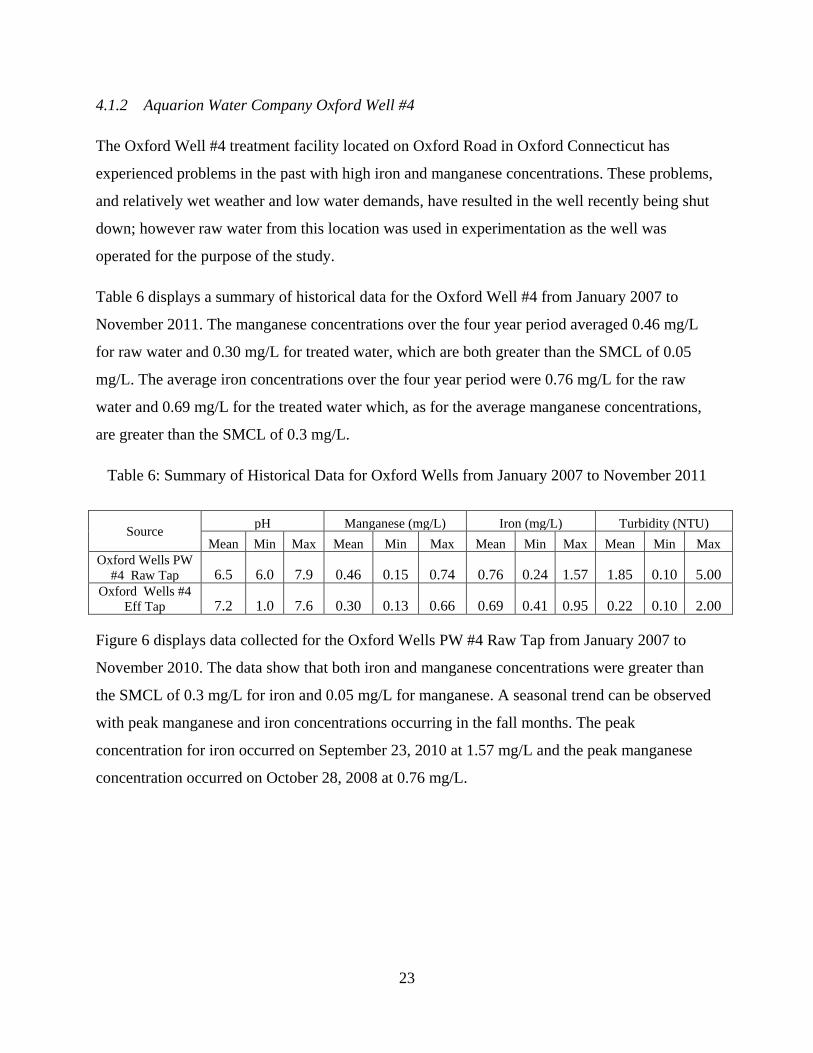
were observed from September 23, 2010 to November 2, 2010. Figure 3 displays turbidity data
for the Hamill Wells TP Raw Tap. The turbidity values are high, averaging 1.17 NTU over the
three year period. This turbidity may be a result of precipitation of dissolved Fe in the raw water;
sample handling procedures are not known, and the level of interaction of oxygen with the water
sample is not known.
Figure 2: Hamill Wells TP Raw Tap
Figure 3: Turbidity Data for Hamill Wells TP Raw Tap
0.00
0.10
0.20
0.30
0.40
0.50
0.60
Con
cent
ratio
n (m
g/L
)
Date
Iron
Manganese
SMCL Iron
SMCL Manganese
0.00
1.00
2.00
3.00
4.00
5.00
6.00
Tur
bidi
ty (N
TU
)
Date
Turbidity
0.3 NTU

22
Data collected for the Hamill Wells TP Effluent Tap are displayed in Figure 4. The average iron
concentration of the Hamill Wells effluent increased to 0.22 mg/L from the 0.20 mg/L raw water
level, however, both concentrations fall below the SMCL. The average manganese concentration
for the Hamill effluent tap was 0.06 mg/L, which was the same as the raw water average
manganese concentration, and is greater than the SMCL.
Figure 4: Hamill Wells TP Eff Tap
Figure 5 displays turbidity data for the Hamill Wells TP Effluent Tap. The turbidity values were
high, averaging 1.67 NTU, and increased from the 1.17 NTU average for Hamill raw water. This
increase may be attributed to oxidation of some of the raw water dissolved iron across the
treatment plant. The filtered water treatment turbidity goal is 0.3 NTU. The average turbidity
value of 1.67 NTU is therefore, significantly greater than the goal of 0.3 NTU, and changes in
treatment processes should be implemented.
Figure 5: Turbidity Data Hamill Wells TP Eff Tap
0.00
0.10
0.20
0.30
0.40
0.50
0.60
Con
cent
ratio
n (m
g/L
)
Date
Iron
Manganese
SMCL Iron
SMCLManganese
0.000.501.001.502.002.503.003.504.004.505.00
Tur
bidi
ty (N
TU
)
Date
Turbidity
0.3 NTU
23
4.1.2 Aquarion Water Company Oxford Well #4
The Oxford Well #4 treatment facility located on Oxford Road in Oxford Connecticut has
experienced problems in the past with high iron and manganese concentrations. These problems,
and relatively wet weather and low water demands, have resulted in the well recently being shut
down; however raw water from this location was used in experimentation as the well was
operated for the purpose of the study.
Table 6 displays a summary of historical data for the Oxford Well #4 from January 2007 to
November 2011. The manganese concentrations over the four year period averaged 0.46 mg/L
for raw water and 0.30 mg/L for treated water, which are both greater than the SMCL of 0.05
mg/L. The average iron concentrations over the four year period were 0.76 mg/L for the raw
water and 0.69 mg/L for the treated water which, as for the average manganese concentrations,
are greater than the SMCL of 0.3 mg/L.
Table 6: Summary of Historical Data for Oxford Wells from January 2007 to November 2011
Figure 6 displays data collected for the Oxford Wells PW #4 Raw Tap from January 2007 to
November 2010. The data show that both iron and manganese concentrations were greater than
the SMCL of 0.3 mg/L for iron and 0.05 mg/L for manganese. A seasonal trend can be observed
with peak manganese and iron concentrations occurring in the fall months. The peak
concentration for iron occurred on September 23, 2010 at 1.57 mg/L and the peak manganese
concentration occurred on October 28, 2008 at 0.76 mg/L.
Source pH Manganese (mg/L) Iron (mg/L) Turbidity (NTU) Mean Min Max Mean Min Max Mean Min Max Mean Min Max
Oxford Wells PW #4 Raw Tap 6.5 6.0 7.9 0.46 0.15 0.74 0.76 0.24 1.57 1.85 0.10 5.00
Oxford Wells #4 Eff Tap 7.2 1.0 7.6 0.30 0.13 0.66 0.69 0.41 0.95 0.22 0.10 2.00

24
Figure 6: Oxford Well PW #4 Raw Tap
The turbidity data for the Oxford #4 Raw Tap over the three year period are displayed in Figure
7. The turbidity levels were significantly greater than 0.3 NTU. The average turbidity level was
1.85 NTU with the highest turbidity level measured on March 26, 2008 at 5.00 NTU. The high
turbidity levels can be attributed to precipitation of dissolved iron in the raw water samples. The
average pH for the #4 Raw Tap well was 6.5.
Figure 7: Turbidity Data for Oxford Well #4 Raw Tap
0.000.200.400.600.801.001.201.401.60
Con
cent
ratio
n (m
g/L
)
Date
Iron
Manganese
SMCL Iron
SMCL Manganese
0.00
1.00
2.00
3.00
4.00
5.00
6.00
Tur
bidi
ty (N
TU
)
Date
Turbidity
0.3 NTU
25
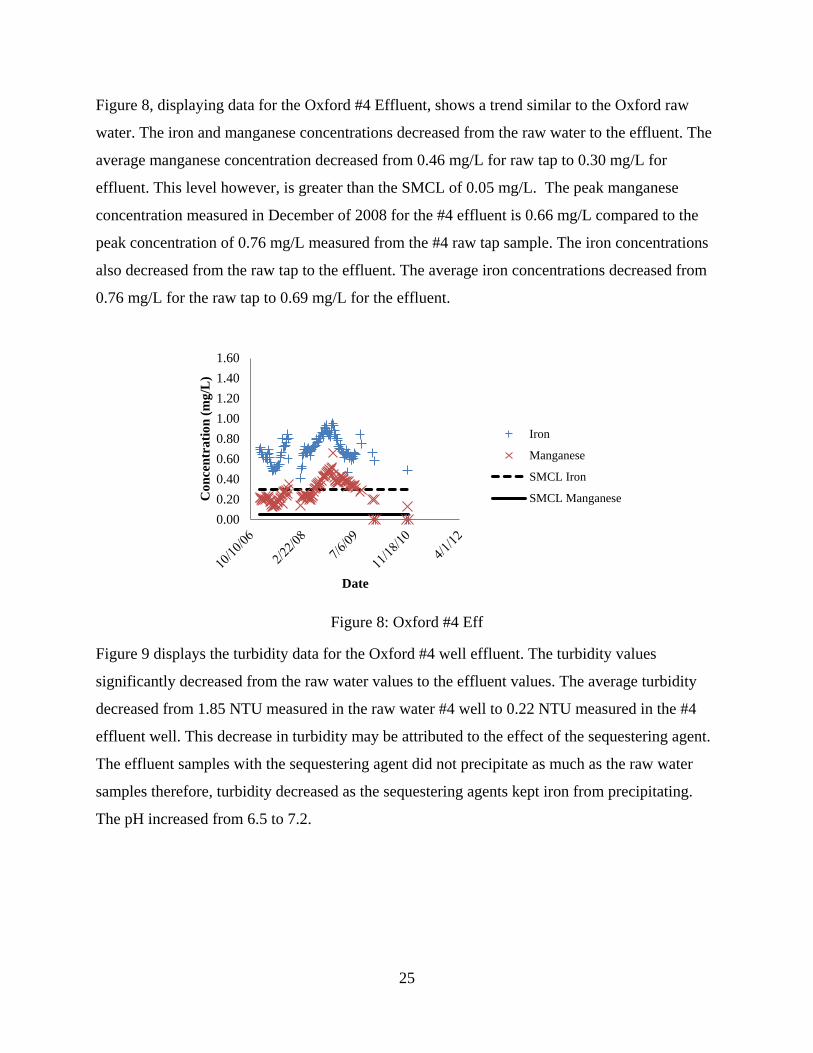
Figure 8, displaying data for the Oxford #4 Effluent, shows a trend similar to the Oxford raw
water. The iron and manganese concentrations decreased from the raw water to the effluent. The
average manganese concentration decreased from 0.46 mg/L for raw tap to 0.30 mg/L for
effluent. This level however, is greater than the SMCL of 0.05 mg/L. The peak manganese
concentration measured in December of 2008 for the #4 effluent is 0.66 mg/L compared to the
peak concentration of 0.76 mg/L measured from the #4 raw tap sample. The iron concentrations
also decreased from the raw tap to the effluent. The average iron concentrations decreased from
0.76 mg/L for the raw tap to 0.69 mg/L for the effluent.
Figure 8: Oxford #4 Eff
Figure 9 displays the turbidity data for the Oxford #4 well effluent. The turbidity values
significantly decreased from the raw water values to the effluent values. The average turbidity
decreased from 1.85 NTU measured in the raw water #4 well to 0.22 NTU measured in the #4
effluent well. This decrease in turbidity may be attributed to the effect of the sequestering agent.
The effluent samples with the sequestering agent did not precipitate as much as the raw water
samples therefore, turbidity decreased as the sequestering agents kept iron from precipitating.
The pH increased from 6.5 to 7.2.
0.000.200.400.600.801.001.201.401.60
Con
cent
ratio
n (m
g/L
)
Date
Iron
Manganese
SMCL Iron
SMCL Manganese

26
Figure 9: Turbidity Data for Oxford #4 Eff
4.1.3 Amherst, Massachusetts Raw Water (Well #4)
Amherst water (well #4) was used as a raw water source to examine sequestering agent
effectiveness. The Amherst well #4 water treatment facility does not use sequestering agents
because of high concentrations of manganese and iron, but had used sequestering agents in the
past; currently iron and manganese are oxidized and removed by filtration. This raw water source
had high concentrations of manganese (0.68 mg/L) and moderate concentrations of iron (0.39
mg/L). Additionally, this raw water source had a total hardness of 84.8 mg/L as calcium
carbonate and a pH of 8.
4.1.4 Hadley, Massachusetts Raw Water
Water from a well in Hadley, Massachusetts was also used a raw water source. Similar to the
Amherst well #4 water treatment facility, this facility was not using a sequestering agent as it
uses KMnO4 oxidation and membrane filtration to remove manganese. However, the water
quality differed significantly from the other sources and therefore was used to further examine
sequestering agent effectiveness; sequestration had been used in the past for this source. The
Hadley raw water had a manganese concentration of 0.33 mg/L and very low iron (0.03 mg/L).
The Hadley raw water source had a total hardness of 145 mg/L as calcium carbonate and a pH of
7.49.
0.00
0.50
1.00
1.50
2.00
Tur
bidi
ty (N
TU
)
Time
Turbidity
0.3 NTU

27
4.1.5 Comparison of Source Waters
Table 7 displays a summary of water quality parameters for the four groundwater sources. These
sources were chosen because of their wide range in quality, especially the absolute and relative
levels of metals and levels of hardness. The Hamill source water has the highest hardness at 237
mg/L as CaCO3 and the highest alkalinity at 198 mg/L as CaCO3. The Amherst source water has
the highest iron concentration (0.39 mg/L) and highest manganese concentration (0.68 mg/L).
The pH for all source water ranges between 6 and 8.
Table 7: Water Quality Parameters for Sources
Parameters Amherst Hadley Hamill Oxford pH 8.00 7.49 7.60 6.00 Temperature (°C) 10.9 16.8 11.1 11.2 TOC (mg/L) 0.95 1.60 2.55 2.31 Alkalinity (as mg/L CaCO3) 57 94 198 43 Hardness (as mg/L CaCO3) 85 145 237 30 Calcium (mg/L) 27 43 58 29 Magnesium (mg/L) 3.86 7.50 23.1 5.05 Iron (mg/L) 0.39 0.03 0.22 0.18 Manganese (mg/L) 0.68 0.33 0.09 0.12 Potassium (mg/L) 1.46 2.01 3.29 2.00 Sodium (mg/L) 9.70 9.97 27.9 13.6
4.2 METHOD DEVELOPMENT FOR DETERMINING SEQUESTERANT EFFECTIVENESS Despite the widespread use of sequestering agents, research has not resulted in a successful
method to directly assess the complexation of Mn and Fe by sequestering agents. Analytical
methods used to measure iron and manganese measure total metal and do not distinguish
between complexed or uncomplexed metals. Therefore methods for assessing sequestering agent
effectiveness were evaluated. This section describes the steps taken to determine an appropriate
method.
4.2.1 Variations on HACH Low Range Total Manganese Method
The HACH low range total manganese method measures total manganese by the addition of
ascorbic acid, alkaline cyanide reagent, and PAN indicator solution. The purpose of the ascorbic

28
acid addition is to reduce all forms of manganese within the sample to the lowest oxidation state
of +2. The alkaline cyanide reagent masks interferences by other metals, and the PAN indicator
solution complexes with Mn2+ and forms a yellow-orange color. Therefore, a hypothesis was
made that if the ascorbic acid was removed from the procedure, only the manganese already in
the Mn2+ or dissolved form would be complexed with the PAN indicator solution. It was also
assumed that Mn2+ complexed with a polyphosphate was in the dissolved form and would be
measured, while manganese that was free or not complexed, would not be in the +2 oxidation
state and therefore, would not be measured. This method was tested by creating synthetic water
with a known manganese concentration (0.2 mg/L) by addition of manganous sulfate to
deionized water. The Hach method was used both with and without ascorbic acid addition in
order to compare results. These results are displayed in Table 8. In order for this procedure to
work effectively, both measurements (with and without ascorbic acid) would have resulted in the
same manganese concentration because all manganese in the synthetic water was in the dissolved
form. However, the manganese concentrations measured without the addition of ascorbic acid
were significantly lower than the measurements made with ascorbic acid. Therefore, it was
determined that ascorbic acid was necessary for the HACH method to measure dissolved
manganese, so this approach was not successful.
Table 8: Hach Method with and without Ascorbic Acid
Measured Manganese
Concentration with Ascorbic Acid
(mg/L)
Measured Manganese
Concentration without Ascorbic
Acid (mg/L) 0.196 0.025 0.202 0.012 0.200 0.010
4.2.2 Weak Cation Exchange Resin
An alternative method to measure sequestering agent effectiveness using weak cation exchange
resin was investigated. It was hypothesized that a cation exchange resin could be used to separate
complexed and uncomplexed Mn2+. The positively charged free manganese would bind to the
resin and the neutral manganese-polyphosphate complex would pass through the resin. The
cation exchange resin used was DOWEX MAC-3. This resin is a weak acid cationic resin

29
comprised of polyacrylic macro pores (DOWEX MAC-3, 2003). Laboratory experiments were
conducted using model water with a concentration of 0.2 mg/L of dissolved Mn2+. The model
water was processed through the ion exchange column and 98.7% of the manganese was
removed by the resin. The water was then dosed with polyphosphate at 200% of the
stoichiometric dose in order to ensure almost complete complexation. This water was then
processed through the column. For this experiment, 75% of the manganese was removed by the
ion exchange column. The method did not work effectively because although the ion exchange
resin was weak, it was apparently still strong enough to break the polyphosphate-manganese
complex. In order for this procedure to work effectively, it was hypothesized that 0% of the
manganese would have been removed by the resin because it would have all been in the
complexed form. Therefore this approach was not successful.
4.2.3 Metal Filterability Method
A study conducted by Klueh and Robinson (1989) determined polyphosphate effectiveness by
measuring the filterability of iron. In their procedure polyphosphates were added to the samples
followed by sodium hypochlorite at the stoichiometric dose. The concentration of iron after
filtration through a 0.1 micron membrane filter was measured over the course of 6 days.
Effectiveness was determined based on the percent of total iron that was filterable. The percent
of filterable iron directly correlated to the percent of iron sequestered (Klueh and Robinson,
1989). Based on this study, a similar protocol was developed to measure the sequestering ability
of various polyphosphates.
An initial study was conducted by using deionized (DI) water to which manganous (Mn2+)
sulfate was added to achieve a manganese concentration of approximately 0.2 mg/L. Sodium
bicarbonate and sodium chloride were also added at concentrations of 10-4M and 10-3M,
respectively. Sodium hydroxide was added to increase the pH to between 7.5 and 8.
Polyphosphate was added according to the stoichiometry in Reaction 4: 1 mole of sodium
hexametaphosphate to 3 moles of manganese. Previous stoichiometry displayed in Reactions 1
and 2 of this thesis showed a 1:2 mole ratio of dipolyphosphate to metal, however for this
particular experiment sodium hexametaphosphate was used as a polyphosphate and therefore,
since the molecular formula was known, the stoichiometry was recalculated for this particular
polyphosphate.

30
Sodium hypochlorite (NaOCl) was dosed to obtain a residual of approximately 1 mg/L as Cl2.
The solution was allowed to react for 24 hours. After 24 hours, the solution was vacuum filtered
through a 0.4 µm filter and pressure filtered through an ultrafilter membrane to determine
particulate, colloidal, and dissolved manganese. Total manganese was also measured.
The results from this experiment are displayed in Figure 10 and show that samples without the
polyphosphate and samples with the polyphosphate reacted similarly. For samples with
polyphosphate addition, 96 to 99% of the manganese was in the colloidal and dissolved form
after 24 hours. Samples without polyphosphate showed between 90 and 92% of the manganese
in the dissolved form. Both samples with and without a polyphosphate displayed that the
majority of the manganese was in the dissolved form rather than in the colloidal form.
Figure 10: Synthetic Water 24 Hour Reaction Period
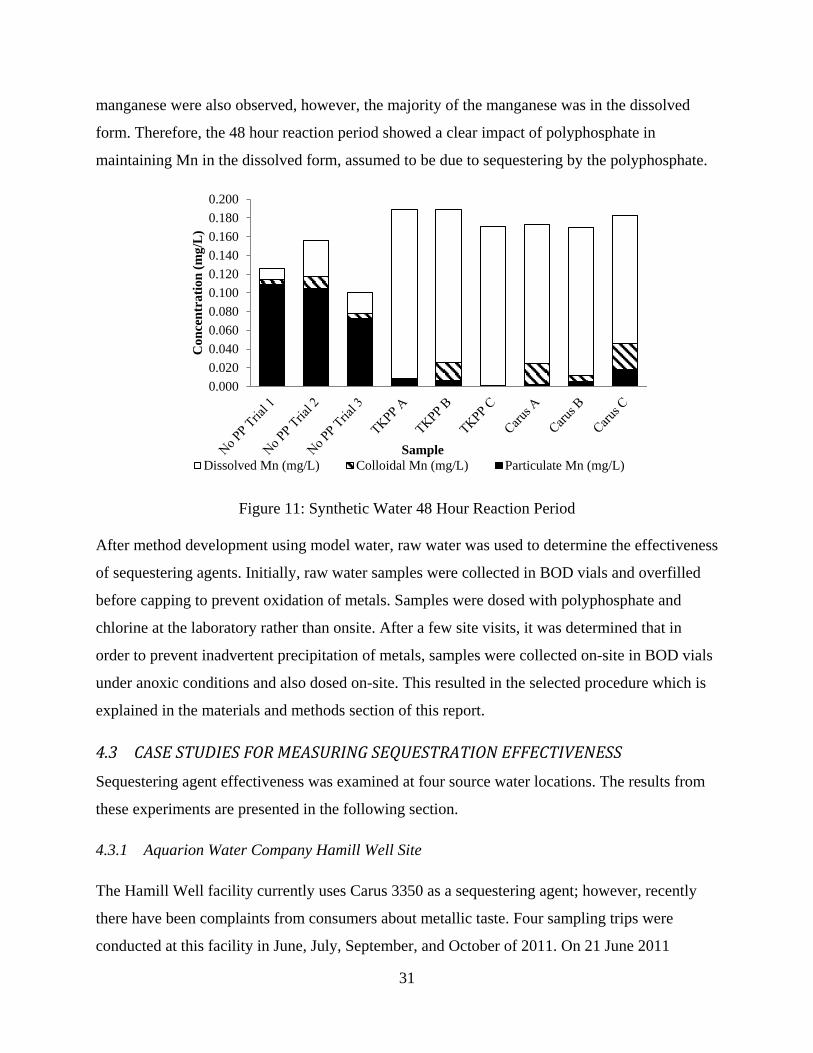
Since no significant impacts of polyphosphate addition on the fraction of dissolved Mn were
observed after a 24 hour reaction period, the reaction period was increased to 48 hours. The
results for the 48 hour experiment (Figure 11) show that the samples with added polyphosphate
had greater total manganese when compared to samples without the added polyphosphate.
Additionally, samples with the polyphosphate had a much greater percentage of dissolved
manganese (75-99%) than samples without polyphosphate (10-22%). Small fractions of colloidal
0
0.05
0.1
0.15
0.2
0.25
No PPA No PPB PPA PPB PPC
Con
cent
ratio
n (m
g/L
)
Sample
Mn Dissolved (mg/L) Colloidal Mn (mg/L) Mn Particulate (mg/L)
3 𝑀𝑛𝑆𝑂4 (𝑎𝑞) + 𝑁𝑎6𝑃6𝑂18 (𝑎𝑞) → 𝑀𝑛3𝑃6𝑂18 (𝑎𝑞) + 3𝑁𝑎2𝑆𝑂4(𝑎𝑞) Reaction 4
31
manganese were also observed, however, the majority of the manganese was in the dissolved
form. Therefore, the 48 hour reaction period showed a clear impact of polyphosphate in
maintaining Mn in the dissolved form, assumed to be due to sequestering by the polyphosphate.
Figure 11: Synthetic Water 48 Hour Reaction Period
After method development using model water, raw water was used to determine the effectiveness
of sequestering agents. Initially, raw water samples were collected in BOD vials and overfilled
before capping to prevent oxidation of metals. Samples were dosed with polyphosphate and
chlorine at the laboratory rather than onsite. After a few site visits, it was determined that in
order to prevent inadvertent precipitation of metals, samples were collected on-site in BOD vials
under anoxic conditions and also dosed on-site. This resulted in the selected procedure which is
explained in the materials and methods section of this report.
4.3 CASE STUDIES FOR MEASURING SEQUESTRATION EFFECTIVENESS Sequestering agent effectiveness was examined at four source water locations. The results from
these experiments are presented in the following section.
4.3.1 Aquarion Water Company Hamill Well Site
The Hamill Well facility currently uses Carus 3350 as a sequestering agent; however, recently
there have been complaints from consumers about metallic taste. Four sampling trips were
conducted at this facility in June, July, September, and October of 2011. On 21 June 2011
0.0000.0200.0400.0600.0800.1000.1200.1400.1600.1800.200
Con
cent
ratio
n (m
g/L
)
Sample Dissolved Mn (mg/L) Colloidal Mn (mg/L) Particulate Mn (mg/L)

32
sampling was conducted at Aquarion Water Company Hamill Wells in order to assess the
effectiveness of various chemicals for sequestration of source water Mn and Fe. Samples were
collected from the raw water, the plant effluent, and at two locations within the distribution
system (the PATCO Service Station and the Litchfield Country Club). For the June, July, and
September site visits, raw water samples were collected in BOD vials headspace free and
brought back to the University of Massachusetts, Amherst for dosing of polyphosphate and
chlorine. However, this method of collection proved to be ineffective because metals, especially
iron, were oxidized prior to polyphosphate addition due to interaction with air from the transfer
process. Therefore, a new collection method was undertaken, using dosing of polyphosphate and
chlorine on-site under anoxic conditions, attained via the application of nitrogen. This collection
procedure is described in detail in the materials and methods section of this report.
For the metal filterability procedure, 100% recovery of total metal was generally not achieved
after the 48 hour reaction period. This may be attributed to adsorption of metal onto glass
surfaces. During the procedure for this experiment, samples were moved several times between
filters and sampling vials, which may have decreased the percent recovery of total metals.
4.3.1.1 Field Sampling Results: June 21 Site Visit
Results from field sampling are displayed in Table 9. Raw water manganese and iron were more
than 62% colloidal/dissolved, and only the iron had colloidal material (14%). In the plant
effluent, 78% of the total manganese was in the dissolved form and 47% of the total iron was in
the dissolved form with another 20% in colloidal form. The chlorine residual in the plant effluent
was 1.62 mg/L as Cl2. The results show that both iron and manganese were removed within the
distribution system during travel to the first distribution location (PATCO), and that the
remaining iron was mostly in particulate form. In contrast, the total iron concentration increased
to 0.99 mg/L at the second distribution location (Litchfield CC); Mn also increased from 0.05
mg/L at PATCO to 0.14 mg/l (raw water level) at Litchfield CC. Most of the metals were in
particulate form (71% for Mn, 92% for Fe), perhaps being introduced to the sample during the
sampling procedure. Residual chlorine levels were 0.32 and 0.14 mg/L at the two distribution
system sites. The results suggest that the sequestering agent addition is not effective in

33
maintaining Fe and Mn in dissolved form. AWC monitoring data for 18 June 2011 indicate
average plant chemical doses of 2.89 mg/L as phosphate for the corrosion inhibitor.
Table 9: Raw Water Quality Hamill June 2011
Hamill Raw, pH 6.96, Chlorine Dose 1.51 mg/L Cl2, Polyphos dose 2.89 mg/L as PO4 Metal
Fractions Manganese Iron
Concentration (mg/L)
% of Total Concentration (mg/L)
% of Total
Total 0.14 100% 0.35 100% Particulate 0.05 36% 0.13 37% Colloidal 0 0% 0.05 14% Dissolved 0.09 64% 0.17 49%
Hamill Plant Effluent, pH 6.89, Chlorine Residual 1.62 mg/L Metal
Fractions Manganese Iron
Concentration (mg/L)
% of Total Concentration (mg/L)
% of Total
Total 0.09 100% 0.3 100% Particulate 0.01 11% 0.1 33% Colloidal 0.01 11% 0.06 20% Dissolved 0.07 78% 0.14 47%
Hamill Distribution 1 PATCO, pH 7.29, Chlorine Residual 0.78 mg/L Metal
Fractions Manganese Iron
Concentration (mg/L)
% of Total Concentration (mg/L)
% of Total
Total 0.05 100% 0.27 100% Particulate 0.01 20% 0.22 81% Colloidal 0.01 20% 0.02 7% Dissolved 0.03 60% 0.03 11%
Hamill Distribution 2 Litchfield CC, pH 7.39, Chlorine Residual 0.65 mg/L Metal
Fractions Manganese Iron
Concentration (mg/L)
% of Total Concentration (mg/L)
% of Total
Total 0.14 100% 0.99 100% Particulate 0.1 71% 0.91 92% Colloidal 0 0% 0.03 3% Dissolved 0.04 29% 0.05 5%
4.3.1.2 Laboratory Investigation Results: June 21 Site Visit
Polyphosphates were dosed at 125% and 200% of the stoichiometric dose, and specific dosing
considerations for the polyphosphates for the June 21st site visit are displayed in Table 10. The

34
laboratory fractionation results for the June 21st site visit are displayed in Figure 12 for
manganese and Figure 13 for iron. These figures display the average fractionation data for two
duplicate samples. Data for these figures are displayed in Table 22 of the Appendix.
Table 10: Dosing of Polyphosphates June 21st Hamill Water
Polyphosphate Dosing as Phosphate
(mg/L PO4-3)
Dosing as Product
(mg/L Product)
TKPP 100% Stoich 0.98 1.72
TKPP 150% Stoich 1.47 2.15
TKPP 200% Stoich 1.96 3.44
Carus 3350 100% Stoich 0.98 1.46
Carus 3350 150% Stoich 1.47 1.83
Carus 3350 200% Stoich 1.96 2.93
Figure 12 shows that the Carus 3350 polyphosphate sequestered more manganese than the
TKPP. Sample TKPP 1.25A was an outlier as it displayed a high total manganese concentration
(0.189 mg/L), greater than the total manganese (0.14 mg/L) measured in the raw water, which
may be attributed to sample contamination since the high concentration appears in both the
manganese and iron data for that particular sample. The samples that were dosed with a
polyphosphate, for the most part (excluding TKPP 2A and 2B), showed decreased oxidation of
manganese compared to the raw water samples and the plant effluent sample. Samples dosed
with polyphosphate showed approximately 13% to 75% sequestration of the manganese (i.e., the
manganese remained in the colloidal and dissolved forms) while only 24 to 25% of raw water
metals remained in dissolved form without polyphosphate addition;51% of the plant effluent Mn
was in the colloidal and dissolved forms after 48 hours. Additionally, the increased dose of
polyphosphate did not show significant increases in fraction of dissolved metal. For TKPP, a
decrease in dissolved metal was observed when a greater dose of polyphosphate was added,
while the opposite was true for Carus.
Figure 13 displays the iron data for the laboratory results for the June 21 Hamill Well water. The
sequestering agents were not as effective for iron as they were for manganese. The results show
that iron was oxidized more easily than manganese and that the sequestering agents did not have
much effect on slowing the oxidation process. For the samples with the sequestering agents, only

35
approximately 5% to 20% of the iron was sequestered. Similar results were found for the raw
water without sequestering agent addition and for the plant effluent sample (note that most of the
particulate iron was not recovered in one of the two raw water samples without polyphosphate
addition).
Figure 12: Manganese Concentrations Hamill Wells June 2011, Lab Study
Figure 13: Iron Concentrations Hamill Wells June 2011, Lab Study
0
0.02
0.04
0.06
0.08
0.1
0.12
0.14
0.16
No PP TKPP 1.25 TKPP 2 Carus 1.25 Carus 2 Effluent
Con
cent
ratio
n (m
g/L
)
Sample Dissolved Mn (mg/L) Colloidal Mn (mg/L) Particulate Mn (mg/L)
0
0.1
0.2
0.3
0.4
0.5
0.6
No PP TKPP 1.25 TKPP 2 Carus 1.25 Carus 2 Effluent
Con
cent
ratio
n (m
g/L
)
Sample Dissolved Fe (mg/L) Colloidal Fe (mg/L) Particulate Fe (mg/L)

36
4.3.1.3 Summary of the June 21 Site Visit
From the field and laboratory sampling results for the 21 June 2011 Hamill Wells site visit, it is
evident that raw water metals are converted to particulate form in the distribution system and that
Carus 3350 is not particularly effective as a sequestering agent, especially for iron. In the
laboratory experiment, Carus 3350 performed better than TKPP; however, it was only able to
sequester at most 25% of the iron in the raw water sample. Carus 3350 was more effective than
TKPP for sequestering manganese; laboratory samples showed 50 to 75% Mn sequestration,
somewhat higher than the 43% for the plant effluent sample. Further experimentation is needed
to gain a deeper understanding of the sequestration process and chemistry.
4.3.1.4 July 20 Site Visit
A second site visit was conducted on 20 July 2011 in order to again assess the effectiveness of
Carus 3350. The second site visit was conducted similarly to the first site visit with some
variation to the field and laboratory procedures. For this site visit samples were not processed
through a Millipore YM30 ultrafilter. From the results of the first site visit, it was determined
that filtering through the ultrafilter did not provide much useful information for analysis. In
general, the majority of the colloidal and dissolved metals are in the dissolved form and
therefore, measuring the difference between colloidal and dissolved metals does not aid in the
analysis of the effectiveness of the sequestering agent at this site.
4.3.1.5 Field Sampling Results: July 20 Site Visit
Results from field sampling are displayed in

37
Table 11. These results are similar to the results from the June 20 site visit. However, the
chlorine residual overall for both distribution locations was higher for this site visit than for the
June site visit. In addition the total iron at the Litchfield CC distribution location was much
lower (0.16 mg/L) than found on the June site visit (0.91 mg/L). This may be attributed to
allowing the water to run from the sampling tap for a much longer period of time (15 min vs. 2
min) prior to sampling. Raw water manganese was 67% colloidal/dissolved and iron was 100%
colloidal/dissolved. In the plant effluent, 75% of the total manganese was in the
colloidal/dissolved form and 71% of the total iron was in the colloidal/dissolved form. The
chlorine residual in the plant effluent was 1.55 mg/L as Cl2. The results show that both iron and
manganese were removed within the distribution system during travel to the first and second
distribution locations (PATCO and Litchfield CC respectively). The remaining manganese at
PATCO and at Litchfield CC was mostly in the colloidal/dissolved form (57% and 60%
respectively). However, the remaining iron at PATCO and Litchfield CC was mostly in the
particulate form (78% and 75% respectively). Residual chlorine levels were 0.78 mg/L (PATCO)
and 0.65 mg/L (Litchfield CC) as Cl2 at the two distribution locations. The results suggest that
sequestering agent addition was not effective in maintaining Fe in the colloidal/dissolved form
when measured at the PATCO and Litchfield distribution locations. The results also suggest that
the sequestering agent was not entirely effective for maintaining Mn in the colloidal/dissolved
form as only ~%60 of the remaining Mn at the distribution locations was in the
colloidal/dissolved form. AWC monitoring data for 17 July 2011 indicate average plant chemical
doses of 1.48 mg/L as phosphate for corrosion inhibitor (Carus 3350) and 2.72 mg/L for free
chlorine.

38
Table 11: Raw Water Quality Hamill July 2011
Hamill Raw, pH 6.93, Chlorine Dose 2.72 mg/L Cl2, Polyphos dose 1.48 mg/L as PO4
Metal Fractions Manganese Iron Concentration
(mg/L) % of Total
Concentration (mg/L)
% of Total
Total 0.12 100% 0.21 100% Particulate 0.04 33% 0.1 48%
Colloidal and Dissolved
0.08 67% 0.1 48%
Hamill Plant Effluent, pH 6.85, Chlorine Residual 1.55 mg/L Metal Fractions Manganese Iron
Concentration (mg/L)
% of Total
Concentration (mg/L)
% of Total
Total 0.12 100% 0.31 100% Particulate 0.03 25% 0.09 29%
Colloidal and Dissolved
0.09 75% 0.22 71%
Hamill Distribution 1 PATCO, pH 7.29, Chlorine Residual 0.78 mg/L Metal Fractions Manganese Iron
Concentration (mg/L)
% of Total
Concentration (mg/L)
% of Total
Total 0.07 100% 0.18 100% Particulate 0.03 43% 0.14 78%
Colloidal and Dissolved
0.04 57% 0.04 22%
Hamill Distribution 2 Litchfield CC, pH 7.39, Chlorine Residual 0.65 mg/L Metal Fractions Manganese Iron
Concentration (mg/L)
% of Total
Concentration (mg/L)
% of Total
Total 0.05 100% 0.16 100% Particulate 0.02 40% 0.12 75%
Colloidal and Dissolved
0.03 60% 0.04 25%
4.3.1.6 Laboratory Investigation Results: July 20 Site Visit
Additional samples were collected from the raw water and plant effluent on July 20, 2011 and
were brought to UMass Amherst for further analysis. Since the first site visit resulted in slightly
better results for Carus 3350 when compared to TKPP, Carus 3350 was the only sequestering
agent used in the July experiment. In addition, for the July experiment, dosages were added
based on the current dose at the Hamill wells rather than on a stoichiometric dose. The
sequestering agent, Carus 3350, which is currently used at the Hamill wells treatment facility,
was added at dosages of 75%, 100%, and 200% of the current plant dose (~1.3, 1.7, and 3.5

39
times the stoichiometric dose respectively). Two samples of raw water were untreated controls
while two plant effluent samples were also evaluated for comparison.
All raw water samples were chlorinated at dosages similar to what is currently applied at the
Hamill wells (2.72 mg/L as Cl2). The results of these tests are displayed in Figure 14
(manganese) and Figure 15 (iron). Table 23 in the Appendix displays the data for Figure 14
(manganese) and Figure 15 (iron).
Figure 14 shows fractionation results for addition of the Carus 3350 polyphosphate. The results
show that the sequestration of manganese in the dissolved form was only between 10% and 35%
better when a sequestering agent was added as compared to no sequestering agent addition. The
majority of the manganese was in the particulate form for 7 of the 10 samples. The samples that
were dosed with a polyphosphate showed decreased oxidation of manganese compared to the
chlorinated raw water samples with polyphosphate. Samples dosed with polyphosphate showed
approximately 27% to 57% sequestration of the manganese (i.e., the manganese remained
colloidal/dissolved) while 17% to 27% of raw water manganese remained in the
colloidal/dissolved form without polyphosphate addition; 36% to 39% of the plant effluent Mn
was in the colloidal/dissolved form after 48 hours.
Figure 15 displays the iron data for the Hamill Wells. The results show that iron was oxidized
more easily than manganese and that the sequestering agent did not have much effect on slowing
the oxidation process. For the samples with the addition of the sequestering agent, only
approximately 21% to 32% of the iron was sequestered (or remained in the colloidal/dissolved
form). The chlorinated raw water samples without sequestering agent addition had only a slightly
lower percentage of iron in the dissolved form (17% to 18%). The effluent samples from the
plant seemed to display better performance than the samples tested at UMass Amherst with 42%
to 45% of iron sequestered. The results show that even with the addition of two times the current
dose of Carus 3350, the sequestering agent was not very effective.

40
Figure 14: Manganese Concentrations Hamill Wells July 2011, Lab Study
Figure 15: Iron Concentrations Hamill Wells July 2011, Lab Study
4.3.1.7 Summary of the July 20 Site Visit
From the field and laboratory sampling results for the July 2011 Hamill Wells site visit, it is
evident that Carus 3350 is not particularly effective as a sequestering agent, especially for iron.
In the laboratory experiment, Carus 3350 was only able to sequester at most 32% of the iron in
the raw water sample. Carus 3350 was slightly more effective at sequestering manganese;
laboratory samples showed 27% to 57% Mn sequestration, somewhat higher than the 36% to
39% for the plant effluent sample. From the two experiments conducted in June and July 2011, it
is evident that Carus 3350 is not highly effective for sequestering manganese and iron at the
0
0.02
0.04
0.06
0.08
0.1
0.12
No PP Carus 0.75 Carus Stoich Carus 2 Effluent
Con
cent
ratio
n (m
g/L
)
Sample
Colloidal and Dissolved Mn (mg/L) Particulate Mn (mg/L)
0
0.05
0.1
0.15
0.2
0.25
0.3
No PP Carus 0.75 Carus Stoich Carus 2 Effluent
Con
cent
ratio
n (m
g/L
)
Sample Colloidal and Dissolved Fe (mg/L) Particulate Fe (mg/L)

41
Hamill wells. Further testing should be conducted in order to determine if the time difference
between the addition of the sequestering agent and the chlorine affects the results. Additionally,
different sequestering agents should be tested at the Hamill wells in order to find an effective
sequestering agent.
4.3.1.8 Field Sampling Results: September 9 Site Visit
A third site visit was conducted on September 9, 2011 at the Hamill wells facility. For this site
visit the effectiveness of six sequestering agents was determined at three different dosages
(stoichiometric dose, 75% stoichiometric, and 200% stoichiometric). At the time of this
sampling event, the Hamill wells facility was dosing 1.48 mg/L as phosphate of Carus 3350 (~2
times the stoichiometric dose) and 3.16 mg/L of chlorine (as Cl2). The raw water collected from
Hamill (Table 12) wells shows that the majority (71%) of the iron was in the particulate form
while the plant effluent iron was 79% particulate.
Table 12: Raw Water Quality Hamill Sept 2011
Hamill Raw, pH 6.72, Chlorine Dose 3.16 mg/L Cl2, 1.48 mg/L as PO4 Metal
Fractions Manganese Iron
Concentration (mg/L)
% of Total Concentration (mg/L)
% of Total
Total 0.07 100% 0.31 100% Particulate 0.02 29% 0.22 71%
Colloidal and Dissolved
0.05 71% 0.09 29%
Hamill Plant Effluent, pH 6.67, Chlorine Residual 1.32 mg/L Total 0.05 100% 0.19 100%
Particulate 0.03 60% 0.15 79% Colloidal and
Dissolved 0.02 40% 0.04 21%
The results for the September 2011 sampling trip are displayed in Figure 16 and Figure 17. The
data table for these figures is displayed in Table 24 of the Appendix. From the results, it is
evident that the polyphosphates were generally more effective for sequestering manganese than
iron as can be observed by a greater percentage of manganese in the colloidal and dissolved
form. However, clear trends cannot be observed for which sequestering agents were most

42
effective. In addition, as sequestering agent dose increased, it would have been expected that the
percent of dissolved metals would also increase, however this trend was not clearly observed.
Figure 16 shows that the largest percentage of manganese sequestered was 88% (Carus 2150
0.75A). However, the results vary significantly between samples ranging from 0 to 88%
sequestered manganese. The effluent sample for the manganese results shows that 100% of the
manganese was sequestered or in the dissolved form, however, it is important to note that the
total manganese recovered for this samples was only 0.04 mg/L, and therefore particulate
manganese was possibly lost due to sampling techniques.
The sequestering agents were not effective for sequestration of iron as is displayed in Figure 17. The percent of iron dissolved in the effluent sample was only 12%, which implies that the current sequestration dose applied at the facility is ineffective. The maximum percent iron
sequestered was only 33% (AquaMag 9150 0.75B), which also implies sequestration may not be the most effective treatment alternative for the Hamill wells facility.
Table 13 displays a summary of the range of percent of manganese and iron sequestered for each
sequestering agent.
Figure 16: Manganese Concentrations Hamill September 2011
0
0.02
0.04
0.06
0.08
0.1
0.12
Con
cent
ratio
n (m
g/L
)
Sample Colloidal and Dissolved Mn (mg/L) Particulate Mn (Mg/L)

43
Figure 17: Iron Concentrations Hamill September 2011
Table 13: Summary of Hamill Well September 2011
% Colloidal/Dissolved Metal
Metal No PP TKPP Carus 1000
Carus 2150
Carus 3350
AquaMag 9150
AquaMag 9000
Manganese 0 to 57 18 to 56 9 to 43 30 to 88 0 to 31 33 to 86 0 to 50 Iron 4 to 20 0 to 19 8 to 24 0 to 12 0 to 27 0 to 33 0 to 14
4.3.1.9 Summary of September 9 Site Visit
Like the previous site visits, the results show that the sequestering agents were not effective for
sequestration of iron and manganese. Results vary significantly, but not consistently, between
type of polyphosphate and dose of polyphosphate. No clear trends can be observed, this could
potentially be attributed to relatively low initial dissolved metal concentrations.
4.3.1.10 Field Sampling Results: October 11 Site Visit
A fourth site visit was conducted on October 11, 2011. For this site visit three sequestering
agents were examined: Carus 3350, AquaMag 9000, and TKPP. The dosing for this field visit
consisted of three dosages: the stoichiometric dose, the field dose currently applied at the plant,
and 150% of the field dose. A different collection technique was used for this sampling trip
00.050.1
0.150.2
0.250.3
Con
cent
ratio
n (m
g/L
)
Sample
Colloidal and Dissolved Fe (mg/L) Particulate Fe (mg/L)

44
which is explained in the methods and materials section. In addition, dosing of polyphosphate
and chlorine was conducted on site.
The raw water results for this sampling trip (Table 14) showed that approximately 67% of the
manganese was in the dissolved form and 19% of the iron was in the dissolved form prior to
polyphosphate addition. Additionally, at both distribution, system sites the majority of the
manganese and iron was in the dissolved form (100% for PATCO, 75% Litchfield manganese,
60% Litchfield iron). Also note that the sum of all metal fractions does not equal 100% due to
inability to recover all metal and error in sampling techniques. Table 14 is displayed in graphical
form in Figure 18 and Figure 19.
Table 14: Raw Water Quality Hamill October 2011
Hamill Raw Metal Fractions Manganese Iron
Concentration (mg/L)
% of Total Concentration (mg/L)
% of Total
Total 0.09 100% 0.21 100% Particulate 0.02 22% 0.1 48% Colloidal 0.01 11% 0.1 48% Dissolved 0.06 67% 0.04 19%
Hamill Plant Effluent, Chlorine Residual 0.81 mg/L Total 0.09 100% 0.16 100%
Particulate 0 0% 0 0% Colloidal 0.04 44% 0 0% Dissolved 0.05 56% 0.12 75%
Hamill Distribution 1 PATCO Chlorine Residual 0.33 mg/L Total 0.05 100% 0.03 100%
Particulate 0.02 40% 0 0% Colloidal 0 0% 0 0% Dissolved 0.03 60% 0.03 100%
Hamill Distribution 2 Litchfield CC Chlorine Residual 0.16 mg/L Total 0.04 100% 0.05 100%
Particulate 0.03 75% 0 0% Colloidal 0 0% 0 0% Dissolved 0.01 25% 0.05 100%
Figure 18 shows a loss of total manganese at the distribution sites. Additionally, of the total
manganese measured at the distribution points a significant fraction of the manganese was in the

45
particulate form (40% at PATCO and 75% at Litchfield CC). Therefore, the sequestering agent
does not seem to be working effectively for this raw water source. Figure 19 shows a significant
loss of total iron at both distribution points (86% loss). Of the total iron that was measured at the
distribution points, all of it was in the dissolved form. Therefore, it can be assumed that iron was
deposited in the pipes of the distribution system and again the sequestering agent does not seem
to be working effectively for this raw water source.
Figure 18: Hamill Manganese Concentrations (Raw, Effluent, and Distribution Points) Oct 2011
00.010.020.030.040.050.060.070.080.090.1
Raw Water Plant Effluent PATCO ServiceStation
Litchfiled CC
Con
cent
ratio
n (m
g/l)
Sample Dissolved Mn (mg/L) Colloidal Mn (mg/L) Particulate Mn (mg/L)

46
Figure 19: Hamill Iron Concentrations (Raw, Effluent, and Distribution Points) Oct 2011
The results for this site visit are displayed in Figure 20 and Figure 21. The data for these figures
are displayed in Table 25of the Appendix. Figure 20 results show that 21 to 100% of the
manganese was sequestered. The effluent samples from the plant seemed to perform equal to, or
better than all other samples with an average of 92% sequestered manganese. The field samples
identical to these samples (Field Carus) sequestered an average of only 65%. These results show
that it is difficult to mimic field conditions in the laboratory, especially at low total metal
concentrations. Additionally the effluent sample shows a significant loss of particulate
manganese. Figure 20 also shows that Carus and TKPP produced some colloidal manganese
while AquaMag only produced dissolved manganese.
Figure 21 displays the results for iron sequestration. From these results it is evident that
polyphosphates are ineffective for iron sequestration at the Hamill well facility. A total of only 5
to 20% of the iron was sequestered (colloidal and dissolved). The effluent samples collected
from the plant showed that only 13% of iron was sequestered.
0
0.05
0.1
0.15
0.2
0.25
0.3
Raw Water Plant Effluent PATCO ServiceStation
Litchfiled CC
Con
cent
ratio
n (m
g/L
)
Sample
Dissolved Fe (mg/L) Colloidal Fe (mg/L) Particulate Fe (mg/L)

47
Figure 20: Manganese Concentrations Hamill October 2011
Figure 21: Iron Concentrations Hamill October 2011
4.3.1.11 Summary of October 11 Site Visit
Results for this site visit show that although sequestration was not effective for the well site,
more manganese was sequestered than iron. In addition, the sequestering agent TKPP seemed to
form more colloidal manganese when compared to other sequestering agents.
00.020.040.060.080.1
0.120.140.16
Con
cent
ratio
n (m
g/L
)
Sample
Dissolved Mn (mg/L) Colloidal Mn (mg/L) Particulate Mn (mg/L)
0
0.05
0.1
0.15
0.2
0.25
Con
cent
ratio
n (m
g/L
)
Sample Dissolved Fe (mg/L) Colloidal Fe (mg/L) Particulate Fe (mg/L)

48
4.3.2 Aquarion Water Company Oxford Well #4 Site
At the time of this site visit, the Oxford well #4 was not online due to historically high levels of
iron and manganese and a low water demand period. However, the facility was brought on line
specifically for this experiment. Samples for the Oxford site were collected in December 2011
and February 2012. The Oxford well #4 was not using polyphosphate treatment at the time of the
site visit; however the purpose of this site visit was to assess effectiveness of sequestering agents
for a different raw water quality source.
4.3.2.1 Oxford Well Site Visit December 2, 2011
The total manganese and iron concentrations for the December site visit to the Oxford well were
low (0.12 mg/L Mn and 0.15 mg/L Fe). The majority of the manganese and iron were in the
dissolved form (67% Mn and 89% Fe). Sample collection, polyphosphate addition and chlorine
addition were conducted onsite. Chlorine was added at two different dosages: 1.5 mg/L as Cl2 for
all samples and 2.5 mg/L as Cl2 to one sample (TKPP stoichiometric).
Table 15: Raw Water Quality Oxford December 2011, pH 6.02, 11.2 °C, Chlorine Dose 2.5 mg/L Cl2
Fractions of Metal
Manganese Iron
Concentration (mg/L)
% of Total
Concentration (mg/L)
% of Total
Total 0.115 100% 0.18 100% Particulate 0.03 26% 0.02 11% Colloidal 0.01 9% 0 0% Dissolved 0.08 70% 0.165 92%
Results from polyphosphate addition for the Oxford site visit are displayed in Figure 22 and
Figure 23. Data for these figures are displayed in Table 26 and Table 27 of the Appendix.
According to the manganese data for the Oxford site visit, 67 to 100% of manganese was
sequestered. Figure 22 also shows a general increase in percent manganese sequestered with an
increase in dosage of polyphosphate when using TKPP.
Additionally when comparing manganese and iron results for this Oxford site visit, more iron
was sequestered in the colloidal form than in the dissolved form. The addition of the higher
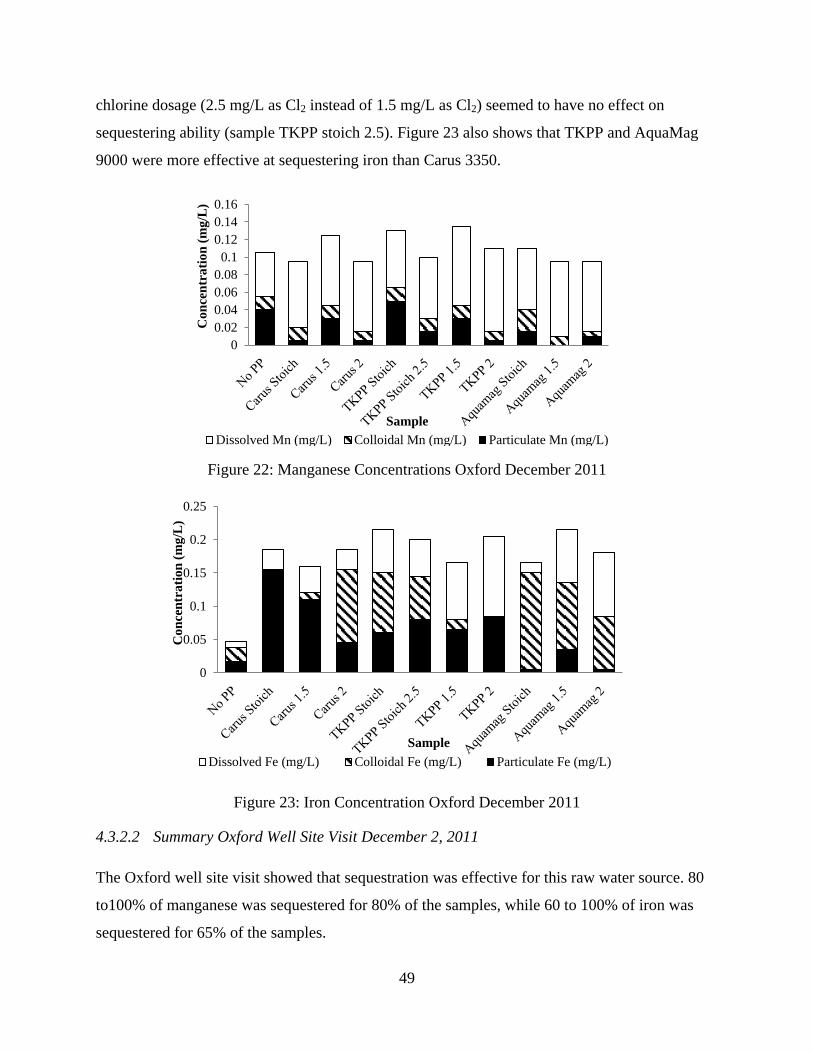
49
chlorine dosage (2.5 mg/L as Cl2 instead of 1.5 mg/L as Cl2) seemed to have no effect on
sequestering ability (sample TKPP stoich 2.5). Figure 23 also shows that TKPP and AquaMag
9000 were more effective at sequestering iron than Carus 3350.
Figure 22: Manganese Concentrations Oxford December 2011
Figure 23: Iron Concentration Oxford December 2011
4.3.2.2 Summary Oxford Well Site Visit December 2, 2011
The Oxford well site visit showed that sequestration was effective for this raw water source. 80
to100% of manganese was sequestered for 80% of the samples, while 60 to 100% of iron was
sequestered for 65% of the samples.
00.020.040.060.080.1
0.120.140.16
Con
cent
ratio
n (m
g/L
)
Sample Dissolved Mn (mg/L) Colloidal Mn (mg/L) Particulate Mn (mg/L)
0
0.05
0.1
0.15
0.2
0.25
Con
cent
ratio
n (m
g/L
)
Sample Dissolved Fe (mg/L) Colloidal Fe (mg/L) Particulate Fe (mg/L)

50
4.3.2.3 Oxford Well Site Visit February 7, 2012
A second site visit was conducted on February 7, 2012 at the Oxford Well site. For the
December site visit, pH adjustment was not conducted even though pH in the raw water was low
(6). When polyphosphate addition has been implemented as a treatment alternative at this
facility, pH adjustment was also conducted to increase the pH to 7 or 8. Therefore, the second
site visit in February included pH adjustment. Table 16 displays the raw water quality
characteristics for the Oxford site visit in February 2012. The total manganese and total iron
concentrations were low (0.055 mg/L Mn and 0.12 mg/L Fe). The metals in the raw water were
in the dissolved form. The pH was adjusted to approximately 7.7 with the addition of 23 mg/L of
NaOH and chlorine was dosed at 1.5 mg/L as Cl2. Note that the total manganese fractions do not
add to 100% of the total metal due to error in measuring technique and sample handling.
Table 16: Raw Water Quality Oxford February 2012, pH 6
Fractions of Metal
Manganese Iron Concentration
(mg/L) % of Total
Concentration (mg/L)
% of Total
Total 0.055 100% 0.12 100% Particulate 0.01 18% 0.01 8% Colloidal 0 0% 0 0% Dissolved 0.055 100% 0.11 92%
Results from the February 2012 site visit are displayed in Figure 24 and Figure 25. Data for these
figures are presented in Table 27 of the Appendix. Figure 24 displays the results of manganese
sequestration. It is evident that sequestration was unsuccessful as polyphosphates were incapable
of retaining the manganese in the dissolved form. Any manganese that was sequestered was in
the colloidal form, which had not been observed in previous experiments. Replicate samples
varied significantly in performance. The average percent of manganese sequestered in the
colloidal form was only 18%. For this set of data one sample was again dosed at 2.5 mg/L as Cl2
instead of 1.5 mg/L as Cl2 to determine the impact of increasing chlorine dosage on sequestering
effectiveness. The results show that slightly less manganese was sequestered or in the colloidal
form compared to the other samples. This can be attributed to a higher oxidant dosage which
outcompetes the sequestering ability of the polyphosphate.

51
Figure 25 displays results of iron sequestration. For this site visit, polyphosphates were more
effective at sequestering iron than manganese, which had not been observed previously. Figure
25 shows a positive correlation between increasing polyphosphate dose and increasing percent
iron sequestered (most clearly observed for Carus 3350). Additionally Carus 3350 seemed to
outperform other sequestering agents in ability to sequester iron. Similar to previous results, the
majority of sequestered iron was in the colloidal form. For this site visit, again two samples were
dosed with 2.5 mg/L as Cl2 instead of 1.5 mg/L Cl2. These samples clearly show less iron was
sequestered with a higher dosage of chlorine. Since more oxidant was added to these samples,
and iron is more susceptible to particulate formation than manganese, the oxidant may have been
strong enough to break the some of the polyphosphate iron complexes, therefore resulting in less
iron sequestered.
Figure 24: Manganese Concentrations Oxford February 2012
0
0.01
0.02
0.03
0.04
0.05
0.06
0.07
Con
cent
ratio
n (m
g/L
)
Sample
Dissovled Mn (mg/L) Colloidal Mn (mg/L) Particulate Mn (mg/L)

52
Figure 25: Iron Concentrations Oxford February 2012
4.3.2.4 Summary of Oxford Wells Site Visit (Feb 2012)
From the February 2012 site visit to the Oxford wells, it was evident that with adjustment of pH
to 7.5, the overall average percent iron sequestered was lower compared to the site visit
conducted in December where no pH adjustment (pH 6) occurred (59% vs. 68%). It would be
expected that polyphosphate performance would decrease for a pH increase from 6 to 7.5.
Sequestration was not as effective for either manganese or iron for the second site visit to
Oxford. This ineffective sequestration can be attributed to significantly lower initial dissolved
metal concentrations (0.17 mg/L Dec 2011 vs. 0.11 mg/L Feb 2012) and higher pH. The
experimental technique used to determine sequestration effectiveness is not particularly sensitive
when measuring low concentrations of metals; therefore there is large variability in the results.
Less effective sequestration ability is observed at a higher pH because metals oxidize more
readily at a higher pH and therefore, oxidation of the metal is more dominant than sequestration
of the metal.
4.3.3 Amherst Well Site Visit October 21, 2011
In order to assess the effectiveness of sequestering agents for another raw water source, the
Amherst site visit was conducted on October 21, 2011. Table 16 displays the raw water quality
data for the Amherst site visit. The average total manganese concentration was approximately
00.020.040.060.080.1
0.120.140.160.18
Con
cent
ratio
n (m
g/L
)
Sample
Dissolved Fe (mg/L) Colloidal Fe (mg/L) Particulate Fe (mg/L)
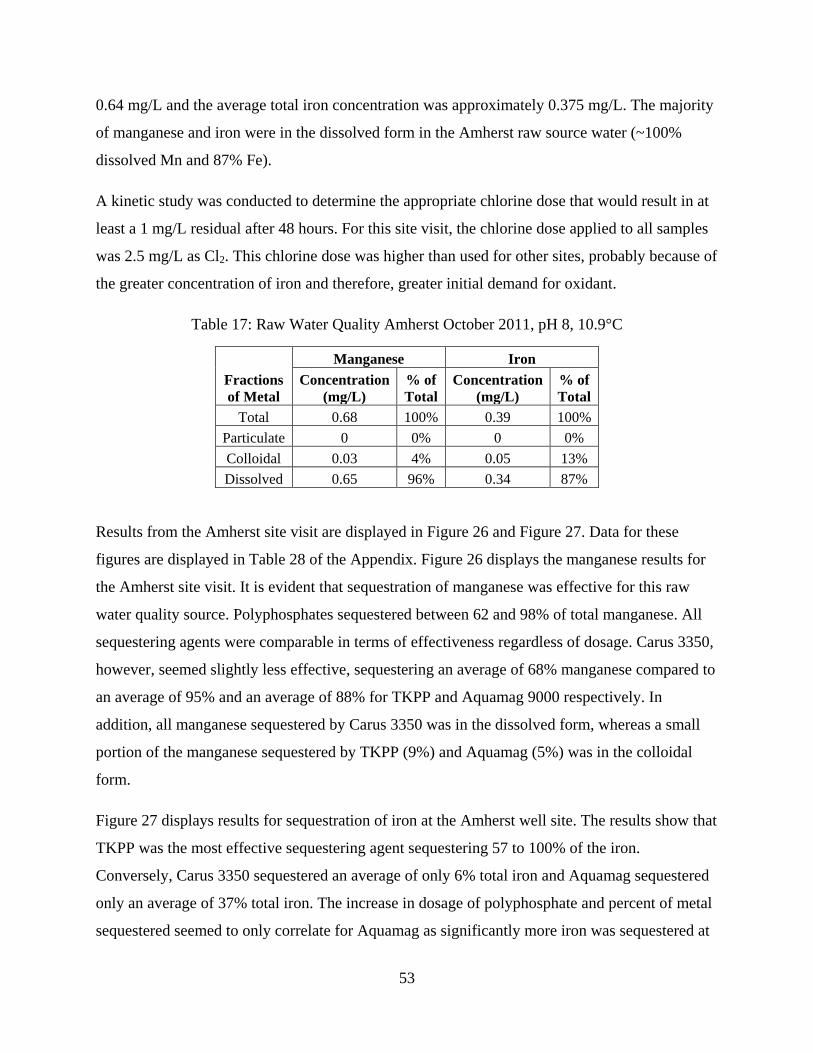
53
0.64 mg/L and the average total iron concentration was approximately 0.375 mg/L. The majority
of manganese and iron were in the dissolved form in the Amherst raw source water (~100%
dissolved Mn and 87% Fe).
A kinetic study was conducted to determine the appropriate chlorine dose that would result in at
least a 1 mg/L residual after 48 hours. For this site visit, the chlorine dose applied to all samples
was 2.5 mg/L as Cl2. This chlorine dose was higher than used for other sites, probably because of
the greater concentration of iron and therefore, greater initial demand for oxidant.
Table 17: Raw Water Quality Amherst October 2011, pH 8, 10.9°C
Fractions of Metal
Manganese Iron Concentration
(mg/L) % of Total
Concentration (mg/L)
% of Total
Total 0.68 100% 0.39 100% Particulate 0 0% 0 0% Colloidal 0.03 4% 0.05 13% Dissolved 0.65 96% 0.34 87%
Results from the Amherst site visit are displayed in Figure 26 and Figure 27. Data for these
figures are displayed in Table 28 of the Appendix. Figure 26 displays the manganese results for
the Amherst site visit. It is evident that sequestration of manganese was effective for this raw
water quality source. Polyphosphates sequestered between 62 and 98% of total manganese. All
sequestering agents were comparable in terms of effectiveness regardless of dosage. Carus 3350,
however, seemed slightly less effective, sequestering an average of 68% manganese compared to
an average of 95% and an average of 88% for TKPP and Aquamag 9000 respectively. In
addition, all manganese sequestered by Carus 3350 was in the dissolved form, whereas a small
portion of the manganese sequestered by TKPP (9%) and Aquamag (5%) was in the colloidal
form.
Figure 27 displays results for sequestration of iron at the Amherst well site. The results show that
TKPP was the most effective sequestering agent sequestering 57 to 100% of the iron.
Conversely, Carus 3350 sequestered an average of only 6% total iron and Aquamag sequestered
only an average of 37% total iron. The increase in dosage of polyphosphate and percent of metal
sequestered seemed to only correlate for Aquamag as significantly more iron was sequestered at

54
200% of the stoichiometric dose when compared to the 100% and 150% stoichiometric dose. As
observed in previous experiments, the majority of sequestered iron was in the colloidal form.
Figure 26: Manganese Concentration Amherst October 2011
Figure 27: Iron Concentration Amherst October 2011
4.3.3.1 Summary Amherst Well Site Visit Oct 2011
Sequestering agents for the Amherst site visit were more effective at sequestering manganese
than iron. Additionally, sequestered manganese was primarily in the dissolved form, while
sequestered iron was primarily in the colloidal form.
00.10.20.30.40.50.60.70.8
Con
cent
ratio
n (m
g/l)
Sample Dissolved Mn (mg/L) Colloidal Mn (mg/L) Particulate Mn (mg/L)
00.050.1
0.150.2
0.250.3
0.350.4
0.450.5
Con
cent
ratio
n (m
g/L
)
Sample
Dissolved Fe (mg/L) Colloidal Fe (mg/L) Particulate Fe (mg/L)

55
4.3.4 Hadley Site Visit November 11, 2011
A site visit was conducted in November 2011 for the Hadley groundwater. The raw water quality
for this ground water source is displayed in Table 18. This ground water source had low
concentrations of iron (~0.035 mg/L) and moderate concentrations of manganese (~0.32 mg/L).
The majority of the manganese (~91%) in the raw water source was in the dissolved form. The
total iron in the dissolved form of the raw water was only 0.02 mg/L.
Table 18: Raw Water Quality Hadley November 2011, pH 7.49, 16.8°C
Metal Fractions
Manganese Iron
Concentration (mg/L)
% of Total
Concentration (mg/L)
% of Total
Total 0.32 100% 0.035 100% Particulate 0.03 9% 0 0% Colloidal 0 0% 0.015 43% Dissolved 0.29 91% 0.02 57%
Results for laboratory testing of the Hadley source water are displayed in Figure 28 and Figure
29. Data from this figure are displayed in Table 29 of the Appendix. For this site visit,
polyphosphate dosing was increased to 300% of the stoichiometric, 450% stoichiometric dose,
and 600% stoichiometric dose in order to assess if larger dosages of polyphosphates sequestered
more metal. A chlorine dose of 1.5 mg/L was applied to the samples during the experiment.
Figure 28 shows that between 72% and 100% of the manganese was sequestered. Additionally,
the majority of the sequestered manganese was in the dissolved form. As observed from previous
site visits (Amherst and Oxford), TKPP seemed to form more colloidal manganese than the other
two sequestering agents. TKPP formed an average of 50% of colloidal manganese, while Carus
3350 formed an average of 17% and AquaMag an average of 0%.
Figure 29 displays iron concentrations after polyphosphate addition, however, no trends or
conclusions can be made from this figure. The dissolved iron concentrations in the Hadley
ground water were very low; perhaps causing the varied performance.

56
Figure 28: Manganese Concentrations for Hadley November 2011
Figure 29: Iron Concentrations for Hadley November 2011
4.3.4.1 Summary of Hadley Site Visit November 11, 2011
For the Hadley site visit conducted in November 2011, polyphosphates were successful in
sequestering manganese. Polyphosphates were dosed at excessive amounts; therefore a second
site visit was conducted to determine if the same results could be achieved with stoichiometric
dosing of polyphosphates for this ground water source. No conclusions were made for the
00.050.1
0.150.2
0.250.3
0.350.4
0.45
Con
cent
ratio
n (m
g/L
)
Sample
Dissolved Mn (mg/L) Colloidal Mn (mg/L) Particulate Mn (mg/L)
0
0.01
0.02
0.03
0.04
0.05
0.06
Con
cent
ratio
n (m
g/L
)
Sample
Dissolved Fe (mg/L) Colloidal Fe (mg/L) Particulate Fe (mg/L)

57
effectiveness of iron sequestration at this groundwater source because iron concentrations were
too low.
4.3.4.2 Hadley Site Visit December 8, 2011
A second site visit was conducted in December of 2011 at the Hadley well facility. Raw water
concentrations were similar to the previous site visit conducted in November 2011. Total iron
levels were low, with dissolved iron concentrations of approximately 0.04 mg/L, therefore
analysis for iron sequestration was not conducted for this site visit. Total manganese
concentrations were approximately 0.35 mg/L. Polyphosphates were dosed at 100%, 150%, and
200% stoichiometric dose. Chlorine was added at 1.5 mg/L as Cl2.
Table 19: Raw Water Quality Hadley December 2011, pH 7.65, 13.4°C
Metal Fractions
Manganese Iron Concentration
(mg/L) % of Total
Concentration (mg/L)
% of Total
Total 0.35 100% 0.04 100% Particulate 0 0% 0.01 25% Colloidal 0 0% 0.02 50% Dissolved 0.35 100% 0.01 25%
Figure 30 displays manganese concentrations for the Hadley site visit in December 2011.
Data for this figure are displayed in Table 30 of the Appendix. Similar to the previous site visit
conducted in November 2011, polyphosphates were effective in sequestering manganese for this
ground water source. Between 77 and 97% of the manganese was sequestered. Again the
majority of the sequestered manganese was in the dissolved form. Additionally for this site visit
chlorine was added at a higher dosage of 2.5 mg/L as Cl2 to the TKPP stoichiometric dose
sample. For this sample, it is evident from Figure 30 that at the higher dosage of chlorine
sequestration of manganese was less effective. The higher dose of oxidant caused more metal to
be oxidized rather than sequestered.

58
Figure 30: Manganese Concentrations Hadley December 2011
4.3.4.3 Summary Hadley Site Visit December 8, 2011
From the November and December 2011 site visits it is evident that there is no significant
change in the effectiveness of the polyphosphate for dosing that is greater than the stoichiometric
dose. This possibly occurs because there is an excess of polyphosphate and no more manganese
to complex. It would be expected that if there were an excess of polyphosphate, 100%
sequestration would be achieved, however 100% sequestration is not observed, which may be
attributed to manganese in the presence of organic matter. Dissolved manganese could be bound
to organic matter which may prevent uptake by polyphosphates, but allow oxidation by chlorine,
therefore only a certain amount of dissolved metal could be complexed by the polyphosphate.
These site visits also confirm that manganese is sequestered in the dissolved form.
4.4 COMPARISONS OF EFFECTIVENESS OF SEQUESTERING AGENTS FOR VARIOUS
SOURCE WATERS The results of sequestration experiments for the four different source water locations show that
sequestration effectiveness is highly dependent upon water quality characteristics. Table 20
displays the raw water quality data for the four source waters. All source waters were
comparable in temperature. The Hamill and Oxford source waters contained higher
00.050.1
0.150.2
0.250.3
0.350.4
0.450.5
Con
cent
ratio
n (m
g/L
)
Sample
Dissolved Mn (mg/L) Colloidal Mn (mg/L) Particulate Mn (mg/L)

59
concentrations of TOC. The Hamill source water also had the highest levels of alkalinity,
hardness, and sodium.
Table 20: Water Quality Parameters for Source Waters
Parameters Amherst Hadley Hamill Oxford pH 8.00 7.49 7.60 6.00 Temperature (°C) 10.9 16.8 11.1 11.2 TOC (mg/L) 0.95 1.60 2.55 2.31 Alkalinity (as mg/L CaCO3) 57 94 198 43 Hardness (as mg/L CaCO3) 85 145 237 30 Calcium (mg/L) 27 43 58 29 Magnesium (mg/L) 3.86 7.50 23.1 5.05 Iron (mg/L) 0.39 0.03 0.22 0.18 Manganese (mg/L) 0.68 0.33 0.09 0.12 Potassium (mg/L) 1.46 2.01 3.29 2.00 Sodium (mg/L) 9.70 9.97 27.9 13.6
Table 21 displays a summary of general sequestering effectiveness for each specific raw water
source. Overall, no significant trends in effectiveness were found for the different sequestering
agents or for sequestering agent dosing for an individual sequestering agent. The values
displayed in Table 21 are the average of the percent of total iron and manganese that was
sequestered, for all sequestering agents at all dosages.
Table 21: Summary of Sequestering Effectiveness
Hamill Oxford
(pH 6) Oxford (pH 7.6) Amherst Hadley
(Oct 2011) (Dec 2011) (Feb 2012 (Oct 2011) (Dec 2011) Total Fe (mg/L) 0.21 0.18 0.12 0.38 0.04 Total Mn (mg/L) 0.09 0.12 0.06 0.68 0.35
Total Fe and Mn (mg/L) 0.30 0.30 0.18 1.06 0.39 Average Total % Mn
Sequestered 63% 90% 18% 85% 83%
Average Total % Fe Sequestered 12% 66% 56% 42% N/A

60
Table 21 shows that the quality of the Oxford source water on average was most suitable for
sequestration of manganese and iron compared to the other raw water sources. Conversely, the
Hamill well raw water quality was least suitable for iron and manganese sequestration. The
Hamill raw water quality was least suitable perhaps due to its high calcium and magnesium
levels. These cations competed with the iron and manganese for the polyphosphate resulting in
less sequestration of iron and manganese. This observation has also been supported by other
studies conducted by Klueh and Robinson (1989). Klueh and Robinson observed that as calcium
concentrations increased, less iron was sequestered. Another study conducted by Robinson et al.
(1987) where silica was used as a sequestering agent determined that the presence of calcium and
other multivalent cations interferes with the ability of silica to destabilize the iron particles,
therefore more silica is needed in the presence of calcium in order to sequester iron.
Additionally, the Hamill raw water had the highest TOC level which also may have contributed
to interference with the formation of the polyphosphate and manganese or iron complex. If
source water has organic matter, the organic matter may form complexes with metals like iron
and manganese. Therefore, when polyphosphate is added, it cannot effectively sequester the
already complexed metal. However, the organic-metal complex can break when an oxidant is
added to the system. This results in particulate iron and manganese which is not complexed or
sequestered by the polyphosphate.
Table 20 also shows that manganese is sequestered more effectively by polyphosphates than is
iron. This may be attributed to the polyphosphates interaction with iron. Rather than complex
formation, the polyphosphate stabilizes colloids and prevents further aggregation.
All four source waters had various ratios of iron to manganese. The Hadley raw water source
contained almost no iron and 0.35 mg/L Mn and 83% of the manganese was sequestered. In
contrast, the Amherst source water contained significantly higher concentrations of iron and
manganese and (0.39 mg/L Fe and 0.68 mg/L Mn) and a higher average (compared to Hadley)
percent manganese sequestered (85%).
4.5 KINETIC STUDY CONDUCTED FOR OXFORD FEBRUARY 2012 Results from the site visits prompted further experimentation. For all field experiments
conducted, a 48 hour reaction time was used to allow chlorine to oxidize metal that had not been

61
complexed by polyphosphate. For the February site visit to the Oxford wells, samples were held
for various reaction times including 1 hour, 24 hours, 48 hours, and 72 hours. Since
complexation between metals and polyphosphates is a fast process, it would be expected that all
metals would be complexed by 1 hour reaction period and remain in that form until
polyphosphate depolymerization. A similar study was conducted by Klueh and Robinson (1989)
to observe depolymerization of polyphosphates. Conclusions from their study indicated that
depolymerization did not occur until after four days. Results from the study conducted at Oxford
are displayed in Figure 31 and Figure 32. From this study it is evident that conclusions about
sequestering agent effectiveness cannot be made after only a one hour reaction period. This study
also supports the 48 hour reaction period used in experimental procedures to draw conclusions
about sequestering agent effectiveness. The experiment was conducted with several individual
samples held for specific lengths of time. However; the procedure may have been more
successful if sampling occurred each day from the same container rather than from separate
containers.
Figure 31: Kinetic Study (Mn) Oxford February 2012
0
0.01
0.02
0.03
0.04
0.05
0.06
0.07
Con
cent
ratio
n (m
g/L
)
Sample
Dissolved Mn (mg/L) Colloidal Mn (mg/L) Particulate Mn (mg/L)
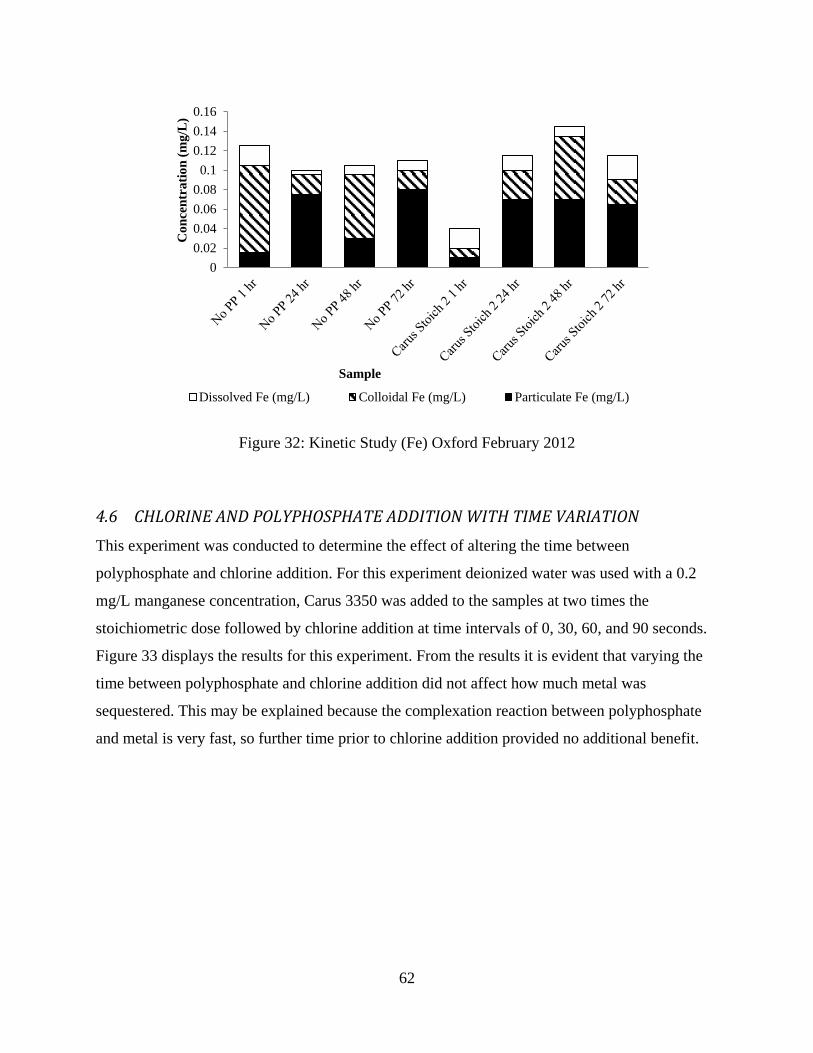
62
Figure 32: Kinetic Study (Fe) Oxford February 2012
4.6 CHLORINE AND POLYPHOSPHATE ADDITION WITH TIME VARIATION This experiment was conducted to determine the effect of altering the time between
polyphosphate and chlorine addition. For this experiment deionized water was used with a 0.2
mg/L manganese concentration, Carus 3350 was added to the samples at two times the
stoichiometric dose followed by chlorine addition at time intervals of 0, 30, 60, and 90 seconds.
Figure 33 displays the results for this experiment. From the results it is evident that varying the
time between polyphosphate and chlorine addition did not affect how much metal was
sequestered. This may be explained because the complexation reaction between polyphosphate
and metal is very fast, so further time prior to chlorine addition provided no additional benefit.
00.020.040.060.080.1
0.120.140.16
Con
cent
ratio
n (m
g/L
)
Sample
Dissolved Fe (mg/L) Colloidal Fe (mg/L) Particulate Fe (mg/L)
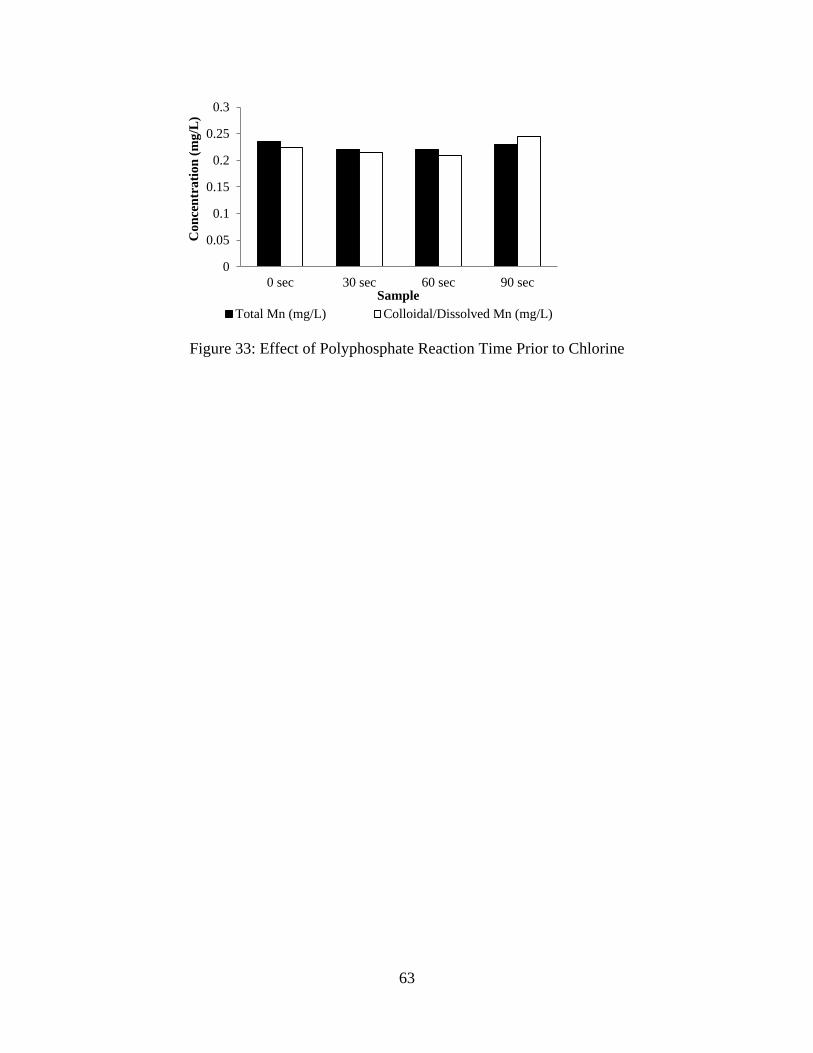
63
Figure 33: Effect of Polyphosphate Reaction Time Prior to Chlorine
0
0.05
0.1
0.15
0.2
0.25
0.3
0 sec 30 sec 60 sec 90 sec
Con
cent
ratio
n (m
g/L
)
Sample Total Mn (mg/L) Colloidal/Dissolved Mn (mg/L)

64
Chapter 5 SUMMARY, CONCLUSIONS, AND RECOMMENDATIONS
5.1 SUMMARY
The objectives of this study were to develop a method to assess sequestering agent effectiveness,
and to assess the effectiveness of various sequestering agents on several source waters. Initial
experimentation was conducted using synthetic water in the laboratory setting to determine an
appropriate method to evaluate sequestering agent effectiveness. Following this method
development, raw water was collected from four different sources including Litchfield, CT,
Oxford, CT, Amherst, MA, and Hadley, MA. Dosing of sequestering agent, chlorine, and pH
adjustment was conducted on-site under anoxic conditions to minimize metal oxidation. Three
sequestering agents were applied to samples at three dosages. Following a 48 hour reaction
period, samples were fractionated. Concentrations of metals that remained in the colloidal and
dissolved forms were considered to be sequestered. Results were analyzed and compared to
determine sequestering agent effectiveness for various source waters.
5.2 CONCLUSIONS
Several conclusions about sequestering effectiveness can be made based on the experimental
results.
• All experiments for all source waters, except Oxford at pH 7.6, show that manganese is
more effectively sequestered as compared to iron. For the Hamill source water 63% of
Mn was sequestered and 12% of Fe was sequestered. For Oxford at pH 6, 90% of Mn
was sequestered and 66% of Fe was sequestered. This can be attributed to the fact that
iron readily oxidizes in the presence of oxygen and therefore, since chlorine is a stronger
oxidant than oxygen, more iron is oxidized by the chlorine than sequestered by the
polyphosphate.
• The effectiveness of sequestering agents is highly dependent upon source water quality.
For water with high levels of hardness, less iron and manganese is sequestered due to
competition between bulk cations (Ca2+ and Mg2+) and metals (Mn2+ and Fe2+) for the
polyphosphate. Additionally at a lower pH, sequestering agent effectiveness increased
because at a higher pH metals oxidize more readily and the polyphosphates cannot
sequester the metal prior to oxidation.

65
• From experimentation it was also observed that the majority of the sequestered iron was
in the colloidal form rather than the dissolved form. This may be attributed to the fact that
iron oxidizes so readily that instead of iron being complexed in the dissolved form; the
polyphosphate adsorbs to the surface of colloidal iron and prevents further aggregation of
particles.
• Specific conclusions related to the sequestering agents indicate that TKPP, when
compared to the other sequestering agents, tended to create more colloidal iron and
manganese.
• Excessive dosing of polyphosphates dose not increase the percent of metal sequestered
because there is a limited amount of dissolved metal to be sequestered and any dose of
polyphosphate much greater than the stoichiometric dose results in excess.
• Lastly, when additional amounts of chlorine were added to the samples, fewer metals
were sequestered due to the fact that there was a greater concentration of oxidant that
competed with the polyphosphate for the metal.
5.3 RECOMMENDATIONS Results from sequestering agent experimentation show that sequestering agent effectiveness is
highly dependent on source water quality. Higher levels of hardness and alkalinity result in less
iron and manganese sequestration. In regards to the AWC Hamill well facility which uses
sequestering agents as its primary form of metal treatment, it is recommended that the facility
stop using sequestering agents. The results from studies conducted show that samples from
Hamill with and without sequestering agent addition perform the same; therefore, costs could
decrease without the addition of the sequestering agent. However, this may cause concerns
regarding pipe corrosion therefore, an orthophosphate or corrosion inhibitor may be more
beneficial than sequestering agents. Additionally,
Since polyphosphate effectiveness is dependent on raw water quality, any facility considering the
use of sequestering agents must conduct bench scale or pilot testing. Facilities with raw water
quality containing high levels of hardness and alkalinity should consider other forms of
treatment.

66
References
Agency For Toxic Substances and Disease Registry. (2008). Toxicological Profile for Manganese. US Department of Health and Public Services.
Benjamin, M. M. (2002). Water chemistry. (1 ed.). Long Grove, IL: Waveland Press Inc.
Bouchard, M. F., Sauvé, S., Barbeau, B., Legrand, M., & Brodeur, M.-ève. (2011). Research | Children ’ s Health Intellectual Impairment in School-Age Children Exposed to Manganese from Drinking Water. Environmental Health, (1), 138-143. doi:10.1289/ehp.1002321
Carlson, K., Knocke, W., & Gertig, K. (1997). Optimizing treatment through Fe and Mn Fractionation. Journal American Water Works Association, 89(4), 162-171.
Chakroff, D. D., Vela, R. R., Oleinik, M. G., & Lynch, D. L. (2000). Use of polyphosphate in corrosion control. Journal American Water Works Association, 92(2), 95-102.
Dart, F. & Foley, P., (1972) Silicate as Fe, Mn Deposition Preventative in Distribution Systems. Journal American Water Works Association, 64(4), 244-249.
DOWEX MAC-3 (2003). DOWEX MAC-3 Weak Cation Exchange Resin Engineering Information. DOW Chemical.
DOWEX MAC-3 (2003). DOWEX MAC-3 Weak Cation Exchange Resin Product Information. DOW Chemical.
Illig, G. (1960). Use of Sodium Hexametaphosphate in Manganese Stabilization. Journal American Water Works Association, 52(7), 867-874.
Klueh, K. & Robinson, B. (1989). Sequestration of Iron in Groundwater by Polyphosphates. Journal of Environmental Engineering Division ASCE, 114(5), 1192-1199.
Knocke, W.R. Van Benschoten, J., & Kearney M. (1990). Alternative Oxidants for the Removal of Soluble Iron and Manganese, AWWA Research Foundatioin. Denver, CO.
Lytle, D. A., & Snoeyink, V. L. (2002). Effect of ortho-and polyphosphates on the properties of iron particles and suspensions. Journal American Water Works Association, 94(10), 87-99.
Office of Dietary Supplements. (n.d.) Dietary Supplement Fact Sheet: Iron. National Institutes of Health. http://ods.od.nih.gov/factsheets/iron/.
Rashchi, F. & Finch, J. (2000). Polyphosphates: A Review of their Chemistry and Application with Particular Reference to Mineral Processing. Journal American Water Works Association, 13(10), 1019-1035.

67
Reckhow, D. (2006). Analysis of Total Organic Carbon. University Massachusetts, Environmental Engineering Research Laboratory.
Reckhow, D. (2006). Chlorine Residual Determination. University Massachusetts, Environmental Engineering Research Laboratory.
Robinson, R. B., Minear, R. A., & Holden, J. M. (1987). Effects of Several Ions on Iron Treatment by Sodium Silicate and Hypochlorite. Journal American Water Works Association, 79(7), 116-125.
Robinson, R. B., Reed, G. D., (1990). Sequestering Methods of Iron and Manganese Treatment. American Water Works Association Research Foundation.
Robinson, R. B., Reed, G. D., & Frazier, B. (1992). Iron and Manganese Sequestration Facilities Using Sodium Silicate. Journal American Water Works Association, 84(2), 77-82.
Robinson, R. B., & Ronk, S. K. (1987). The Treatability of Manganese by Sodium Silicate and Chlorine. Journal American Water Works Association, 79(11), 64-70.
Siemens Water Technologies Corporation. (2009). Conventional Treatment Processes for Removal of Iron and Manganese. Water Technologies.
US EPA Toxicity and Exposure Assessment for Children’s Health. (2006). Manganese TEACH Chemical Summary. http://www.epa.gov/teach/.
US EPA (2012). Corrosion, Scaling, and Metal Mobility Research: Iron.
http://www.epa.gov/nrmrl/wswrd/cr/corr_res_iron.html
World Health Organization, (2008). Guidelines for Drinking Water Quality Third Edition.
Volume 1 Recommendations.

68
Appendix Table 22: Hamill Well Data June 2011
Sample pH
Free Chlorine Residual (mg/L)
Mn
Total (mg/L)
Mn Particulate
(mg/L)
Mn Colloidal (mg/L)
Mn Dissolved
(mg/L)
% Mn Colloidal/Dissolved
Form
Fe Total
(mg/L)
Fe Particulate
(mg/L)
Fe Colloidal (mg/L)
Fe Dissolved
(mg/L)
% Fe Colloidal/Dissolved
Form
No PP A No Polyphos
6.88 0.15 0.072 0.054 0.001 0.017 25% 0.060 0.02 0.02 0.02 67% No PP B 6.97 0.14 0.090 0.068 0.010 0.012 24% 0.442 0.36 0.03 0.05 18% TKPP 1.25A TKPP
7.09 0.05 0.189 0.100 0.005 0.084 47% 0.673 0.56 0.07 0.04 16%
TKPP 1.25B 7.09 0.00 0.096 0.042 0.005 0.049 56% 0.361 0.26 0.04 0.07 30%
TKPP 2A TKPP
7.08 0.06 0.106 0.083 0.005 0.018 22% 0.408 0.31 0.02 0.08 25% TKPP 2B 7.07 0.11 0.096 0.086 -0.002 0.012 13% 0.384 0.30 0.02 0.06 21% Carus 1.25A Carus
3350
7.08 0.00 0.117 0.069 -0.003 0.051 44% 0.398 0.31 0.02 0.07 23%
Carus 1.25B 7.07 0.07 0.088 0.039 -0.003 0.052 59% 0.360 0.28 0.01 0.07 22%
Carus 2A Carus 3350
7.07 0.07 0.097 0.038 0.007 0.052 61% 0.389 0.31 0.06 0.02 21% Carus 2B 7.12 0.04 0.080 0.020 0.000 0.060 75% 0.310 0.30 -0.04 0.04 13% Effluent -- -- 0.46 0.077 0.038 0.006 0.033 51% 0.328 0.27 0.00 0.06 18%

69
Table 23: Hamill Well Data July 2011
Sample pH
Free Chlorine Residual (mg/L)
Mn
Total (mg/L)
Mn after 0.2 µm Filter
(mg/L)
Mn Particu
late (mg/L)
Mn Colloidal/Disso
lved (mg/L)
Total % Mn Colloidal/Dissolved
Fe Total
(mg/L)
Fe after
0.2 µm Filter
(mg/L)
Fe Particu
late (mg/L)
Fe Colloidal/Dissolv
ed (mg/L)
% Fe Colloidal/Dissolv
ed (mg/L)
No PP A No Polyph
os
6.8 0.96 0.083 0.022 0.061 0.022 27% 0.325 0.056 0.27 0.06 17%
No PP B 6.83 0.81 0.098 0.017 0.081 0.017 17% 0.353 0.063 0.29 0.06 18% Carus 0.75 A Carus
3350
6.84 1.41 0.095 0.026 0.069 0.026 27% 0.346 0.076 0.27 0.08 22%
Carus 0.75 B 6.84 1.15 0.095 0.054 0.041 0.054 57% 0.317 0.068 0.25 0.07 21%
Carus A Carus 3350
6.89 1.37 0.096 0.039 0.057 0.039 41% 0.244 0.055 0.19 0.06 23% Carus B 6.93 1.65 0.104 0.033 0.071 0.033 32% 0.283 0.069 0.21 0.07 24% Carus 2A Carus
3350 6.94 1.45 0.085 0.044 0.041 0.044 52% 0.307 0.097 0.21 0.10 32%
Carus 2B 6.98 1.69 0.101 0.053 0.048 0.053 52% 0.280 0.077 0.20 0.08 28% Effluent
A Carus 3350
6.95 1.45 0.076 0.030 0.046 0.030 39% 0.160 0.067 0.09 0.07 42%
Effluent B 7.04 0.04 0.069 0.025 0.044 0.025 36% 0.251 0.114 0.14 0.11 45%

70
Table 24: Hamill Well Data September 2011
Sample pH Free
Chlorine Residual (mg/L)
Mn
Total (mg/L)
Mn Particulate
(mg/L)
Mn Colloidal
and Dissolved
(mg/L)
Total % Mn
Colloidal and
Dissolved
Fe Total
(mg/L)
Fe Particulate
(mg/L)
Fe Colloidal
and Dissolved
(mg/L)
Total % Fe
Colloidal and
Dissolved
No PP A 7.04 2.11 0.08 0.08 0.00 0% 0.20 0.16 0.04 20% No PP B 6.42 2.2 0.07 0.03 0.04 57% 0.24 0.23 0.01 4%
Innophos TKPP 0.75A 6.96 1.2 0.07 0.04 0.03 43% 0.21 0.20 0.01 5% Innophos TKPP 0.75B 7.21 2.25 0.07 0.05 0.02 29% 0.25 0.23 0.02 8%
Innophos TKPP 1A 7 2.17 0.06 0.02 0.04 67% 0.27 0.25 0.02 7% Innophos TKPP 1B 6.56 2.11 0.11 0.09 0.02 18% 0.24 0.24 0.00 0% Innophos TKPP 2A 7.03 1.76 0.11 0.07 0.04 36% 0.22 0.22 0.00 0% Innophos TKPP 2B 6.92 2.16 0.09 0.04 0.05 56% 0.27 0.22 0.05 19% Carus 1000 0.75A 7.06 1.34 0.08 0.07 0.01 13% 0.26 0.22 0.04 15% Carus 1000 0.75B 6.96 2.35 0.11 0.10 0.01 9% 0.24 0.22 0.02 8%
Carus 1000 1A 7.1 2.26 0.09 0.08 0.01 11% 0.19 0.17 0.02 11% Carus 1000 1B 7.02 2.11 0.08 0.05 0.03 38% 0.25 0.19 0.06 24% Carus 1000 2A 7.11 2.01 0.08 0.05 0.03 38% 0.23 0.20 0.03 13% Carus 1000 2B 7.11 1.98 0.07 0.04 0.03 43% 0.23 0.18 0.05 22%
Carus 2150 0.75A 7.12 2.26 0.08 0.01 0.07 88% 0.26 0.24 0.02 8% Carus 2150 0.75B 7.09 1.81 0.09 0.06 0.03 33% 0.21 0.19 0.02 10%
Carus 2150 1A 7.13 2.11 0.08 0.03 0.05 63% 0.26 0.23 0.03 12% Carus 2150 1B 7.23 2.18 0.08 0.03 0.05 63% 0.28 0.27 0.01 4% Carus 2150 2A 7.13 2.05 0.08 0.05 0.03 38% 0.28 0.28 0.00 0% Carus 2150 2B 7.25 2.14 0.1 0.07 0.03 30% 0.20 0.20 0.00 0%
Carus 3350 0.75A 7.14 1.58 0.08 0.06 0.02 25% 0.30 0.22 0.08 27% Carus 3350 0.75B 7.18 1.11 0.08 0.08 0.00 0% 0.20 0.15 0.05 25%
Carus 3350 1A 7.16 2.43 0.08 0.07 0.01 13% 0.23 0.22 0.01 4%

71
Carus 3350 1B 7.19 2.35 0.07 0.06 0.01 14% 0.19 0.19 0.00 0% Carus 3350 2A 7.12 1.71 0.07 0.05 0.02 29% 0.20 0.16 0.04 20% Carus 3350 2B 7.17 1.69 0.07 0.05 0.02 31% 0.29 0.29 0.00 0%
AquaMag 9150 0.75A 7.21 2.64 0.07 0.05 0.02 29% 0.29 0.27 0.02 7% AquaMag 9150 0.75B 7.22 2.18 0.1 0.08 0.02 20% 0.27 0.18 0.09 33%
AquaMag 9150 1A 7.21 2.24 0.08 0.02 0.06 75% 0.30 0.27 0.03 10% AquaMag 9150 1B 7.24 1.92 0.11 0.07 0.04 36% 0.21 0.14 0.07 33% AquaMag 9150 2A 7.21 2.17 0.07 0.01 0.06 86% 0.20 0.16 0.04 20% AquaMag 9150 2B 7.22 2.12 0.12 0.08 0.04 33% 0.29 0.29 0.00 0%
AquaMag 9000 0.75A 7.2 2.43 0.08 0.07 0.01 13% 0.26 0.26 0.00 0% AquaMag 9000 0.75B 7.22 2.44 0.08 0.05 0.03 38% 0.24 0.24 0.00 0%
AquaMag 9000 1A 7.19 2.49 0.09 0.07 0.02 22% 0.21 0.20 0.01 5% AquaMag 9000 1B 7.24 2.46 0.07 0.07 0.00 0% 0.24 0.21 0.03 13% AquaMag 9000 2A 7.19 2.13 0.06 0.03 0.03 50% 0.22 0.19 0.03 14% AquaMag 9000 2B 7.2 2.6 0.07 0.04 0.03 43% 0.20 0.18 0.02 10%
Effluent 6.89 0.35 0.03 -0.01 0.04 133% 0.17 0.15 0.02 12%

72
Table 25: Hamill Well Data October 2011
Sample Cl2 (mg/L) pH
Total Mn
(mg/L)
0.2 µm Mn
(mg/L)
UF Mn
(mg/L)
Particulate Mn
(mg/L)
Colloidal Mn
(mg/L)
Dissolved Mn
(mg/L)
Total Fe
(mg/L)
0.2 µm Fe
(mg/L)
UF Fe (mg/L)
Particulate
Fe (mg/L)
Colloidal Fe
(mg/L)
Dissolved Fe
(mg/L)
No PP A 0.39 7.36 0.14 0.05 0.05 0.09 0 0.05 0.13 0 0.01 0.13 -0.01 0.01 No PP B 0.2 7.35 0.14 0.06 0.03 0.08 0.03 0.03 0.19 0.02 0.02 0.17 0 0.02 Stoich Carus A 0.39 7.48 0.1 0.05 0.05 0.05 0 0.05 0.2 0.01 0.03 0.19 -0.02 0.03 Stoich Carus B 0.46 7.34 0.1 0.05 0.04 0.05 0.01 0.04 0.2 0.04 0.02 0.16 0.02 0.02 Field Carus A 0.62 7.36 0.08 0.06 0.04 0.02 0.02 0.04 0.19 0.01 0.02 0.18 -0.01 0.02 Field Carus B 0.65 7.37 0.09 0.05 0.05 0.04 0 0.05 0.21 0 0.03 0.21 -0.03 0.03 1.5 Carus A 0.91 7.39 0.1 0.07 0.04 0.03 0.03 0.04 0.19 0 0.01 0.19 -0.01 0.01 1.5 Carus B 0.65 7.38 0.11 0.08 0.04 0.03 0.04 0.04 0.24 0.01 0.03 0.23 -0.02 0.03 Stoich TKPP A 0.77 7.38 0.06 0.05 0.04 0.01 0.01 0.04 0.19 0.02 0.02 0.17 0 0.02 Stoich TKPP B 0.6 7.39 0.07 0.08 0.04 -0.01 0.04 0.04 0.19 0 0.03 0.19 -0.03 0.03 Field TKPP A 0.44 7.26 0.12 0.08 0.04 0.04 0.04 0.04 0.18 0.03 0 0.15 0.03 0 Field TKPP B 0.53 7.28 0.1 0.06 0.05 0.04 0.01 0.05 0.2 0.03 0.02 0.17 0.01 0.02 1.5 TKPP A 1.1 7.38 0.11 0.05 0.04 0.06 0.01 0.04 0.21 0.04 0.02 0.17 0.02 0.02 1.5 TKPP B 1 7.27 0.07 0.06 0.04 0.01 0.02 0.04 0.19 0.01 0 0.18 0.01 0 Stoich Aquamag A 0.69 7.35 0.14 0.03 0.02 0.11 0.01 0.02 0.17 0.01 0 0.16 0.01 0 Stoich Aquamag B 0.84 7.35 0.1 0.04 0.04 0.06 0 0.04 0.19 0.03 0.03 0.16 0 0.03 Field Aquamag A 0.75 7.33 0.08 0.05 0.05 0.03 0 0.05 0.19 0.02 0.02 0.17 0 0.02 Field Aquamag B 0.65 7.41 0.06 0.04 0.04 0.02 0 0.04 0.21 0 0.02 0.21 -0.02 0.02 1.5 Aquamag A 0.55 7.42 0.1 0.04 0.04 0.06 0 0.04 0.18 0 0.01 0.18 -0.01 0.01 1.5 Aquamag B 0.65 7.38 0.13 0.03 0.04 0.1 -0.01 0.04 0.2 0.02 0.01 0.18 0.01 0.01 Effluent A 0.29 7.39 0.06 0.05 0.05 0.01 0 0.05 0.15 0.02 0.01 0.13 0.01 0.01 Effluent B 0.25 7.42 0.05 0.05 0.04 0 0.01 0.04 0.16 0.02 0.02 0.14 0 0.02

73
Table 26: Oxoford Well Data December 2011
Sample Cl2 (mg/L) pH
Total Mn
(mg/L) % Mn
Particulate % Mn
Colloidal % Mn
Dissolved Total
Fe (mg/L)
% Fe Particulate
% Fe Colloidal
% Fe Dissolved
No PP A 0.17 6.78 0.09 22% 22% 56% 0.19 95% -5% 11% No PP B 0.34 6.68 0.12 50% 8% 42% 0.21 81% 19% 0% Carus Stoich A 0.98 5.93 0.09 0% 33% 67% 0.17 82% 0% 18% Carus Stoich B 0.87 5.88 0.09 11% -11% 100% 0.19 89% -5% 16% Carus 1.5 A 0.91 5.9 0.12 0% 25% 75% 0.17 71% 6% 24% Carus 1.5 B 0.74 5.89 0.13 46% 0% 54% 0.15 67% 7% 27% Carus 2 A 1.01 5.86 0.09 0% 0% 100% 0.13 0% 92% 8% Carus 2 B 0.71 5.84 0.1 10% 20% 70% 0.24 38% 42% 21% TKPP Stoich A 0.76 6.11 0.09 11% 22% 67% 0.23 35% 26% 39% TKPP Stoich B 0.41 6.13 0.08 0% 13% 88% 0.2 20% 60% 20% TKPP Stoich 2.5 A 1.5 6.19 0.11 27% 9% 64% 0.22 36% 36% 27% TKPP Stoich 2.5 B 1.55 6.12 0.09 0% 22% 78% 0.18 44% 28% 28% TKPP 1.5 A 0.9 6.02 0.12 8% 17% 75% 0.15 33% 13% 53% TKPP 1.5 B 0.87 5.99 0.15 33% 7% 60% 0.18 44% 6% 50% TKPP 2 A 0.6 5.95 0.11 0% 18% 82% 0.18 39% -11% 72% TKPP 2 B 0.78 5.96 0.11 9% 0% 91% 0.2 50% -5% 55% Aquamag Stoich A 0.52 5..86 0.11 27% 9% 64% 0.19 0% 89% 11% Aquamag Stoich B 0.97 5.84 0.09 -22% 44% 78% 0.14 7% 86% 7% Aquamag 1.5 A 0.83 5.83 0.07 0% -14% 114% 0.14 -29% 71% 57% Aquamag 1.5 B 1.06 5.82 0.08 -38% 25% 113% 0.19 37% 21% 42% Aquamag 2 A 0.41 5.86 0.1 20% 0% 80% 0.17 -6% 53% 53% Aquamag 2 B 0.67 5.85 0.09 0% 11% 89% 0.18 6% 39% 56%

74
Table 27: Oxford Well Data February 2012
Sample Cl2
(mg/L)
pH Total Mn (mg/L)
Particulate Mn
(mg/L)
Colloidal Mn (mg/L)
Dissolved Mn
(mg/L)
% Mn
Particulat
e
% Mn Colloida
l
% Mn Dissolve
d
Total Fe
(mg/L)
Particulate
Fe (mg/L)
Colloidal Fe
(mg/L)
Dissolved Fe (mg/L)
% Fe Particulat
e
% Fe Colloidal
% Fe Dissol
ved
No PP A 0.12 7.53 0.05 0.05 0 0 100% 0% 0% 0.09 0.07 0.01 0.01 78% 11% 11%
No PP B 0.54 7.6 0.05 0.05 0 0 100% 0% 0% 0.07 0.04 0.02 0.01 57% 29% 14%
Carus Stoich A 0.84 8.2 0.04 0.04 0 0 100
% 0% 0% 0.07 0.01 0.04 0.02 14% 57% 29%
Carus Stoich B 0.52 8.14 0.04 0.04 0 0 100
% 0% 0% 0.11 0.07 0.02 0.02 64% 18% 18%
Carus 1.5 A 0.48 7.84 0.05 0.05 0 0 100
% 0% 0% 0.08 0.02 0.05 0.01 25% 63% 13%
Carus 1.5 B 0.28 8.02 0.05 0.05 0 0 100
% 0% 0% 0.11 0.01 0.09 0.01 9% 82% 9%
Carus 2 A 0.69 7.83 0.06 0.05 0.01 0 83% 17% 0% 0.08 -0.04 0.1 0.02 -50% 125% 25%
Carus 2 B 0.52 7.85 0.07 0.07 0 0 100% 0% 0% 0.16 0.03 0.13 0 19% 81% 0%
TKPP Stoich A 0.8 8.17 0.06 0.05 0.01 0 83% 17% 0% 0.13 0.11 0 0.02 85% 0% 15%
TKPP Stoich B 0.94 7.88 0.06 0.04 0.02 0 67% 33% 0% 0.12 0.07 0.04 0.01 58% 33% 8%
TKPP Stoich 2.5 A
1.82 8.08 0.05 0.04 0.01 0 80% 20% 0% 0.12 0.10 0.02 0 83% 17% 0%
TKPP Stoich 2.5 B
1.58 7.78 0.05 0.05 0 0 100% 0% 0% 0.1 0.08 0.01 0.01 80% 10% 10%

75
TKPP 1.5 A 0.84 7.9 0.05 0.04 0.01 0 80% 20% 0% 0.12 0.04 0.08 0 33% 67% 0%
TKPP 1.5 B 0.83 8.06 0.04 0.02 0.02 0 50% 50% 0% 0.11 0.04 0.05 0.02 36% 45% 18%
TKPP 2 A 0.83 7.96 0.04 0.03 0.01 0 75% 25% 0% 0.16 0.06 0.1 0 38% 63% 0%
TKPP 2 B 0.24 7.95 0.07 0.04 0.03 0 57% 43% 0% 0.15 0.08 0.07 0 53% 47% 0%
Aquamag Stoich A 0.78 7.99 0.05 0.04 0.02 0 67% 33% 0% 0.12 0.08 0.02 0.02 67% 17% 17%
Aquamag Stoich B 0.95 7.89 0.05 0.05 0.01 0 83% 17% 0% 0.09 0.05 0.01 0.03 56% 11% 33%
Aquamag 1.5 A 0.69 7.73 0.06 0.02 0.03 0 40% 60% 0% 0.13 0.07 0.06 0 54% 46% 0%
Aquamag 1.5 B 0.88 7.78 0.06 0.06 0 0 100
% 0% 0% 0.09 0.04 0.04 0.01 44% 44% 11%
Aquamag 2 A 0.55 8.1 0.05 0.05 0 0 100
% 0% 0% 0.11 0.04 0.06 0.01 36% 55% 9%
Aquamag 2 B 0.81 7.92 0.06 0.04 0.02 0 67% 33% 0% 0.12 0.03 0.09 0 25% 75% 0%
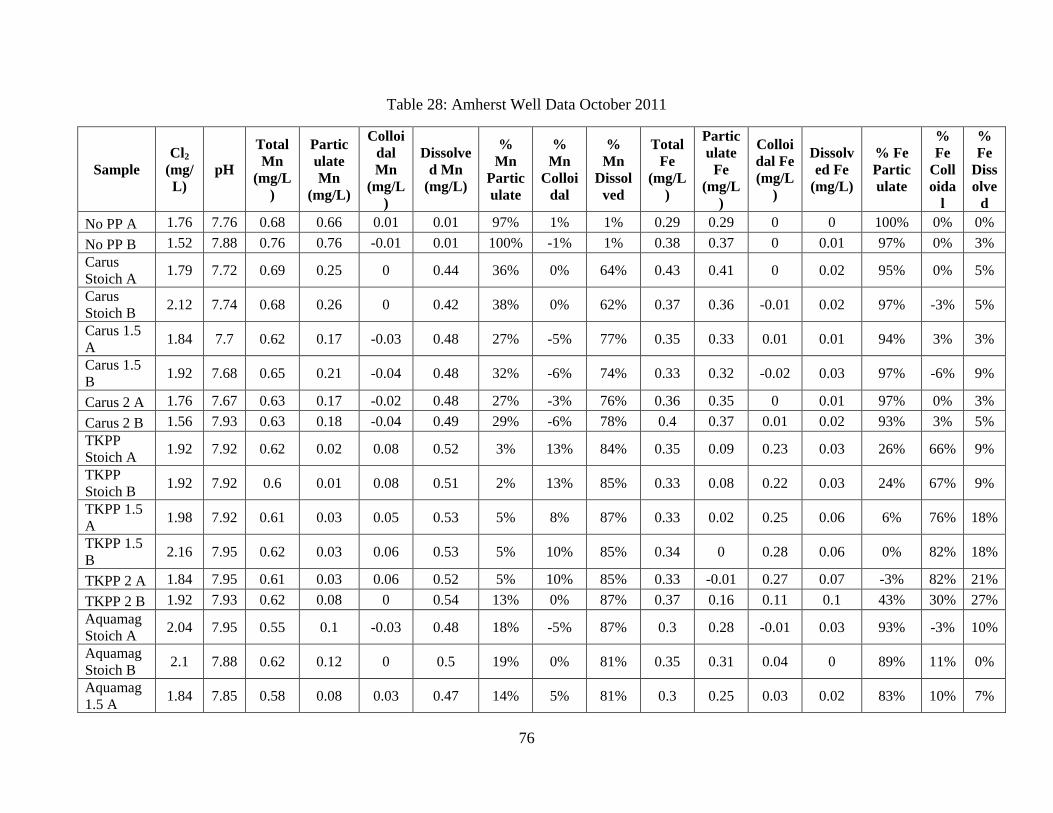
76
Table 28: Amherst Well Data October 2011
Sample Cl2
(mg/L)
pH Total Mn
(mg/L)
Particulate Mn
(mg/L)
Colloidal Mn
(mg/L)
Dissolved Mn
(mg/L)
% Mn
Particulate
% Mn
Colloidal
% Mn
Dissolved
Total Fe
(mg/L)
Particulate
Fe (mg/L
)
Colloidal Fe (mg/L
)
Dissolved Fe
(mg/L)
% Fe Particulate
% Fe
Colloida
l
% Fe
Dissolve
d No PP A 1.76 7.76 0.68 0.66 0.01 0.01 97% 1% 1% 0.29 0.29 0 0 100% 0% 0% No PP B 1.52 7.88 0.76 0.76 -0.01 0.01 100% -1% 1% 0.38 0.37 0 0.01 97% 0% 3% Carus Stoich A 1.79 7.72 0.69 0.25 0 0.44 36% 0% 64% 0.43 0.41 0 0.02 95% 0% 5% Carus Stoich B 2.12 7.74 0.68 0.26 0 0.42 38% 0% 62% 0.37 0.36 -0.01 0.02 97% -3% 5% Carus 1.5 A 1.84 7.7 0.62 0.17 -0.03 0.48 27% -5% 77% 0.35 0.33 0.01 0.01 94% 3% 3% Carus 1.5 B 1.92 7.68 0.65 0.21 -0.04 0.48 32% -6% 74% 0.33 0.32 -0.02 0.03 97% -6% 9%
Carus 2 A 1.76 7.67 0.63 0.17 -0.02 0.48 27% -3% 76% 0.36 0.35 0 0.01 97% 0% 3% Carus 2 B 1.56 7.93 0.63 0.18 -0.04 0.49 29% -6% 78% 0.4 0.37 0.01 0.02 93% 3% 5% TKPP Stoich A 1.92 7.92 0.62 0.02 0.08 0.52 3% 13% 84% 0.35 0.09 0.23 0.03 26% 66% 9% TKPP Stoich B 1.92 7.92 0.6 0.01 0.08 0.51 2% 13% 85% 0.33 0.08 0.22 0.03 24% 67% 9% TKPP 1.5 A 1.98 7.92 0.61 0.03 0.05 0.53 5% 8% 87% 0.33 0.02 0.25 0.06 6% 76% 18% TKPP 1.5 B 2.16 7.95 0.62 0.03 0.06 0.53 5% 10% 85% 0.34 0 0.28 0.06 0% 82% 18%
TKPP 2 A 1.84 7.95 0.61 0.03 0.06 0.52 5% 10% 85% 0.33 -0.01 0.27 0.07 -3% 82% 21% TKPP 2 B 1.92 7.93 0.62 0.08 0 0.54 13% 0% 87% 0.37 0.16 0.11 0.1 43% 30% 27% Aquamag Stoich A 2.04 7.95 0.55 0.1 -0.03 0.48 18% -5% 87% 0.3 0.28 -0.01 0.03 93% -3% 10% Aquamag Stoich B 2.1 7.88 0.62 0.12 0 0.5 19% 0% 81% 0.35 0.31 0.04 0 89% 11% 0% Aquamag 1.5 A 1.84 7.85 0.58 0.08 0.03 0.47 14% 5% 81% 0.3 0.25 0.03 0.02 83% 10% 7%

77
Aquamag 1.5 B 1.92 7.82 0.6 0.1 0.01 0.49 17% 2% 82% 0.37 0.3 0.04 0.03 81% 11% 8% Aquamag 2 A 2 7.77 0.6 0.01 0.09 0.5 2% 15% 83% 0.34 0.08 0.19 0.07 24% 56% 21% Aquamag 2 B 2.16 7.83 0.59 0.01 0.06 0.52 2% 10% 88% 0.34 0.02 0.27 0.05 6% 79% 15%
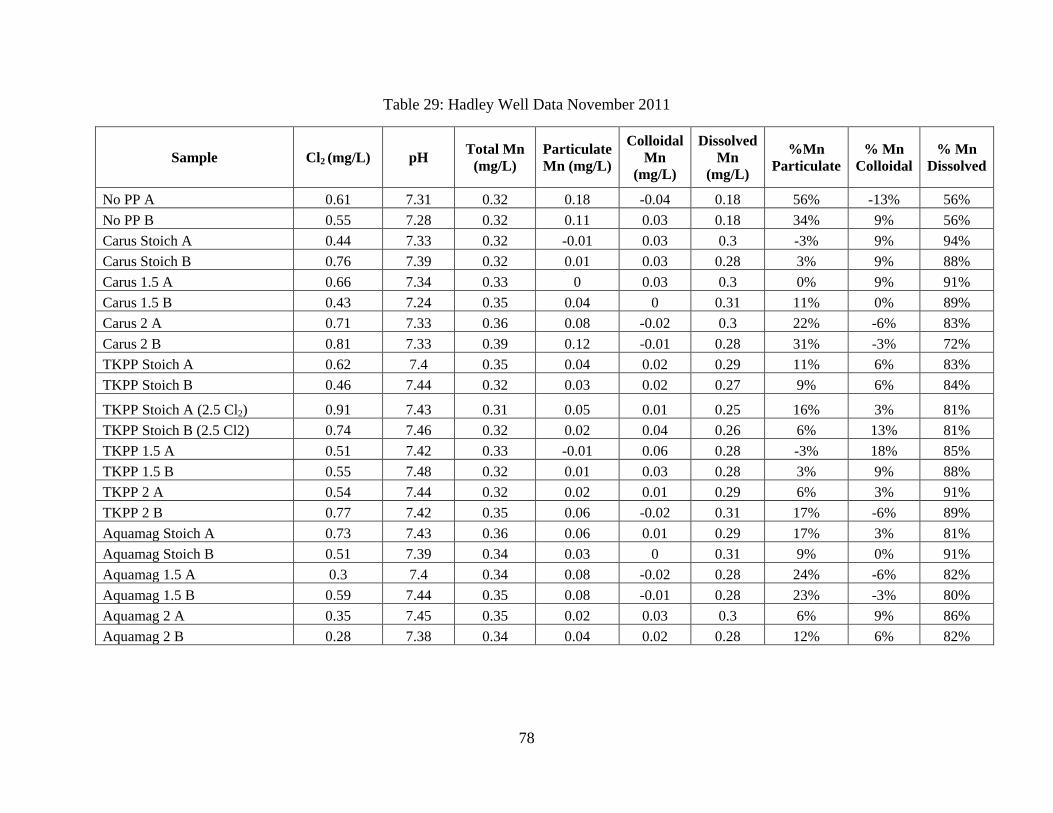
78
Table 29: Hadley Well Data November 2011
Sample Cl2 (mg/L) pH Total Mn (mg/L)
Particulate Mn (mg/L)
Colloidal Mn
(mg/L)
Dissolved Mn
(mg/L) %Mn
Particulate % Mn
Colloidal % Mn
Dissolved
No PP A 0.61 7.31 0.32 0.18 -0.04 0.18 56% -13% 56% No PP B 0.55 7.28 0.32 0.11 0.03 0.18 34% 9% 56% Carus Stoich A 0.44 7.33 0.32 -0.01 0.03 0.3 -3% 9% 94% Carus Stoich B 0.76 7.39 0.32 0.01 0.03 0.28 3% 9% 88% Carus 1.5 A 0.66 7.34 0.33 0 0.03 0.3 0% 9% 91% Carus 1.5 B 0.43 7.24 0.35 0.04 0 0.31 11% 0% 89% Carus 2 A 0.71 7.33 0.36 0.08 -0.02 0.3 22% -6% 83% Carus 2 B 0.81 7.33 0.39 0.12 -0.01 0.28 31% -3% 72% TKPP Stoich A 0.62 7.4 0.35 0.04 0.02 0.29 11% 6% 83% TKPP Stoich B 0.46 7.44 0.32 0.03 0.02 0.27 9% 6% 84% TKPP Stoich A (2.5 Cl2) 0.91 7.43 0.31 0.05 0.01 0.25 16% 3% 81% TKPP Stoich B (2.5 Cl2) 0.74 7.46 0.32 0.02 0.04 0.26 6% 13% 81% TKPP 1.5 A 0.51 7.42 0.33 -0.01 0.06 0.28 -3% 18% 85% TKPP 1.5 B 0.55 7.48 0.32 0.01 0.03 0.28 3% 9% 88% TKPP 2 A 0.54 7.44 0.32 0.02 0.01 0.29 6% 3% 91% TKPP 2 B 0.77 7.42 0.35 0.06 -0.02 0.31 17% -6% 89% Aquamag Stoich A 0.73 7.43 0.36 0.06 0.01 0.29 17% 3% 81% Aquamag Stoich B 0.51 7.39 0.34 0.03 0 0.31 9% 0% 91% Aquamag 1.5 A 0.3 7.4 0.34 0.08 -0.02 0.28 24% -6% 82% Aquamag 1.5 B 0.59 7.44 0.35 0.08 -0.01 0.28 23% -3% 80% Aquamag 2 A 0.35 7.45 0.35 0.02 0.03 0.3 6% 9% 86% Aquamag 2 B 0.28 7.38 0.34 0.04 0.02 0.28 12% 6% 82%
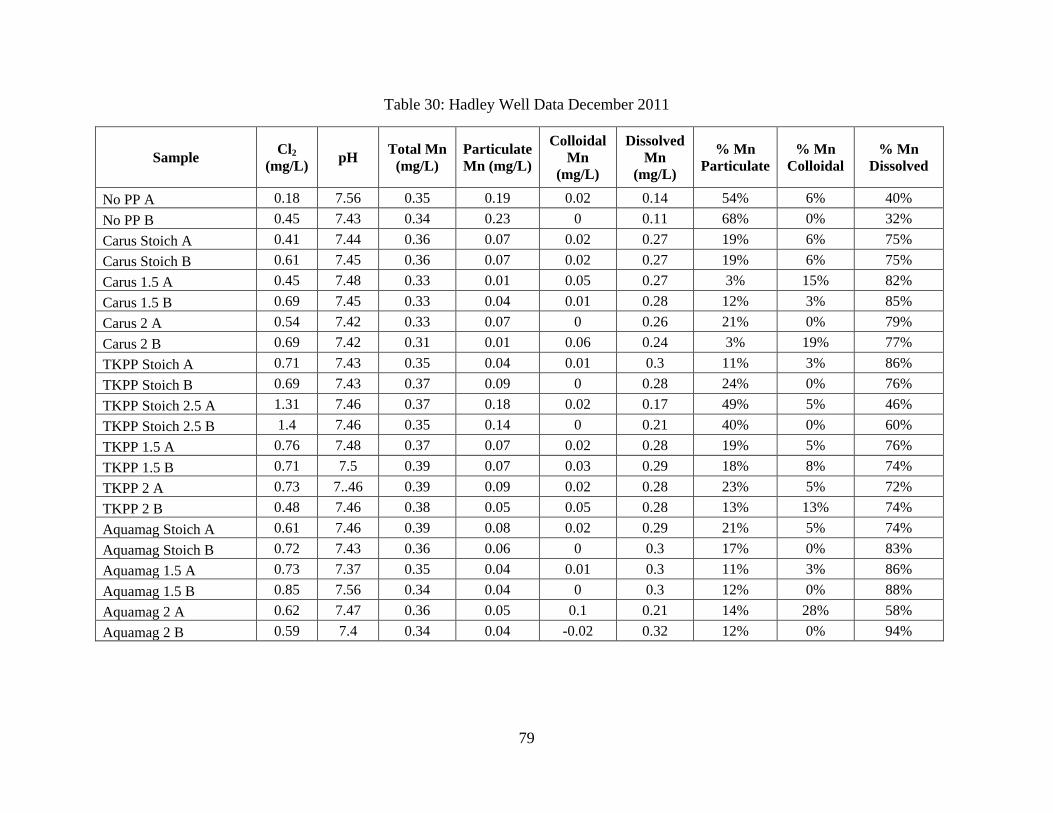
79
Table 30: Hadley Well Data December 2011
Sample Cl2 (mg/L) pH Total Mn
(mg/L) Particulate Mn (mg/L)
Colloidal Mn
(mg/L)
Dissolved Mn
(mg/L) % Mn
Particulate % Mn
Colloidal % Mn
Dissolved
No PP A 0.18 7.56 0.35 0.19 0.02 0.14 54% 6% 40% No PP B 0.45 7.43 0.34 0.23 0 0.11 68% 0% 32% Carus Stoich A 0.41 7.44 0.36 0.07 0.02 0.27 19% 6% 75% Carus Stoich B 0.61 7.45 0.36 0.07 0.02 0.27 19% 6% 75% Carus 1.5 A 0.45 7.48 0.33 0.01 0.05 0.27 3% 15% 82% Carus 1.5 B 0.69 7.45 0.33 0.04 0.01 0.28 12% 3% 85% Carus 2 A 0.54 7.42 0.33 0.07 0 0.26 21% 0% 79% Carus 2 B 0.69 7.42 0.31 0.01 0.06 0.24 3% 19% 77% TKPP Stoich A 0.71 7.43 0.35 0.04 0.01 0.3 11% 3% 86% TKPP Stoich B 0.69 7.43 0.37 0.09 0 0.28 24% 0% 76% TKPP Stoich 2.5 A 1.31 7.46 0.37 0.18 0.02 0.17 49% 5% 46% TKPP Stoich 2.5 B 1.4 7.46 0.35 0.14 0 0.21 40% 0% 60% TKPP 1.5 A 0.76 7.48 0.37 0.07 0.02 0.28 19% 5% 76% TKPP 1.5 B 0.71 7.5 0.39 0.07 0.03 0.29 18% 8% 74% TKPP 2 A 0.73 7..46 0.39 0.09 0.02 0.28 23% 5% 72% TKPP 2 B 0.48 7.46 0.38 0.05 0.05 0.28 13% 13% 74% Aquamag Stoich A 0.61 7.46 0.39 0.08 0.02 0.29 21% 5% 74% Aquamag Stoich B 0.72 7.43 0.36 0.06 0 0.3 17% 0% 83% Aquamag 1.5 A 0.73 7.37 0.35 0.04 0.01 0.3 11% 3% 86% Aquamag 1.5 B 0.85 7.56 0.34 0.04 0 0.3 12% 0% 88% Aquamag 2 A 0.62 7.47 0.36 0.05 0.1 0.21 14% 28% 58% Aquamag 2 B 0.59 7.4 0.34 0.04 -0.02 0.32 12% 0% 94%