Embed Size (px)
Citation preview

Asia Pacific Journal of Academic Research in Business Administration, Vol. 3, April 2017 ______________________________________________________________________________________________________________
54 P-ISSN: 2467-6691 | E-ISSN: 2467-5148
Turn Over Factors in a Private Development
Bank in CALABARZON: Basis of Human
Resource Retention Program
Marvin C. Arsua and Hadge A. Encio
Graduate School, Lyceum of the Philippines University, Batangas City,
Philippines
Date Received: April 1, 2017; Date Revised: June 7, 2017
Asia Pacific Journal of
Academic Research in
Business Administration Vol. 3, No. 1, 54-67
April 2017
P-ISSN: 2467-6691
E-ISSN: 2467-5148
Abstract - This research is intended to determine the factors leading to turn over of employees with
regard to organizational climate, achievement and respect, salary and assistance, growth and
enhancement, responsibilities and load and work itself. This research used a descriptive method with 321
or 90% of the total population of the employees of a private development bank in the Philippines. Results
showed that employee will leave the institution if they feel they don’t have future direction on their
current company; no recognition or rewards given to their accomplishment; and not satisfied with their
pay scale. Growth and enhancement position is more important to the current employee if they will leave
or stay in their employers. Organizational Climate is the most noted factor of the respondents that may
lead to employee turnover. Length of service and job status are considered significant factor that lead to
turnover of employee. In terms of growth and enhancement, length of service, monthly salary and job
status are significant to employee that will lead to turnover as well as the monthly salary and job status
are also considered significant.
Keywords: turn over, development bank, organizational climate
INTRODUCTION
Human capital, as a primary resource in the
organization, is vital in sustaining organizational
growth and successes. Hence, in any organization, the
human resource department (HRD) has a critical task
of ensuring that its human capital becomes productive
and motivated.
The Human Resource Department is typically
composed of three main functions. The administrative
services, developing effective HR system that helps
people with the skills, and contributing to the
company’s strategy through understanding its existing
and needed human resources. In practicing these
functions, it will give the company HR a competitive
advantage [1].
The duty of the human resource is to come up
with ideas and approaches necessary for hiring the
right employee. The knowledge, skills and
competencies necessary for the job of an employee are
most often acquired directly through experience.
However, the foundation of knowledge and skills are
naturally provided solely by an organization. Now,
imagine that a company changes its employees two or
three times a year, it then becomes increasingly more
challenging for the company to achieve its objectives.
Consequently, this leads to incompetence among
employees. This can happen due to the company’s
lack of good leadership or inability to provide a bright
career path for the company can then be realized.
This Private Development Bank, as subject of the
study, is a newly upgraded private development bank
in CALABARZON. This bank is providing credit and
other facilities where the role of the human resource
comes into play, focusing on how it will develop its
mediocre employees into better employees.
The study focuses on the factors that will lead to
resignation of employees. These six factors are
organizational climate, achievement and respect,
salary and assistances, growth and enhancement,
responsibilities and work itself which is mentioned in
the theory of Herzberg. All companies other than
banks are investing to improve its compensation and
benefits to make sure that they have control on the
turn over. However, despite the strategies of the
human resource, still there are employees who are
bound to leave the company, and most of those who
resign are not just ordinary employees in the
companies. They are, in fact, excellent employees that
are in line for a middle management position. But
unfortunately, the knowledge, ideas, and the skills

Asia Pacific Journal of Academic Research in Business Administration, Vol. 3, April 2017 ______________________________________________________________________________________________________________
55 P-ISSN: 2467-6691 | E-ISSN: 2467-5148
cannot be passed to the next managers. Employees,
unlike a faulty piece of physical equipment, cannot be
easily replaced. They are not interchangeable. The
applicant that the human resource hires takes years to
train, to develop, in order for the company to achieve
its return of investment. The tendency is that
companies find it hard to maintain the productivity,
sustain its profit and preserve the high level of
customer’s satisfaction [2]-[10] at the same time. In
majority of the companies, attrition is a reality.
Companies are experiencing high turnover rate which
damages its goals as the additional effort of job
posting and re-training new employees incurs
additional expenses. Organizations will be confronted
with shortage of skilled labourers, a shortage further
worsened by the voluntary turnover by many
employees in an effort to secure better occupations.
With this in mind, as a human resource
practitioner, the researcher is interested in
investigating what keeps employees motivated, what
drives them ‘away’ and how their potential can be
developed in a way that shapes them into more
fulfilling and productive partners of an organization.
OBJECTIVES OF THE STUDY
This study aimed to find out the turn over factors
in a private development bank in CALABARZON to
improve human resource retention program.
Specifically, this study is intended to describe the
demographic profile of the employees in terms of
gender, age, length of service, marital status,
department, position, educational attainment, monthly
salary and job status; determine the reason for leaving
and factors that are missing in the previous job; to
determine the factors leading to turn over of
employees with regard to organizational climate,
achievement and respect, salary and assistance,
growth and enhancement, responsibilities and load
and work itself; test the significance differences on the
factors leading to turn over of employees when the
respondents are grouped according to demographic
profile; and to prepare a turn over plan to improve the
human resource retention program of the bank.
METHODS
Research Design
This research paper used a descriptive approach
method to discuss the research variables to describe
the demographic profile of the respondents and the
attrition factors of employees. The questionnaire is
categorized according to their demographic profile
and factors will considered in resignation these are
Organizational Philosophy and Working Condition,
Achievement and Respect, Salary and Assistances,
Growth and Enhancement, Responsibilities and Load
and Work itself these are patterns to the theory of
motivation Herzberg Two-Factor Theory.
“A descriptive study tries to discover answers to
the questions who, what, when, where, and how. The
researcher attempts to describe or define a subject,
often by creating a profile of a group of problems,
people or events or involve relating the interaction of
two or more variables. The descriptive study is a
popular in research because of its versatility across
management disciplines” [11].
Respondents of the Study The CALABARZON Region of Region IV-A is
composed of Cavite, Laguna, Batangas, Rizal and
Quezon is one of the region of the Philippines. And it
is estimated that the population of Metro Manila and
CALABARZON combined accounts for around 30 %
of the country’s population (Talavera, Manila Times
2016). CALABARZON is the second highest
concentration of thrift banks with 12 head offices and
226 branches (bsp.gov.ph).
The respondents of the study composed of 321 or
total of 90% of the total number of employees (357)
of this Private Development Bank with a total number
of 24 branches including head office. In the province
of Batangas with 18 branches, Laguna with 2 branches
and Quezon with 4 branches with total of 357
employees. Shown on the below table 1.
Table 1. Distribution of Respondents
Area in
CALABARZON
No. of
Branches
Number of
Employees
Batangas 18 318
Quezon 4 26
Laguna 2 13
Total 24 357
This Private Development Bank. as a rural bank
before was widely recognized as multi-awarded rural
bank, with client base of over 60,000 depositors and
borrowers and resources of over P 2 billion pesos, and
ranked among the top 3% of rural banks in the
Philippines. The bank’s mission is to become region’s
partner in economic development by providing quality
financial services to Micro and Small Medium
Enterprises. In the research, managers, supervisors,
and rank and file employees are included as
respondents who are best assets of the company.
Asia Pacific Journal of Academic Research in Business Administration, Vol. 3, April 2017 ______________________________________________________________________________________________________________
56 P-ISSN: 2467-6691 | E-ISSN: 2467-5148
Data Gathering Instrument
The study used a questionnaire which was
constructed as a result of literature review, online
research and related studies analysis. The
questionnaire has three (3) parts. Part 1 describes the
demographic profile of the respondents of bank
employees and check the reasons why they left their
previous employer and factors missing in previous
job. Part 2 consists of six (6) indicators; these are
Organizational Philosophy and Working Condition,
Achievement and Respect, Salary and Assistances,
Growth and Enhancement, Responsibilities and Load
and Work itself. Each indicator has ten (10) questions
and respondents must rate their current employer
based on the following indicators. Responses for part
two (2) were quantitatively measured using four (4)
choices: option four (4) as interpreted as strongly
disagree, three (3) as agree, two (2) disagree and one
(1) as the strongly disagree. Part (A) is designed to
measure which areas of concern were most important
to the respondent’s decision to leave their current
employer and the corresponding verbal interpretation
are the following: five (5) very important, four (4)
important, three (3) moderate important, two (2)
slightly important and one (1) not important. On this
part of the question, the researcher can identify which
companies to improve and what indicates the potential
leaving of employees. For part (B), respondents were
asked to choose where they want to see themselves
five years from the day they answered the
questionnaires adopted from the research of
Hechanova and Franco [12].
Validation of the Instrument
The questionnaire was validated by an Expert who
is in the field of human resource management and a
licensed psychometrician (RPm). This was further
validated by my Thesis Adviser. (See Letter of
Request for Validation).
To further establish the validity and reliability of
the questionnaire the researcher conducted a pilot
testing as advised by a university statistician. The
testing was conducted at the bank’s head office to its
fifteen (15) employees. Who were not included in the
final run of the questionnaire.
The pilot testing yielded a Cronbach Alpha value
of 0.970 is very high which indicates that items are
acceptable and very good. This means that the results
are valid and reliable.
Data Gathering Procedure
The researcher presented the proposal for
comments and upon the final approval of the thesis
committee, the researcher started to develop the
questionnaire. A validation process was conducted
with the assistance from an experience human
resource manager and a university statistician. The
researcher had permission from the management of
this bank to conduct a pilot testing and distribution of
validated questionnaire.
The questionnaires were distributed to the bank’s
Head Office and to all branches at province of
Batangas, Laguna and Quezon in the Philippines. The
researcher sent letter via email to the department
heads and managers for their assistance in distributing
questionnaires and informing the purpose of the
questionnaires. It was delivered through the bank’s
courier and the collections of the questionnaires was
done in same manner.
Answers of the respondents’ items were tabulated
and submitted to the to the university statistician for
the statistical analysis.
Data Analysis
To describe the demographic profile of the
respondents in the research descriptive statistics were
used in format of frequency using simple summaries
in tabular format and percentage in tabular
demonstration
Weighted mean was used to determine the
indicators on attrition factors of employees, such as
Organizational Climate, Achievement and Respect,
Salary and Assistances and Work Itself.
For more interpretation of the figures statistical
method was used in form of F-Test Analysis of
variance (ANOVA) to determine whether the means
of three or more groups are different ANOVA uses F-
tests to statistically test the equality of means. The
given scale was used to interpret the result of the data
gathered: 3.50 – 4.00 = Strongly Agree (SA); 2.50 –
3.49 = Agree (A); 1.50 – 2.49 = Disagree (D); 1.00 –
1.49 = Strongly Disagree (SD)
RESULTS AND DISCUSSION
Table 2 presents the percentage distribution of the
respondents’ profile as to gender, age and length of
service. This research has a total of 321 respondents
across all branches of the bank under study in
CALABARZON.

Asia Pacific Journal of Academic Research in Business Administration, Vol. 3, April 2017 ______________________________________________________________________________________________________________
57 P-ISSN: 2467-6691 | E-ISSN: 2467-5148
Table 2. Percentage Distribution of the
Respondents Profile as to Gender, Age and Length
of Service Profile f %
Gender Male 124 38.60
Female 197 61.40
Age 20 - 25 years old 113 35.20
26 – 30 years old 90 28.00
31 – 35 years old 63 19.60
36 – 40 years old 28 8.70
41 – 45 years old 16 5.00
46 – 50 years old 6 1.90
51- 55 years old 3 0.90
56 – 60 years old 2 0.60
Length of
Service Less than 1 year 78 24.30
1-3 years 119 37.10
4-6 years 45 14.00
7-9 years 27 8.40
10-12 years 26 8.10
13- 15 years 6 1.90
more than 15 years 20 6.20
Table 2 shows that the respondents are mostly
female with frequency of 197 or 61.40 percent of the
respondents. Male respondents are at a frequency of
124 or 38.60 % of the respondents. This shows that
this bank under study is a female-dominated company.
In the banking industry female are considered to be
more customer service oriented and their personality
suits the industry. Female by nature have the sense of
nurturing people with integral traits to leadership and
customer service [16]. Also based on the study of
International Labor Organization (ILO) on 2010, “for
many years, women have joined the labor market in
growing numbers between 1980 and 2009, the global
rate of female labor force participation rose from 50.2
% to 51.8 %, while the male rate fell from 82.0 % to
77.7 %”. In the Philippines females also dominated
the labor work force. This validates the report of the
Philippine Commission for women in 2014 that there
was an increase in the Labor Force Participation Rate
(LFPR) for females at 49.8% (from 49.7% in 2012),
and 0.2% decrease for males at 78.1% (from 78.3% in
2012).
In terms of age, majority of the respondents
belonged in the bracket of age 20-25 with 113
respondents or 35.2%. This is followed by the group
26-30 years old with 90 respondents or 28%, then by
the 31- 35 years old group, with 63 respondents or
19.6%. The age bracket 56-60 years old, at 0.6%, got
the lowest number of respondents followed by 51-55
years old with 0.90% and 46-50 years old with 1.90%.
Since the majority of the respondents belongs in
the bracket of age 20-25, they are in the younger
generation popularly called the millennial generation.
To this age group, job security is not so important
[13]. The millennial generation group, being younger
respondents, are indeed more likely to leave their job
or to do job hopping because these employees might
be more willing to change jobs as they seek better
opportunities. They are extremely focused in
developing themselves. They thrive on learning new
job skills, and on always setting new challenges to
achieve.
In terms of length of service, respondents who
were in their 1-3 years in service have the highest
percentage of 37.10, followed by less than those with
1 year stay, with the percentage of 24.30 and with 4-6
years with age of 14.00%. Respondents with 13-15
years in service received the lowest number of
respondents with 1.90% followed by than more-than-
15 years, group with 6.20%, and the group of 10-12
years with 8.10%.
Most of the respondents who are serving the
company from 1- 3 years have the greater chance to
leave their current employer. This is also similar to the
study of Cappelli [14]. With this length of service,
employees have gathered more firm specific talents,
though longer tenure is more likely to separate those
with less than one year of service.
Table 3. Percentage Distribution of the
Respondents Profile as to Marital Status and
department assigned Marital Status f %
Single 161 50.20
Married 145 45.20
Widow 4 1.20
Separated 7 2.20
Single with dependents 4 1.20
Department f %
Cash 79 24.60
Marketing/Sales 97 30.20
Loans 83 25.90
Accounting 14 4.40
Support 48 15.00
Table 3 presents the percentage distribution of the
respondents’ profile as to marital status and
department assigned. In terms of marital status, it
shows that majority of the respondents are single, at
50.20%, followed by 45.20% for married employees.
1.20percentof the employees are separated. Widows

Asia Pacific Journal of Academic Research in Business Administration, Vol. 3, April 2017 ______________________________________________________________________________________________________________
58 P-ISSN: 2467-6691 | E-ISSN: 2467-5148
and single parents with dependents both received the
lowest percentage, each with 1.20percent. Majority of
the employees are single because they are still young
and the bank is their first employer. Mostly, they are
in the millennial generation and their character is to be
more focused on career growth. Ng et al (2010), cited
by Rai et al [17] in their book, said career expectation
and priorities of the millennial are for career
advancement.
In terms of department assignment of employees,
respondents from marketing/sales department received
the highest percentage with 30.20 percent, followed
by loans department with 25.90 percent, and
cash/operation department with 24.60 percent.
Support department got the lowest participation of
respondent with 15.00percent followed by accounting
with 4.40 percent. In the bank, the main resource of
the income generation is from the marketing/sales
department considering that the percentage of the
population of the bank belongs in this group. The
company must focus on bringing good retention
programs. Because marketing/sales are in demand on
banking, if the resignation is high in this position, the
production may fall because the skills differences
between the newly hired and the older workers are
different, because the new employee who replaces the
old employee is not as efficient as the latter.
Table 4. Percentage Distribution of the
Respondents’ Profile as to Position and
Educational Attainment Position f %
Rank and File (Non-Officer) 215 67.00
Supervisory 67 20.90
Managerial 39 12.10
Educational Attainment
Undergraduate 5 1.60
College/Bachelor’s Degree 290 90.30
College/Bachelor’s Degree with
PRC License 12 3.70
Master’s Degree 14 4.40
Table 4 presents the percentage distribution of the
respondents’ profile as to position and educational
attainment.
In terms of position, rank and file employees were
the top respondents with 67.00percent. This is
followed by supervisory respondents with
20.90percent. Managerial positions got the lowest
percentage of respondents with 12.10percent. Non-
management positions typically have higher turnover
rates. Mostly those employed on this level are newly
graduated and in the process of gaining experiences.
They have the tendency to leave the current employer
and look for better opportunities.
In terms of educational attainment, majority of the
respondents are college/bachelor’s degree graduates
with 90.30percent, and only 4.40 percent of
employees hold a master’s degree. Employees with
professional license got 3.70percent, and employees
who are undergraduates or with technical training got
the lowest participation at 1.60percent. As financial
institution, this bank requires all positions in
marketing/sales and cash/operation, and loans to have
at least a bachelor’s degree. This is a common
requirement to all companies that an employee should
at least be a college graduate. This will help the
employees have a bright career path with the current
employer.
Table 5. Percentage Distribution of the
Respondents’ Profile as to Monthly Salary and Job
Status Monthly Salary f %
Php 41,000 and above 5 1.60
Php 31,000 – 40,000 8 2.50
Php 21,000 – 30,000 31 9.70
Php 10,000 – 20,00 245 76.30
Php 5,000 – 10,000 32 10.00
Job Status
Regular 289 90.00
Probationary 31 9.70
Contractual 1 0.30
Table 5 presents the percentage distribution of the
respondents’ profile as to monthly salary and job
status. In terms of salary, respondent-employees with
salary bracket Php 11,000- 20,000 got the highest
participation with 76.30percent, followed by Php
5,000-10,000 with 10.00percent, and salary bracket of
Php 21,000-30,000 with 9.70percent. Salary bracket
Php 31,000-40,000 got the lowest percentage with
2.50 percent, followed by salary bracket Php 41,000
above with 1.60percent.
Lastly, in terms of job status majority of the
respondents were regular employees with
90.00percent participation on the research. This is
followed by probationary employees with 9.70percent
and contractual with 0.30percent. This data shows that
the bank is compliant to the Labor Code in
regularizing all employees under probationary status
within six months of tenure, provided that they meet
the standards of the company in terms of performance
and values. Successful operations, performance and
long viability of any business depends on the

Asia Pacific Journal of Academic Research in Business Administration, Vol. 3, April 2017 ______________________________________________________________________________________________________________
59 P-ISSN: 2467-6691 | E-ISSN: 2467-5148
continuous sequence of sound decisions made
individually or collectively by the management team
[18].
Table 6. Reasons for Leaving the Previous Job
Reasons for Leaving f %
Discrimination 8 2.50
Pressure from immediate head 21 6.50
Monotonous job 15 4.70
Lack of recognition 38 11.80
Remuneration not par with other
company 8 2.50
no scope for career growth 88 27.40
Unclear jobs roles 41 12.80
High pressure of work 24 7.50
Multiple bosses 19 5.90
No/low incentives 53 16.50
no scope for skill development 40 12.50
Others 56 17.40
Table 6 shows answers of the respondents on the
reason why they left their previous employer or job.
The respondents were requested to choose among the
indicators. The result shows that no scope for career
growth has the highest score at 27.40percent, meaning
that their previous employer did not give them a clear
career growth path. This likewise implies that once an
employee becomes employed, the main goal of the
employer is to set a clear career growth path for the
employees. The next primary reason that followed is
personal reasons with 17.40 percent. Last is no or low
incentives with 16.50 percent. In the carrot or stick
approach it is said that the offering of some reward or
incentive to employees will motivate them to perform
well in their job.
Table 7. Factors Missing in the Previous Job
Indicators f %
Job security 55 17.10
Flexible working hour’s 41 12.80
Approachable immediate head 31 9.70
Recognition 44 13.70
remuneration that at par with other
companies 18 5.60
Scope for career growth 75 23.40
Job satisfaction 69 21.50
Working environment 61 19.00
Cooperative peer 22 6.90
Motivation/incentives 65 20.20
Scope for skill development 43 13.40
Others 20 6.20
Table 7 shows answers of the respondents on the
factors that are missing in their last employer or job.
The result showed as that, again, no scope for career
growth has the highest with 27.40%. This data
confirms that employees are really seeking for a
career growth. This is followed by job satisfaction
with 21. 50%. It can be said that if employees are
satisfied with the salary, benefits and training, they
have the big chance to stay longer in the company and
lastly, motivation incentives obtained 20.20percent.
Vasantham and Sawrnalatha, [19] said that it is clear
that employees will most likely stay with companies
who are providing clear career paths for growth.
Table 8. Factors Leading to Turn Over of
Employees with Regards to Organizational
Climate
Indicators WM VI Rank
1. I am proud to work for this
company. 3.47 A 1
2. I receive thorough orientations
to this office in my job when I
started.
3.39 A 3
3. There is a spirit of cooperation
among staff in this office. 3.38 A 4
4. Conflict among staff in my
office is managed effectively. 3.22 A 8
5. I understand how my job aligns
with the company’s mission. 3.41 A 2
6. I feel safe at my worksite. 3.30 A 6
7. I have sufficient tools and
resources to do my job daily. 3.20 A 9
8. Promoting respect and fair
treatment among all staff is a high
priority in this office.
3.29 A 7
9. Communication between staff
and officers is effective. 3.31 A 5
10. I have clear sense of the future
direction in this company. 3.19 A 10
Composite Mean 3.32 A
Table 8 shows the factors leading to attrition of
employees with regards to organizational culture. The
respondents agreed that they are proud to work in this
company, with the highest weighted mean of 3.47
which ranked one in all the indicators. This bank is
famous in Batangas province and a multi awarded
company and most of the employees experienced the
upgrading of this bank under study from a rural bank
into a private development bank. The organizational
climates are considered by employees to help
determine if they will stay longer in the company.
They value relationship with their peers and
supervisors [20]. Other conditions employees observe
Asia Pacific Journal of Academic Research in Business Administration, Vol. 3, April 2017 ______________________________________________________________________________________________________________
60 P-ISSN: 2467-6691 | E-ISSN: 2467-5148
to be important are unity and trust among the group
[21].
In the organizational climate the respondents feel
they are proud working in their current employer with
a weighted mean of 3.47. Because this bank is well-
known as to be the number one rural bank in
CALABARZON and belonged to the top 3% rural
bank in the Philippines. On the other hand,
respondents agreed that they understand their job and
that it is aligned with the company mission, with
weighted mean 3.41. In this bank, employees are well
trained in their specific responsibilities and in the
mission of the company. Communicating organization
vision and strategies seem to be important to the
Filipino workers [22], [23]. Having a clear vision and
strategy implies a certain level of stability. For the
third rank, respondents agreed that they received
thorough orientations in their job when started, with
weighted mean 3.39. This indicates that the human
resource is consistent in giving orientation and
training in developing their skills.
Furthermore, the respondents said that they have
clear sense of the future direction in the company, as
the lowest with weighted mean of 3.19. There are still
few employees who are not sure in seeing themselves
working with their current employer. Second lowest is
that the employees have sufficient tools and resources
to do his job daily, with weighted mean of 3.20. Basic
sets of equipment are provided by the employer but
other tools are not. This can lead to a turnover if the
immediate manager does not do proper budgeting of
equipment. On the theory of Herzberg, working
condition is a factor in employee’s dissatisfaction.
Lastly, conflict among staff is managed effectively,
with weighted mean of 3.22. Respondents still agreed
that conflicts and misunderstandings are well
managed. This bank has a consistent values seminar to
all its employees wherein they can share their concern
to their immediate heads.
Overall, it showed a composite mean of 3.32
which mean the respondents agreed that
organizational climate is well handled.
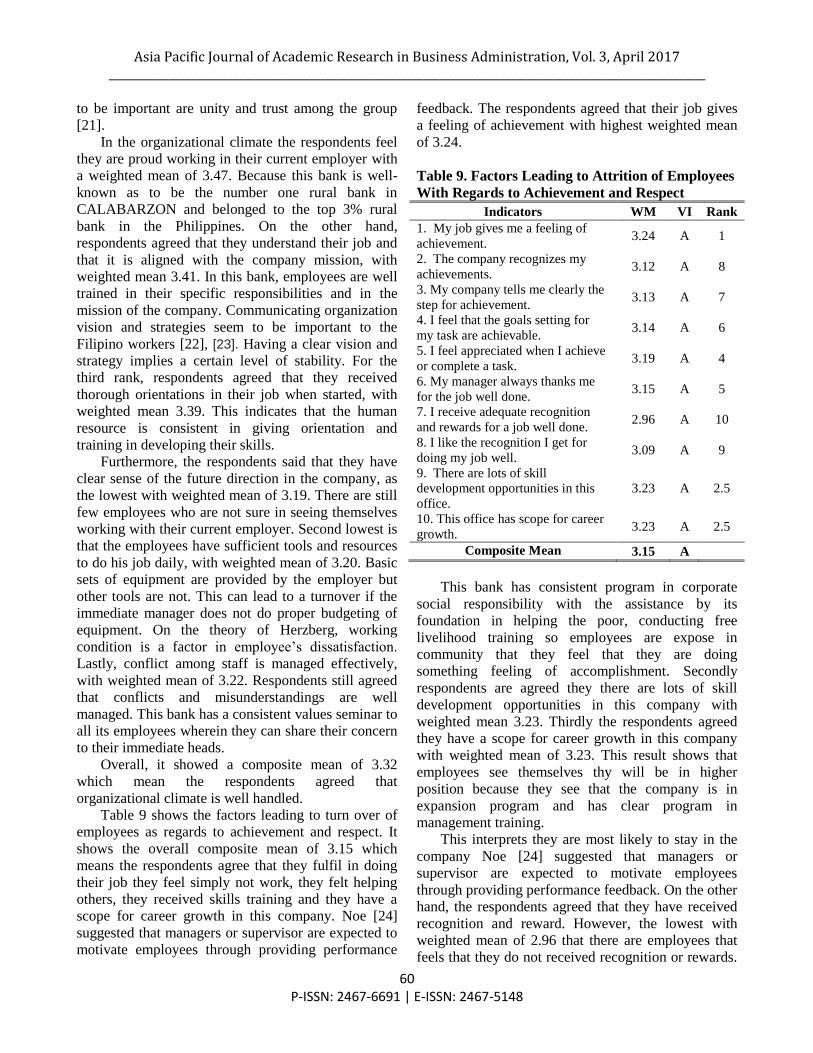
Table 9 shows the factors leading to turn over of
employees as regards to achievement and respect. It
shows the overall composite mean of 3.15 which
means the respondents agree that they fulfil in doing
their job they feel simply not work, they felt helping
others, they received skills training and they have a
scope for career growth in this company. Noe [24]
suggested that managers or supervisor are expected to
motivate employees through providing performance
feedback. The respondents agreed that their job gives
a feeling of achievement with highest weighted mean
of 3.24.
Table 9. Factors Leading to Attrition of Employees
With Regards to Achievement and Respect
Indicators WM VI Rank
1. My job gives me a feeling of
achievement. 3.24 A 1
2. The company recognizes my
achievements. 3.12 A 8
3. My company tells me clearly the
step for achievement. 3.13 A 7
4. I feel that the goals setting for
my task are achievable. 3.14 A 6
5. I feel appreciated when I achieve
or complete a task. 3.19 A 4
6. My manager always thanks me
for the job well done. 3.15 A 5
7. I receive adequate recognition
and rewards for a job well done. 2.96 A 10
8. I like the recognition I get for
doing my job well. 3.09 A 9
9. There are lots of skill
development opportunities in this
office.
3.23 A 2.5
10. This office has scope for career
growth. 3.23 A 2.5
Composite Mean 3.15 A
This bank has consistent program in corporate
social responsibility with the assistance by its
foundation in helping the poor, conducting free
livelihood training so employees are expose in
community that they feel that they are doing
something feeling of accomplishment. Secondly
respondents are agreed they there are lots of skill
development opportunities in this company with
weighted mean 3.23. Thirdly the respondents agreed
they have a scope for career growth in this company
with weighted mean of 3.23. This result shows that
employees see themselves thy will be in higher
position because they see that the company is in
expansion program and has clear program in
management training.
This interprets they are most likely to stay in the
company Noe [24] suggested that managers or
supervisor are expected to motivate employees
through providing performance feedback. On the other
hand, the respondents agreed that they have received
recognition and reward. However, the lowest with
weighted mean of 2.96 that there are employees that
feels that they do not received recognition or rewards.
Asia Pacific Journal of Academic Research in Business Administration, Vol. 3, April 2017 ______________________________________________________________________________________________________________
61 P-ISSN: 2467-6691 | E-ISSN: 2467-5148
They believe that there are supervisors who are not
recognizing the simple accomplishment of its
employees. Meanwhile with weighted mean of 3.12
respondents agreed that they are company recognize
achievements and 3.09 lowest but respondents still
agree their job were recognized. In recognizing the
achievement of the employees is a good factor to
retain its employees. The researcher pointed out the
populations of this bank are more millennial. Noe [24]
said career development will increase the employee
satisfaction and reduce turn over will result to a high
retention among high potential employees.
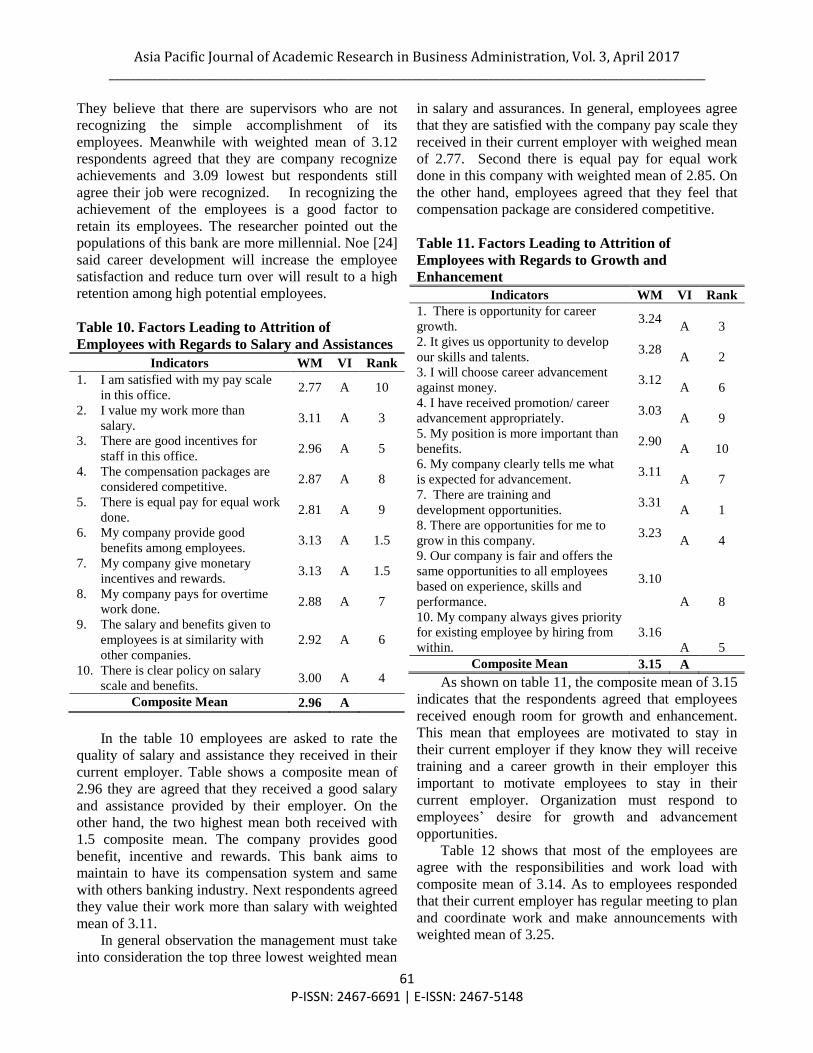
Table 10. Factors Leading to Attrition of
Employees with Regards to Salary and Assistances
Indicators WM VI Rank
1. I am satisfied with my pay scale
in this office. 2.77 A 10
2. I value my work more than
salary. 3.11 A 3
3. There are good incentives for
staff in this office. 2.96 A 5
4. The compensation packages are
considered competitive. 2.87 A 8
5. There is equal pay for equal work
done. 2.81 A 9
6. My company provide good
benefits among employees. 3.13 A 1.5
7. My company give monetary
incentives and rewards. 3.13 A 1.5
8. My company pays for overtime
work done. 2.88 A 7
9. The salary and benefits given to
employees is at similarity with
other companies.
2.92 A 6
10. There is clear policy on salary
scale and benefits. 3.00 A 4
Composite Mean 2.96 A
In the table 10 employees are asked to rate the
quality of salary and assistance they received in their
current employer. Table shows a composite mean of
2.96 they are agreed that they received a good salary
and assistance provided by their employer. On the
other hand, the two highest mean both received with
1.5 composite mean. The company provides good
benefit, incentive and rewards. This bank aims to
maintain to have its compensation system and same
with others banking industry. Next respondents agreed
they value their work more than salary with weighted
mean of 3.11.
In general observation the management must take
into consideration the top three lowest weighted mean
in salary and assurances. In general, employees agree
that they are satisfied with the company pay scale they
received in their current employer with weighed mean
of 2.77. Second there is equal pay for equal work
done in this company with weighted mean of 2.85. On
the other hand, employees agreed that they feel that
compensation package are considered competitive.
Table 11. Factors Leading to Attrition of
Employees with Regards to Growth and
Enhancement
Indicators WM VI Rank
1. There is opportunity for career
growth. 3.24
A 3
2. It gives us opportunity to develop
our skills and talents. 3.28
A 2
3. I will choose career advancement
against money. 3.12
A 6
4. I have received promotion/ career
advancement appropriately. 3.03
A 9
5. My position is more important than
benefits. 2.90
A 10
6. My company clearly tells me what
is expected for advancement. 3.11
A 7
7. There are training and
development opportunities. 3.31
A 1
8. There are opportunities for me to
grow in this company. 3.23
A 4
9. Our company is fair and offers the
same opportunities to all employees
based on experience, skills and
performance.
3.10
A 8
10. My company always gives priority
for existing employee by hiring from
within.
3.16
A 5
Composite Mean 3.15 A
As shown on table 11, the composite mean of 3.15
indicates that the respondents agreed that employees
received enough room for growth and enhancement.
This mean that employees are motivated to stay in
their current employer if they know they will receive
training and a career growth in their employer this
important to motivate employees to stay in their
current employer. Organization must respond to
employees’ desire for growth and advancement
opportunities.
Table 12 shows that most of the employees are
agree with the responsibilities and work load with
composite mean of 3.14. As to employees responded
that their current employer has regular meeting to plan
and coordinate work and make announcements with
weighted mean of 3.25.

Asia Pacific Journal of Academic Research in Business Administration, Vol. 3, April 2017 ______________________________________________________________________________________________________________
62 P-ISSN: 2467-6691 | E-ISSN: 2467-5148
Table 12. Factors Leading to Attrition of
Employees with Regards to Responsibilities and
Work Load
Indicators WM VI Rank
1. I am empowered enough to do
my job, 3.17
A 6
2. I can make my own decision in
my job. 3.05
A 9
3. I go extra miles to do my job.
(doing more than what it takes). 3.22
A 3
4. I feel I contribute to the facility’s
plan and mission. 3.19
A 4
5. I can do something that I truly
enjoy. 3.24
A 2
6. I am clear and agree with my job
description. 3.19
A 5
7. The workload in this office is
distributed equally. 2.93
A 10
8. This office has regular meetings
to plan and coordinate work and
to make announcements.
3.25
A 1
9. I believe my job is secure. 3.09 A 8
10. There is work-life balance in my
work. 3.10
A 7
Composite Mean 3.14 A
The management is conducting a strategic
planning setting of target and plans for the year. The
manager or departments head cascade the importation
through regular monthly meeting to know the status of
target and to their concern. Next is do something that I
truly enjoy with weighted mean of 3.24 respondents
agree despite of the pressure on their work load still
they can do something they can enjoy. Third go extra
miles to do my job with weighted mean of 3.22
respondents agree they are willing to do their job
beyond on their job. The employees who are doing
more than their job are being awarded for an “extra
mile awardee” receiving a certificate and cash reward.
Employees need to be treated as valued members of
the organization in which they work, and not as
disposable assets [15].
In general respondent agree they satisfy with
regards to responsibility and work load. In the
statements of the respondents to the top three lowest
the workload in this office is distributed equally with
weighted mean of 2.93. Based in the mean that there
is a need to review of the job description of the
employees and determine if there is a need for
additional employees. Second employees agree can
make my own decision in my job with weighted mean
3.05. And believe my job is secure with weighted
mean of 3.09.
Table 13. Factors Leading to Attrition of
Employees with Regards to Work Itself
Indicators WM VI Rank
1. My job challenges me frequently. 3.28 A 1
2. I have clear understanding on how
my job performance is measured. 3.17
A 6
3. I am free to choose my own method
of working. 3.05
A 10
4. I feel that the amount of work I am
expected to do is reasonable. 3.06
A 9
5. There are varieties of tasks in my
work. 3.21
A 4
6. My work allows us to use our
education/specialization in the work. 3.21
A 3
7. I know exactly what is expected of
me as an employee. 3.25
A 2
8. My supervisor understands me and
appreciates my work. 3.18
A 5
9. There are sufficient roles for staff
to avoid job monotony. 3.11
A 7
10. I receives constructive feedback
about the quality of my work. 3.08
A 8
Composite Mean 3.16 A
Table 13 shows respondents agree that with
regards to work itself over all they are satisfied with
composite mean of 3.16. In the theory of Herzberg,
work itself is factor to motivate the employee to work.
The respondents agree that they are challenge by their
job frequently with weighted mean of 3.28. Majority
of the respondents are belonged to the sales/marketing
and operation. They will feel the pressure from the
management to do their job excellently. Secondly the
respondents know exactly what is expected for them e
as an employee with weighted mean of 3.25. And
work allows us to use our education/specialization in
the work with weighted mean of 3.21 tied with there
are varieties of tasks in my work with weighted mean
of 3.21. Employees are looking for the wherein they
can utilize their knowledge and skills. The human
resource department has a set of qualification to the
applicants so if there is a vacant position that will fit
them they can be move and practice their profession.
For companies this is the major challenge in attaining
balance in work life. Organizations fail to help their
people to achieve work life balance it will increase to
attract and retain most capable motivated employee
[25].
Employees who are engage to their work fully
will increase their commitment to their job and
company [24].

Asia Pacific Journal of Academic Research in Business Administration, Vol. 3, April 2017 ______________________________________________________________________________________________________________
63 P-ISSN: 2467-6691 | E-ISSN: 2467-5148
Table 14. Summary Table on the Factors Leading
to Attrition of Employees
Indicators WM VI Rank
Organizational Climate 3.32 A 1
Achievement and Respect 3.15 A 3.5
Salary and Assistances 2.96 A 6
Growth and Enhancement 3.15 A 3.5
Responsibilities and Load 3.14 A 5
Work Itself 3.16 A 2
Composite Mean 3.15 A
Table 14 shows the summary perception of the
respondents on the factors leading to attrition
indicators. In general, the respondents agree that all
indicators are important with composite mean of 3.15.
All indicators are good motivator for the respondents
to stay in their current employer if they receive
equally to all indicator. The combination of the six
indicators are important for the employer to focus on
how they will maintain the retention of their
employees. Organization climate ranked 1 with
weighted mean of 3.32 thus employees will stay if
they feel there is a good working environment. Work
itself ranked 2 with weighted mean of 3.16 wherein
employees had a chance to use their specialization.
Followed by achievement and respect, growth
enhancement with 3.5 both rank. Next is
responsibilities and load with weighted mean of 3.14
with rank of 5. Last is salary and assistances with rank
of 6 with weighted mean.
The suggestion of this research is clear. Salary is
not factor listed in retaining employees but of course
salary must be at least in the minimum requirement of
the government, Programs to develop employees, such
as leadership management training programs, can be
considered a motivator and good working relation
clear career growth are the good motivator to retain
the employees.
Table 15. Differences on Factors Leading to turn
over of Employees With Regards to Organizational
Climatewhen grouped according to profile variable
Profile Variables F-value p-value
Gender .073 0.787
Age 5.814 0.562
Length of Service 17.385* 0.008
Marital Status 3.940 0.414
Department 6.241 0.182
Position 2.199 0.532
Educational Attainment 4.564 0.207
Monthly Salary 9.332 0.053
Job Status 9.174* 0.027
Legend:* Significant at p-value < 0.05
As seen from the result of Table 15 shows that
only length of service and marital status showed
significant difference on the factors leading to turn
over with regards to organizational climate since the
obtained p-value of 0.008 and 0.027 which less than
0.05 alpha level.
This means that there is differences exists and
implies that the respondent’s commitment to the
company as to organizational climate is affected by
their length of service in the company as well as their
job status. Employees working in the company for
more than 2 years and feel the dissatisfied to the
climate inside the company most likely to leave and
employees job status can also be a reason in leaving
the company as an employee whether old or new they
still want to have a good working environment most
important aspect of workplace according [15]. In
terms of length of service, work productivity of those
with lesser tenure in the organization are usually more
competitive [27]-[28].
Table 16. Differences on the Factors Leading to
turn over of Employees with Regards to
Achievement and Respect when grouped according
to profile variables
Profile Variables F-value p-value
Gender 1.521 0.467
Age 18.257 0.195
Length of Service 24.528* 0.017
Marital Status 22.228* 0.005
Department 11.531 0.173
Position 2.320 0.888
Educational Attainment 3.344 0.765
Monthly Salary 17.151* 0.029
Job Status 11.029 0.087
* Significant at p-value < 0.05; **Highly Significant at p-
value < 0.01
As seen from Table 16, there were significant
difference observed on the length of service (0.017),
marital status (0.005) and monthly salary (0.029) and
achievement and respect. This only implies that the
factors leading to turn over by the respondents with
regards to achievement and respect depends on how
long they are in the company, their marital status and
their monthly income. Monthly salary, length of
service and marital status can lead to leaving of
employees. If an employee are serving the company in
many years and employee is not paid enough there is
potential in leaving the employer Employers must
support benefits that extend to their family. Benefits

Asia Pacific Journal of Academic Research in Business Administration, Vol. 3, April 2017 ______________________________________________________________________________________________________________
64 P-ISSN: 2467-6691 | E-ISSN: 2467-5148
that will cover the employees’ immediate family will
most likely prefer them to stay in the company [15].
Table 17. Differences on the Factors Leading to
turn over of Employees with Regards to Salary and
Assistances when grouped according to profile
variable
Profile Variables F-value p-value
Gender 1.290 0.731
Age 25.518 0.225
Length of Service 45.090** 0.000
Marital Status 5.977 0.917
Department 23.505* 0.024
Position 15.793 0.071
Educational Attainment 5.564 0.783
Monthly Salary 26.830* 0.008
Job Status 33.885** 0.000
* Significant at p-value < 0.05; **Highly Significant at p-
value < 0.01
It can be gleaned from the result of Table 17, that
respondents’ reasons lead them to attrition with
regards to salary and assistances were affected by the
length of service, department where they belong,
monthly salary and job status since the computed p-
values were less than 0.05 alpha level. This indicates
that the factors that leads them to leave depends on the
above mentioned variables. Length of service and Job
Status are highly significant. This is also similar to the
study of Cappelli [14] employee had gathered more
firm specific talents through longer tenure are more
likely to separate than those with less than one year of
service.
Table 18. Differences on the Factors Leading to
turn over of Employees with Regards to Growth
and Enhancement when grouped according to
profile variable
Profile Variables F-value p-value
Gender 1.156 0.561
Age 14.398 0.421
Length of Service 27.941* 0.006
Marital Status 11.285 0.186
Department 12.327 0.137
Position 4.724 0.580
Educational Attainment 4.905 0.556
Monthly Salary 19.924* 0.011
Job Status 23.287* 0.001
* Significant at p-value < 0.05;
Table 18 reveals that there was significant
relationship between the respondents’ length of
service (0.006), monthly salary (0.011) and job status
(0.001) because the obtained p-values were less than
0.05 alpha level, thus the hypothesis under these
variables is rejected. This means that respondent’s
reason that brought them to leave in the previous job
were affected by their length of service, income and
tenure. Growth and career enhancement are factor
why employees stay of leave in the company. Base on
the result respondents working in the company are
looking for a career growth especially respondents
within 1-3 years they want to see themselves in a
higher position and experience training for their
improvement.
Table 19. Differences on the Factors Leading to
turn over of Employees with Regards to
Responsibilities and Load when grouped according
to profile variable
Profile Variables F-value p-value
Gender 1.367 0.505
Age 12.164 0.593
Length of Service 21.780* 0.040
Marital Status 31.752** 0.000
Department 15.541* 0.049
Position 57.439** 0.000
Educational Attainment 2.988 0.810
Monthly Salary 20.165* 0.010
Job Status 20.373* 0.002
* Significant at p-value < 0.05; **Highly Significant at p-
value < 0.01
As seen from Table 19, that there was difference
in relationship to the respondents’ length of service,
marital status, department, position, monthly salary
and job status since all computed p-values were less
than 0.05. Therefore, this indicates that the
respondents’ assessment on the factors leading to turn
over with regards to responsibilities and load depends
on the above mentioned variables. In the result there is
highly significance difference in marital status and
position this means that if an employee has more
responsibilities it may affect the decision making of
the current employee if will stay longer in their
current employer. Sinclair et al. [26] gave an example
said “supervisor assign too much unreasonable
workload may harm their workers” this may lead in
turnover of employees. While monthly salary and job
status is significant in responsibilities and load.
Table 20 presents the differences on the factors
leading to turn over of employees with regard to work
itself when grouped according to profile variables.
The factors that lead the respondents to leave their

Asia Pacific Journal of Academic Research in Business Administration, Vol. 3, April 2017 ______________________________________________________________________________________________________________
65 P-ISSN: 2467-6691 | E-ISSN: 2467-5148
previous job as to work itself were marital status and
position. These are highly significant factors.
Table 20. Differences on the Factors Leading to
turn over of Employees with Regards to Work
Itself when grouped according to profile variables
Profile Variables F-value p-value
Gender .111 0.946
Age 10.046 0.759
Length of Service 16.934 0.152
Marital Status 42.715** 0.000
Department 13.909 0.084
Position 81.554** 0.000
Educational Attainment 1.226 0.976
Monthly Salary 18.376* 0.019
Job Status 16.204* 0.013
* Significant at p-value < 0.05; **Highly Significant at p-
value < 0.01
For monthly salary and job status are significant
since the obtained p-value were less than 0.05 alpha
level all are significant. If an employee experience
challenges marital status and position in the work
place and a lot of challenges in the work they do;
perceived overload, they tend to leave the current
employer. And for salary and job status is significant
means if employee sees that their work load is not
compensated to their salary, a possibility of leaving
from work is there.
Proposed Plan of Action
The proposed plan of action focuses on the
preparation of programs for career path/ladder and
discussion with employees their future on the
company as well as the continuation of branch/
department meeting with open forum. Proper
budgeting to provide sufficient equipment to
employees and re-designing the working area
convenient to employees and clients are necessary for
improving the organizational climate while improving
the current orientation program conducted and
reviewing the time frame of the current orientation to
the contents of the program should also be in place.
To address the gap in terms of work itself,
conducting colloquial talk/forum among employees to
review the amount of policy; reviewing the HR policy
to validate if it is still attune to the needs of the
company; reviewing the target setting vs. manpower
needs; conducting job description review; providing
department/branch level award ex: perfect attendance
award for the month; employee of the month of the
branch and giving recognition from HRD the branch
level award should be given emphasis to improve the
performance of the organization.
CONCLUSION AND RECOMMENDATION
Majority of the respondents belong to the age
bracket of 20-25 years old and serving the company
from 1-3 years, regular status and Bachelor degree
graduates. Employees believe they don’t have clear
path for career growth is one of the reasons why the
current employee leave their previous employer.
Employee will leave if they feel they don’t have
future direction on their current company. And to
achievement and respect employee will leave if they
fell there is no recognition or rewards given to their
accomplishment. And for salary and assistances
employee will leave if they are not satisfied with their
pay scale. And for growth and enhancement position
is more important to the current employee if they will
leave or stay in their employers. With regards to
responsibilities and work load employees will leave if
they feel their work load is not distributed equally.
And for work itself employee still looking for
employer which they can choose their own method of
working most likely will stay.
Organizational Climate is the most noted factor of
the respondents that may lead to employee turnover.
In terms of organizational climate, length of
service and job status is considered significant factor
leading to turnover of employee. However, length of
service, marital status and monthly salary are also
significant to achievement and respect. As to salary
and assistances length of service and job status are
highly significant. And department assignment and
monthly salary are both significant in salary and
assistances. In growth and enhancement length of
service, monthly salary and job status are significant
to employee that will lead to turnover. And for
responsibilities and load marital status and position
are both highly significant while length of service,
department, monthly salary and job status are
significant in turnover of employees. As to work itself
marital status and position are highly significant,
while monthly salary and job status are significant in
turnover of employees.
Having the majority of the respondents are in
millennial generation, the company may develop
programs for career path/ladder to see the future
direction of the employees in the company. Review
the salary structure and incentive scheme considering
the length of service, job status or years in their
current position and marital status. A proposed

Asia Pacific Journal of Academic Research in Business Administration, Vol. 3, April 2017 ______________________________________________________________________________________________________________
66 P-ISSN: 2467-6691 | E-ISSN: 2467-5148
program for new generation of millennial that they
will make, enjoy and find fulfilment. Human Resource
may propose a replacement program for employees
because retention program is a complex process.
REFERENCES [1] Noe, Hollenbeck, Gerhart, Wright (2012). Human
Resource Management, Philippines: The McGraw-Hill
Companies Inc. USA.
[2] Ayap, C. D., & Macalalad, J. A. (2016). Work Values
and Job Satisfaction among Seafarers in J-Phil Marine
Incorporated. Asia Pacific Journal of Academic
Research in Business Administration, 2(1).
[3] Laguador, J. M. De Castro, E. A., Portugal, L. M.
(2014). Employees’ Organizational Satisfaction and Its
Relationship with Customer Satisfaction Measurement
of an Asian Academic Institution, Quarterly Journal of
Business Studies, 1(3), 83-93
[4] Mendoza, R. O., Laguador, J. M., & Buenviaje, M. G.
(2014). Organizational Satisfaction and Work
Engagement Among Non-Teaching Personnel of an
Asian University. Asian Journal of Management
Sciences and Economics Vol, 1(1).
[5] Mojares, E. K. B. (2014). Customer Satisfaction and
Loyalty Among Internet Banking Users of Philippine
National Bank in Batangas City. Asia Pacific Journal
of Multidisciplinary Research, 2(2), 1-1.
[6] Deligero, J. C. L., & Laguador, J. M. (2014). Work
Engagement among Employees and Its Relationship
with Work Units’ Performance of a Higher Education
Institution. International Journal of Management
Sciences, 3(12), 909-917.
[7] Javier, E. R., & Deligero, J. C. L. (2014). Job
Satisfaction of the Teaching and Non-Teaching Staff of
the Lyceum of the Philippines University-
Batangas. International Journal of Information,
Business and Management, 6(4), 1.
[8] Bay, A. B., An, I. L., & Laguador, J. M. (2014).
Organizational satisfaction and work engagement of
Filipino teachers in an Asian university. International
Journal of Multidisciplinary Academic Research, 2(4),
32-41.
[9] Mojares, E. K. B. (2014). Customer Satisfaction and
Loyalty Among Internet Banking Users of Philippine
National Bank in Batangas City. Asia Pacific Journal
of Multidisciplinary Research, 2(2), 1-1.
[10] Agulo, A. M. M., Agno, K. M., Andres Jr, A. C.,
Carandang, H. C., Rugay, V. G., Umali, M. A., ... &
An, I. L. (2015). Customer Satisfaction on the Quality
Services of one Department Store in Batangas City,
Philippines. Asia Pacific Journal of Academic
Research in Business Administration, 1(1).
[11] Cooper D. & Schindler P. (2014), Business Research
Methods 12th Edition, Philippines, The McGraw-Hill
Companies Inc.
[12] Hechanova R. M. & Franco E.P. (2008) Leading
Philippine Organization in a Changing World Research
and Best Practices, Ateneo de Manila University Press.
Quezon City
[13] Perrin et al. (2011). Age-Based Stereotypes: Silent
Killer of Collaboration and Productivity, Achieve
Gloval Inc., Florida USA. (Date Retrieve November
12, 2016 from http:www.aag-quebec.org/nouvelles/age
base stereitypes.pdf).
[14] Cappelli, P. (2008) Employment Relationship New
Models of White Collar Work.Cambrige University
Press. (Date Retrieved November 12, 2016 from
www.books.google.com.ph).
[15] Tolbize, Anick (2008). Generations Differences in the
Work Place. (Date Retrieve July 21, 2016 from
http://rtc.umn.edu/docs/2_18_Gen_diff_workplace.pdf)
.
[16] Perry John A. and Perry Erna K (2016). Contemporary
Society An Introduction to Social Science, Routledge
Taylor & Francis Group, USA, (Date Retrieved
November 12, 2016 from www.books.google.com.ph).
[17] Singh, P., Rai, S., Bhandarker, A. (2013). Millennials
and the Workplace: Challenges for Architecting the
Organizations for Tomorrow. Human Resource
Management International Digest, 21(7).
[18] Rai. S. et al. (2012) Millennials and the Work Place,
Sage Publication, USA. (Date Retrieved November 12,
2016 from www.books.google.com.ph).
[19] Swarnalatha, C and Vasantham T. (2016), Need and
Importance of Employee Retention in Organization
Related to Human Resource Management, Laxmi Book
Publication,USA.(Date Retrieved November 12, 2016
from www.books.google.com.ph).
[20] Bacong, C. I. M., & Encio, H. A. (2017). Effect of
Employee Relation to Job Performance in Engineering,
Construction and Manufacturing Company.
[21] Hendon J.R. & Lussier R.N. (2013).Human Resource
Management Functions Skills Development, Sage
Publication Asia, California, USA, (Date Retrieved
November 12, 2016 from www.books.google.com.ph).
[22] Buenviaje, M. G., Morcilla, G. P., FernanRefozar, R.,
Macalalad, J. A., & Laguador, J. M. (2016). Role of
Effective Communication in the Organizational
Commitment and Employee Behavior as Input to
Human Resource Management. Quarterly Journal of
Business Studies, 2(4), 193-200.
[23] Endaya, M. A. I., & Buenviaje, M. G. (2016).
Organizational Communication Tools Utilized by the
Employees of one Development Cooperative in the
Philippines. Asia Pacific Journal of Academic
Research in Business Administration, 2(1).
[24] Noe, R. A.(2010) Employee Training and Development
5th edition, McGraw Hill International, NY, USA,
(Date Retrieved November 12, 2016 from
www.books.google.com.ph).

Asia Pacific Journal of Academic Research in Business Administration, Vol. 3, April 2017 ______________________________________________________________________________________________________________
67 P-ISSN: 2467-6691 | E-ISSN: 2467-5148
[25] Verhulst et al. (2013), Human Resource Management
11th Edition, John and Wiley Sons, Singapore, (Date
Retrieved November 12, 2016 from
www.books.google.com.ph).
[26] Sinclair et al. (2012) Contemporary Occupational
Health Psychology Global Perspective on Research
and Practice Volume 2, Wiley-Blackwell Publishing,
U. (Date Retrieved November 12, 2016 from
www.books.google.com.ph).
[27] Benedicto, C. L. B., & Buenviaje, M. G. (2016).
Implementation of the New Core Banking System
(eICBA) in a Local Bank in the Philippines. Asia
Pacific Journal of Academic Research in Business
Administration, 2(1).
[28] Bagsit, J. P., Anuran, A. B. (2016). Financial
Performance of Sorosoro Ibaba Development
Cooperative- Feedmilling Operation, Asia Pacific
Journal of Academic Research in Business
Administration, 2(1), 1-13