Embed Size (px)
Citation preview

Back to the Future: Hybrid Co-operative Pensions and the TIAA-CREF System
Benjamin Goodman and David P. Richardson
September 2014
PRC WP2014-11 Pension Research Council
The Wharton School, University of Pennsylvania 3620 Locust Walk, 3000 SH-DH
Philadelphia, PA 19104-6302 Tel.: 215.898.7620 Fax: 215.573.3418
Email: [email protected] http://www.pensionresearchcouncil.org
The views expressed are the authors and do not necessarily reflect the views of TIAA-CREF. Any errors are our own. All opinions, errors, findings, interpretations, and conclusions of this paper represent the views of the authors and not those of the Wharton School or the Pension Research Council. © 2014 Pension Research Council of the Wharton School of the University of Pennsylvania. All rights reserved.

Back to the Future: Hybrid Co-operative Pensions and the TIAA-CREF System
Abstract
Hybrid retirement plans that combine the best features of defined benefit and defined contribution plans can provide an efficient and equitable method of ensuring retirement security for workers. Co-operative pension structures also enhance retirement security through risk pooling and leveraging economies of scale. Yet most U.S. private sector workers are not covered by these types of plan design. The TIAA-CREF system, which began in 1918 and covers millions of workers in the non-profit sector, provides an example of a plan design with features of a hybrid co-operative pension. We examine the historical performance of the core components, TIAA (a guaranteed fixed annuity) and CREF (a variable annuity), discuss key design features, and analyze data on contributions, investment returns, risk pooling, and retirement distribution characteristics. Keywords: Hybrid plan, annuities

1
Back to the Future: Hybrid Co-operative Pensions and the TIAA-CREF System
Over the past 30 years, defined contribution (DC) plans have emerged as the primary
employment-based retirement program for millions of U.S. workers.1 DC plans provide covered
workers with substantial latitude in determining whether to participate, how much salary to
contribute, how to invest assets, and how to take distributions from the plans. As participation in
DC plans has grown, more households bear increased responsibility for managing the various risks
to their retirement savings. A growing body of research finds that many DC plan participants have
difficulty making decisions that maximize their chances of achieving retirement security. For
example, workers may make poor retirement plan decisions because they are prone to behavioral
biases or have low financial literacy.2 Policymakers recently began enacting changes to the DC
plan system with the goal of reducing the chances of participants making systematic mistakes.
Major changes enacted as part of the Pension Protection Act of 2006 included new rules for
qualified plan default provisions that were designed to increase worker participation, achieve a
minimum rate of retirement contributions, and provide automatic investment diversification. These
changes focused on helping households manage risk during the accumulation phase, but they
provided no guidance for the distribution phase of these retirement plans.
As the U.S. population ages, there is a need to ensure that retirement programs can carry
individuals not just to, but also through, retirement. This has resulted in renewed interest in plan
designs that include guaranteed income options to help households manage various retirement
income risks. Among the ideas being considered, policymakers are requiring default (or
mandatory) annuity features and encouraging the expanded use of hybrid plan designs.
This chapter provides an overview of how TIAA-CREF, a Fortune 100 financial services
company providing retirement services to the non-profit and public sectors, incorporates features

2
of a co-operative hybrid pension into retirement plan design. We define a co-operative pension as
a retirement plan that distributes all assets (net of operating costs) to system participants over time.
A hybrid pension combines elements of both a defined contribution (DC) plan and a defined
benefit (DB) plan. The TIAA-CREF system combines a DC structure during the accumulation
phase, with workers allocating contributions to investment choices that include mutual funds and
deferred fixed and variable annuities; a DB structure during retirement by providing the option to
annuitize part (or all) of retirement assets; and a co-operative structure for individuals who
participate in the fixed annuity component over their working and retired lives.
In what follows, we first provide a brief overview of the TIAA-CREF system. Next we
discuss how TIAA Traditional, a guaranteed fixed annuity, and the CREF variable annuity work,
and we discuss past performance. We then review some recent data on participant experience. A
final section concludes.
The Basics of TIAA-CREF
Teachers Insurance and Annuity Association – College Retirement Equities Fund (TIAA–
CREF) is multi-faceted financial services organization offering a range of pension, IRA, life
insurance, brokerage, financial guidance and advice, wealth management, banking, endowment,
and planned giving services. Here we focus on the structure of core pension business which serves
over 3.9 million individuals and more than 15,000 institutional clients.3 Many institutions offer at
least two plans—a primary plan (which may accept only employer contributions), and a
supplemental plan (which typically accepts only employee contributions). Because TIAA-CREF
serves the non-profit and public sector markets, some institutions are subject to the Employee
Retirement Income Security Act (ERISA) while others are not. Numerous sources provide

3
information on corporate structure, governance, and risk management aspects of TIAA-CREF.4
Our focus in this chapter is how the system impacts participant outcomes.
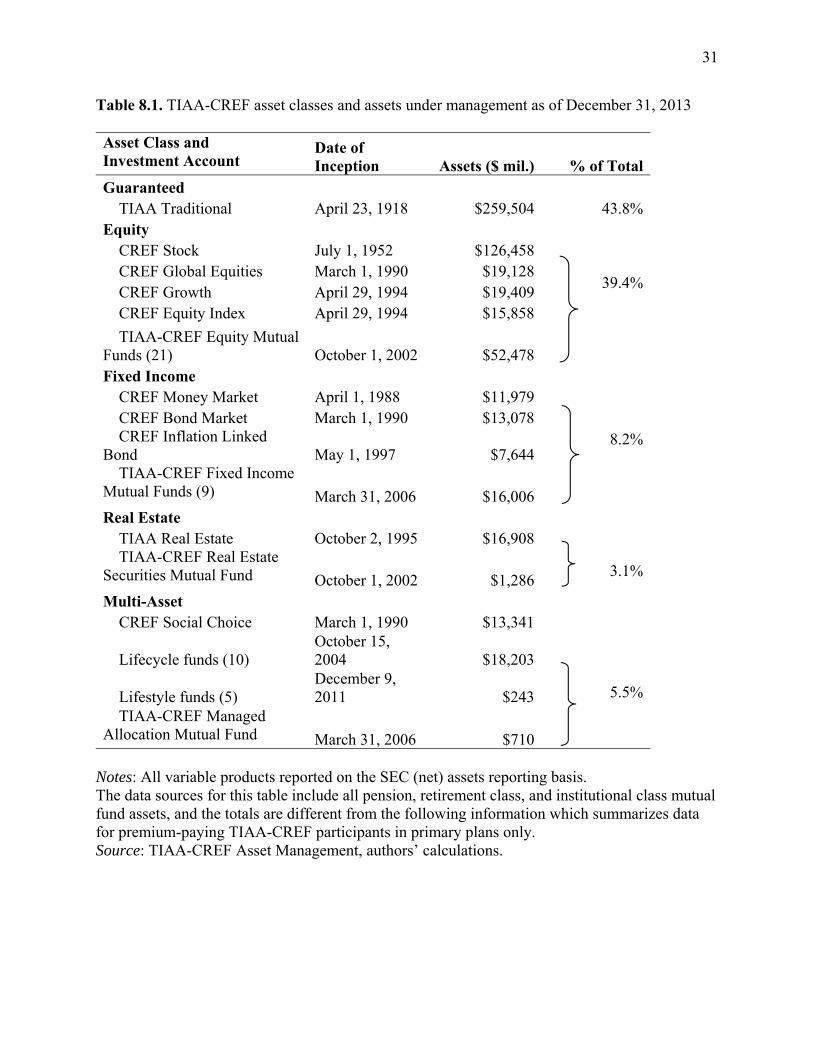
Participants in the TIAA-CREF system choose from a menu of investments when building
their retirement portfolios. Table 8.1 provides information on the asset classes and investment
choices available to participants as of December 31, 2013; it also documents the rapid growth in
the investment choice set over the past 20 years. Participants can also invest in one guaranteed
asset, the TIAA Traditional annuity. This asset class was the genesis of TIAA in 1918; it provides
a guarantee of principal, a guaranteed interest rate, and additional declared dividends in excess of
the guaranteed rate.5 In 1952, CREF became the first organization to offer a variable annuity when
it introduced the CREF stock account. This account allowed participants to directly purchase (and
bear the associated investment risks of) an equity asset class within their retirement plans. In 1988,
CREF began offering a fixed income asset class with the introduction of the CREF Money Market
account. A fourth asset class—balanced—was added in 1990 with the introduction of the CREF
Social Choice fund.6 The TIAA Real Estate fund in 1995 introduced a fifth asset class—real
estate. As shown in Table 8.1, a number of additional equity, fixed income, real estate, and
balanced asset class fund options have been added to the investment menu thereafter. Notable
among these were the introduction of the CREF inflation-linked bond fund (1997), retirement class
mutual funds (2002), and the target-date series of life-cycle mutual funds in 2004. In 2013, TIAA-
CREF offered a total of 57 investment options across five different asset classes, divided about 39
percent in equity and 69 percent in non-equity asset classes.
Insert Table 8.1 here
At retirement, participants have a menu of distribution options available for converting
assets into retirement income. For instance, they have access to a full menu of annuity options

4
including fixed and variable, single and joint, standard and graded, various length guaranteed (or
certainty) periods, transfer payout, and interest-only payments. Participants may also take
systematic withdrawals, lump-sum payments, or required minimum distributions. The flexibility
of the distribution menu allows participants to customize their retirement incomes to suit their
consumption and estate planning needs.
Prior to 1988, however, the TIAA-CREF system could be characterized as a co-operative
hybrid retirement plan. The hybrid component was facilitated through a plan design that required
defined contributions to be allocated to units of deferred annuities; at retirement, participants
converted these assets into a lifetime income benefit stream. The co-operative component was
associated with a system design that distributed all assets (net of operating costs) to participants
over time. Though the firm no longer requires the conversion of assets into lifetime annuities, the
co-operative arrangement remains in place for participants choosing to utilize annuities. In what
follows, we describe how TIAA and CREF work and show how the two products remain an
integral part of many participants’ retirement income plans.
TIAA Traditional
The TIAA Traditional annuity is a guaranteed fixed annuity product that can be purchased
while working or in retirement by investing in deferred TIAA annuity units through an
employment-based retirement plan. The overall concept of ‘investing’ in TIAA is quite simple
during a participant’s working life. Contributions are made by a participant (or on behalf of the
participant by his/her employer).7 Each contribution has a guaranteed lifetime minimum rate of
return based on the month and year in which the contribution is made. For most of our participants,
this guaranteed minimum rate is 3 percent.8 All TIAA participants are thus guaranteed (subject to

5
TIAA meeting its claim-paying ability) to have an account balance that continually grows at the
stated minimum rate. In addition, in any year the TIAA Trustees declare that ‘additional amounts’
will be credited to participant accounts, this in effect provides an interest rate greater than the
guaranteed minimum rate.
A participant (or surviving spouse, partner, or beneficiary) has the right but not the
obligation to turn the accumulated units of TIAA into a stream of lifetime income. The decision to
contractually convert into lifetime income typically happens in retirement, although it can occur
at later ages. Similar to the accumulation phase, the TIAA annuity contract has a guaranteed
minimum payout rate; the TIAA trustees can declare additional amounts to increase the total
payment beyond this minimum guarantee on an annual basis. A full menu of annuity choices is
available and includes options for single or joint life, standard or graded, and certainty periods of
various lengths.9 If a participant chooses not to take a lifetime annuity, other income options are
available, such as receiving interest-only payments, taking the Required Minimum Distribution
(RMD) amounts, or opting for an annuity certain. The accumulated balance can also be transferred
out of TIAA in roughly equal-sized periodic payments using a Transfer Payout Annuity (TPA),
with the transferred amounts moved into other TIAA-CREF investments or taken out of the
system, though the latter may depend on employer-specific plan rules.10
While the concepts behind TIAA are simple, features of the system make including a TIAA
deferred annuity in an investment portfolio somewhat complex. First, every year for the last half
century, the TIAA trustees have declared additional amounts for both the accumulation and the
payout rates. For this reason, participants and advisers who considered only the minimum
guarantee would have underweighted the expected return contribution on the product. Second,
TIAA has a unique ‘vintage’ system that applies different crediting rates to marginal
6
accumulations based on the time of original contribution. Thus, the total return earned on total
contributions is unique to each individual’s history of contributions. Third, there is typically
limited liquidity and cashability for TIAA accumulations held in employer-sponsored retirement
plans, which limits the ability to rebalance one’s portfolio. Each of these features is addressed in
what follows.
TIAA crediting rates during the accumulation phase. Participants can purchase TIAA deferred
annuity units through their retirement plan by allocating part of their contributions to them, or by
transferring other retirement assets into the product. Accumulated TIAA units earn a lifetime
guaranteed minimum rate of return that is determined by the type of retirement plan contract. For
many participants, this guaranteed minimum is 3 percent, though more recent plan contracts have
adopted a year-to-year floating guaranteed rate of at least 1 percent and at most 3 percent.11 For
the past few decades, actual credit rates have been much higher than the guaranteed minimums
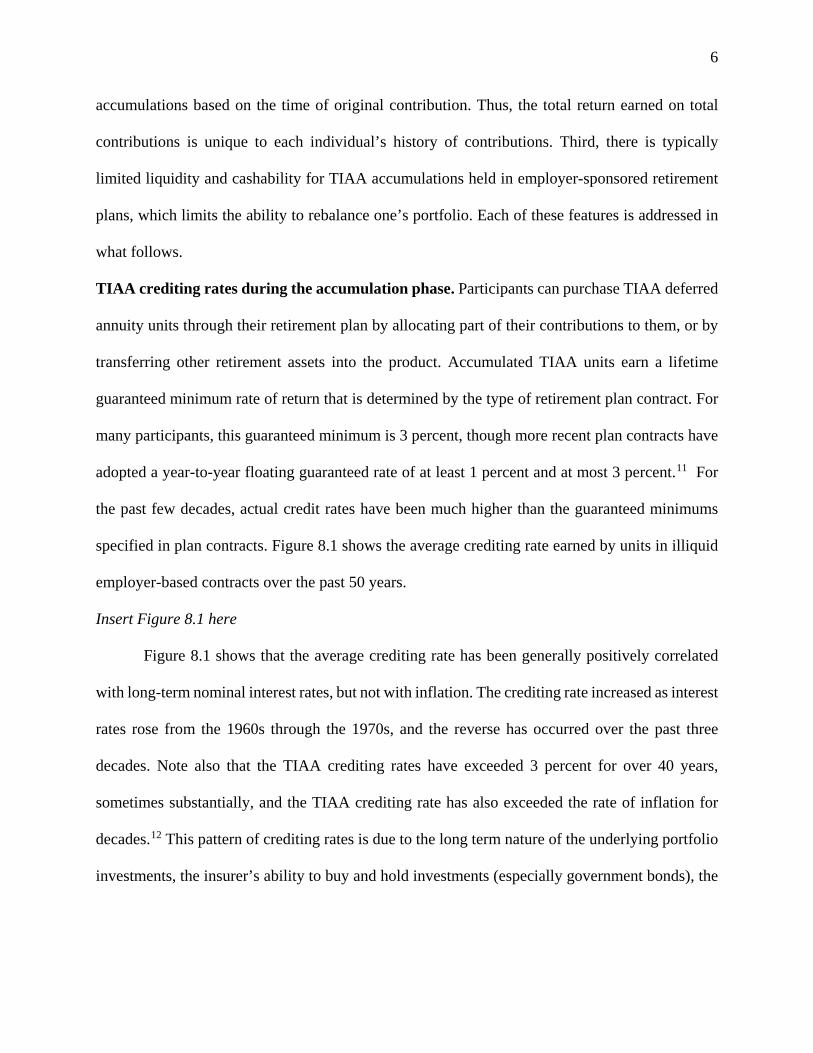
specified in plan contracts. Figure 8.1 shows the average crediting rate earned by units in illiquid
employer-based contracts over the past 50 years.
Insert Figure 8.1 here
Figure 8.1 shows that the average crediting rate has been generally positively correlated
with long-term nominal interest rates, but not with inflation. The crediting rate increased as interest
rates rose from the 1960s through the 1970s, and the reverse has occurred over the past three
decades. Note also that the TIAA crediting rates have exceeded 3 percent for over 40 years,
sometimes substantially, and the TIAA crediting rate has also exceeded the rate of inflation for
decades.12 This pattern of crediting rates is due to the long term nature of the underlying portfolio
investments, the insurer’s ability to buy and hold investments (especially government bonds), the

7
size of the general account (which helps facilitate investment in alternative assets), and low
expenses.
When a participant is credited with earnings on his existing TIAA assets, his new
accumulation receives the same guaranteed minimum rate. As a simple example, suppose a
participant makes a one-time allocation of $100 to TIAA and has a plan contract with a guaranteed
minimum rate of 3 percent. After 10 years, the minimum accumulation would be $134.39. If
instead, during the first year, the actual crediting rate was 5 percent, then after 10 years the
guaranteed minimum accumulation will be $137. 13 The additional 2 percent earned in the first
year is guaranteed once it has been earned.
As an illustration using historical returns, assume a participant made a one-time allocation
to TIAA of $100 on January 1, 1984 and had a plan contract with a guaranteed minimum crediting
rate of 3 percent. A 30-year projection of his guaranteed minimum accumulation as of January 1,
2014 would have been $242.73. But when we apply the actual crediting rates to this participant’s
TIAA accumulations, the actual amount accumulated was $846.61, an amount nearly 3.5 times
larger than the guaranteed minimum. Of course, past performance is no guarantee of future results,
so if today’s low interest rate environment persists into the foreseeable future, there is a strong
likelihood that a 2044 actual accumulation from a one-time $100 contribution in 2014 will result
in a smaller total return. Nevertheless, it is important to understand that considering only the
guaranteed minimum accumulation rate of 3 percent likely understates the potential value of
investing in a TIAA account.
Another important aspect of investing in TIAA is the lack of downside volatility in the
participant’s total return. When market interest rates rise or fall, bond holders can experience
portfolio gains or losses to their total returns because of the interaction between interest rates and

8
bond prices. By contrast, TIAA participants always earn a positive return because the interest rate
risk is managed within the TIAA general account. This lack of participant downside investment
risk compares favorably to other ‘safe’ fixed income investments—namely bond funds—that are
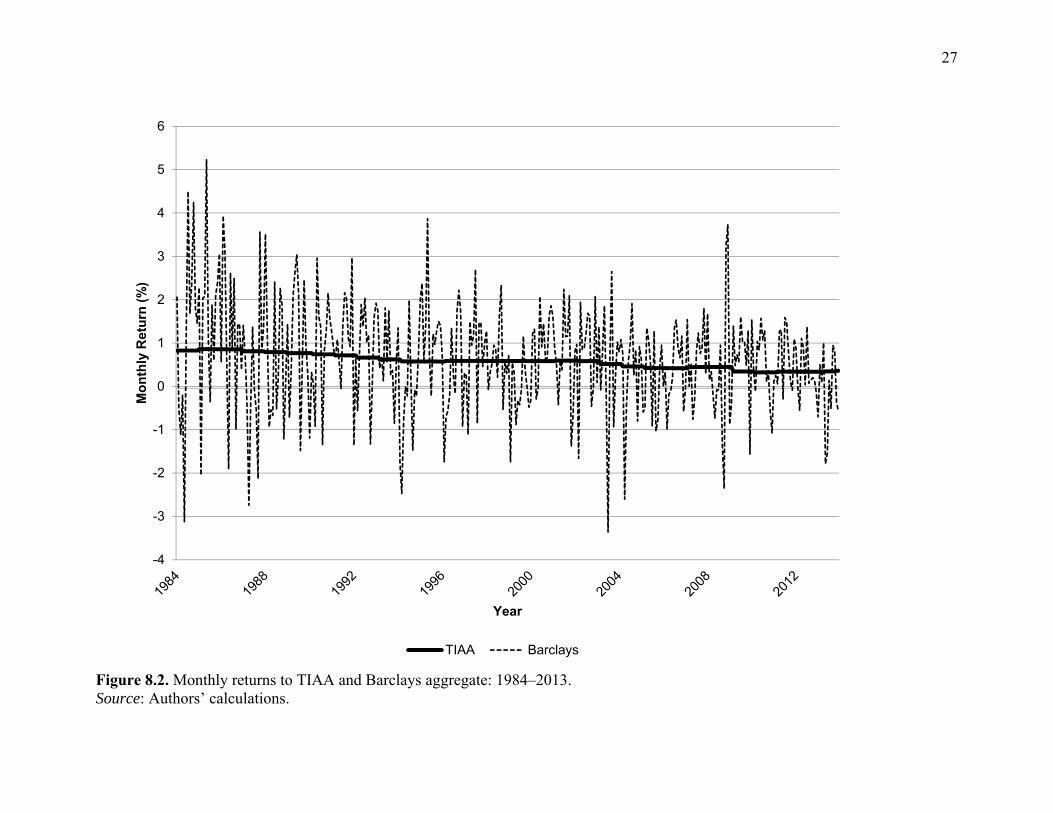
required to distribute capital gains and losses to participants. Figure 8.2 compares the past 30 years
of monthly returns in TIAA with the Barclays Aggregate Bond Fund returns.14 The bond funds
had negative monthly returns about 30 percent of the time over the sample period. The likelihood
of short term negative bond returns is a particularly important consideration for older workers
nearing retirement who seek to rebalance their portfolios away from equities and toward fixed
income products. Using this strategy in a rising interest rate environment may have near-retirees
bearing excessive interest rate risk relative to an alternative strategy of holding TIAA. This is
because the latter pools the risk within a general account which is not required to distribute capital
losses to participants.
Insert Figure 8.2 here
Table 8.2 provides additional evidence of the advantages of pooling investment risk across
participants within the TIAA general account. The average return performance of TIAA and the
Barclays aggregate give the appearance of similar performance across various time periods. Taking
into account the funds’ volatility (as shown in Figure 2), however, indicates that participants bear
substantially more risk in the bond funds compared to TIAA. The Barclays aggregate had negative
returns in about 30 percent of the months, compared to zero negative months for TIAA. The
difference in Sharpe ratios highlights the additional risk to participants within the bond fund, as
compared to the accumulations held in the TIAA general account.
Insert Table 8.2 here
9
Contributions and the TIAA vintage system. An unusual feature of the TIAA Traditional
annuity is its vintage system for crediting returns that participants earn on their contributions.
Generally speaking, the vintage system exists because TIAA is structured as a non-profit ‘co-
operative’ annuity with a long-term investment horizon. When a participant contributes to TIAA
Traditional, assets are purchased to back the total lifetime expected impact of that contribution.
Contributions made at different points in time (called ‘vintages’) can therefore earn different
crediting rates, because assets backing the various vintages of contributions will tend to have
different rates of return.
This vintage system can make it difficult for some to understand their total TIAA returns,
because most participants contribute to the fund over their working lives and not as a simple lump-
sum at a point in time. As a result, most TIAA participants tend to have accumulations in many
different vintages, so their overall average return is a blend of the returns to the various vintages.15
The vintage system is akin to a cooperative pension, in that all the participants of a particular
vintage ‘own’ the underlying vintage assets and share in their returns.
Table 8.3 provides a hypothetical example of how the vintage system contributes to a
participant’s TIAA returns. The total average return in the table is calculated as the weighted
average of the accumulations attributable to each of the various vintages. For most contracts,
interest earnings above the 3 percent guarantee are placed in the new vintage, so the average
interest earned on total accumulations can thus change on a daily basis.
Insert Table 8.3 here
The TIAA vintage system was created to treat participants fairly relative to their tenure
within the system. The alternative of using a single total portfolio rate might drive down returns
for existing participants when interest rates fall, and by necessity it would require reduced new
10
money rates when interest rates rise. The vintage system reduces exposure to this type of interest
rate risk.
The ‘co-operative’ characteristics of the vintage system extend through the accumulation
phase into retirement, so they can also affect the annuity settlement crediting rate.16 This is
because the settlement rate will reflect the various vintages of investment experience, as well as
an additional amount from the return of unneeded contingency reserves.17 Given TIAA’s non-
profit co-operative annuity structure, when the contingency reserves are no longer needed, the firm
distributes them to the participants who helped generate them. Absent unusual circumstances, the
longer a participant has assets in TIAA, the higher the payout rate, because the older vintages have
larger contingency reserves. Table 8.4 illuminates this concept by showing current payout rates by
vintage.
Insert Table 8.4 here
Two important features of the TIAA system are worth emphasizing. First, the comparison
of vintages to ‘new money’ rates shows the difference in payout rates that a long-term participant
in TIAA receives, compared to someone who converts other retirement assets into a TIAA annuity
on the contract settlement date. For example, a long-term participant annuitizing assets with
vintages from 1990 to 2008 would have a payout rate of between 7.19 percent and 9.73 percent,
depending on the timing of his contributions. By contrast, a person converting retirement assets
into a TIAA annuity today would receive the ‘new money’ rate of 6.5 percent. Second, participants
cannot pick and choose which vintages they want to sell or annuitize – all decisions are pro-rata
across various vintages to deter participants from gaming the system when interest rates change.
Continuing the previous example, if a long-term participant annuitized half his TIAA assets, then
the crediting rate is weighted pro-rata across his various vintages.

11
TIAA annuity payout rates. Participants choose if, when, how, and how much they annuitize
from their holdings of TIAA assets. A participant may decide he does not need to annuitize any
retirement wealth and so can continue holding TIAA assets through retirement. Alternatively, he
can take interest-only payments, allow Required Minimum Distribution (RMD) rules to generate
payments, or convert those assets using a Transfer Payout Annuity (TPA).18 For those choosing
annuitization, a full range of choices is available including options for single versus joint life,
standard versus graded, and a range of guarantee options. Once a participant decides when, how,
and how much to annuitize, his TIAA assets are converted into an annuity payment stream using
the current applicable annuity payout rate. Given the vintage system described above, this rate is
likely to be unique to each participant.
TIAA provides a guaranteed minimum payout defined in terms of expected lifetime
income. Expressing the payout as income per $1,000 of TIAA accumulation, most contracts
currently have an age 65 minimum guarantee of $4.11 of monthly lifetime income, or over $49
per year. TIAA has also historically credited additional amounts to the payout rate. For example,
as of January 1, 2014, the initial income per $1,000 on ‘new money’ at age 65 was $5.54 a month,
or over $66 per year. All of these payments are stated as rates, with the guaranteed minimum
payout rate equal to 4.93 percent and the ‘new money’ payout rate equal to 6.6 percent.
As is well known, annuity payout rates vary depending on several factors, including an
annuitant’s age, annuity option elected, and the current interest rate. Table 8.5 provides examples
of current payout rates. Participants annuitizing at younger ages, those choosing two-life annuities,
and/or those electing a certainty or guarantee period (e.g., a life annuity that also includes a
guaranteed minimum number of payments) will receive a lower payout rate compared to older
annuitants and those opting for a single life annuity with no guarantee period. While the payout

12
rate will differ based on these factors, the expected total lifetime benefit will be roughly equal
across ages and options. By contrast, differences in the current interest environment at the time of
retirement can result in different payout rates and different expected lifetime benefits. For example,
while the current new money payout rate for an age 65 annuitant is 6.5 percent, many years ago it
was quite a bit higher, hitting a peak of about 14 percent in the early 1980s.
Insert Table 8.5 here
One challenge in explaining the annuitization decision process is that, unlike with mutual
fund investments, there is no single ‘price’ for annuities. That is, the guaranteed minimum interest
rate is known, but the participant’s actual payout rate depends on age, option, and interest, plus the
additional impact on the rate from the vintage system and additional credited amounts. Because
these additional amounts are not guaranteed, a prospective annuitant retiree will not know his/her
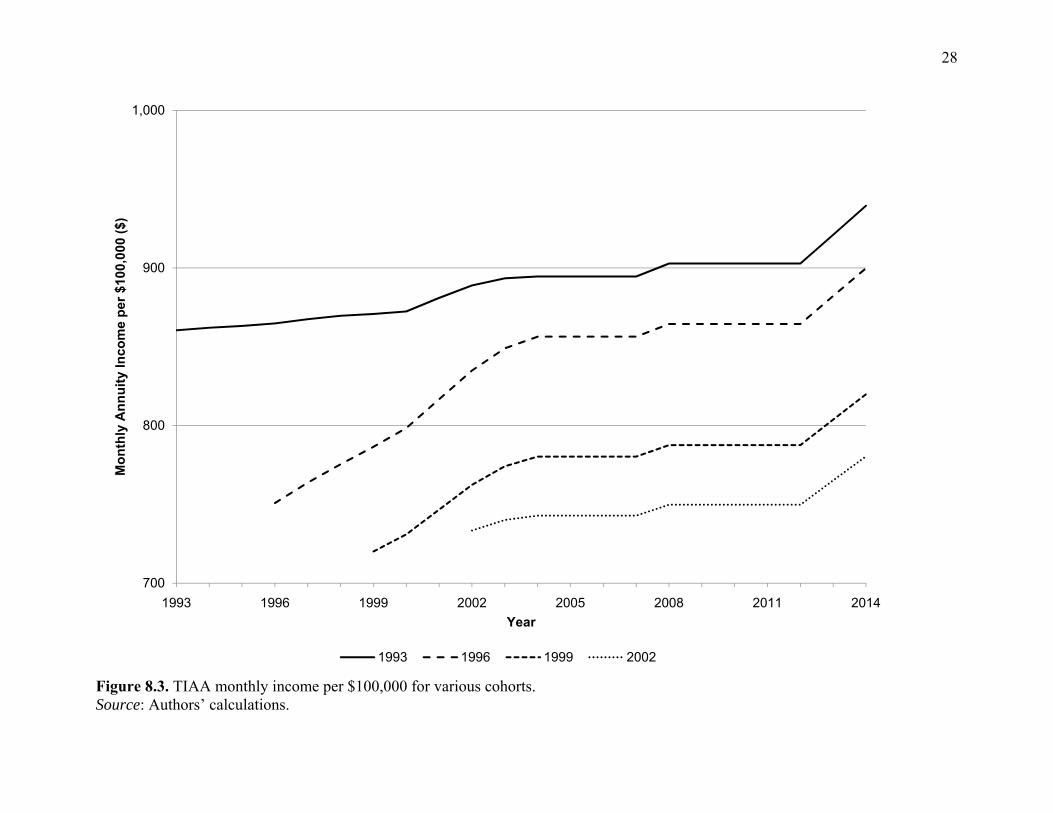
actual income per $1,000 accumulation until very close to the settlement date. Furthermore, the
additional amounts can change, even for those who have already turned their accumulations into
lifetime income. Figure 8.3 shows that TIAA has declared numerous increases to post-
annuitization payout rates to annuitants in different cohorts. As Figure 8.3 shows, initial income
per $100,000 has varied over the past 20 years.19 Notably, there were no reductions since 1993,
even though this period included the 2001 recession and the 2008 financial crisis.
Insert Figure 8.3 here
Combining accumulation and payout features: A hybrid co-op pension product. We have
characterized TIAA as a co-op hybrid pension product based on its features and structure. TIAA
has a DC component because participants allocate retirement contributions to TIAA over their
working lives and accumulate units of a deferred guaranteed fixed annuity. The vintage system
has features of a co-operative pension because of TIAA’s non-profit annuity structure—meaning

13
that the risk pooling, returns, and Board decisions on the distribution of underlying no-longer-
needed contingency reserves is proportional to the accumulated shares owned by each vintage
cohort. Likewise, the guaranteed minimum crediting and payout rates during the accumulation and
payout phases, respectively, provide a co-operative structure for distributing returns and income
from system assets while effectively pooling market risk. At retirement, the features of the
participating annuity options provide a minimum level defined benefit pension with a high
likelihood of receiving additional amounts.
Design complexity is an issue for this type of product within a retirement plan investment
menu. A growing body of research indicates that individuals face both behavioral and financial
literacy hurdles when making retirement decisions, and complexity can be a major driver of poor
decision making.20 Research also indicates that low annuitization rates can be partially explained
by behavioral biases.21 For example, prospect theory indicates that after working a lifetime and
accumulating retirement wealth, retirees may have a difficult time writing a big check from their
accounts to receive a series of small checks in the form of annuity income. Including hybrid
pension products in the investment menu (in the form of deferred fixed annuities) can help
participants overcome this behavioral bias, by encouraging them to allocate contributions to the
deferred annuity over time to receive a series of larger checks in retirement. Guaranteed minimums
can also help with loss aversion, because every contribution is guaranteed to grow at a minimum
rate and produce income for lifetime retirement income at that minimum rate. Other features, such
as the vintage system and allocation of additional amounts, should increase demand for these
products, yet they also add complexity. So while research in behavioral finance and financial
literacy has improved plan design during the accumulation phase, much work remains to be done
with respect to the distribution phase.

14
A simple example highlights the challenges. No precise projection of future lifetime
benefits from TIAA is available, but a rough estimate can be calculated using today’s crediting
and payout rates. For example, at age 35, a one-time $100 contribution is guaranteed to increase
to $243 by age 65. With a guaranteed minimum payout rate of 4.9 percent, this one-time
contribution will generate at least $12 in annual income as a single life annuity. A more realistic
example estimates the guaranteed income benefit received starting at age 65, assuming level
contributions of $100 monthly over 30 years. Applying the current guaranteed minimum
guaranteed rates results in about $2,842, while applying average current rates would imply about
$4,347 in annual income.
This simple example shows that including this type of hybrid product in a retirement plan
could nudge participants to focus on retirement outcomes, rather than simply wealth accumulation.
Advice engines can provide different outcome metrics under a variety of other assumptions. For
example, by assuming a contribution equal to a fixed percentage of salary, one can describe the
final benefit as a replacement rate (projected benefit divided by final salary), using either the
minimum guaranteed interest and payout rates, or current rates (or even historical average TIAA
rates).
Another advantage of this type of hybrid product is that the guaranteed minimum income
floor allows participants to customize their retirement investment portfolios to seek higher returns
(and more risk), or to reduce total risk exposure by allocating more assets to a higher income floor.
The flexibility of distributions in retirement is also a feature. Participants have the right but not the
obligation to convert their accumulations into lifetime income. Participants are free to use their
accumulations in any way they choose, subject to contractual limits. For example, a participant in
poor health might not want to annuitize, might choose a joint life annuity to provide for a spouse

15
or partner, or might choose a single life annuity with a guarantee period to ensure assets revert to
the estate in case of an early death.
The CREF Variable Annuity
CREF became the first commercially offered variable annuity product in the U.S. in 1952,
with an intuitive and simple design concept.22 During the accumulation phase, CREF investments
appear to perform similar to mutual fund investments. Participants who allocate contributions to
CREF purchase fractional shares (units) of a basket of underlying assets. The daily share value
changes, based on the performance of the assets held in the fund. But there is a key difference
between CREF and mutual funds: while mutual funds have capital gain distributions and/or pay
dividends, the declared amount is used to add to the participant’s number of shares owned. In
CREF, the units are valued daily and any gains or dividends are added to the unit value.
As shown in Table 8.1, there are currently eight different CREF accounts. The first was the
CREF Stock account, which provides a broadly diversified basket of equities with foreign and
domestic stocks (large and small cap), and combines both active and passive management. Other
accounts include an Index fund, Growth account, Global account, Bond Fund, Inflation-linked
Bond fund, Social Choice fund, and a Money Market Account. Participants are free to choose any
allocation to these accounts, as well as TIAA Traditional, TIAA Real Estate, or any other mutual
funds included in the plan sponsor’s menu.
Another difference between CREF and a mutual fund is that, in the payout phase, the CREF
participant has the right but not the obligation to convert his accumulations into a stream of lifetime
income. Similar to TIAA, participants choose if, when, how, and how much of their CREF
accumulations to annuitize. Participants may take non-annuity distributions similar to mutual
16
funds or lump-sum or systematic withdrawals (there may be limits based on plan rules), or simply
draw down their accumulations based on the Required Minimum Distribution (RMD) rules.
A unique feature of the CREF payout annuity is that it offers post-settlement asset
allocation choices. Conversion from one CREF annuity to another CREF annuity and/or to a TIAA
annuity is permitted. Thus if an annuitant wants to ‘lock in’ gains after a good year, or simply
wants to reduce or increase the risk of his annuity payment stream, he can transfer some or all of
his assets across accounts. Accordingly, the participant can collect payments for life.
One consequence of purchasing a variable annuity is that the retiree does not know from
payment to payment how much income he will receive from the annuity. This uncertainty must be
balanced against the possibility of achieving greater investment returns than those promised by a
fixed annuity. In essence, CREF (or any variable annuity) provides an instrument for those who
seek the security of lifetime income and also wish to participate in the equity and/or bond markets.
The size of life annuity payment per $1,000 of assets converted will depend, among other
factors, on the annuitant’s age at settlement, how long he is expected to live from that age (single
or joint mortality), and an assumed investment return (AIR). In the case of a fixed annuity like
TIAA, the insurer has a high degree of confidence in what the underlying investments are expected
to earn, so the payment calculation is straightforward. By contrast, expectations are less certain
regarding what assets will earn in a CREF variable annuity. This is because the equity market may
be bullish or bearish, and interest rates may rise or fall. CREF uses a 4 percent AIR to calculate
the initial annuity payment and then each year (or month for those who choose to revalue their
payments monthly), the payment is adjusted by comparing the 4 percent AIR with the actual return
earned. If the CREF funds earn more than 4 percent, the payment is increased; if the fund earned
less than 4 percent, the payment decreases. CREF may also adjust the annuity payment based on

17
changes in system expenses, group mortality, or other factors (these have been very minor over
time).
Some might ask why CREF uses a 4 percent AIR, and the answer is not simple. Part of the
explanation is that the firm seeks to reduce potential volatility of participant outcomes based on
past market experience. If CREF used a lower AIR, it would result in a lower initial payment, but
participants would be more likely to receive increases and those increases would tend to be larger.
Using a higher AIR would result in high initial payments, but it would also bring a greater
likelihood of subsequent decreases in payments.
Consider a 65 year-old participant with a contract for a CREF single life annuity with a 10-
year guaranteed period. Using the standard 4 percent AIR results in an initial annual payment of
about $6,680 per $100,000 in assets converted. If instead, we use a 0 percent AIR, the initial
payment would be $4,181; using a 6 percent AIR generates an initial payment of $8,076. Suppose
in the following year, the actual return of the CREF fund were 6 percent. Then the annuities with
0 percent, 4 percent, and 6 percent AIR would get a 6 percent, 2 percent, and 0 percent increase,
respectively. Given its experience, CREF uses the 4 percent AIR to accomplish the overall goals
of sufficient initial income with some potential for increases that can help keep pace with inflation.
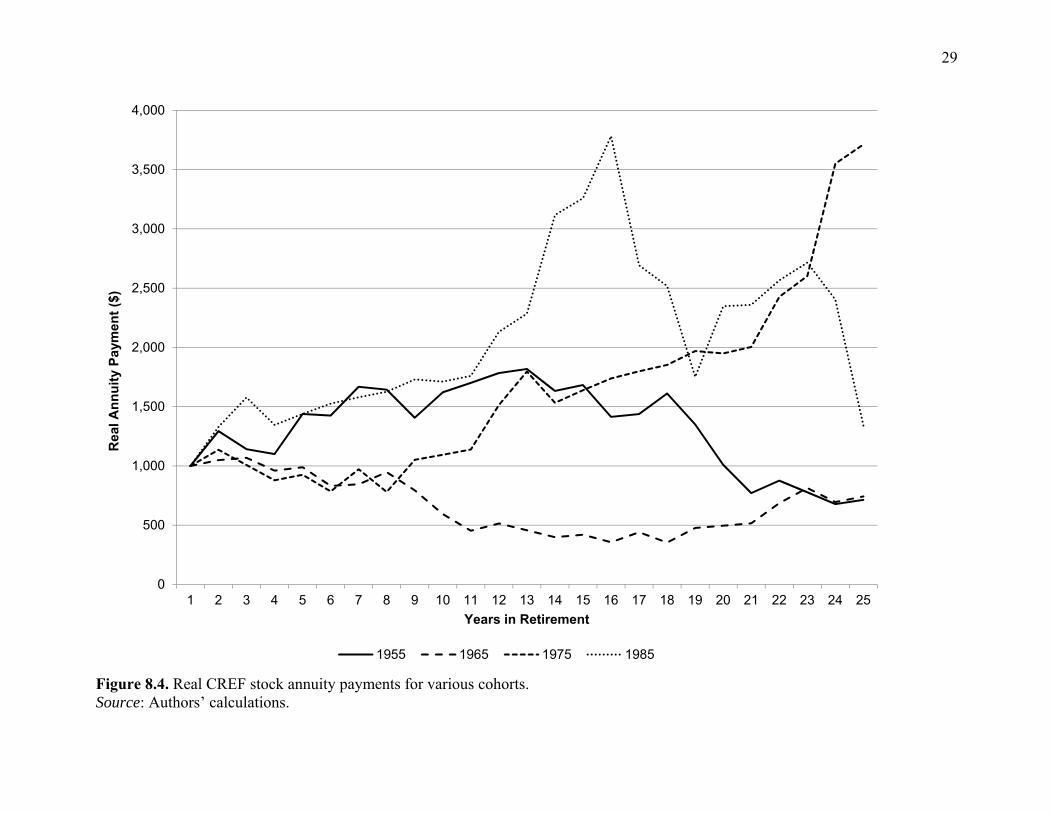
How effective has the 4 percent AIR been in achieving these goals? The answer depends
on the date of annuity settlement. Figure 4 shows the evolution of payments per initial $1,000
income from a variable annuity using the CREF stock account. We show paths for cohorts with
settlement dates in 10-year intervals from 1955 to 1985, noting that the horizontal axis shows years
from settlement and not standardized years. For example, the 20th year payment for the 1965 cohort
is equivalent to the initial year payment for 1985 cohort. The $1,000 line represents a perfectly
inflation-hedged annuity. For most cohorts, a variable annuity using the CREF stock account has
18
done well in keeping pace with inflation, on average. This was particularly true for cohorts with
settlement dates after 1980.
Insert Figure 8.4 here
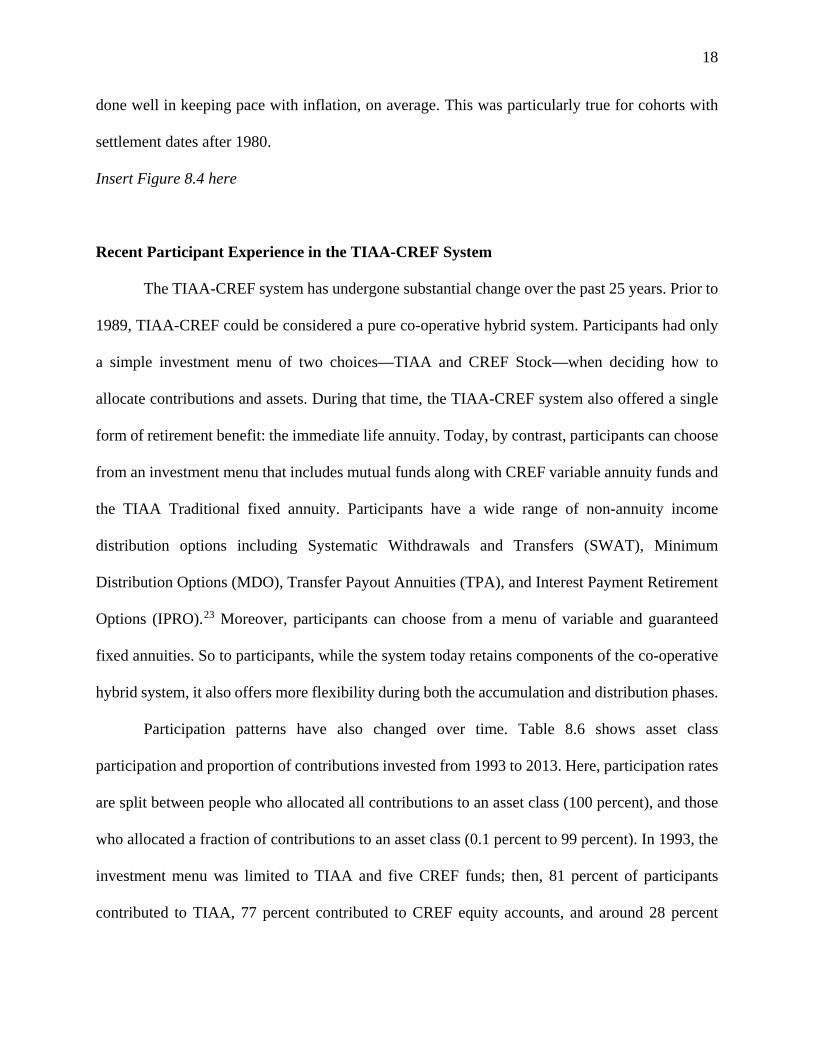
Recent Participant Experience in the TIAA-CREF System
The TIAA-CREF system has undergone substantial change over the past 25 years. Prior to
1989, TIAA-CREF could be considered a pure co-operative hybrid system. Participants had only
a simple investment menu of two choices—TIAA and CREF Stock—when deciding how to
allocate contributions and assets. During that time, the TIAA-CREF system also offered a single
form of retirement benefit: the immediate life annuity. Today, by contrast, participants can choose
from an investment menu that includes mutual funds along with CREF variable annuity funds and
the TIAA Traditional fixed annuity. Participants have a wide range of non-annuity income
distribution options including Systematic Withdrawals and Transfers (SWAT), Minimum
Distribution Options (MDO), Transfer Payout Annuities (TPA), and Interest Payment Retirement
Options (IPRO).23 Moreover, participants can choose from a menu of variable and guaranteed
fixed annuities. So to participants, while the system today retains components of the co-operative
hybrid system, it also offers more flexibility during both the accumulation and distribution phases.
Participation patterns have also changed over time. Table 8.6 shows asset class
participation and proportion of contributions invested from 1993 to 2013. Here, participation rates
are split between people who allocated all contributions to an asset class (100 percent), and those
who allocated a fraction of contributions to an asset class (0.1 percent to 99 percent). In 1993, the
investment menu was limited to TIAA and five CREF funds; then, 81 percent of participants
contributed to TIAA, 77 percent contributed to CREF equity accounts, and around 28 percent

19
contributed to CREF fixed income accounts. As the investment menu expanded, the proportion of
participants allocating any contributions to TIAA declined, and in 2013, only about 40 percent
contributed to TIAA. As noted in Rugh (2004), equity class participation peaked in the early 2000s
and steadily declined since the 2001 recession. This drop in participation in the guaranteed and
equity classes has been offset by a strong increase in participation in the multi-asset class, a shift
almost completely attributable to increasingly strong participation in auto-diversified life-cycle
fund investments first offered in 2004 (Richardson 2014).
Insert Table 8.6 here
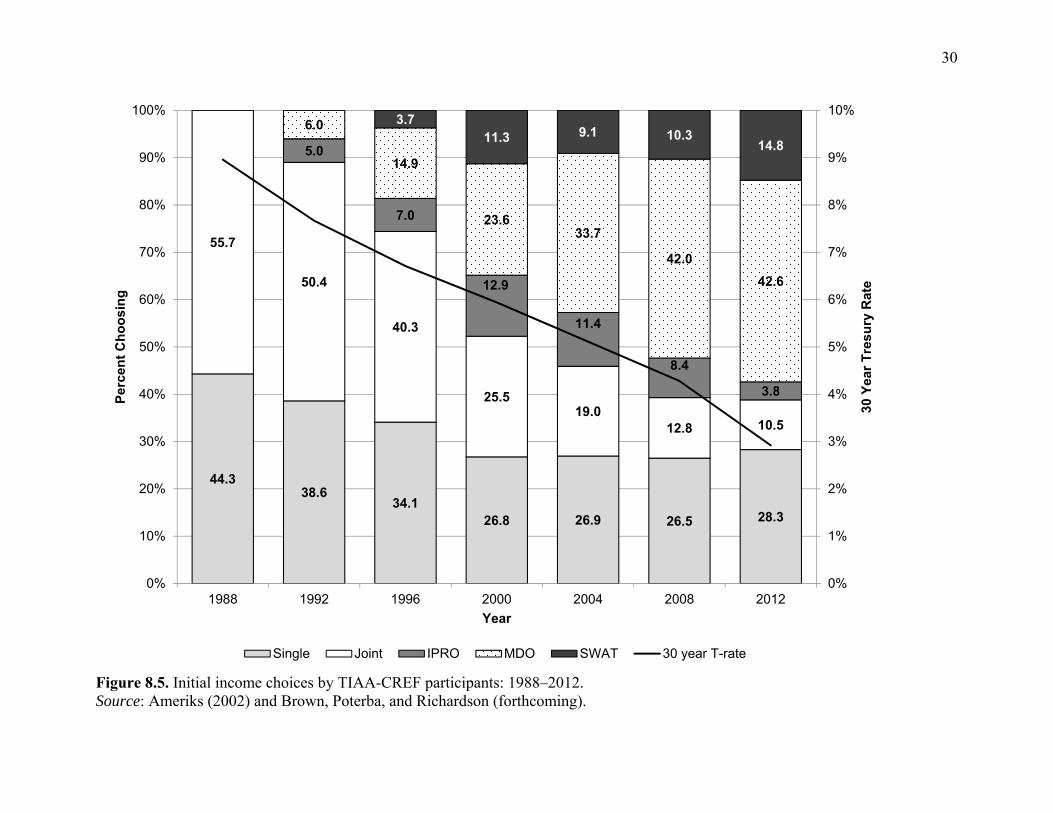
Figure 8.5 shows initial income choices by TIAA-CREF participants over the 1988–2012
period. As discussed above, 1988 was the last year that the TIAA-CREF could be considered a
true hybrid system. Among participants choosing an income stream that year, about 56 percent
opted for a joint life annuity and 44 percent a single life annuity. Over the next eight years, TIAA-
CREF expanded the distribution menu. In 1989, the Interest Payment Retirement Option (IPRO),
which allows participants to receive interest income from their TIAA asset accumulations, became
the first non-annuity payment option offered by TIAA-CREF. The Minimum Distribution Option
(MDO) was first offered in 1991 to help retirees satisfy their federally required minimum
distributions. In 1996, Systematic Withdrawals and Transfers (SWAT) were automated. Figure 8.6
shows that SWATs and MDOs in particular have become relatively popular initial distribution
choices, now accounting for over 50 percent of new income distributions. Figure 8.5 also shows
that the decline in first-time annutization rates was strongly correlated with long-term interest
rates. We also note the drop in demand for joint life relative to single life annuities. Moreover, the
demand for IPROs, in which a participant receives the interest payment from the annual crediting
rate while leaving the asset untouched, has been sensitive to declines in market interest rates. While

20
the relative demand for annuities has fallen within the TIAA-CREF system, the proportion of new
retirees annuitizing part of their retirement wealth remains high relative to experience in the
broader economy; only about 10 percent of workers leaving their job after age 65 annuitize any
assets (Burman, Johhnson, and Kobes 2004).
Insert Figure 8.5 here
Conclusions
In theory, hybrid retirement plans can combine the best features of DB and DC plans. Co-
operative pensions are designed to provide adequate risk sharing and treat different age cohorts
fairly. These plans can provide an efficient and equitable method of ensuring the retirement
security of workers. Nevertheless, few private sector workers are currently covered by these types
of plan. The TIAA-CREF system, which began in 1918 and covers millions of workers in the non-
profit sector, provides an example of how to incorporate features of hybrid co-operative pension
into a retirement plan design. The hybrid features, along with an expanded menu of investment
and distribution choices, provide participants with more flexibility. They may also result in
workers and retirees increasing their retirement risk exposure. Nevertheless, many participants
continue to customize their portfolios by including TIAA Traditional and CREF in their retirement
planning.
Particularly for a mobile work force, including hybrid products like TIAA Traditional
within a DC plan investment menu can provide greater retirement security than a plan structure
with a primary DB plan and supplemental DC plan. This is especially true for individuals who stop
working early, ‘job hop,’ and have short life expectancy. Participants who allocate part of their

21
contributions to a co-operative hybrid product will benefit from the risk pooling and full interest
experience of the annuity.
Much work remains to be done to help current and future retirees make more effective
retirement income and estate planning decisions. One area for future research is to apply lessons
from behavioral finance to retirement plan distribution design. More work is also needed to better
understand how to frame annuity choices and prices in a way that participants understand the trade-
offs and consequences of their decisions. The next generation of life-cycle products might also
incorporate hybrid features helping participants diversify risk and enhance retirement security,
both to and through retirement.

22
References
Ameriks, J. (2000). ‘Trends in TIAA-CREF Participant Premium and Asset Allocations: 1986 –
2000,’ TIAA-CREF Institute Research Dialogue 65. New York: TIAA-CREF Institute.
Ameriks, J. (2002). ‘Recent Trends in the Selection of Retirement Income Streams by TIAA-
CREF Participants,’ TIAA-CREF Institute Research Dialogue 74. New York: TIAA-CREF
Institute.
Brown, J., J. Poterba, and D. P. Richardson (forthcoming). ‘Trends in the Selection of
Retirement Income Distributions by TIAA-CREF Participants: 2002–2013.’ New York:
TIAA-CREF Institute.
Benartzi, S., A. Previtero, and R. Thaler. (2011) ‘Annuity Puzzles,’ Journal of Economic
Perspectives, 25(4): 143–164.
Benartzi, S. and R. Thaler (2007). ‘Heuristics and Biases in Retirement Savings Behavior,’
Journal of Economic Perspectives, 21(3): 81–104.
Burman, L. E., R. W. Johnson, and D. I. Kobes (2004). Annuitized Wealth at Older Ages:
Evidence from the Health and Retirement Study. Final Report to the Employee Benefits
Security Administration. Washington, D.C.: The Urban Institute.
http://www.urban.org/UploadedPDF/411000_annuitized_wealth.pdf
Greenough, W. C. (1990). It’s My Retirement Money, Take Good Care of It: The TIAA-CREF
Story. Boston, MA: Irwin.
Lusardi, A. and O. S. Mitchell (2014). ‘The Economic Importance of Financial Literacy: Theory
and Evidence,’ Journal of Economic Literature, 52(1): 5–44.

23
Richardson, D. P. (2014). ‘Trends in Premium and Asset Allocation by TIAA-CREF
Participants: 2005–2011,’ TIAA-CREF Institute Research Dialogue 112. New York: TIAA-
CREF Institute.
Rugh, J. S. (2004). ‘What Happened to TIAA-CREF Participant Premium and Asset Allocations
from 2000 to 2004?’ TIAA-CREF Institute Research Dialogue 80. New York: TIAA-CREF
Institute.
United States Department of Labor (DOL) (2013). Private Pension Plan Bulletin Historical
Tables and Graphs. Washington, DC: Employer Benefits Security Administration.
24
Endnotes
1 Department of Labor (2013) data indicate that, for private sector workers, defined contribution
(DC) plan participation first surpassed defined benefit (DB) plan participation in 1992. There were
more than twice as many total DC participants as DB participants and more than four times as
many active DC participants in 2011.
2 Benartzi and Thaler (2007) provide a good overview on how behavior biases may effect
retirement. Lusardi and Mitchell (2014) discuss the importance of financial literacy to improving
decision making.
3 Many of the institutions within the TIAA-CREF system have multiple retirement plans and the
system includes 401(a), 401(k), 403(b), 415 and 457 type plans.
4 See Greenough (1990) and the TIAA-CREF website.
5 A guaranteed interest rate of 3 percent is applied to all premiums remitted since 1979. When
declared, additional amounts remain in effect for a 12 month period beginning March 1st of each
year. Some newer contracts have an index guarantee rate that can be between 1 percent and 3
percent.
6 Previous studies by Ameriks (2000) and Rugh (2004) did not consider this a distinct asset class.
7 Or a participant may choose to transfer part of their existing stock of other retirement investment
assets into TIAA.
8 There are actually 8 versions of TIAA which differ primarily by type of retirement plan. The
versions vary by guaranteed return and liquidity of the asset. Generally, the greater the liquidity of
the account, the lower the guaranteed minimum rate of return.

25
9 A certainty period guarantees payment for a specific number of years regardless of annuitant
mortality. Because the payment can be made as a lump sum at annuitant’s death, it is akin to a
declining value term life insurance policy.
10 The length of the TPA period will depend on which version of TIAA the participant holds. The
typical transfer period is 10 payments over 9 years and 1 day. Some employers’ plans do not allow
TPAs.
11 The guarantee is determined by the 5-year Constant Maturity Treasury (CMT) less 125 basis
points with a minimum bound of 1 percent and a maximum guarantee of 3 percent.
12 This is especially true since the early 1980s.
13 $100 × 1.0310 = $134.39; 100 * 1.05 * 1.039 = 137
14 We reduce the Barclays return by 18 basis points as a proxy for bond fund expenses.
15 Participants can log into their accounts on the TIAA-CREF web site and see their current TIAA
accumulations by vintage as well as their overall average earning rate.
16 The annuity settlement crediting rate is the interest rate used, in conjunction with the mortality
rate assumption, to determine the amount of income an annuity generates.
17 ‘Contingency reserves’ are rainy day funds, and all insurers need to have some level of these
reserves. These reserves come from the spread that companies earn on the money invested.
18 The latter option is similar to a 10 year annuity certain.
19 Guaranteed minimum rates have been fairly stable through this period.
20 See Bernartzi and Thaler (2007) and Lusardi and Mitchell (2014).
21 See Bernartzi, Previtero and Thaler (2011) for a discussing of annuity puzzles.
22 See Greenough (1990) for a discussion of the creation of CREF.
23 See Ameriks (2002) for a discussion of different income distribution options.

26
Figure 8.1. TIAA Average Crediting Rates versus Consumer Price Index: 1964–2013. Source: Authors’ calculations.
-2
0
2
4
6
8
10
12
14An
nual
TIA
A C
redi
ting
Rat
e an
d C
PI
Year
TIAA CPI
27
Figure 8.2. Monthly returns to TIAA and Barclays aggregate: 1984–2013. Source: Authors’ calculations.
-4
-3
-2
-1
0
1
2
3
4
5
6M
onth
ly R
etur
n (%
)
Year
TIAA Barclays
28
Figure 8.3. TIAA monthly income per $100,000 for various cohorts. Source: Authors’ calculations.
700
800
900
1,000
1993 1996 1999 2002 2005 2008 2011 2014
Mon
thly
Ann
uity
Inco
me
per $
100,
000
($)
Year
1993 1996 1999 2002
29
Figure 8.4. Real CREF stock annuity payments for various cohorts. Source: Authors’ calculations.
0
500
1,000
1,500
2,000
2,500
3,000
3,500
4,000
1 2 3 4 5 6 7 8 9 10 11 12 13 14 15 16 17 18 19 20 21 22 23 24 25
Rea
l Ann
uity
Pay
men
t ($)
Years in Retirement
1955 1965 1975 1985
30
Figure 8.5. Initial income choices by TIAA-CREF participants: 1988–2012. Source: Ameriks (2002) and Brown, Poterba, and Richardson (forthcoming).
44.338.6
34.126.8 26.9 26.5 28.3
55.7
50.4
40.3
25.519.0
12.8 10.5
5.0
7.0
12.9
11.4
8.4
3.8
6.0
14.9
23.633.7
42.042.6
3.711.3 9.1 10.3
14.8
0%
1%
2%
3%
4%
5%
6%
7%
8%
9%
10%
0%
10%
20%
30%
40%
50%
60%
70%
80%
90%
100%
1988 1992 1996 2000 2004 2008 2012
30 Y
ear T
resu
ry R
ate
Perc
ent C
hoos
ing
Year
Single Joint IPRO MDO SWAT 30 year T-rate
31
Table 8.1. TIAA-CREF asset classes and assets under management as of December 31, 2013 Asset Class and Investment Account
Date of Inception Assets ($ mil.) % of Total
Guaranteed TIAA Traditional April 23, 1918 $259,504 43.8%
Equity CREF Stock July 1, 1952 $126,458
39.4%
CREF Global Equities March 1, 1990 $19,128CREF Growth April 29, 1994 $19,409CREF Equity Index April 29, 1994 $15,858TIAA-CREF Equity Mutual
Funds (21) October 1, 2002 $52,478Fixed Income
CREF Money Market April 1, 1988 $11,979
8.2%
CREF Bond Market March 1, 1990 $13,078CREF Inflation Linked
Bond May 1, 1997 $7,644TIAA-CREF Fixed Income
Mutual Funds (9) March 31, 2006 $16,006Real Estate
TIAA Real Estate October 2, 1995 $16,908
3.1%
TIAA-CREF Real Estate Securities Mutual Fund October 1, 2002 $1,286Multi-Asset
CREF Social Choice March 1, 1990 $13,341
5.5%
Lifecycle funds (10) October 15, 2004 $18,203
Lifestyle funds (5) December 9, 2011 $243
TIAA-CREF Managed Allocation Mutual Fund March 31, 2006 $710
Notes: All variable products reported on the SEC (net) assets reporting basis. The data sources for this table include all pension, retirement class, and institutional class mutual fund assets, and the totals are different from the following information which summarizes data for premium-paying TIAA-CREF participants in primary plans only. Source: TIAA-CREF Asset Management, authors’ calculations.

32
Table 8.2. Average returns to TIAA and Barclays aggregate as of December 31, 2013
5 years 10 years
20 years
30 years
TIAA Traditional Average Return (%) 4.5 4.3 5.9 7.4# of Negative
months 0 0 0 0Sharpe Ratio 2.0
Barclays Aggregate Bond Average Return (%) 4.3 4.4 5.6 7.5# of Negative
months 17 38 77 106Sharpe Ratio 0.3
Table 8.3. Calculating returns in the TIAA vintage system: an example
Vintage Accumulation Interest Rate (%)
2000-2007 15,555 4.252008 10,234 5.002009 9,479 4.502010-2013 12,905 3.75Total 48,173 4.32
Source: Authors’ calculations. Table 8.4. TIAA payout rates by contribution vintage
Vintage Payout Rate at Age 65 (%)
Pre-1992 9.731992–1997 7.721998–2008 7.192009–2013 6.33–7.01New Money 6.50Average Policyholder 7.60
Source: Authors’ calculations.

33
Table 8.5. Payout rates by annuity option and age (%) as of January 1, 2014.
Single Joint and 100%
No guarantee 20 year guarantee No guarantee
Age 55 Age 65 Age 75 Age 65 Ages 65
Payout Rate 5.50 6.60 8.90 6.00 5.70
Guaranteed Minimum Rate
4.10 4.90 6.40 4.70 4.30
Source: Authors’ calculations using TIAA-CREF data. Table 8.6. Asset class participation and proportion contribution: selected years. 1993 1996 1999 2002 2005 2008 2011 2013TIAA Guaranteed
100% 16.1 11.2 6.7 7.5 6.2 4.9 5.7 5.10.1–99% 65.2 56.5 48.5 54.8 56.6 49.6 41.0 34.9
Equity 100% 11.5 22.2 29.6 20.0 11.3 8.9 7.6 7.30.1–99% 65.2 61.8 55.8 61.9 67.7 62.4 53.2 46.9
Fixed Income
100% 3.8 4.2 5.4 6.8 8.9 8.2 8.6 8.20.1–99% 24.5 23.8 25.2 26.0 34.1 37.1 34.0 29.6
Real Estate 100% -- 0.0 0.1 0.2 0.4 0.4 0.3 0.60.1–99% -- 0.7 9.0 26.5 39.9 39.8 32.9 29.9
Multi-Asset 100% -- -- -- -- 1.2 10.7 20.1 27.650.1–99% -- -- -- -- 13.6 14.3 13.6 13.3
Note: Multi-asset analyses prior to 2005 included the multi-asset CREF Social Choice Fund in the Equity Class. Sources: Ameriks (2000), Rugh (2005), Richardson (2014), and authors’ calculations.


![Cap. 173] Pensions CHAPTER 173. PENSIONS. 173.pdf · Pensions, etc., to cease on bankruptcy. 14. Pensions, etc., may cease on sentence to term of imprisonment. 15. Pensions, etc.,](https://img.pdfslide.net/doc/110x75/5f32c41fe2aa25713c052446/cap-173-pensions-chapter-173-173pdf-pensions-etc-to-cease-on-bankruptcy.jpg)