Embed Size (px)
Citation preview

NATIONAL CENTER FOR EDUCATION STATISTICS
Dropout Rates inthe United States:1997
Phillip KaufmanSteve KleinMPR Associates, Inc.
Mary FraseNational Center for Education Statistics
U.S. Department of EducationOffice of Educational Research and Improvement NCES 1999–082

U.S. Department of EducationRichard W. RileySecretary
Office of Educational Research and ImprovementC. Kent McGuireAssistant Secretary
National Center for Education StatisticsPascal D. Forgione, Jr.Commissioner
The National Center for Education Statistics (NCES) is the primary federal entity for collecting,analyzing, and reporting data related to education in the United States and other nations. It fulfillsa congressional mandate to collect, collate, analyze, and report full and complete statistics on thecondition of education in the United States; conduct and publish reports and specialized analysesof the meaning and significance of such statistics; assist state and local education agencies inimproving their statistical systems; and review and report on education activities in foreigncountries.
NCES activities are designed to address high priority education data needs; provide consistent,reliable, complete, and accurate indicators of education status and trends; and report timely,useful, and high quality data to the U.S. Department of Education, the Congress, the states, othereducation policymakers, practitioners, data users, and the general public.
We strive to make our products available in a variety of formats and in language that isappropriate to a variety of audiences. You, as our customer, are the best judge of our success incommunicating information effectively. If you have any comments or suggestions about this orany other NCES product or report, we would like to hear from you. Please direct your commentsto:
National Center for Education StatisticsOffice of Educational Research and ImprovementU.S. Department of Education555 New Jersey Avenue, NWWashington, DC 20208–5651
March 1999
The NCES World Wide Web Home Page is: http://www.nces.ed.gov/pubsearch/index.html
Suggested Citation
U.S. Department of Education. National Center for Education Statistics. Dropout Rates in theUnited States, NCES 1999-082, by Phillip Kaufman, Steve Klein, and Mary Frase.
Contact:Christopher Chapman(202) 219-4182

i
FOREWORD
The National Center for Education Statistics (NCES) collects and publishes informationon the condition of education in the United States. Under mandate from the Hawkins-StaffordElementary and Secondary School Improvements Amendment of 1988 (P.L. 100–297), NCESreleased the first annual report on school dropouts in 1989. Although law no longer requires thereporting of dropout statistics, this report has been continued because of the importance ofcharting dropout behavior among America’s youth.
This report, the tenth in the series, presents data for 1997 on high school dropout rates,and examines high school completion and graduation rates. In addition to extending time seriesdata reported in earlier years, this report focuses on the characteristics of high school dropoutsand high school completers in 1997.
The report is based on the best and most current national data available at this time. Itutilizes the data from the Current Population Survey conducted by the Bureau of the Census todevelop national event and status dropout rates for young adults of various ages. As a part of anongoing effort to expand and improve data collected about dropouts, NCES initiated a dropoutstatistics collection in the 1991–92 school year as a component of the Common Core of Data;data from the fifth year of that collection are included in this report for most states. CurrentPopulation Survey data are also used to develop national and state-specific high schoolcompletion rates.
I hope the information in this report will be useful in discussions about this criticalnational issue.
Pascal D. Forgione, Jr.Commissioner of Education Statistics

ii
ACKNOWLEDGMENTS
Many individuals made substantial contributions to the preparation of this report. Thisreport was prepared under the direction of Martin Orland, Associate Commissioner for the EarlyChildhood, International and Crosscutting Studies Division.
Recognition is extended to Rosalind Bruno of the Education and Social StratificationBranch, Population Division, Bureau of the Census for providing access to CPS data on whichthis report is based. Special recognition goes to Marilyn M. McMillen, without whosecontributions as an author of the 3rd to 9th annual dropout reports this report would not bepossible. Without the efforts of Lee Hoffman and Beth Young at NCES, the CCD dropout datacollection would not continue to expand; we thank them for their hard work.
We would also like to extend our gratitude to Lisa Richards Hone and the AmericanCouncil on Education for supplying data on GED test takers and certificates issued.
Without the assistance of Martha Alt, Barbara Kridl, Leslie Retallick, and FrancescaTussing of MPR Associates, this report could not have been prepared. They provided invaluableanalytical, editorial, graphic, and production assistance.
The report was reviewed by Jeffrey Owings, Beth Young, and Marilyn M. McMillen fromNCES; Gladys Martinez from the U.S. Bureau of the Census; and Susan Kochan from theLouisiana State Department of Education. While, of course, we are responsible for any remainingflaws, their efforts and contributions are greatly appreciated.

iii
EXECUTIVE SUMMARY
This is the tenth in a series of National Center for Education Statistics reports on highschool dropout and completion rates. It presents data on rates in 1997, the most recent year forwhich data are available, and includes time series data on high school dropout and completionrates for the period 1972 through 1997. In addition to extending time series data reported inearlier years, this report examines the characteristics of high school dropouts and high schoolcompleters in 1997.
Table A—Proportion of 15- to 24-year-olds dropping out of grades 10 to 12, proportion of 16- to 24-year-oldswho were dropouts, and proportion of 18- to 24-year-olds who had completed high school, by race–ethnicity: October 1997
White, Black,Dropout and completion measures Total non-Hispanic non-Hispanic Hispanic
Percent age 15 to 24 in grades 10 to 12 dropping out, October 1996 to October 1997 4.6 3.6 5.0 9.5
Percent of youth 16 to 24 who were dropouts in 1997 11.0 7.6 13.4 25.3
Percent of youth 18 to 24 who were high school completers in 1997* 85.9 90.5 82.0 66.7
* Excludes those still enrolled in high school.
SOURCE: U.S. Department of Commerce, Bureau of the Census, Current Population Survey, October 1997, unpublished data.
Event Dropout Rates
Event dropout rates for 1997 describe the proportion of youths ages 15 through 24 yearswho dropped out of grades 10 to 12 in the 12 months preceding October 1997. Demographic datacollected in the Current Population Survey (CPS) permit event dropout rates to be calculatedacross a variety of individual characteristics, including race, sex, region of residence, and incomelevel.
• About five out of every 100 young adults enrolled in high school in 1996 left schoolbefore October of 1997 without successfully completing a high school program. Thisestimate of 4.6 percent was similar to those reported over the last 10 years, but lowerthan in the early 1970s (table A, figure A, and table 1).

iv
Figure A—Proportion of 15- to 24-year-olds dropping out of grades 10 to 12, proportion of 16- to 24-year-olds who were dropouts, and proportion of 18- to 24-year-olds who had completed high school:October 1972 to October 1997
SOURCE: U.S. Department of Commerce, Bureau of the Census, Current Population Survey, October (various years).

v
• Hispanic students were more likely than white and black students to leave schoolshort of completing a high school program: in 1997, 9.5 percent of Hispanics wereevent dropouts, compared with 3.6 percent of white and 5.0 percent of black students.Event dropout rates were not significantly different between white and black students(table 1).
• In 1997, young adults living in families with incomes in the lowest 20 percent of allfamily incomes were nearly 7 times as likely as their peers from families in the top 20percent of the income distribution to drop out of high school (table 1).
• Students who remain in high school longer than the majority of their age cohortdropped out at higher rates than their younger peers (table 1).
• Although dropout rates were highest among students age 19 or older, about two-thirds(69 percent) of the current year dropouts were ages 15 through 18; moreover, 35percent of the 1997 dropouts were 15 through 17 years of age (table 1).
Status Dropout Rates
Over the last decade, between 300 and 500 thousand 10th- through 12th-grade studentsleft school each year without successfully completing a high school program. Each year some ofthese young adults return to school or an alternative certification program, and others pass out ofthis age group. Status dropout rates represent the proportion of young adults ages 16 through 24who are out of school and who have not earned a high school credential.
• In October of 1997, some 3.6 million young adults were not enrolled in a high schoolprogram and had not completed high school. These youths accounted for 11.0 percentof the 33 million 16- through 24-year-olds in the United States in 1997 (table A,figure A, and table 3). As noted with event rates, this estimate is consistent with thosereported over the last 10 years, but lower than in the early 1970s.
• Status dropout rates of whites remain lower than for blacks, but over the past quartercentury the difference between blacks and whites has narrowed (figure 2).
• Hispanic young adults in the United States continue to have higher status dropoutrates than either whites or blacks (figure 2). In 1997, 25.3 percent of Hispanic youngadults were status dropouts, compared to 13.4 percent of blacks and 7.6 percent ofwhites (table 3).
• Thirty-nine percent of Hispanic young adults born outside the 50 states and theDistrict of Columbia were high school dropouts. Although the dropout rates ofHispanics born in the United States were lower, they were higher than the dropoutrates of non-Hispanics born in the United States (table 3).

vi
High School Completion Rates
The high school completion rate represents the proportion of 18- to 24-year olds whohave completed a high school diploma or an equivalent credential, including a GeneralEducational Development (GED) credential.
• In 1997, about 86 percent of all 18- through 24-year-olds, not enrolled in school, hadcompleted high schoola slight increase since the early 1970s (table A, figure A, andtable 4).
• The high school completion rate has increased for white and black young adults sincethe early 1970s, with 1997 rates of 90.5 percent for whites and 82.0 percent forblacks. Hispanic young adults have not shared in this improvement, with 66.7 percentreported as having completed high school in 1997 (figure 3 and table 4).
Method of High School Completion
Most young adults complete a regular diploma and graduate from high school; otherscomplete high school by an alternative route, such as by passing the General EducationalDevelopment (GED) test.
• During the 1990s the percent of young adults, not enrolled in school, holding a highschool credential has remained relatively unchanged; however the percent holding analternative certification increased from 4.9 percent in 1990 to 9.1 percent in 1997, andthe percent holding regular diplomas decreased by a similar amount (table 6).

vii
TABLE OF CONTENTS
Page
Foreword .......................................................................................................................................... iAcknowledgments........................................................................................................................... iiExecutive Summary ....................................................................................................................... iiiTable of Contents ..........................................................................................................................viiList of Tables................................................................................................................................viiiList of Figures ................................................................................................................................ ix
Introduction ................................................................................................................................... 1
Event, Status, and Cohort Dropout Rates................................................................................... 2Types of Dropout Rates............................................................................................................. 2Event Dropout Rates ................................................................................................................. 2
Income................................................................................................................................ 5Race–Ethnicity .................................................................................................................... 6Age and Sex ........................................................................................................................ 6Region and State.................................................................................................................. 7
Status Dropout Rates................................................................................................................. 9Race–Ethnicity .................................................................................................................. 10Hispanic Dropout Rates .................................................................................................... 12Age and Sex ...................................................................................................................... 12Region ............................................................................................................................... 13
High School Completion Rates................................................................................................... 14Completion Rates .................................................................................................................... 15
Race–Ethnicity .................................................................................................................. 15Age and Sex ...................................................................................................................... 17Region and State................................................................................................................ 17
Method of High School Completion ....................................................................................... 19
Conclusions.................................................................................................................................. 22
AppendicesA Standard Error and Time Series Tables.......................................................................... 23B Supplemental Tables ...................................................................................................... 39C Technical Notes.............................................................................................................. 50

viii
LIST OF TABLES
Table Page
A Proportion of 15- to 24-year-olds dropping out of grades 10 to 12, proportion of16- to 24-year-olds who were dropouts, and proportion of 18- to 24-year-olds who hadcompleted high school, by race–ethnicity: October 1997 .................................................. iii
1 Event dropout rates and number and distribution of dropouts for grades 10–12, ages 15–24, by background characteristics: October 1997 ............................................................... 3
2 Event dropout rates for grades 9–12, by state: 1993–94, 1994–95, and 1995–96 .............. 8
3 Rate, number, and distribution of status dropouts, ages 16–24, by backgroundcharacteristics: October 1997 ............................................................................................ 11
4 Completion rates and number and distribution of completers, ages 18–24, not currentlyenrolled in high school or below, by background characteristics: October 1997.............. 16
5 High school completion rates of 18- through 24-year-olds not currently enrolled in highschool or below, by state: October 1989–91, 1992–94 and 1995–97 ............................... 18
6 High school completion rates and method of completion of 18- through 24-year-oldsnot currently enrolled in high school or below: October 1988 through October 1997 ..... 20

ix
LIST OF FIGURES
Figure Page
A Proportion of 15- to 24-year-olds dropping out of grades 10 to 12, proportion of 16- to24-year-olds who were dropouts, and proportion of 18- to 24-year-olds who hadcompleted high school: October 1972 to October 1997..................................................... iv
1 Event dropout rates for grades 10–12, ages 15–24, by family income: October 1972through October 1997.......................................................................................................... 4
2 Status dropout rates, ages 16–24, by race–ethnicity: October 1972 through October1997..................................................................................................................................... 9
3 Completion rates, ages 18–24 not currently enrolled in high school or below, by race–ethnicity: October 1972 through October 1997................................................................. 14

1
INTRODUCTION
The economic consequences of leaving high school without a diploma are severe.On average, dropouts are more likely to be unemployed than high school graduates and toearn less money when they eventually secure work.1 High school dropouts are also morelikely to receive public assistance than high school graduates who do not go on to college.2
This increased reliance on public assistance is likely due, at least in part, to the fact thatyoung women who drop out of school are more likely to have children at younger ages andare more likely to be single parents.3 The individual stresses and frustrations associated withdropping out have social implications as well: dropouts comprise a disproportionatepercentage of the nation’s prison and death row inmates.4
Secondary schools in today’s society are faced with the challenge of increasingcurricular rigor to strengthen the knowledge base of high school graduates, while at the sametime increasing the proportion of all students who successfully complete a high schoolprogram. Monitoring high school dropout and completion rates provides one measure ofprogress in meeting these goals.
This is the tenth annual dropout report from the National Center for EducationStatistics (NCES). This report spans the 25-year time period from 1972 through 1997, andfocuses primarily on updates to annual time series data. Data from the October 1997 CurrentPopulation Survey (CPS) of the U.S. Bureau of the Census are used to compute national highschool dropout and completion rates and rates by background characteristics, such as sex,race–ethnicity, family income, and region of the country. State-level data from the CPS areused to produce estimates of high school completion rates by state. In addition, NCES datafrom the Common Core of Data (CCD) are used to provide estimates of dropout rates by statefor many states.
1U.S. Department of Education, National Center for Education Statistics, The Condition of Education 1998, NCES 98-013,Washington, D.C.: U.S. Government Printing Office, 1998, Indicators 31 and 32.2U.S. Department of Education, National Center for Education Statistics, The Condition of Education 1996, NCES 96-304,Washington, D.C.: U.S. Government Printing Office, 1996, Indicator 36.3U.S. Department of Education, National Center for Education Statistics, Dropout Rates in the United States: 1994, NCES96-863, by M. McMillen and P. Kaufman, Washington, D.C.: U.S. Government Printing Office, 1996.4Estimates indicate that one quarter of Federal and one half of state prison inmates are high school dropouts. See U.S.Department of Justice, Office of Justice Programs, Bureau of Justice Statistics, Comparing Federal and State PrisonInmates, 1991, NCJ-145864, by C.W. Harlow, Washington, D.C.: U.S. Government Printing Office, September 1994.

2
EVENT, STATUS, AND COHORT DROPOUT RATES
Event, status, and cohort dropout rates each provide a different perspective on thestudent dropout population. The National Center for Education Statistics presents definitionsand data for all three types of dropout rates in order to provide a fuller profile of the dropoutproblem in the United States. High school graduation and completion rates conclude theprofile of high school outcomes for young adults in the United States.
Types of Dropout Rates
• Event rates describe the proportion of students who leave school each year withoutcompleting a high school program. This annual measure of recent dropoutoccurrences provides important information about how effective educators are inkeeping students enrolled in school.
• Status rates provide cumulative data on dropouts among all young adults within aspecified age range. Status rates are higher than event rates because they include alldropouts, regardless of when they last attended school. Since status rates reveal theextent of the dropout problem in the population, this rate also can be used to estimatethe need for further education and training designed to help dropouts participate fullyin the economy and life of the nation.
• Cohort rates measure what happens to a group of students over a period of time. Thisrate is based on repeated measures of a cohort of students with shared experiences andreveals how many students starting in a specific grade drop out over time. Typically,data from longitudinal studies provide more background and contextual informationon the students who drop out than are available through the CPS or CCD datacollections.5
Event Dropout Rates
Event rates calculated using the October 1997 CPS data measure the proportion ofstudents who dropped out between October 1996 and October 1997.6 These dropouts are 15-
5Cohort data are available only sporadically. The most recent information available is from the August 1994 Third Follow-up of the National Education Longitudinal Study of 1988, which contains data on a cohort of the eighth-grade class of 1988.These data were previously reported in U.S. Department of Education, National Center for Education Statistics, DropoutRates in the United States: 1996, NCES 98-250, by M. McMillen and P. Kaufman, Washington D.C.: U.S. GovernmentPrinting Office, 1998, and can be found in Appendix B, tables B7 to B10.6Specifically, the numerator of the event rate for 1997 is the number of persons 15 through 24 years old surveyed in 1997who were enrolled in high school in October of 1996, were not enrolled in October of 1997, and also did not complete highschool (i.e., had not received a high school diploma or an equivalency certificate) between October 1996 and October 1997.The denominator of the event rate is the sum of the dropouts (i.e., the numerator) and the number of all persons 15 through24 years old who attended grades 10 through 12 in 1996 and were still enrolled in 1997 or had graduated or completed highschool.

3
Table 1—Event dropout rates and number and distribution of dropouts for grades 10–12, ages 15–24, bybackground characteristics: October 1997
Event Number ofdropout event Population Percent Percent
rate dropouts enrolled of all ofCharacteristics (percent) (thousands) (thousands) dropouts population
Total 4.6 454 9,984 100.0 100.0
Sex Male 5.0 251 5,031 55.3 50.4 Female 4.1 203 4,953 44.7 49.6 Race–ethnicity1
White, non-Hispanic 3.6 243 6,710 53.4 67.2 Black, non-Hispanic 5.0 77 1,528 16.9 15.3 Hispanic 9.5 119 1,251 26.3 12.5
Family income2
Low 12.3 172 1,390 37.8 13.9 Middle 4.1 229 5,596 50.5 56.1 High 1.8 53 2,998 11.7 30.0
Age3
15 to 16 2.7 74 2,750 16.2 27.5 17 2.4 85 3,545 18.7 35.5 18 5.9 154 2,617 33.8 26.2 19 10.2 86 839 18.9 8.4 20 to 24 24.2 56 233 12.4 2.3
Region Northeast 3.5 64 1,813 14.0 18.2 Midwest 4.0 101 2,508 22.2 25.1 South 4.0 133 3,299 29.3 33.0 West 6.6 157 2,363 34.5 23.71Due to relatively small sample sizes, American Indian/Alaskan Natives and Asian/Pacific Islanders are included in the totalbut are not shown separately.2Low income is defined as the bottom 20 percent of all family incomes for 1997; middle income is between 20 and 80percent of all family incomes; and high income is the top 20 percent of all family incomes. See Appendix C of this report fora full definition of family income.3Age when a person dropped out may be one year younger, because the dropout event could occur at any time over a 12-month period.
NOTE: Because of rounding, details may not add to totals.
SOURCE: U.S. Department of Commerce, Bureau of the Census, Current Population Survey, October 1997, unpublisheddata.

4
through 24-year-olds who were enrolled in high school in October of 1996, but had notcompleted high school and were not enrolled in grades 10 through 12 a year later. In thisdefinition, a young person could complete high school by either earning a high schooldiploma or receiving an alternative credential such as a GED. By October 1997, 5 out ofevery 100 young adults (4.6 percent) enrolled in high school in October 1996 were not inschool and had not successfully completed a high school program (table 1).7
Over the past quarter century, annual estimates of the event dropout rate havefluctuated between 4.0 and 6.7 percent (figure 1 and table A9), but overall there has been adownward trend in event dropout rates over the entire period, from 6.1 percent in 1972 to 4.6percent in 1997.8 The percentage of young adults who left school each year withoutsuccessfully completing a high school program decreased from 1972 through 1987.
Figure 1—Event dropout rates for grades 10–12, ages 15–24, by family income: October 1972 throughOctober 1997
NOTE: Data on family income are missing for 1974.
SOURCE: U.S. Department of Commerce, Bureau of the Census, Current Population Survey, October (various years),unpublished data.
7Standard errors for all tables and figures are provided in Appendix A.8The statistical significance of these comparisons was assessed with Student’s t-test with a Bonferroni correction formultiple comparisons. Time trends noted in this report were assessed using weighted least squares regressions. For a fulldiscussion of the statistical methods used in this report, see Appendix C. All comparisons in this report are statisticallysignificant at the α = 0.05 level.

5
Despite year-to-year fluctuations, the percentage of students dropping out of schooleach year has neither increased nor decreased since 1987. Changes in data collection andestimation procedures coincided with an increase in the rates from 1991 through 1995 (seeAppendix C). However, the 1997 rate of 4.6 percent was similar to the 1991 rate, and overthe entire period from 1991 to 1997, there was no consistent upward or downward trend inevent rates.
Income
The Current Population Survey includes family income data that can be used toprovide information about the relationship between socioeconomic background and thedecisions of young adults to drop out of school. Of course the range of factors that may affectyoung adults’ life decisions extend beyond the economic conditions associated with familyincome; however, in the absence of additional measures, family income serves as a goodindicator for the other social and economic factors that are likely to be related to a youngadult’s decision to stay in school.9
In 1997, 12.3 percent of students from families in the lowest 20 percent of the incomedistribution dropped out of high school; by way of comparison, 4.1 percent in the middle 60percent of the income distribution dropped out, and 1.8 percent of students from familieswith incomes in the top 20 percent dropped out (table 1).
Since the mid-1970s, there has been a downward trend in the annual estimates of theevent dropout rate for young adults living in families of all income levels (figure 1).Specifically, between 1975 and 1997 annual event dropout rates fell by 3.4 percentage pointsfor low income individuals, by 1.9 percentage points for middle income, and 0.8 percentagepoints for high income individuals (table A9).
The declines in dropout rates for all income groups occurred in the 1970s and 1980s.Event dropout rates for all income groups stabilized in the 1990s. For example, event dropoutrates for low income youth approached 10 percent in 1989 and 1990; since 1990, dropoutrates have fluctuated between 11 and 13 percent. Event rates for young adults living inmiddle and high income families have also shown no upward or downward trend since 1990.
Income is only one of a number of closely linked factors that may be related to astudent’s decision to drop out of school: others include race–ethnicity, age, sex, andgeographic region of residence. Analyses of all of the specific interactions among interveningvariables that mediate the dropout decision are beyond the scope of this report. Instead, this
9The variable used to assess family income is from a single question asked of the household respondent in the October CPS.In some cases, a 15- to 24-year-old is unrelated to the household head or is the head of the household (or spouse/companionof the head) themselves. Because family income for a 15- to 24-year-old is defined as the current household income of thefamily of the household respondent, reported incomes may not reflect the family background of all youth. See Appendix Cfor a more detailed discussion.

6
report reviews some of the primary factors that are associated with higher event dropoutrates.10
Race–Ethnicity
The 1997 CPS data are consistent with earlier reports of a strong association betweenrace–ethnicity and the likelihood of dropping out of school. In particular, cohort studies ofnational longitudinal data for American high school students, such as the High School andBeyond survey sponsored by NCES, show that Hispanics and blacks are at greater risk ofdropping out than whites, with Hispanics at a greater risk of dropping out than either white orblack students.11 More recently, analyses of data from the NCES National EducationLongitudinal Study, and analyses reported by the President’s Advisory Commission onEducational Excellence for Hispanic Americans also confirm these patterns.12
Data from the October 1997 CPS repeat this pattern for Hispanics, showing an eventdropout rate of 9.5 percent for Hispanic students that is higher than the rate of 3.6 percent forwhite students and 5.0 percent for black students (table 1). However, event dropout rateswere not significantly different between white and black students.13
Age and Sex
In October of 1997, about 1 out of every 10 youths ages 15 through 24 who had beenenrolled in school a year earlier was over age 18, but dropouts from this older group ofstudents accounted for 3 out of every 10 high school dropouts in 1997. Thus, students whopursue a high school program beyond the traditional ages are at an increased risk of droppingout of school (table 1). Event dropout rates for younger enrollees are substantially lower (forexample, 2.7 percent for 15- and 16-year-olds and 2.4 percent for 17-year-olds versus 5.9 for18-year-olds, 10.2 for 19-year-olds, and 24.2 for 20- to 24-years-olds).
Although dropout rates were highest among students age 19 or older, about two-thirds(69 percent) of the current year dropouts were ages 15 through 18 (table 1). About one-third(35 percent) of all young adults who left school between October of 1996 and October of 10For coverage on the interaction of dropout rates with other factors, the interested reader is referred to G. Natriello, (Ed.),School Dropouts: Patterns and Policies. New York: Teachers College Press, 1987. For an ethnographic depiction of thesefactors at work, see M. Fine, Framing Dropouts, New York: State University of New York Press, 1991.11See R. Ekstron, M. Goertz, J. Pollack and D. Rock, “Who Drops Out of High School and Why? Findings from a NationalStudy,” in School Dropouts: Patterns and Policies, G. Natriello (Ed.), New York: Teachers College Press, 1987, pg. 52–69.For dropout data using the High School and Beyond Study, see tables B9 and B10, and U.S. Department of Education,National Center for Education Statistics, Dropout Rates in the United States: 1994, NCES 96-863, by M. McMillen and P.Kaufman, Washington, D.C.: U.S. Government Printing Office, 1996.12U.S. Department of Education, National Center for Education Statistics, Dropout Rates in the United States: 1994, NCES96-863, by M. McMillen and P. Kaufman, Washington, D.C.: U.S. Government Printing Office, 1996; and President’sAdvisory Commission on Educational Excellence for Hispanic Americans, Our Nation on the Fault Line: HispanicAmerican Education, Washington, D.C.: U.S. Government Printing Office, 1996.13While these differences appear to be relatively large, they are not statistically significant at the 0.05 level due to relativelylarge standard errors.

7
1997 were ages 15, 16, and 17 in October of 1997. These youths left school short of thetypical age of normal school completion. Understanding why these younger students chooseto leave school early is an important issue to investigate.
The event dropout rates for male and female students were similar in 1997.
Region and State
Event dropout rates in the West were higher than in any other region of the country.For example, 6.6 percent of all young adults living in the Western United States left schoolwithout completing their education in 1997, compared to 3.5 percent of youth living in theNortheast (table 1).
For the past five years, the Common Core of Data (CCD) universe collection at NCEShas included a dropout component in the agency level nonfiscal data collection. CurrentlyNCES, through the National Cooperative for Elementary and Secondary Statistics and theCCD collection, is working with states and school districts to develop this national databaseof public school dropout rates. The number of participating states that report using consistentdata definitions and collection procedures has increased from 14 states in the 1991–92 schoolyear to 25 states in the 1993–94 school year to 29 states plus Puerto Rico for the 1995–96school year. Once all states are participating fully in this data collection, event data for sex,race–ethnicity, and for grades 7 through 12 will be aggregated at the state and national levels.
In the 1996–97 school year collection, 47 states plus Puerto Rico submitted data toCCD for dropouts from the 1995–96 school year. Data from 29 states and Puerto Rico metthe quality and comparability levels necessary for publishing state level estimates that supportvalid cross-state comparisons. The middle case, or median, of the dropout rates for thesejurisdictions was 4.6 percent, found by taking the average of Nebraska and Rhode Island,with rates ranging from 1.5 percent in Puerto Rico to 11.6 percent in Louisiana (table 2).

8
Table 2—Event dropout rates for grades 9–12, by state: 1993–94, 1994–95, and 1995–96
State 1993–94 1994–95 1995–96
Alabama 5.8 6.2 5.6Arkansas 5.3 4.9 4.1California 5.3 4.4 3.9Connecticut 4.9 5.0 4.8Delaware 4.6 4.6 4.5District of Columbia 9.6 10.6 Georgia 8.7 9.0 8.5Hawaii 5.1 4.9 4.7Indiana 4.6 3.5Iowa 3.2 3.5 3.1Kansas 5.0 5.1 4.7Louisiana 4.7 3.5 11.6*Maine 3.1 3.4 3.1Massachusetts 3.7 3.6 3.3Minnesota 5.1 5.2 5.3Mississippi 6.1 6.4 6.2Missouri 7.1 7.1 6.6Montana 5.6Nebraska 4.6 4.5 4.5Nevada 9.8 10.3 9.6New Mexico 8.1 8.5 New York 4.0 4.1 3.7North Dakota 2.7 2.5 2.5Ohio 5.3 5.4Oregon 7.3 7.1 7.0Pennsylvania 3.8 4.1 4.0Rhode Island 4.9 4.6 4.6South Carolina 2.9Texas 3.7 2.7 Utah 3.6 4.4West Virginia 4.2 3.8Wyoming 6.7 5.7Puerto Rico 1.5
Data not available.
* Effective with the 1995–96 school year, Louisiana changed its dropout data collection from school-level aggregate countsreported to districts to an individual, student-record system. The increase in the dropout rate is due in part to the increasedability to track students.
NOTE: All states except for the District of Columbia, New Hampshire, New Jersey, and Washington reported 1995–96 data.However, among the 47 states and Puerto Rico that reported dropouts, 29 states and Puerto Rico said they adhered exactlyto the standard definition and collection procedures.
SOURCE: National Center for Education Statistics, Common Core of Data, Public Elementary/Secondary Agency UniverseSurvey (various years).

9
Status Dropout Rates
The cumulative effect of hundreds of thousands of young adults leaving school eachyear without successfully completing a high school program translates into several millionyoung adults who are out of school but lacking a high school credential. Each year over thelast decade this number has exceeded 3 million.14 In October of 1997 there were 3.6 million16- through 24-year-olds who were not enrolled in a high school program and had notcompleted high school (table 3). Overall, 11.0 percent of the 33 million 16- through 24-year-olds in the U.S. in 1997 were in this group. As noted with event rates, this estimate isconsistent with those reported over the last 10 years, but lower than in the early 1970s.
Figure 2—Status dropout rates, ages 16–24, by race–ethnicity: October 1972 through October 1997
SOURCE: U.S. Department of Commerce, Bureau of the Census, Current Population Survey, October (various years),unpublished data.
14For data from 1988–1996, see U.S. Department of Education. National Center for Education Statistics. Dropout Rates inthe United States: 1991, NCES 92-129, by P. Kaufman, M. McMillen and D. Bradby. Washington, D.C.: U.S. GovernmentPrinting Office, 1992; and Appendix B, table B5.

10
Race–Ethnicity
Over the past quarter century, the status dropout rates for white young adults havepersisted at levels lower than the rates observed for either black or Hispanic young adults(figure 2 and table A11). However, over the time period, the percentages of white and blackyoung adults out of school without a high school credential have declined by nearly 40percent in each group. Since the dropout rates for black young adults have been higher thanthose for white young adults, the comparable rates of change have resulted in a narrowing ofthe gap between the rates for blacks and whites.
The percentage of Hispanic young adults out of school without a high schoolcredential has remained higher than that of blacks and whites in every year throughout this25-year time period.15 During this period, when immigration patterns contributed tosubstantial changes in the size and composition of the Hispanic population, the status dropoutrates for Hispanic young adults did not decline. Over most of the last 25 years, close to one-third of the 16- through 24-year-old Hispanics in the United States were reported as out ofschool and lacking a high school credential.16
Overall, 7.6 percent of white young adults ages 16 through 24 were out of schoolwithout a high school credential in 1997, accounting for 1.7 million of the 3.6 milliondropouts (table 3). Even though whites were relatively less likely to be status dropouts in1997 than black and Hispanic young adults, whites comprised the largest group of statusdropouts (45.7 percent).
While Hispanics and blacks represented similar proportions of the young adultpopulation (14.1 percent vs. 14.7 percent, respectively), Hispanics were disproportionallyrepresented among status dropouts in 1997. A total of 1.2 million Hispanics were dropouts in1997, accounting for 25.3 percent of all Hispanic young adults in this age group. Incomparison, 0.6 million black young adults, or 13.4 percent of the total black population of16- through 24-year-olds, were dropouts in the corresponding period.
15See for example, G. Brown, N. Rose, S. Hill, and M. Olivas, The Condition of Education for Hispanic Americans,Washington, D.C.: U.S. Department of Education, 1980; U.S. Department of Education, Office of Bilingual Education andMinority Language Affairs, An Analysis of Language Minority and Limited English Proficient Students from NELS:88, byF. Bennici and W. Strang, Washington, D.C: U.S. Government Printing Office, August 1995; U.S. Department ofEducation, Characteristics of Secondary-School-Age Language Minority and Limited English Proficient Youth, by W.Strang, M. Winglee and J. Stunkard, Washington, D.C.: U.S. Government Printing Office, 1993; U.S. Department ofEducation. National Center for Education Statistics, Dropout Rates in the United States: 1990, NCES 91-053, by P.Kaufman and M. McMillen, Washington, D.C.: U.S. Government Printing Office, 1991; and, U.S. Department ofEducation. National Center for Education Statistics, Dropout Rates in the United States: 1996, NCES 98-250, by P.Kaufman and M. McMillen, Washington, D.C.: U.S. Government Printing Office, 1998.16The erratic nature of the Hispanic status rate reflects, in part, the small sample size of Hispanics in CPS. The status rate forHispanics of 25.3 percent in 1997 was not significantly lower than the rate for Hispanics in any year between 1992 and1996.

11
Table 3—Rate, number, and distribution of status dropouts, ages 16–24, by background characteristics:October 1997
Status Number ofdropout status Percent Percent
rate dropouts Population of all ofCharacteristics (percent) (thousands) (thousands) dropouts population
Total 11.0 3,624 32,960 100.0 100.0
Sex Male 11.9 1,970 16,619 54.4 50.4 Female 10.1 1,654 16,341 45.6 49.6
Race–ethnicity1
White, non-Hispanic 7.6 1,656 21,800 45.7 66.1 Black, non-Hispanic 13.4 649 4,847 17.9 14.7 Hispanic 25.3 1,180 4,660 32.6 14.1
Age 16 4.0 160 3,951 4.4 12.0 17 5.6 227 4,042 6.3 12.3 18 12.4 468 3,776 12.9 11.5 19 15.3 570 3,728 15.7 11.3 20 to 24 12.6 2,198 17,463 60.7 53.0
Recency of immigration Born outside the 50 states and the District of Columbia Hispanic 38.6 725 1,877 20.0 5.7 Non-Hispanic 7.8 143 1,826 3.9 5.5 First generation2
Hispanic 15.4 250 1,624 6.9 4.9 Non-Hispanic 5.0 87 1,747 2.4 5.3 Second generation or more3
Hispanic 17.7 205 1,159 5.7 3.5 Non-Hispanic 9.0 2,214 24,731 61.1 75.0
Region Northeast 10.5 623 5,947 17.2 18.0 Midwest 8.8 693 7,855 19.1 23.8 South 11.7 1,350 11,488 37.2 34.9 West 12.5 959 7,669 26.5 23.31Due to relatively small sample sizes, American Indian/Alaskan Natives and Asian/Pacific Islanders are included in the totalbut are not shown separately.2Individuals defined as first generation were born in the 50 states or the District of Columbia and have one or both parentsborn outside the 50 states and the District of Columbia.3Individuals defined as second generation or more were born in the 50 states or the District of Columbia and have bothparents born in the 50 states or the District of Columbia.
NOTE: Because of rounding, details may not add to totals.
SOURCE: U.S. Department of Commerce, Bureau of the Census, Current Population Survey, October 1997, unpublisheddata.

12
Hispanic Dropout Rates
High Hispanic dropout rates are attributable, in part, to relatively greater dropout ratesamong Hispanic immigrants. Data from the 1997 CPS appear to substantiate earlier findings(table 3).17 In fact, the status dropout rate of 38.6 percent for Hispanic 16- through 24-year-olds born outside the 50 states and the District of Columbia was at least double the rates of15.4 percent registered for Hispanic youths born in the United States with at least one or bothparents born outside the United States, and 17.7 percent for Hispanic youths with bothparents born in the United States.18
Dropout rates for Hispanic youths born in the U.S. are lower than the dropout rates forHispanic youths born outside the U.S. However, regardless of place of birth, Hispanic youngadults are more likely to be dropouts than their non-Hispanic peers.
Data from 1995 show that over half of the foreign-born Hispanic youths who weredropouts had never enrolled in a U.S. school, and 80 percent of these young adults werereported as either speaking English “not well” or “not at all.”19 Some of the young Hispanicimmigrants who do not enroll in school in the U.S. may have entered the U.S. beyond what isconsidered “normal” high school age, and some may have come to the U.S. in search ofemployment rather than education. But the data also suggest that language may be a barrier toparticipation in U.S. schools. Regardless of the reasons, for the large proportion of Hispanicyoung adults not having a high school credential, the impact is the same; whether they wereborn in the 50 states and the District of Columbia or elsewhere and whether or not theyenrolled in U.S. schools, these young adults probably do not have the basic level of educationthought to be essential in today’s economy.
Age and Sex
As might be expected, young adults of high school age registered among the loweststatus dropout rates, presumably because many of these individuals were still enrolled inschool and pursuing a high school diploma.
Data on status dropout rates indicate that males were more likely to be status dropoutsthan females in 1997. Although males and females are relatively equally represented in the 17U.S. Department of Education, National Center for Education Statistics, Dropout Rates in the United States: 1995, NCES97-473, by M. McMillen, P. Kaufman and S. Klein, Washington, D.C.: U.S. Government Printing Office, 1997.18For the sake of simplicity, the terms “foreign born” and “born outside the United States” are used in the text to refer toanyone born outside the 50 states and the District of Columbia and the term “born in the United States” is used to refer topersons born within the 50 states and the District of Columbia. People born in Puerto Rico and the territories, although U.S.citizens, are grouped with those born in other countries. Because of issues related to language and schooling and becauseCPS does not cover the outlying areas, individuals born in Puerto Rico and the U.S. territories are distinguished from thoseborn in the 50 states and D.C.19See tables 16 and 20, U.S. Department of Education, National Center for Education Statistics, Dropout Rates in the UnitedStates: 1995, NCES 97-473, by M. McMillen, P. Kaufman and S. Klein, Washington, D.C.: U.S. Government PrintingOffice, 1997. The English-speaking ability is based on the reports of a household respondent rather than reports from eachindividual in the household. These data on the ability in speak English are limited to young adults who were reported asspeaking Spanish at home.

13
population of young adults ages 16 to 24 years of age, males comprised a greater percentageof all status dropouts: in 1997, 54 percent of all status dropouts were male, compared to 46percent of all females.
Region
Status dropout rates in the Midwest were significantly lower than those in the Southand West. Moreover, while young adults living in the Midwest region of the countrycomprised roughly 24 percent of the population of the United States, 19 percent of alldropouts resided in this region. In contrast, while young adults living in the West made up 23percent of the total population, nearly 27 percent of all dropouts lived in this region. Thepercentage of status dropouts living in the Northeast and South were similar to theirrepresentation in the overall population.

14
HIGH SCHOOL COMPLETION RATES
The relative importance of a high school education has changed dramatically over thelast half century in the United States. When the grandparents of today’s high school studentsentered adulthood, a high school education was an asset in the labor force, held by about halfof the population ages 25 through 29 in 1950.20 By the early 1970s, when the parents oftoday’s high school students entered the work force, about 83 to 84 percent of the populationages 18 through 24 not enrolled in high school had completed a high school education (figure3 and table A13). At that point in time, a high school education still served as an entryway toa number of promising career paths. Now, a quarter of a century later, technological advancesin the workplace have increased the demand for a skilled labor force to the point where a highschool education serves more as a minimum requirement for entry to the labor force. Thecompletion of a high school education is now even more essential as a basis for entry bothinto additional education and training or into the labor force.
Figure 3—Completion rates, ages 18–24 not currently enrolled in high school or below, by race–ethnicity:October 1972 through October 1997
SOURCE: U.S Department of Commerce, Bureau of the Census, Current Population Survey, October (various years),unpublished data.
20U.S. Department of Education, National Center for Education Statistics, Digest of Education Statistics: 1996, NCES 96-133. Washington, D.C.: U.S. Government Printing Office, 1996.

15
Completion Rates
The high school completion rate represents the proportion of 18- to 24-year oldswho have completed a high school diploma or an equivalent credential, including a GeneralEducational Development (GED) credential.21 Despite the increased importance of a highschool education, the high school completion rate for the country has increased slightly overthe last quarter century. Between 1972 and 1985, high school completion rates climbed by2.6 percentage points (from 82.8 percent in 1972 to 85.4 percent in 1985); since 1985, therate has fluctuated around 85 and 86 percent. This net increase of about 3 percentage pointsover 25 years represents slow progress toward the national goal of a 90 percent high schoolcompletion rate.
Race–Ethnicity
High school completion rates analyzed within each racial–ethnic group showsomewhat similar patterns (figure 3 and table A13). Whites exhibited a positive trend in highschool completion over the last quarter-century, although rates appear to have stabilizedsomewhat in the last decade. Specifically, the high school completion rate climbed fromabout 86 percent in the early 1970s to about 90 percent in the 1990s. Since 1990, whitecompletion rates have fluctuated around 90 percent (figure 3 and table A13). Most recently,the high school completion rate of 90.5 percent for white young adults in 1997 wassignificantly higher than completion rates in every year before 1989.
Black young adults also made significant gains in completing their high schooleducation over the last quarter-century, although, like whites, their completion rates appear tohave stabilized in recent years. The 1997 black completion rate of 82 percent is significantlyhigher than completion rates before 1984, indicating that a greater proportion of black youngadults are now completing high school than in the 1970s and early 1980s. Since 1990,completion rates have fluctuated around 83 percent, and trend data over the period suggestblack completion rates have remained unchanged in the 1990s.
A relatively low percentage of Hispanic young adults complete high schoolprograms—in 1997 about 67 percent of all Hispanic 18- through 24-year-olds had completedtheir secondary schooling. Overall completion rates for Hispanics have fluctuated over thelast quarter-century, but have shown no consistent trend over the entire period. For example,completion rates for Hispanics increased in the period between 1980 and 1985, declinedbetween 1985 and 1990, and increased again between 1990 and 1997. The 1997 completionrate of 66.7 percent was not significantly different from the 1985 rate of 66.6 percent.
21The high school completion rate is based on the population of young adults ages 18 through 24 who are not still enrolledin school; the status dropout rate is based on the population ages 16 through 24. Thus, the age range of the status dropoutrate is two years wider, and those 18- through 24-year-olds who are still enrolled in a high school program are excludedfrom the calculation of the high school completion rate. Because of these differences, the status dropout rate and the highschool completion rate are not the simple inverse of each other.

16
White youth are still more likely than both black and Hispanic youth to completehigh school (table 4). In 1997, 90.5 percent of all white youth ages 18 to 24 had completedhigh school, followed by 82.0 percent of black and 66.7 percent of Hispanics.
Table 4—Completion rates and number and distribution of completers, ages 18–24, not currentlyenrolled in high school or below, by background characteristics: October 1997
Completion rate Number of PercentDiploma completers Population of all
Characteristics Total (percent) Alternative1 (thousands) (thousands) completers
Total 85.9 76.7 9.1 20,241 23,569 100.0
Sex Male 84.6 75.4 9.2 9,894 11,696 48.9 Female 87.2 78.0 9.1 10,347 11,872 51.1
Race–ethnicity2
White, non-Hispanic 90.5 81.1 9.4 14,343 15,841 70.9 Black, non-Hispanic 82.0 72.2 9.7 2,671 3,259 13.2 Hispanic 66.7 59.1 7.7 2,229 3,339 11.0
Age 18 to 19 82.3 74.2 8.1 5,142 6,249 25.4 20 to 21 87.0 76.5 10.5 6,049 6,952 29.9 22 to 24 87.3 78.4 8.9 9,050 10,367 44.7
Region Northeast 86.6 78.2 8.4 3,694 4,268 18.3 Midwest 88.7 80.7 8.0 4,995 5,630 24.7 South 85.1 75.0 10.2 6,985 8,205 34.5 West 83.5 74.2 9.3 4,567 5,467 22.61Completed high school by means of an equivalency test, such as a General Educational Development (GED) exam.2Due to relatively small sample sizes, American Indian/Alaskan Natives and Asian/Pacific Islanders are included in the totalbut are not shown separately.
NOTE: Because of rounding, details may not add to totals.
SOURCE: U.S. Department of Commerce, Bureau of the Census, Current Population Survey, October 1997, unpublisheddata.

17
Age and Sex
Young adults ages 18 and 19 not currently enrolled in high school were less likelythan older individuals to have completed high school. In 1997, approximately 82 percent of18- to 19-year-olds not currently enrolled in high school had completed their secondaryschooling, compared to 87 percent of young adults ages 20 to 24 (table 4).
As might be expected given their relatively lower status dropout rate, females ages18 to 24 who were no longer enrolled in high school were more likely to have completed highschool than males.
Region and State
Young adults in the Northeast and Midwest had higher high school completion ratescompared to their contemporaries living in the West; moreover, young adults living in theMidwest were more likely to complete high school than those living in the South (table 4).
Often interest in geographic comparisons extends beyond the regional level to state-specific data. In order to compare high school completion on a state-by-state basis,completion rates are computed based on data spanning a three-year period. The resultingstate-specific completion rates represent the average annual rate over the three-year periods of1989–91, 1992–94 and 1995–97.22 These data show considerable state-by-state variation(table 5). Using the 1995–97 three-year average, the national rate was 85.8 percent, with theaverage completion rates ranging from 76.6 percent in Nevada to 94.9 percent in Maryland.
22The sample sizes of the numbers of completers at the state level in the Current Population Survey are, by definition,substantially smaller than the counts of completers supporting the national estimates (but appreciably larger than the countsof dropouts). To improve the stability of the state-level estimates for high school completion rates, the rates are displayed asthree-year averages (for example, the data for 1989–91 represent the average of the data from 1989, 1990, and 1991 and thedata for 1995–97 are based on averages of data from 1995, 1996, and 1997). Even with this, sampling variability isincreased substantially, especially in states with relatively smaller populations in the 18 through 24 age range. Thus, it is notsurprising that the rates for some states fluctuate over the three-year periods. Moreover, it should be noted that surveyrespondents may have attended school in a different state from where they lived at the time of the CPS interview.

18
Table 5—High school completion rates of 18- through 24-year-olds not currently enrolled in high schoolor below, by state: October 1989–91, 1992–94, and 1995–97
State 1989–911 1992–941,2 1995–971,2
(percent) Total 85.0 86.1 85.8
Alabama 82.2 82.2 84.9 Alaska 88.7 90.9 85.5 Arizona 83.2 83.7 82.7 Arkansas 87.1 87.5 85.7 California 76.7 78.9 80.6 Colorado 87.8 87.6 88.2 Connecticut 89.7 92.6 94.4 Delaware 85.9 93.7 87.4 District of Columbia 82.0 86.4 87.2 Florida 83.2 83.2 81.9
Georgia 85.5 79.4 84.1 Hawaii 92.9 90.7 93.5 Idaho 83.1 86.7 88.0 Illinois 85.4 86.7 88.6 Indiana 88.9 88.4 87.4 Iowa 94.5 94.2 88.3 Kansas 92.5 92.2 91.5 Kentucky 81.6 83.3 83.3 Louisiana 80.6 83.9 80.4 Maine 90.5 94.0 90.8
Maryland 87.3 92.9 94.9 Massachusetts 89.6 91.2 91.0 Michigan 86.3 89.2 89.7 Minnesota 92.0 93.2 91.6 Mississippi 84.0 88.8 82.8 Missouri 88.0 90.0 87.3 Montana 92.7 91.6 89.3 Nebraska 90.8 95.9 91.2 Nevada 82.6 83.4 76.6 New Hampshire 87.3 86.6 90.6
New Jersey 90.0 91.0 87.0 New Mexico 84.7 83.7 82.7 New York 87.7 87.5 89.5 North Carolina 82.8 85.3 87.1 North Dakota 95.6 96.6 92.3 Ohio 89.3 89.6 88.5 Oklahoma 87.1 83.1 87.4 Oregon 89.2 82.9 79.3 Pennsylvania 90.2 89.7 88.3 Rhode Island 87.4 90.7 86.0
South Carolina 82.6 87.0 89.2 South Dakota 87.6 93.2 88.2 Tennessee 76.5 82.3 84.2 Texas 78.4 80.5 80.5 Utah 93.9 93.9 90.9 Vermont 85.9 89.8 89.3 Virginia 87.0 88.6 87.3 Washington 87.4 87.3 88.2 West Virginia 82.7 85.6 90.2 Wisconsin 93.4 93.4 90.7 Wyoming 91.4 91.6 88.91Numbers on this table reflect 3-year averages.2Numbers for these periods reflect new wording of the educational attainment item in the CPS beginning in 1992 and changes in CPSbeginning in 1994 due to newly instituted computer-assisted interviewing and the change in the population controls used to the 1990Census-based estimates, with adjustment for undercount in the 1990 Census.
SOURCE: U.S. Department of Commerce, Bureau of the Census, Current Population Survey, October (various years), unpublished data.

19
Method of High School Completion
The pressures placed on the education system to turn out increasingly larger numbersof qualified lifelong learners have led to an increased interest in alternative methods of highschool completion. At this point, most students pursuing an alternative to a regular diplomatake the General Educational Development (GED) tests, with the goal of earning a highschool equivalency credential.
Over the 25-year period covered by this report, approximately 18 million people tookthe GED tests and about 11 million, or 60 percent, received a high school equivalencycredential based on the GED tests.23 About three-quarters of a million people take the GEDtest each year and nearly a half million test-takers receive a GED credential. A minimumpassing score is set nationally by the test administrator at the American Council onEducation. Effective January 1, 1997, this minimum passing score was raised to a newstandard that is met by only 66 percent of graduating high school seniors.24 Individual statesset their own passing scores at or above the minimum requirement.
Any one age 16 or older who is out of school without a high school diploma canregister and take the GED tests. Historically, the GED was established as a means of offeringa high school credential to World War II veterans who might have interrupted their schoolingto go to war. Since that time, the GED has been viewed as a second-chance program forpeople who failed to graduate from a regular high school program. Seemingly incontradiction with these programmatic goals, data on GED test-takers show that while theaverage age of GED test-takers is about 26, over the last quarter century one-third of the test-takers have been ages 16 through 19.25
In recent years, research into the adult outcomes for GED credential holders, ascompared to dropouts on the one hand and regular diploma recipients on the other, has fueleda debate over the value of the GED credential. There is conflicting evidence in the researchliterature concerning the effects of having a GED credential on labor force participation,employment, earnings, wage rates, postsecondary program participation, and persistence inpostsecondary programs.26
23U.S. Department of Education, National Center for Education Statistics, Digest of Education Statistics, 1997, NCES 98-015, Washington D.C.: U.S. Government Printing Office, 1998, Table 102. Note data for U.S. outlying areas are included inthese counts.24American Council of Education, Test of GED, Technical Manual, Washington, D.C.: GED Testing Service, 1997.25U.S. Department of Education, National Center for Education Statistics, Digest of Education Statistics: 1996, NCES 96-133, Washington, D.C.: U.S. Government Printing Office, 1996, Table 100.26See, for example, R.J. Murnane, J.B. Willet and K.P. Boudett, “Do high school dropouts benefit from obtaining a GED?”Education and Policy Analysis 17(2): 133–47; Iowa Department of Education, What has happened to Iowa’s GEDgraduates? A two-, five-, and ten-year follow-up study, Des Moines: State of Iowa Department of Education ED 344-047,1992; J. Baldwin, I.S. Hirsch, D. Rock and K. Yamamoto, The Literacy Proficiencies of GED Examinees: Results from theGED-NALS Comparison Study. Washington, D.C. and Princeton, NJ: The American Council on Education and theEducational Testing Service, 1995. Also for a detailed review of the literature, see U.S. Department of Education, NationalLibrary of Education, Educational and Labor Market Performance of GED Recipients, by D. Boesel, N. Alsalam and T.Smith, Washington D.C.: 1996.

20
These conflicting findings have led some to question the efficacy of promoting GEDprograms for youths who are still young enough to participate in regular high schoolprograms. This debate highlights the need to monitor the characteristics and the relative sizeof the groups of dropouts, high school graduates, and alternative completers.
Most of the 85.9 percent of 18- through 24-year-olds who had completed highschool by October 1997 graduated with a regular diploma. In 1997, 76.7 percent of the 18-through 24-year-olds who were not still enrolled in high school held regular diplomas, whichrepresented the high school graduation rate (as opposed to the high school completion rate)(table 6).
Table 6High school completion rates and method of completion of 18- through 24-year-olds notcurrently enrolled in high school or below: October 1988 through October 1997
Completion Year method 1988 1989 1990 1991 19921 19931 19941,2 19951,2 19961,2 19971,2
Total 84.5 84.7 85.6 84.9 86.4 86.2 85.8 85.3 86.2 85.9
Diploma 80.3 80.5 80.6 80.7 81.2 81.2 78.8 77.5 76.5 76.7Alternative3 4.2 4.2 4.9 4.2 5.2 4.9 7.0 7.7 9.8 9.11Numbers for these years reflect new wording of the educational attainment item in the CPS.2Numbers in these years reflect changes in CPS due to newly instituted computer-assisted interviewing and the change in thepopulation controls to the 1990 Census-based estimates, with adjustment for undercount in the 1990 Census.3Completed high school by means of an equivalency test, such as a General Educational (GED) exam.
NOTE: Because of rounding, details may not add to totals.
SOURCE: U.S. Department of Commerce, Bureau of the Census, Current Population Survey, October (various years),unpublished data.
In 1997, 2 million young adults 18 through 24 years of age had earned high schoolcredentials by passing an equivalency exam such as the General Educational Development(GED) test.27 The young adults who completed high school through this alternative routeaccount for 9.1 percent of the 18- through 24-year-olds who were not still enrolled in highschool in 1997 (table 6).
CPS data indicating whether high school credentials were obtained through a regulardiploma or through an alternative route were first collected in 1988.28 Between 1988 and1997, the diploma rate declined by 3.6 percentage points falling from 80.3 percent in 1988 to76.7 percent in 1997. In comparison, the alternative credential rate increased by 4.9percentage points, climbing from 4.2 percent to 9.1 percent over the same period. As noted in
27The General Educational Development (GED) test is the principal equivalency exam in use at this time. In 1997, over780,000 people living in the U.S. age 16 or older took the GED test, and 59 percent or over 460,000 passed the exam toearn a high school credential. GED Testing Service, Who Took the GED? 1998 GED Statistical Report, Washington D.C.:American Council on Education, 1998.28In the CPS data there may be some ambiguity concerning students who complete high school with a certificate ofattendance. While they should be counted as non-completers, some respondents may report them as completers when askedabout educational attainment.

21
Appendix C, the rate increase from 1993 to 1994 coincided with the CPS implementation ofCATI procedures. However, the rate continued to increase between 1994 and 1996.
Among the three racial–ethnic groups, whites were most likely to have earned a highschool diploma followed by blacks and then Hispanics. Although Hispanics were least likelyof the three racial–ethnic groups to have earned a high school diploma, they were as likely tocomplete school with an alternative credential (e.g., GED) as white and black young adults.

22
CONCLUSIONS
In October of 1997, nearly 5 out of every 100 young adults enrolled in high schoolin October of 1996 had left high school without successfully completing a high schoolprogram. In total, these dropouts accounted for approximately a half million of the 9.9million 15- through 24-year-olds enrolled in high school in the previous October. Thesenumbers have not changed appreciably in recent years.
The cumulative effect of hundreds of thousands of young adults leaving school eachyear short of finishing a high school program translates into several million young adults whoare out of school, yet lacking a high school credential. In 1997, there were 3.6 million 16-through 24-year-olds who, although not enrolled in school, had not yet completed a highschool program. Overall, 11.0 percent of the 33 million 16- through 24-year-olds in theUnited States were in this group of dropouts. Although there have been a number of year-to-year fluctuations in this rate, over the past 25 years there has been a gradual pattern of declinethat amounts to an average annual percentage change of 0.11 percent per year.
The goal of reducing the dropout rate is to increase the percentage of young adultswho complete a high school education. Despite the increased importance of a high schooleducation, the high school completion rate has shown limited gains over the last quartercentury and has been stable throughout most of the 1990s. In 1997, just over three-quarters ofthe 18- through 24-year-olds not still in high school were reported as being high schoolgraduates (76.7 percent); another 9.1 percent of these youths were reported as havingcompleted by an alternative route such as the GED.
Over the last eight years, the percent of young adults who had completed highschool has been relatively stable for whites and blacks. During the same time, the percentwho had completed high school through an alternative test increased, with 1997 alternativecompletion rates of about 10 percent for white and black young adults.
The net effect of these recent changes has been stable dropout and high schoolcompletion rates for young adults in the 1990s. These findings suggest that the emphasisgiven in recent years to decreasing dropout rates and also revising standards and high schoolgraduation requirements may have translated into an increase in the use of alternativemethods of high school completion, rather than an overall decrease in dropout rates orincrease in the proportion of young adults holding a high school credential.

23
APPENDIX A
Standard Error and Time Series Tables

24
Table A1—Standard errors for Table A: Proportion of 15- to 24-year-olds dropping out of grades 10 to12, proportion of 16- to 24-year-olds who were dropouts, and proportion of 18- to 24-year-olds who had completed high school, by race–ethnicity: October 1997
White, Black,Dropout and completion measure Total non-Hispanic non-Hispanic Hispanic
Percent age 15 to 24 in grades 10 to 12 dropping out, October 1996 to October 1997 0.32 0.35 0.92 1.45
Percent of youth 16 to 24 who were dropouts in 1997 0.27 0.28 0.80 1.11
Percent of youth 18 to 24 who were high school completers in 1997* 0.35 0.36 1.10 1.42
*Excludes those still enrolled in high school.
SOURCE: U.S. Department of Commerce, Bureau of the Census, Current Population Survey, October 1997, unpublisheddata.

25
Table A2—Standard errors for Table 1: Event dropout rates and number and distribution of dropoutsfor grades 10–12, ages 15–24, by background characteristics: October 1997
Number ofEvent event Population Percent Percent
dropout dropouts enrolled of all ofCharacteristics rate (thousands) (thousands) dropouts population
Total 0.32 32 131
Sex Male 0.47 24 93 3.59 0.77 Female 0.43 21 92 3.59 0.77 Race–ethnicity1
White, non-Hispanic 0.35 24 107 3.60 0.72 Black, non-Hispanic 0.92 13 54 2.88 0.59 Hispanic 1.45 16 54 3.61 0.58
Income2
Low 1.36 19 52 3.50 0.53 Middle 0.41 23 99 3.61 0.76 High 0.37 11 68 2.32 0.71
Age3
15 to 16 0.47 13 65 2.66 0.69 17 0.40 14 32 2.82 0.74 18 0.71 19 44 3.42 0.68 19 1.61 13 39 2.83 0.43 20 to 24 4.32 10 23 2.37 0.23
Region Northeast 0.67 12 56 2.51 0.59 Midwest 0.60 15 65 3.00 0.67 South 0.53 17 76 3.29 0.72 West 0.79 19 64 3.43 0.65
Not applicable.1Due to relatively small sample sizes, American Indian/Alaskan Natives and Asian/Pacific Islanders are included in the totalbut are not shown separately.2Low income is defined as the bottom 20 percent of all family incomes for 1997; middle income is between 20 and 80percent of all family incomes; and high income is the top 20 percent of all family incomes. See Appendix C of this report fora full definition of family income.3Age when a person dropped out may be one year younger, because the dropout event could occur at any time over a 12-month period.
SOURCE: U.S. Department of Commerce, Bureau of the Census, Current Population Survey, October 1997, unpublisheddata.

26
Table A3—Standard errors for Table 3: Rate, number, and distribution of status dropouts, ages 16–24,by background characteristics: October 1997
Number ofStatus status Percent Percent
dropout dropouts of all ofCharacteristics rate (thousands) dropouts population
Total 0.27 87
Sex Male 0.39 64 1.27 0.42 Female 0.36 59 1.27 0.42 Race–ethnicity1
White, non-Hispanic 0.28 60 1.27 0.40 Black, non-Hispanic 0.80 39 1.04 0.32 Hispanic 1.11 52 1.36 0.34
Age 16 0.48 19 0.53 0.28 17 0.56 23 0.62 0.28 18 0.82 31 0.86 0.27 19 0.91 34 0.93 0.27 20 to 24 0.39 67 1.25 0.42
Recency of immigration Born outside the 50 states and the District of Columbia Hispanic 1.96 37 1.16 0.22 Non-Hispanic 0.97 18 0.50 0.19 First generation2
Hispanic 1.56 25 0.74 0.21 Non-Hispanic 0.80 14 0.39 0.19 Second generation or more3
Hispanic 1.96 23 0.67 0.18 Non-Hispanic 0.28 69 1.25 0.37
Region Northeast 0.61 36 0.96 0.33 Midwest 0.49 39 1.01 0.36 South 0.46 53 1.24 0.40 West 0.58 45 1.13 0.36
—Not applicable.1Due to relatively small sample sizes, American Indian/Alaskan Natives and Asian/Pacific Islanders are included in the totalbut are not shown separately.2Individuals defined as first generation were born in the 50 states or the District of Columbia and have one or both parentsborn outside the 50 states and the District of Columbia.3Individuals defined as second generation or more were born in the 50 states or the District of Columbia and have bothparents born in the 50 states or the District of Columbia.
SOURCE: U.S. Department of Commerce, Bureau of the Census, Current Population Survey, October 1997, unpublisheddata.

27
Table A4—Standard errors for Table 4: Completion rates and number and distribution of completers,ages 18–24, not currently enrolled in high school or below, by background characteristics:October 1997
Completion rate Number PercentTotal Diploma of completers of all
Characteristics (percent) (thousands) Alternative1 (thousands) completers
Total 0.35 0.42 0.29 82
Sex Male 0.51 0.61 0.41 60 0.54 Female 0.47 0.58 0.41 56 0.54 Race–ethnicity2
White, non-Hispanic 0.36 0.48 0.36 57 0.49 Black, non-Hispanic 1.10 1.28 0.85 36 0.39 Hispanic 1.42 1.49 0.80 48 0.38
Age 18 to 19 0.74 0.85 0.53 46 0.47 20 to 21 0.62 0.78 0.57 43 0.50 22 to 24 0.50 0.62 0.43 52 0.54
Region Northeast 0.80 0.97 0.65 34 0.42 Midwest 0.65 0.81 0.56 37 0.47 South 0.60 0.74 0.51 50 0.51 West 0.77 0.91 0.60 42 0.45
Not applicable.1Completed high school by means of an equivalency test, such as a General Educational Development (GED) exam.2Due to relatively small sample sizes, American Indian/Alaskan Natives and Asian/Pacific Islanders are included in the totalbut are not shown separately.
SOURCE: U.S. Department of Commerce, Bureau of the Census, Current Population Survey, October 1997, unpublisheddata.

28
Table A5Standard errors for Table 5: High school completion rates of 18- through 24-year-olds not currently enrolled in highschool or below, by state: October 1989–91, 1992–94, and 1995–97
State 1989–911 1992–941,2 1995–971,2
Total 0.21 0.21 0.21
Alabama 2.12 1.75 1.86 Alaska 2.23 3.93 2.30 Arizona 1.91 2.00 1.77 Arkansas 2.11 2.08 1.81 California 0.71 0.70 0.67 Colorado 1.74 1.68 1.53 Connecticut 1.58 1.46 1.32 Delaware 4.09 2.79 3.88 District of Columbia 4.71 4.78 3.86 Florida 1.02 0.97 1.03
Georgia 1.31 1.48 1.29 Hawaii 2.49 2.75 2.03 Idaho 3.81 3.19 1.38 Illinois 0.96 0.93 0.97 Indiana 1.28 1.26 1.45 Iowa 1.28 1.26 2.01 Kansas 1.55 1.58 1.62 Kentucky 1.86 1.93 1.92 Louisiana 1.79 1.77 1.72 Maine 2.68 2.05 1.80
Maryland 1.41 1.15 1.05 Massachusetts 1.13 1.13 1.42 Michigan 1.04 0.96 0.94 Minnesota 1.18 1.11 1.30 Mississippi 2.09 1.79 1.89 Missouri 1.33 1.27 1.59 Montana 2.92 3.07 3.27 Nebraska 2.21 1.49 2.31 Nevada 3.40 3.23 2.24 New Hampshire 2.95 3.25 1.63
New Jersey 1.01 1.04 1.38 New Mexico 2.82 2.99 1.38 New York 0.74 0.77 0.85 North Carolina 1.36 1.28 1.35 North Dakota 2.38 2.17 2.82 Ohio 0.86 0.89 0.92 Oklahoma 1.88 2.13 1.77 Oregon 1.81 2.15 2.20 Pennsylvania 0.85 0.86 0.93 Rhode Island 3.14 3.02 3.60
South Carolina 1.91 1.69 1.57 South Dakota 3.70 2.90 3.56 Tennessee 1.72 1.59 1.55 Texas 0.93 0.87 0.83 Utah 1.59 1.57 1.65 Vermont 4.71 3.94 1.98 Virginia 1.34 1.21 1.56 Washington 1.52 1.41 1.36 West Virginia 2.67 2.43 1.67 Wisconsin 1.05 1.07 1.38 Wyoming 4.21 3.85 4.45
1Numbers on this table reflect 3-year averages.2Numbers for these periods reflect new wording of the educational attainment item in the CPS beginning in 1992 and changes in CPSbeginning in 1994 due to newly instituted computer-assisted interviewing and the change in the population controls used to the 1990Census-based estimates, with adjustment for undercount in the 1990 Census.
NOTE: Some of the standard error estimates in this table may differ from those previously published due to changes in the generalizedvariance parameters developed by the Bureau of the Census.
SOURCE: U.S. Department of Commerce, Bureau of the Census, Current Population Survey, October (various years), unpublished data.

29
Table A6Standard errors for Table 6: High school completion rates and method of completion of 18-through 24-year-olds not currently enrolled in high school or below: October 1988 throughOctober 1997
Completion Year method 1988 1989 1990 1991 19921 19931 19941,2 19951,2 19961,2 19971,2
Total 0.37 0.37 0.36 0.37 0.36 0.36 0.36 0.37 0.35 0.35 Diploma 0.40 0.41 0.41 0.41 0.41 0.41 0.42 0.43 0.43 0.42 Alternative3 0.20 0.21 0.22 0.21 0.23 0.23 0.26 0.28 0.30 0.291Numbers for these years reflect new wording of the educational attainment item in the CPS.2Numbers in these years reflect changes in CPS due to newly instituted computer-assisted interviewing and the change in thepopulation controls to the 1990 Census-based estimates, with adjustment for undercount in the 1990 Census.3Completed high school by means of an equivalency test, such as a General Educational (GED) exam.
NOTE: Some of the standard error estimates in this table may differ from those previously published due to changes in thegeneralized variance parameters developed by the Bureau of the Census.
SOURCE: U.S. Department of Commerce, Bureau of the Census, Current Population Survey, October (various years),unpublished data.

30
Table A7—Supporting data for Figure A: Proportion of 15- to 24-year-olds dropping out of grades 10 to12, proportion of 16- to 24-year-olds who were dropouts, and proportion of 18- to 24-year-olds who had completed high school: October 1972 to October 1997
Event rate Status rate15- to 24- 16- to 24- High schoolyear-old year-old completion rate
dropouts from dropouts in 18- to 24-year-Year grades 10 to 12 age group old completers1
(percent)1972 6.1 14.6 82.81973 6.3 14.1 83.71974 6.7 14.3 83.61975 5.8 13.9 83.81976 5.9 14.1 83.51977 6.5 14.1 83.61978 6.7 14.2 83.61979 6.7 14.6 83.11980 6.1 14.1 83.91981 5.9 13.9 83.81982 5.5 13.9 83.81983 5.2 13.7 83.91984 5.1 13.1 84.71985 5.2 12.6 85.41986 4.7 12.2 85.519872 4.1 12.7 84.719882 4.8 12.9 84.519892 4.5 12.6 84.719902 4.0 12.1 85.619912 4.0 12.5 84.919922,3 4.4 11.0 86.419932,3 4.5 11.0 86.219942,3,4 5.3 11.5 85.819952,3,4 5.7 12.0 85.319962,3,4 5.0 11.1 86.219972,3,4 4.6 11.0 85.91Excluding those not still enrolled in high school.2Numbers for these years reflect new editing procedures instituted by the Bureau of the Census for cases with missing dataon school enrollment items.3Numbers for these years reflect new wording of the educational attainment item in the CPS.4Numbers in these years reflect changes in CPS due to newly instituted computer-assisted interviewing and the change in thepopulation controls used to the 1990 Census-based estimates, with adjustment for undercount in the 1990 Census.
SOURCE: U.S. Department of Commerce, Bureau of the Census, Current Population Survey, October (various years).

31
Table A8—Standard errors for Figure A: Proportion of 15- to 24-year-olds dropping out of grades 10 to12, proportion of 16- to 24-year-olds who were dropouts, and proportion of 18- to 24-year-olds who had completed high school: October 1972 to 1997
Event rate Status rate High school15- to 24-year-old 16- to 24-year-old completion rate
dropouts from dropouts in 18- to 24-year-Year grades 10 to 12 age group old completers1
1972 0.33 0.28 0.351973 0.33 0.27 0.341974 0.34 0.27 0.331975 0.32 0.27 0.331976 0.32 0.26 0.331977 0.34 0.27 0.331978 0.34 0.27 0.331979 0.34 0.27 0.331980 0.33 0.26 0.321981 0.33 0.26 0.321982 0.34 0.27 0.341983 0.33 0.27 0.341984 0.33 0.27 0.331985 0.34 0.27 0.331986 0.32 0.27 0.3319872 0.30 0.28 0.3519882 0.36 0.30 0.3819892 0.36 0.31 0.3819902 0.34 0.29 0.3619912 0.34 0.30 0.3719922,3 0.35 0.28 0.3619932,3 0.36 0.28 0.3619942,3,4 0.34 0.26 0.3619952,3,4 0.35 0.27 0.3719962,3,4 0.34 0.27 0.3519972,3,4 0.32 0.27 0.351Excluding those not still enrolled in high school.2Numbers for these years reflect new editing procedures instituted by the Bureau of the Census for cases with missing dataon school enrollment items.3Numbers for these years reflect new wording of the educational attainment item in the CPS.4Numbers in these years reflect changes in CPS due to newly instituted computer-assisted interviewing and the change in thepopulation controls used to the 1990 Census-based estimates, with adjustment for undercount in the 1990 Census.
NOTE: Some of the standard error estimates in this table may differ from those previously published due to changes in thegeneralized variance parameters developed by the Bureau of the Census.
SOURCE: U.S. Department of Commerce, Bureau of the Census, Current Population Survey, October (various years).

32
Table A9—Supporting data for Figure 1: Event dropout rates for grades 10–12, ages 15–24, by familyincome: October 1972 through October 1997
Event Family income1
dropout Low Middle HighYear rate income income income
(percent)1972 6.1 14.1 6.7 2.51973 6.3 17.3 7.0 1.81974 6.7 1975 5.8 15.7 6.0 2.61976 5.9 15.4 6.8 2.11977 6.5 15.5 7.6 2.21978 6.7 17.4 7.3 3.01979 6.7 17.1 6.9 3.61980 6.1 15.8 6.4 2.51981 5.9 14.4 6.2 2.81982 5.5 15.2 5.6 1.81983 5.2 10.4 6.0 2.21984 5.1 13.9 5.1 1.81985 5.2 14.2 5.2 2.11986 4.7 10.9 5.1 1.619872 4.1 10.3 4.7 1.019882 4.8 13.7 4.7 1.319892 4.5 10.0 5.0 1.119902 4.0 9.5 4.3 1.119912 4.0 10.6 4.0 1.019922,3 4.4 10.9 4.4 1.319932,3 4.5 12.3 4.3 1.319942,3,4 5.3 13.0 5.2 2.119952,3,4 5.7 13.3 5.7 2.019962,3,4 5.0 11.1 5.1 2.119972,3,4 4.6 12.3 4.1 1.8
Data not available for this year.1Low income is defined as the bottom 20 percent of all family incomes for the year; middle income is between 20 and 80percent of all family incomes; and high income is the top 20 percent of all family incomes. See Appendix C of this report fora full definition of family income.2Numbers for these years reflect new editing procedures instituted by the Bureau of the Census for cases with missing dataon school enrollment items.3Numbers for these years reflect new wording of the educational attainment item in the CPS.4Numbers in these years reflect changes in CPS due to newly instituted computer-assisted interviewing and the change in thepopulation controls used to the 1990 Census-based estimates, with adjustment for undercount in the 1990 Census.
SOURCE: U.S. Department of Commerce, Bureau of the Census, Current Population Survey, October (various years),unpublished data.

33
Table A10—Standard errors for Figure 1: Event dropout rates for grades 10–12, ages 15–24, by income:October 1972 through October 1997
Event Family income1
dropout Low Middle HighYear rate income income income
(percent)1972 0.33 1.55 0.45 0.391973 0.33 1.65 0.46 0.321974 0.34 1975 0.32 1.57 0.43 0.381976 0.32 1.61 0.46 0.341977 0.34 1.57 0.48 0.351978 0.34 1.69 0.48 0.401979 0.34 1.62 0.47 0.441980 0.33 1.51 0.46 0.381981 0.33 1.50 0.45 0.411982 0.34 1.52 0.46 0.361983 0.33 1.35 0.48 0.391984 0.33 1.49 0.45 0.371985 0.34 1.53 0.47 0.391986 0.32 1.33 0.45 0.3419872 0.30 1.29 0.45 0.2719882 0.36 1.59 0.48 0.3519892 0.36 1.43 0.50 0.3319902 0.34 1.39 0.45 0.3319912 0.34 1.43 0.44 0.3119922,3 0.35 1.42 0.46 0.3619932,3 0.36 1.57 0.46 0.3519942,3,4 0.34 1.44 0.44 0.4119952,3,4 0.35 1.36 0.47 0.3919962,3,4 0.34 1.34 0.46 0.4119972,3,4 0.32 1.36 0.41 0.37
Data not available for this year.1Low income is defined as the bottom 20 percent of all family incomes for the year; middle income is between 20 and 80percent of all family incomes; and high income is the top 20 percent of all family incomes. See Appendix C of this report fora full definition of family income.2Numbers for these years reflect new editing procedures instituted by the Bureau of the Census for cases with missing dataon school enrollment items.3Numbers for these years reflect new wording of the educational attainment item in the CPS.4Numbers in these years reflect changes in CPS due to newly instituted computer-assisted interviewing the change in thepopulation controls used to the 1990 Census-based estimates, with adjustment for undercount in the 1990 Census.
NOTE: Some of the standard error estimates in this table may differ from those previously published due to changes in thegeneralized variance parameters developed by the Bureau of the Census.
SOURCE: U.S. Department of Commerce, Bureau of the Census, Current Population Survey, October (various years),unpublished data.

34
Table A11—Supporting data for Figure 2: Status dropout rates for persons ages 16–24, by race–ethnicity: October 1972 through October 1997
Race–ethnicity1
White, Black,Year Total non-Hispanic non-Hispanic Hispanic
(percent)1972 14.6 12.3 21.3 34.31973 14.1 11.6 22.2 33.51974 14.3 11.9 21.2 33.01975 13.9 11.4 22.9 29.21976 14.1 12.0 20.5 31.41977 14.1 11.9 19.8 33.01978 14.2 11.9 20.2 33.31979 14.6 12.0 21.1 33.81980 14.1 11.4 19.1 35.21981 13.9 11.4 18.4 33.21982 13.9 11.4 18.4 31.71983 13.7 11.2 18.0 31.61984 13.1 11.0 15.5 29.81985 12.6 10.4 15.2 27.61986 12.2 9.7 14.2 30.119872 12.7 10.4 14.1 28.619882 12.9 9.6 14.5 35.819892 12.6 9.4 13.9 33.019902 12.1 9.0 13.2 32.419912 12.5 8.9 13.6 35.319922,3 11.0 7.7 13.7 29.419932,3 11.0 7.9 13.6 27.519942,3,4 11.5 7.7 12.6 30.019952,3,4 12.0 8.6 12.1 30.019962,3,4 11.1 7.3 13.0 29.419972,3,4 11.0 7.6 13.4 25.31Due to relatively small sample sizes, American Indian/Alaskan Natives and Asian/Pacific Islanders are included in the totalbut are not shown separately.2Numbers for these years reflect new editing procedures instituted by the Bureau of the Census for cases with missing dataon school enrollment items.3Numbers for these years reflect new wording of the educational attainment item in the CPS.4Numbers in these years reflect changes in CPS due to newly instituted computer-assisted interviewing and the change in thepopulation controls used to the 1990 Census-based estimates, with adjustment for undercount in the 1990 Census.
NOTE: Some of the estimates in this table may differ from those previously published.
SOURCE: U.S. Department of Commerce, Bureau of the Census, Current Population Survey, October (various years),unpublished data.

35
Table A12—Standard errors for Figure 2: Status dropout rates for persons ages 16–24, by race–ethnicity: October 1972 through October 1997
Race–ethnicity1
White, Black,Year Total non-Hispanic non-Hispanic Hispanic
(percent)1972 0.28 0.29 1.07 2.221973 0.27 0.28 1.06 2.241974 0.27 0.28 1.05 2.081975 0.27 0.27 1.06 2.021976 0.26 0.28 1.01 2.011977 0.27 0.28 1.00 2.021978 0.27 0.28 1.00 2.001979 0.27 0.28 1.01 1.981980 0.26 0.27 0.97 1.891981 0.26 0.27 0.93 1.801982 0.27 0.29 0.98 1.931983 0.27 0.29 0.97 1.931984 0.27 0.29 0.92 1.911985 0.27 0.29 0.92 1.931986 0.27 0.28 0.90 1.8819872 0.28 0.30 0.91 1.8419882 0.30 0.32 1.00 2.3019892 0.31 0.32 0.98 2.1919902 0.29 0.30 0.94 1.9119912 0.30 0.31 0.95 1.9319922,3 0.28 0.29 0.95 1.8619932,3 0.28 0.29 0.94 1.7919942,3,4 0.26 0.27 0.75 1.1619952,3,4 0.27 0.28 0.74 1.1519962,3,4 0.27 0.26 0.75 1.1319972,3,4 0.27 0.28 0.80 1.11
1Due to relatively small sample sizes, American Indian/Alaskan Natives and Asian/Pacific Islanders are included in the totalbut are not shown separately.2Numbers for these years reflect new editing procedures instituted by the Bureau of the Census for cases with missing dataon school enrollment items.3Numbers for these years reflect new wording of the educational attainment item in the CPS.4Numbers in these years reflect changes in CPS due to newly instituted computer-assisted interviewing and the change in thepopulation controls used to the 1990 Census-based estimates, with adjustment for undercount in the 1990 Census.
NOTE: Some of the standard error estimates in this table may differ from those previously published due to changes in thegeneralized variance parameters developed by the Bureau of the Census.
SOURCE: U.S. Department of Commerce, Bureau of the Census, Current Population Survey, October (various years),unpublished data.

36
Table A13—Supporting data for Figure 3: Completion rates for persons ages 18–24 not currentlyenrolled in high school or below, by race–ethnicity: October 1972 through October 1997
Race–ethnicity1
White, Black,Year Total non-Hispanic non-Hispanic Hispanic
(percent)1972 82.8 86.0 72.1 56.21973 83.7 87.0 71.6 58.71974 83.6 86.7 73.0 60.11975 83.8 87.2 70.2 62.21976 83.5 86.4 73.5 60.31977 83.6 86.7 73.9 58.61978 83.6 86.9 73.4 58.81979 83.1 86.6 72.6 58.51980 83.9 87.5 75.2 57.11981 83.8 87.1 76.7 59.11982 83.8 87.0 76.4 60.91983 83.9 87.4 76.8 59.41984 84.7 87.5 80.3 63.71985 85.4 88.2 81.0 66.61986 85.5 88.8 81.8 63.519872 84.7 87.7 81.9 65.119882 84.5 88.7 80.9 58.219892 84.7 89.0 81.9 59.419902 85.6 89.6 83.2 59.119912 84.9 89.4 82.5 56.519922,3 86.4 90.7 82.0 62.119932,3 86.2 90.1 81.9 64.419942,3,4 85.8 90.7 83.3 61.819952,3,4 85.3 89.8 84.5 62.819962,3,4 86.2 91.5 83.0 61.919972,3,4 85.9 90.5 82.0 66.71Due to relatively small sample sizes, American Indian/Alaskan Natives and Asian/Pacific Islanders are included in the totalbut are not shown separately.2Numbers for these years reflect new editing procedures instituted by the Bureau of the Census for cases with missing dataon school enrollment items.3Numbers for these years reflect new wording of the educational attainment item in the CPS.4Numbers in these years reflect changes in CPS due to newly instituted computer-assisted interviewing and the change in thepopulation controls used to the 1990 Census-based estimates, with adjustment for undercount in the 1990 Census.
SOURCE: U.S. Department of Commerce, Bureau of the Census, Current Population Survey, October (various years),unpublished data.

37
Table A14—Standard errors for Figure 3: Completion rates for persons ages 18–24 not currentlyenrolled in high school or below, by race–ethnicity: October 1972 through October 1997
Race–ethnicity1
White, Black,Year Total non-Hispanic non-Hispanic Hispanic
(percent)1972 0.32 0.33 1.20 1.831973 0.31 0.31 1.17 1.831974 0.31 0.31 1.17 1.701975 0.30 0.30 1.18 1.721976 0.30 0.31 1.12 1.681977 0.30 0.31 1.12 1.661978 0.30 0.31 1.11 1.611979 0.30 0.31 1.11 1.581980 0.30 0.30 1.07 1.511981 0.29 0.30 1.02 1.461982 0.31 0.32 1.06 1.571983 0.31 0.32 1.06 1.591984 0.31 0.32 0.99 1.541985 0.31 0.32 1.00 1.581986 0.31 0.32 0.99 1.5119872 0.32 0.34 0.99 1.4719882 0.36 0.36 1.13 1.7819892 0.36 0.37 1.11 1.7319902 0.34 0.34 1.03 1.5419912 0.34 0.35 1.06 1.5319922,3 0.33 0.33 1.07 1.5319932,3 0.34 0.35 1.07 1.4919942,3,4 0.34 0.34 1.02 1.4319952,3,4 0.35 0.36 1.01 1.4019962,3,4 0.35 0.34 1.08 1.4919972,3,4 0.35 0.36 1.10 1.421Due to relatively small sample sizes, American Indian/Alaskan Natives and Asian/Pacific Islanders are included in the totalbut are not shown separately.2Numbers for these years reflect new editing procedures instituted by the Bureau of the Census for cases with missing dataon school enrollment items.3Numbers for these years reflect new wording of the educational attainment item in the CPS.4Numbers in these years reflect changes in CPS due to newly instituted computer-assisted interviewing and the change in thepopulation controls used to the 1990 Census-based estimates, with adjustment for undercount in the 1990 Census.
NOTE: Some of the standard error estimates in this table may differ from those previously published due to changes in thegeneralized variance parameters developed by the Bureau of the Census.
SOURCE: U.S. Department of Commerce, Bureau of the Census, Current Population Survey, October (various years),unpublished data.

38
APPENDIX B
Supplemental Tables

39
Table B1—Event dropout rates and number of dropouts and population ages 15–24 in grades 10–12:October 1990 through October 1997
Event dropout Number Populationrate of dropouts enrolled
Year (percent) (thousands) (thousands)
1990 4.0 347 8,6751991 4.0 348 8,70019921 4.4 383 8,70519931 4.5 381 8,46919941,2 5.3 497 9,37719951,2 5.7 544 9,50919961,2 5.0 485 9,61219971,2 4.6 454 9,9841Numbers for these years reflect new wording of the educational attainment item in the CPS.2Numbers in these years reflect changes in CPS due to newly instituted computer-assisted interviewing and the change in thepopulation controls used to the 1990 Census-based estimates, with adjustment for undercount in the 1990 Census.
SOURCE: U.S. Department of Commerce, Bureau of the Census, Current Population Survey, October (various years),unpublished data.

40
Table B2—Standard errors for Table B1: Event dropout rates and number of dropouts and populationages 15–24 in grades 10–12: October 1990 through October 1997
Event dropout Number Populationrate of dropouts enrolled
Year (percent) (thousands) (thousands)
1990 0.34 29 1281991 0.34 29 12819921 0.35 30 12819931 0.36 30 12719941,2 0.34 32 12319951,2 0.35 33 12419961,2 0.34 33 12919971,2 0.32 32 1311Numbers for these years reflect new wording of the educational attainment item in the CPS.2Numbers in these years reflect changes in CPS due to newly instituted computer-assisted interviewing and the change in thepopulation controls used to the 1990 Census-based estimates, with adjustment for undercount in the 1990 Census.
NOTE: Some of the standard error estimates in this table may differ from those previously published due to changes in thegeneralized variance parameters developed by the Bureau of the Census.
SOURCE: U.S. Department of Commerce, Bureau of the Census, Current Population Survey, October (various years),unpublished data.

41
Table B3—Event dropout rates, grades 10–12, ages 15–24, by sex and race–ethnicity: October 1972through October 1997
Race-ethnicity1
Sex White BlackYear Total Male Female non-Hispanic non-Hispanic Hispanic
(percent)1972 6.1 5.9 6.3 5.3 9.5 11.21973 6.3 6.8 5.7 5.5 9.9 10.01974 6.7 7.4 6.0 5.8 11.6 9.91975 5.8 5.4 6.1 5.0 8.7 10.91976 5.9 6.6 5.2 5.6 7.4 7.31977 6.5 6.9 6.1 6.1 8.6 7.81978 6.7 7.5 5.9 5.8 10.2 12.31979 6.7 6.8 6.7 6.0 9.9 9.81980 6.1 6.7 5.5 5.2 8.2 11.71981 5.9 6.0 5.8 4.8 9.7 10.71982 5.5 5.8 5.1 4.7 7.8 9.21983 5.2 5.8 4.7 4.4 7.0 10.11984 5.1 5.4 4.8 4.4 5.7 11.11985 5.2 5.4 5.0 4.3 7.8 9.81986 4.7 4.7 4.7 3.7 5.4 11.91987 4.1 4.3 3.8 3.5 6.4 5.419882 4.8 5.1 4.4 4.2 5.9 10.419892 4.5 4.5 4.5 3.5 7.8 7.819902 4.0 4.0 3.9 3.3 5.0 7.919912 4.0 3.8 4.2 3.2 6.0 7.319922,3 4.4 3.9 4.9 3.7 5.0 8.219932,3 4.5 4.6 4.3 3.9 5.8 6.719943,3,4 5.3 5.2 5.4 4.2 6.6 10.019952,3,4 5.7 6.2 5.3 4.5 6.4 12.419962,3,4 5.0 5.05 5.15 4.1 6.7 9.019972,3,4 4.6 5.0 4.1 3.6 5.0 9.51Due to relatively small sample sizes, American Indian/Alaskan Natives and Asian/Pacific Islanders are included in the totalbut are not shown separately.2Numbers for these years reflect new editing procedures instituted by the Bureau of the Census for cases with missing dataon school enrollment items.3Numbers for these years reflect new wording of the educational attainment in the CPS.4Numbers in these years reflect changes in CPS due to newly instituted computer-assisted interviewing and the change in thepopulation controls used to the 1990 Census-based estimates, with adjustment for undercount in the 1990 Census.5Revised from Dropout Rates in the United States: 1996.
SOURCE: U.S. Department of Commerce, Bureau of the Census, Current Population Survey, October (various years),unpublished data.

42
Table B4—Standard errors for Table B3: Event dropout rates, grades 10–12, ages 15–24, by sex andrace–ethnicity: October 1972 through October 1997
Race–ethnicity1
Sex White BlackYear Total Male Female non-Hispanic non-Hispanic Hispanic
(percent)1972 0.33 0.46 0.48 0.34 1.32 2.811973 0.33 0.49 0.45 0.35 1.35 2.651974 0.34 0.51 0.46 0.35 1.41 2.521975 0.32 0.44 0.46 0.33 1.25 2.501976 0.32 0.48 0.43 0.35 1.15 2.051977 0.34 0.49 0.46 0.37 1.20 2.131978 0.34 0.51 0.46 0.36 1.31 2.751979 0.34 0.49 0.48 0.37 1.32 2.431980 0.33 0.49 0.45 0.35 1.21 2.561981 0.33 0.47 0.46 0.34 1.29 2.281982 0.34 0.49 0.46 0.36 1.21 2.311983 0.33 0.50 0.45 0.35 1.17 2.441984 0.33 0.49 0.46 0.36 1.06 2.511985 0.34 0.50 0.48 0.36 1.26 2.551986 0.32 0.46 0.45 0.34 1.05 2.6919872 0.30 0.44 0.41 0.33 1.14 1.8919882 0.36 0.52 0.50 0.39 1.20 3.0919892 0.36 0.51 0.51 0.37 1.39 2.6519902 0.34 0.48 0.47 0.36 1.15 2.2919912 0.34 0.46 0.49 0.36 1.20 2.1719922,3 0.35 0.46 0.53 0.38 1.09 2.2319932,3 0.36 0.51 0.50 0.40 1.20 2.0319942,3,4 0.34 0.48 0.49 0.37 1.03 1.5219952,3,4 0.35 0.51 0.48 0.38 1.00 1.6119962,3,4 0.34 0.49 0.50 0.38 1.05 1.5019972,3,4 0.32 0.47 0.43 0.35 0.92 1.451Due to relatively small sample sizes, American Indian/Alaskan Natives and Asian/Pacific Islanders are included in the totalbut are not shown separately.2Numbers for these years reflect new editing procedures instituted by the Bureau of the Census for cases with missing dataon school enrollment items.3Numbers for these years reflect new wording of the educational attainment in the CPS.4Numbers in these years reflect changes in CPS due to newly instituted computer-assisted interviewing and the change in thepopulation controls used to the 1990 Census-based estimates, with adjustment for undercount in the 1990 Census.
NOTE: Some of the standard error estimates in this table may differ from those previously published due to changes in thegeneralized variance parameters developed by the Bureau of the Census.
SOURCE: U.S. Department of Commerce, Bureau of the Census, Current Population Survey, October (various years),unpublished data.
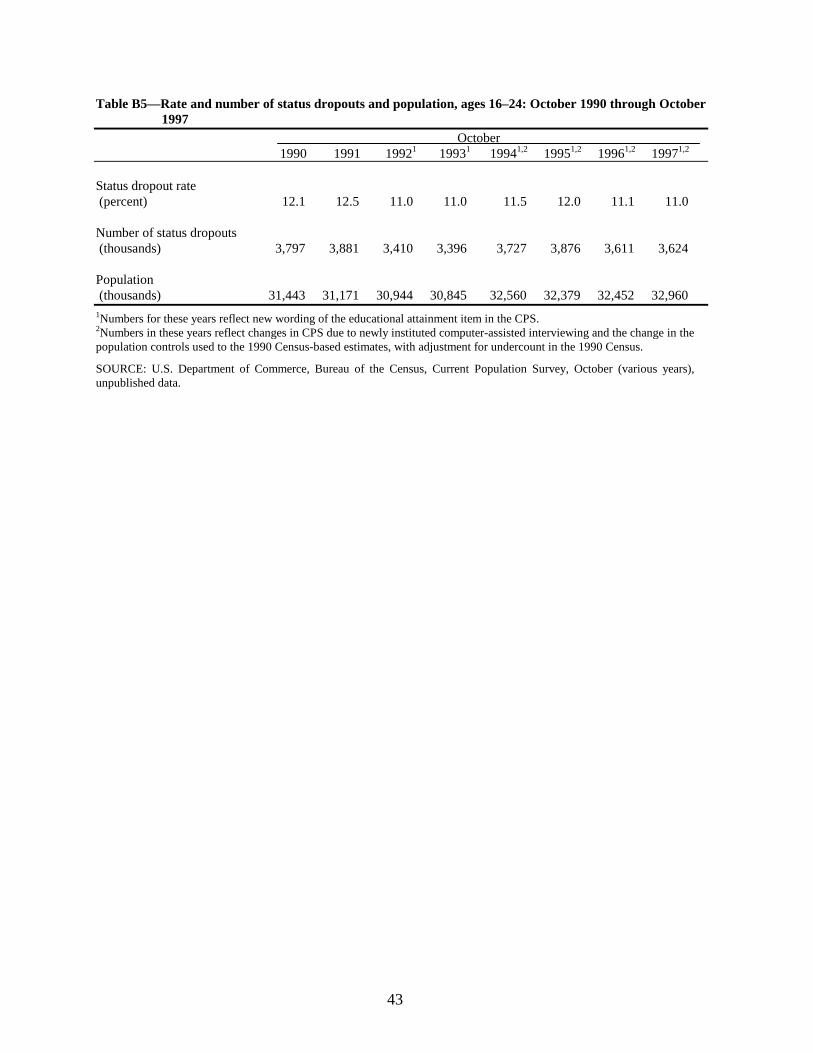
43
Table B5—Rate and number of status dropouts and population, ages 16–24: October 1990 through October1997
October1990 1991 19921 19931 19941,2 19951,2 19961,2 19971,2
Status dropout rate (percent) 12.1 12.5 11.0 11.0 11.5 12.0 11.1 11.0
Number of status dropouts (thousands) 3,797 3,881 3,410 3,396 3,727 3,876 3,611 3,624
Population (thousands) 31,443 31,171 30,944 30,845 32,560 32,379 32,452 32,9601Numbers for these years reflect new wording of the educational attainment item in the CPS.2Numbers in these years reflect changes in CPS due to newly instituted computer-assisted interviewing and the change in thepopulation controls used to the 1990 Census-based estimates, with adjustment for undercount in the 1990 Census.
SOURCE: U.S. Department of Commerce, Bureau of the Census, Current Population Survey, October (various years),unpublished data.

44
Table B6—Standard errors for Table B5: Rate and number of status dropouts and population, ages 16–24: October 1992 through October 1997
October1990 1991 19921 19931 19941,2 19951,2 19961,2 19971,2
Status dropout rate (percent) 0.29 0.30 0.28 0.28 0.26 0.27 0.27 0.27
Number of status dropouts (thousands) 92 93 88 88 85 86 87 871Numbers for these years reflect new wording of the educational attainment item in the CPS.2Numbers in these years reflect changes in CPS due to newly instituted computer-assisted interviewing and the change in thepopulation controls to the 1990 Census-based estimates, with adjustment for undercount in the 1990 Census.
NOTE: Some of the standard error estimates in this table may differ from those previously published due to changes in thegeneralized variance parameters developed by the Bureau of the Census.
SOURCE: U.S. Department of Commerce, Bureau of the Census, Current Population Survey, October (various years),unpublished data.

45
Table B7—NELS:88 8th- to 12th-grade cohort dropout rates, by sex and race–ethnicity: 1992 and 1994 Cohort dropout rate
Spring Spring August AugustCharacteristics 1990–921 1988–92 1988–92 1988–94
(percent) Total 7.1 10.8 10.1 7.2
Sex Male 6.9 10.3 9.8 7.5 Female 7.4 11.3 10.4 6.9
Race–ethnicity2
Asian/Pacific Islander 3.9 4.9 4.3 5.1 Hispanic 12.2 17.8 17.2 14.1 Black, non-Hispanic 9.1 13.4 12.7 8.5 White, non-Hispanic 5.9 9.1 8.3 5.8 American Indian or Alaskan Native 22.3 30.4 30.4 17.11The denominator for this rate includes the members of the 1988 eighth-grade cohort who were still enrolled in school in thespring of 1990; excluded are students who dropped out between 1988 and 1990 and students who migrated out of thecountry or died.2Not shown separately are 434 persons (approximately 2 percent of the unweighted sample) whose race–ethnicity isunknown.
NOTE: This table is based on the core cohort of eighth graders (i.e., this sample excludes students in the base year samplewhose sex, race–ethnicity, and dropout status were determined through the Followback Study of Excluded Students). Assuch, numbers may differ from earlier reports.
SOURCE: U.S. Department of Education, National Center for Education Statistics, National Education Longitudinal Studyof 1988 Base Year, First, Second, and Third Follow-up Surveys, 1988, 1990, 1992, and 1994, unpublished data.

46
Table B8—Standard errors for Table B7: NELS:88 8th- to 12th-grade cohort dropout rates, by sex andrace–ethnicity: 1992 and 1994
Cohort dropout rate Spring Spring August Spring
Characteristics 1990–921 1988–92 1992 1994
(percent) Total 0.40 0.52 0.47 0.45
Sex Male 0.53 0.65 0.62 0.69 Female 0.55 0.73 0.65 0.48
Race–ethnicity2
Asian/Pacific Islander 1.55 1.55 1.54 1.78 Hispanic 1.36 1.51 1.49 1.44 Black, non-Hispanic 1.16 1.61 1.51 1.30 White, non-Hispanic 0.41 0.54 0.47 0.49 American Indian or Alaskan Native 7.57 8.62 8.62 4.921The denominator for this rate includes the members of the 1988 eighth-grade cohort who were still enrolled in school in thespring of 1990; excluded are students who dropped out between 1988 and 1990 and students who migrated out of thecountry or died.2Not shown separately are 434 persons (approximately 2 percent of the unweighted sample) whose race–ethnicity isunknown.
NOTE: This table is based on the core cohort of eighth graders (i.e., this sample excludes students in the base year sample,whose sex, race–ethnicity, and dropout status were determined through the Followback Study of Excluded Students). Assuch, numbers may differ from earlier reports.
SOURCE: U.S. Department of Education, National Center for Education Statistics, National Education Longitudinal Studyof 1988 Base Year, First, and Second Followup Surveys, 1988, 1990, 1992, and 1994, unpublished data.

47
Table B9—HS&B and NELS:88 10th- to 12th-grade cohort dropout rates, by demographiccharacteristics: August 1982 and 1992
Cohort dropout rate HS&B NELS:88
Status in 10th grade 1980–82 1990–92
(percent)
Total 9.9 5.6
Sex Male 11.0 5.2 Female 9.0 6.0
Race–ethnicity* Asian/Pacific Islander 2.2 4.6 Hispanic 16.8 10.9 Black, non-Hispanic 11.3 7.6 White, non-Hispanic 8.8 4.3 American Indian or Alaskan Native 25.1 18.2
Family below poverty level Yes 13.0 10.9 No 6.1 3.6
Family composition Two parents 5.5 4.2 Two adults/one parent 12.9 7.9 Single parent 11.0 7.4 Other 19.8 10.4
Own child in home Yes Male 19.4 6.8 Female 33.0 18.3
No Male 8.3 5.1 Female 7.0 5.5
*Not shown separately are those included in the total whose race–ethnicity is unknown.
NOTE: See Appendix C for the definitions of poverty and family composition used in these tables.
SOURCES: U.S. Department of Education, National Center for Education Statistics, High School and Beyond Study,Sophomore Cohort, First Follow-up Survey, 1982, unpublished data. U.S. Department of Education, National Center forEducation Statistics, National Education Longitudinal Study of 1988 First and Second Follow-up Surveys, 1990 and 1992,unpublished data.

48
Table B10—Standard errors for Table B9: HS&B and NELS:88 10th- to 12th-grade cohort dropoutrates, by demographic characteristics: August 1982 and 1992
Cohort dropout rate HS&B NELS:88
Status in 10th grade 1980–82 1990–92
(percent) Total 0.42 0.36
Sex Male 0.64 0.45 Female 0.54 0.56
Race–ethnicity* Asian/Pacific Islander 0.73 2.14 Hispanic 1.65 1.44 Black, non-Hispanic 1.15 1.22 White, non-Hispanic 0.46 0.33 American Indian or Alaskan Native 5.33 8.09
Family below poverty level Yes 0.86 1.16 No 0.28 0.35
Family composition Two parents 0.24 0.42 Two adults/one parent 1.25 1.06 Single parent 0.78 0.96 Other 1.86 2.22
Own child in home Yes Male 6.50 2.35 Female 7.42 3.91
No Male 0.38 0.46 Female 0.36 0.56
*Not shown separately are those included in the total whose race–ethnicity is unknown.
NOTE: See Appendix C for the definitions of poverty and family composition used in these tables.
SOURCES: U.S. Department of Education, National Center for Education Statistics, High School and Beyond Study,Sophomore Cohort, First Followup Survey, 1982, unpublished data. U.S. Department of Education, National Center forEducation Statistics, National Education Longitudinal Study of 1988 First and Second Followup Surveys, 1990 and 1992,unpublished data.

49
APPENDIX C
Technical Notes

50
Definition of Who Is a Dropout
There are variations in the dropout definitions in the existing data sources, includingthe Current Population Survey (CPS), the High School and Beyond Study (HS&B), and theNational Education Longitudinal Study of 1988 (NELS:88). In addition, the age or grade spanexamined and the type of dropout rate—status, event, or cohort—varies across the datasources. Furthermore, there were potentially significant changes in CPS procedures in 1986,1992, and 1994.
Defining and Calculating Event Dropout Rates Using the CCD
The Common Core of Data (CCD) administered by NCES is an annual survey of thestate-level education agencies in the 50 states, the District of Columbia, and the outlyingareas. Statistical information is collected on public schools, staff, students, and finance.
A dropout data collection component was field tested during the 1989–90 school year.The participants were in approximately 300 school districts that included representativesfrom 27 states and two territories. The data were gathered through administrative recordsmaintained at school districts and schools. The field test data were used to inform the designof a dropout statistics component for CCD.
The definition that was agreed upon by NCES and the states was the following:
A dropout is an individual who:
1. Was enrolled in school at some time during the previous school year;2. Was not enrolled at the beginning of the current school year;3. Has not graduated from high school or completed a state- or district-approved
educational program; and4. Does not meet any of the following exclusionary conditions: transfer to another
public school district, private school, or state- or district-approved educationprogram; temporary absence due to suspension or school-approved educationprogram; or death.
For the purpose of this definition:
• The school year is the 12-month period of time from the first day of school(operationally set as October 1), with dropouts from the previous summerreported for the year and grade for which they fail to enroll;
• Individuals who are not accounted for on October 1 are considered dropouts;• An individual has graduated from high school or completed a state- or district-
approved educational program upon receipt of formal recognition from schoolauthorities. State- or district-approved educational program may consist ofspecial education and district or state sponsored GED preparation.

51
The collection was initiated with a set of instructions to state CCD coordinators in thesummer of 1991. Those instructions specified the details of dropout data to be collectedduring the 1991-92 school year. Dropouts, like graduates, are reported for the precedingschool year. The 1991-92 data were submitted to NCES as a component of the 1992-93 CCDdata collection. Most recently, the 1995-96 dropout data were submitted as a component ofthe 1996-97 CCD collection.
The dropout collection through the National Center for Education Statistics (NCES)Common Core of Data (CCD) is designed to be consistent with the current CPS procedures.However, the CCD collection includes dropouts in grades 7 through 12 versus only grades 10through 12 in the CPS. The CCD collection is based on administrative records rather than ahousehold survey as in CPS. One other difference in the CCD collection is that the CCDcounts anyone receiving a GED outside of a regular (approved) secondary education programas a dropout.
As in the development of any nationally consistent definition, there is considerablevariation in the dropout definition across local, state, and federal data collections on suchissues as whether:
• those who return to school after October 1 are identified as dropouts;• those who complete a grade and drop out over the summer are attributed to the
grade completed or the next grade;• students entering GED programs are considered dropouts; and• a student that drops out more than once can be counted as a dropout more than
once.
As this process progresses further, there will, no doubt, be some discontinuities indropout reporting as more consistent data become available.
Defining and Calculating Dropout Rates Using the CPS
Event Rates
The October Supplement to the CPS is the only national data source that can currentlybe used to estimate annual national dropout rates. As a measure of recent dropoutexperiences, the event rate measures the proportion of students who dropped out over a one-year interval of time.
The numerator of the event rate for 1997 is the number of persons 15 through 24 yearsold surveyed in 1997 who were enrolled in high school (grades 10–12) in October 1996, werenot enrolled in high school in October 1997, and who also did not complete high school (thatis, had not received a high school diploma or an equivalency certificate) between October1996 and October 1997.

52
The denominator of the event rate for 1997 is the sum of the dropouts (that is, thenumerator) and the number of all persons 15 through 24 years old who attended grades 10,11, and 12 in October 1996 who were still enrolled in October 1997 or who graduated orcompleted high school between October 1996 and October 1997.
The dropout interval is defined to include the previous summer and the current schoolyear; so that once a grade is completed, the student is then at risk of dropping out of the nextgrade. Given that the data collection is tied to each young adult’s enrollment status inOctober of two consecutive years, any student who drops out and returns within the 12-monthperiod is not counted as a dropout.
Status Rates
The status dropout rate is a cumulative rate that estimates the proportion of youngadults who are dropouts, regardless of when they dropped out.
The numerator of the status rate for 1997 is the number of young adults ages 16through 24 years of age who, as of October 1997, had not completed high school and werenot currently enrolled. The denominator is the total number of 16- through 24-year-olds inOctober 1997.
CPS Design
CPS is a nationally representative sample survey of all households. The survey isconducted in approximately 60,000 dwelling units in 729 primary sampling units. Dwellingunits are in-sample for four successive monthly interviews, out-of-sample for the next 8months, and then returned to the sample for the following four months. The sample frame is acomplete list of dwelling-unit addresses at the Census updated by demolitions and newconstruction and field listings. The population surveyed excludes members of the ArmedForces, inmates of correctional institutions, and patients in long-term medical or custodialfacilities; it is referred to as the civilian, non-institutionalized population. Typically, about 4percent of dwelling units are not interviewed, because occupants are not at home afterrepeated callbacks, or for some other reason.
An adult member of each household serves as the informant for that household,supplying data for each member of the household. In addition, in October supplementaryquestions regarding school enrollment are asked about eligible household members 3 yearsold and over. Most interviews are conducted by phone using computer-assisted telephoneinterviewing.

53
CPS Dropout Data Collection
CPS data on educational attainment and enrollment status in the current year and prioryear are used to identify dropouts; and additional CPS data are used to describe some basiccharacteristics of dropouts. The CPS provides the only source of national time series data ondropout rates. However, because CPS collects no information on school characteristics andexperiences, its uses in addressing dropout issues are primarily for providing some insightsinto who drops out. In addition, the sample design of the CPS yields estimates for Hispanicsthat tend to have large standard errors, which make it difficult to interpret patterns inHispanic dropout rates.
The October CPS Supplement enrollment items used to identify dropouts include thefollowing:
• Is...attending or enrolled in regular school?
• What grade or year is...attending?
• Was...attending or enrolled in a regular school or college in October, 199-, that is,of October of last year?
• What grade or year was...attending last year?
Changes Introduced in 1986
In an effort to improve data quality, in 1986 the Bureau of Census instituted newediting procedures for cases with missing data on school enrollment items. The effect of theediting changes were evaluated for data from 1986 by applying both the old and new editingprocedures. The result was an increase in the number of students enrolled in school thecurrent year and a decrease in the number of students enrolled last year but not enrolled in thecurrent year (i.e. dropouts). The new editing procedures lowered, but not significantly, the1986 event rate for grades 10–12, ages 14 through 24, by about 0.4 percentage points, from4.69 to 4.28. The changes in the editing procedures made even less of a difference in thestatus dropout rates for 16- through 24-year-olds (12.2 percent based on the old proceduresand 12.1 percent based on the new).
Changes Introduced in 1992
Prior to 1992, educational attainment was based on the control card questions onhighest grade attended and completed. Identification as a high school graduate was derivedbased on attendance and completion of grade 12.
54
The control card items used to identify educational attainment were:
• What is the highest grade or year...has attended?
• Did...complete that grade?
The 1992 redesign of the CPS introduced a change in the data used to identify highschool completers. Dropout data from the CPS are now based on a combination of controlcard data on educational attainment and October Supplement data on school enrollment andeducational attainment. In 1992 the Census Bureau changed the items on the control cardwhich measured each individual’s educational attainment.
The new control card educational attainment item is as follows:
• What is the highest level of school... has completed or the highest degree...hasreceived?
The following response categories are used for high school:
• 9th grade,
• 10th grade,
• 11th grade, and
• 12th grade—no diploma.
Students whose highest grade completed is the 9th, 10th, or 11th grade are assumed to havedropped out in the next grade (i.e., the 10th, 11th, and 12th grades, respectively).
The following response categories are used to identify high school completers:
• high school graduate—high school diploma or the equivalent (for example GED);and
• all categories indicating some postsecondary education, from some college, nodegree through doctorate degree.
Although the response categories are not automatically read to each respondent, theycan be used as a prompt to help clarify the meaning of a question or a response. Identificationas a high school completer is based on the direct response to the new control card educationalattainment item.
Differences in the pre- and post-1992 methods of identifying high school completersreflect two phenomena: not all 12th-grade completers receive a high school diploma or

55
equivalent, and not all holders of a high school diploma or certificate complete the 12thgrade. These differences have an impact on the numbers and proportions of event and statusdropouts.
Differences in event rates. In the case of the event rate, in prior years students whocompleted 12th grade and left school without graduating or receiving an equivalent credentialwere counted as completers when they were in fact dropouts. On the other hand, somestudents who left school because they completed high school before the 12th grade wereidentified as dropouts when they were really early completers (e.g., those who passed theCalifornia Challenge Exam, received a GED certificate, or were admitted early to college).29
The current use of actual graduation or completion status includes the first group as dropoutsand the second group as completers.
Compared to before, the event dropout rate includes 12th graders who did not receivea credential of some sort in the numerator count of dropouts and the early completers are notincluded in the numerator as dropouts. The denominator is not changed.
In 1992, the net effect of these changes resulted in an increase in the aggregate eventdropout rate that was not significant. In 1992, the October CPS included both versions of theeducational attainment items—the old items based on the number of years of schoolcompleted and the new one based on the more accurate response categories.30 Using the olditems, the estimated event rate for 1992 was 4.0, compared with a rate of 4.4 percent in 1992using the new educational attainment item.
Differences in the status rate. The status rate involves a third group of students whowere coded differently prior to 1992. These students leave high school before completing the12th grade, never complete the 12th grade, but later graduate or complete high school bysome alternative means, such as an equivalency exam. Prior to 1992 these young adults werecoded as dropouts. Since 1992, members of this group have been coded as graduates orcompleters. Furthermore, the explicit inclusion of high school graduation or completion,including the GED as a response category may have increased the likelihood of identifyinglate completers.
Under the procedures introduced in 1992, the 12th graders who do not complete highschool or the equivalent are now included in the numerator of the status dropout rate whileearly and late completers are not included in the numerator. The denominator is not changed.These changes, including the identification and removal of late completers from the dropoutcount, contributed to a decrease in the status dropout rate. Indeed, using years of school 29Although prior to 1992 the questionnaire did not have the words “high school diploma or equivalency certificate,” theinterviewer instructions included an instruction to record 12th grade for people who completed high school with a GED orother certificate although they had dropped out earlier. The specific inclusion of these words on the questionnaire appear tohave made a difference in the quality of responses from the household informant.30Unlike prior years, however, data for individuals missing on the variables representing years of school completed (“Whatis the highest grade or year …has attended?” and “Did…complete that grade?”) were not imputed by the Census Bureau.For this analysis we imputed missing data on these variables based on the grade they attended last year (if enrolled lastyear). For those individuals that were missing data and were not enrolled last year we imputed their highest grade completedby examining the responses to the new educational attainment variable.

56
completed rather than the new educational attainment item, the status rate in 1992 rises to11.4 percent rather than the 11.0 percent based on the new educational attainment item.However, the estimate of 11.4 percent is still much lower than the status rate for 1991 (12.5percent). While this could represent real change in the status dropout rate, the fact that thiswould be the largest decrease in the status dropout rate seen in the time series data from 1972to 1995, coupled with the fact that the rate for 1993 also was 11.0 percent, leads one tospeculate that the introduction of the new educational attainment item resulted in moreaccurate data on educational attainment throughout the survey, including the variables thathad been used to calculate the number of years of school completed.
One exception to the procedures to identify dropouts in CPS is the treatment by theBureau of the Census of students in special schools (i.e., not regular schools). These specialschools are:
. . . schools that are not in the regular school system, such as trade schools,business colleges, and schools for the mentally handicapped, which do notadvance students to regular school degrees.31
When the Census Bureau identifies students in special schools, they code them as notenrolled in regular school. Therefore, if a person enrolled in a special school is reported ascompleting less than the 12th grade, he or she will be counted as a status dropout.
Changes Introduced in 1994
During the 1994 data collection and processing, two additional changes wereimplemented in the CPS. Computer-assisted telephone interviewing (CATI) was introduced,resulting in higher completion rates for each individual data item and thus less reliance onallocation of missing responses. If the allocation procedures yielded a distribution differentfrom the 1994 reported patterns, there is the potential for a change in the distribution of thehigh school completion status.
In 1994 there were also changes introduced in the processing and computing phase ofdata preparation. The benchmarking year for these survey estimates was changed from the1980 Census to the 1990 Census. In addition, adjustments for undercount in the Census werealso included, which had not been done before. Thus, any age, sex, or racial–ethnic groupsthat were found to be under-represented in the 1990 Census were given increased weights.Analysis using 1993 data of the effect of the changes in the benchmarking year andadjustment of undercount indicates the change especially affected the weights assigned toHispanic young adults (table C1).
31U.S. Department of Commerce, Bureau of the Census, School Enrollment-Social and Economic Characteristics ofStudents: October 1994. U.S. Government Printing Office, September 1996.

57
Table C1: Average weights and population estimates using 1980 and 1990 Census–based weights for all15- to 24-year-olds, by race–ethnicity: October 1993
1980 based 1990 based Population Population
Average estimate Average estimate PercentageRace–ethnicity weight (thousands) weight (thousands) change*
White, non-Hispanic 1.79 23,911 1.84 24,611 2.8Black, non-Hispanic 2.25 5,087 2.33 5,285 3.6Hispanic 2.09 3,998 2.48 4,747 18.7
*Change in rates between 1980-based weights and 1990-based weights using 1980 as the base year (i.e., for whites thecalculation is: {(1.84-1.79)/1.79}.
SOURCE: U.S. Department of Commerce, Bureau of the Census, Current Population Survey, various years, unpublisheddata.
These changes have the potential for affecting both the numerator and denominator ofthe dropout rates. Analyses of the 1993 data showed that the change in the benchmark yearfor the sample weights increased the Hispanic status and event dropout rates somewhat, whileit had little effect on the white or black rates (table C2). However, the change in the overallevent and status rates appears to be driven by the increase in the estimated size of theHispanic population. Since Hispanics drop out at higher rates than other groups, increasingtheir relative proportion of the population increases the overall dropout rates.
Table C2 shows that overall the change in the benchmark year had a larger impact onstatus rates than on event rates. Using the 1990-based weights increased the event rate by 1.3percent, but raised the status rate by 3.2 percent.

58
Table C2—Estimated event and status dropout rates based on 1980 and 1990 Census weights:
Table C2—October 1993
1980-based 1990-basedweights weights in rates
Characteristics Event Status Event Status Event Status
Total 4.46 11.01 4.52 11.36 1.3 3.2
Sex
Male 4.58 11.17 4.65 11.61 1.5 4.0
Female 4.34 10.85 4.38 11.10 1.0 2.3
Race–ethnicity
White non-Hispanic 3.93 7.94 3.95 7.96 0.5 0.3
Black non-Hispanic 5.83 13.56 5.81 13.52 -0.3 -0.3Hispanic 6.72 27.52 6.90 27.88 2.8 1.3
Percent differences
(percent) (percent)
SOURCE: U.S. Department of Commerce, Bureau of the Census, Current Population Survey (various years),unpublished data.

59
Defining and Calculating High School Completion Rates Using the CPS
The educational attainment and high school completion status data from the OctoberCPS are also used to measure the high school graduation and completion rates. Thecompletion rate computed and published is for the young adult population in the yearsbeyond high school—that is, the 18- to 24-year-old population. These rates are reportednationally by race–ethnicity. At the state level, three-year moving averages are computed toyield more stable estimates for completion rates.
As was noted in the text, the state completion rates reflect the experiences of the 18- to24-year-olds living in the state at the time of the interview; thus, movements in and out ofstates to accommodate employment and postsecondary education may be evident in somestates. For example, a state with a relatively large unskilled labor employment sector mighthave a lower high school completion rate than anticipated, due to an influx of young workers.Conversely, a state with a disproportionate number of colleges and universities might have ahigher high school completion rate than anticipated, due to an influx of postsecondarystudents.
Increases in GED rates
The section on completion indicated that there was a substantial increase in the lastfew years in the estimate of the percentage of 18- to 24-year-olds getting GEDs. For example,the alternative completion rate was 4.9 percent in 1993, but rose to 7.0 percent in 1994, andto 9.8 percent in 1996, and then was 9.1 in 1997. Although the standard errors on theseestimates are fairly large, the absolute change is also quite large. The large increase between1993 and 1994 came at the time when CPS instituted CATI in 1994.
The American Council on Education (ACE), which administers the GED, producesannual reports on the number of persons taking the GED and the number of persons whowere issued a GED credential. From these reports it is possible to calculate the number of18- to 24-year-olds who received a GED in the past year for 1990 through 1997. It is alsopossible to estimate the same quantity from the CPS data for 1990 to 1997 by looking at onlythose who were reported to have completed a GED last year and using this, along with theGED item, to calculate how many 18- to 24-year-olds obtained GEDs each year. The CPSestimates of the number of GED recipients in the years 1990 to 1993 were lower than theACE estimates in each of these years. The CPS estimates for 1994 through 1997 are muchcloser to the estimates from the American Council on Education than previous years and arenot statistically different than those for the ACE in these later years (figure C1 and table C3).

60
Figure C1—Number of 18- to 24-year-olds who received a GED in given year: 1990 to 1997
-
50,000
100,000
150,000
200,000
250,000
300,000
350,000
1990 1991 1992 1993 1994 1995 1996 1997
Year
GED serviceCPS
SOURCE: U.S. Department of Commerce, Bureau of the Census, Current Population Survey, various years, unpublisheddata; and American Council on Education, GED Testing Service, GED Statistical Report, 1990 to 1997.

61
Table C3—Number of 18- to 24-year-olds who received a GED in given year: 1990 to 1997Standard error
Year GED Service CPS CPS1990 222,295 111,023 16,728 1991 247,767 117,371 17,197 1992 249,470 107,030 16,425 1993 241,787 107,415 16,455 1994 247,051 211,560 23,047 1995 256,441 237,876 24,424 1996 258,957 312,645 27,957 1997 244,749 286,811 26,793
SOURCE: U.S. Department of Commerce, Bureau of the Census, Current Population Survey, various years, unpublisheddata; and American Council on Education, GED Testing Service, GED Statistical Report, 1990 to 1997.
Definition of Family Income in CPS
Family income is derived from a single question asked of the household respondent.Income includes money income from all sources including jobs, business, interest, rent,social security payments, and so forth. The income of nonrelatives living in the household isexcluded, but the income of all family members 14 years old and over, including thosetemporarily living away, is included. Family income refers to receipts over a 12-monthperiod.
Income for families from which no income information was obtained (about 5 percentof families) was imputed. A sequential hot deck procedure was used. A total of 200imputation classes were created—5 levels of the age of head of household by 5 levels of theeducation of the head of household by 2 levels for the employment status of the head ofhousehold, and 4 levels of the number of workers in the household. To minimize the multipleuse of a single donor, up to 5 donors were placed in each imputation class. A donor wasselected at random from these when a family with missing income information wasencountered. In a few instances (about 10 of 50,000 families in each year) an imputation classhad no donors but a family from the class with missing income information was encountered.In these cases a donor was selected by collapsing similar classes until a non-emptyimputation class was created.
To facilitate comparisons over time, the categorical family income information wastransformed into a continuous family income variable. The transformation was accomplishedby randomly assigning for each family an income value from the income interval to whichtheir income belonged. For intervals below the median a rectangular probability densityfunction was used; for those above the median a Pareto probability density function was used.The methodology has a feature that if the continuous family income variable weretransformed back to a categorical family income variable, the value for each family would beidentical to the original data. Based on the continuous family income variable, a familyincome percentile variable is calculated for each person in the survey which represents thatperson’s position in the family income distribution. For example, if 25 percent of all personshave a lower value of family income (and 75 percent have a higher value), then the person’s

62
family income percentile variable has a value of 25. The methodology gives all persons in thesame household the same value of both the categorical and continuous versions of familyincome. There are several issues that affect the interpretation of dropout rates by familyincome using the CPS. First, it is possible that the family income of the students at the timethey dropped out was somewhat different than their current family income.
Furthermore, family income is from a single question asked of the householdrespondent in the October CPS. In some cases, there are persons 15 through 24 years oldliving in the household who are unrelated to the household respondent, yet whose familyincome is defined as the income of the family of the household respondent. Therefore, thecurrent household income of the respondent may not accurately reflect that person’s familybackground. In particular, some of the young adults in the 15- through 24-year age range donot live in a family unit with a parent present. An analysis of 1997 event dropout rates byfamily income and family status (presence of parent in the household) indicates whether anybias is introduced into the analysis of dropout rates by family income by including in theanalysis youth not living with at least one parent (table C4). About ten percent of 15- to 24-year-olds enrolled in high school in the previous year were not living with a parent and thepercentage was much higher for students in low-income households than for those frommiddle- and high-income households.
The event dropout rate was lower for those with at least one parent in the householdthan for those not living with a parent. This was true for all 15- to 24-year-olds as well aswithin each category of household income. The dropout rate for those with at least one parentin the household was 82 to 83 percent of the dropout rate for all 15- to 24-year-olds withineach of the three categories of household income. As a result, despite the fact that a muchhigher proportion of students in low-income households did not reside with a parent, therelative relationships among dropout rates for the three income groups were similar for thosewith a parent in the household as they were for all 15- to 24-year-olds. Specifically, the eventdropout rate for those from low-income households was about three times higher than forthose from middle-income households and seven times higher than for those from high-income households, both among all 15- to 24-year-olds and among those residing with atleast one parent.
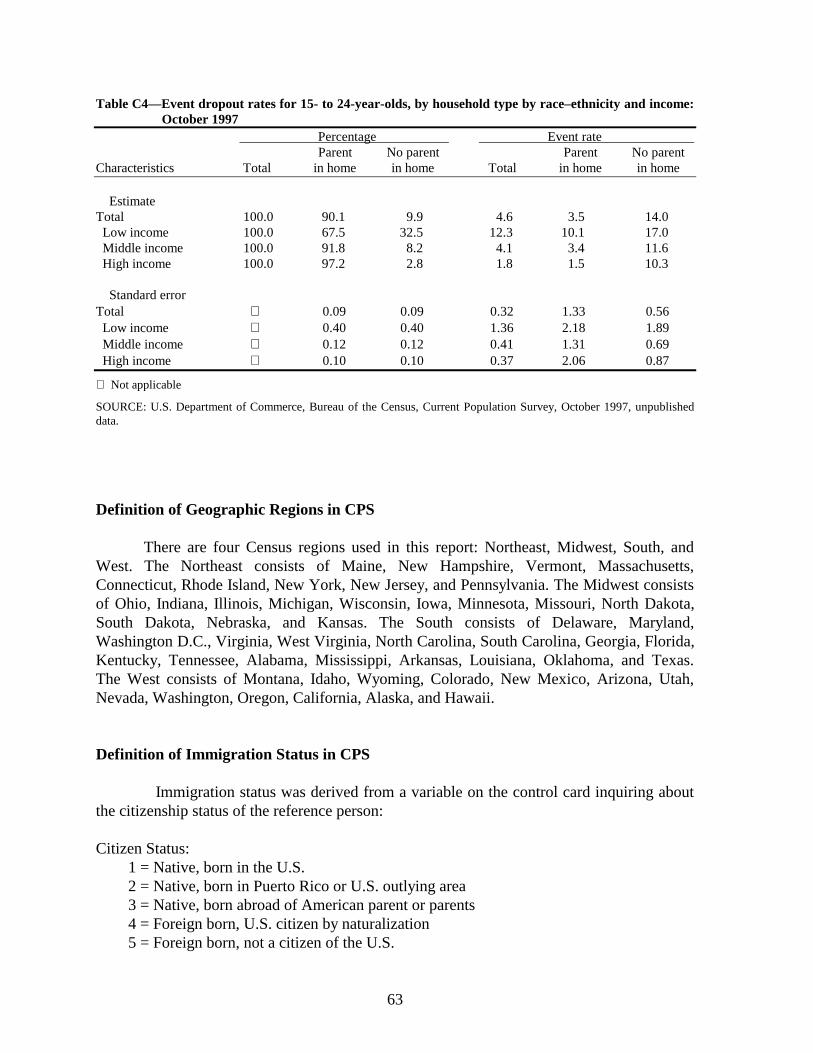
63
Table C4—Event dropout rates for 15- to 24-year-olds, by household type by race–ethnicity and income:October 1997
Percentage Event rate Parent No parent Parent No parent
Characteristics Total in home in home Total in home in home
EstimateTotal 100.0 90.1 9.9 4.6 3.5 14.0 Low income 100.0 67.5 32.5 12.3 10.1 17.0 Middle income 100.0 91.8 8.2 4.1 3.4 11.6 High income 100.0 97.2 2.8 1.8 1.5 10.3
Standard errorTotal 0.09 0.09 0.32 1.33 0.56 Low income 0.40 0.40 1.36 2.18 1.89 Middle income 0.12 0.12 0.41 1.31 0.69 High income 0.10 0.10 0.37 2.06 0.87
Not applicable
SOURCE: U.S. Department of Commerce, Bureau of the Census, Current Population Survey, October 1997, unpublisheddata.
Definition of Geographic Regions in CPS
There are four Census regions used in this report: Northeast, Midwest, South, andWest. The Northeast consists of Maine, New Hampshire, Vermont, Massachusetts,Connecticut, Rhode Island, New York, New Jersey, and Pennsylvania. The Midwest consistsof Ohio, Indiana, Illinois, Michigan, Wisconsin, Iowa, Minnesota, Missouri, North Dakota,South Dakota, Nebraska, and Kansas. The South consists of Delaware, Maryland,Washington D.C., Virginia, West Virginia, North Carolina, South Carolina, Georgia, Florida,Kentucky, Tennessee, Alabama, Mississippi, Arkansas, Louisiana, Oklahoma, and Texas.The West consists of Montana, Idaho, Wyoming, Colorado, New Mexico, Arizona, Utah,Nevada, Washington, Oregon, California, Alaska, and Hawaii.
Definition of Immigration Status in CPS
Immigration status was derived from a variable on the control card inquiring aboutthe citizenship status of the reference person:
Citizen Status:1 = Native, born in the U.S.2 = Native, born in Puerto Rico or U.S. outlying area3 = Native, born abroad of American parent or parents4 = Foreign born, U.S. citizen by naturalization5 = Foreign born, not a citizen of the U.S.

64
Those coded (1) above (Native, born in U.S.) were considered born in the 50 statesand the District of Columbia. All others were considered born elsewhere. (In 1997, about 1.0percent of all 16- to 24-year-olds and of Hispanic 16- to 24-year-olds were born abroad toAmerican parents.)
Imputation for Item Non-Response
For many key items in the October CPS, the Bureau of the Census imputes data forcases with missing data due to item non-response. However, item non-response data for themethod of high school completion were not imputed by the Bureau of the Census. Specialimputations were conducted for these items using a sequential hot deck procedureimplemented through the PROC IMPUTE computer program developed by the AmericanInstitutes for Research.32 Three categories of age, two categories of race, two categories ofsex, and two categories of citizenship were used as imputation cells.
32D. H. McLaughlin, Imputation for Non-Response Adjustment, American Institutes for Research, October 1991, updated:February 1994.

65
Defining and Calculating Cohort Dropout Rates Using NELS:88
The NELS:88 base-year survey comprised a national probability sample of all regularpublic and private 8th-grade schools in the 50 states and District of Columbia in the 1987–88school year. Excluded from the NELS:88 sample were Bureau of Indian Affairs schools,special education schools for the handicapped, area vocational schools that do not enrollstudents directly, and schools for dependents of U.S. personnel overseas; such school-levelexclusions have a very small impact on national estimates.
NELS:88 started with the base-year data collection in which students, parents,teachers, and school administrators were selected to participate in the survey. NELS:88 beganwith a target sample of 1,032 sample schools, of which 30 were deemed ineligible. Some 698of the 1,002 eligible schools agreed to participate in the study. Given the longitudinal natureof the study, the initial school response rate of 69.7 percent was deemed too low to yieldacceptable levels of schools, administrators, teachers, parents, and most importantly,students. To address this concern, a sample of sister schools was selected and 359replacement schools were identified and added to the study. Responses were obtained from1,057 schools, thus increasing the school response rate to 77.7 percent (1,057/(1,002+359)).Usable student data were received for 1,052 of the schools.
The total eighth-grade enrollment for the 1,052 NELS:88 sample schools was202,996. During the listing procedures (before 24–26 students were selected per school), 5.35percent of the students were excluded because they were identified by school staff as beingincapable of completing the NELS:88 instruments owing to limitations in their languageproficiency or to mental or physical disabilities. Ultimately, 93 percent or 24,599 of thesample students participated in the base-year survey in the spring of 1988.
The NELS:88 first follow-up survey was conducted in the spring of 1990. Students,dropouts, teachers, and school administrators participated in the followup, with a successfuldata collection effort for approximately 93 percent of the base-year student respondents. Inaddition, because the characteristics and education outcomes of the students excluded fromthe base year may differ from those of students who participated in the base-year datacollection, a special study was initiated to identify the enrollment status of a representativesample of the base-year ineligible students. Data from this sample were then combined withfirst and second follow-up data for the computation of 8th- to 10th-grade, 10th- to 12th-grade, and 8th- to 12th-grade cohort dropout rates.
The second follow-up survey was conducted in the spring of 1992. Students,dropouts, parents, teachers, and school administrators participated in this followup.Approximately 91 percent of the sample of students participated in the second follow-upsurvey, with 88 percent of the dropouts responding.
The second follow-up High School Transcript Study was conducted in the fall of1992. Transcript data spanning the three or four years of high school (9th or 10th through12th grades) were collected for 1) students attending, in the spring of 1992, schools sampled

66
for the second follow-up school administrator and teacher surveys,33 2) all dropouts anddropouts in alternative programs who had attended high school for a minimum of one term;3) all early graduates, regardless of school contextual sample type; and 4) triple ineligiblesenrolled in the twelfth grade in the spring of 1992, regardless of school affiliation. Tripleineligibles are sample members who were ineligible—due to mental or physical handicap orlanguage barrier—for the base year, first follow-up, and second follow-up surveys. Thetranscript data collected from schools included student-level data (e.g., number of days absentper school year, standardized test scores) and complete course-taking histories. Completehigh school course-taking records were, of course, obtained only for those transcript surveysample members who graduated by the end of the spring term of 1992; incomplete recordswere collected for sample members who had dropped out of school, had fallen behind themodal progression sequence, or were enrolled in a special education program requiring orallowing more than twelve years of schooling.
A total of 1,287 contextual schools and 256 non-contextual schools responded to therequest for transcripts. Reasons cited by school staff for not complying with the requestincluded: inadequate permission for transcript release (some schools required parentalpermission for the release of minors’ transcripts); no record of the sample member or nocourse-taking record because of brevity of enrollment; insufficient staff for transcriptpreparation (despite offers of remuneration for preparation costs); and archiving or transfer ofsample member records. Student coverage rates were 89.5 percent for the total transcriptsample and 74.2 percent for the dropout/alternative completers.
Missing from the cohort rates from NELS:88 is anyone who had dropped out prior tothe spring of their eighth-grade year. Thus, the overall cohort dropout rates reported here maybe lower than they would have been if a younger cohort were used. This may be particularlyimportant for Hispanics, given that CPS data show that Hispanic dropouts tend to havecompleted less schooling than other dropouts. The cohort rates also reflect the schoolenrollment status of both eligible and ineligible non-participants and participants, to theextent that this information could be obtained.
The following definition of a dropout was employed in NELS:88:
1. an individual who, according to the school (if the sample member could not belocated) or according to the school and home, is not attending school (i.e., has notbeen in school for 4 consecutive weeks or more and is not absent due to accident orillness); or
2. a student who has been in school less than 2 weeks after a period in which he or shewas classified as a dropout.
Thus, a student who was a temporary dropout (stopout) who was found by the studyto be out of school for 4 or more consecutive school weeks and had returned to school (that
33Schools selected for the contextual components of the second followup (the school administrator and teacher surveys) arereferred to as contextual schools. Sample members enrolled in those schools are referred to as contextual students.

67
is, had been back in school for a period of at least 2 weeks at the time of surveyadministration in the spring of 1990) would not be classified as a dropout for purposes of thecohort dropout rates reported here.
The basic NELS:88 procedure for identification of a dropout was to confirm school-reported dropout status with the student’s household. For the first followup, dropout statuswas obtained first from the school and then confirmed with the household for 96.4 percent ofthe dropouts. Thus only 3.6 percent of the dropouts were identified by only school-reportedinformation. For the second followup, 4.9 percent of the dropouts were identified by onlyschool-reported information.
The 1988–1990 dropout rate requires data from both 1988 and 1990. As a result, thesize of the sample used in computing the 1988 to 1990 rate is tied to the size of the sample in1990. Many students changed schools between 1988 and 1990. Because of the costsassociated with following small numbers of students to many schools, a subsamplingoperation was conducted at the time of the first followup. Of the 24,599 students whoparticipated in 1988, 20,263 students were sampled, and 130 were found to be out of scope(due to death or migration out of the country). The dropout rates from 1988–1990 reflect theexperiences of 20,133 sample cases. Some 1,088 sample cases dropped out and 19,045sample cases continued in school.
The 1990–1992 rate starts from the 19,045 student sample cases who were in schoolin 1990. Some 91 of the student sample cases from 1990 were identified as out of scope in1992. The dropout rates from 1990 to 1992 reflect the experiences of 18,954 student samplecases.
The 1988–1992 rates reflect the experiences of 20,070 student sample cases. Thesecases result from the 20,263 subsampled student cases in 1990, less 92 cases that were out ofscope in both 1990 and 1992, less the 91 students sample cases identified as out of scope in1992, less 10 dropout sample cases identified as out of scope in 1992. Note that 24 studentsample cases who were out of the country in 1990 returned to school in the U.S. by spring1992, and an additional 14 student sample cases who were out of the country in spring 1990returned to the U.S. by spring 1992 but did not reenroll (dropouts). Another 354 studentsample cases who dropped out between 1988 and 1990 returned to school by spring 1992.
HS&B Calculation of Cohort Dropout Rates
The original dropout variable in HS&B was defined somewhat differently than thedropout variable in NELS:88.34 The essential difference was in the way in which the surveyshandled students in alternative programs. Specifically, HS&B originally considered thosewho were in “alternative” programs, such as those leading to a GED, or those who hadreceived a GED as dropouts, not students or completers, respectively. NELS:88 was designed
34The NELS:88 Second Followup Dropout Data Users Manual has an extensive discussion of the differences in definitionaluse in the two surveys.

68
so that researchers would have the flexibility to define dropping out in more than one way. Inorder to equate the two data sets, several modifications were made to the original HS&Bdefinition for the purpose of this report.35
Variables Used in Comparison of HS&B and NELS:88
Poverty
In HS&B, a student was considered to be living below the poverty line if their familysize was 1 to 3 persons and their family income was $7,000 or less; or if their family size was4 to 6 persons and their family income was $11,999 or less; or their family size was 7 ormore persons and their family income was under $15,999.
In NELS:88 a student was considered to be living below the poverty line if theirfamily size was 1 to 2 persons and their family income was $7,499 or less; or if their familysize was 3 persons and family income was $9,999 or less; or if their family size was 4 or 5persons and family income was $14,999 or less; or if their family size was 6 or 7 persons andfamily income was $19,999 or less; or if their family size was 8 persons and family incomewas $24,999 or less; or if their family size was 9 or more persons and family income wasunder $34,999.
Family Composition
In both HS&B and NELS:88 a student’s family composition was defined as:
1. Two parents—if both the father and mother were in the household.
2. Two adults/one parent—if the father was not in household but the mother and amale guardian/stepfather were in the household; or if the mother was not in thehousehold but the father and a female guardian/stepmother were in the household.
3. Single parent—if the father was in the household and no other adult partner was inhousehold; or if the mother was in the household and no other adult partner was inthe household.
4. Other—if neither parent were in the household.
35See the technical appendix to P. Kaufman, M. McMillen, and P. Sweet, A Comparison of High School Dropout Rates in1982 and 1992 (Washington, D.C.: National Center for Education Statistics, October 1996).

69
Accuracy of Estimates
The estimates in this report are derived from samples and are subject to two broadclasses of error—sampling and nonsampling error. Sampling errors occur because the dataare collected from a sample of a population rather than from the entire population. Estimatesbased on a sample will differ somewhat from the values that would have been obtained froma universe survey using the same instruments, instructions, and procedures. Nonsamplingerrors come from a variety of sources and affect all types of surveys, universe as well assample surveys. Examples of sources of nonsampling error include design, reporting, andprocessing errors, and errors due to nonresponse. The effects of nonsampling errors are moredifficult to evaluate than those that result from sampling variability. As much as possible,procedures are built into surveys in order to minimize nonsampling errors.
In reporting sample survey data, estimates based on unweighted sample sizes less than30 are not displayed. The standard error is a measure of the variability due to sampling whenestimating a parameter. It indicates how much variance there is in the population of possibleestimates of a parameter for a given sample size. Standard errors can be used as a measure ofthe precision expected from a particular sample. The probability that a complete censuswould differ from the sample by less than the standard error is about 68 out of 100. Thechances that the difference would be less than 1.65 times the standard error are about 90 outof 100; that the difference would be less than 1.96 times the standard error, about 95 out of100.
Standard errors for percentages and number of persons based on CPS data werecalculated using the following formulas:
Percentage:
se = ( )( )( / )b N p p100−wherep = the percentage (0 < p < 100),
N = the population on which the percentage is based, andb = the parameter associated with the characteristic;
b is equal to 2,369 for the total or white population; 2,680 for the blackpopulation; and 3,051 for the Hispanic population ages 14 through 24years old for 1996 and 1997.
Number of persons:
se = ( )( )bx x T1− /wherex = the number of persons (i.e., dropouts),
T = population in the category (i.e., blacks 16 through 24), andb = as above.
Standard errors for the estimates in the text tables and figures appear in Appendix A.

70
In October of 1998, the Bureau of the Census released new b parameters for 1996 and1997. With the release of the new parameters, the Bureau of the Census also madeadjustments to the parameters for earlier years. Therefore, for some years, the standard errorspresented in the appendix tables here are different than the standard errors presented in earlierreports.
Response Rates
Current Population Survey. For the October 1997 basic CPS, the unweighted nonresponserate was 6.3 percent and for the school enrollment supplement the nonresponse rate was anadditional 4.7 percent for a total supplement unweighted nonresponse rate of 10.7 percent.
High School and Beyond. The overall unweighted student response rate for the secondfollow-up was about 94 percent.
NELS:88 Second Follow-up. The overall unweighted student response rate was 94 percentand the weighted response rate was 91 percent.
Methodology and Statistical Procedures
The comparisons in the text have all been tested for statistical significance to ensurethat the differences are larger than those that might be expected due to sampling variation.Two types of comparisons have been made in the text.
Differences in two estimated percentages. The Student’s t statistic can be used to testthe likelihood that the differences between two percentages are larger than would be expectedby sampling error.
t = P P
se se
1 2
12
22
−
+
where P1 and P2 are the estimates to be compared and se1 and se2 are their correspondingstandard errors.
As the number of comparisons on the same set of data increases, the likelihood thatthe t value for at least one of the comparisons will exceed 1.96 simply due to sampling errorincreases. For a single comparison, there is a 5 percent chance that the t value will exceed1.96 due to sampling error. For five tests, the risk of getting at least one t value that highincreases to 23 percent and for 20 comparisons, 64 percent.
One way to compensate for this danger when making multiple comparisons is toadjust the alpha level to take into account the number of comparisons being made. Forexample, rather than establishing an alpha level of 0.05 for a single comparison, the alphalevel is set to ensure that the likelihood is less than 0.05 that the t value for any of the

71
comparisons exceeds the critical value by chance alone when there are truly no differencesfor any of the comparisons. This Bonferroni adjustment is calculated by taking the desiredalpha level and dividing by the number of possible comparisons, based on the variable(s)being compared. The t value corresponding to the revised, lower alpha level must beexceeded in order for any of the comparisons to be considered significant. For example, totest for differences in dropout rates between whites, blacks, and Hispanics, the followingsteps would be involved:
• Establish the number of comparisons—in this case three (whites and blacks; whitesand Hispanics; and blacks and Hispanics). The number of two-way comparisons thatcan be made equals [(n)(n-1)]/2, where n is the number of variable categories. Thus,with three categories the number of possible comparisons is [(3)(2)]/2 = 3.
• Divide the desired alpha level, 0.05, by the number of comparisons (e.g., three) toobtain the new alpha level (0.05/3 = 0.0166).
• Consult a table of t statistics (or the standard normal table for z values if the N islarge) to find the t value that corresponds to that alpha (t = 2.39 for alpha = 0.0166).
All comparisons in this report were tested using the Bonferroni adjustment for the ttests. Where categories of two variables were involved, the number of comparisons used tomake the Bonferroni adjustment was based on the relationship(s) being tested.
Trends. Regression analysis was used to test for trends across age groups and overtime. Regression analysis assesses the degree to which one variable (the dependent variable)is related to a set of other variables (the independent variables). The estimation proceduremost commonly used in regression analysis is ordinary least squares (OLS).
The analyses in this report were conducted on the event rates, status rates, andcompletion rates. The event rate and status rate estimates were used as dependent measures inthe analysis with a variable representing time and a dummy variable controlling for changesin the educational attainment item in 1992 (0 = years 1968 to 1991, 1 = 1992 to 1997) used asindependent variables. However, in these data some of the observations were less reliablethan others (i.e., some years’ standard errors were larger than other years’). In such casesOLS estimation procedures do not apply and it is necessary to modify the regressionprocedures to obtain unbiased regression parameters. The modification that is usuallyrecommended transforms the observations to variables which satisfy the usual assumptions ofordinary least squares regression and then applies the usual OLS analysis to these variables.
This was done in this analysis using the data manipulation and regression capabilityof Microsoft EXCEL®. Each of the variables in the analysis was transformed by dividingeach by the standard error of the relevant year’s rate (event, status, or completion). The newdependent variable was then regressed on the new time variable and new editing-changedummy variable. All statements about trends in this report are statistically significant at the0.05 level.