Embed Size (px)
Citation preview
Bank Relationships and Underwriter Competition:
Evidence from Japan
AYAKO YASUDA∗
forthcoming in the Journal of Financial Economics
ABSTRACT
This paper examines the effects of bank relationships on underwriter choice in the Japanesecorporate-bond market following the 1993 deregulation. Bank relationships have significantpositive effects on a firm’s underwriter choice. Relationship firms receive a small but sig-nificant fee discount and, consistent with mitigating effect of bank competition on holdupcost, multiple-relationship firms receive a significantly deeper discount than solo-relationshipfirms. Bank shareholding alone negatively affects underwriter choice, whereas shareholdingtogether with loans have significantly more positive effects than loans alone. Finally, existingrelationships reduce a Japanese firm’s switching probability by 32%, in contrast to only 6%for U.S. firms.
JEL Classification: G1, G2, G3, L1, L5.Keywords: Bank Relationships, Bank Equity Holdings, Investment Banking, Universal Bank-ing, Bank Competition, Underwriting Market, Comparing Financial Systems
∗ The Wharton School of the University of Pennsylvania, 2300 SH-DH, 3620 Locust Walk, Philadelphia,PA 19104, U.S.A., tel: (215) 898-6087, fax: (215) 898-6200, [email protected]. I would like tothank Franklin Allen, Masahiko Aoki, Doug Bernheim, Tim Bresnahan, Serdar Dinc, Espen Eckbo, GaryGorton, Roger Noll, Manju Puri, William Schwert (the editor), John Shoven, an anonymous referee, andall the seminar participants at the Asian Development Bank Institute, INSEAD, London Business School,Stanford University, the University of Tokyo, the 42nd Annual Bank Structure Conference (Chicago), the 2ndFIRS Conference on Banking, Corporate Finance and Intermediation (Shanghai), and the Wharton Schoolfor valuable discussions and comments, and Nomura Research Institute for making their data available foracademic use. All errors are my own.
1 Introduction
The Financial System Reform Act of 1992 allowed Japanese commercial banks to re-enter
the underwriting market for corporate bonds by establishing wholly owned securities sub-
sidiaries.1 Within a few years, commercial banks made dramatic inroads into the market.
Between 1994-1998, the top 11 commercial banks collectively accounted for 55% of corporate-
bond underwriting, while the top 4 securities houses (Nomura, Daiwa, Nikko, and Yamaichi)
held on to the remaining 45%. In contrast, U.S. commercial banks collectively gained a
market share of only 13% in the comparable period (Yasuda (2005)).
Why were Japanese commercial banks such successful entrants into the underwriting
business? The literature offers three sources of explanations. First, many authors argue that
Japanese banks have close, long-term, and exclusive relationships with their borrowers.2
Their relationships may provide significant benefits to their client firms and, thus, induce
them to choose their lender banks as underwriters, all else equal.3 Second, it is plausible
that Japanese banks produce information with greater economies of scope and/or scale than
investment banks and strategically transfer this benefit through fee discounts. In particular,
the degree of fee discounts may depend on the degree of interbank competition.4 Third,
Japanese banks are allowed to own equity in the firms to which they lend, whereas U.S.
banks are prohibited from holding equity of their client firms under normal circumstances.5
This additional control right may account for the greater success of Japanese banks in gaining
market share in the corporate bond underwriting market.
1The law took effect on April 1, 1993 and the first bank subsidiary was established in July 1993.2Allen and Gale (2000), for example, suggest that one characteristic of financial systems that rely on
banks (such as Japan) is the greater importance of long-term relationships compared to financial systemsthat rely on markets (such as the U.S.). Aoki and Patrick (1994) and Aoki and Saxonhouse (2000) provideexcellent surveys of the Japanese financial system.
3See James (1987) and Billett, Flannery, and Garfinkel (1995), among others, for empirical evidence onuniqueness of banks as information producers.
4See, for example, Sharpe (1990), and Rajan (1992) for theoretical analyses of the banks’ ability to extractinformation rent ex post from their borrower firms.
5As an exception to this rule, U.S. banks are allowed to hold equity as a result of debt restructuring. SeeJames (1995) for a study of this issue.
1
These studies raise the following empirical questions: Do commercial banks charge dis-
count or premium underwriting fees to firms with which they had relationships? Do the
relationship discounts (or premiums) depend on the degree of interbank competition? Do
existing relationships affect the firm’s underwriter choice over and above their effect on fees?
Do they affect the firm’s decision to switch underwriters? And finally, do bank equity hold-
ings affect the firm’s underwriter choice or the underwriting fee it is charged? I investigate
these questions by analyzing the effects of bank relationships on the firms’ underwriter choice,
using a framework that allows imputation of unobserved fees conditional on the choice of un-
derwriter. By directly modeling the firm’s underwriter-choice problem and disentangling the
effect of relationships on the choice of underwriter from their effects on fees, this paper sheds
light on the question of how commercial banks’ entry into the securities business affects bank
relationships with borrower firms. I also examine what role (if any) equity holding by banks
plays in determining the firm’s underwriter choice and the fee it is charged. Since banks
are allowed to own equity of borrower firms in many non-U.S. countries (e.g., Germany),
findings on equity relationships have important implications going beyond Japan.6
The literature provides extensive and growing evidence on the effect of commercial banks’
entry into securities business on bond performance, underwriting fees, and the firm’s under-
writer choice in the U.S. Many of these studies examine the questions of whether commercial
banks’ conflict of interest offsets their certification ability. For example, Puri (1996) and
Gande, Puri, Saunders, and Walter (1997) examine ex ante yields of bonds and find that
issues underwritten by commercial banks performed better than or as well as those under-
written by investment banks, which is consistent with net certification.7 On the question of
6Others have examined how a bank’s relationship with a borrower is affected by extra control rights,including bank shareholding, proxy vote rights and board seats (e.g., Berlin, John, and Saunders (1996)).For representative empirical studies, see, among others, Gorton and Schmid (2000) (for equity ownershipby German banks), Kaplan and Minton (1994) (for board seats held by Japanese banks), and Kroszner andStrahan (2001) and Santos and Rumble (forthcoming) (for board seats and proxy vote rights controlled byU.S. banks via trust business). See Gorton and Winton (2003) for a comprehensive review of the theoreticaland empirical literature on the subject.
7Further see Ang and Richardson (1994), Kroszner and Rajan (1994), and Puri (1994) for studies ofbond performance using pre-war data. Also see Gompers and Lerner (1999) and Li and Masulis (2005) (for
2
effect of commercial-bank underwriting on fees, Gande, Puri, and Saunders (1999), Roten
and Mullineaux (2002), and Yasuda (2005) find that firms underwritten by commercial banks
paid fees that were lower than or equal to those paid by firms underwritten by investment
banks. Yasuda (2005) examines the firm’s underwriter choice and finds that bank relation-
ships have positive and significant effects on the firm’s underwriter choice, over and above
their effects on fees.8 Moreover, Yasuda (2005) finds that this effect is sharply higher for
junk-bond issuers and first-time issuers. Collectively, findings of those studies examining the
U.S. market support the view that firms benefit from joint activities of commercial bank
lending and underwriting.
In contrast, empirical evidence on the effects of commercial bank underwriting in coun-
tries outside of the U.S. is more mixed. For example, Klein and Zoeller (2003) studies the
German market and finds that IPOs underwritten by universal banks are more underpriced
than those underwritten by specialized banks, which is consistent with investors imposing
discounts for possible conflicts of interest. In contrast, Ursel and Ljucovic (1998) studies
the Canadian IPO market and finds that universal-bank underwritten IPOs are either less
underpriced than or as much underpriced as those underwritten by other underwriters.9 One
factor limiting results of these analyses is that lending and equity relationships have not been
explicitly controlled for at the firm-bank specific level due to data constraints in these coun-
tries. In contrast, comprehensive lending and equity relationship data at the firm-bank level
are available in Japan. Thus, by studying the Japanese market, we can shed light on the
general question of whether joint bank activities of lending and underwriting are beneficial
to firms even in a financial system outside of the U.S.
While several existing studies examine the effects of commercial bank underwriting in the
pre-IPO bank shareholding via venture capital subsidiaries), and Schenone (2004) (for pre-IPO bank lendingrelationships and IPO underpricing).
8Bharath, Dahiya, and Saunders (forthcoming) also document that bank relationships positively andsignificantly affect banks’ ability to win future lending business in the U.S.
9See Drucker and Puri (2006) for a comprehensive review of the international evidence on the conflicts ofinterest. On a slightly different question of the potential cost of universal banking that combines underwritingand asset management, see Ber, Yafeh, and Yosha (2001) and Massa and Rehman (2005).
3
Japanese market, the evidence is far from conclusive.10 Using data from 1992-2000, Takaoka
and McKenzie (2004) find that bank entry significantly lowers both underwriting commis-
sions and yield spreads. They also find that commissions charged by banks are significantly
lower than those charged by investment banks. However, using a somewhat shorter sample
period, Hamao and Hoshi (2003) and Kang and Liu (2004) find that commercial bank un-
derwriting is associated with higher yield spreads. Further, while Takaoka and McKenzie
(2004) report a positive effect of bank relationships on the firm’s underwriter choice, Hamao
and Hoshi (2003) report the opposite, i.e., banks attempted to cultivate new clients with
weak or no bank ties rather than to serve firms with existing relationships.
An important difference between this paper and the previous studies is that while those
papers predominantly deal with equilibrium pricing outcomes, I directly model the firm’s
underwriter-choice problem and measure the effect of relationships on the choice of under-
writer. To isolate the relationship effect, I use a multinomial-choice set-up in which a firm
chooses one bank out of multiple choices, conditional on the full variation across banks in
terms of the relationships it has with them. Further, I use a framework developed in Yasuda
(2005) that allows me to disentangle the effects of relationships on the underwriter choice
and their effects on fees. By doing so, I attempt to jointly address the questions of whether
bank relationships have positive or negative effects on the firm’s underwriter choice, over and
above their effects on fees, and whether the relationships are associated with fee discounts
or premiums.
In order to estimate this model, I constructed a unique data set consisting of 1,302
Japanese domestic corporate-bond issues for the period 1994-1999. This data set combines
issue-specific bond data with firm- and bank-specific data on previous lending and sharehold-
ing relationships. Bank-relationship data are constructed from the JDB Database, which is
compiled by the former Japan Development Bank and consists of comprehensive financial-
statements information for listed companies in Japan. Bond data are constructed from the
10Also see Konishi (2002) for analysis of the pre-war Japanese market.
4
Japan Domestic New Issues Database by Thomson Financial Securities Data. Finally, bank
equity holding data are constructed from the Compendium of Firm Groupings (kigyo keiretsu
souran).
The findings indicate that bank relationships are very important in shaping bank com-
petition in the corporate-bond underwriting market in Japan. First, I find that lending
relationships have significant and positive effects on a firm’s underwriter choice, over and
above their effects on fees. Moreover, this result is sharply stronger for top lenders. I draw
inferences here from the estimates of the underwriter-choice model. On the question of the
effect of relationships on fees, I find that there is a significant fee discount when there are
lending relationships between firms and commercial-bank underwriters. The inference is
drawn from the estimates of the fee model.
Second, further examining whether the fee discount derives from bank competition, I find
that significantly deeper fee discounts are offered to firms with multiple relationships than
to single-relationship firms. This is consistent with Rajan (1992), who argues that multiple
banking relationships potentially mitigate bank information monopolies.11
Third, I find that bank equity holdings alone have significant and negative effects on a
firm’s underwriter choice, whereas equity holdings together with lending relationships have
significantly more positive effects than lending relationships alone. These findings suggest a
complementary relation between bank equity holding and bank lending. In particular, these
results are related to Puri (1999), who argues that retirement of banks’ financial claims
using proceeds of bond issues hurts banks’ certification ability. One interpretation is that
equity holdings alone (without loans) indicate past retirement of financial claims by banks
using proceeds from prior issues. As for the fees, equity holdings alone are associated with
a fee premium, whereas lending relationships alone are associated with a deeper fee discount
than lending relationships together with equity holdings. These fee premium results reflect
11See Ongena and Smith (1998) for a comprehensive review of existing research on this question. Theexisting literature is discussed in more detail in the later section.
5
a strong bargaining power of lender banks that also hold equity.12
Finally, assessing the economic significance of bank relationships for Japanese firms us-
ing U.S. firms as benchmarks, I find evidence that relationship values dominate in terms of
economic magnitudes; that is, the relative success of Japanese banks’ entry into the under-
writing business owes more to the greater values of their bank relationships than to the fee
discounts they give to their client firms. Further examining this comparative result in the
context of firm’s switching behavior, I find that the presence of existing lender relationships
with commercial banks reduces a Japanese firm’s switching probability by 32%, in contrast
to only 6% for U.S. firms with existing lender relationships with commercial banks. Fur-
thermore, in the case of U.S. firms with existing lender relationships with investment banks,
there is no reduction in switching probability.13 These results indicate that, ceteris paribus,
Japanese firms are more reluctant to hire a new commercial bank underwriter in the pres-
ence of lending relationships than U.S. firms.14 A plausible interpretation is that a bank
relationship on average is more valuable in Japan than in the U.S. and that this makes it
more costly for a Japanese firm to hire a new commercial bank in the underwriting market.
Alternatively, loyalty pays more - by continuing with the same bank underwriter, a Japanese
firm enjoys greater benefits, such as lower future fees, greater access to capital, or a more
cooperative creditor in the event of financial distress.15
The remainder of the article is organized as follows. Section 2 describes the corporate
bond underwriting market in Japan and the research hypotheses to be tested. Section 3
describes the data. Section 4 specifies the empirical model. Section 5 presents and discusses
12This is related to Morck, Nakamura, and Shivdasani (2000), who also find a positive relation betweenbank ownership and firms’ interest costs.
13Japanese investment banks are not active in the corporate lending market.14Petersen and Rajan (1994) report that small U.S. firms display a similar reluctance to borrow from a
new commercial bank in the presence of existing relationships for fear of retaliation by their current lenders.15See Hoshi, Kashyap, and Scharfstein (1990a) and Hoshi, Kashyap, and Scharfstein (1991) for studies of
bank ties and cash-flow sensitivity of investments by Japanese firms, and Hoshi, Kashyap, and Scharfstein(1990b) for analysis of bank ties and financial distress; see Gilson, Kose, and Lang (1990) for U.S. evidence.Also see Weinstein and Yafeh (1998), Hayashi (2000), Kang and Stulz (2000), and Dewenter and Warther(1998).
6
the estimation results. Section 6 concludes.
2 The Japanese Bond Market and My Research Ques-
tions
2.1 Development of the Japanese Bond Underwriting Market
In the literature on comparative financial systems, Japan is often characterized as a bank-
based system of relationship finance in contrast to the U.S.-style, market-based system of
direct finance. Less remarked but hardly less important is the fact that Japan also has one of
the largest capital markets (both stocks and bonds) outside of the U.S.16 as well as a history
of banking regulation that has paralleled that of the U.S. since the end of World War II.
Specifically, Article 65 of the 1948 Securities and Exchange Law, which separated the
banking and securities business in Japan, was modeled after Glass-Steagall Act. Likewise,
mirroring the dismantling of the Glass-Steagall Act that started in the U.S. in the late 1980s,
the 1992 Financial Institution Reform Act in Japan allowed banks, securities firms, trust
banks, and insurance companies to enter reciprocally each other’s business areas by means
of area-specific subsidiaries. The first bank subsidiaries started operations in July 1993.
Initially, security-firm subsidiaries of commercial banks were not allowed to engage in equity
brokerage businesses, including equity underwriting. Eventually, with the enactment of the
Financial System Reform Law on Oct. 1, 1999, the remaining equity-related restrictions
were lifted. This institutional and regulatory history makes Japan an interesting natural
laboratory setting to study the effect of bank relationships on capital market competition.
A question of particular interest is whether Japanese firms choose their relationship banks
with greater propensity than U.S. firms do.
Another noteworthy institutional feature of the Japanese financial system is that banks
16See, for example, Rajan and Zingales (1995).
7
own equity of their borrower firms up to 5% ceiling. Thus it will be important to examine
bank relationships in terms of both lending and shareholding.17
2.2 Effects of Bank Relationships on Underwriter Choice and Fees
When a firm decides to issue a bond, it hires an underwriting bank which provides for a fee
two kinds of services: (1) insurance for unsold securities, and (2) assistance in document-
ing, marketing, pricing, and selling the security. From the bank’s perspective, the cost of
underwriting is likely to be associated with some features of the bond, such as its maturity;
for example, the fees are expected to be higher the longer the maturity of the bond because
long-maturity bonds are less liquid and their prices are more volatile over the course of their
maturities.
The costs of underwriting services are also associated with some characteristics of the
issuers. For example, if the issuer is a “hot,” well-regarded name in the market, not only
is the probability of unsold securities low, but so is the cost of marketing and selling the
security. In contrast, it is more expensive both to insure (against unsold securities) and to
market and distribute a less well-known issuer’s bond. Investors need to be educated and
persuaded harder to purchase the bond (even after controlling for its higher yield), which
also requires educating the bank’s sales force. Thus, the borrower reputation characteristics
of the issuing firms and bonds are factored into the price of underwriting services. Credit
ratings and previous issue experience of the firms are examples of such characteristics.
The issuer and bond characteristics are not the only determinants of fees, however. Banks
incur costs in assessing the issuer’s creditworthiness and certifying the information to the
investors. This aspect of the underwriting service can be called information production. One
way that banks become more effective at information production is through past relationships
with the firms. Established networks and communication channels with an issuer increase a
bank’s effectiveness in producing information about that particular issuer. With this infor-
17I thank the referee for suggesting this fruitful extension of research.
8
mational advantage, banks with prior relationships can build up demand for the securities
faster and face a lower risk of unsold securities and a lower marginal cost of marketing and
sales.
Issuing firms may prefer banks that are better at producing information for two reasons.
First, dealing with such banks is less likely to lead to unsold securities or otherwise failed
transactions, which could hurt their borrower reputation in the capital markets for future
transactions. Second, such banks’ ability to build up demand for the security may indicate
that they can negotiate a lower yield for the bond than other underwriting banks can. So
the underwriting service is expected to be differentiated mainly along two dimensions—fees
and effective information production, which is measured by bank relationships.
The effect of bank relationships on underwriter demand (over and above their effects on
fees) depends on the firm’s valuation of the relationships. What kinds of firms would value
bank relationships with underwriters? Diamond (1991) uses the borrowing firm’s reputation
to explain its choice between bank loans and bonds. The main result of the paper is that
borrower reputation and the need for bank monitoring are inversely related. Young firms
and old firms with low borrower reputations do not have reputations to lose and bank
monitoring is needed to enforce efficient investment decisions; as a result, they tend to rely
more on bank loans. Large established firms with high borrower reputations, on the other
hand, do have a valuable reputation to lose and therefore have sufficient incentives to choose
efficient investment decisions; since bank monitoring is costly, this class of firms prefers to
issue bonds.
This argument (referred to as Diamond’s reputation-building argument hereafter) pre-
dicts that the issuing firm’s valuation of bank relationships is inversely related to its borrower
reputation: firms with low borrower reputation are expected to value them the most, since
they stand to gain the most from choosing an underwriting bank with certification ability.
For firms with high borrower reputation, on the other hand, the information production
effectiveness of banks is largely redundant, since their securities can sell easily in the market
9
regardless of who the underwriter is.
Furthermore, how does a bank relationship between a given firm and a given bank affect
the relative likelihoods of other banks to be chosen by that firm? This is of particular interest
in the context of comparing U.S. and Japan as two economies with distinct banking systems
that have recently experienced major waves of financial deregulations. For example, does
the existing practice of the Japanese Main Bank system affect bank competition in the post-
deregulation bond underwriting market?18 Or does the deregulation erase all traces of the
old institutional practice in the emerging competitive landscape?
One distinguishing aspect of the main bank system is the visibility and long-term nature
of bank relationships; this may be due to the fact that the majority of Japanese banks’
clients are mature and established listed firms, which are unlikely to ‘upgrade’ to a higher-
reputation bank, as young, post-IPO firms in the U.S. are found to do.19 Another aspect is
the mutual delegation of monitoring to main banks, where other banks that also lend to the
firms effectively free-ride on the main banks’ monitoring efforts. Given these features of the
Japanese banking system, it is more likely that a firm’s decision to hire a commercial bank
with no prior bank relationships is perceived as a ‘switch’ of relationships, and thus a firm
is expected to lose all the long-term benefits of existing relationships after such a decision.
In contrast, in the U.S., firms that are established enough to access public bond markets
are less likely to be constrained in this way. Still, whether Japanese and U.S. bond-issuing
firms are constrained by existing bank relationships in this manner is an empirical question.
While U.S. evidence for small businesses has been reported,20 to the best of my knowledge,
no analysis has been conducted on larger, bond-issuing firms.
Finally, the effect of bank relationships on underwriter demand is expected to depend
on the strength of bank relationships. Banks that made significant efforts in gathering
18See Boot and Thakor (2000) for a theoretical analysis of how relationship banking is affected by changein capital market competition.
19See, for example, Krigman, Shaw, and Womack (2001).20See Petersen and Rajan (1994) and Petersen and Rajan (1995).
10
information about the firm in past loan transactions may be more effective in certifying them
as underwriters than those banks that just passively provided capital. On the other hand,
the information may be equally shared among all lending banks. I will test this question by
examining the lender-relationship rankings and their effects on underwriter choice.
To summarize, I investigate the following questions in this paper:
1. Are bank relationships significant in determining the firm’s underwriter choice? Does
the effect of relationships on underwriter choice depend on (i) borrower reputation
and/or (ii) the strength of the relationships?
2. How do relationships affect fees? Does this depend on the degree of interbank compe-
tition?
3. How does equity holding interact with lending relationships in determining the firm’s
underwriter choice and the fees it is charged?
4. Does a bank relationship between a given firm and a given bank affect the relative
likelihoods of other banks to be chosen by that firm?
3 The Data
3.1 Data Sources
I constructed the dataset using three data sources. The Japan Domestic New Issues Database
by Thomson Financial Securities Data compiles new-issues information from company filings,
press releases, and news sources. The JDB Database by the former Japan Development
Bank is a comprehensive database of financial-statements information for listed companies
in Japan. The data are collected from regulatory filings and include all companies (except
for those in the financial and insurance industries) listed on the Tokyo, Osaka, and Nagoya
Stock Exchanges (both 1st and 2nd Section) as well as over-the-counter companies. Finally,
11
I use the Compendium of Firm Groupings (kigyo keiretsu souran) to obtain bank equity
holding data.
3.2 Data Selection
I chose the sample period to be from January 1, 1994 to March 15, 1999— roughly 5 1/4
years, based on the following criteria. First, the sample begins after July 1993, when the
first commercial bank subsidiary started operations.21 Second, the economic and regulatory
environment surrounding the underwriters and issuers remained relatively stable during this
period. Third, by ending the sample in March 1999, I avoid the effects of the closure in June
1999 of Yamaichi Securities, one of the major investment houses in the underwriting market.
Consistent with prior studies, I excluded financial firms and regulated industries from the
study. I also concentrated on the top 15 underwriters of fixed-rate, non-convertible corporate
debt.22 In the resulting sample, 11 of the 15 underwriters are subsidiaries of bank holding
companies. Using the above criteria, I obtain a sample of 1,302 non-convertible, fixed-rate
corporate bond issues.
3.3 Summary Statistics
Table 1 reports various sample summary statistics from which several observations can
be made. First, commercial-bank-underwritten issues are relatively small compared to
investment-bank-underwritten issues. Their maturity also tends to be slightly shorter, but
no better or worse in terms of credit ratings. There are a few plausible reasons for this. For
example, if a smaller, younger firm is more likely to choose the commercial bank with which it
had built close ties, the issue size might proxy for characteristics of that firm. Alternatively,
if commercial banks have a smaller distribution capability relative to investment banks, the
21The sample period also follows the liberalization of underwriting fees in Japan, which had been set bya common fee matrix up to November 1991 (see Okamura (2003)).
22The rankings are based on the monetary value of underwritings, and full credit is given to the book-runner(s).
12
issue size might then be reflecting the supply-side constraint. The commercial-bank issues
are also found to be smaller than the investment-bank issues in the U.S.23
************************
Insert Table 1 about here
************************
Panels D and E report the sample tabulated by previous issue experience and then by
the issuer’s industry code. The proportion of first-time issuers (of domestic bonds) is actu-
ally lower among commercial-bank issues (12%) than among investment-bank counterparts
(19%). This finding is interesting because it goes against the characterization of commercial-
bank clients as smaller, younger firms with no or little previous issue experience. Indeed,
first-time issuers are more likely among commercial-bank issues in the U.S. bond-market.
One possible explanation is that the main clients of Japanese commercial banks are blue-chip
Japanese companies, most of which gained access to the domestic corporate bond market in
the 1980s, when commercial banks were still prohibited from underwriting securities. In con-
trast, there is little difference between commercial-bank and investment-bank sub-samples
in terms of the distribution of issuers across different industries.
4 Methodology
4.1 The Firm’s Underwriter Choice Model
Previous studies on underwriter choice typically use a dichotomous probit specification,
where the dependent variable equals 1 if a firm uses a commercial-bank underwriter, and
zero if it uses an investment-bank underwriter. In this setup, all commercial banks are treated
as homogeneous. Since firms have relationships with some banks and not with others, this
approach cannot measure the effect of relationships on underwriter choice. To isolate the
23See Yasuda (2005).
13
relationship effect, we need a multinomial-choice setup where a firm chooses one bank out
of multiple choices. This allows full variation across banks in terms of the relationships they
have with individual firms, both when they are chosen and when they are not.
In this paper I use the nested multinomial logit model, which is a generalization of the
multinomial logit model (also called conditional logit model), both developed by McFadden
(1974, 1978, 1981) and discussed in Maddala (1983).24 The nested logit model relaxes the
IIA (Irrelevance of Independence Alternative) property of the logit model by structuring the
decision process as a tree or nest structure. The IIA assumption implies that odds ratios in
the multinomial logit models are independent of the other choices, which is inappropriate
in many instances.25 The nested multinomial logit model is used by Goldberg (1995) in her
study of the effect of tariffs on automobile demand and by MacKie-Mason (1990) in his study
of the firm’s choice of external financing.
Formally, the model consists of a maximization problem for a firm i choosing over banks
1,...,15 (where banks are indexed by j). I define
V ∗i,j = the level of latent value for firm i choosing bank j
Vi,j = 1 if firm i chooses bank j
Vi,j = 0 otherwise
I further specify the latent underwriter-choice equation as follows:
V ∗i,j = αFEEi,j + βLOANi,j +
δLMATj ln(MATURITY )i + δISSUE
j ln(NO.ISSUES+1)i +
δLAMTj ln(AMOUNT )i + δINV GRADE
j INV GRADEi +
δY EARj Y EARSi + εi,j. (1)
24See p.41 and p.67.25Maddala (1983) discusses this issue with the famous “red bus, blue bus” example on page 62. Also see
Greene (2003), p.671.
14
FEEi,j is the underwriting fee charged by bank j. The fee definition used in the estimation
is a gross spread, which is the fee that the underwriter receives as a percentage of the issue
proceeds. A typical public bond offering consists of multiple underwriters forming a selling
syndicate, where one underwriter serves as the book-runner. Consistent with prior studies,
I identified the book-runner (or the lead-manager) as the underwriter of a given issue.26
The relationship variables LOAN1-LOAN15 (for 15 underwriting banks in the sample) are
constructed using balance-sheet data from the JDB database. On any given year’s balance
sheet, a company typically has loans from more than one bank.27 Since these loans vary
in relative sizes, it is misleading to count all of these banks as having equally important
banking relationships with the firm. The bank relationship definition I use in the baseline
model is whether or not a given bank has served as a top lender for a given firm in a fiscal
year. The dummy variable LOANi,j for bank j is 1 if it has ever acted as a top lender for
firm i between 1980 and 1992, and 0 if not.28 These variables capture the presence of loan
relationships between a given firm and individual commercial banks that existed before the
banks entered into the underwriting market. I treat these relationships as predetermined
and exogenous to the competition in the underwriting market.
Summary statistics indicate that issuers and bonds with certain characteristics are more
likely to be underwritten by commercial banks than others. ln(AMOUNT )i is the natural
log of the issue size in �billions. The value ln(MATURITY )i is the natural log of the
26In a small number of cases where there were two co-book-runners, each was counted as if it underwroteseparate issues.
27Ongena and Smith (1998) reports that multiple-bank relationships are commonly found across a numberof countries and data samples.
28In the JDB loan database, the total bank loans outstanding for a given firm-year are reported separatelyfor short-term loans and long-term loans. Short-term loans refer to loans maturing in less than a year;long-term loans refer to loans with a maturity of a year or longer. For the short-term loan category, bank-firm specific loans outstanding are available for the top 2 lenders in a given firm-year. For the long-termloan category, bank-firm specific loans outstanding are available for 24 individual banks. To identify a toplender in a given firm-year, I use the sum of the short-term loan and the long-term loan amount. Since 3rdor lower-ranked short-term lenders are not observed (while all long-term lenders are observed), I verifiedwhether this could hinder researchers’ ability to correctly identify a top bank. Specifically, I obtained arandomly drawn sample of firms for which the total loans outstanding were available and compared the toplenders identified using the variable definition described above using JDB data and the actual top lendersfor these firms. The comparison yielded a 100% match, which is reassuring.
15
bond maturity in years. The value ln(NO.ISSUES+1)i is the natural log of the number of
previous bond issues plus 1. The value INV GRADEi is 1 if the issue is rated investment
grade based on the average of all credit ratings for a given bond issue, and 0 otherwise.
The variable Y EARSi represents year dummies (Y EAR94 = 1 if the issue date is in 1994,
etc.). Finally, εi,(m,j) is the error term, which captures the effects of personal idiosyncrasies,
imperfections in maximization, and other random aspects of the firm’s choice problem. Note
that FEEi,j and LOANi,j vary across both firms (i = 1,..., N) and banks (j = 1,..., 15),
whereas other explanatory variables, such as ln(MATURITY )i, vary only across issues.
************************
Insert Figure 1 about here
************************
Specifying the Generalized Extreme-Value (GEV) distribution for the error term and the
nest structure as given in Figure 1 yields the nested multinomial logit model. At the lower
level of the nest are 15 alternative underwriting banks, indexed by j, and at the upper level
of the nest are two alternatives, commercial banks and investment banks, indexed by m.
Given this nest structure, we can write
Pr(j) = Pr(j|m) · Pr(m).
The choice probability for each of the 15 alternatives at the lower level of the nest (conditional
on the upper-level choice) is:
Pr(j|m, i) =eαFEEi,j + βLOANi,j∑Km
k=1 eαFEEi,k + βLOANi,k. (2)
The choice probability for each of the two alternatives (commercial banks and investment
banks) at the upper level of the nest is:
16
Pr(m, i) =ew
�i δm + λIi,m∑2
t=1 ew�i δt + λIi,t
, (3)
where Ii,t = log(
Lt∑l=1
eαFEEi,l + βLOANi,l), (4)
and where w�δ refers to the bond and issuer characteristics ln(MATURITY )i...Y EARSi
and their corresponding coefficients δLMAT ...δY EARS. Since these are chooser-specific (and
not choice-specific) variables, parameters are estimated separately for each choice (thus δ
are now subscripted by m). The inclusive value Ii,t measures the expected aggregate value
of subset t, and the coefficient λ reflects the dissimilarity of alternatives within a specific
subset. Thus λ = 1 would imply that there are no differences in substitution patterns between
choices within the nest and those across the nests, while λ = 0 would imply that there is
perfect correlation among choices within the nests. Allowing λ to be other than 1 makes this
model more general; more importantly, it allows us to test for any inherent organizational-
form specific differences between commercial banks and investment banks after explicitly
controlling for bank relationships. This coefficient essentially indicates whether there are
systematic differences between commercial banks and investment banks that are not captured
by other control variables.
In addition to estimating this baseline model, I examine how the firm’s valuation of re-
lationships varies with its borrower reputation. As discussed earlier, Diamond’s reputation-
building argument predicts an inverse relationship. To test this hypothesis, I also estimate
specifications where the borrower-reputation characteristics of issuers interact with the rela-
tionship and fee variables.29
29This further relaxes the restrictive nature of traditional discrete-choice models by allowing differencesbetween individual choosers (firms) to have a systematic effect on their valuations. This point is well discussedin Goldberg (1995).
17
4.2 Fee Equations
A data issue arises in studying this market because fees vary across both issuers and banks,
but only one fee per issue is observed, namely, the fee offered by the bank that is hired to
underwrite the bond. Thus, I impute the fees of unchosen banks for each issue. This follows
the practice of competition studies of other industries.30 I control for the correlation of fees
with the quality of the issue by using the same issue category as the one realized in each
observation. For example, if a given observation was a short-maturity, AAA, first-time issue,
I impute the fees for that issue category for all banks.
Specifically, I impute the fees in the following multi-variate specification:
FEEi,j = γCONSj + γLMAT
j ln(MATURITY )i + γISSUEj ln(NO.ISSUES+1)i +
γLAMTj ln(AMOUNT )i + γCREDIT
j CREDIT RATINGSi +
γY EARj Y EARSi + γLOAN
j LOANi,j + ui,j. (5)
As discussed in Section 2, underwriting fees are determined in part by various costs, including
distribution costs, the expected cost of taking market and underwriter reputation risks,
and information production costs. The value γCONSj is the constant coefficient. The value
ln(MATURITY )i is the natural log of the bond maturity in years. In general, underwriters
demand higher underwriting fees for longer maturity bonds. This makes sense to the extent
that a normal yield curve is also upward sloping; in addition, the secondary market for
30-year corporate bonds is much less liquid than for 30-year government bonds.
The value ln(NO.ISSUES+1)i is the natural log of the number of previous bond issues
plus 1. The variable CREDIT RATINGSi represents credit rating dummies based on
the average of all credit ratings for a given bond issue, and 0 otherwise.31 Having lower
30For example, see Goldberg (1995).31No one agency dominates the Japanese market and, as a result, no comprehensive sample of ratings
by a single agency is available. The 6 leading credit-rating agencies whose ratings I use are: Japan BondRating Institute, Japan Credit Rating Agency, Ltd., Nippon Investors Services, Japan Rating and InvestmentInformation, Inc., Moody’s Investors Service, and Standard & Poor’s.
18
credit ratings means issuers have less financial strength and in general have lower borrower
reputation than those with higher credit ratings. This increases the risk-related cost for
the underwriter. It might also mean that it is more costly to distribute these bonds since
the company is less well-known and investors need to be marketed more intensively (which
also feeds back to creating potentially greater market risk). For similar reasons, investors
require substantially higher yields for junk bonds. LOANi,j is 1 if a prior loan relationship
exists, and 0 otherwise. I have included loans in the fee equation to evaluate the benefit of
relationships net of the effect of loans on fees in the demand model. Finally, ui,j is the error
term, which is assumed to be distributed iid normal.
Note that, though the fees are assumed to be exogenous in the model, the observations
I use to compute the average fees are not a random subset, but are the fees charged when
they are chosen. Not controlling for this feature of the data will lead to biased estimates of
fees. To illustrate this point, let ci represent the index of the bank chosen by firm i. Since
the fee affects the demand for a given bank’s underwriting service negatively (assuming a
downward-sloping demand), the fact that a given bank was chosen over other banks in the
choice set implies that these observed fees, (FEEi,j; j = ci), are on average lower than the
unconditional distribution of FEEi,j. As a result, if I impute unobserved fees by obtaining
estimates of γ from Equation (5) using observed fees as dependent variables, the model will
systematically underestimate unobserved fees and bias the fee coefficient α toward zero.
To control for this feature of the data, I use the Expectation-Maximization (EM) Al-
gorithm to impute the fees conditional on the firm’s underwriter choice.32 The main idea
is to obtain fee-equation estimates γ and demand-equation estimates α and β jointly in an
iterative algorithm where fee imputation is conditional on the information in ci, i = 1..N and
where Maximum Likelihood estimation is straightforward. The demand estimates obtained
from this estimation method are then used to estimate the upper level of the nested-logit
32See Dempster, Laird, and Rubin (1977) and McLachlan and Krishnan (1997) for the literature surveyof this method.
19
model. Details of the procedures are described in the Appendix.
4.3 Research Questions
With the empirical model specified, I test the following research hypotheses:
1. Are relationships significant in determining the firm’s underwriter choice? This is
captured by coefficient β in Equation (2). Furthermore, does the effect of relationships
on underwriter choice depend on (i) borrower reputation and (ii) the strength of the
relationships? This is tested by redefining bank relationship variables and examining
how the coefficient β changes.
2. How do relationships affect fees? This is captured by the coefficient γLOAN in Equation
(5). Furthermore, γLOAN is separately estimated for solo-relationship and multiple-
relationship issuers, where the number of relationships is used as a measure of interbank
competition.
3. How does bank equity holding interact with lending relationships in determining the
firm’s underwriter choice and the underwriting fee it is charged? This is captured by
separately estimating β and γLOAN for (i) loan-only issuers, (ii) loan-and-equity issuers,
and (iii) equity-only issuers.
4. Does the presence of bank relationships affect the choice probabilities of other banks
without relationships? This is tested by estimating the probit model.
5 Estimation Results
5.1 Baseline Model
Table 2 reports the estimation results of the baseline underwriter-choice model. Panel A
presents estimates of the fee equations, γ; Panel B presents estimates of the demand model,
20
α, β, λ and δ. In Panel A, the estimates of commercial banks and investment banks are
aggregated separately. Coefficients for the maturity are both positive, which is consistent
with the analysis of fee determination in Section 2 and with the discussion of variables
entering fee equations in Section 4.2. Coefficients for credit-rating dummies are also positive
and significant for both commercial banks and investment banks, indicating that higher
fees are charged for lower-rated issuers. The coefficient for the number of previous issues is
positive and significant for both commercial banks and investment banks, which is somewhat
surprising. There is a significant fee discount when there are lender relationships between
firms and commercial banks.
************************
Insert Table 2 about here
************************
Panel B shows that both fees and prior loan relationships are significant determinants of
the firm’s underwriter choice. The fee coefficient α is negative and significant, indicating a
downward-sloping demand for underwriting service. The relationship coefficient β is positive
and significant, which indicates that firms derive a benefit from choosing banks with prior
lender relationships.
Coefficients on issuer and bond characteristics included in the upper nest are generally
as expected and consistent with the summary statistics in Table 1. Since these are chooser-
specific variables, parameters are estimated separately for each choice. The coefficients for
one choice (in this case investment banks) are normalized to zero, so the reported coefficients
are for the choice of commercial banks. The coefficient on the issue amount and maturity is
negative and significant, whereas the coefficient on the previous issue experience is positive
and significant. This is consistent with the prediction that firms issuing large bonds and
long bonds are less likely to choose commercial banks (due to their limited operational scale)
and that more seasoned issuers are more likely to choose them, potentially due to their prior
21
relationships. λ, the dissimilarity coefficient of the nested-logit model, is 0.2476, which is
different from one at the 5% significance level. λ �= 1 implies that the nesting as specified in
Figure 1 is not redundant; an investment bank is a closer substitute for another investment
bank than for a commercial bank, and vice versa.
5.2 Investment Grade vs. Non-Investment Grade Model
Table 3 reports the estimation results where fee and relationship coefficients are allowed to
vary across the issuer’s borrower reputation characteristics, i.e., credit ratings. Specifically,
I divide the sample by whether the issuer’s credit rating is investment grade at the time of
the issuance. Being rated investment grade means issuers have superior financial strength
and in general higher borrower reputation than those with lower ratings.
************************
Insert Table 3 about here
************************
In panel B, the fee coefficient α1 for investment-grade issuers is negative and significant
at -41.8507, whereas the fee coefficient for low-rated issuers is significant but less steep at
-10.9850. The difference is statistically significant. This suggests that investment-grade
issuers are significantly more fee-sensitive than non-investment grade issuers. The loan co-
efficients β are positive and significant for both types of issuers. (The difference is not
significant.) The upper-nest coefficients are qualitatively similar to those in the baseline
model. Firms with smaller issues and more seasoned issuers are more likely to choose com-
mercial bank underwriters. The dissimilarity coefficient λ is again significantly different
from 1. Fee-equation estimates in Panel A are qualitatively (and quantitatively) similar to
the baseline model results. Interestingly, significantly deeper fee discounts are offered to
low-rated issuers as compared to high-rated issuers.
22
5.3 First-time vs. Seasoned Model
Table 4 reports the estimation results where the trade-off between fee and relationship in
the demand equation is allowed to vary along the newness of the issuers in the corporate
bond market. Investors are less likely to be familiar with or even to recognize the name of
first-time issuers in the market, so these firms are worse off than seasoned issuers in terms
of their borrower reputation. Seasoned issuers, on the other hand, have a track record of
issuing public debt, which contributes positively to their borrower reputation.
************************
Insert Table 4 about here
************************
In Panel B, the fee coefficient α1 for seasoned (i.e. “high reputation”) issuers is negative
and significant at -123.3734, whereas the fee coefficient α2 for first-time issuers (“low rep-
utation”) is not significantly different from zero. The loan coefficients β1 and β2 are both
positive and significant. The size of the dissimilarity coefficient λ is significantly different
from 1, as in the two previous specifications. Fee-equation coefficients (presented in Panel A)
are again similar to the baseline results. Interestingly, a fee premium is charged to first-time
issuers with lending relationships, whereas a fee discount is offered to seasoned issuers with
lending relationships.
5.4 Alternative Measures of Relationships
As discussed in Section 4, I use a top-lender position (in any given year) as an indicator
of a prior banking relationship. In Table 5, I report the results of broadening this relation-
ship definition that allow measurement of rankings among lending banks for a given firm.
Constructing such variables serves two purposes. First, running alternative specifications
using these variables allows me to check the robustness of my main results for the Japanese
data. Second, it allows me to assess whether the rankings or strength of bank relationships
23
matter, an interesting empirical question in the broader context of the literature on bank
relationships.
The rankings are based on firm-, bank-, and year- specific loan ratio variables. The loan
ratio is defined asbankj
′s loan to firmi
firmi′s total bank loan
. For each bank-firm pair, I took a 5-year average (from
1988 to 1992) of these loan ratios. Using these loan ratio variables, I identify a top lender,
second-largest lender, third-largest lender, and the rest of the lenders with lower rankings
than third, all among the 11 commercial-bank underwriters.33
************************
Insert Table 5 about here
************************
Using these rankings, I constructed four alternative measures of relationships, from the
most exclusive (=1 only if a given bank was the top lender) to the most inclusive (=1
if a given bank had an average loan ratio of greater than zero).34 I find that there is a
monotonically increasing relationship between the significance of lending relationships and
its positive effect on the firm’s underwriter choice. As shown, coefficients are all positive
and significant, with the top-lender relationship being the largest (1.9328) and all lender
relationships being the smallest (0.3738). I find that the coefficient for the fee variable is
negative and significant. The coefficients for the inclusive value variable and for previous
market exposure and issue amount have the predicted signs.
33Taking the average seemed reasonable, because I observed in the data some years in which no loans weremade by a given bank. Wherever there is a tie, I count each as possessing that rank, and assign the nextlargest lender as having a rank right below them. So two banks with the top share of 0.20 each both get atop lender position, the next bank with the share of 0.15 gets a second-largest lender position, and so on.Ties occur in about 5% of the sample for the top three lenders.
34I also tried different specifications, where Loan Ratio variables (both including and excluding the lower-ranked lenders) were used instead of these lender ranking variables and found that the results did not change.
24
5.5 Interbank Competition and Fees
In Panel A of Table 2, the loan coefficient γLOANj is negative and significant. This indicates
that commercial banks charge lower fees to those firms with which they have relationships
than to other firms. Does this result depend in turn on the degree of interbank competition?
The theoretical literature on the costs and benefits of lending relationships shows that while
banks are better at monitoring the quality of internal projects within the firms than arm’s-
length providers of debt, this very advantage also gives banks opportunities to extract rent
from their relationships, thereby reducing expected profits for the firms implementing the
projects. In the context of bond underwriting, this might result in banks charging higher
fees to those firms with which they had lender relationships (and thus informational advan-
tages). This hold-up problem, however, might be mitigated by the increase in interbank
competition.35 We hypothesize that firms with greater bargaining power will thus optimally
choose a high degree of interbank competition and obtain reduced fees, whereas firms with
low bargaining power will be subject to fee premiums. To capture the degree of interbank
competition, we use the number of lender relationships and separately estimate γLOANj for
firms with multiple lender relationships and firms with solo relationships, respectively.
Existing empirical evidence on the impact of multiple-bank relationships on pricing and
quantity of credit extended to firm is mixed.36 This may partially be due to differences in
the types of firms analyzed across studies. For small, private firms, multiple relationships
tend to hurt pricing and availability of credit (as in Petersen and Rajan (1994)), whereas
among larger firms, single-relationship firms are found to be more credit-constrained (e.g., see
Houston and James (2001)).37 The Japanese firms I study in this paper are large, publicly-
traded firms; thus, the prediction consistent with the extant literature is that multiple-
relationship firms enjoy better bargaining power vis-a-vis their banks.38
35For theoretical analysis, see, for example, Rajan (1992) and Marquez (2002).36See Ongena and Smith (1998) for a survey review.37Also see Farinha and Santos (2002) for non-U.S. evidence of small firms.38Also see Houston and James (1996) for U.S. evidence of large firms.
25
************************
Insert Table 6 about here
************************
The estimation results of the Multi- vs. Solo-Relationship Model are presented in Table
6. Panel A presents the results of the fee equations. γLOAN is significantly more negative
for firms with multiple lender relationships as compared to firms with solo lender relation-
ships. The results suggest that firms are charged relatively higher fees by commercial-bank
underwriters when they have only one such relationship. The results are consistent with the
mitigating effect of interbank competition on banks’ monopoly power.
In Panel B, the fee coefficients α for both multi-relationship issuers and solo-relationship
issuers are negative and significant. The loan coefficients β1 and β2 are both positive and
significant and essentially equal in size. Other demand estimates are quantitatively and
qualitatively similar to the results in the base model.
5.6 Effects of Bank Equity Holdings
One of the key institutional differences between the Japanese and American banking systems
is that Japanese banks are allowed to own equity of the firms to which they lend, whereas U.S.
banks are normally prohibited from doing so. This additional control right might account for
part of the market share gains by Japanese commercial banks. To investigate this question,
I classify bank relationships into three mutually exclusive categories: (1) Loan only, which
is 1 if bank j had a lending relationship but no equity shareholding relationship with firm i;
(2) Loan and Equity, which is 1 if the bank had both a lending relationship and an equity
shareholding relationship with the firm; and (3) Equity only, which is 1 if the bank had an
equity shareholding but no lending relationship with the firm.
The estimation results of the Equity-and-Lending Relationship Model are presented in
Table 7.
26

************************
Insert Table 7 about here
************************
In Panel B, the coefficient β for Equity-only relationships is significant and negative,
whereas the coefficient β for Equity-and-loan relationships is significant and more positive
than that for Loan-only relationships. The differences between these coefficients are statis-
tically significant. These results suggest that bank equity holding relationships do not have
the same effects on the underwriter choice as lending relationships. Rather than substi-
tuting for lending relationships, equity holding relationships appear to complement lending
relationships.
In a paper that analyzes the co-existence of commercial bank and investment bank un-
derwriting, Puri (1999) argues that banks’ certification ability is hurt when they use the
proceeds of the securities they underwrite in order to retire their financial claim in the
firms. Consistent with this argument, one interpretation of the negative coefficient β for the
Equity-only relationship is as follows: If the bank is liquidating its financial claim, then its
certification ability is likely to be impaired. If so, it is a less credible certifier and it makes
sense for the firm to hire another underwriter.
In Panel A, the coefficient γ for Equity-only relationships is significant and positive,
whereas the coefficient γ for Loan-only relationships is significant and more negative than
that for Loan-and-Equity relationships. The differences between these coefficients are statis-
tically significant. These results indicate that equity shareholding is associated with higher
fees.
To summarize, the fee effects of bank equity holding are consistent with banks extracting
rents from their client firms. This reflects a strong bargaining power of lender banks that
also hold equity. On the other hand, the underwriter choice model result suggests that, at
least when bank equity holding is present together with lending, firms appear to derive a
benefit from choosing commercial banks with both equity and loan relationships, even with
27
the relative fee premium.39
5.7 Are Bank Relationships (Economically) More Important in
Japan?
The qualitative baseline results reported in Table 2 mirror the U.S. evidence reported in
Yasuda (2005). That is, bank relationships have positive effects on the firm’s underwriter
choice and negative effects on the fees the firm is charged. While the effects are statistically
significant in both countries, are there differences of economic significance between them?
In this subsection I attempt to compare the economic significance of the results in the two
countries.
Table 8 presents the comparison of the baseline results reported in Table 2 above for
Japan and in Table II of Yasuda (2005) for the U.S.
************************
Insert Table 8 about here
************************
To gauge the economic significance of the loan coefficients in the fee equations, I divide
the absolute value of the coefficients γ by σ, the sample standard deviation of fees. The
results indicate that the fee discounts for relationships are modest (approximately 10% of
the standard deviation in fees) and are of similar magnitude in the two countries.
To assess the relative economic significance of the loan coefficients in the underwriter
choice equations, I first divide the absolute values of the loan coefficients β by the fee
coefficients α. Note that the loan coefficient is an indicator variable that takes the value
of 1 if the firm had a relationship with a given bank, and 0 otherwise. Since the fee is
measured in percentage points, |βα| = 1 implies that 1% reduction in fees is required for a
39In a related study, Morck, Nakamura, and Shivdasani (2000) also find a positive relation between bankownership and firms’ interest costs. Also see Morck, Shleifer, and Vishny (1988). Clearly this is a rich topicfor further research.
28
bank with no loan relationships to achieve the same choice probability as a bank with loan
relationships, all else equal. As before, I further divide this measure by σ, the standard
deviation of fees. The results indicate that the magnitude of the effects of relationships on
the firm’s underwriter choice is greater in Japan than in the U.S., with the ratio of 3.87 for
Japan and that of 1.37 for the U.S. A plausible interpretation is that a bank relationship,
on average, is more valuable in Japan than in the U.S. and that this induces Japanese firms
to hire their banks as underwriters. I further explore this hypothesis in the next subsection.
5.8 Do Existing Relationships Discourage Switching?
As discussed earlier, this paper mainly focuses on how a given bank relationship affects
the likelihood that that particular bank will be chosen. As an extension, I also examine
whether the presence of bank relationships affects the relative likelihoods that other banks
will be chosen. Does the existing practice of the Japanese Main Bank system affect bank
competition in the post-deregulation bond underwriting market? Or does the deregulation
erase all traces of the old institutional practice in the emerging competitive landscape? To
address this question, I report the results using Japanese and U.S. data side by side.
Table 9 reports the sample breakdown of the firm’s choice between commercial banks
and investment banks conditional on (i) whether there are any prior relationships with
commercial banks and (ii) whether the relationship commercial bank is chosen. Panel A
reports the sample breakdown for the Japanese data; Panel B reports the sample breakdowns
according to the same sample criteria for the U.S. data; and Panel C reports a similar sample
breakdown for the U.S. data but conditioning on (i) whether there are any prior relationships
with investment banks and (ii) whether the relationship investment bank is chosen.
************************
Insert Table 9 about here
************************
29
Note that in both Panel A and Panel B, the existence of a prior lender relationship with a
commercial bank appears to reduce the probability that a firm will choose a new commercial
bank underwriter (relative to the case where there are no prior relationships). In contrast,
there appears to be no such pattern in the data in Panel C, where the choice probability
(between commercial banks and investment banks) is conditioned on the existence of prior
lender relationships between investment banks and firms.
To examine this further, I estimate a probit model where the sample is chosen to consist
of (1) issues where firms had no prior lender relationships and (2) issues where firms had
at least one lender relationship with a commercial bank but a bank other than the lender
bank(s) was chosen. Specifically, I model the binary underwriter-choice model (between
commercial banks and investment banks) as follows:
Vi,j = δLMATj ln(MATURITY )i + δISSUE
j ln(NO.ISSUES+1)i +
δLAMTj ln(AMOUNT )i + δINV GRADE
j INV GRADEi +
δY EARj Y EARSi + δCBLOAN
j CBLOANi + εi,j. (6)
The explanatory variables ln(MATURITY )i...Y EARSi are as defined before in the base
model. The new variable of interest, CBLOANi, is 1 if firmi has at least one lender rela-
tionship with a commercial bank, and 0 otherwise.
The effects of lending relationships on switching have been analyzed in prior studies.40
Ljungqvist, Marston, and Wilhelm (2006) studies the relative importance of bank relation-
ships and analyst recommendations as determinants of the firm’s underwriter choice using
the U.S. equity and bond underwriting data. In their study, strength of a given bank’s re-
lationship with a given firm is measured as the bank’s share of the issuer’s total past deals.
They find that this coefficient is generally positive and significant for prior lending relation-
ships. Since Firm X having a strong relationship with bank A would, ceteris paribus, lower
40Krigman, Shaw, and Womack (2001) and Burch, Nanda, and Warther (2005), among others, also examinethe effects of underwriting relationships on switching behavior of firms.
30
bank B’s share of X’s total past deals, a prediction consistent with the result of their study is
that the coefficient on CBLOANi is negative, i.e., existence of a lender relationship reduces
a firm’s switching probability.
Drucker and Puri (2005) studies the effects of concurrent lending and underwriting on
the firm’s underwriter choice and pricing of fees and loan yields using post-deregulation U.S.
data. In their study, they use a nested logit model similar to the main specification used in
Yasuda (2005) to study the effects of prior bank relationships on the firm’s switching choice
and find that concurrent lending significantly decreases the firm’s probability of switching to
another underwriter. Their finding would also support a negative coefficient on CBLOANi.
However, since both studies are done on the U.S. market, it remains an empirical question as
to whether the result extends to countries other than the U.S., and, even more interestingly,
whether the effect is stronger in bank-oriented economies such as Japan as compared to the
U.S.
************************
Insert Table 10 about here
************************
The estimation results are presented in Table 10. Panel A reports the estimates using
the Japanese data. The coefficient δCBLOANj is negative and significant. This indicates that
the presence of an existing lender relationship reduces the probability that a Japanese firm
will choose a new commercial bank underwriter by 32%. The economic magnitude of this
effect is quite large compared to the analogous estimate using the U.S. data, reported in
Panels B and C. As shown in Panel B, the presence of lender relationships with commercial
banks indeed reduces the probability that a U.S. firm will choose a new commercial bank
underwriter as well, but the economic magnitude is much smaller, only 6%. In contrast,
the coefficient δIBLOANj is not significantly different from zero in Panel C, where the probit
model is estimated to measure the effect of relationships with investment banks on the firm’s
31
switching probability.41 This indicates that the presence of lender relationships between in-
vestment banks and firms has no effect on the probability that a firm will choose a new
investment bank underwriter. The results together provide evidence that there is something
special about commercial bank relationships (as opposed to investment bank relationships)
and that firms are discouraged from hiring new banks in the presence of existing relation-
ships. Furthermore, this effect is more pronounced in Japan, where banking relationships
are arguably more valuable to firms as sources of external financing than they are in the U.S.
6 Conclusion
This paper empirically examines the sources of the Japanese commercial banks’ success-
ful entry into the corporate-bond underwriting market following deregulation in 1993. In
comparison with the phenomenal gain in collective market shares by Japanese banks, the
U.S. banks’ success in their domestic market has been more muted. Why were Japanese
commercial banks such successful entrants into the underwriting business?
The literature suggests three sources of explanations: values of bank relationships, fee
discounts, and bank equity holdings. Assessing the relative importance of these three sources
has significant policy implications; however, to the best of my knowledge, it has not been
examined in the literature. To explore these sources, I investigate a series of empirical
questions using a rich sample of data on bank-firm relationships and the firm’s choice of
underwriting banks for bond issues. Using a framework that allows imputation of unobserved
fees conditional on the choice of underwriter, I directly model the firm’s underwriter-choice
problem and measure the effect of relationships on the choice of underwriter, both when the
relationship bank is chosen and when it is not. The methodology allows me to disentangle the
effects of relationships on the underwriter choice and their effects on fees, thereby reconciling
41For this model, the sample consists of (i) issues where firms had no prior lender relationships withinvestment banks and (2) issues where firms had at least one lender relationship with an investment bankbut a bank other than the relationship bank(s) was chosen.
32
the discrepancies in the literature that has examined the post-deregulation Japanese market.
First, I find that lending relationships have significant and positive effects on a firm’s
underwriter choice, over and above their effects on fees. Moreover, this result is sharply
stronger for lower-rated issuers and for top lenders. This indicates that firms derive a benefit
from choosing banks with prior bank relationships, all else equal.
Second, I find that there is a significant fee discount when there are lending relation-
ships between firms and commercial-bank underwriters. Further examining whether the fee
discount derives from bank competition, I find that significantly deeper fee discounts are
offered to firms with multiple relationships than to single-relationship firms. This is consis-
tent with the view that multiple banking relationships mitigate potential bank information
monopolies.
Third, I find that bank equity holdings alone have significant and negative effects on a
firm’s underwriter choice, whereas equity holdings together with lending relationships have
significantly more positive effects than lending relationships alone. These findings suggest a
complementary relation between bank equity holding and bank lending. One interpretation
is that equity holdings alone (without loans) indicate past retirement of financial claims by
banks using proceeds from prior issues, thus hurting their certification ability. As for the fee
effects, equity holdings alone are associated with a fee premium, whereas lending relationships
alone are associated with a deeper fee discount than lending relationships together with
equity holdings. These results reflect a strong bargaining power of lender banks that also
hold equity.
Finally, comparing the economic significance of the values of relationships and the fee
discounts in the Japanese market (reported in this paper) and the U.S. market (reported
in Yasuda (2005)), I find evidence that relationship values dominate in terms of economic
magnitudes; that is, the relative success of Japanese banks’ entry into the underwriting
business owes more to the greater values of their bank relationships than to the fee discounts
they give to their client firms.
33
Building further on the above finding, I examine whether the existence of prior rela-
tionships affects a firm’s switching probability in the two markets. I find that the presence
of existing lender relationships with commercial banks reduces a Japanese firm’s switching
probability by 32%, in contrast to only 6% for U.S. firms. These results indicate that, ceteris
paribus, Japanese firms are more reluctant to hire a new commercial bank underwriter in the
presence of lending relationships than U.S. firms. A plausible interpretation is that a bank
relationship on average is more valuable in Japan than in the U.S., making it more costly for
a Japanese firm to hire a new commercial bank in the underwriting market. Alternatively,
loyalty pays more - by continuing with the same bank underwriter, a Japanese firm enjoys
greater benefits, such as lower fees in future transactions, greater access to capital, or a more
cooperative creditor in the event of financial distress. Clearly a better understanding of the
nature of these benefits is needed, and is an appropriate subject for further research.
The evidence presented in this paper shows that bank relationships are very important
in shaping bank competition in the corporate bond underwriting market in Japan. Firms
derive a benefit from choosing a bank with prior bank relationships, over and above their
effects on fees. This explains the successful entry by commercial banks into this market,
since they had relationships with many of the issuing firms in the lending market. Another
benefit of continuing with the same bank underwriter for the firms is a fee discount, but
the underwriter-choice model result shows that the benefit goes beyond that. This benefit
in turn is not uniformly distributed among the firms. Rather, it is positively related to
information sensitivity of the issuing firms. Moreover, not all relationships are beneficial:
Firms value more highly those relationships where banks played a pivotal informational role.
Meanwhile, commercial banks do not have a generic advantage over investment banks.
Rather, these firms appear to carefully maintain a few key bank relationships, and their
exclusiveness persists in the new market when the scope of the existing relationships widens.
Thus, far from concluding that deregulation erased all traces of the decades-old relationships
between banks and firms, these results indicate that bank relationships continue to affect
34

firms’ and banks’ choices in the post-deregulation intermediation process. Importantly, the
results reported in this paper also suggest that the differences between Japan and the U.S.
derive mainly from differences in the values of relationships in the two countries rather than
from differences in the fee discounts offered to firms.
35
Appendix
In the Expectation-Maximization (EM) Algorithm framework, the observed data are
viewed as being “incomplete” and are augmented by unobserved data to make up the “com-
plete data.” Each EM iteration involves an E-step, where the conditional expectation of
the complete-data log likelihood given the observed data is computed using the previous
estimates θ(0), and an M-step, where the conditional expectation is maximized over θ. This
procedure is repeated iteratively until convergence is achieved.
Let ci represent the index of the bank chosen by firm i.
Let θ = {α, β, γ, σ}.Let z represent the explanatory variables entering the fee equations.
Let pi,j represent the underwriting fees and let xi,j represent the relationship variables.
We observe ci and pi,ci, as well as xi,j , zi. The task is to estimate θ according to the
maximum likelihood principle. I do this using an EM-type algorithm, assuming p−cito be
the “hidden” data and hence {ci, pci, p−ci
} to be the complete data. Thus I need to establish
Pr(ci, pci, p−ci
|θ).
Pr(c, pc, p−c|θ) = Pr(c|pc, p−c, θ) Pr(pc, p−c|θ)
by Bayes’s rule. According to the logit demand model
Pr(c|pc, p−c, θ) =eαpc+βxc∑K
k=1 eαpk+βxk
.
According to the iid normal distribution of uk, we know that each pk ∼ N(zT γk, σ2) inde-
pendently. Hence
Pr(pc, p−c|θ) =
K∏k=1
1√2πσ2
e−1
2σ2 (pk−zT γk)2 .
36
Hence, we have the log likelihood of the complete data (of a single firm) as
ln Pr(c, pc, p−c|θ) = − 1
2σ2
K∑k=1
(pk − zT γk)2 − K
2ln 2πσ2 +
lneαpc+βxc∑K
k=1 eαpk+βxk
.
In order to implement the E-step, I compute
Eθ(0)( lnPr(c, pc, p−c|θ) | c, pc )
=
∫ln( Pr(c, pc, p−c|θ)) Pr(p−c|c, pc, θ
(0)) dp−c
=
⎛⎝∫ ∏
k �=c e− 1
2σ2,(0)(pk−zT γ
(0)k )2
eα(0)pc+β(0)xc +∑
k �=c eα(0)pk+β(0)xkdp−c
⎞⎠
−1
∫ln( Pr(c, pc, p−c|θ))
⎛⎝ ∏
k �=c e− 1
2σ2,(0)(pk−zT γ
(0)k )2
eα(0)pc+β(0)xc +∑
k �=c eα(0)pk+β(0)xk
⎞⎠ dp−c .
Note that the first integral term is irrelevant in the M-step because it is a function only of
the old parameters θ(0) and therefore is invariant with respect to new θ . So for the rest
of this section I drop this term from the analysis. What remains inside the second integral
term is the product of a log of complete-data likelihood (evaluated at the new θ) and the
remaining part of the conditional probability Pr(p−c|c, pc, θ(0)) , to be evaluated at the old
θ.
These are high-dimensional (K = 15) integrals over hybrid distributions consisting of
normal and logit components and are computationally non-trivial. Neither numerical in-
tegration nor Monte-Carlo EM (where the E-step is replaced by a Monte-Carlo process) is
trivial or immediately promising given the high dimensionality. Instead I use what is com-
monly referred to as an “EM-type algorithm,” where the single most likely value p−c that
maximizes the conditional density above (i.e., only Pr(c, pc, p−c|θ(0)) ) is computed and a
probability of 1 is placed on these data. In terms of the underlying economic problem, this
part can be described as adjusted fee imputation, where, instead of using unconditionally
37
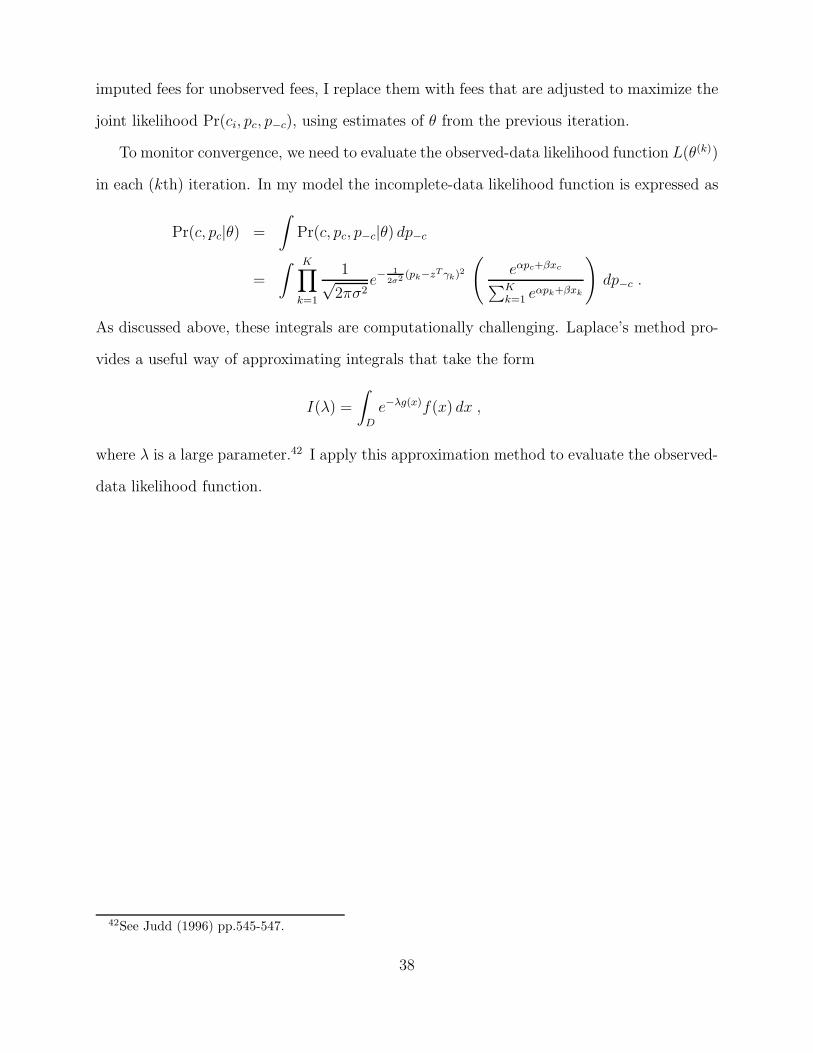
imputed fees for unobserved fees, I replace them with fees that are adjusted to maximize the
joint likelihood Pr(ci, pc, p−c), using estimates of θ from the previous iteration.
To monitor convergence, we need to evaluate the observed-data likelihood function L(θ(k))
in each (kth) iteration. In my model the incomplete-data likelihood function is expressed as
Pr(c, pc|θ) =
∫Pr(c, pc, p−c|θ) dp−c
=
∫ K∏k=1
1√2πσ2
e−1
2σ2 (pk−zT γk)2
(eαpc+βxc∑K
k=1 eαpk+βxk
)dp−c .
As discussed above, these integrals are computationally challenging. Laplace’s method pro-
vides a useful way of approximating integrals that take the form
I(λ) =
∫D
e−λg(x)f(x) dx ,
where λ is a large parameter.42 I apply this approximation method to evaluate the observed-
data likelihood function.
42See Judd (1996) pp.545-547.
38
References
Allen, Franklin, and Douglas Gale, 2000, Comparing Financial Systems (The MIT Press).
Ang, James S., and Terry Richardson, 1994, The underwriting experience of commercial
bank affiliates prior to the Glass-Steagall Act: A re-examination of evidence for passage
of the Act, Journal of Banking and Finance 18, 351–395.
Aoki, Masahiko, and Hugh Patrick (eds.), 1994, The Japanese Main Bank System
(Oxford University Press).
Aoki, M., and G. Saxonhouse (eds.), 2000, Finance, Governance, and Competitiveness
in Japan (Oxford University Press: Oxford).
Ber, Hedva, Yishay Yafeh, and Oved Yosha, 2001, Conflict of interest in universal banking:
Bank lending, stock underwriting, and fund management, Journal of Monetary Economics
47, 189–218.
Berlin, Mitchell, Kose John, and Anthony Saunders, 1996, Bank equity stakes in borrowing
firms and financial distress, Review of Financial Studies 9, 889–919.
Bharath, Sreedhar, Sandeep Dahiya, and Anthony Saunders, forthcoming, So what do I get?
The bank’s view of lending relationships, Journal of Financial Economics.
Billett, Matthew T., Mark J. Flannery, and Jon A. Garfinkel, 1995, The effect of lender
identity on a borrowing firm’s equity return, Journal of Finance 50, 699–718.
Boot, Arnoud W.A., and Anjan V. Thakor, 2000, Can relationship banking survive compe-
tition?, Journal of Finance 55, 679–713.
Burch, Timothy R., Vikram Nanda, and Vincent Warther, 2005, Does it pay to be loyal? an
empirical analysis of underwriting relationships and fees, Journal of Financial Economics
77, 673–699.
Dempster, Arthur P., Nan M. Laird, and Donald B. Rubin, 1977, Maximum likelihood from
incomplete data via the EM algorithm (with discussion), Journal of the Royal Statistical
Society B 39, 1–38.
Dewenter, Kathryn L., and Vincent A. Warther, 1998, Dividends, asymmetric information,
and agency conflicts: Evidence from a comparison of the dividend policies of japanese and
u.s. firms, Journal of Finance 53, 879–904.
39
Diamond, Douglas W., 1991, Monitoring and reputation: The choice between bank loans
and directly placed debt, Journal of Political Economy 99, 689–721.
Drucker, Steve, and Manju Puri, 2005, On the benefits of concurrent lending and underwrit-
ing, Journal of Finance 60, 2763–99.
, 2006, Banks in capital markets, in Espen Eckbo, ed.: Empirical Corporate Finance
(North-Holland Publishers: Amsterdam).
Farinha, Luisa A., and Joao A. C. Santos, 2002, Switching from single to multiple bank
lending relationships: Determinants and implications, Journal of Financial Intermediation
11, 124–51.
Gande, Amar, Manju Puri, and Anthony Saunders, 1999, Bank entry, competition, and the
market for corporate securities underwriting, Journal of Financial Economics 54, 165–195.
, and Ingo Walter, 1997, Bank underwriting of debt securities: Modern evidence,
Review of Financial Studies 10, 1175–1202.
Gilson, Stuart C., John Kose, and Larry H. P. Lang, 1990, Troubled debt restructurings:
An empirical study of private reorganization of firms in default, Journal of Financial
Economics 27, 315–353.
Goldberg, Pinelopi K., 1995, Product differentiation and oligopoly in international markets:
The case of the U.S. automobile industry, Econometrica 63, 891–951.
Gompers, Paul, and Josh Lerner, 1999, Conflict of interest in the issuance of public securities:
Evidence from venture capital, Journal of Law and Economics 42, 1–28.
Gorton, Gary, and Frank A. Schmid, 2000, Universal banking and the performance of German
firms, Journal of Financial Economics 58.
Gorton, Gary, and Andrew Winton, 2003, Financial intermediation, in George M. Con-
stantinides, Milton Harris, and Rene Stulz, ed.: Handbook of the Economics of Finance,
Volume 1A, Corporate Finance (Elsevier: Amsterdam, London and New York).
Greene, William H., 2003, Econometric Analysis (MacMillan Publishing Company).
Hamao, Yasushi, and Takeo Hoshi, 2003, Bank underwriting of corporate bonds: Evidence
from Japan after the Financial System Reform of 1993, .
40
Hayashi, F., 2000, The main bank system and corporate investment: An empirical reassess-
ment, in M. Aoki, and G. Saxonhouse, ed.: Finance, Governance, and Competitiveness in
Japan (Oxford University Press: Oxford).
Hoshi, T., A. Kashyap, and D. Scharfstein, 1990a, Bank monitoring and investment: Evi-
dence from the changing structure of japanese corporate banking relationships, in R. Glenn
Hubbard, ed.: Asymmetric Information, Corporate Finance, and Investment (University
of Chicago Press: Chicago and London) A National Bureau of Economic Research Project
Report.
, 1990b, The role of banks in reducing the costs of financial distress in Japan, Journal
of Financial Economics 27, 67–88.
, 1991, Corporate structure, liquidity, and investment: Evidence from japanese in-
dustrial groups, Quarterly Journal of Economics 106.
Houston, Joel, and Christopher James, 1996, Bank information monopolies and the mix of
private and public debt claims, Journal of Finance 51, 1863–1889.
, 2001, Do relationships have limits? Banking relationships, financial constraints,
and investment, Journal of Business 74, 347–374.
James, Christopher, 1987, Some evidence on the uniqueness of bank loans, Journal of Fi-
nancial Economics 19, 217–235.
, 1995, When do banks take equity in debt restructurings?, Review of Financial
Studies 8, 1209–1234.
Judd, Kenneth L., 1996, Approximation, perturbation, and projection methods in economic
analysis, in Hans M. Amman, David A. Kendrick, and John Rust, ed.: Handbook of Com-
putational Economics, Volume I (Handbooks in Economics: 13) (Elsevier: Amsterdam).
Kang, Jun-Koo, and Wei-Lin Liu, 2004, Is universal banking justified? Evidence from bank
underwriting of coporate bonds in Japan, Working paper.
Kang, Jun-Koo, and Rene M. Stulz, 2000, Do banking shocks affect borrowing firm perfor-
mance? An analysis of the Japanese experience, Journal of Business 73, 1–23.
Kaplan, Steven N., and Bernadette A. Minton, 1994, Appointments of outsiders to Japanese
boards: Determinants and implications for managers, Journal of Financial Economics 36,
225–258.
41
Klein, Peter, and Kathrin Zoeller, 2003, Universal-bank underwriting and conflicts of inter-
est: Evidence from German initial public offerings, Working paper, University of Missouri
at Columbia.
Konishi, Masaru, 2002, Bond underwriting by banks and conflicts of interest: Evidence from
Japan during the pre-war period, Journal of Banking and Finance 26, 767–793.
Krigman, Laurie, Wayne H. Shaw, and Kent L. Womack, 2001, Why do firms switch under-
writers?, Journal of Financial Economics 60, 245–284.
Kroszner, Randall S., and Raghuram G. Rajan, 1994, Is the Glass-Steagall Act justified?
A study of the U.S. experience with universal banking before 1933, American Economic
Review 84, 810–832.
Kroszner, Randall S., and Philip E. Strahan, 2001, Bankers on boards: Monitoring, conflicts
of interest, and lender liability, Journal of Financial Economics 62, 415–452.
Li, Xi, and Ronald Masulis, 2005, Venture capital investments by IPO underwriters: Certi-
fication or conflict of interest?, working paper Vanderbilt University.
Ljungqvist, Alexander, Felicia Marston, and William J. Wilhelm, Jr., 2006, Competing for
securities underwriting mandates: Banking relationships and analyst recommendations,
Journal of Finance 61, 301–340.
MacKie-Mason, Jeffrey K., 1990, Do firms care who provides their financing?, in R. Glenn
Hubbard, ed.: Asymmetric Information, Corporate Finance, and Investment (University
of Chicago Press: Chicago and London) A National Bureau of Economic Research Project
Report.
Maddala, G. S., 1983, Limited-Dependent and Qualitative Variables in Econometrics (Cam-
bridge University Press).
Marquez, Robert, 2002, Competition, adverse selection, and information dispersion in the
banking industry, Review of Financial Studies 15, 901–926.
Massa, Massimo, and Zahid Rehman, 2005, Information flows within financial conglomerates:
Evidence from the banks-mutual funds relationship, Working paper INSEAD.
McLachlan, Geoffrey J., and Thriyambakam Krishnan, 1997, The EM Algorithm and Exten-
sions (John Wiley and Sons, Inc.: New York).
42
Morck, Randall, Masao Nakamura, and Anil Shivdasani, 2000, Banks, ownership structure,
and firm value in Japan, Journal of Business 73, 539–567.
Morck, Randall, Andrei Shleifer, and Robert W. Vishny, 1988, Management ownership and
market valuation: An empirical analysis, Journal of Financial Economics 20, 293–315.
Okamura, Hideo, 2003, Kinnen no shasai shijo kaikaku to fusai chotatsu kosuto no kettei yoin
(recent reform of the bond market and the determinants of the funding cost liabilities),
in Tsutomu Okato, and Junsuke Matsuo, ed.: Gendai Shasai Shijo Bunseki: Aratanaru
Apuroochi (Analysis of Modern Corporate Bond Markets: A New Approach) (Dai Nippon
Printing: Tokyo) (in Japanese).
Ongena, Steven, and David C. Smith, 1998, Bank relationships: A review, in P. Harker,
and S. A. Zenios, ed.: The Performance of Financial Institutions (Cambridge University
Press).
Petersen, Mitchell A., and Raghuram G. Rajan, 1994, The benefits of lending relationships:
Evidence from small business data, Journal of Finance 49, 3–37.
, 1995, The effect of credit market competition on lending relationships, Quarterly
Journal of Economics 110, 407–43.
Puri, Manju, 1994, The long-term default performance of bank underwritten security issues,
Journal of Banking and Finance 18, 397–418.
, 1996, Commercial banks in investment banking: Conflict of interest or certification
role?, Journal of Financial Economics 40, 373–401.
, 1999, Commercial banks as underwriters: Implications for the going public process,
Journal of Financial Economics 54, 133–163.
Rajan, Raghuram G., 1992, Insiders and outsiders: The choice between informed and arm’s-
length debt, Journal of Finance 47, 1367–400.
, and Luigi Zingales, 1995, What do we know about capital structure? some evidence
from international data, Journal of Finance 50.
Roten, Ivan C., and Donald J. Mullineaux, 2002, Debt underwriting by commercial bank-
affiliated firms and investment banks: More evidence, Journal of Banking and Finance
26, 689–718.
43
Santos, Joao, and Adrian Rumble, forthcoming, The American keiretsu and universal banks:
Investing, voting and sitting on nonfinancials’ corporate boards, Journal of Financial
Economics.
Schenone, Carola, 2004, The effect of banking relationships on the firm’s IPO underpricing,
Journal of Finance 59, 2903–2958.
Sharpe, Steven A., 1990, Asymmetric information, bank lending, and implicit contracts: A
stylized model of customer relationships, Journal of Finance 45, 1069–1087.
Takaoka, Sumiko, and Colin McKenzie, 2004, The impact of bank entry in the Japanese
corporate bond underwriting market, Working paper Keio University.
Ursel, Nancy, and Paul Ljucovic, 1998, The impact of bank ownership of underwriters on
the underpricing of initial public offerings, Canadian Journal of Administrative Sciences
15, 17–27.
Weinstein, David E., and Yishay Yafeh, 1998, On the costs of a bank-centered financial
system: Evidence from the changing main bank relations in Japan, Journal of Finance
53, 635–672.
Yasuda, Ayako, 2005, Do bank relationships affect the firm’s underwriter choice in the
corporate-bond underwriting market?, Journal of Finance 60, 1259–1292.
44
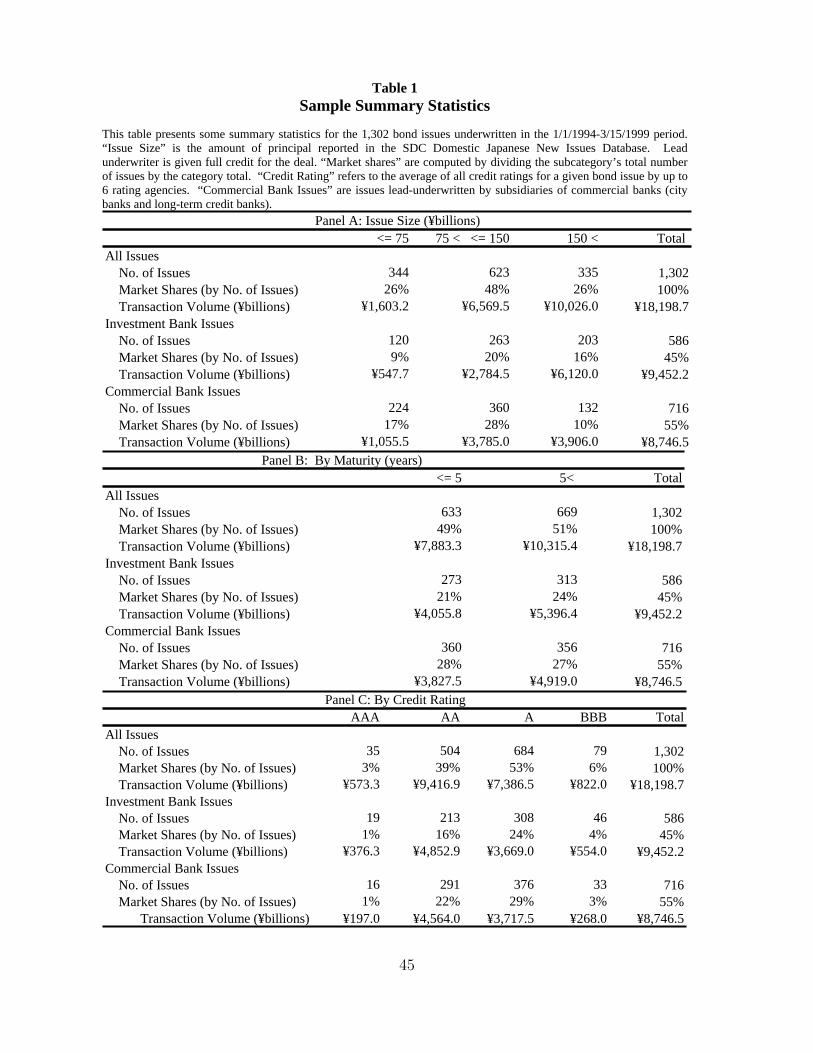
Table 1 Sample Summary Statistics
This table presents some summary statistics for the 1,302 bond issues underwritten in the 1/1/1994-3/15/1999 period. “Issue Size” is the amount of principal reported in the SDC Domestic Japanese New Issues Database. Lead underwriter is given full credit for the deal. “Market shares” are computed by dividing the subcategory’s total number of issues by the category total. “Credit Rating” refers to the average of all credit ratings for a given bond issue by up to 6 rating agencies. “Commercial Bank Issues” are issues lead-underwritten by subsidiaries of commercial banks (city banks and long-term credit banks).
<= 75 75 < <= 150 150 < Total All Issues No. of Issues 344 623 335 1,302 Market Shares (by No. of Issues) 26% 48% 26% 100% Transaction Volume (¥billions) ¥1,603.2 ¥6,569.5 ¥10,026.0 ¥18,198.7Investment Bank Issues No. of Issues 120 263 203 586 Market Shares (by No. of Issues) 9% 20% 16% 45% Transaction Volume (¥billions) ¥547.7 ¥2,784.5 ¥6,120.0 ¥9,452.2Commercial Bank Issues No. of Issues 224 360 132 716 Market Shares (by No. of Issues) 17% 28% 10% 55% Transaction Volume (¥billions) ¥1,055.5 ¥3,785.0 ¥3,906.0 ¥8,746.5
Panel A: Issue Size (¥billions)
<= 5 5< TotalAll Issues No. of Issues 633 669 1,302 Market Shares (by No. of Issues) 49% 51% 100% Transaction Volume (¥billions) ¥7,883.3 ¥10,315.4 ¥18,198.7Investment Bank Issues No. of Issues 273 313 586 Market Shares (by No. of Issues) 21% 24% 45% Transaction Volume (¥billions) ¥4,055.8 ¥5,396.4 ¥9,452.2Commercial Bank Issues No. of Issues 360 356 716 Market Shares (by No. of Issues) 28% 27% 55% Transaction Volume (¥billions) ¥3,827.5 ¥4,919.0 ¥8,746.5
Panel B: By Maturity (years)
AAA AA A BBB TotalAll Issues No. of Issues 35 504 684 79 1,302 Market Shares (by No. of Issues) 3% 39% 53% 6% 100% Transaction Volume (¥billions) ¥573.3 ¥9,416.9 ¥7,386.5 ¥822.0 ¥18,198.7Investment Bank Issues No. of Issues 19 213 308 46 586 Market Shares (by No. of Issues) 1% 16% 24% 4% 45% Transaction Volume (¥billions) ¥376.3 ¥4,852.9 ¥3,669.0 ¥554.0 ¥9,452.2Commercial Bank Issues No. of Issues 16 291 376 33 716 Market Shares (by No. of Issues) 1% 22% 29% 3% 55%
Transaction Volume (¥billions) ¥197.0 ¥4,564.0 ¥3,717.5 ¥268.0 ¥8,746.5
Panel C: By Credit Rating
45
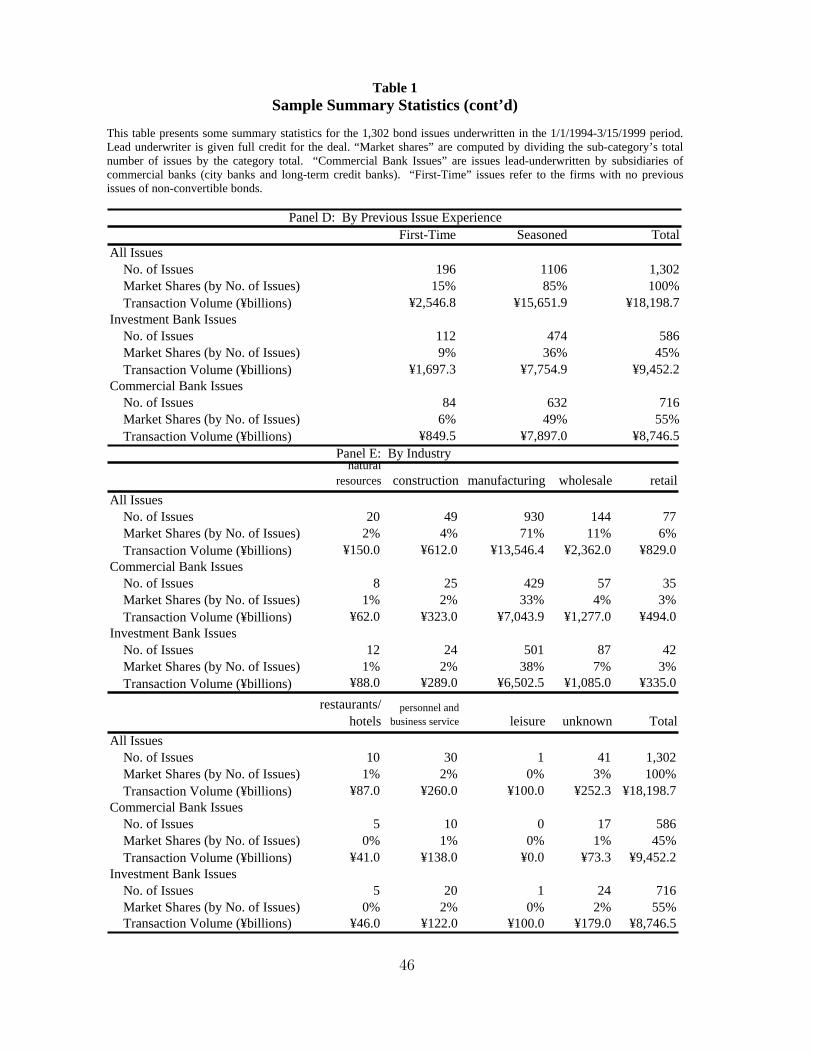
Table 1 Sample Summary Statistics (cont’d)
This table presents some summary statistics for the 1,302 bond issues underwritten in the 1/1/1994-3/15/1999 period. Lead underwriter is given full credit for the deal. “Market shares” are computed by dividing the sub-category’s total number of issues by the category total. “Commercial Bank Issues” are issues lead-underwritten by subsidiaries of commercial banks (city banks and long-term credit banks). “First-Time” issues refer to the firms with no previous issues of non-convertible bonds.
First-Time Seasoned TotalAll Issues No. of Issues 196 1106 1,302 Market Shares (by No. of Issues) 15% 85% 100% Transaction Volume (¥billions) ¥2,546.8 ¥15,651.9 ¥18,198.7Investment Bank Issues No. of Issues 112 474 586 Market Shares (by No. of Issues) 9% 36% 45% Transaction Volume (¥billions) ¥1,697.3 ¥7,754.9 ¥9,452.2Commercial Bank Issues No. of Issues 84 632 716 Market Shares (by No. of Issues) 6% 49% 55% Transaction Volume (¥billions) ¥849.5 ¥7,897.0 ¥8,746.5
Panel D: By Previous Issue Experience
naturalresources construction manufacturing wholesale retail
All Issues No. of Issues 20 49 930 144 77 Market Shares (by No. of Issues) 2% 4% 71% 11% 6% Transaction Volume (¥billions) ¥150.0 ¥612.0 ¥13,546.4 ¥2,362.0 ¥829.0Commercial Bank Issues No. of Issues 8 25 429 57 35 Market Shares (by No. of Issues) 1% 2% 33% 4% 3% Transaction Volume (¥billions) ¥62.0 ¥323.0 ¥7,043.9 ¥1,277.0 ¥494.0Investment Bank Issues No. of Issues 12 24 501 87 42 Market Shares (by No. of Issues) 1% 2% 38% 7% 3% Transaction Volume (¥billions) ¥88.0 ¥289.0 ¥6,502.5 ¥1,085.0 ¥335.0
restaurants/ hotels
personnel and business service leisure unknown Total
All Issues No. of Issues 10 30 1 41 1,302 Market Shares (by No. of Issues) 1% 2% 0% 3% 100% Transaction Volume (¥billions) ¥87.0 ¥260.0 ¥100.0 ¥252.3 ¥18,198.7Commercial Bank Issues No. of Issues 5 10 0 17 586 Market Shares (by No. of Issues) 0% 1% 0% 1% 45% Transaction Volume (¥billions) ¥41.0 ¥138.0 ¥0.0 ¥73.3 ¥9,452.2Investment Bank Issues No. of Issues 5 20 1 24 716 Market Shares (by No. of Issues) 0% 2% 0% 2% 55% Transaction Volume (¥billions) ¥46.0 ¥122.0 ¥100.0 ¥179.0 ¥8,746.5
Panel E: By Industry
46
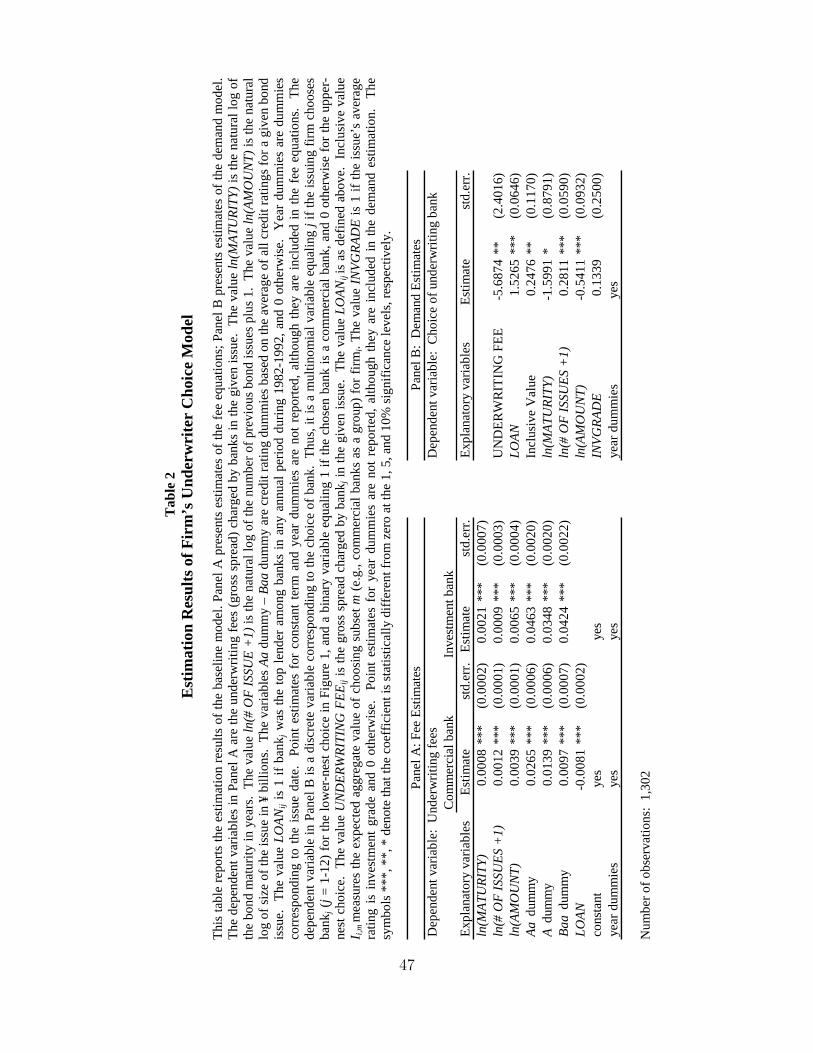
Tab
le 2
E
stim
atio
n R
esul
ts o
f Fir
m’s
Und
erw
rite
r C
hoic
e M
odel
This
tabl
e re
ports
the
estim
atio
n re
sults
of t
he b
asel
ine
mod
el. P
anel
A p
rese
nts
estim
ates
of t
he fe
e eq
uatio
ns; P
anel
B p
rese
nts
estim
ates
of t
he d
eman
d m
odel
. Th
e de
pend
ent v
aria
bles
in P
anel
A a
re th
e un
derw
ritin
g fe
es (g
ross
spr
ead)
cha
rged
by
bank
s in
the
give
n is
sue.
The
val
ue ln
(MA
TUR
ITY)
is th
e na
tura
l log
of
the
bond
mat
urity
in y
ears
. Th
e va
lue
ln(#
OF
ISSU
E +
1) is
the
natu
ral l
og o
f the
num
ber o
f pre
viou
s bon
d is
sues
plu
s 1.
The
valu
e ln
(AM
OU
NT)
is th
e na
tura
l lo
g of
size
of t
he is
sue
in ¥
bill
ions
. Th
e va
riabl
es A
adu
mm
y –
Baa
dum
my
are
cred
it ra
ting
dum
mie
s bas
ed o
n th
e av
erag
e of
all
cred
it ra
tings
for a
giv
en b
ond
issu
e. T
he v
alue
LO
AN
ij is
1 if
ban
k j w
as th
e to
p le
nder
am
ong
bank
s in
any
ann
ual p
erio
d du
ring
1982
-199
2, a
nd 0
oth
erw
ise.
Yea
r du
mm
ies
are
dum
mie
sco
rres
pond
ing
to th
e is
sue
date
. Po
int e
stim
ates
for
con
stan
t ter
m a
nd y
ear
dum
mie
s ar
e no
t rep
orte
d, a
lthou
gh th
ey a
re in
clud
ed in
the
fee
equa
tions
. Th
ede
pend
ent v
aria
ble
in P
anel
B is
a d
iscr
ete
varia
ble
corr
espo
ndin
g to
the
choi
ce o
f ban
k. T
hus,
it is
a m
ultin
omia
l var
iabl
e eq
ualin
g j i
f the
issu
ing
firm
cho
oses
ba
nkj (
j = 1
-12)
for t
he lo
wer
-nes
t cho
ice
in F
igur
e 1,
and
a b
inar
y va
riabl
e eq
ualin
g 1
if th
e ch
osen
ban
k is
a c
omm
erci
al b
ank,
and
0 o
ther
wis
e fo
r the
upp
er-
nest
cho
ice.
The
val
ue U
ND
ER
WR
ITIN
G F
EE
ijis
the
gros
s sp
read
cha
rged
by
bank
j in
the
give
n is
sue.
The
val
ue L
OA
Nij
is a
s de
fined
abo
ve.
Incl
usiv
e va
lue
I i,m
mea
sure
s th
e ex
pect
ed a
ggre
gate
val
ue o
f cho
osin
g su
bset
m (e
.g.,
com
mer
cial
ban
ks a
s a
grou
p) fo
r firm
i. Th
e va
lue
INV
GR
AD
E is
1 if
the
issu
e’s
aver
age
ratin
g is
inv
estm
ent
grad
e an
d 0
othe
rwis
e.
Poin
t es
timat
es f
or y
ear
dum
mie
s ar
e no
t re
porte
d, a
lthou
gh th
ey a
re i
nclu
ded
in th
e de
man
d es
timat
ion.
Th
esy
mbo
ls *
**, *
*, *
den
ote
that
the
coef
ficie
nt is
stat
istic
ally
diff
eren
t fro
m z
ero
at th
e 1,
5, a
nd 1
0% si
gnifi
canc
e le
vels
, res
pect
ivel
y.
Expl
anat
ory
varia
bles
Estim
ate
std.
err.
Estim
ate
std.
err.
Expl
anat
ory
varia
bles
Estim
ate
std.
err.
ln(M
ATU
RIT
Y)0.
0008
***
(0.0
002)
0.00
21**
*(0
.000
7)ln
(# O
F IS
SUE
S +
1)0.
0012
***
(0.0
001)
0.00
09**
*(0
.000
3)U
ND
ERW
RIT
ING
FEE
-5.6
874
**(2
.401
6)ln
(AM
OU
NT)
0.00
39**
*(0
.000
1)0.
0065
***
(0.0
004)
LOA
N1.
5265
***
(0.0
646)
Aa
dum
my
0.02
65**
*(0
.000
6)0.
0463
***
(0.0
020)
Incl
usiv
e V
alue
0.
2476
**(0
.117
0)A
dum
my
0.01
39**
*(0
.000
6)0.
0348
***
(0.0
020)
ln(M
ATU
RIT
Y)-1
.599
1*
(0.8
791)
Baa
dum
my
0.00
97**
*(0
.000
7)0.
0424
***
(0.0
022)
ln(#
OF
ISSU
ES
+1)
0.28
11**
*(0
.059
0)LO
AN
-0.0
081
***
(0.0
002)
ln(A
MO
UN
T)-0
.541
1**
*(0
.093
2)co
nsta
ntye
sye
sIN
VG
RA
DE
0.13
39(0
.250
0)ye
ar d
umm
ies
yes
yes
year
dum
mie
sye
s
Com
mer
cial
ban
kIn
vest
men
t ban
k
Pane
l B:
Dem
and
Estim
ates
Dep
ende
nt v
aria
ble:
Cho
ice
of u
nder
writ
ing
bank
Pane
l A: F
ee E
stim
ates
Dep
ende
nt v
aria
ble:
Und
erw
ritin
g fe
es
Num
ber o
f obs
erva
tions
: 1,
302
47
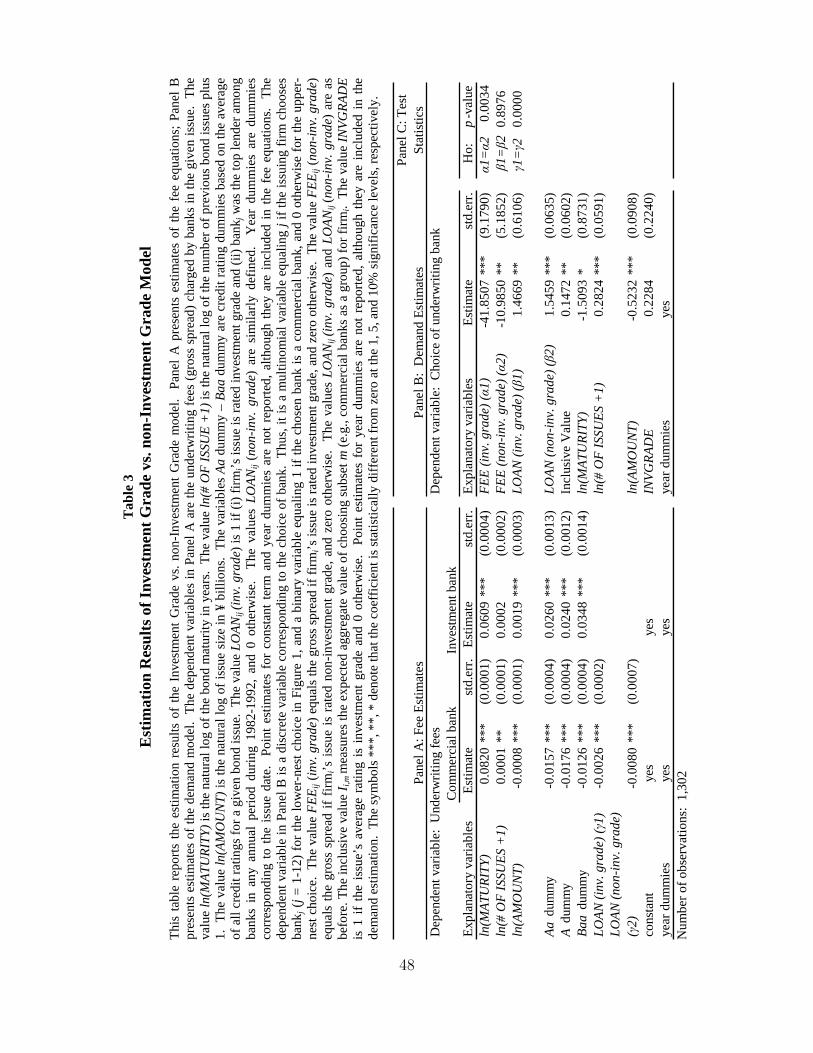
Tab
le 3
E
stim
atio
n R
esul
ts o
f Inv
estm
ent G
rade
vs.
non-
Inve
stm
ent G
rade
Mod
el
This
tabl
e re
ports
the
estim
atio
n re
sults
of
the
Inve
stm
ent G
rade
vs.
non-
Inve
stm
ent G
rade
mod
el.
Pane
l A p
rese
nts
estim
ates
of
the
fee
equa
tions
; Pan
el B
pr
esen
ts e
stim
ates
of t
he d
eman
d m
odel
. Th
e de
pend
ent v
aria
bles
in P
anel
A a
re th
e un
derw
ritin
g fe
es (g
ross
spr
ead)
cha
rged
by
bank
s in
the
give
n is
sue.
The
valu
e ln
(MA
TUR
ITY)
is th
e na
tura
l log
of t
he b
ond
mat
urity
in y
ears
. Th
e va
lue
ln(#
OF
ISSU
E +
1) is
the
natu
ral l
og o
f the
num
ber o
f pre
viou
s bon
d is
sues
plu
s 1.
The
val
ue ln
(AM
OU
NT)
is th
e na
tura
l log
of i
ssue
siz
e in
¥ b
illio
ns.
The
varia
bles
Aa
dum
my
– B
aa d
umm
y ar
e cr
edit
ratin
g du
mm
ies
base
d on
the
aver
age
of a
ll cr
edit
ratin
gs fo
r a g
iven
bon
d is
sue.
The
val
ue L
OA
Nij
(inv
. gra
de) i
s 1 if
(i) f
irmi’s
issu
e is
rate
d in
vest
men
t gra
de a
nd (i
i) ba
nkj w
as th
e to
p le
nder
am
ong
bank
s in
any
ann
ual
perio
d du
ring
1982
-199
2, a
nd 0
oth
erw
ise.
Th
e va
lues
LO
AN
ij(n
on-i
nv.
grad
e) a
re s
imila
rly d
efin
ed.
Yea
r du
mm
ies
are
dum
mie
sco
rres
pond
ing
to th
e is
sue
date
. Po
int e
stim
ates
for
con
stan
t ter
m a
nd y
ear
dum
mie
s ar
e no
t rep
orte
d, a
lthou
gh th
ey a
re in
clud
ed in
the
fee
equa
tions
. Th
ede
pend
ent v
aria
ble
in P
anel
B is
a d
iscr
ete
varia
ble
corr
espo
ndin
g to
the
choi
ce o
f ban
k. T
hus,
it is
a m
ultin
omia
l var
iabl
e eq
ualin
g j i
f the
issu
ing
firm
cho
oses
ba
nkj (
j = 1
-12)
for t
he lo
wer
-nes
t cho
ice
in F
igur
e 1,
and
a b
inar
y va
riabl
e eq
ualin
g 1
if th
e ch
osen
ban
k is
a c
omm
erci
al b
ank,
and
0 o
ther
wis
e fo
r the
upp
er-
nest
cho
ice.
The
val
ue F
EE
ij(in
v. g
rade
) equ
als
the
gros
s spr
ead
if fir
mi’s
issu
e is
rate
d in
vest
men
t gra
de, a
nd z
ero
othe
rwis
e. T
he v
alue
FE
Eij (
non-
inv.
gra
de)
equa
ls th
e gr
oss
spre
ad if
firm
i’s is
sue
is r
ated
non
-inve
stm
ent g
rade
, and
zer
o ot
herw
ise.
Th
e va
lues
LO
AN
ij(i
nv. g
rade
) an
d LO
AN
ij(n
on-i
nv. g
rade
) ar
e as
befo
re. T
he in
clus
ive
valu
e I i,
m m
easu
res t
he e
xpec
ted
aggr
egat
e va
lue
of c
hoos
ing
subs
et m
(e.g
., co
mm
erci
al b
anks
as a
gro
up) f
or fi
rmi.
The
val
ue IN
VGR
ADE
is 1
if th
e is
sue’
s av
erag
e ra
ting
is in
vest
men
t gra
de a
nd 0
oth
erw
ise.
Po
int e
stim
ates
for
yea
r du
mm
ies
are
not r
epor
ted,
alth
ough
they
are
incl
uded
in th
e de
man
d es
timat
ion.
The
sym
bols
***
, **,
* d
enot
e th
at th
e co
effic
ient
is st
atis
tical
ly d
iffer
ent f
rom
zer
o at
the
1, 5
, and
10%
sign
ifica
nce
leve
ls, r
espe
ctiv
ely.
Expl
anat
ory
varia
bles
Estim
ate
std.
err.
Estim
ate
std.
err.
Expl
anat
ory
varia
bles
Estim
ate
std.
err.
Ho:
p-v
alue
ln(M
ATU
RIT
Y)0.
0820
***
(0.0
001)
0.06
09**
*(0
.000
4)F
EE
(inv
. gra
de) (
1)-4
1.85
07**
*(9
.179
0)1=
20.
0034
ln(#
OF
ISSU
ES
+1)
0.00
01**
(0.0
001)
0.00
02(0
.000
2)F
EE
(non
-inv
. gra
de) (
2)-1
0.98
50**
(5.1
852)
1=2
0.89
76ln
(AM
OU
NT)
-0.0
008
***
(0.0
001)
0.00
19**
*(0
.000
3)LO
AN
(inv
. gra
de) (
1)1.
4669
**(0
.610
6)1=
20.
0000
Aa
dum
my
-0.0
157
***
(0.0
004)
0.02
60**
*(0
.001
3)LO
AN
(non
-inv
. gra
de) (
2)1.
5459
***
(0.0
635)
Adu
mm
y-0
.017
6**
*(0
.000
4)0.
0240
***
(0.0
012)
Incl
usiv
e V
alue
0.
1472
**(0
.060
2)B
aadu
mm
y-0
.012
6**
*(0
.000
4)0.
0348
***
(0.0
014)
ln(M
ATU
RIT
Y)-1
.509
3*
(0.8
731)
LOA
N (i
nv. g
rade
) (1)
-0.0
026
***
(0.0
002)
ln(#
OF
ISSU
ES
+1)
0.28
24**
*(0
.059
1)LO
AN
(non
-inv
. gra
de)
(2)
-0.0
080
***
(0.0
007)
ln(A
MO
UN
T)-0
.523
2**
*(0
.090
8)co
nsta
ntye
sye
sIN
VG
RA
DE
0.22
84(0
.224
0)ye
ar d
umm
ies
yes
yes
year
dum
mie
sye
s
Pane
l C: T
est
Stat
istic
s
Com
mer
cial
ban
kIn
vest
men
t ban
kD
epen
dent
var
iabl
e: C
hoic
e of
und
erw
ritin
g ba
nkPa
nel A
: Fee
Est
imat
esD
epen
dent
var
iabl
e: U
nder
writ
ing
fees
Pane
l B:
Dem
and
Estim
ates
Num
ber o
f obs
erva
tions
: 1,
302
48
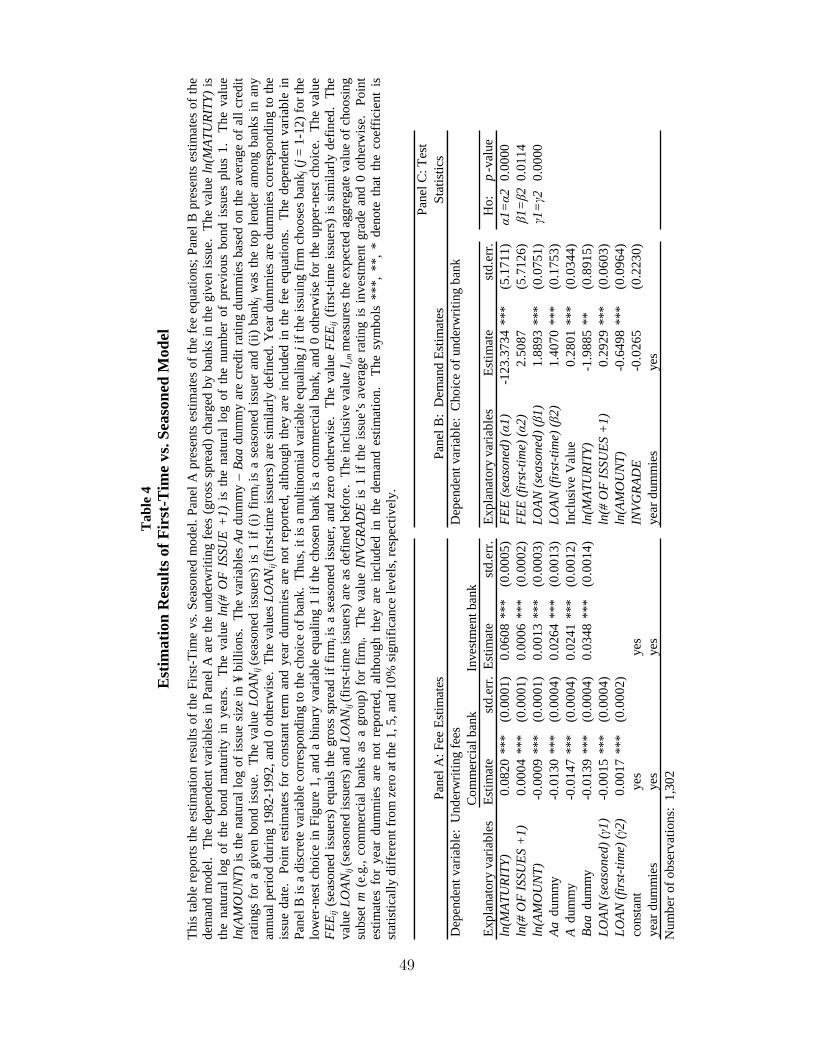
Tab
le 4
E
stim
atio
n R
esul
ts o
f Fir
st-T
ime
vs. S
easo
ned
Mod
el
This
tabl
e re
ports
the
estim
atio
n re
sults
of t
he F
irst-T
ime
vs. S
easo
ned
mod
el. P
anel
A p
rese
nts
estim
ates
of t
he fe
e eq
uatio
ns; P
anel
B p
rese
nts
estim
ates
of t
he
dem
and
mod
el.
The
depe
nden
t var
iabl
es in
Pan
el A
are
the
unde
rwrit
ing
fees
(gro
ss s
prea
d) c
harg
ed b
y ba
nks
in th
e gi
ven
issu
e. T
he v
alue
ln(M
ATU
RIT
Y) is
the
natu
ral
log
of t
he b
ond
mat
urity
in
year
s. T
he v
alue
ln(
# O
F I
SSU
E +
1) i
s th
e na
tura
l lo
g of
the
num
ber
of p
revi
ous
bond
iss
ues
plus
1.
The
valu
e ln
(AM
OU
NT)
is th
e na
tura
l log
of i
ssue
siz
e in
¥ b
illio
ns.
The
varia
bles
Aa
dum
my
– B
aadu
mm
y ar
e cr
edit
ratin
g du
mm
ies
base
d on
the
aver
age
of a
ll cr
edit
ratin
gs f
or a
giv
en b
ond
issu
e.
The
valu
e LO
AN
ij(s
easo
ned
issu
ers)
is 1
if (
i) fir
miis
a s
easo
ned
issu
er a
nd (
ii) b
ank j
was
the
top
lend
er a
mon
g ba
nks
in a
nyan
nual
per
iod
durin
g 19
82-1
992,
and
0 o
ther
wis
e. T
he v
alue
s LO
AN
ij(f
irst-t
ime
issu
ers)
are
sim
ilarly
def
ined
. Yea
r dum
mie
s ar
e du
mm
ies
corr
espo
ndin
g to
the
issu
e da
te.
Poin
t est
imat
es f
or c
onst
ant t
erm
and
yea
r du
mm
ies
are
not r
epor
ted,
alth
ough
they
are
incl
uded
in th
e fe
e eq
uatio
ns.
The
depe
nden
t var
iabl
e in
Pane
l B is
a d
iscr
ete
varia
ble
corr
espo
ndin
g to
the
choi
ce o
f ban
k. T
hus,
it is
a m
ultin
omia
l var
iabl
e eq
ualin
g j i
f the
issu
ing
firm
cho
oses
ban
k j (j
= 1-
12) f
or th
elo
wer
-nes
t cho
ice
in F
igur
e 1,
and
a b
inar
y va
riabl
e eq
ualin
g 1
if th
e ch
osen
ban
k is
a c
omm
erci
al b
ank,
and
0 o
ther
wis
e fo
r the
upp
er-n
est c
hoic
e. T
he v
alue
FE
Eij
(sea
sone
d is
suer
s) e
qual
s th
e gr
oss
spre
ad if
firm
iis a
sea
sone
d is
suer
, and
zer
o ot
herw
ise.
The
val
ue F
EE
ij (f
irst-t
ime
issu
ers)
is s
imila
rly d
efin
ed.
The
valu
e LO
AN
ij(s
easo
ned
issu
ers)
and
LO
AN
ij(f
irst-t
ime
issu
ers)
are
as
defin
ed b
efor
e. T
he in
clus
ive
valu
e I i,
mm
easu
res
the
expe
cted
agg
rega
te v
alue
of c
hoos
ing
subs
etm
(e.
g., c
omm
erci
al b
anks
as
a gr
oup)
for
firm
i. T
he v
alue
IN
VG
RA
DE
is 1
if th
e is
sue’
s av
erag
e ra
ting
is in
vest
men
t gra
de a
nd 0
oth
erw
ise.
Po
int
estim
ates
for
yea
r du
mm
ies
are
not
repo
rted,
alth
ough
the
y ar
e in
clud
ed i
n th
e de
man
d es
timat
ion.
Th
e sy
mbo
ls *
**,
**, *
den
ote
that
the
coe
ffic
ient
is
stat
istic
ally
diff
eren
t fro
m z
ero
at th
e 1,
5, a
nd 1
0% si
gnifi
canc
e le
vels
, res
pect
ivel
y.
Expl
anat
ory
varia
bles
Estim
ate
std.
err.
Estim
ate
std.
err.
Expl
anat
ory
varia
bles
Estim
ate
std.
err.
Ho:
p-v
alue
ln(M
ATU
RIT
Y)0.
0820
***
(0.0
001)
0.06
08**
*(0
.000
5)F
EE
(sea
sone
d) (
1)-1
23.3
734
***
(5.1
711)
1=2
0.00
00ln
(# O
F IS
SUE
S +
1)0.
0004
***
(0.0
001)
0.00
06**
*(0
.000
2)F
EE
(fir
st-t
ime)
(2)
2.50
87(5
.712
6)1=
20.
0114
ln(A
MO
UN
T)-0
.000
9**
*(0
.000
1)0.
0013
***
(0.0
003)
LOA
N (s
easo
ned)
(1)
1.88
93**
*(0
.075
1)1=
20.
0000
Aa
dum
my
-0.0
130
***
(0.0
004)
0.02
64**
*(0
.001
3)LO
AN
(fir
st-t
ime)
(2)
1.40
70**
*(0
.175
3)A
dum
my
-0.0
147
***
(0.0
004)
0.02
41**
*(0
.001
2)In
clus
ive
Val
ue
0.28
01**
*(0
.034
4)B
aadu
mm
y-0
.013
9**
*(0
.000
4)0.
0348
***
(0.0
014)
ln(M
ATU
RIT
Y)-1
.988
5**
(0.8
915)
LOA
N (s
easo
ned)
(1)
-0.0
015
***
(0.0
004)
ln(#
OF
ISSU
ES
+1)
0.29
29**
*(0
.060
3)LO
AN
(fir
st-t
ime)
(2)
0.00
17**
*(0
.000
2)
ln
(AM
OU
NT)
-0.6
498
***
(0.0
964)
cons
tant
yes
yes
INV
GR
AD
E-0
.026
5(0
.223
0)ye
ar d
umm
ies
yes
yes
year
dum
mie
sye
s
Pane
l C: T
est
Stat
istic
s
Com
mer
cial
ban
kIn
vest
men
t ban
kD
epen
dent
var
iabl
e: C
hoic
e of
und
erw
ritin
g ba
nkPa
nel A
: Fee
Est
imat
esD
epen
dent
var
iabl
e: U
nder
writ
ing
fees
Pane
l B:
Dem
and
Estim
ates
Num
ber o
f obs
erva
tions
: 1,
302
49
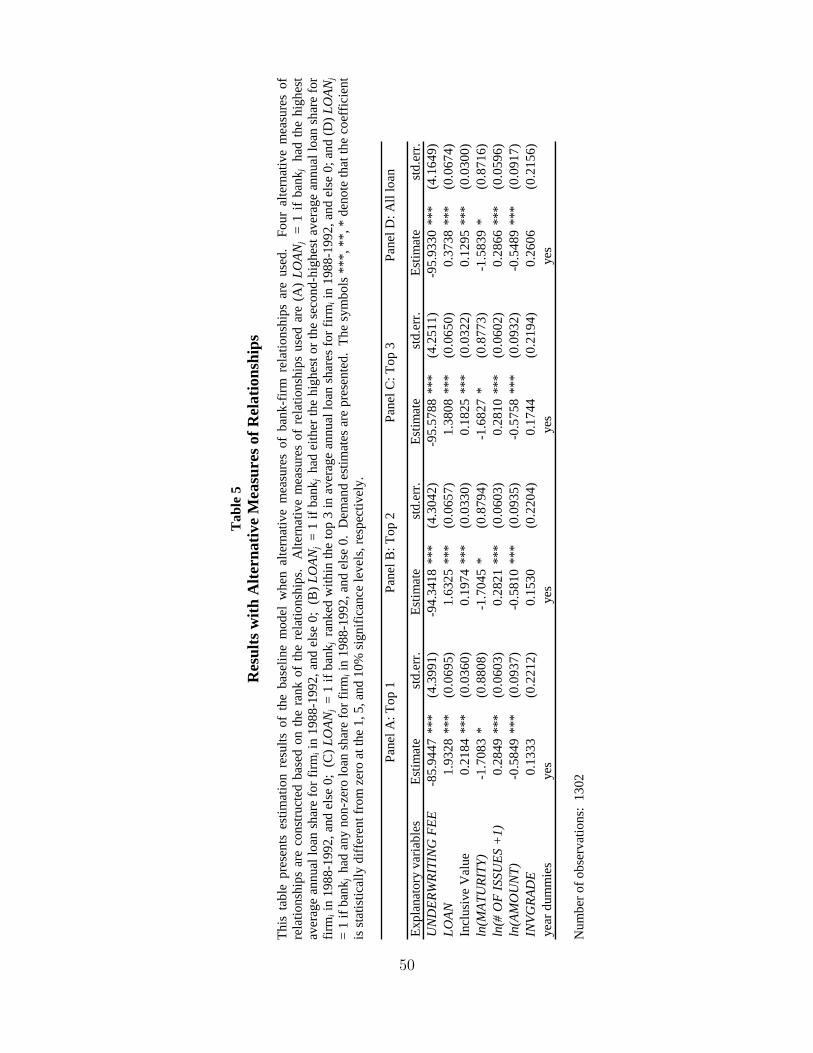
Tab
le 5
R
esul
ts w
ith A
ltern
ativ
e M
easu
res o
f Rel
atio
nshi
ps
This
tab
le p
rese
nts
estim
atio
n re
sults
of
the
base
line
mod
el w
hen
alte
rnat
ive
mea
sure
s of
ban
k-fir
m r
elat
ions
hips
are
use
d.
Four
alte
rnat
ive
mea
sure
s of
rela
tions
hips
are
con
stru
cted
bas
ed o
n th
e ra
nk o
f th
e re
latio
nshi
ps.
Alte
rnat
ive
mea
sure
s of
rel
atio
nshi
ps u
sed
are
(A)
LOA
Nj =
1 if
ban
k j h
ad th
e hi
ghes
tav
erag
e an
nual
loan
sha
re fo
r firm
i in
1988
-199
2, a
nd e
lse
0; (
B) L
OA
Nj =
1 if
ban
k j h
ad e
ither
the
high
est o
r the
sec
ond-
high
est a
vera
ge a
nnua
l loa
n sh
are
for
firm
i in
1988
-199
2, a
nd e
lse
0; (
C) L
OA
Nj =
1 if
ban
k j ra
nked
with
in th
e to
p 3
in a
vera
ge a
nnua
l loa
n sh
ares
for f
irmi i
n 19
88-1
992,
and
els
e 0;
and
(D) L
OA
Nj
= 1
if ba
nkj h
ad a
ny n
on-z
ero
loan
shar
e fo
r firm
i in
1988
-199
2, a
nd e
lse
0. D
eman
d es
timat
es a
re p
rese
nted
. Th
e sy
mbo
ls *
**, *
*, *
den
ote
that
the
coef
ficie
ntis
stat
istic
ally
diff
eren
t fro
m z
ero
at th
e 1,
5, a
nd 1
0% si
gnifi
canc
e le
vels
, res
pect
ivel
y.
Expl
anat
ory
varia
bles
Estim
ate
std.
err.
Estim
ate
std.
err.
Estim
ate
std.
err.
Estim
ate
std.
err.
UN
DE
RW
RIT
ING
FE
E-8
5.94
47**
*(4
.399
1)-9
4.34
18**
*(4
.304
2)-9
5.57
88**
*(4
.251
1)-9
5.93
30**
*(4
.164
9)LO
AN
1.93
28**
*(0
.069
5)1.
6325
***
(0.0
657)
1.38
08**
*(0
.065
0)0.
3738
***
(0.0
674)
Incl
usiv
e V
alue
0.
2184
***
(0.0
360)
0.19
74**
*(0
.033
0)0.
1825
***
(0.0
322)
0.12
95**
*(0
.030
0)ln
(MA
TUR
ITY)
-1.7
083
*(0
.880
8)-1
.704
5*
(0.8
794)
-1.6
827
*(0
.877
3)-1
.583
9*
(0.8
716)
ln(#
OF
ISSU
ES
+1)
0.28
49**
*(0
.060
3)0.
2821
***
(0.0
603)
0.28
10**
*(0
.060
2)0.
2866
***
(0.0
596)
ln(A
MO
UN
T)-0
.584
9**
*(0
.093
7)-0
.581
0**
*(0
.093
5)-0
.575
8**
*(0
.093
2)-0
.548
9**
*(0
.091
7)IN
VG
RA
DE
0.13
33(0
.221
2)0.
1530
(0.2
204)
0.17
44(0
.219
4)0.
2606
(0.2
156)
year
dum
mie
s
yes
ye
s
ye
s
ye
s
Pane
l A: T
op 1
Pane
l B: T
op 2
Pane
l C: T
op 3
Pane
l D: A
ll lo
an
Num
ber o
f obs
erva
tions
: 13
02
50
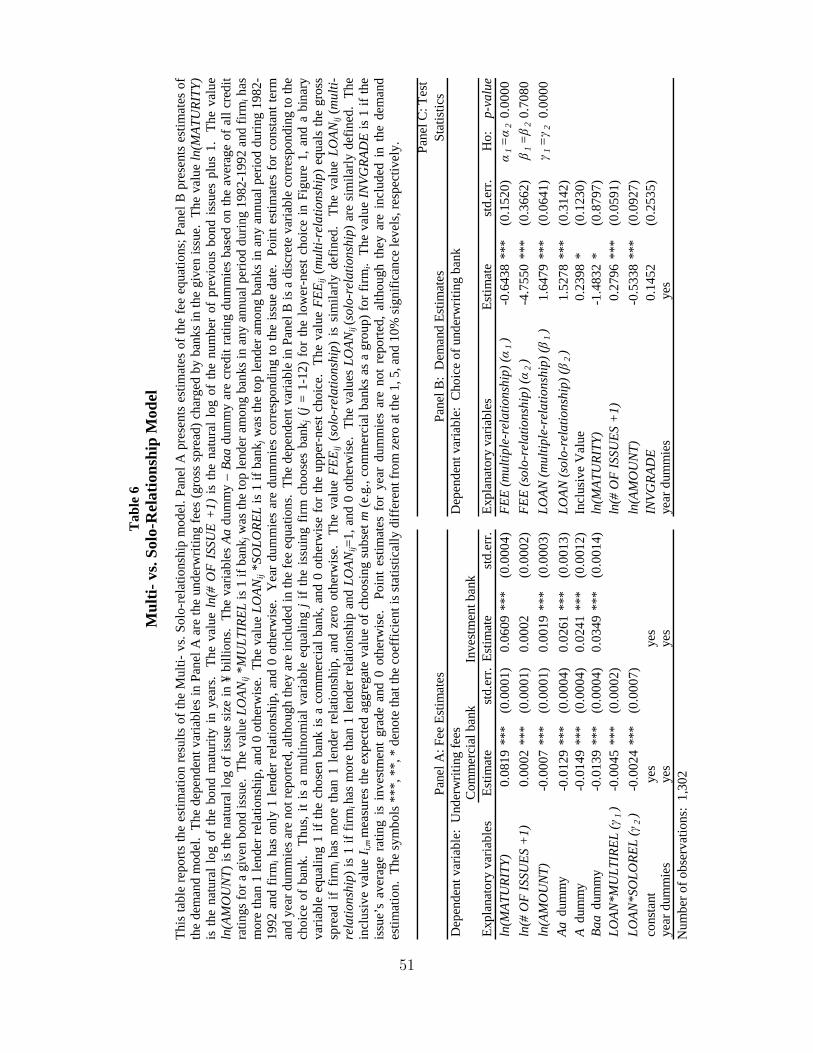
Tab
le 6
M
ulti-
vs.
Solo
-Rel
atio
nshi
p M
odel
This
tabl
e re
ports
the
estim
atio
n re
sults
of t
he M
ulti-
vs.
Solo
-rel
atio
nshi
p m
odel
. Pan
el A
pre
sent
s es
timat
es o
f the
fee
equa
tions
; Pan
el B
pre
sent
s es
timat
es o
f th
e de
man
d m
odel
. Th
e de
pend
ent v
aria
bles
in P
anel
A a
re th
e un
derw
ritin
g fe
es (g
ross
spr
ead)
cha
rged
by
bank
s in
the
give
n iss
ue.
The
valu
e ln
(MA
TUR
ITY)
is th
e na
tura
l log
of
the
bond
mat
urity
in y
ears
. Th
e va
lue
ln(#
OF
ISS
UE
+1)
is th
e na
tura
l log
of
the
num
ber
of p
revi
ous
bond
issu
es p
lus
1.
The
valu
eln
(AM
OU
NT)
is th
e na
tura
l log
of i
ssue
siz
e in
¥ b
illio
ns.
The
varia
bles
Aa
dum
my
– B
aa d
umm
y ar
e cr
edit
ratin
g du
mm
ies
base
d on
the
aver
age
of a
ll cr
edit
ratin
gs fo
r a g
iven
bon
d is
sue.
The
val
ue L
OA
Nij *
MU
LTIR
EL
is 1
if b
ank j
was
the
top
lend
er a
mon
g ba
nks i
n an
y an
nual
per
iod
durin
g 19
82-1
992
and
firm
i has
mor
e th
an 1
lend
er re
latio
nshi
p, a
nd 0
oth
erw
ise.
The
val
ue L
OA
Nij *
SOLO
RE
L is
1 if
ban
k j w
as th
e to
p le
nder
am
ong
bank
s in
any
ann
ual p
erio
d du
ring
1982
-19
92 a
nd fi
rmi h
as o
nly
1 le
nder
rela
tions
hip,
and
0 o
ther
wis
e. Y
ear d
umm
ies
are
dum
mie
s co
rres
pond
ing
to th
e iss
ue d
ate.
Poi
nt e
stim
ates
for c
onst
ant t
erm
and
year
dum
mie
s are
not
repo
rted,
alth
ough
they
are
incl
uded
in th
e fe
e eq
uatio
ns.
The
depe
nden
t var
iabl
e in
Pan
el B
is a
disc
rete
var
iabl
e co
rres
pond
ing
to th
ech
oice
of
bank
. Th
us, i
t is
a m
ultin
omia
l var
iabl
e eq
ualin
g j i
f th
e is
suin
g fir
m c
hoos
es b
ank j
(j =
1-1
2) f
or th
e lo
wer
-nes
t cho
ice
in F
igur
e 1,
and
a b
inar
yva
riabl
e eq
ualin
g 1
if th
e ch
osen
ban
k is
a c
omm
erci
al b
ank,
and
0 o
ther
wis
e fo
r the
upp
er-n
est c
hoic
e. T
he v
alue
FE
Eij
(mul
ti-re
latio
nshi
p) e
qual
s th
e gr
oss
spre
ad i
f fir
miha
s m
ore
than
1 l
ende
r re
latio
nshi
p, a
nd z
ero
othe
rwis
e.
The
valu
e F
EE
ij (s
olo-
rela
tions
hip)
is
sim
ilarly
def
ined
. Th
e va
lue
LOA
Nij
(mul
ti-re
latio
nshi
p) is
1 if
firm
ihas
mor
e th
an 1
lend
er re
latio
nshi
p an
d LO
AN
ij=1,
and
0 o
ther
wis
e. T
he v
alue
s LO
AN
ij(s
olo-
rela
tions
hip)
are
sim
ilarly
def
ined
. Th
ein
clus
ive
valu
e I i,
mm
easu
res
the
expe
cted
agg
rega
te v
alue
of c
hoos
ing
subs
et m
(e.g
., co
mm
erci
al b
anks
as
a gr
oup)
for f
irmi.
The
val
ue IN
VG
RA
DE
is 1
if th
e is
sue’
s av
erag
e ra
ting
is i
nves
tmen
t gr
ade
and
0 ot
herw
ise.
Po
int
estim
ates
for
yea
r du
mm
ies
are
not
repo
rted,
alth
ough
the
y ar
e in
clud
ed i
n th
e de
man
d es
timat
ion.
The
sym
bols
***
, **,
* d
enot
e th
at th
e co
effic
ient
is st
atis
tical
ly d
iffer
ent f
rom
zer
o at
the
1, 5
, and
10%
sign
ifica
nce
leve
ls, r
espe
ctiv
ely.
Expl
anat
ory
varia
bles
Estim
ate
std.
err.
Estim
ate
std.
err.
Expl
anat
ory
varia
bles
Estim
ate
std.
err.
Ho:
p-va
lue
ln(M
ATU
RIT
Y)0.
0819
***
(0.0
001)
0.06
09**
*(0
.000
4)F
EE
(mul
tiple
-rel
atio
nshi
p) (
1)
-0.6
438
***
(0.1
520)
1=
20.
0000
ln(#
OF
ISSU
ES
+1)
0.00
02**
*(0
.000
1)0.
0002
(0.0
002)
FE
E (s
olo-
rela
tions
hip)
(2
)-4
.755
0**
*(0
.366
2)1
=2
0.70
80ln
(AM
OU
NT)
-0.0
007
***
(0.0
001)
0.00
19**
*(0
.000
3)LO
AN
(mul
tiple
-rel
atio
nshi
p) (
1)
1.64
79**
*(0
.064
1)1
=2
0.00
00A
adu
mm
y-0
.012
9**
*(0
.000
4)0.
0261
***
(0.0
013)
LOA
N (s
olo-
rela
tions
hip)
(2)
1.52
78**
*(0
.314
2)A
dum
my
-0.0
149
***
(0.0
004)
0.02
41**
*(0
.001
2)In
clus
ive
Val
ue
0.23
98*
(0.1
230)
Baa
dum
my
-0.0
139
***
(0.0
004)
0.03
49**
*(0
.001
4)ln
(MA
TUR
ITY)
-1.4
832
*(0
.879
7)LO
AN
*MU
LTIR
EL
(1
)-0
.004
5**
*(0
.000
2)
ln
(# O
F IS
SUE
S +
1)0.
2796
***
(0.0
591)
LOA
N*S
OLO
RE
L (
2)
-0.0
024
***
(0.0
007)
ln(A
MO
UN
T)-0
.533
8**
*(0
.092
7)co
nsta
ntye
sye
sIN
VG
RA
DE
0.14
52(0
.253
5)ye
ar d
umm
ies
yes
yes
year
dum
mie
sye
s
Com
mer
cial
ban
kIn
vest
men
t ban
k
Pane
l B:
Dem
and
Estim
ates
Pane
lC: T
est
Stat
istic
sD
epen
dent
var
iabl
e: C
hoic
e of
und
erw
ritin
g ba
nkPa
nel A
: Fee
Est
imat
esD
epen
dent
var
iabl
e: U
nder
writ
ing
fees
Num
ber o
f obs
erva
tions
: 1,
302
51
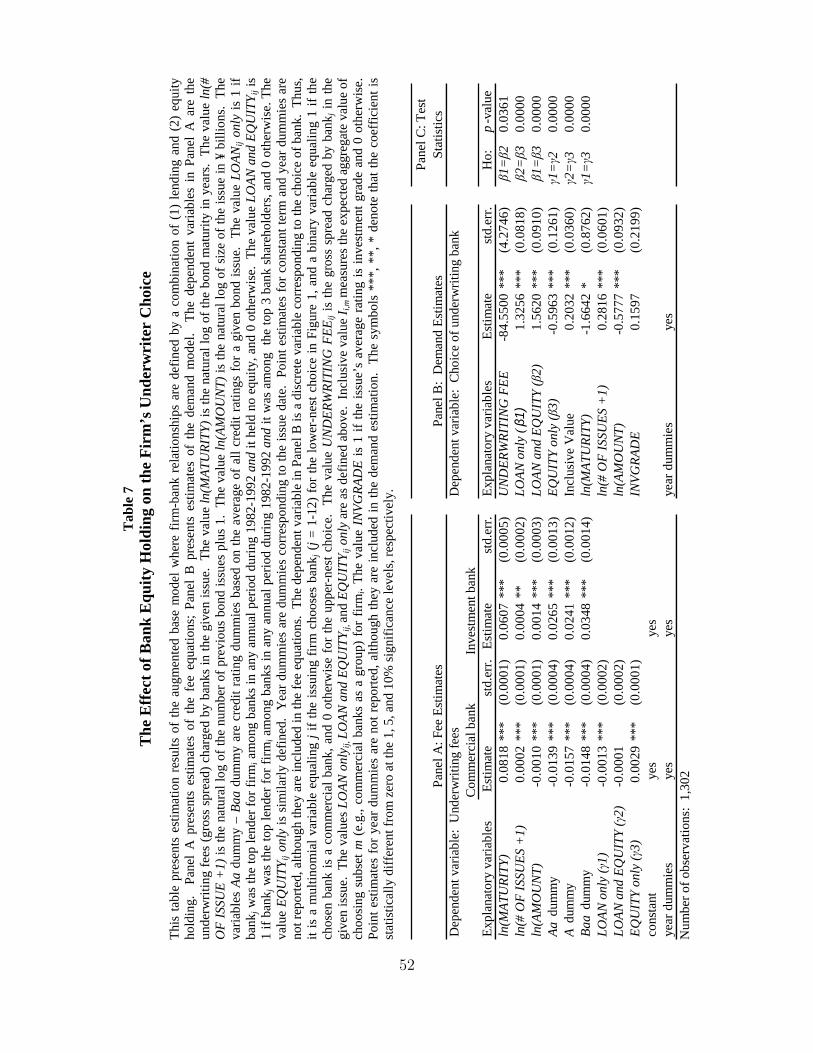
Tab
le 7
T
he E
ffect
of B
ank
Equ
ity H
oldi
ng o
n th
e Fi
rm’s
Und
erw
rite
r C
hoic
e
This
tabl
e pr
esen
ts e
stim
atio
n re
sults
of
the
augm
ente
d ba
se m
odel
whe
re f
irm-b
ank
rela
tions
hips
are
def
ined
by
a co
mbi
natio
n of
(1)
lend
ing
and
(2)
equi
tyho
ldin
g.
Pane
l A
pre
sent
s es
timat
es o
f th
e fe
e eq
uatio
ns;
Pane
l B
pre
sent
s es
timat
es o
f th
e de
man
d m
odel
. T
he d
epen
dent
var
iabl
es i
n Pa
nel
A a
re t
heun
derw
ritin
g fe
es (g
ross
spr
ead)
cha
rged
by
bank
s in
the
give
n is
sue.
The
val
ue ln
(MA
TUR
ITY)
is th
e na
tura
l log
of t
he b
ond
mat
urity
in y
ears
. Th
e va
lue
ln(#
O
F I
SSU
E +
1) is
the
natu
ral l
og o
f the
num
ber o
f pre
viou
s bo
nd is
sues
plu
s 1.
The
val
ue ln
(AM
OU
NT)
is th
e na
tura
l log
of s
ize
of th
e is
sue
in ¥
bill
ions
. Th
eva
riabl
es A
adu
mm
y –
Baa
dum
my
are
cred
it ra
ting
dum
mie
s ba
sed
on th
e av
erag
e of
all
cred
it ra
tings
for a
giv
en b
ond
issu
e. T
he v
alue
LO
AN
ijon
ly is
1 if
ba
nkj w
as th
e to
p le
nder
for f
irmi a
mon
g ba
nks i
n an
y an
nual
per
iod
durin
g 19
82-1
992
and
it he
ld n
o eq
uity
, and
0 o
ther
wis
e. T
he v
alue
LO
AN
and
EQ
UIT
Y ij i
s 1
if ba
nkj w
as th
e to
p le
nder
for f
irmi a
mon
g ba
nks
in a
ny a
nnua
l per
iod
durin
g 19
82-1
992
and
it w
as a
mon
g th
e to
p 3
bank
sha
reho
lder
s, an
d 0
othe
rwis
e.Th
eva
lue
EQ
UIT
Y ijon
ly is
sim
ilarly
def
ined
. Y
ear d
umm
ies
are
dum
mie
s co
rres
pond
ing
to th
e is
sue
date
. Po
int e
stim
ates
for c
onst
ant t
erm
and
yea
r dum
mie
s ar
eno
t rep
orte
d, a
lthou
gh th
ey a
re in
clud
ed in
the
fee
equa
tions
. Th
e de
pend
ent v
aria
ble
in P
anel
B is
a d
iscr
ete
varia
ble
corr
espo
ndin
g to
the
choi
ce o
f ban
k. T
hus,
it is
a m
ultin
omia
l var
iabl
e eq
ualin
g j i
f the
issu
ing
firm
cho
oses
ban
k j (j
= 1
-12)
for t
he lo
wer
-nes
t cho
ice
in F
igur
e 1,
and
a b
inar
y va
riabl
e eq
ualin
g 1
if th
ech
osen
ban
k is
a c
omm
erci
al b
ank,
and
0 o
ther
wis
e fo
r th
e up
per-
nest
cho
ice.
Th
e va
lue
UN
DE
RW
RIT
ING
FE
Eij
is th
e gr
oss
spre
ad c
harg
ed b
y ba
nkj i
n th
egi
ven
issu
e. T
he v
alue
s LO
AN
onl
y ij,
LOA
N a
nd E
QU
ITY i
j,an
dE
QU
ITY i
jon
ly a
re a
s def
ined
abo
ve.
Incl
usiv
e va
lue
I i,m
mea
sure
s the
exp
ecte
d ag
greg
ate
valu
e of
choo
sing
sub
set m
(e.g
., co
mm
erci
al b
anks
as
a gr
oup)
for
firm
i. Th
e va
lue
INV
GR
AD
E is
1 if
the
issu
e’s
aver
age
ratin
g is
inve
stm
ent g
rade
and
0 o
ther
wis
e.
Poin
t est
imat
es fo
r yea
r dum
mie
s ar
e no
t rep
orte
d, a
lthou
gh th
ey a
re in
clud
ed in
the
dem
and
estim
atio
n. T
he s
ymbo
ls *
**, *
*, *
den
ote
that
the
coef
ficie
nt is
st
atis
tical
ly d
iffer
ent f
rom
zer
o at
the
1, 5
, and
10%
sign
ifica
nce
leve
ls, r
espe
ctiv
ely.
Expl
anat
ory
varia
bles
Estim
ate
std.
err.
Estim
ate
std.
err.
Expl
anat
ory
varia
bles
Estim
ate
std.
err.
Ho:
p-v
alue
ln(M
ATU
RIT
Y)0.
0818
***
(0.0
001)
0.06
07**
*(0
.000
5)U
ND
ER
WR
ITIN
G F
EE
-84.
5500
***
(4.2
746)
1=2
0.03
61ln
(# O
F IS
SUE
S +
1)0.
0002
***
(0.0
001)
0.00
04**
(0.0
002)
LOA
N o
nly
(1)
1.32
56**
*(0
.081
8)2=
30.
0000
ln(A
MO
UN
T)-0
.001
0**
*(0
.000
1)0.
0014
***
(0.0
003)
LOA
N a
nd E
QU
ITY
(2)
1.56
20**
*(0
.091
0)1=
30.
0000
Aa
dum
my
-0.0
139
***
(0.0
004)
0.02
65**
*(0
.001
3)E
QU
ITY
only
(3)
-0.5
963
***
(0.1
261)
1=2
0.00
00A
dum
my
-0.0
157
***
(0.0
004)
0.02
41**
*(0
.001
2)In
clus
ive
Val
ue
0.20
32**
*(0
.036
0)2=
30.
0000
Baa
dum
my
-0.0
148
***
(0.0
004)
0.03
48**
*(0
.001
4)ln
(MA
TUR
ITY)
-1.6
642
*(0
.876
2)1=
30.
0000
LOA
N o
nly
(1)
-0.0
013
***
(0.0
002)
ln(#
OF
ISSU
ES
+1)
0.28
16**
*(0
.060
1)LO
AN
and
EQ
UIT
Y (
2)-0
.000
1(0
.000
2)
ln
(AM
OU
NT)
-0.5
777
***
(0.0
932)
EQ
UIT
Y on
ly (
3)0.
0029
***
(0.0
001)
INV
GR
AD
E0.
1597
(0.2
199)
cons
tant
yes
yes
year
dum
mie
sye
sye
sye
ar d
umm
ies
yes
Com
mer
cial
ban
kIn
vest
men
t ban
k
Pane
l B:
Dem
and
Estim
ates
Pane
l C: T
est
Stat
istic
sD
epen
dent
var
iabl
e: C
hoic
e of
und
erw
ritin
g ba
nkPa
nel A
: Fee
Est
imat
esD
epen
dent
var
iabl
e: U
nder
writ
ing
fees
Num
ber o
f obs
erva
tions
: 1,
302
52
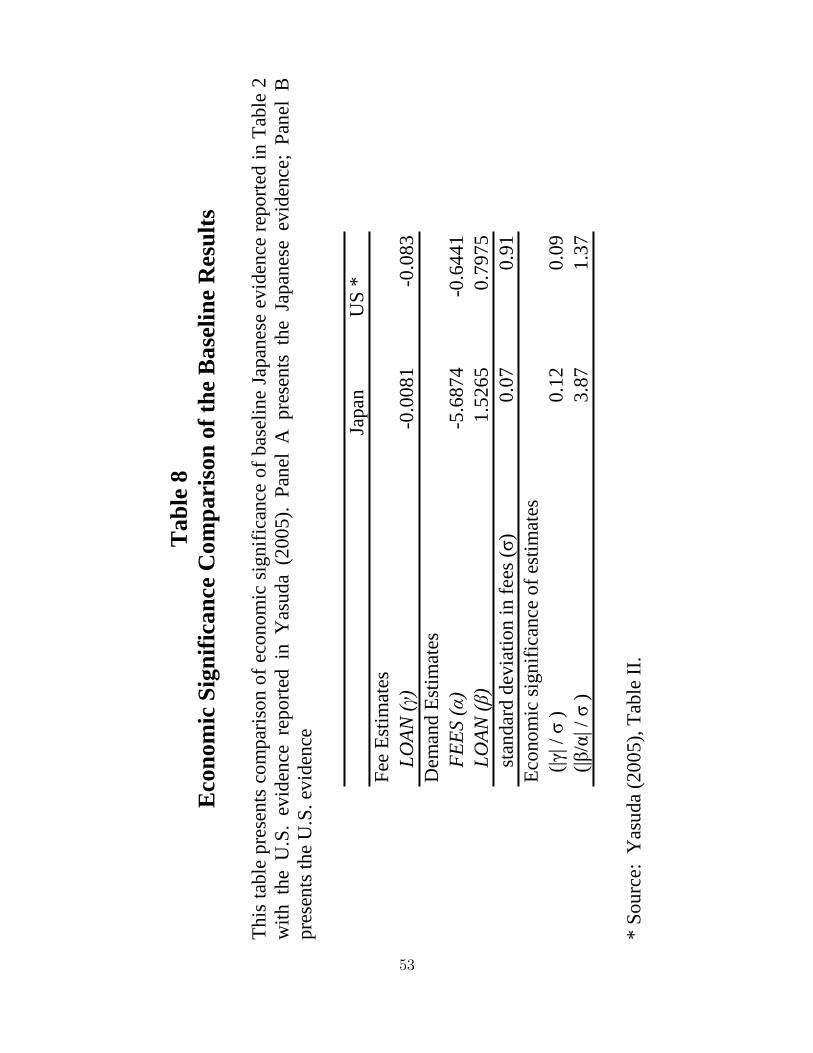
Tab
le 8
E
cono
mic
Sig
nific
ance
Com
pari
son
of th
e B
asel
ine
Res
ults
This
tabl
e pr
esen
ts c
ompa
rison
of e
cono
mic
sig
nific
ance
of b
asel
ine
Japa
nese
evi
denc
e re
porte
d in
Tab
le 2
w
ith t
he U
.S.
evid
ence
rep
orte
d in
Yas
uda
(200
5).
Pane
l A
pre
sent
s th
e Ja
pane
se e
vide
nce;
Pan
el B
pres
ents
the
U.S
. evi
denc
e
Ja
pan
US
*Fe
e Es
timat
es
LO
AN
()
-0.0
081
-0.0
83D
eman
d Es
timat
es
FE
ES
()
-5.6
874
-0.6
441
LO
AN
()
1.52
650.
7975
st
anda
rd d
evia
tion
in fe
es (
)0.
070.
91
(||
/ )
0.12
0.09
(|
/| /
)
3.87
1.37
Econ
omic
sign
ifica
nce
of e
stim
ates
* So
urce
: Y
asud
a (2
005)
, Tab
le II
.
53
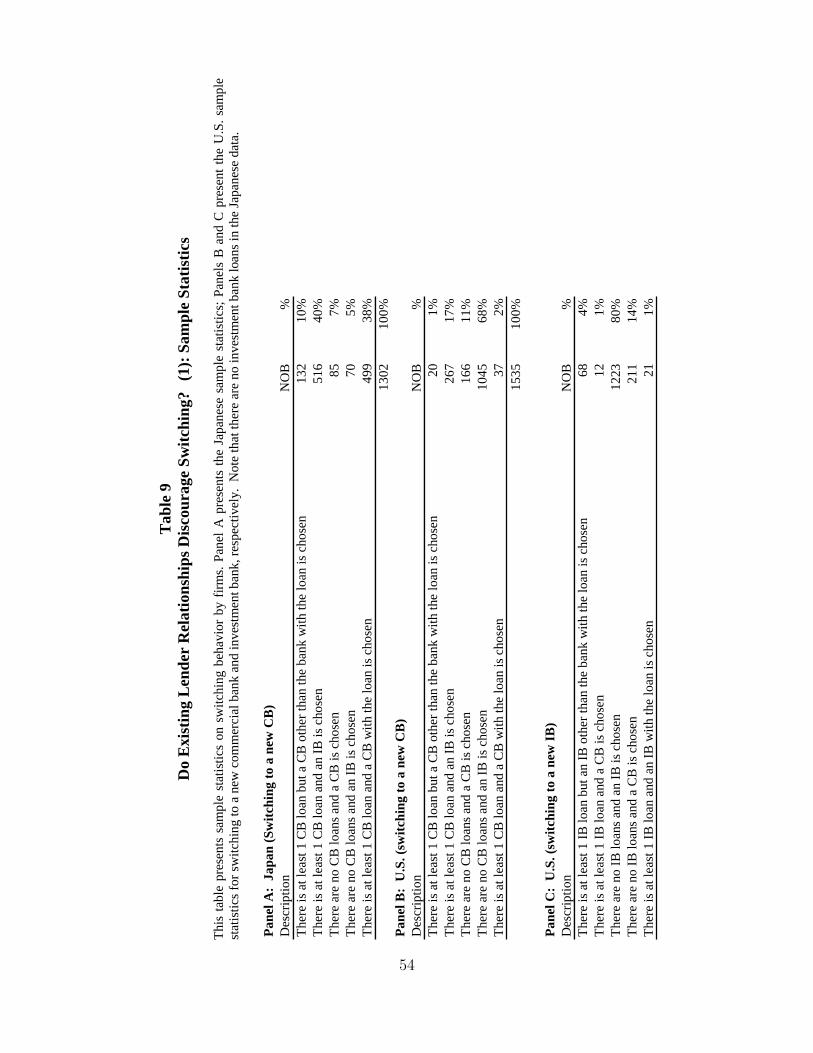
Tab
le 9
D
o E
xist
ing
Len
der
Rel
atio
nshi
ps D
isco
urag
e Sw
itchi
ng?
(1):
Sam
ple
Stat
istic
s
This
tabl
e pr
esen
ts s
ampl
e st
atis
tics
on s
witc
hing
beh
avio
r by
firm
s. Pa
nel A
pre
sent
s th
e Ja
pane
se s
ampl
e st
atis
tics;
Pan
els
B an
d C
pre
sent
the
U.S
. sam
ple
stat
istic
s for
switc
hing
to a
new
com
mer
cial
ban
k an
d in
vest
men
t ban
k, re
spec
tivel
y. N
ote
that
ther
e ar
e no
inve
stm
ent b
ank
loan
s in
the
Japa
nese
dat
a.
Pane
l A:
Japa
n (S
witc
hing
to a
new
CB
)D
escr
iptio
n N
OB
%Th
ere
is a
t lea
st 1
CB
loan
but
a C
B o
ther
than
the
bank
with
the
loan
is c
hose
n 13
210
%Th
ere
is a
t lea
st 1
CB
loan
and
an
IB is
cho
sen
516
40%
Ther
e ar
e no
CB
loan
s and
a C
B is
cho
sen
857%
Ther
e ar
e no
CB
loan
s and
an
IB is
cho
sen
705%
Ther
e is
at l
east
1 C
B lo
an a
nd a
CB
with
the
loan
is c
hose
n 49
938
%13
0210
0%Pa
nel B
: U
.S. (
switc
hing
to a
new
CB
)D
escr
iptio
n N
OB
%Th
ere
is a
t lea
st 1
CB
loan
but
a C
B o
ther
than
the
bank
with
the
loan
is c
hose
n20
1%Th
ere
is a
t lea
st 1
CB
loan
and
an
IB is
cho
sen
267
17%
Ther
e ar
e no
CB
loan
s and
a C
B is
cho
sen
166
11%
Ther
e ar
e no
CB
loan
s and
an
IB is
cho
sen
1045
68%
Ther
e is
at l
east
1 C
B lo
an a
nd a
CB
with
the
loan
is c
hose
n 37
2%15
3510
0%
Pane
l C:
U.S
. (sw
itchi
ng to
a n
ew IB
)D
escr
iptio
n N
OB
%Th
ere
is a
t lea
st 1
IB lo
an b
ut a
n IB
oth
er th
an th
e ba
nk w
ith th
e lo
an is
cho
sen
684%
Ther
e is
at l
east
1 IB
loan
and
a C
B is
cho
sen
121%
Ther
e ar
e no
IB lo
ans a
nd a
n IB
is c
hose
n 12
2380
%Th
ere
are
no IB
loan
s and
a C
B is
cho
sen
211
14%
Ther
e is
at l
east
1 IB
loan
and
an
IB w
ith th
e lo
an is
cho
sen
211%
54
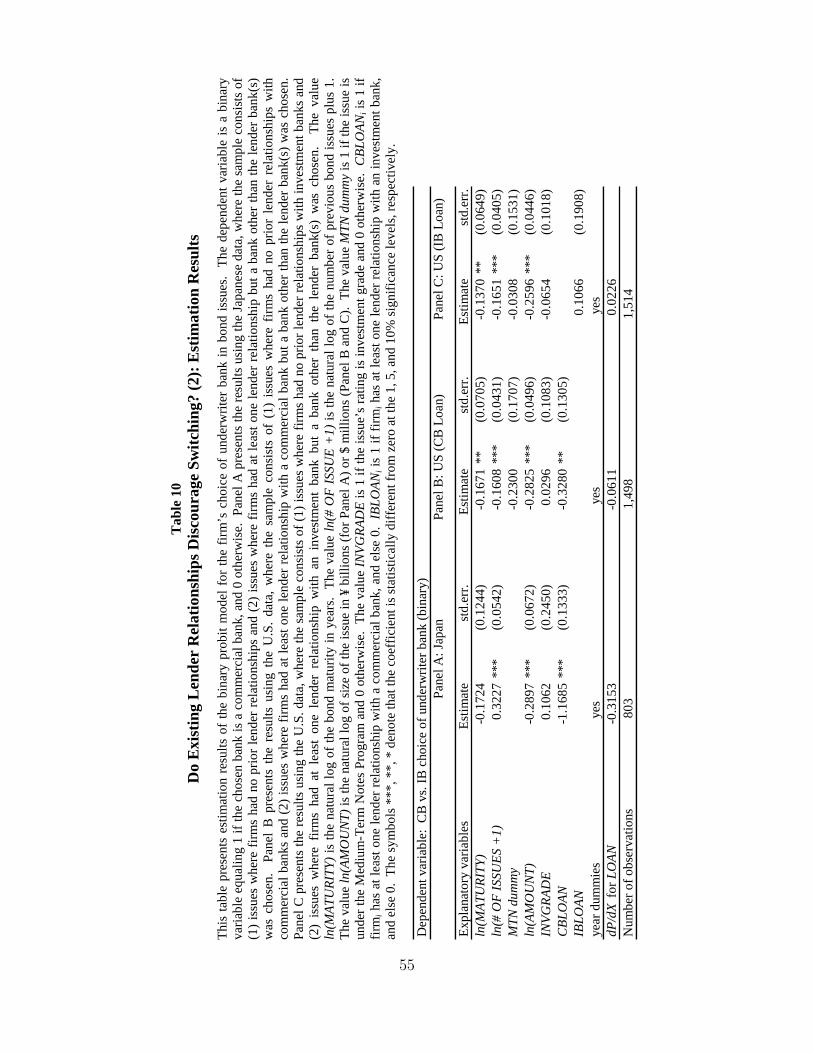
Tab
le 1
0 D
o E
xist
ing
Len
der
Rel
atio
nshi
ps D
isco
urag
e Sw
itchi
ng?
(2):
Est
imat
ion
Res
ults
This
tabl
e pr
esen
ts e
stim
atio
n re
sults
of
the
bina
ry p
robi
t mod
el f
or th
e fir
m’s
cho
ice
of u
nder
writ
er b
ank
in b
ond
issu
es.
The
depe
nden
t var
iabl
e is
a b
inar
yva
riabl
e eq
ualin
g 1
if th
e ch
osen
ban
k is
a c
omm
erci
al b
ank,
and
0 o
ther
wis
e. P
anel
A p
rese
nts
the
resu
lts u
sing
the
Japa
nese
dat
a, w
here
the
sam
ple
cons
ists
of
(1) i
ssue
s w
here
firm
s ha
d no
prio
r len
der r
elat
ions
hips
and
(2) i
ssue
s w
here
firm
s ha
d at
leas
t one
lend
er re
latio
nshi
p bu
t a b
ank
othe
r tha
n th
e le
nder
ban
k(s)
was
cho
sen.
Pa
nel
B p
rese
nts
the
resu
lts u
sing
the
U.S
. da
ta, w
here
the
sam
ple
cons
ists
of
(1)
issu
es w
here
firm
s ha
d no
prio
r le
nder
rel
atio
nshi
ps w
ithco
mm
erci
al b
anks
and
(2) i
ssue
s w
here
firm
s ha
d at
leas
t one
lend
er re
latio
nshi
p w
ith a
com
mer
cial
ban
k bu
t a b
ank
othe
r tha
n th
e le
nder
ban
k(s)
was
cho
sen.
Pane
l C p
rese
nts
the
resu
lts u
sing
the
U.S
. dat
a, w
here
the
sam
ple
cons
ists
of (
1) is
sues
whe
re fi
rms
had
no p
rior l
ende
r rel
atio
nshi
ps w
ith in
vest
men
t ban
ks a
nd(2
) is
sues
whe
re f
irms
had
at l
east
one
len
der
rela
tions
hip
with
an
inve
stm
ent
bank
but
a b
ank
othe
r th
an t
he l
ende
r ba
nk(s
) w
as c
hose
n.
The
valu
eln
(MA
TUR
ITY)
is th
e na
tura
l log
of t
he b
ond
mat
urity
in y
ears
. Th
e va
lue
ln(#
OF
ISS
UE
+1)
is th
e na
tura
l log
of t
he n
umbe
r of p
revi
ous
bond
issu
es p
lus
1.
The
valu
e ln
(AM
OU
NT)
is th
e na
tura
l log
of s
ize
of th
e is
sue
in ¥
bill
ions
(for
Pan
el A
) or $
mill
ions
(Pan
el B
and
C).
The
val
ue M
TN d
umm
y is
1 if
the
issu
e is
un
der t
he M
ediu
m-T
erm
Not
es P
rogr
am a
nd 0
oth
erw
ise.
The
val
ue IN
VG
RA
DE
is 1
if th
e is
sue’
s ra
ting
is in
vest
men
t gra
de a
nd 0
oth
erw
ise.
CB
LOA
Ni i
s 1
if fir
mi h
as a
t lea
st o
ne le
nder
rela
tions
hip
with
a c
omm
erci
al b
ank,
and
els
e 0.
IB
LOA
Ni i
s 1
if fir
mi h
as a
t lea
st o
ne le
nder
rela
tions
hip
with
an
inve
stm
ent b
ank,
and
else
0.
The
sym
bols
***
, **,
* d
enot
e th
at th
e co
effic
ient
is st
atis
tical
ly d
iffer
ent f
rom
zer
o at
the
1, 5
, and
10%
sign
ifica
nce
leve
ls, r
espe
ctiv
ely.
Pane
l B: U
S (C
B L
oan)
Expl
anat
ory
varia
bles
Estim
ate
std.
err.
Estim
ate
std.
err.
Estim
ate
std.
err.
ln(M
ATU
RIT
Y)-0
.172
4(0
.124
4)-0
.167
1**
(0.0
705)
-0.1
370
**(0
.064
9)ln
(# O
F IS
SUE
S +
1)0.
3227
***
(0.0
542)
-0.1
608
***
(0.0
431)
-0.1
651
***
(0.0
405)
MTN
dum
my
-0.2
300
(0.1
707)
-0.0
308
(0.1
531)
ln(A
MO
UN
T)-0
.289
7**
*(0
.067
2)-0
.282
5**
*(0
.049
6)-0
.259
6**
*(0
.044
6)IN
VG
RA
DE
0.10
62(0
.245
0)0.
0296
(0.1
083)
-0.0
654
(0.1
018)
CB
LOA
N-1
.168
5**
*(0
.133
3)-0
.328
0**
(0.1
305)
IB
LOA
N0.
1066
(0.1
908)
year
dum
mie
sye
s ye
s ye
s dP
/dX
for L
OA
N-0
.315
3-0
.061
10.
0226
Num
ber o
f obs
erva
tions
80
31,
498
1,51
4
Pane
l A: J
apan
Pane
l C: U
S (I
B L
oan)
Dep
ende
nt v
aria
ble:
CB
vs.
IB c
hoic
e of
und
erw
riter
ban
k (b
inar
y)
55
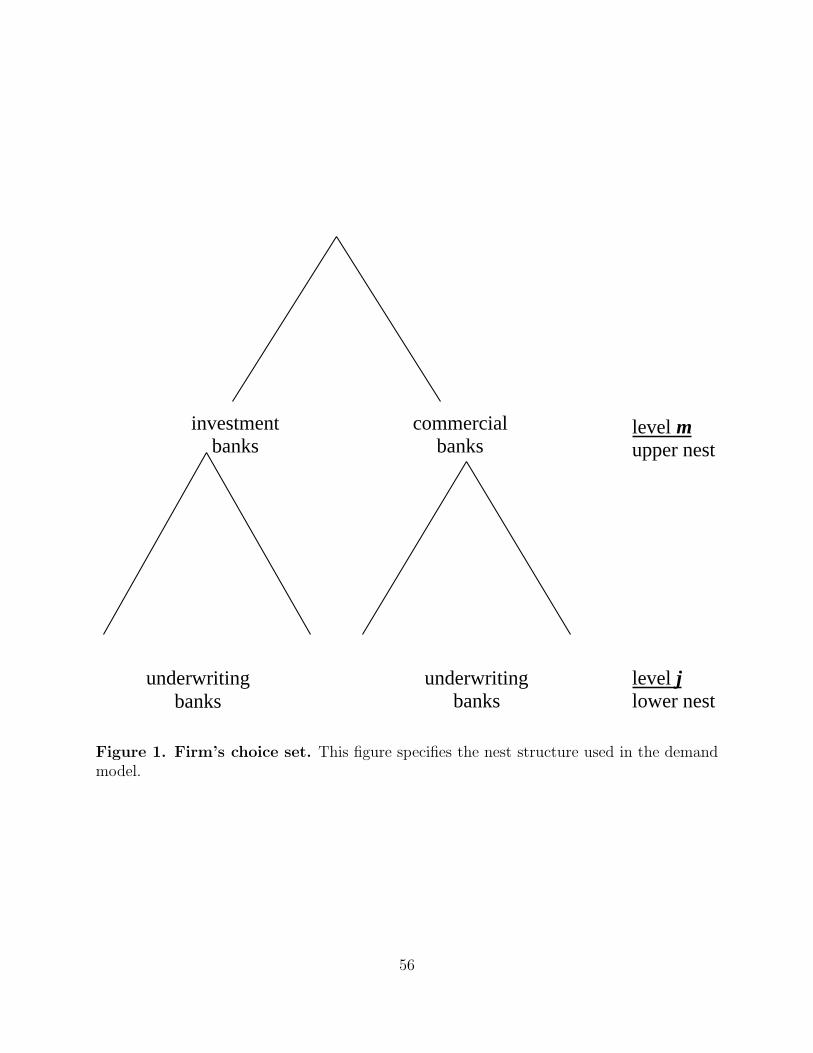
investmentbanks
commercialbanks
underwritingbanks
underwritingbanks
level j
lower nest
level m
upper nest
Figure 1. Firm’s choice set. This figure specifies the nest structure used in the demandmodel.
56