Embed Size (px)
Citation preview

Dr. David Liu, PhD
NDIA Joint Service Power Expo
May 3, 2011
Battery Management for Monitoring up to
Six Lead-Acid Batteries at the Individual
Battery and System Levels
2
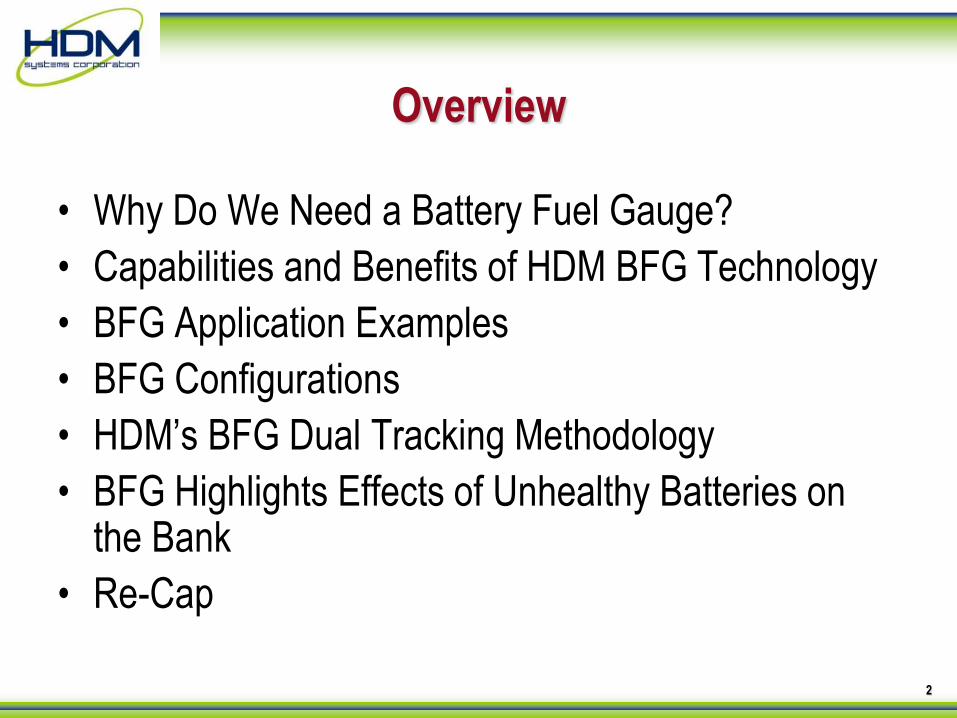
Overview
• Why Do We Need a Battery Fuel Gauge?
• Capabilities and Benefits of HDM BFG Technology
• BFG Application Examples
• BFG Configurations
• HDM’s BFG Dual Tracking Methodology
• BFG Highlights Effects of Unhealthy Batteries on the Bank
• Re-Cap
3
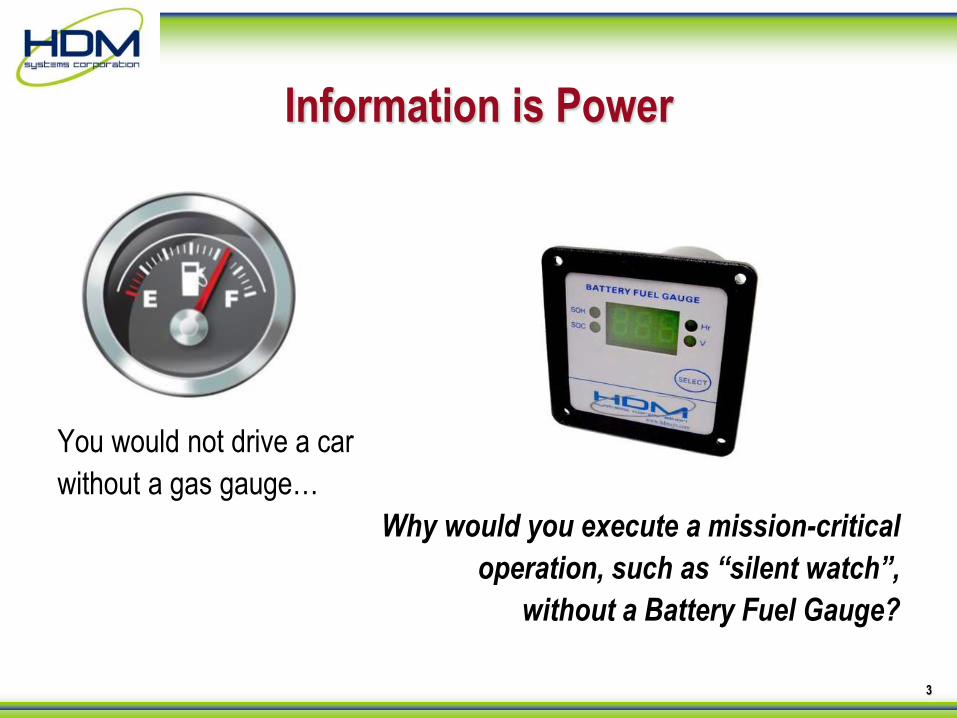
Information is Power
You would not drive a car
without a gas gauge…
Why would you execute a mission-critical
operation, such as “silent watch”,
without a Battery Fuel Gauge?
4
Capabilities of HDM BFG Technology
• Battery Power Usage Information: Diagnostics and Prognostics – State of Charge (SOC) at 95% Accuracy
– State of Health (SOH) at 95% Accuracy
– Hours Remaining (HR) at 90% Accuracy
– Battery Voltage (V)
– Battery Temperature (T)
– Current (I)
– State of Life (SOL)
• Functionality – System Interface: CANBUS, RS232, Control Panel-Mounted Display
– Real-Time Data and Estimations
– Self-Calibration
– Lightweight Packaging
5
Benefits of HDM BFG Technology
• Operations – Alerts crew when re-charging is necessary
– Provides Hours Remaining for silent watch
– Ensures mission capacity and success
• Maintenance – Identifies unhealthy batteries for replacement
– Facilitates Condition-Based Maintenance (CBM)
• Cost-Efficiency – Single BFG per system vs. multiple BFGs per system
– Simple configuration reduces install, operation, and maintenance
– Powerful tool for intelligent power management systems

6
BFG Implementation
Mobile Application
• Customer
– Navistar Defense
• UK MOD/NATO
• Vehicle
– Husky Tactical Support Vehicle
• Application
– Monitors Battery SOC and SOH
Over 1500 HDM BFGs have
been installed in Husky
TSVs in Afghanistan
supporting the NATO troops
7
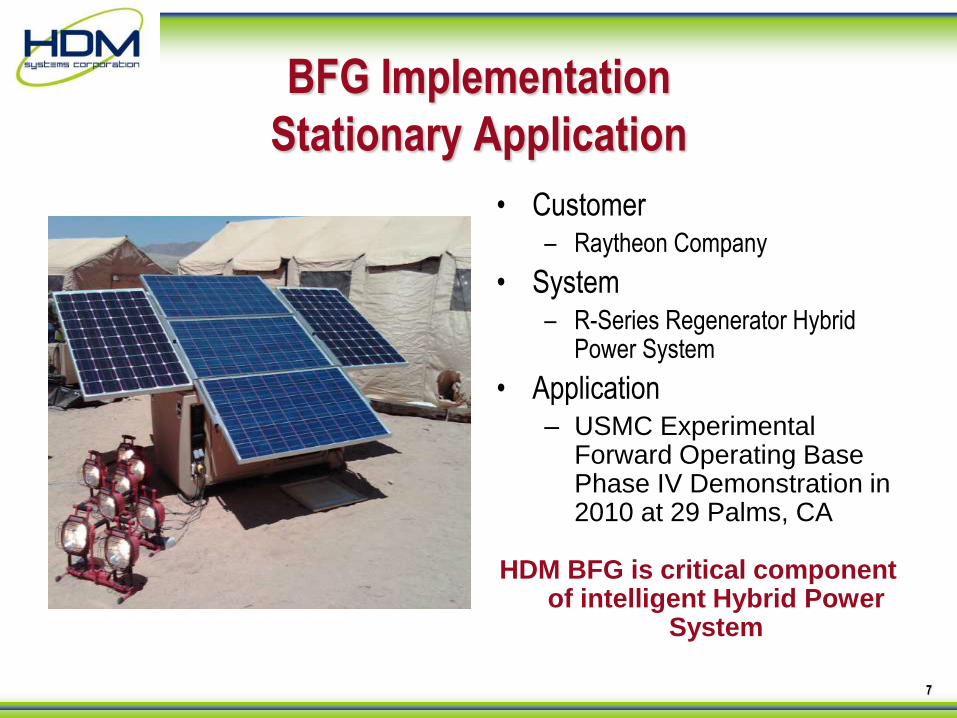
BFG Implementation
Stationary Application
• Customer – Raytheon Company
• System – R-Series Regenerator Hybrid
Power System
• Application – USMC Experimental
Forward Operating Base Phase IV Demonstration in 2010 at 29 Palms, CA
HDM BFG is critical component
of intelligent Hybrid Power System
8
Battery Fuel Gauge Configurations

9
Configuration 1
System Level Monitoring Only
Advantage: SIMPLICITY
12VDC
Battery
#3
12VDC
Battery
#1
12VDC
Battery
#4
12VDC
Battery
#2
DC
Load
Charg
er
(Alte
rnato
r)
12VDC
Battery
#5
12VDC
Battery
#6
Batt
Neg
Load
Neg
Interface Connection
(Display, RS232, CAN-Bus)
Fuel Gauge Sensor Module
Inline Fuse
Battery Positive Sense Wire
Battery Negative Connection
Load Negative Connection
10
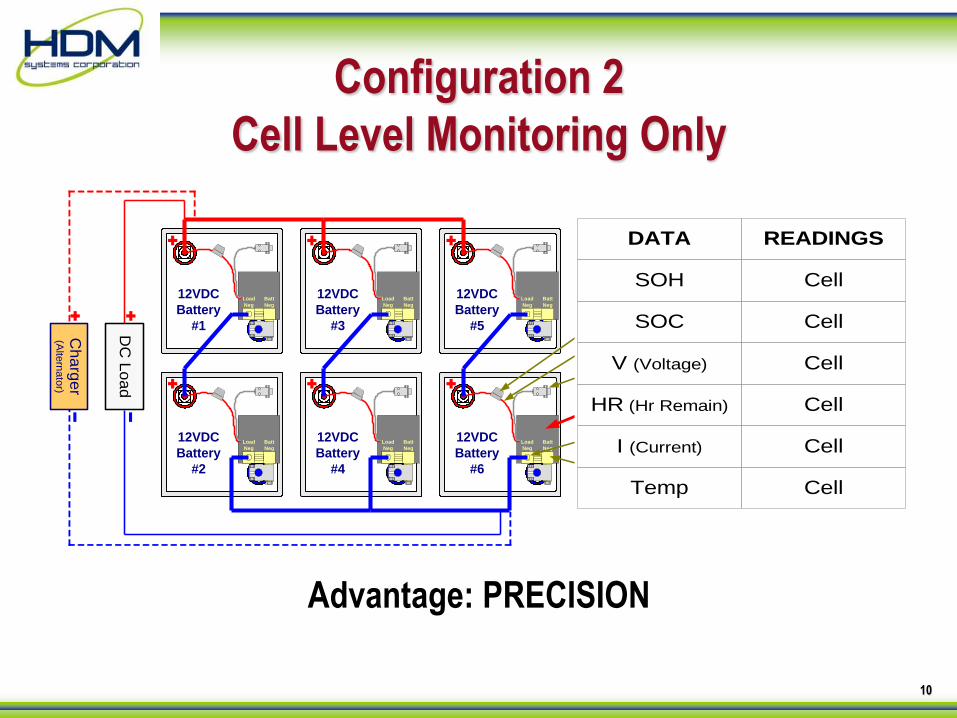
Configuration 2
Cell Level Monitoring Only
Advantage: PRECISION
12VDC
Battery
#3
12VDC
Battery
#1
12VDC
Battery
#4
12VDC
Battery
#2
Batt
Neg
Load
Neg
Batt
Neg
Load
Neg
Batt
Neg
Load
Neg
Batt
Neg
Load
Neg
DC
Lo
ad
Cha
rger
(Alte
rnato
r)
12VDC
Battery
#5
12VDC
Battery
#6
Batt
Neg
Load
Neg
Batt
Neg
Load
Neg
Interface Connection
(Display, RS232, CAN-Bus)
Fuel Gauge Sensor Module
Inline Fuse
Battery Positive Sense Wire
Battery Negative Connection
Load Negative Connection
DATA READINGS
SOH Cell
SOC Cell
V (Voltage) Cell
HR (Hr Remain) Cell
I (Current) Cell
Temp Cell
11
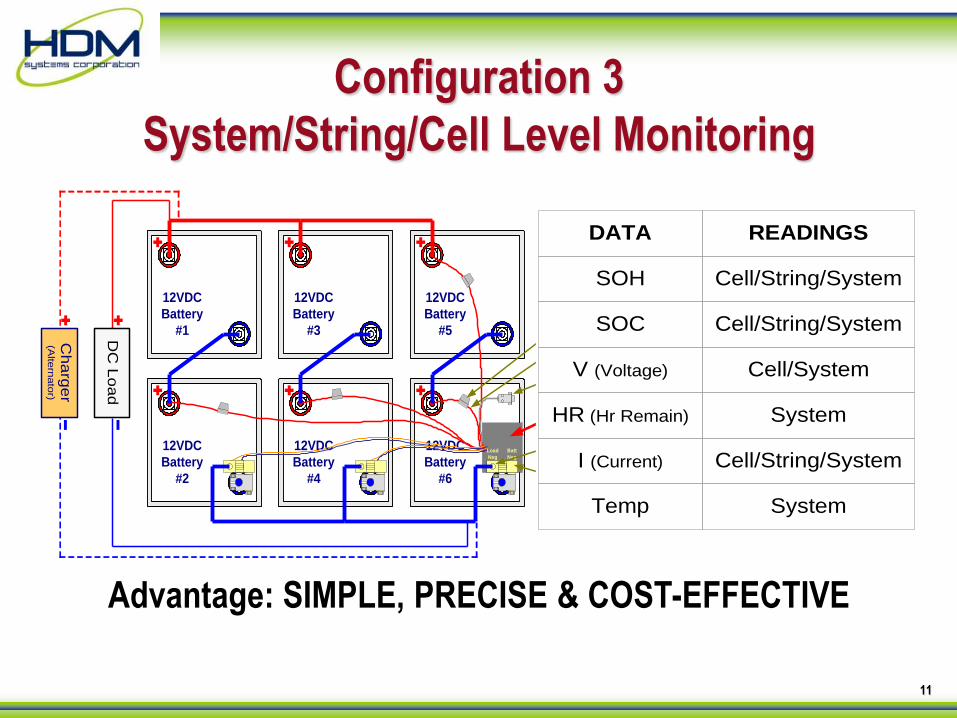
Configuration 3
System/String/Cell Level Monitoring
Advantage: SIMPLE, PRECISE & COST-EFFECTIVE
12VDC
Battery
#3
12VDC
Battery
#1
12VDC
Battery
#4
12VDC
Battery
#2
DC
Lo
ad
Cha
rger
(Alte
rnato
r)
12VDC
Battery
#5
12VDC
Battery
#6
Batt
Neg
Load
Neg
Interface Connection
(Display, RS232, CAN-Bus)
Fuel Gauge Sensor Module
Inline Fuse
Battery Positive Sense Wire
Battery Negative Connection
Load Negative Connection
DATA READINGS
SOH
SOC Cell/String/System
V (Voltage)
HR (Hr Remain)
I (Current)
Temp
Cell/String/System
Cell/System
System
Cell/String/System
System

12
HDM’s Battery Fuel Gauge Technology:
Dual Tracking Methodology
13
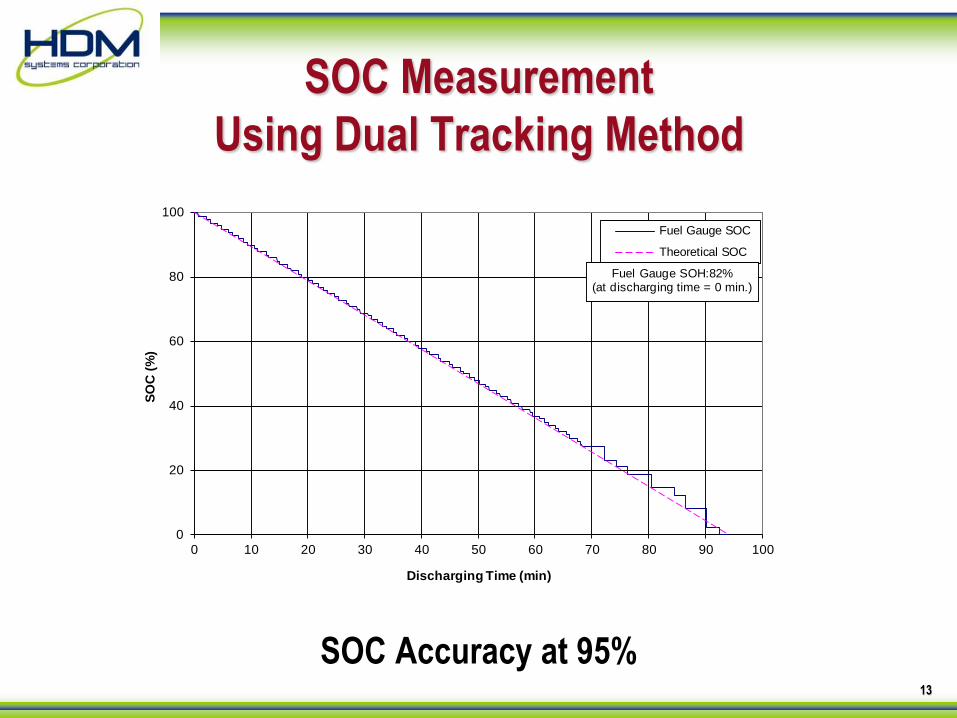
SOC Measurement
Using Dual Tracking Method
SOC Accuracy at 95%
0
20
40
60
80
100
0 10 20 30 40 50 60 70 80 90 100
SO
C (
%)
Discharging Time (min)
3rd Discharging Cycle (2x55 AH Batteries, 24V in series, 10A/40A Alternating Loads)
Fuel Gauge SOC
Theoretical SOC
Fuel Gauge SOH:82% (at discharging time = 0 min.)
14
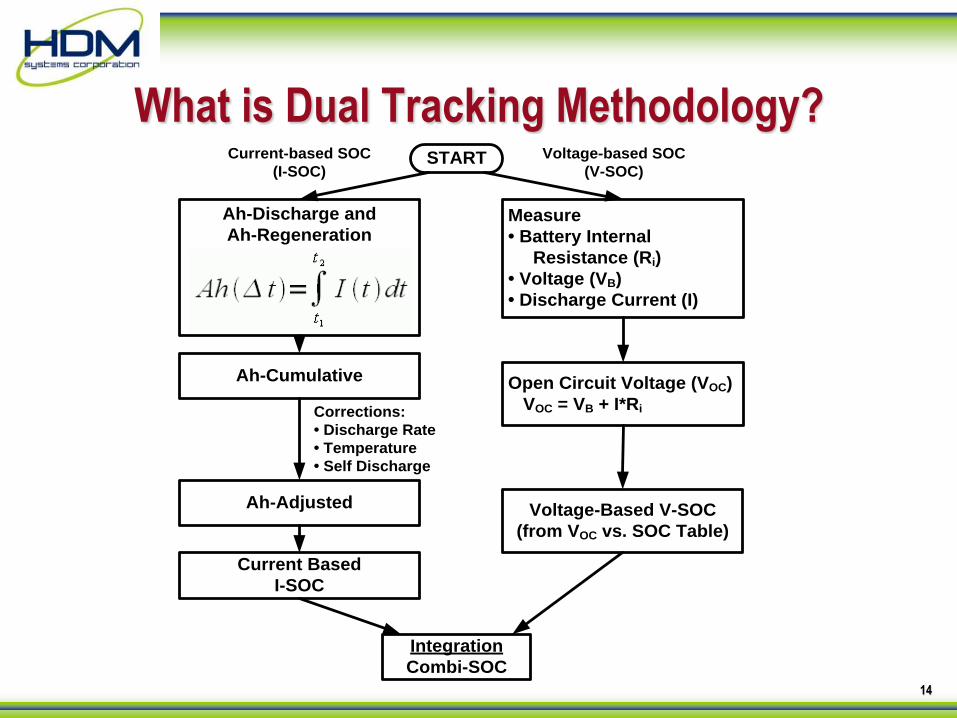
What is Dual Tracking Methodology? START
Measure
• Battery Internal
Resistance (Ri)
• Voltage (VB)
• Discharge Current (I)
Open Circuit Voltage (VOC)
VOC = VB + I*Ri
Voltage-Based V-SOC
(from VOC vs. SOC Table)
Ah-Cumulative
Ah-Adjusted
Current Based
I-SOC
Integration
Combi-SOC
Corrections:
• Discharge Rate
• Temperature
• Self Discharge
Ah-Discharge and
Ah-Regeneration
Dual Tracking Voltage and Current Based SOC Derivation
Current-based SOC
(I-SOC)
Voltage-based SOC
(V-SOC)
15
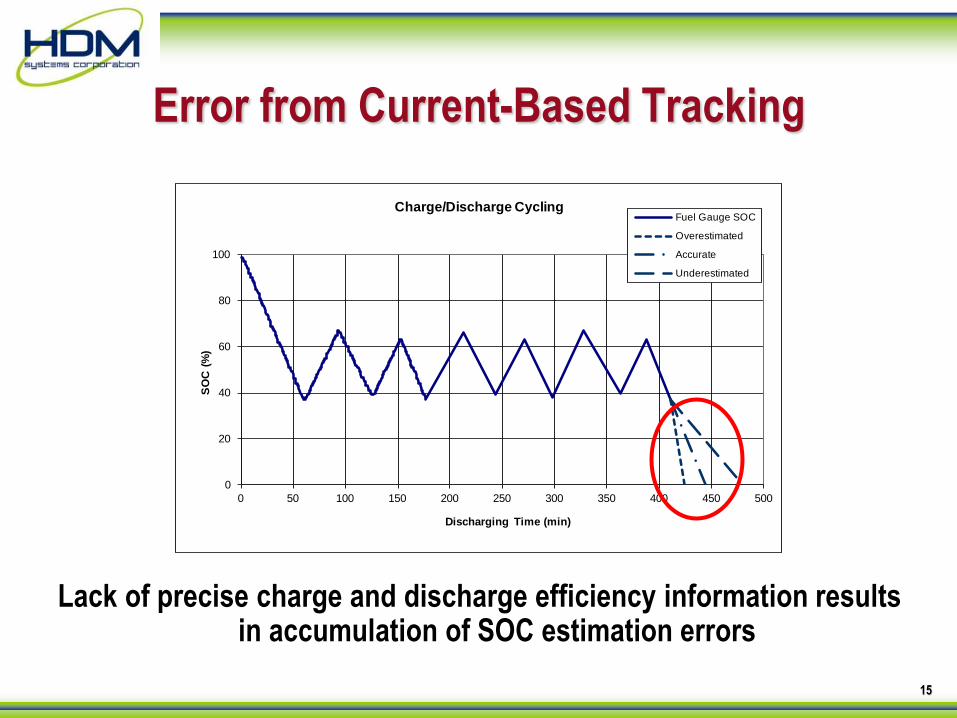
Error from Current-Based Tracking
Lack of precise charge and discharge efficiency information results in accumulation of SOC estimation errors
0
20
40
60
80
100
0 50 100 150 200 250 300 350 400 450 500
SO
C (
%)
Discharging Time (min)
Charge/Discharge Cycling Fuel Gauge SOC
Overestimated
Accurate
Underestimated
16
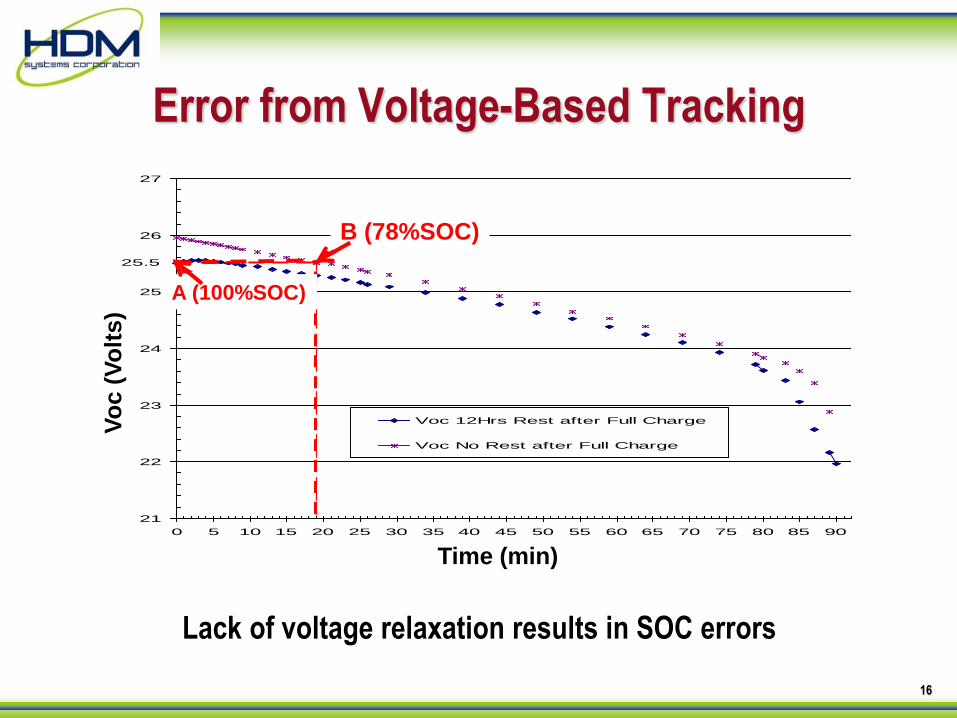
Error from Voltage-Based Tracking
Lack of voltage relaxation results in SOC errors
Voc (Open Circuit Voltage) Profiles of Battery with and without
Resting
21
22
23
24
25
26
27
0 5 10 15 20 25 30 35 40 45 50 55 60 65 70 75 80 85 90
time(mins)
Voc (
Volta
ge)
Voc 12Hrs Rest after Full Charge
Voc No Rest after Full Charge
A (100%SOC)
B (78%SOC)
25.5
Time (min)
Vo
c (
Vo
lts)
B (78%SOC)
A (100%SOC)
17
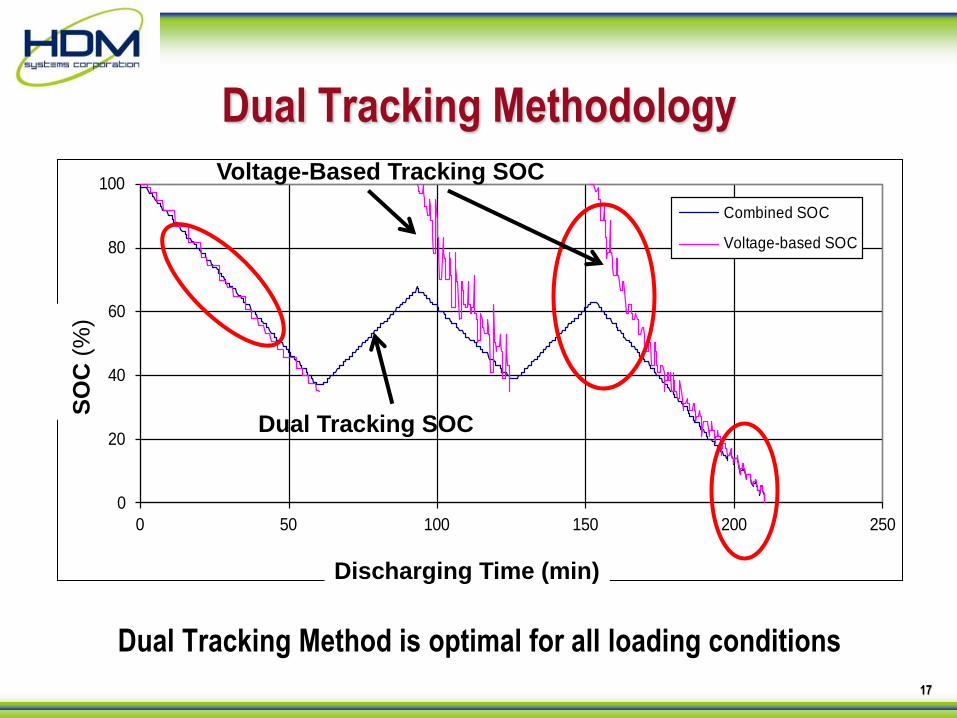
Dual Tracking Methodology
Dual Tracking Method is optimal for all loading conditions
0
20
40
60
80
100
0 50 100 150 200 250
SO
C (
%)
Discharging Time (min)
SOC Measurement in 24VDC Battery
with Partial Discharge / Partial Charge Conditions
Combined SOC
Voltage-based SOC
Discharging Time (min)
SO
C (
%)
Dual Tracking SOC
Voltage-Based Tracking SOC

18
Configuration 3
System/String/Cell Level Monitoring
Advantage: SIMPLE, PRECISE & COST-EFFECTIVE
12VDC
Battery
#3
12VDC
Battery
#1
12VDC
Battery
#4
12VDC
Battery
#2
DC
Lo
ad
Cha
rger
(Alte
rnato
r)
12VDC
Battery
#5
12VDC
Battery
#6
Batt
Neg
Load
Neg
Interface Connection
(Display, RS232, CAN-Bus)
Fuel Gauge Sensor Module
Inline Fuse
Battery Positive Sense Wire
Battery Negative Connection
Load Negative Connection
DATA READINGS
SOH
SOC Cell/String/System
V (Voltage)
HR (Hr Remain)
I (Current)
Temp
Cell/String/System
Cell/System
System
Cell/String/System
System
19
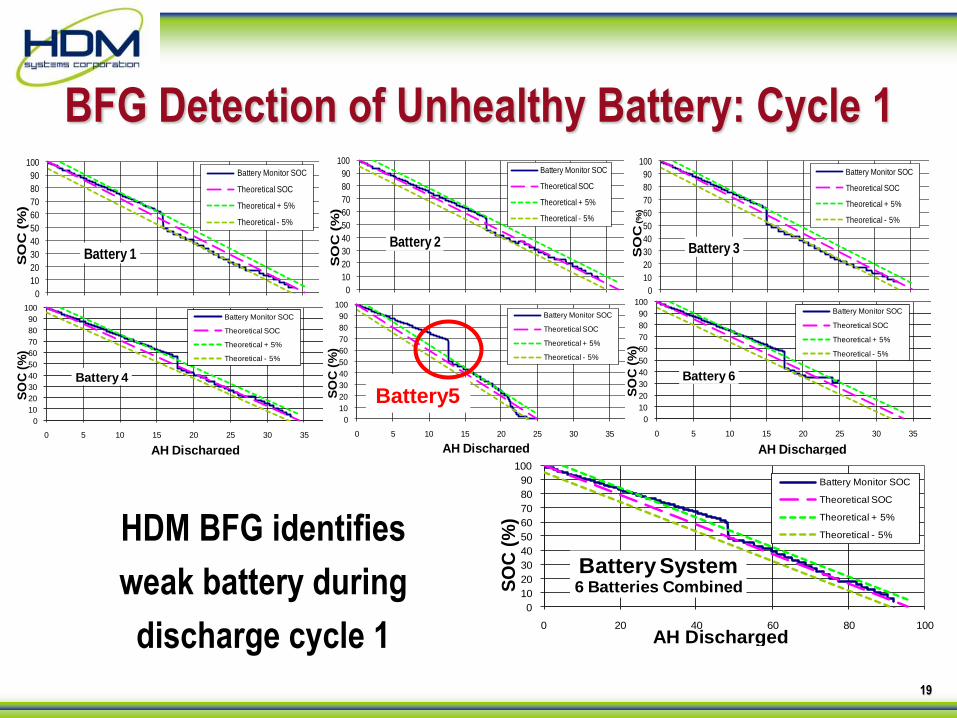
BFG Detection of Unhealthy Battery: Cycle 1
HDM BFG identifies
weak battery during
discharge cycle 1
0
10
20
30
40
50
60
70
80
90
100
0 5 10 15 20 25 30 35 40
SO
C (
%)
AH Discharged
Battery 1
Battery Monitor SOC
Theoretical SOC
Theoretical + 5%
Theoretical - 5%
0
10
20
30
40
50
60
70
80
90
100
0 5 10 15 20 25 30 35 40
SO
C(%
)
AH Discharged
Battery 3
Battery Monitor SOC
Theoretical SOC
Theoretical + 5%
Theoretical - 5%
0
10
20
30
40
50
60
70
80
90
100
0 5 10 15 20 25 30 35 40
SO
C (
%)
AH Discharged
Battery 2
Battery Monitor SOC
Theoretical SOC
Theoretical + 5%
Theoretical - 5%
0
10
20
30
40
50
60
70
80
90
100
0 5 10 15 20 25 30 35 40
SO
C (
%)
AH Discharged
Battery 4
Battery Monitor SOC
Theoretical SOC
Theoretical + 5%
Theoretical - 5%
0
10
20
30
40
50
60
70
80
90
100
0 5 10 15 20 25 30 35 40
SO
C (
%)
AH Discharged
Battery 6
Battery Monitor SOC
Theoretical SOC
Theoretical + 5%
Theoretical - 5%
0
10
20
30
40
50
60
70
80
90
100
0 20 40 60 80 100
SO
C (
%)
AH Discharged
Battery System6 Batteries Combined
Battery Monitor SOC
Theoretical SOC
Theoretical + 5%
Theoretical - 5%
0
10
20
30
40
50
60
70
80
90
100
0 5 10 15 20 25 30 35 40
SO
C (
%)
AH Discharged
Battery 5
Battery Monitor SOC
Theoretical SOC
Theoretical + 5%
Theoretical - 5%
Battery5
20
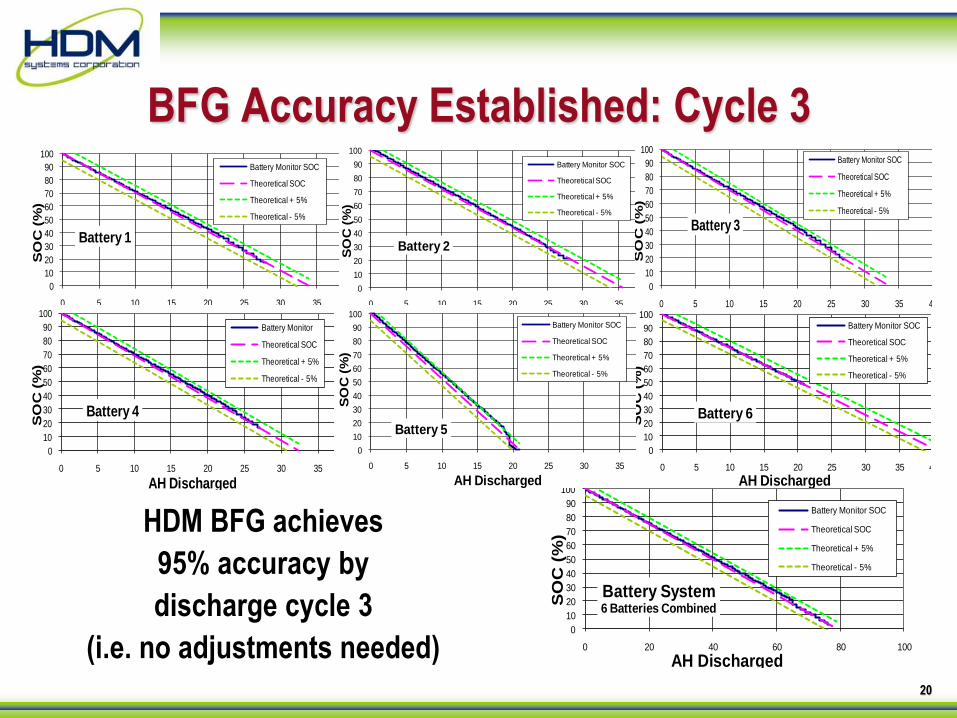
BFG Accuracy Established: Cycle 3
HDM BFG achieves
95% accuracy by
discharge cycle 3
(i.e. no adjustments needed)
0
10
20
30
40
50
60
70
80
90
100
0 5 10 15 20 25 30 35 40
SO
C (
%)
AH Discharged
Battery 1
Battery Monitor SOC
Theoretical SOC
Theoretical + 5%
Theoretical - 5%
0
10
20
30
40
50
60
70
80
90
100
0 20 40 60 80 100
SO
C (
%)
AH Discharged
Battery System6 Batteries Combined
Battery Monitor SOC
Theoretical SOC
Theoretical + 5%
Theoretical - 5%
0
10
20
30
40
50
60
70
80
90
100
0 5 10 15 20 25 30 35 40
SO
C (
%)
AH Discharged
Battery 2
Battery Monitor SOC
Theoretical SOC
Theoretical + 5%
Theoretical - 5%
0
10
20
30
40
50
60
70
80
90
100
0 5 10 15 20 25 30 35 40
SO
C (
%)
AH Discharged
Battery 4
Battery Monitor
Theoretical SOC
Theoretical + 5%
Theoretical - 5%
0
10
20
30
40
50
60
70
80
90
100
0 5 10 15 20 25 30 35 40 45
SO
C (
%)
AH Discharged
Battery 6
Battery Monitor SOC
Theoretical SOC
Theoretical + 5%
Theoretical - 5%
0
10
20
30
40
50
60
70
80
90
100
0 5 10 15 20 25 30 35 40
SO
C (
%)
AH Discharged
Battery 5
Battery Monitor SOC
Theoretical SOC
Theoretical + 5%
Theoretical - 5%
0
10
20
30
40
50
60
70
80
90
100
0 5 10 15 20 25 30 35 40
SO
C (
%)
AH Discharged
Battery 3
Battery Monitor SOC
Theoretical SOC
Theoretical + 5%
Theoretical - 5%
21
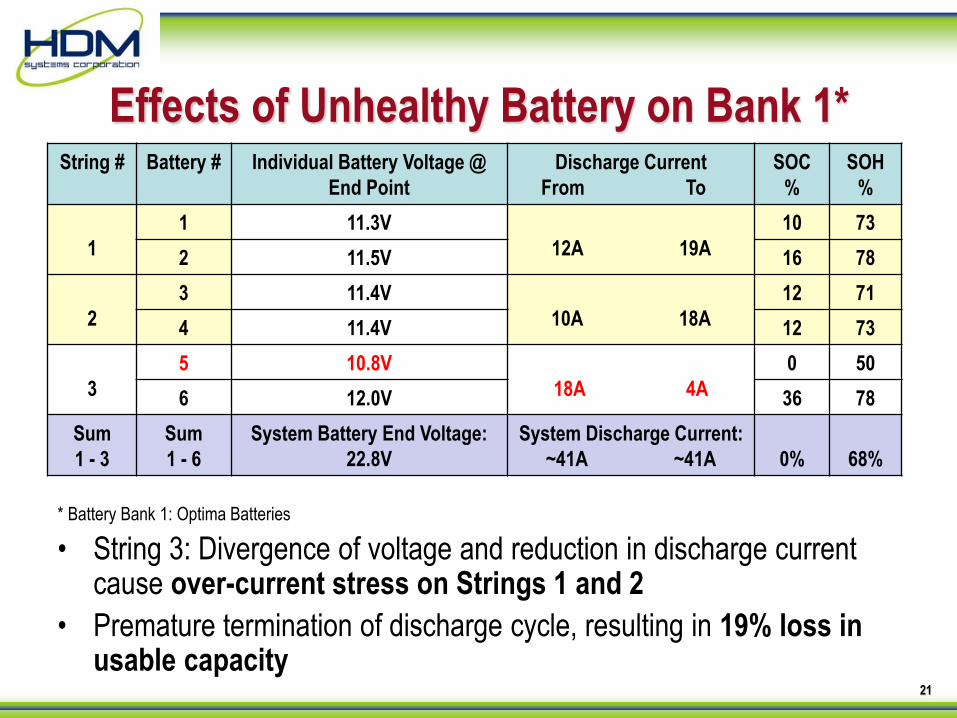
Effects of Unhealthy Battery on Bank 1*
* Battery Bank 1: Optima Batteries
• String 3: Divergence of voltage and reduction in discharge current cause over-current stress on Strings 1 and 2
• Premature termination of discharge cycle, resulting in 19% loss in usable capacity
String # Battery # Individual Battery Voltage @
End Point
Discharge Current
From To
SOC
%
SOH
%
1
1 11.3V
12A 19A
10 73
2 11.5V 16 78
2
3 11.4V
10A 18A
12 71
4 11.4V 12 73
3
5 10.8V
18A 4A
0 50
6 12.0V 36 78
Sum
1 - 3
Sum
1 - 6
System Battery End Voltage:
22.8V
System Discharge Current:
~41A ~41A
0%
68%
22
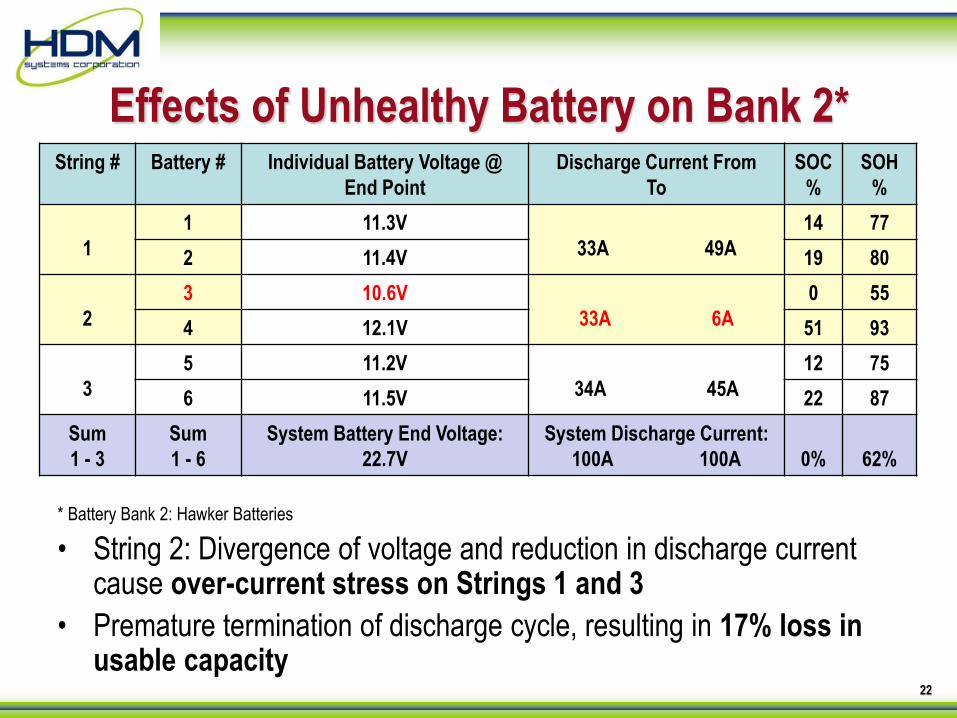
Effects of Unhealthy Battery on Bank 2*
* Battery Bank 2: Hawker Batteries
• String 2: Divergence of voltage and reduction in discharge current cause over-current stress on Strings 1 and 3
• Premature termination of discharge cycle, resulting in 17% loss in usable capacity
String # Battery # Individual Battery Voltage @
End Point
Discharge Current From
To
SOC
%
SOH
%
1
1 11.3V
33A 49A
14 77
2 11.4V 19 80
2
3 10.6V
33A 6A
0 55
4 12.1V 51 93
3
5 11.2V
34A 45A
12 75
6 11.5V 22 87
Sum
1 - 3
Sum
1 - 6
System Battery End Voltage:
22.7V
System Discharge Current:
100A 100A
0%
62%
23
Weakest Battery Threshold
vs. Conventional Threshold at 21V
By extending the system run-time (e.g. by 30 minutes), would be at the expense of the weakest battery
String
#
Battery
#
Battery Voltage Discharge Current Charge Current
@ End Point 1
(Bat 3 SOC=0%)
@ End Point 2 (Bat
Voltage=21V)
@ 100%
SOC
@ End
Point 1
@ End
Point 2
@ Low SOC
1
1 11.3V 9.9V
36A
51A
20A
20A 2 11.4V 11.1V
2
3 10.6V 9.6V
30A
6A
65A
3A 4 12.1V 11.5V
3
5 11.2V 9.7V
36A
45A
17A
19A 6 11.5V 11.3V
Sum
1 - 3
Sum
1 - 6
22.7V 21.0V 102A 102A 102A Set @ 42A
24
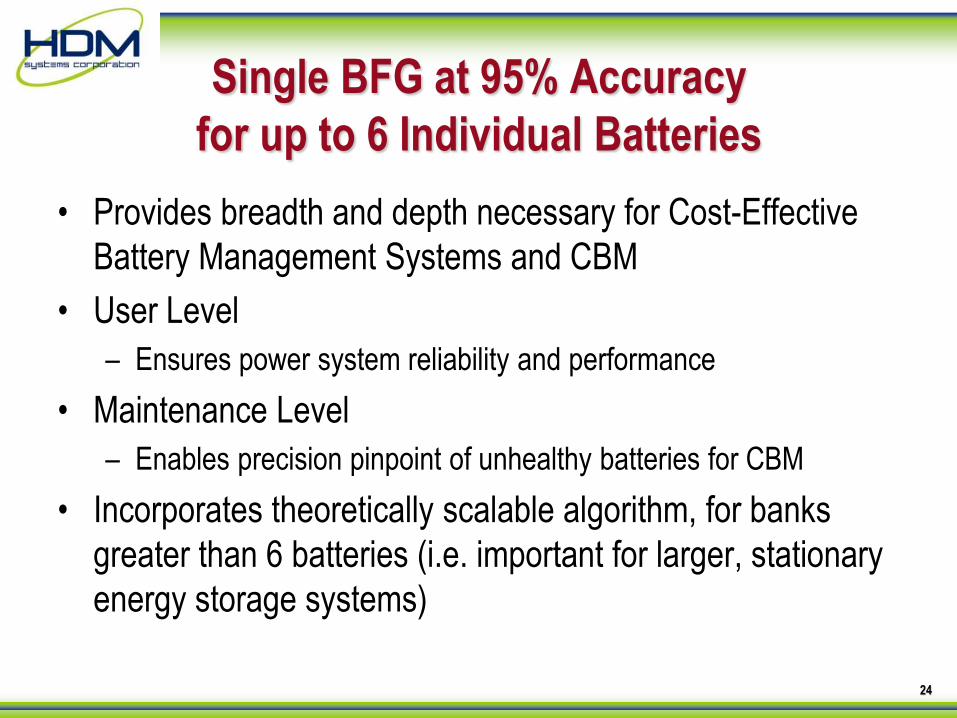
Single BFG at 95% Accuracy
for up to 6 Individual Batteries
• Provides breadth and depth necessary for Cost-Effective
Battery Management Systems and CBM
• User Level
– Ensures power system reliability and performance
• Maintenance Level
– Enables precision pinpoint of unhealthy batteries for CBM
• Incorporates theoretically scalable algorithm, for banks
greater than 6 batteries (i.e. important for larger, stationary
energy storage systems)

25
Thank You!
Contact Information:
Dr. David Liu, VP of R&D: [email protected]
Tel: 617.562.4054
Grace Chu, Director of New Business Development: [email protected]
Tel: 617-306-0060
Jim Averill, Director of Sales: [email protected]
Tel: 617-333-0399
HDM Systems, Inc.
226 Lincoln Street
Allston, MA 02134
Tel: 617.562.4054
Fax: 617.562.4013
Web: www.HDM-Sys.com
26
Appendix
27
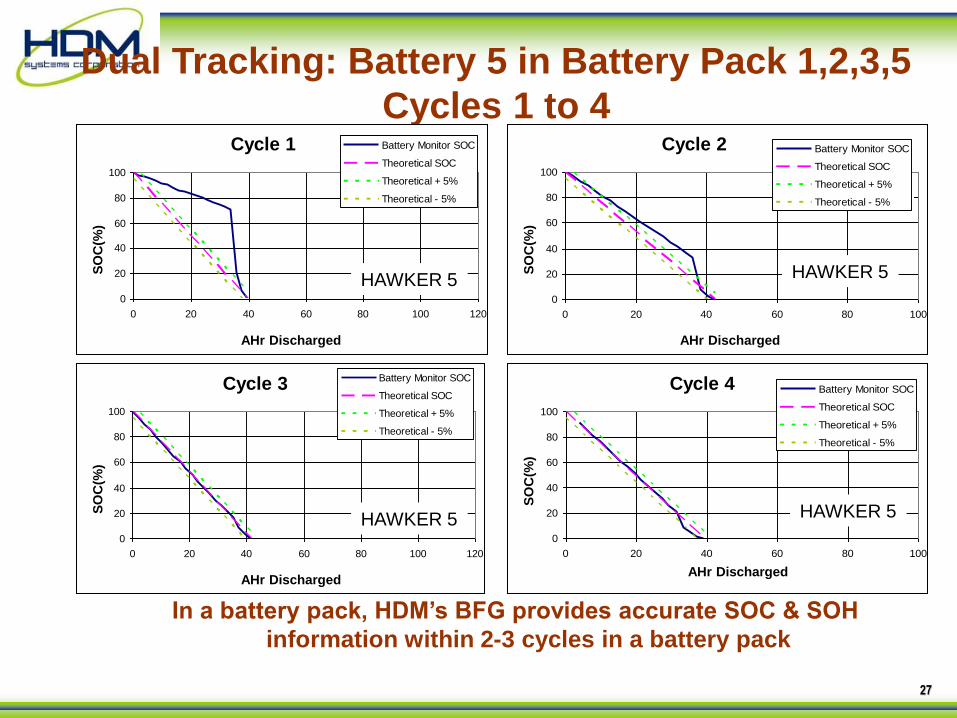
Dual Tracking: Battery 5 in Battery Pack 1,2,3,5
Cycles 1 to 4 4.20 2 H5 cycle 1
0
20
40
60
80
100
0 20 40 60 80 100 120
AH Discharged
SO
C (
%)
Battery Monitor SOC
Theoretical SOC
Theoretical + 5%
Theoretical - 5%
4.20.2 H5 cycle 2
0
20
40
60
80
100
0 20 40 60 80 100
AH Discharged
SO
C (
%)
Battery Monitor SOC
Theoretical SOC
Theoretical + 5%
Theoretical - 5%
4.20.2 H5 Cycle 3
0
20
40
60
80
100
0 20 40 60 80 100 120
AH Discharged
SO
C (
%)
Battery Monitor SOC
Theoretical SOC
Theoretical + 5%
Theoretical - 5%
4.21.1 H5
0
20
40
60
80
100
0 20 40 60 80 100
AH Discharged
SO
C (
%)
Battery Monitor SOC
Theoretical SOC
Theoretical + 5%
Theoretical - 5%
HAWKER 5
HAWKER 5 HAWKER 5
HAWKER 5
Cycle 1
Cycle 3 Cycle 4
Cycle 2
AHr Discharged AHr Discharged
AHr Discharged AHr Discharged
SO
C(%
)
SO
C(%
)
SO
C(%
)
SO
C(%
)
In a battery pack, HDM’s BFG provides accurate SOC & SOH
information within 2-3 cycles in a battery pack
28
0
20
40
60
80
100
0 20 40 60 80 100
SO
C (
%)
Discharging Time (min)
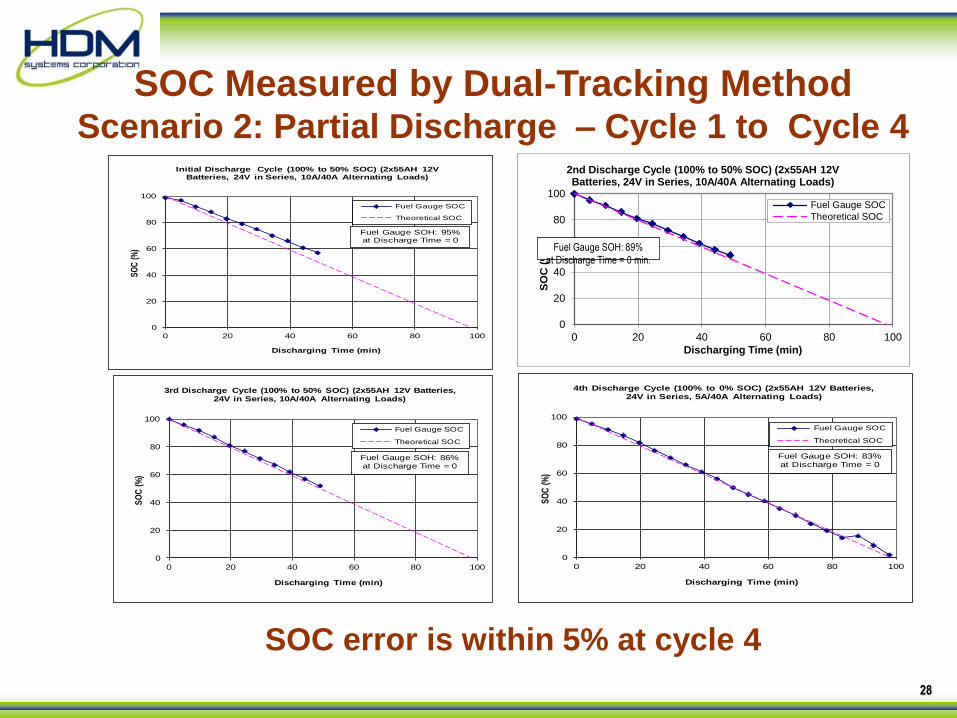
Initial Discharge Cycle (100% to 50% SOC) (2x55AH 12V Batteries, 24V in Series, 10A/40A Alternating Loads)
Fuel Gauge SOC
Theoretical SOC
Fuel Gauge SOH: 95% at Discharge Time = 0
0
20
40
60
80
100
0 20 40 60 80 100
SO
C (
%)
Discharging Time (min)
2nd Discharge Cycle (100% to 50% SOC) (2x55AH 12V Batteries, 24V in Series, 10A/40A Alternating Loads)
Fuel Gauge SOC
Theoretical SOC
Fuel Gauge SOH: 89%
at Discharge Time = 0 min.
0
20
40
60
80
100
0 20 40 60 80 100
SO
C (
%)
Discharging Time (min)
3rd Discharge Cycle (100% to 50% SOC) (2x55AH 12V Batteries, 24V in Series, 10A/40A Alternating Loads)
Fuel Gauge SOC
Theoretical SOC
Fuel Gauge SOH: 86% at Discharge Time = 0
0
20
40
60
80
100
0 20 40 60 80 100
SO
C (
%)
Discharging Time (min)
4th Discharge Cycle (100% to 0% SOC) (2x55AH 12V Batteries, 24V in Series, 5A/40A Alternating Loads)
Fuel Gauge SOC
Theoretical SOC
Fuel Gauge SOH: 83% at Discharge Time = 0
SOC Measured by Dual-Tracking Method Scenario 2: Partial Discharge – Cycle 1 to Cycle 4
SOC error is within 5% at cycle 4
29
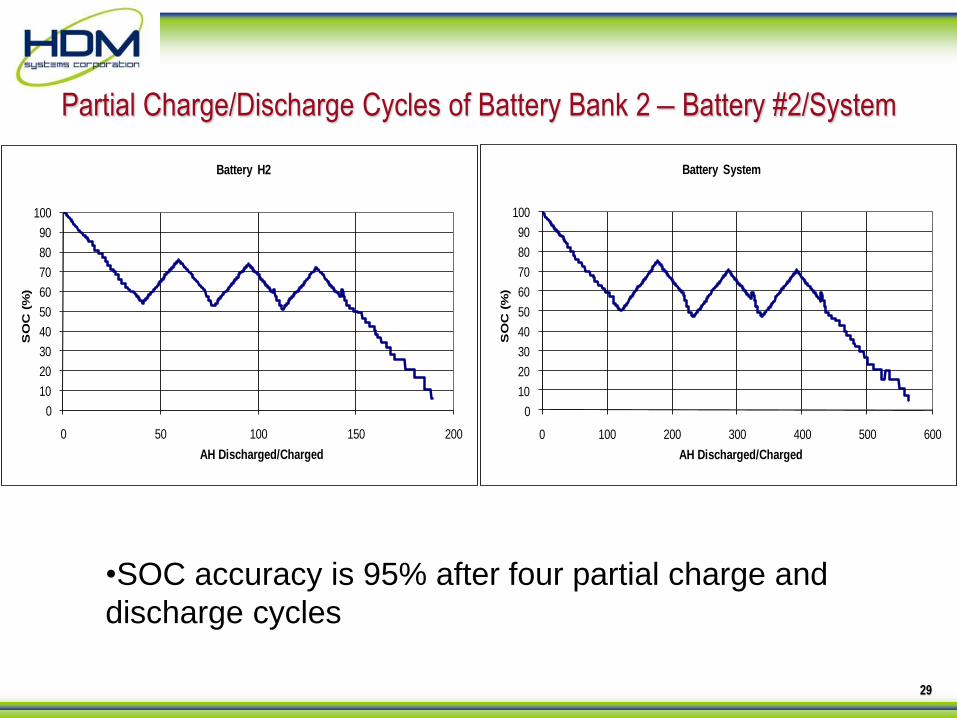
Partial Charge/Discharge Cycles of Battery Bank 2 – Battery #2/System
•SOC accuracy is 95% after four partial charge and
discharge cycles
0
10
20
30
40
50
60
70
80
90
100
0 50 100 150 200
SO
C (
%)
AH Discharged/Charged
Battery H2
0
10
20
30
40
50
60
70
80
90
100
0 100 200 300 400 500 600
SO
C (
%)
AH Discharged/Charged
Battery System
30
0
10
20
30
40
50
60
70
80
90
100
0 200 400 600 800 1000 1200 1400 1600 1800 2000
SO
C (
%)
AH Discharged/Charged
Battery System Battery Monitor SOC
Theoretical SOC
Theoretical + 5%
Theoretical - 5%
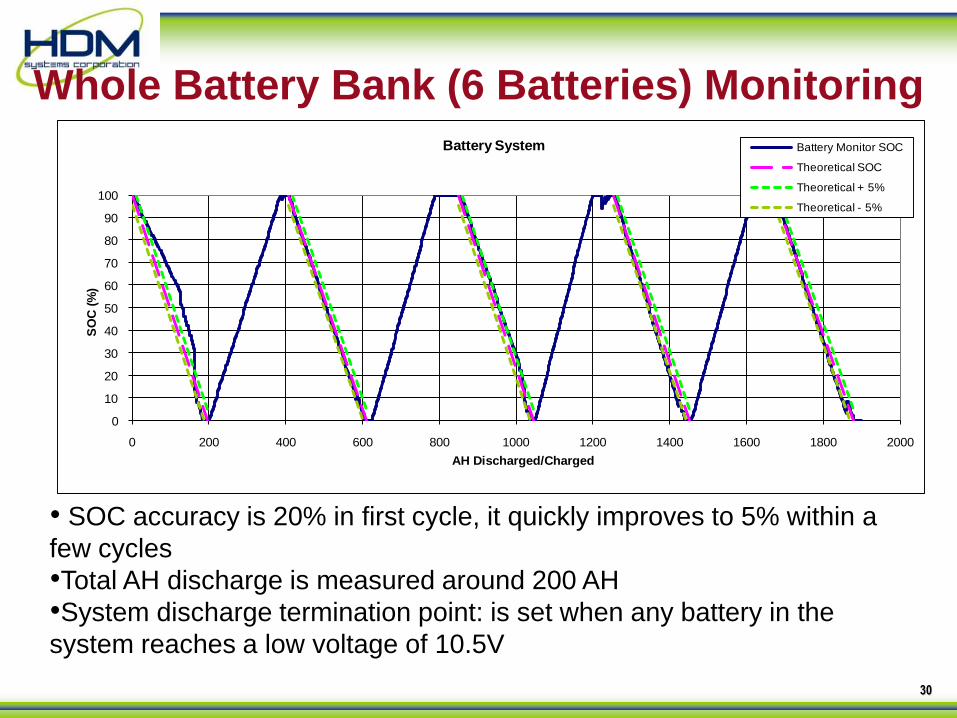
Whole Battery Bank (6 Batteries) Monitoring
• SOC accuracy is 20% in first cycle, it quickly improves to 5% within a
few cycles
•Total AH discharge is measured around 200 AH
•System discharge termination point: is set when any battery in the
system reaches a low voltage of 10.5V
31
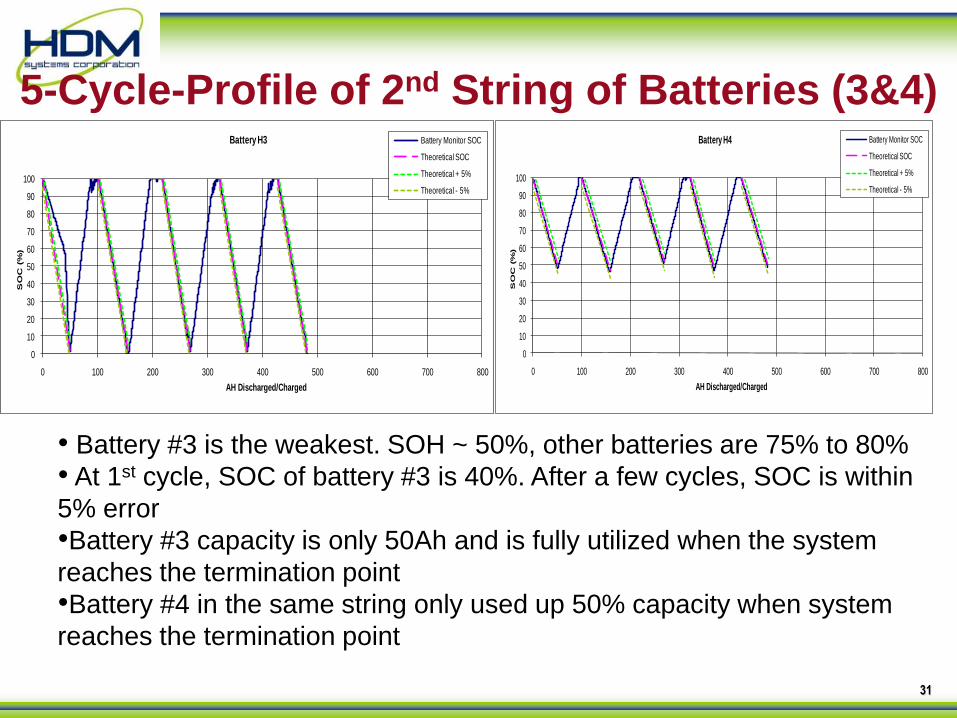
• Battery #3 is the weakest. SOH ~ 50%, other batteries are 75% to 80%
• At 1st cycle, SOC of battery #3 is 40%. After a few cycles, SOC is within
5% error
•Battery #3 capacity is only 50Ah and is fully utilized when the system
reaches the termination point
•Battery #4 in the same string only used up 50% capacity when system
reaches the termination point
0
10
20
30
40
50
60
70
80
90
100
0 100 200 300 400 500 600 700 800
SO
C (
%)
AH Discharged/Charged
Battery H3 Battery Monitor SOC
Theoretical SOC
Theoretical + 5%
Theoretical - 5%
0
10
20
30
40
50
60
70
80
90
100
0 100 200 300 400 500 600 700 800
SO
C (%
)
AH Discharged/Charged
Battery H4 Battery Monitor SOC
Theoretical SOC
Theoretical + 5%
Theoretical - 5%
5-Cycle-Profile of 2nd String of Batteries (3&4)
32
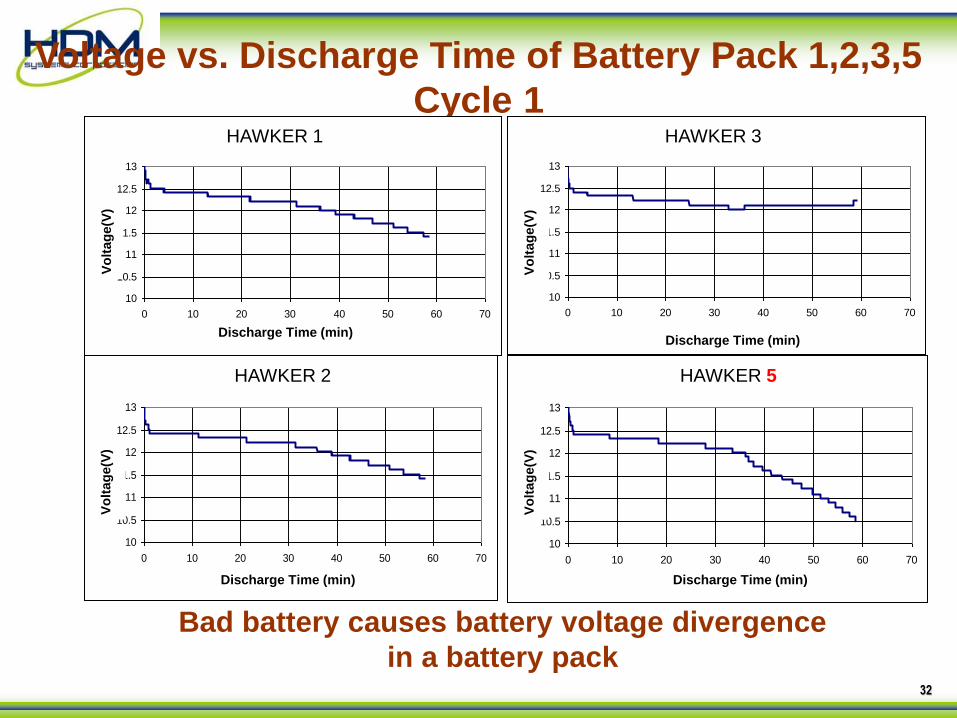
Bad battery causes battery voltage divergence
in a battery pack
Voltage vs. Discharge Time of Battery Pack 1,2,3,5
Cycle 1
4.20.2 H1 cycle 1
10
10.5
11
11.5
12
12.5
13
0 10 20 30 40 50 60 70
Discharging Time (min)
Vo
ltag
e (
V)
4.20.2 H2 cycle 1
10
10.5
11
11.5
12
12.5
13
0 10 20 30 40 50 60 70
Discharging Time (min)
Vo
ltag
e (
V)
4.20.2 H3 Cycle1
10
10.5
11
11.5
12
12.5
13
0 10 20 30 40 50 60 70
Discharging Time (min)
Vo
ltag
e (
V)
4.20.2 H5 cycle 1
10
10.5
11
11.5
12
12.5
13
0 10 20 30 40 50 60 70
Discharging Time (min)
Vo
ltag
e (
V)
HAWKER 2 HAWKER 5
Discharge Time (min)
Vo
ltag
e(V
)
HAWKER 1
Vo
ltag
e(V
)
Vo
ltag
e(V
) V
olt
ag
e(V
)
Discharge Time (min)
Discharge Time (min)
Discharge Time (min)
HAWKER 3
33
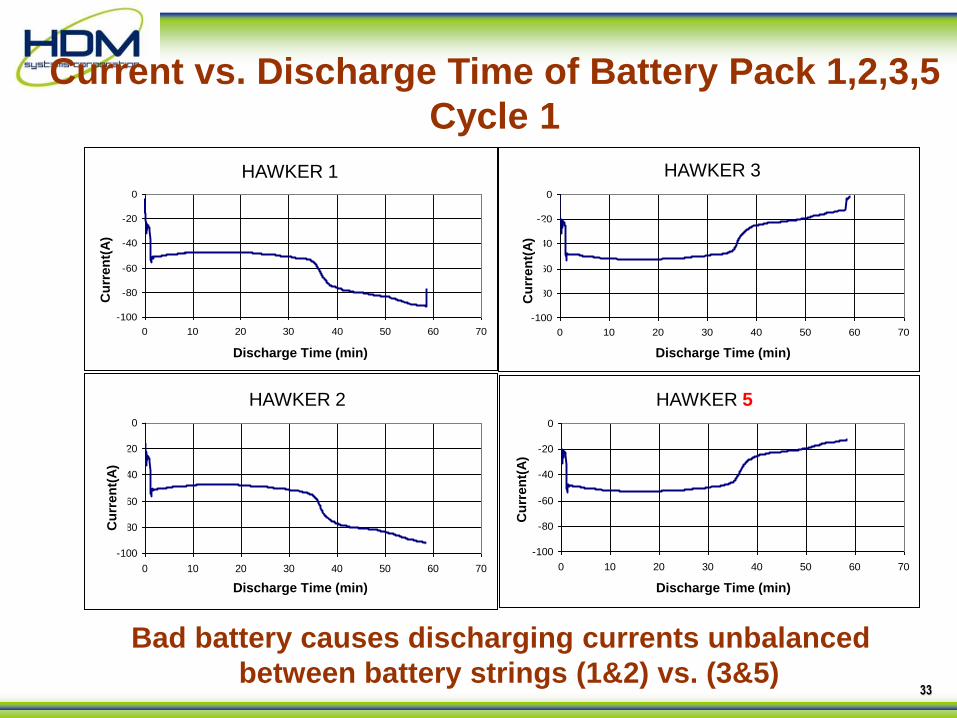
Current vs. Discharge Time of Battery Pack 1,2,3,5
Cycle 1
Bad battery causes discharging currents unbalanced
between battery strings (1&2) vs. (3&5)
4.20.2 H1 cycle 1
-100
-80
-60
-40
-20
0
0 10 20 30 40 50 60 70
Discharging Time (min)
Cu
rren
t (A
)
4.20.2 H2 cycle 1
-100
-80
-60
-40
-20
0
0 10 20 30 40 50 60 70
Discharging Time (min)
Cu
rren
t (A
)
4.20.2 H3 Cycle 1
-100
-80
-60
-40
-20
0
0 10 20 30 40 50 60 70
Discharging Time (min)
Cu
rren
t (A
)
4.20.2 H5 cycle 1
-100
-80
-60
-40
-20
0
0 10 20 30 40 50 60 70
Discharging Time (min)
Cu
rren
t (A
)
Discharge Time (min) Discharge Time (min)
Discharge Time (min) Discharge Time (min)
Cu
rren
t(A
)
Cu
rren
t(A
)
Cu
rren
t(A
)
Cu
rren
t(A
)
HAWKER 1
HAWKER 2
HAWKER 3
HAWKER 5
34
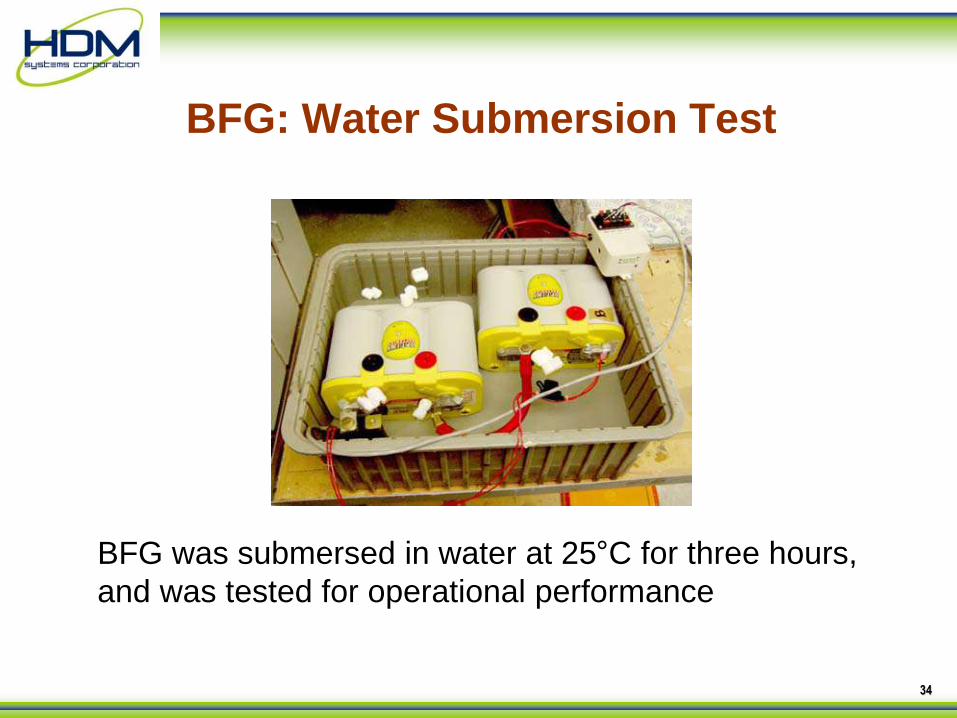
BFG: Water Submersion Test
BFG was submersed in water at 25°C for three hours,
and was tested for operational performance


![· Web viewadvantages of an alkaline battery over lead acid battery. [2Marks]](https://img.pdfslide.net/doc/110x75/5aff7fa77f8b9a0c028b5680/-viewadvantages-of-an-alkaline-battery-over-lead-acid-battery-2marks-.jpg)