Embed Size (px)
Citation preview
International Journal of Aviation, International Journal of Aviation,
Aeronautics, and Aerospace Aeronautics, and Aerospace
Volume 2 Issue 3 Article 2
7-7-2015
Bio-Fuel Alternatives in South African Airways (SAA) Operations - Bio-Fuel Alternatives in South African Airways (SAA) Operations -
Is it an Effective Response to Vulnerability over Carbon Taxes and Is it an Effective Response to Vulnerability over Carbon Taxes and
Penalty? Penalty?
Daniel Kwasi Adjekum University of North Dakota, [email protected]
Follow this and additional works at: https://commons.erau.edu/ijaaa
Part of the Aerospace Engineering Commons, Atmospheric Sciences Commons, Business
Administration, Management, and Operations Commons, Management and Operations Commons,
Meteorology Commons, Operations and Supply Chain Management Commons, and the Technology and
Innovation Commons
Scholarly Commons Citation Scholarly Commons Citation Adjekum, D. K. (2015). Bio-Fuel Alternatives in South African Airways (SAA) Operations - Is it an Effective Response to Vulnerability over Carbon Taxes and Penalty?. International Journal of Aviation, Aeronautics, and Aerospace, 2(3). Retrieved from https://commons.erau.edu/ijaaa/vol2/iss3/2
This Article is brought to you for free and open access by the Journals at Scholarly Commons. It has been accepted for inclusion in International Journal of Aviation, Aeronautics, and Aerospace by an authorized administrator of Scholarly Commons. For more information, please contact [email protected].
Bio-Fuel Alternatives in South African Airways (SAA) Operations - Is it an Effective Bio-Fuel Alternatives in South African Airways (SAA) Operations - Is it an Effective Response to Vulnerability over Carbon Taxes and Penalty? Response to Vulnerability over Carbon Taxes and Penalty?
Cover Page Footnote Cover Page Footnote Faculty of the Aviation Department of University of North Dakota International Civil Aviation Organization , EU/EMEP and South African Airways Flight Operations Department.
This article is available in International Journal of Aviation, Aeronautics, and Aerospace: https://commons.erau.edu/ijaaa/vol2/iss3/2
The global aviation industry aims to achieve carbon neutral growth by 2020
and eventually reduce carbon dioxide (CO2) emissions by 50% relative to 2005
levels by 2050 (ATAG, 2011). The International Air Transport Association (IATA)
outlined a ‘‘four pillar’’ approach that includes technology, operations,
infrastructure and economic measures to help reduce carbon dioxide emission
(IATA, 2013). Technology has been seen as the most promising option for reducing
emissions and includes improved engine technologies, aircraft design, new
composite lightweight materials, and use of biofuels that have significantly lower
lifecycle greenhouse gas (GHG) emissions than conventional fuel (IATA, 2013).
The South African government announced a strategy to develop a
homegrown aviation biofuels industry to support the state-owned South African
Airways (SAA). The announcement came in the wake of having to introduce a one
to two euro carbon surcharge from the beginning of the year 2014 on passengers
travelling to and from Europe to cover their European Union Emission Trading
Scheme (EU ETS) costs (SAA, 2012; Air Transport World, 2014). The strategic
plan has a goal of having 50% of SAA’s fuel uplifted at Johannesburg, at least, to
be sustainable aviation fuel by 2023 (Greenair, 2012). South African Airways and
The Department of Public Enterprises signed an MOU for collaboration with
Boeing on biofuels, becoming the first airline in Africa to formalize an effort on
this issue (SAA, 2012).
From an operational perspective, the question has always been whether the
use of any form of alternate fuel like bio-fuel in South African Airways (SAA)
operations will be an effective response to vulnerability over carbon taxes and
penalty. In order to answer the research question, a quantitative research method
was used to compare the carbon dioxide emission levels of South Africa Airways
(SAA) fleet over the European routes using aviation Jet A-1 fuel and a hypothetical
case scenario, if SAA had used a 25% ‘blend-in’ of Jet A-1/ Bio-Fuel. Finally, the
paper highlighted some challenges that may be faced by SAA if a move is made to
implement ‘blend-in’ bio-fuel for flights operations.
Literature Review
South African Airways
South African Airways (SAA) is the national flag carrier and largest airline
of South Africa, with headquarters in Airways Park on the grounds of OR Tambo
International Airport, Gauteng. The airline flies to 38 destinations worldwide from
its hub at OR Tambo International Airport, using a fleet of 54 aircraft mostly made
up of Airbus series 319, 320,330 and 340s. They also operate a Boeing 737-800
1
Adjekum: Bio-Fuel Alternatives in South African Airways (SAA) Operations
Published by Scholarly Commons, 2015
fleet and 737-300 freighter fleet. SAA was the first African airline to join the Star
Alliance, and became the 18th member in the alliance. South African Airways flies
to 37 international destinations in 26 countries in Africa, Europe, North
America, South America, and Asia (SAA, 2015).
The European Union Emission Trading Scheme
The European Union Emission Trading Scheme (EU ETS) was initiated in
2005 and was initially restricted to static emission sources, such as power plants
and cement factories. The inclusion of aviation was not authorized until 2008
(NBAA, 2014). The EU ETS, required airlines to actively participate for the first
time in 2012 and capped the emissions of all flights to, from and within the 27 EU
member states plus Norway, Iceland and Liechtenstein (with exceptions for some
flights) (ATAG, 2011).
The EU ETS was established by involving both Annex I and non-Annex I
countries. Miyoshi (2014) stated that under the Kyoto Protocol, ratified countries
have different responsibilities and roles based on whether they are Annex I or non-
Annex I countries. Miyoshi (2014) further suggested that a lot of non-Annex I
countries have been concerned about the move by Annex I countries to a market-
based mechanism (MBM) initiatives such as the EU ETS or levies in other regions.
The EU ETS functions using a system of emissions allowances, each
allowance being equivalent to one ton of CO2. In 2012, airline emissions were
capped at 97% of the average annual emissions from 2004-2006, and airlines
receive 85% of their proportionally-allocated allowances (based on 2010
emissions) for free. These aviation-specific 1-ton units are called EU Emissions
Aviation Allowances (EUAA; Financial Times, 2014).
A US study by Malina et al. (2012) found out that the EU ETS had a
relatively small impact on US airlines and aviation emissions and under the current
allocation rules, US carriers׳ profits may in fact increase due to windfall gains from
free allowances. Derigs and Illing (2013) analysed the impact of the measure on air
cargo airlines, with specific reference to how airlines can optimise their profits by
adapting their network and schedules. In their findings, carbon dioxide
(CO2) reduction was shown to have a zero or marginal impact on cost increases,
and small changes in the schedule of these cargo airlines may limit these. Zhang
and Wei (2010) suggested that non-Annex countries like South Africa need to
discover how to engage in and make use of the EU ETS, and the measure’s future
influence on their aviation sectors required further consideration.
2
International Journal of Aviation, Aeronautics, and Aerospace, Vol. 2 [2015], Iss. 3, Art. 2
https://commons.erau.edu/ijaaa/vol2/iss3/2
Miyoshi (2014) investigated the impact of the EU ETS on an African airline
compared to airlines in an Annex I country (South African Airways and British
Airways). Miyoshi (2014) suggested that the impact of EU ETS on travel change
and carbon cost change was very limited apart from the case of the high carbon
price (€30 per tonne). Miyasho (2014) further suggested that the market carbon
price was required to be high enough to allow high emitters to incur higher costs
than lower emitters do. This should act as strong incentive for carriers to invest in
the abatement measures by reducing emissions under the ETS.
Alternative Aviation Fuel Pathways
Renewable jet fuel processes currently certified for use in commercial
aviation include fuel produced from a Hydro processed Esters and Fatty Acids
(HEFA) process (also known as Hydro treated Renewable Jet fuel) and biomass-
to-liquid (BTL) via a Fischer–Tropsch (ASTM, 2011) . Both these processes
produce a product slate that includes diesel, jet fuel and other co-products
(Pearlson, 2013). BTL production involves vaporizing a mixture of biomass and
coal and converting the gas to synthetic liquid fuels through an F–T process. Fuel
produced using an F–T process was certified for aviation by ASTM International
Standard D7566 in September 2009 (ASTM, 2011). In South Africa, Sasol is
providing SPK jet fuel using a Fischer-Tropsch technology and coal as a feedstock
to airlines operating at O.R. Tambo International Airport (Sasol, 2011).
Under a HEFA process, renewable oil (vegetable oils, animal fat, waste
grease and algae oil) is processed using hydrogen treatment (hydro processing) to
yield a fuel in the distillation range of jet fuel, diesel and naphtha (Pearlson, 2013).
On July 1, 2011, ASTM approved the jet fuel product slate of HEFA under
alternative fuel specification D7566 (ASTM, 2011). HEFA fuel that meets this
specification can be mixed with conventional jet fuel, up to a blend ratio of 50%.
HEFA is currently the leading process for producing renewable jet fuel and
several airlines (including Aero México, Air China, Air France, Finnair, Iberia,
KLM, Lufthansa and United) have performed commercial passenger flights with
blends of up to 50% renewable fuel produced using this technology (IATA, 2012:
KLM, 2014). In addition to the popularity of HEFA fuel in demonstration flights,
Bauen et al. ( 2009) suggested that as an estimate that the near-term uptake of
biofuels will be greatest when oil crops are used in a HEFA process.
In June 2014, ASTM revised D7566, the aviation fuel standard concerning
synthesized hydrocarbons, to include a type of biofuel called “Synthesized Iso-
Paraffinic” (SIP) fuel from hydro processed fermented sugars. The SIP fuel is
3
Adjekum: Bio-Fuel Alternatives in South African Airways (SAA) Operations
Published by Scholarly Commons, 2015

produced by the fermentation of biomass-derived sugars into Farnesene, followed
by hydrotreatment and fractionation of Farnesene into Farnesane, and they may be
blended at a maximum of 10% by volume with conventional jet fuel (ASTM, 2014).
Economic Challenges of the Commercial Use of Bio –fuel in Aviation
Large-scale deployment of aviation biofuels from pathways suited for
aviation face significant challenges. These include high production costs and lack
of integration of aviation biofuels into regulatory frameworks (Carriquiry et al.,
2011; Carter et al., 2011). One of the much heralded challenges that faces operators
who want to expand their ‘green operations’ may be the reality of the prohibitive
cost and low economy of scale supply chain system of bio jet fuel (SQconsult,
2013).
The EU estimates that the cost to construct and secure production, including
plant and supply chain of bio-fuel for commercial aviation production may be in
the region of EUR3bn (Aviationeconomics, 2014). In addition to these, there is a
further EUR3bn cost of the actual fuel above that of Jet Kerosene – equating to
EUR1, 500/tonne more than the recent price for regular jet fuel
(Aviationeconomics, 2014). Currently Jet A1 fuel costs below EUR700/tonne, so
the EU estimate is that bio-jet will be almost three times that figure at over
EUR2,200/tonne (Aviationeconomics, 2014).
The demand for bio jet fuel is small because of high prices and concerns
about sustainability. For airlines, the fuel costs are approximately 30% of the total
operational costs and in the US, the FAA’s biofuel goal is met by commercial
airlines and the military voluntarily purchasing a set quantity of renewable fuel each
year, even though this fuel is more expensive than conventional jet fuel (Winchester
et al., 2013). Due to the small margins and the highly competitive market that some
airlines operate in, they may not be able to sustain their operations using biofuels,
which is twice as high as fossil fuels on a large scale. Sustainability concerns make
airlines extra prudent in their actions since bad publicity due to operational losses
has the potential to damage them even further (ECOFYS, 2013).
The economics of biofuel seem to have been largely overlooked in the short-
term feasibility debate. Even adding the carbon cost to the price of jet fuel, it is far
more economically advantageous to burn regular fuel and pay the carbon penalty
than to switch to biofuel (SQconsult, 2013). One tonne of jet emits just over three
tonnes of carbon, carbon trades at less than EUR10/tonne, which means purchasing
a tonne of jet kerosene will cost, say, EUR700 and cost a further EUR 25 to cover
the carbon burden. Even with a trebling of the cost of carbon, it is significantly
4
International Journal of Aviation, Aeronautics, and Aerospace, Vol. 2 [2015], Iss. 3, Art. 2
https://commons.erau.edu/ijaaa/vol2/iss3/2
cheaper than the projected EUR2, 200/tonne for bio-jet fuel (Aviationeconomics,
2014).
South African Airways Green Policy
South African Airways envisages to become the “most sustainable airline in
the world” and has plans to scale up its use of biofuels for its flights to 20-million
litres in 2017, before reaching 400-million litres by 2023 (SAA, 2012). Some of the
benefits of SAA’s shift to replacing fossil fuels with aviation biofuels include
reduced operational costs and stability in fuel price planning, purchasing and
foreign exchange.
A tobacco feed stock variant called Solaris which is under development to
produce bio-jet fuel has the ability to reduce CO2 emissions, bring socioeconomic
value to local farmers, create jobs and lower the carbon footprint and fuel costs of
SAA, the latter of which contributed between 39% and 41% of the State-
owned airline’s total operating costs (Engineeringnews, 2014). The nicotine- and
GMO-free Solaris crop, which was developed and patented by Italy-based research
and development company Sunchem Holding, would now be scaled-up across other
regions in South Africa and potentially beyond into Africa.
The Solaris project envisages 250 000 ha by 2025, which would result in
the production of 700 000 t of bio-jet fuel. The project is expected to create 250
000 jobs and shave-off 1558 Kiloton of CO2 emissions, thus ensuring
a sustainable, environment-friendly aviation industry (Engineeringnews, 2014).
Research Objective
In this study, a comparative analysis of the South African Airways current
fleet that used conventional aviation jet fuel and the same fleet if it had used a 25%
bio-fuel ‘drop in’ mixture of conventional jet fuel and bio-fuel over the European
routes within the first quarter of the 2014 flying year (FY 14) was conducted. In
order to answer the research question, a comparison of carbon dioxide emission
using Jet A-1 fuel and a hypothetical 25% bio-fuel/JetA-1 ‘blend in’ was done to
find out if there will be any significant benefits for South African Airways in their
flight operations to their European destinations.
Research Questions
To guide this study, the following research questions were utilized:
5
Adjekum: Bio-Fuel Alternatives in South African Airways (SAA) Operations
Published by Scholarly Commons, 2015
1. Will there be any significant differences in terms of carbon dioxide
emission between the use of conventional jet A1 fuel and the bio-fuel
alternative in South African Airways operational flights to Europe in the
first quarter of FY14?
2. Will there be any significant differences in terms of the EU ETS per
stage length in the South African Airways flight operations to Europe
using conventional jet A1 fuel and bio-fuel alternative in the first quarter
of FY14?
Method
The study utilized archived operational data in terms of the flight scheduled,
aircraft type, total time enroute, route stage length, passenger estimates from South
African Airways flight operations department and the company website (SAA,
2015). The performance data (burn rate, route stage length, total time enroute) for
the hypothetical case scenario was estimated from another airline that conducted
flights using 25% bio-fuel ‘blend-in’ over similar range with similar aircraft type
(IATA, 2012; KLM, 2014; Young, 2014). The operational data was collated for the
first quarter of the winter and spring schedule for flights from their main hub Oliver
Tambo International Airport (FAOR) formerly Johannesburg International Airport
(JNB) to four European destinations. The destinations were London Heathrow
(LHR), Frankfurt Main, Munich International (MUC) and Zurich International
(ZRH).
The stage lengths, Estimated Block Time (total time of flight from chocks
out to chocks in) were obtained from SAA flight operations. The amount of fuel
burnt for the stage length and finally the amount of carbon dioxide emitted over the
entire period of the flight was estimated for the various aircraft in SAA fleet used
for the flights from the CORINAIRE charts (EMEP, 2014). The EMEP/CORINAIR
Emission Inventory Guidebook 2 (EIG) is the bases of commercial aviation fuel
burn and emission information (EMEP, 2014). The Guidebook includes an
accompanying workbook, which details fuel burn and emissions associated with
discrete mission distances for 44 equivalent aircraft types.
In order to implement the methodology, the database used by ICAO takes
the fuel burn to distance flown data provided by CORINAIR and extends some
aircraft ranges by extrapolation using a linear regression (EMEP, 2014). This
approach was chosen since the fuel consumption curve approaches a linear
relationship to distance when considering medium and long haul flights.
6
International Journal of Aviation, Aeronautics, and Aerospace, Vol. 2 [2015], Iss. 3, Art. 2
https://commons.erau.edu/ijaaa/vol2/iss3/2
Most air carriers have detailed information in regards to their fuel
consumption and fuel efficiency, however, this information is not publicly available
(EMEP, 2014). The ICAO methodology employs a distance-based approach to
estimate an individual’s aviation emissions using data currently available on a range
of aircraft types. At present, it was not possible to identify any suitable public
alternative data source, making CORINAIR the best publicly available data source
for the purpose of the ICAO methodology (ICAO, 2014).
All the relevant data was tabulated using SPSS® and analyzed for
descriptive statistics. The total surcharge per stage length and based on the amount
of carbon dioxide emitted during the flight was calculated based on the EU ETS
guideline of an average value of є8/ton of carbon dioxide emitted (Financial Times,
2014). The mean emission of CO2 per ton burn of conventional jetA1 was compared
with the mean emission of CO2 per ton burn of the 25% bio fuel ‘blend –in’.
An independent t–test is an inferential statistical test that determines
whether there is a statistically significant difference between the means in two
unrelated groups. This statistical test was conducted to find out if there was any
significant differences in emissions between the two categorical flight operational
groups of fleet that had ‘YES or No’ biofuel blend-in. The second t-test of means
analysis compared the EU ETS per conventional jet A1 fuel and 25 % ‘blend-in’ to
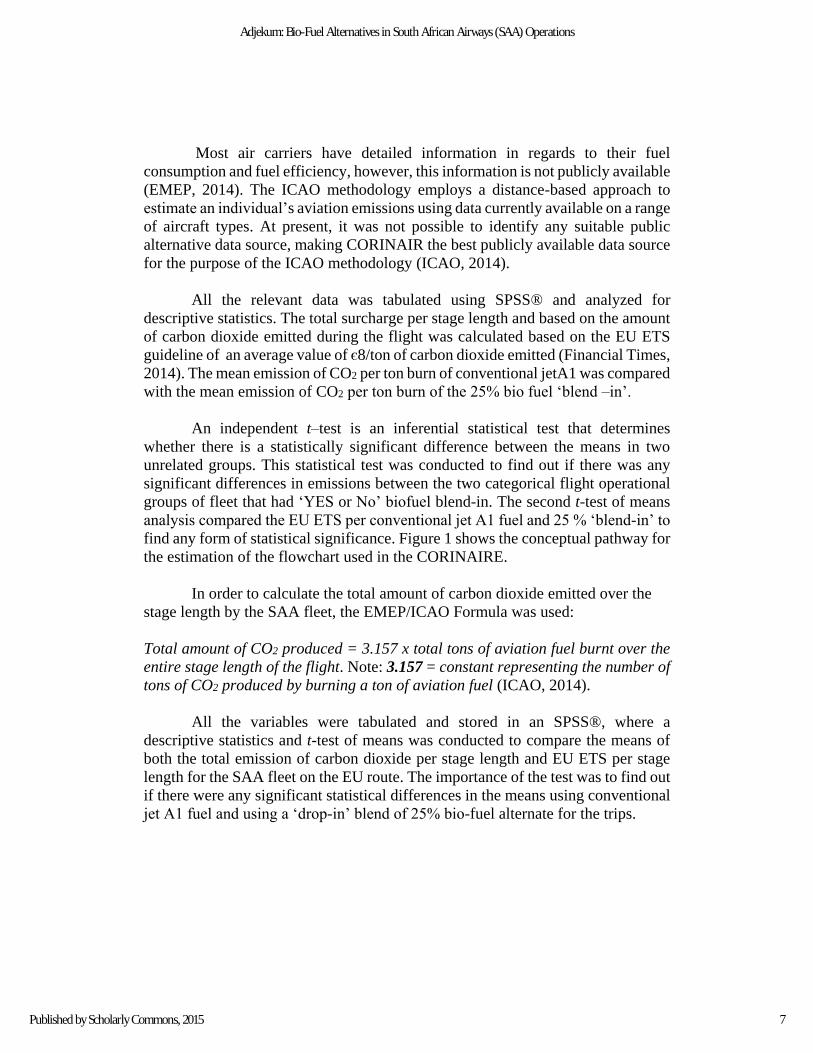
find any form of statistical significance. Figure 1 shows the conceptual pathway for
the estimation of the flowchart used in the CORINAIRE.
In order to calculate the total amount of carbon dioxide emitted over the
stage length by the SAA fleet, the EMEP/ICAO Formula was used:
Total amount of CO2 produced = 3.157 x total tons of aviation fuel burnt over the
entire stage length of the flight. Note: 3.157 = constant representing the number of
tons of CO2 produced by burning a ton of aviation fuel (ICAO, 2014).
All the variables were tabulated and stored in an SPSS®, where a
descriptive statistics and t-test of means was conducted to compare the means of
both the total emission of carbon dioxide per stage length and EU ETS per stage
length for the SAA fleet on the EU route. The importance of the test was to find out
if there were any significant statistical differences in the means using conventional
jet A1 fuel and using a ‘drop-in’ blend of 25% bio-fuel alternate for the trips.
7
Adjekum: Bio-Fuel Alternatives in South African Airways (SAA) Operations
Published by Scholarly Commons, 2015
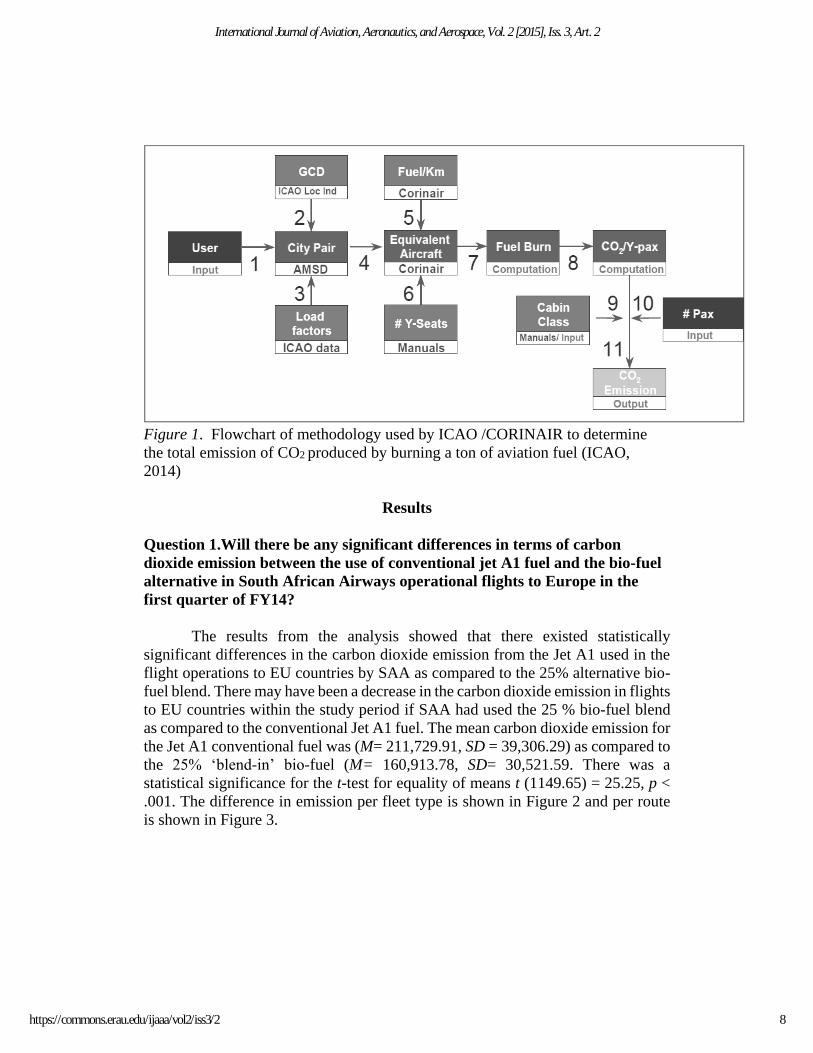
Figure 1. Flowchart of methodology used by ICAO /CORINAIR to determine
the total emission of CO2 produced by burning a ton of aviation fuel (ICAO,
2014)
Results
Question 1.Will there be any significant differences in terms of carbon
dioxide emission between the use of conventional jet A1 fuel and the bio-fuel
alternative in South African Airways operational flights to Europe in the
first quarter of FY14?
The results from the analysis showed that there existed statistically
significant differences in the carbon dioxide emission from the Jet A1 used in the
flight operations to EU countries by SAA as compared to the 25% alternative bio-
fuel blend. There may have been a decrease in the carbon dioxide emission in flights
to EU countries within the study period if SAA had used the 25 % bio-fuel blend
as compared to the conventional Jet A1 fuel. The mean carbon dioxide emission for
the Jet A1 conventional fuel was (M= 211,729.91, SD = 39,306.29) as compared to
the 25% ‘blend-in’ bio-fuel (M= 160,913.78, SD= 30,521.59. There was a
statistical significance for the t-test for equality of means t (1149.65) = 25.25, p <
.001. The difference in emission per fleet type is shown in Figure 2 and per route
is shown in Figure 3.
8
International Journal of Aviation, Aeronautics, and Aerospace, Vol. 2 [2015], Iss. 3, Art. 2
https://commons.erau.edu/ijaaa/vol2/iss3/2
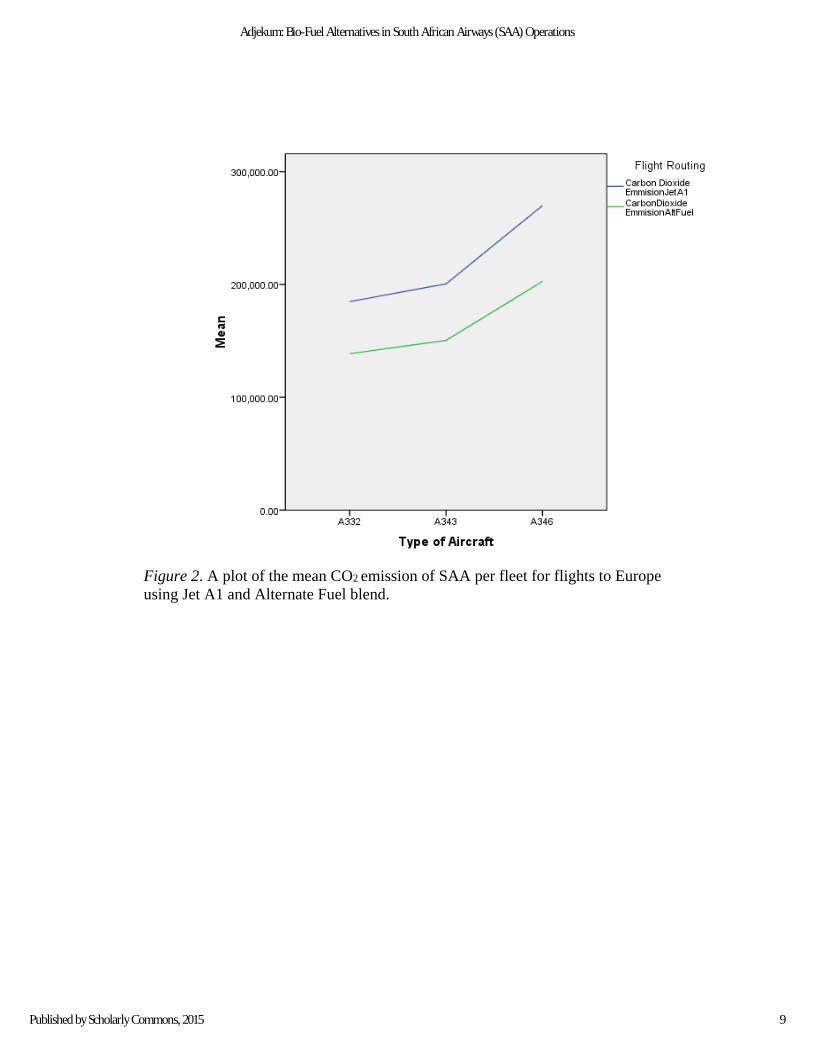
Figure 2. A plot of the mean CO2 emission of SAA per fleet for flights to Europe
using Jet A1 and Alternate Fuel blend.
9
Adjekum: Bio-Fuel Alternatives in South African Airways (SAA) Operations
Published by Scholarly Commons, 2015
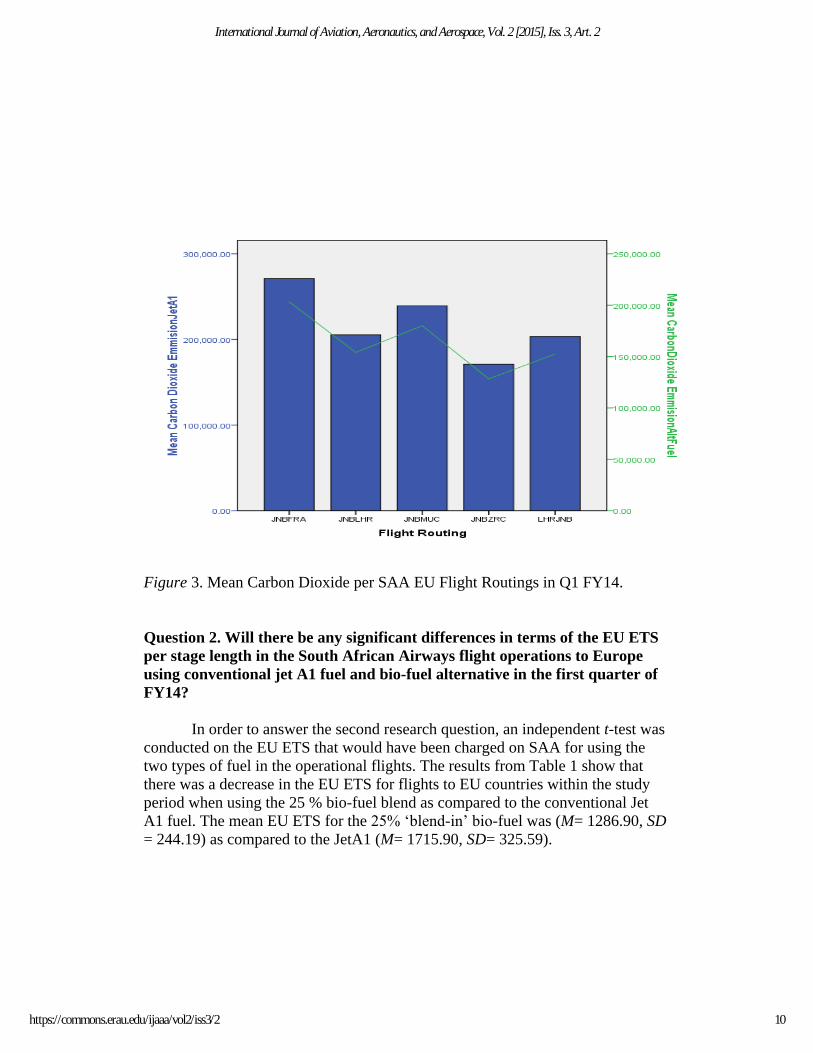
Figure 3. Mean Carbon Dioxide per SAA EU Flight Routings in Q1 FY14.
Question 2. Will there be any significant differences in terms of the EU ETS
per stage length in the South African Airways flight operations to Europe
using conventional jet A1 fuel and bio-fuel alternative in the first quarter of
FY14?
In order to answer the second research question, an independent t-test was
conducted on the EU ETS that would have been charged on SAA for using the
two types of fuel in the operational flights. The results from Table 1 show that
there was a decrease in the EU ETS for flights to EU countries within the study
period when using the 25 % bio-fuel blend as compared to the conventional Jet
A1 fuel. The mean EU ETS for the 25% ‘blend-in’ bio-fuel was (M= 1286.90, SD
= 244.19) as compared to the JetA1 (M= 1715.90, SD= 325.59).
10
International Journal of Aviation, Aeronautics, and Aerospace, Vol. 2 [2015], Iss. 3, Art. 2
https://commons.erau.edu/ijaaa/vol2/iss3/2
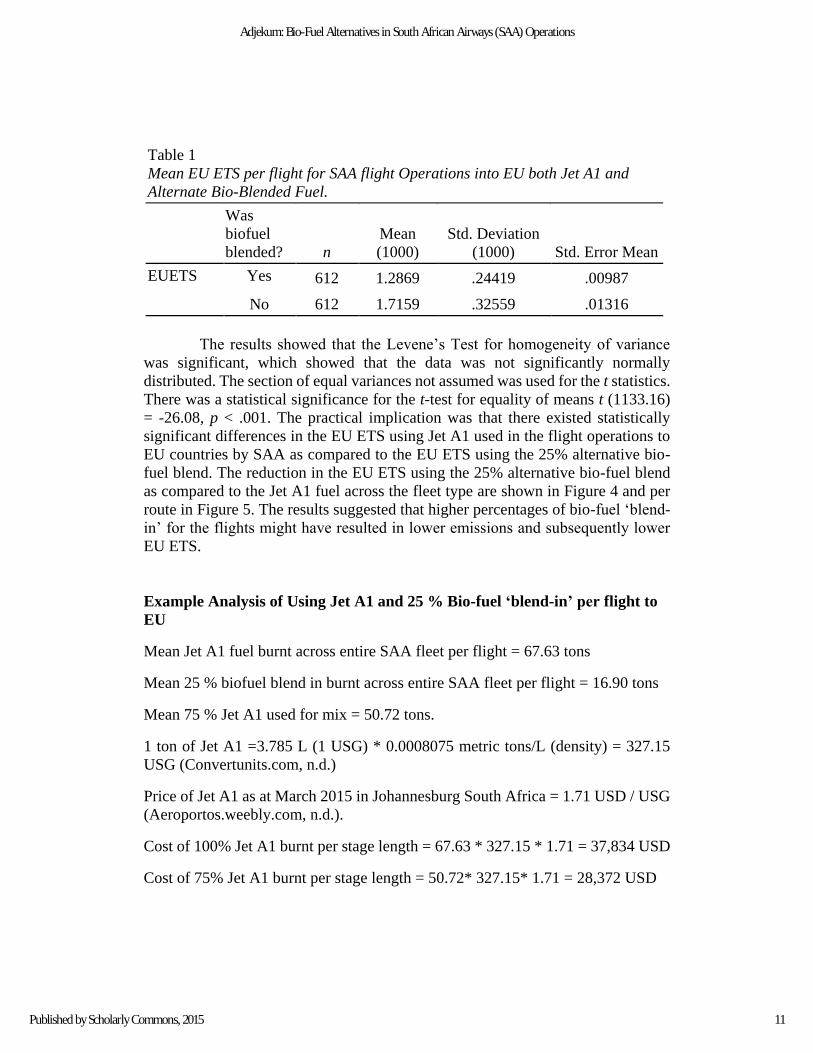
Table 1
Mean EU ETS per flight for SAA flight Operations into EU both Jet A1 and
Alternate Bio-Blended Fuel.
Was
biofuel
blended? n
Mean
(1000)
Std. Deviation
(1000) Std. Error Mean
EUETS Yes 612 1.2869 .24419 .00987
No 612 1.7159 .32559 .01316
The results showed that the Levene’s Test for homogeneity of variance
was significant, which showed that the data was not significantly normally
distributed. The section of equal variances not assumed was used for the t statistics.
There was a statistical significance for the t-test for equality of means t (1133.16)
= -26.08, p < .001. The practical implication was that there existed statistically
significant differences in the EU ETS using Jet A1 used in the flight operations to
EU countries by SAA as compared to the EU ETS using the 25% alternative bio-
fuel blend. The reduction in the EU ETS using the 25% alternative bio-fuel blend
as compared to the Jet A1 fuel across the fleet type are shown in Figure 4 and per
route in Figure 5. The results suggested that higher percentages of bio-fuel ‘blend-
in’ for the flights might have resulted in lower emissions and subsequently lower
EU ETS.
Example Analysis of Using Jet A1 and 25 % Bio-fuel ‘blend-in’ per flight to
EU
Mean Jet A1 fuel burnt across entire SAA fleet per flight = 67.63 tons
Mean 25 % biofuel blend in burnt across entire SAA fleet per flight = 16.90 tons
Mean 75 % Jet A1 used for mix = 50.72 tons.
1 ton of Jet A1 =3.785 L (1 USG) * 0.0008075 metric tons/L (density) = 327.15
USG (Convertunits.com, n.d.)
Price of Jet A1 as at March 2015 in Johannesburg South Africa = 1.71 USD / USG
(Aeroportos.weebly.com, n.d.).
Cost of 100% Jet A1 burnt per stage length = 67.63 * 327.15 * 1.71 = 37,834 USD
Cost of 75% Jet A1 burnt per stage length = 50.72* 327.15* 1.71 = 28,372 USD
11
Adjekum: Bio-Fuel Alternatives in South African Airways (SAA) Operations
Published by Scholarly Commons, 2015
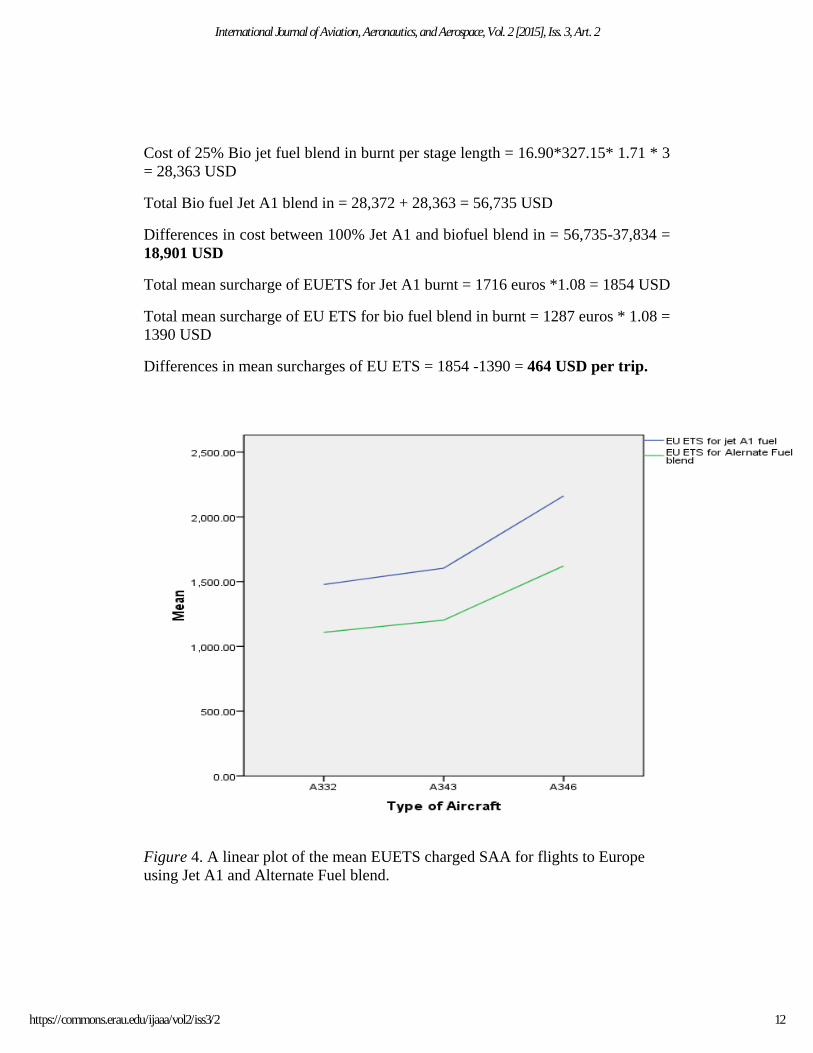
Cost of 25% Bio jet fuel blend in burnt per stage length = 16.90*327.15* 1.71 * 3
= 28,363 USD
Total Bio fuel Jet A1 blend in = 28,372 + 28,363 = 56,735 USD
Differences in cost between 100% Jet A1 and biofuel blend in = 56,735-37,834 =
18,901 USD
Total mean surcharge of EUETS for Jet A1 burnt = 1716 euros *1.08 = 1854 USD
Total mean surcharge of EU ETS for bio fuel blend in burnt = 1287 euros * 1.08 =
1390 USD
Differences in mean surcharges of EU ETS = 1854 -1390 = 464 USD per trip.
Figure 4. A linear plot of the mean EUETS charged SAA for flights to Europe
using Jet A1 and Alternate Fuel blend.
12
International Journal of Aviation, Aeronautics, and Aerospace, Vol. 2 [2015], Iss. 3, Art. 2
https://commons.erau.edu/ijaaa/vol2/iss3/2
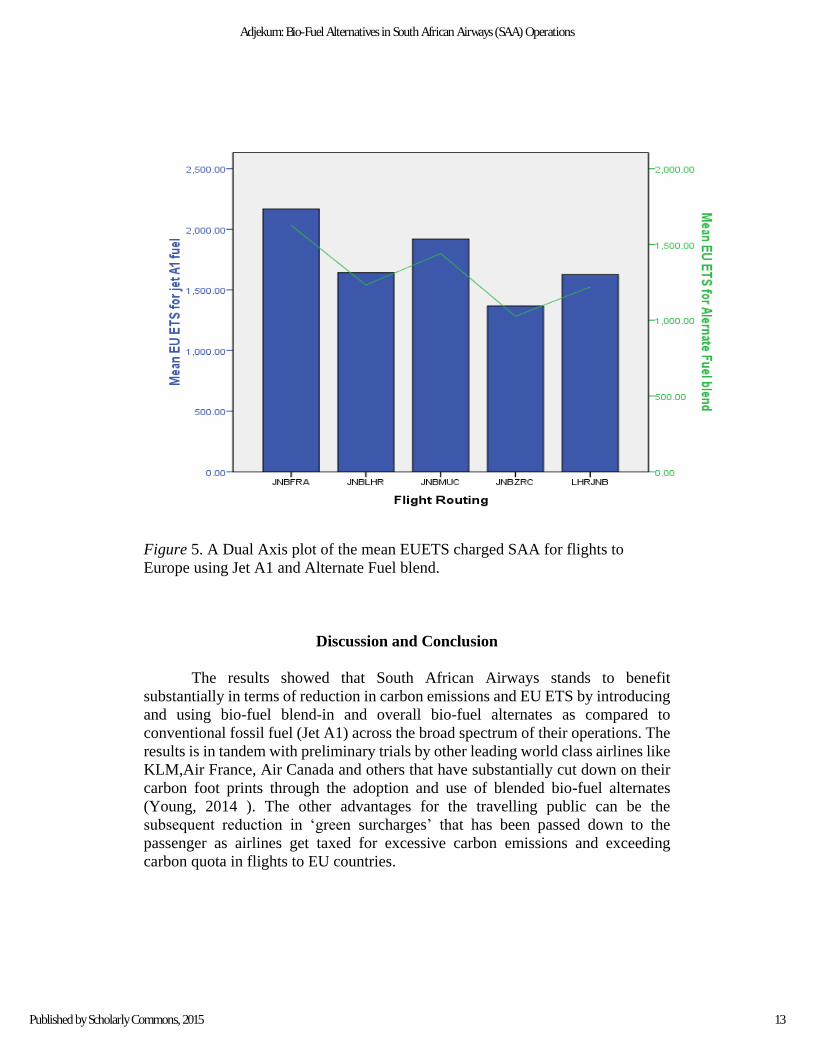
Figure 5. A Dual Axis plot of the mean EUETS charged SAA for flights to
Europe using Jet A1 and Alternate Fuel blend.
Discussion and Conclusion
The results showed that South African Airways stands to benefit
substantially in terms of reduction in carbon emissions and EU ETS by introducing
and using bio-fuel blend-in and overall bio-fuel alternates as compared to
conventional fossil fuel (Jet A1) across the broad spectrum of their operations. The
results is in tandem with preliminary trials by other leading world class airlines like
KLM,Air France, Air Canada and others that have substantially cut down on their
carbon foot prints through the adoption and use of blended bio-fuel alternates
(Young, 2014 ). The other advantages for the travelling public can be the
subsequent reduction in ‘green surcharges’ that has been passed down to the
passenger as airlines get taxed for excessive carbon emissions and exceeding
carbon quota in flights to EU countries.
13
Adjekum: Bio-Fuel Alternatives in South African Airways (SAA) Operations
Published by Scholarly Commons, 2015
However it may be operationally profitable for SAA to use 100% Jet A1
and pay the EU ETS surcharge, if they exceed their allowable cap rather than use
the bio fuel “blend-in fuel”, due to the high cost of blended fuel, as compared to the
EU surcharges for carbon emission. This may be one of the present challenge
airlines ready to implement bio fuel in their flight operations face. These numbers
suggest that the emissions offsetting scheme proposed by IATA is currently more
cost-effective than using biofuels to abate aviation emissions and prevent
surcharges. However, biofuels may play a future role as the cost of these
technologies decrease and global demand for emissions reduction credits increase
the price of offsets.
In order to overcome the supply chain challenge of having a sustainable
supply of bio-fuel for flight operations, it is reassuring that Boeing and South
African Airways (SAA) are extending the collaboration on a sustainable bio-fuel
production and supply chain to include the Roundtable on Sustainable Biomaterials
(RSB). The three partners have announced an initiative to help small hold farmers
in the region grow crops to produce sustainable fuels. SAA has a target of having
50 per cent of its fuel uplifted at Johannesburg to be made up of sustainable jet fuel
by 2023 (RSB, 2014).
The sustainable biofuel supply chains may also enhances a viable economic
opportunity for local agriculture and energy production. A pragmatic example can
be the Southern Africa Green Initiative, which has seen Boeing and RSB working
together with stakeholders to create pilot programmes to build knowledge, and
skills among groups of farmers who want to certify their feedstocks as sustainable.
The partners will also help farmers with small plots of land gain access to markets
for sustainable biofuels and biomaterials. In the long term, they expect more
farmers to tap into a demand for biofuel feed stocks that provide socio-economic
value to local communities without adverse impact on food supplies, fresh water or
land use. (RSB, 2014)
South African Airways may need to expedite their joint production of bio-
fuel in order to ensure a seamless supply chain that will reduce the production cost
of the bio fuel needed for the blend-in for flight operations. Such a strategic measure
may significantly enhance their ‘green operations’ and reduce their carbon footprint
and set them on the goal of meeting the objectives of the carbon neutrality of 2020.
In terms of the reduction of carbon dioxide emission, there may be quantifiable and
tangible metrics to show, but as to the overall effect on the operational cost taking
into consideration the present cost of bio-fuel and Jet A1, there may be substantial
challenges.
14
International Journal of Aviation, Aeronautics, and Aerospace, Vol. 2 [2015], Iss. 3, Art. 2
https://commons.erau.edu/ijaaa/vol2/iss3/2
This study looked at only a small data set (Quarter 1) for the entire FY14 of
SAA and recommend that further studies consider operational data with a wider
data set spanning more than a year. It would be insightful to get actual operational
data from SAA on bio-fuel operations and assess emission/EUETS trends over the
same route with a newer fuel-efficient fleet. Future studies may look at long term
economic, environmental and operational challenges that other airlines from
developing countries in Africa, will be faced with, should they decide to use biofuel
in their flight operations. These challenges will have to be analysed within the
framework of the real and present competition, they face from top-tier airlines from
Europe.
15
Adjekum: Bio-Fuel Alternatives in South African Airways (SAA) Operations
Published by Scholarly Commons, 2015
References
Aeroportos.weebly.com. (n.d.). Fuel prices. Retrieved from
http://aeroportos.weebly.com/fuel-prices.html#.VQ-fCvnF-So
Air Transport World. (2014). Boeing-South African Airways expand biofuel
initiative. Retrieved from http://atwonline.com/eco-aviation/boeing-
south-african-airways-expand-biofuel-initiative
American Society for Testing and Materials (2011). ASTM Standard
Specification for Aviation Turbine Fuel Containing Synthesized
Hydrocarbons, Designation D7566-12a. West Conshohocken, PA: ASTM
International. Retrieved from
http://enterprise.astm.org/filtrexx40.cgi?±REDLINE_PAGES/D7566.htm
American Society for Testing and Materials (2014). ASTM Standard
Specification for Aviation Turbine Fuel Containing Synthesized
Hydrocarbons. Designation D7566-14c, West Conshohocken, PA:
Author. Retrieved from http://www.astm.org/Standards/D7566.htm
doi:10.1520/D7566-14C
Air Transport Action Group (ATAG). (2011). Beginners guide to aviation biofuel
2 ed. Geneva: Air Transport Action Group. Retrieved from
http://www.atag.org/our-activities/sustainable-aviation-biofuels.html
Aviationeconomics. (2014, April 14). News. Retrieved
from http://www.aviationeconomics.com/NewsItem.aspx?title=The-
Commercial-Use-of-Biofuels-in-Aviation
Bauen, A. H. (2009). Review of the Potential for Biofuels in Aviation. Final
Report Prepared for the Committee on, Climate Change. Geneva,
Switzerland.: E4tech. Retrieved from
http://citeseerx.ist.psu.edu/viewdoc/download;jsessionid=E296A64BF3E8
34001B828
1496DA49C7D?doi=10.1.1.170.8750&rep=rep1&type=pdf
doi:10.1.1.170.8750
Carriquiry, M. A., Du, X., Timilsina, G. R. (2011). Second generation biofuels.
Economics and policies Energy Policy, 39, 4222–4234.
16
International Journal of Aviation, Aeronautics, and Aerospace, Vol. 2 [2015], Iss. 3, Art. 2
https://commons.erau.edu/ijaaa/vol2/iss3/2
Carter, N., Stratton, R., Bredehoeft, M., Hileman, J. (2011) Energy and
environmental viability of select alternative jet fuel pathways. 47th AIAA
Joint Propulsion Conference, San Diego, CA.
Convertunits.com. (n.d.). Converting tons to U.S. gallons. Retrieved from
http://www.convertunits.com/forum/message/614/Re-Converting-tons-to
US-gallons
ECOFYS. (2013). Biofuels for aviation. Retrieved from
http://www.ecofys.com/files/files/ecofys-2013-
biofuels-for-aviation.pdf
Engineeringnews. (2014). SAA to test biofuel flight next year.
Retrieved from : http://www.engineeringnews.co.za/article/saa-to-test-
biofuel-flight-next-year-2014-12-09
European Monitoring Evaluation Program (EMEP). (2014).
EMEP EEA guidebook. Retrieved from
www.eea.europa.eu: http://www.eea.europa.eu/publications/emep-eea-
guidebook-2014/
Financial Times. (2014, October 14). CMS. Retrieved from
http://www.ft.com/cms/s/0/23d2b622-4fce-11e4-a0a4-
00144feab7de.html#ixzz3RJPJ2cIp
Greenair. (2012). South Africa looks to develop aviation biofuels supply chain in
response to vulnerability over carbon taxes and penalties. Retrieved
from http://www.greenaironline.com/news.php?viewStory=1567
Greenair. (2015). Finnair and SAA first to reach the top level in IATA's airline
environmental assessment programme. Retrieved
from http://www.greenaironline.com/news.php?viewStory=2028
International Air Transport Association. (2013). IATA 2013 report on alternative
fuels. Montreal: Author. Retrieved from
http://www.iata.org/publications/documents/2013-report-alternative-
fuels.pdf
International Civil Aviation Organization. (2014). ICAO environmental report
Montreal: Author. Retrieved
from http://cfapp.icao.int/Environmental-Report-2013/#124
17
Adjekum: Bio-Fuel Alternatives in South African Airways (SAA) Operations
Published by Scholarly Commons, 2015
KLM. (2014). KLM biofuel flight. Retrieved (02/22/15)
from : http://news.klm.com/klm-biofuelflight-aua-bon/
Malina, R., McConnachie, D., Winchester, N., Wollersheim, C., Paltsev,
S.,Waitz, I. A.(2012).The impact of the European Union emissions trading
scheme on U.S. aviation , Journal of Air Transportation Management, 19,
36–41.
Miyoshi,C. (2014). Assessing the equity impact of the European Union emission
trading scheme on an African airline, Transport Policy, 33(C),
56-64.
doi:10.1016/j.tranpol.2014.02.010
National Business Aircraft Association. (2014). Environment: EU.
Retrieved from : http://www.nbaa.org/ops/environment/eu-ets/
Pearlson, M. (2013). A techno-economic review of hydroprocessed renewable
esters and fatty acids for jet fuel production. Biofuel, Bioproducts and
Biorefining, 7(1), 89-96.
RSB. (2014). Smallholder program in Africa.. Retrieved from
http://rsb.org/activities-and-projects/smallholder-program-in-africa/
Sasol. (2011, February 09). Facts. Retrieved from
http://www.sasol.com/sasol_internet/downloads/11029_Sasol_Facts_2011
_1309786765289.pdf
South African Airways. (2012). Flysaa.com/News. Retrieved
from http://www.flysaa.com/za/en/flyingSAA/News/SAA-to-raise-
surcharge-to-comply-with-EU-Emissions-Trading-Scheme.html
South African Airways. (2015). Plan my trip.
Retrieved from
http://www.flysaa.com/za/en/planmytrip/schedulesroutes/flight_schedules.
html
18
International Journal of Aviation, Aeronautics, and Aerospace, Vol. 2 [2015], Iss. 3, Art. 2
https://commons.erau.edu/ijaaa/vol2/iss3/2
SQconsult. (2013). Content.. Retrieved from
http://www.sqconsult.com/content/newsletter_html/mrt_14_SQ_Consult_
Bringing_biojet_fuels_to_the_market.html
Winchester, N. M. (2013). Economic and emissions impacts of renewable fuel
goals for aviation in the US. Transportation Research Part A, 58, 116-
128. Retrieved from
http://www.researchgate.net/publication/259138966_Economic_and_emis
sions_impacts_of_renewable_fuel_goals_for_aviation_in_the_US
doi:10.1016/j.tra.2013.10.001.
Winchester, N., Malina, R., Staples, M. D., Barrett, R. S. H. (2015).The impact of
advanced biofuels on aviation emissions and operations in the U.S. Energy
Economics, 49, 482-491.
doi:10.1016/j.eneco.2015.03.024
Young, N. (2014 ). The future of biofuels: U.S. (and Global) airlines & aviation
alternative fuels. EIA Conference Presentations. San Antonio,TX: EIA.
Retrieved from
http://www.eia.gov/conference/2014/pdf/presentations/young.pdf
Zhang, Y., Wei, Y. (2010). An overview of current research on EU ETS:
evidence from its operating mechanism and economic effect. Applied
Energy, 87, 1804–1814.
19
Adjekum: Bio-Fuel Alternatives in South African Airways (SAA) Operations
Published by Scholarly Commons, 2015